created: jan 2013 by jim luke. unit 14: an open economy your money's value is determined by a...
TRANSCRIPT

Created:Jan 2013by Jim Luke.
Unit 14: An Open Economy
Your money's value is determined by a global casino of unprecedented proportions: $2 trillion are traded per day in foreign exchange markets, 100 times more than the trading volume of all the stock markets of the world combined.
-- Bernard Lietaer

Accounting for at R.O.W. in Circular Flow
Watch the money: Transactions with $ entering country are + numbers. Transactions with $ leaving country are – numbers. Add the numbers.
ROW
Capital FlowsGoods/Services Flows

Balance of Payments:ROW In the Circular Flow
Goods & Services+ Exports
- Imports
+ Net Unilateral Transfers
= Current Account
Finance & Capital+ Capital Inflow
- Capital Outflow
= Capital Account

Current Account is Mirror of Capital Account
Current Account + Capital Account = 0
If one is a deficit, the other is same value surplus.

Balance of Payments – Concept
green represents transactions where money is paid by foreigners to the U.S. (“credits”). In-flows of money.
red represents transactions where money is paid by people in the U.S. to foreigners – outflows: money is leaving the U.S
highlighted black could be either inflow or outflow depending on amounts.
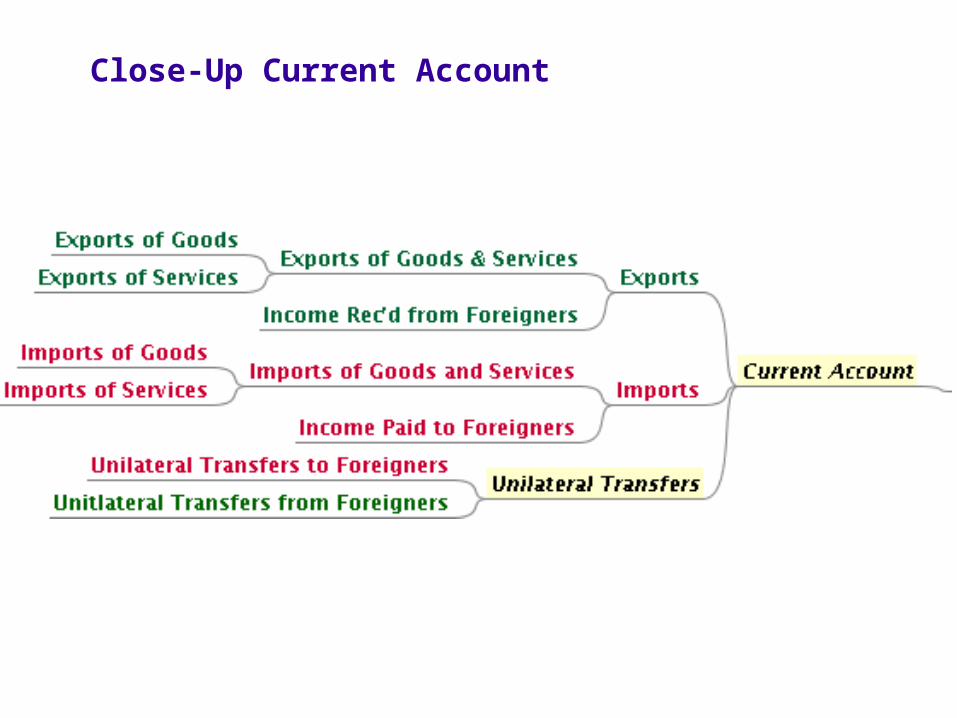
Close-Up Current Account

Close-Up: Capital Account

Balance of Payments: Example as it appears in Govt ReportsLine 2006
Current account1 Exports of goods and services and income receipts 2,0962 1,4463 1,0234 4235 6506 Imports of goods and services and income payments -2,8217 -2,2068 -1,8629 -34410 -61511 Unilateral current transfers, net -86
Capital account
12 -1,05513 Foreign-owned assets in the United States (increase/financial inflow (+)) 1,86014 44015 18116 55617 1318 23619 Statistical discrepancy (sum of above items with sign reversed) 6
Memoranda:20 Balance on goods (lines 3 and 8) -83921 Balance on services (lines 4 and 9) 7922 Balance on goods and services (lines 2 and 7) -76023 Balance on income (lines 5 and 9) 3524 Unilateral current transfers, net (line 35) -8625 Balance on current account (lines 1, 6, and 11 or lines 20, 21, and 22) -81126 Balance on capital account (lines 12, 13, and 19) 811
(Credits +; debits -)
Exports of goods and services Goods, balance of payments basis Services Income receipts
Imports of goods and services Goods, balance of payments basis Services Income payments
U.S.-owned assets abroad (increase (+)/financial outflow (-))
Foreign official assets in the United States Foreign Direct investment U.S. securities U.S. currency U.S. liabilities to foreigners, not included elsewhere

Add some formatting to divide into major sections:
Three sections.
• Current Account
• Capital Account
• Memoranda – (summaries or “balances”)
Line 2006
Current account1 Exports of goods and services and income receipts 2,0962 1,4463 1,0234 4235 6506 Imports of goods and services and income payments -2,8217 -2,2068 -1,8629 -34410 -61511 Unilateral current transfers, net -86
Capital account12 -1,05513 Foreign-owned assets in the United States (increase/financial inflow (+)) 1,86014 44015 18116 55617 13
18 23619 Statistical discrepancy (sum of above items with sign reversed) 6
Memoranda:20 Balance on goods (lines 3 and 8) -83921 Balance on services (lines 4 and 9) 7922 Balance on goods and services (lines 2 and 7) -76023 Balance on income (lines 5 and 9) 3524 Unilateral current transfers, net (line 35) -8625 Balance on current account (lines 1, 6, and 11 or lines 20, 21, and 22) -81126 Balance on capital account (lines 12, 13, and 19) 811
(Credits +; debits -)
Exports of goods and services Goods, balance of payments basis Services Income receipts
Imports of goods and services Goods, balance of payments basis Services Income payments
U.S.-owned assets abroad (increase (+)/financial outflow (-))
Foreign official assets in the United States Foreign Direct investment U.S. securities U.S. currency
U.S. liabilities to foreigners, not included elsewhere

More Formatting to show what adds to what.
Next let’s separate the different levels of detail
Green are debits – money entering country
Red are credits – money leaving country
Line Year 2006
Current account1 Exports of goods and services and income receipts 2,0962 1,4463 1,0234 4235 6506 Imports of goods and services and income payments -2,8217 -2,2068 -1,8629 -34410 -61511 Unilateral current transfers, net -86
Capital account12 -1,05513 Foreign-owned assets in the United States 1,86014 44015 18116 55617 13 18 670 19 Statistical discrepancy (sum of above items with sign reversed) 6
Memoranda:20 Balance on goods (lines 3 and 8) -83921 Balance on services (lines 4 and 9) 7922 Balance on goods and services (lines 2 and 7) -76023 Balance on income (lines 5 and 9) 3524 Unilateral current transfers, net (line 35) -8625 Balance on current account (lines 1, 6, and 11 or lines 20, 21, and 22) -81126 Balance on capital account (lines 12, 13, and 19) 811
(Credits +; debits -)
Exports of goods and services
Goods Services
Income receipts
Imports of goods and services Goods
Services
Income payments
U.S.-owned assets abroad
Foreign official assets in the United States Foreign Direct investment
U.S. securities U.S. currency U.S. liabilities to foreigners, not included elsewhere

Created:Jan 2008by Jim Luke.
Balance of Payments – The Items as we’ve called them.Line Year 2006
Current account1 2,0962 1,4463 1,0234 4235 6506 -2,8217 -2,2068 -1,8629 -34410 -61511 Unilateral current transfers, net -86
Capital account12 -1,05513 1,86014 44015 18116 55617 13 18 670 19 Statistical discrepancy (sum of above items with sign reversed) 6
Memoranda:20 -83921 Balance on services (lines 4 and 9) 7922 -76023 Balance on income (lines 5 and 9) 3524 Unilateral current transfers, net (line 35) -86
25 -81126 811
(Credits +; debits -)
Exports of goods and services and income receipts X Exports of goods and services
Goods Services
Income receipts
Imports of goods and services and income payments M
Imports of goods and services Goods
Services
Income payments
U.S.-owned assets abroad CAPITAL OUTFLOWS
Foreign-owned assets in the United States CAPITAL INFLOWS
Foreign official assets in the United States Foreign Direct investment
U.S. securities U.S. currency U.S. liabilities to foreigners, not included elsewhere
Balance on goods (lines 3 and 8) MERCHANDISE TRADE BALANCE
Balance on goods and services (lines 2 and 7) TRADE BALANCE
BALANCE ON CURRENT ACCOUNT(lines 1, 6, and 11 or lines 20, 21, and 22)BALANCE ON CAPITAL ACCOUNT (lines 12, 13, and 19)

Created:Jan 2008by Jim Luke.
Balance of Payments - Dynamics
Capital Account & Current Account linked If one increases, the other will also, & vice-versa Causality not clear
U.S. Issues Large, persistent (30+yrs):
Current account deficitCapital account surplus
Unusual for developed nation Possible factors:
Low U.S. savings rateHigh U.S. consumption & govt spendingStrong dollar
• $ as reserve currency• Petro-dollars• Weak yen & yuan as foreign growth strategy

Capital and Currrent Account flows are linked.
Which causes which is unclear.
Is US trade deficit a result of ROW wanting to invest here?
Or, do US imports lead to ROW investing here?

U.S. Balance of Payments Issues
Large, persistent (30+yrs):Current account deficitCapital account surplus
Unusual for developed nation Possible factors:
Low U.S. savings rateExchange rates: Strong dollar
• Safe assets• $ as reserve currency• Petro-dollars• Weak yen & yuan as foreign growth strategy
Created:Jan 2008by Jim Luke.

Created:Jan 2008by Jim Luke.
Foreign Exchange Rates
Forex rates are “prices”
• Represents:• how many Y’s does 1 X buy• Expressed two ways: reciprocals of each
other
Example: suppose $1.00 CAD = $1.05 USD
then $1.00 USD = $ 0.9524 CAD
LESSON: always pay close attention to which way the exchange rate is expressed –

Created:Jan 2008by Jim Luke.
Exchange Rates – An Example
November 4, 2007. For more up-to-date rates, see http://www.x-rates.com/ for rates updated daily. See Yahoo finance for up-to-the-minute rates.
U.S. $
1 114.71 0.69 0.93 0.48 1.08 1.150.01 1 0.01 0.01 0 0.01 0.011.45 166.33 1 1.35 0.69 1.57 1.671.07 122.76 0.74 1 0.51 1.16 1.232.09 239.74 1.44 1.95 1 2.26 2.410.92 105.99 0.64 0.86 0.44 1 1.070.87 99.42 0.6 0.81 0.41 0.94 1
CurrencyLast Trade ¥en Euro Can $ U.K. £ AU $ Swiss Franc
1 U.S. $ = 1 ¥en =
1 Euro = 1 Can $ = 1 U.K. £ =
1 AU $ = 1 Swiss Franc =

Created:Jan 2008by Jim Luke.
Changes in Rates Matter
Caused by differences in inflation, interest rates, and attractiveness
Change capital flows Change Pricing of imports & exports change
current account

Exchange Rate Changes: Winners
Benefits from a weaker home currency ($ if in US)US exporterForeign ImporterForeign Tourist Visiting US

Exchange Rate Changes: Winners
Benefits from a stronger home currency ($ if in US)• Foreign Exporter• US importer• US Tourist

Created:Jan 2008by Jim Luke.
What “Should” Exchange Rates Be?
Whatever creates equilibrium Absolute rate is irrelevant Purchasing Power Parity Theory
“Big Mac” Index & others