creating a global surface solutions and advanced materials ... · pdf fileit's not...
TRANSCRIPT
It's not allowed to change the master It's not allowed to change the master
8,6
4,7
8,0
9,1
6,6
8,3
0,9
0,5
Version September 2012
Creating a global surface solutions
and advanced materials powerhouse
Bellevue Meets Management
CFO Jürg Fedier
Flims, January 15, 2016

It's not allowed to change the master It's not allowed to change the master
8,6
4,7
8,0
9,1
6,6
8,3
0,9
0,5
Version September 2012
Agenda
20160115_Oerlikon Presentation_Bellevue Meet Management 2016Page 2
1 Oerlikon priorities
– INVEST: Surface Solutions Segment
– MANAGE: Manmade Fibers Segment
– FIX: Drive Systems Segment
– Group & Summary
2 Appendix
It's not allowed to change the master It's not allowed to change the master
8,6
4,7
8,0
9,1
6,6
8,3
0,9
0,5
Version September 2012
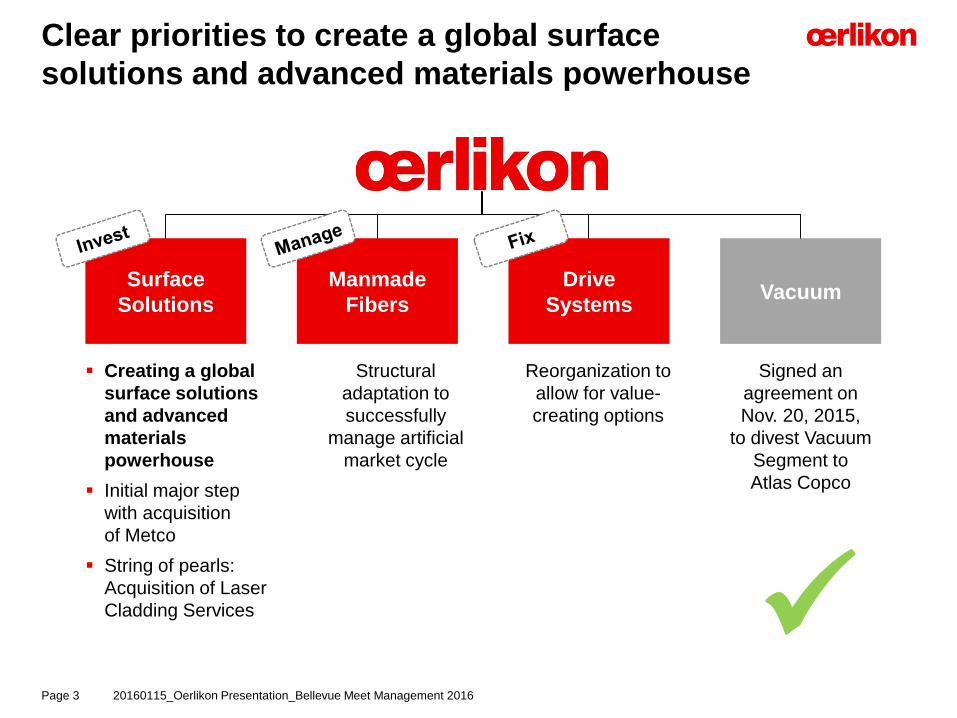
Creating a global
surface solutions
and advanced
materials
powerhouse
Initial major step
with acquisition
of Metco
String of pearls:
Acquisition of Laser
Cladding Services
Clear priorities to create a global surface
solutions and advanced materials powerhouse
20160115_Oerlikon Presentation_Bellevue Meet Management 2016Page 3
Surface
Solutions
Manmade
Fibers
Drive
SystemsVacuum
Signed an
agreement on
Nov. 20, 2015,
to divest Vacuum
Segment to
Atlas Copco
Reorganization to
allow for value-
creating options
Structural
adaptation to
successfully
manage artificial
market cycle

It's not allowed to change the master It's not allowed to change the master
8,6
4,7
8,0
9,1
6,6
8,3
0,9
0,5
Version September 2012
Agenda
20160115_Oerlikon Presentation_Bellevue Meet Management 2016Page 4
1 Oerlikon priorities
– INVEST: Surface Solutions Segment
– MANAGE: Manmade Fibers Segment
– FIX: Drive Systems Segment
– Group & Summary
2 Appendix
It's not allowed to change the master It's not allowed to change the master
8,6
4,7
8,0
9,1
6,6
8,3
0,9
0,5
Version September 2012
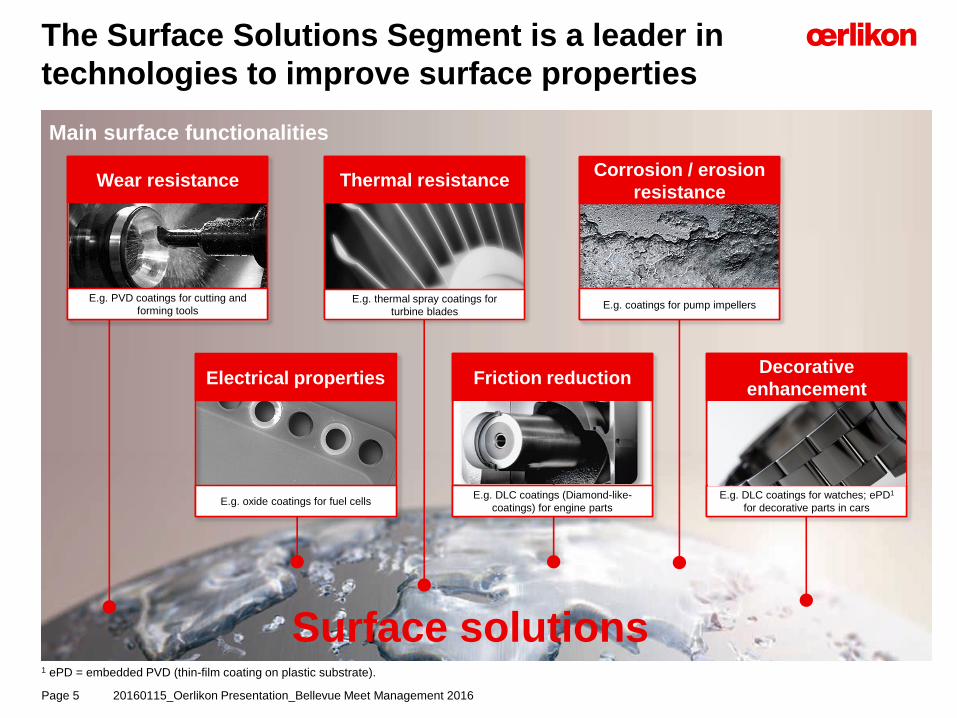
The Surface Solutions Segment is a leader in
technologies to improve surface properties
20160115_Oerlikon Presentation_Bellevue Meet Management 2016Page 5
Main surface functionalities
29147978Wear resistance
E.g. PVD coatings for cutting and
forming tools E.g. thermal spray coatings for
turbine blades
Thermal resistanceCorrosion / erosion
resistance
E.g. coatings for pump impellers
48711002Electrical properties
E.g. oxide coatings for fuel cells
Surface solutions
10688883Decorative
enhancement
E.g. DLC coatings for watches; ePD1
for decorative parts in cars
1 ePD = embedded PVD (thin-film coating on plastic substrate).
10688883Friction reduction
E.g. DLC coatings (Diamond-like-
coatings) for engine parts
It's not allowed to change the master It's not allowed to change the master
8,6
4,7
8,0
9,1
6,6
8,3
0,9
0,5
Version September 2012
20160115_Oerlikon Presentation_Bellevue Meet Management 2016Page 6
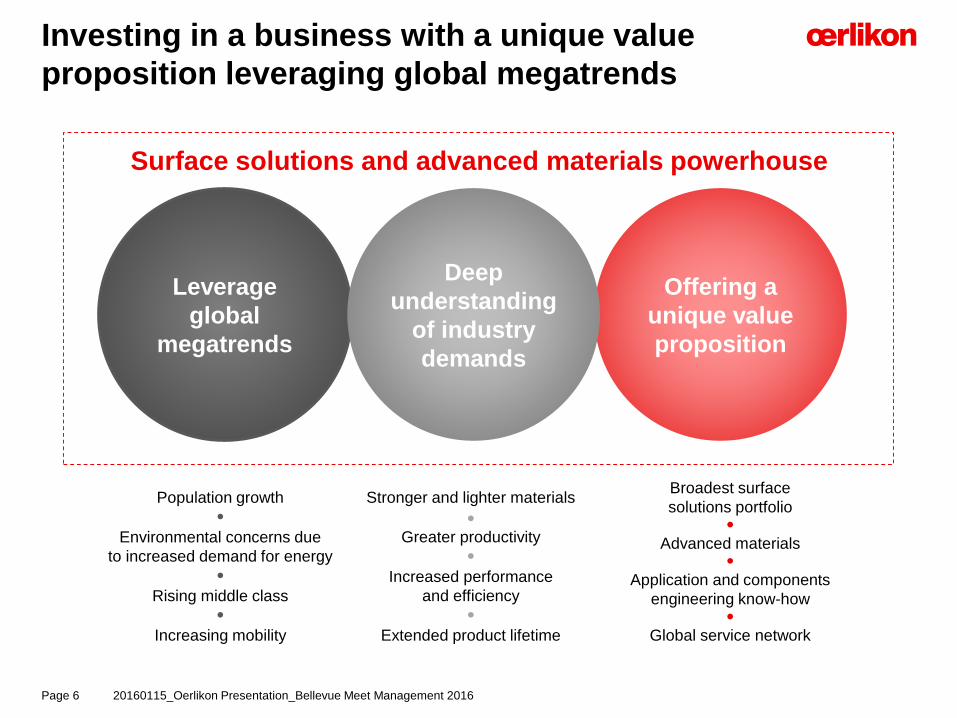
Investing in a business with a unique value
proposition leveraging global megatrends
Surface solutions and advanced materials powerhouse
Leverage
global
megatrends
Offering a
unique value
proposition
Deep
understanding
of industry
demands
Population growth
Environmental concerns due
to increased demand for energy
Rising middle class
Increasing mobility
Stronger and lighter materials
Greater productivity
Increased performance
and efficiency
Extended product lifetime
Broadest surface
solutions portfolio
Advanced materials
Application and components
engineering know-how
Global service network
It's not allowed to change the master It's not allowed to change the master
8,6
4,7
8,0
9,1
6,6
8,3
0,9
0,5
Version September 2012
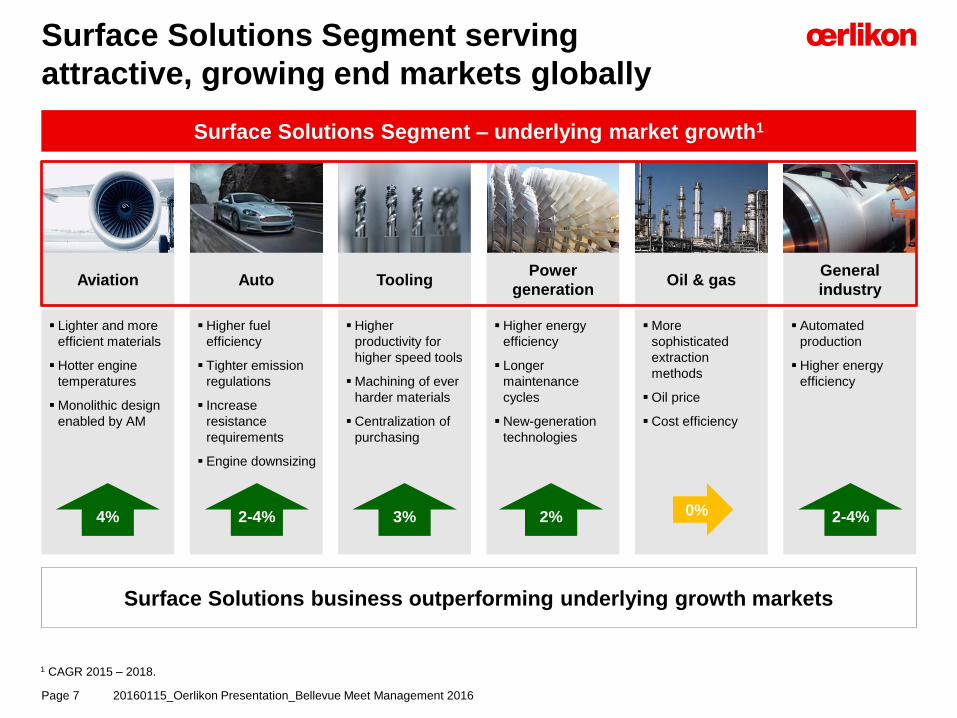
Surface Solutions Segment serving
attractive, growing end markets globally
20160115_Oerlikon Presentation_Bellevue Meet Management 2016Page 7
Aviation Auto ToolingPower
generationOil & gas
General
industry
Higher fuel
efficiency
Tighter emission
regulations
Increase
resistance
requirements
Engine downsizing
Higher
productivity for
higher speed tools
Machining of ever
harder materials
Centralization of
purchasing
Higher energy
efficiency
Longer
maintenance
cycles
New-generation
technologies
More
sophisticated
extraction
methods
Oil price
Cost efficiency
Automated
production
Higher energy
efficiency
Surface Solutions Segment – underlying market growth1
Surface Solutions business outperforming underlying growth markets
2-4% 3% 2-4%
Lighter and more
efficient materials
Hotter engine
temperatures
Monolithic design
enabled by AM
4% 2% 0%
1 CAGR 2015 – 2018.
It's not allowed to change the master It's not allowed to change the master
8,6
4,7
8,0
9,1
6,6
8,3
0,9
0,5
Version September 2012
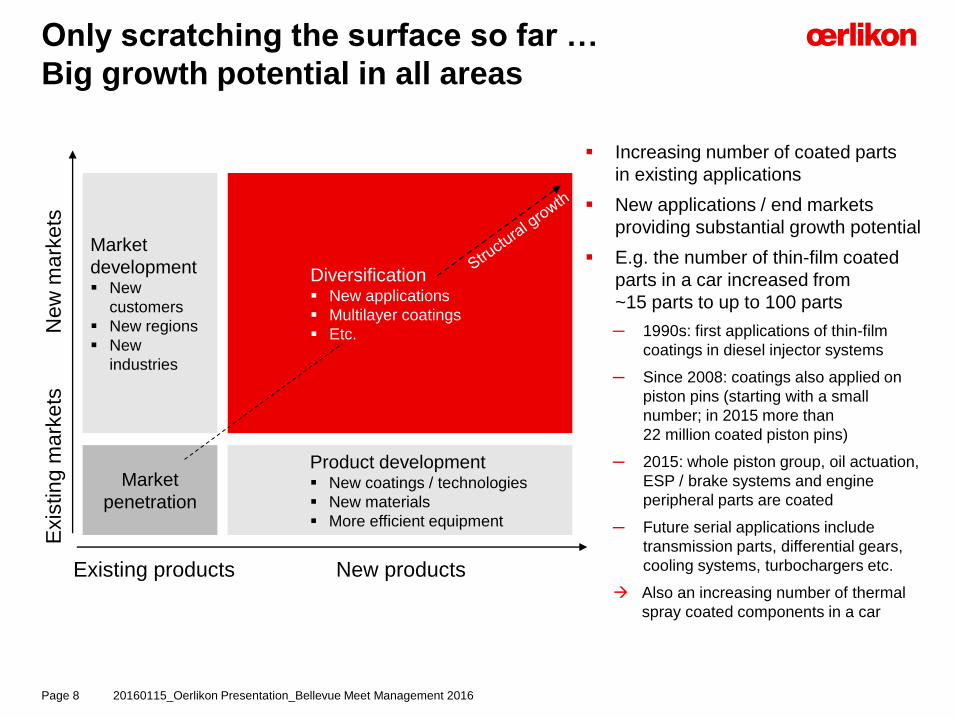
Only scratching the surface so far …
Big growth potential in all areas
20160115_Oerlikon Presentation_Bellevue Meet Management 2016Page 8
Market
development New
customers
New regions
New
industries
Market
penetration
Diversification New applications
Multilayer coatings
Etc.
Product development New coatings / technologies
New materials
More efficient equipment
New products
Exis
ting m
ark
ets
Existing products
New
mark
ets
Increasing number of coated parts
in existing applications
New applications / end markets
providing substantial growth potential
E.g. the number of thin-film coated
parts in a car increased from
~15 parts to up to 100 parts
─ 1990s: first applications of thin-film
coatings in diesel injector systems
─ Since 2008: coatings also applied on
piston pins (starting with a small
number; in 2015 more than
22 million coated piston pins)
─ 2015: whole piston group, oil actuation,
ESP / brake systems and engine
peripheral parts are coated
─ Future serial applications include
transmission parts, differential gears,
cooling systems, turbochargers etc.
Also an increasing number of thermal
spray coated components in a car
It's not allowed to change the master It's not allowed to change the master
8,6
4,7
8,0
9,1
6,6
8,3
0,9
0,5
Version September 2012
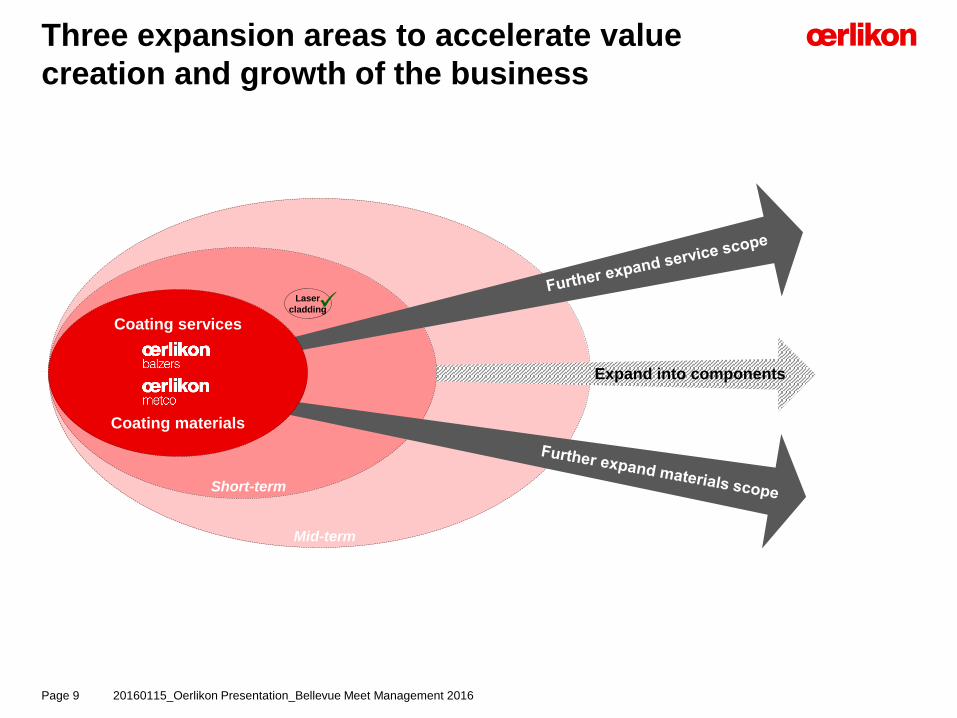
Three expansion areas to accelerate value
creation and growth of the business
20160115_Oerlikon Presentation_Bellevue Meet Management 2016Page 9
Mid-term
Expand into components
Short-term
Coating services
Coating materials
Laser
cladding
It's not allowed to change the master It's not allowed to change the master
8,6
4,7
8,0
9,1
6,6
8,3
0,9
0,5
Version September 2012
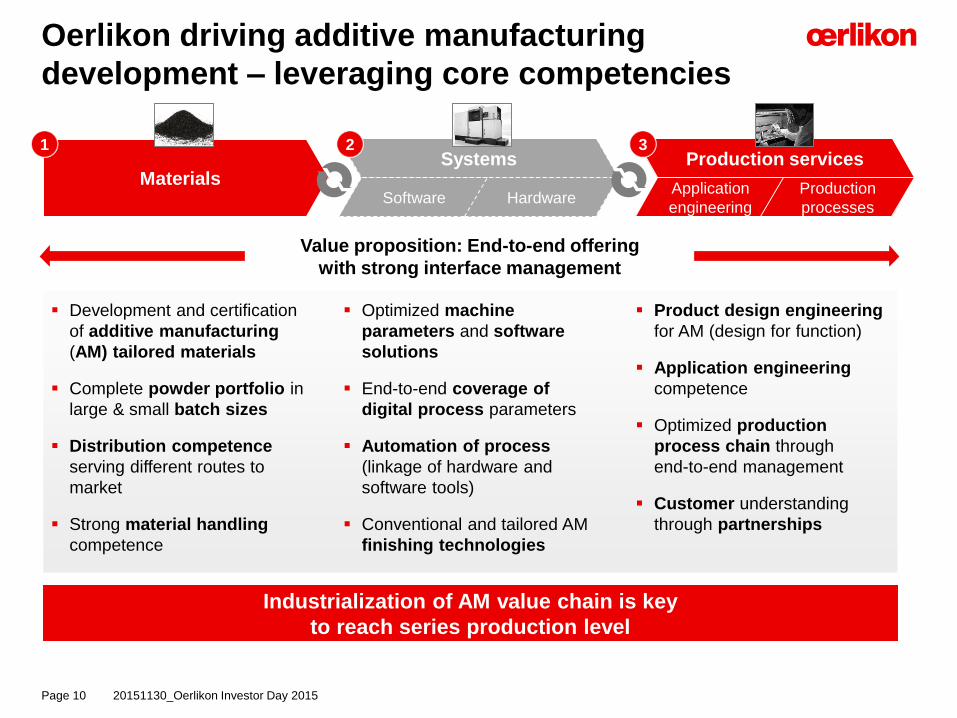
Oerlikon driving additive manufacturing
development – leveraging core competencies
Production services
Application
engineering
Production
processes
Development and certification
of additive manufacturing
(AM) tailored materials
Complete powder portfolio in
large & small batch sizes
Distribution competence
serving different routes to
market
Strong material handling
competence
Product design engineering
for AM (design for function)
Application engineering
competence
Optimized production
process chain through
end-to-end management
Customer understanding
through partnerships
Optimized machine
parameters and software
solutions
End-to-end coverage of
digital process parameters
Automation of process
(linkage of hardware and
software tools)
Conventional and tailored AM
finishing technologies
Materials
1 3
Value proposition: End-to-end offering
with strong interface management
Industrialization of AM value chain is key
to reach series production level
Systems
Software Hardware
2
20151130_Oerlikon Investor Day 2015Page 10

It's not allowed to change the master It's not allowed to change the master
8,6
4,7
8,0
9,1
6,6
8,3
0,9
0,5
Version September 2012
Total addressable market by technology (as of 2015)
Disciplined expansion of business increases
addressable market by ~20% to ~CHF 11bn
20160115_Oerlikon Presentation_Bellevue Meet Management 2016Page 11
Source: Oerlikon estimates
Additive manufacturing (AM)
Physical vapor deposition (PVD)
Brazing & welding
Nitriding (plasma & gas)
Thermal spray service
Others (components)
~CHF 9 bn ~CHF 11 bn+ additional
technologies
Total addressable market based
on current technology portfolio
Total addressable market
incl. additional technologies
By adding additional technologies such as brazing, welding and additive manufacturing, the
Surface Solutions Segment’s total addressable market increases by ~20% from
~CHF 9 billion to ~CHF 11 billion
It's not allowed to change the master It's not allowed to change the master
8,6
4,7
8,0
9,1
6,6
8,3
0,9
0,5
Version September 2012
Agenda
20160115_Oerlikon Presentation_Bellevue Meet Management 2016Page 12
1 Oerlikon priorities
– INVEST: Surface Solutions Segment
– MANAGE: Manmade Fibers Segment
– FIX: Drive Systems Segment
– Group & Summary
2 Appendix

It's not allowed to change the master It's not allowed to change the master
8,6
4,7
8,0
9,1
6,6
8,3
0,9
0,5
Version September 2012
Oerlikon in the middle of the polyester value
chain
20160115_Oerlikon Presentation_Bellevue Meet Management 2016Page 13
Refinery
Aromatics
plant
Steam
cracker
PTA plant
Polyester
yarn
Polyester
chips PET-packaging
Apparel
Home textiles
Technical textiles
Polyester chainEnergy and upstream petrochemicals
Oerlikon focus
End markets
PX
PTA
MEG
Crude
oil Naphtha
Ethylene
PX = paraxylene; PTA = purified terephthalic acid; MEG = monoethylene glycol; PET = polyethylene terephthalate.
Textile
processing
MEG plant
Polymer processing
(polycondensation)
Spinning
plant
Polyester melt
Polyester
melt
It's not allowed to change the master It's not allowed to change the master
8,6
4,7
8,0
9,1
6,6
8,3
0,9
0,5
Version September 2012
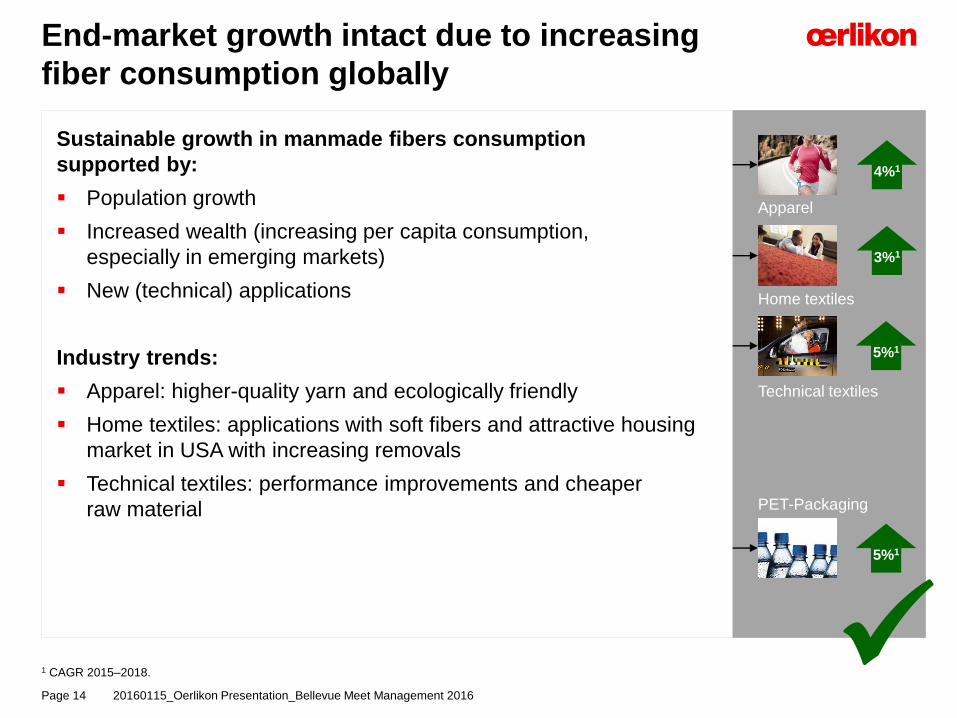
End-market growth intact due to increasing
fiber consumption globally
20160115_Oerlikon Presentation_Bellevue Meet Management 2016Page 14
1 CAGR 2015–2018.
Refinery
Aromatics
plant
Steam
cracker
PTA plant
Polyester
yarn
Polyester
chips PET-PackagingMEG plant
Polymer processing
Spinning
plant Apparel
Home textiles
Technical textiles
Sustainable growth in manmade fibers consumption
supported by:
Population growth
Increased wealth (increasing per capita consumption,
especially in emerging markets)
New (technical) applications
Industry trends:
Apparel: higher-quality yarn and ecologically friendly
Home textiles: applications with soft fibers and attractive housing
market in USA with increasing removals
Technical textiles: performance improvements and cheaper
raw material
4%1
5%1
5%1
3%1

It's not allowed to change the master It's not allowed to change the master
8,6
4,7
8,0
9,1
6,6
8,3
0,9
0,5
Version September 2012
46
29
14
2020E2019E2018E2017E2016E201520102000
Revised growth environment in China in the
short term due to significant overcapacity
20160115_Oerlikon Presentation_Bellevue Meet Management 2016Page 15
Boom of Chinese textile industry
driven by 12th five-year plan
China with ambition to become
number one in textile industry
Subsidies from Chinese
government
Easy access to financing
Overcapacity of 20 to 25%
Current situation characterized by overcapacity and general
slowdown of Chinese economy
Postponements of large-scale projects and cancellation of
smaller projects from Chinese customers
New regulations for handling chemicals after Tianjin
explosion
Slowdown of Chinese economy and devaluation of RMB also
impacting the Chinese textile industry
External factors additionally impacting global textile industry:
─ General economic downturn worldwide
─ Low oil price putting pressure on Segment’s customers
2011–15:
buildup of
overcapacity
Initial capacity assumption
(CAGR 6%)New reality
(CAGR ~3%)

It's not allowed to change the master It's not allowed to change the master
8,6
4,7
8,0
9,1
6,6
8,3
0,9
0,5
Version September 2012
Now rather cautious indications from current drafts of
13th five-year plan (2016–2020)
Annual average growth rate of capacity expected to be
around 3% (vs. >9% in 12th five-year plan)
Chinese government controlling the new production
capacity to improve utilization of existing capacity
Three overlapping phases expected in 13th five-year
plan:
Latest assessmentInitial expectations
Initially positive indications from
first drafts of 13th five-year plan
Textile industry to be at the
core of the five-year plan
Continuous substitution of
natural fibers with
manmade fibers
Focus on high-tech fibers
Energy-efficient equipment
Directional adaptation in upcoming 13th
Chinese five-year plan1
20160115_Oerlikon Presentation_Bellevue Meet Management 2016Page 16
1 13th Chinese five-year plan expected to be approved in March 2016.
Rebalancing:
Increase
capacity
utilization
Optimization:
Replace old
equipment
(technology
upgrade)
Appropriate
development:
Appropriately
recover the
growth of
production
capacity
(planned net
growth
~6 m t/a)
Phase 1Phase 2
Phase 3
2015
level
It's not allowed to change the master It's not allowed to change the master
8,6
4,7
8,0
9,1
6,6
8,3
0,9
0,5
Version September 2012
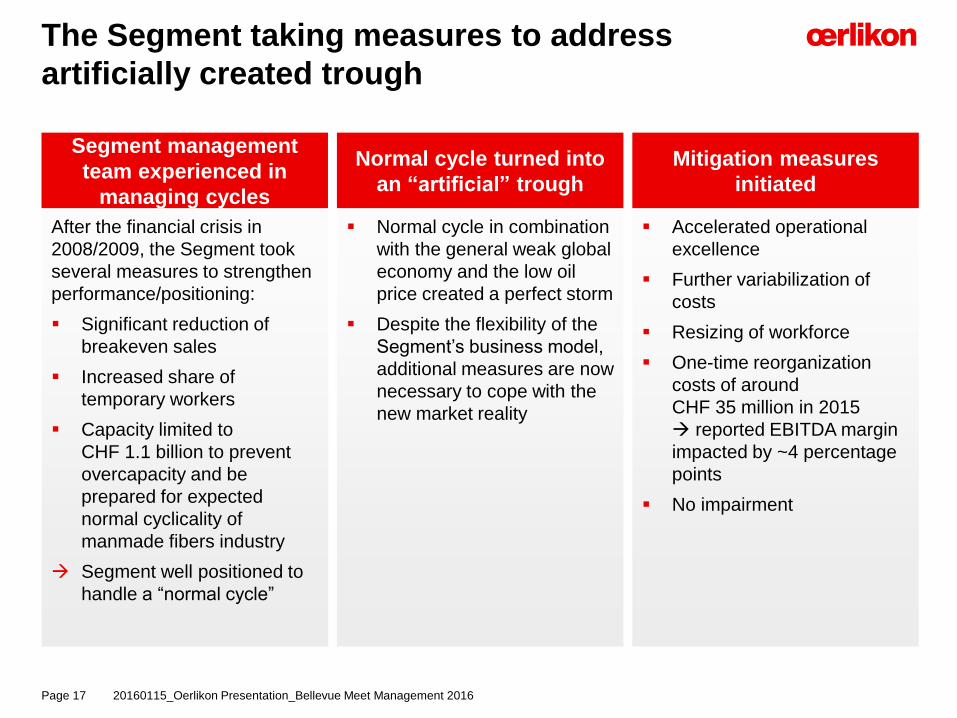
The Segment taking measures to address
artificially created trough
20160115_Oerlikon Presentation_Bellevue Meet Management 2016Page 17
Accelerated operational
excellence
Further variabilization of
costs
Resizing of workforce
One-time reorganization
costs of around
CHF 35 million in 2015
reported EBITDA margin
impacted by ~4 percentage
points
No impairment
Segment management
team experienced in
managing cycles
After the financial crisis in
2008/2009, the Segment took
several measures to strengthen
performance/positioning:
Significant reduction of
breakeven sales
Increased share of
temporary workers
Capacity limited to
CHF 1.1 billion to prevent
overcapacity and be
prepared for expected
normal cyclicality of
manmade fibers industry
Segment well positioned to
handle a “normal cycle”
Normal cycle turned into
an “artificial” trough
Mitigation measures
initiated
Normal cycle in combination
with the general weak global
economy and the low oil
price created a perfect storm
Despite the flexibility of the
Segment’s business model,
additional measures are now
necessary to cope with the
new market reality
It's not allowed to change the master It's not allowed to change the master
8,6
4,7
8,0
9,1
6,6
8,3
0,9
0,5
Version September 2012
Agenda
20160115_Oerlikon Presentation_Bellevue Meet Management 2016Page 18
1 Oerlikon priorities
– INVEST: Surface Solutions Segment
– MANAGE: Manmade Fibers Segment
– FIX: Drive Systems Segment
– Group & Summary
2 Appendix
It's not allowed to change the master It's not allowed to change the master
8,6
4,7
8,0
9,1
6,6
8,3
0,9
0,5
Version September 2012
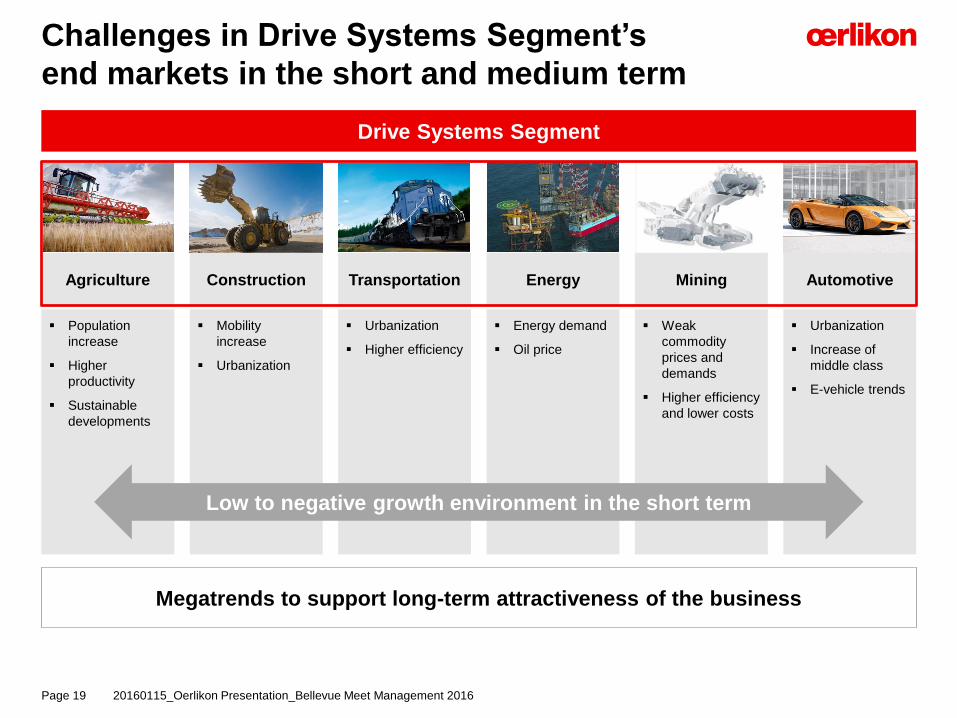
Challenges in Drive Systems Segment’s
end markets in the short and medium term
20160115_Oerlikon Presentation_Bellevue Meet Management 2016Page 19
Agriculture Construction Transportation Energy Mining Automotive
Mobility
increase
Urbanization
Urbanization
Higher efficiency
Energy demand
Oil price
Weak
commodity
prices and
demands
Higher efficiency
and lower costs
Urbanization
Increase of
middle class
E-vehicle trends
Drive Systems Segment
Megatrends to support long-term attractiveness of the business
Population
increase
Higher
productivity
Sustainable
developments
Low to negative growth environment in the short term
It's not allowed to change the master It's not allowed to change the master
8,6
4,7
8,0
9,1
6,6
8,3
0,9
0,5
Version September 2012
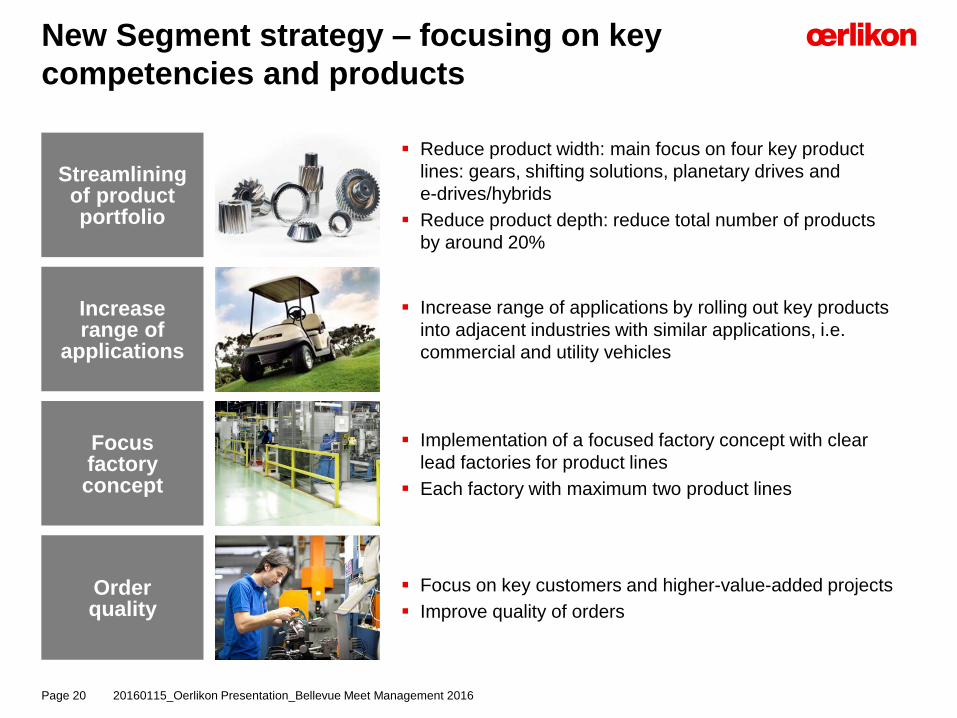
New Segment strategy – focusing on key
competencies and products
20160115_Oerlikon Presentation_Bellevue Meet Management 2016Page 20
Implementation of a focused factory concept with clear
lead factories for product lines
Each factory with maximum two product lines
Streamliningof productportfolio
Reduce product width: main focus on four key product
lines: gears, shifting solutions, planetary drives and
e-drives/hybrids
Reduce product depth: reduce total number of products
by around 20%
Increaserange of
applications
Focusfactoryconcept
Increase range of applications by rolling out key products
into adjacent industries with similar applications, i.e.
commercial and utility vehicles
Focus on key customers and higher-value-added projects
Improve quality of orders
Orderquality

It's not allowed to change the master It's not allowed to change the master
8,6
4,7
8,0
9,1
6,6
8,3
0,9
0,5
Version September 2012
About CHF 25 million
capex over the next three
years related to technology
upgrade
Reorganization provisions
in the range of CHF 55 to
65 million in 2015
Goodwill impairment of
around CHF 470 million
given the current weakness
in key end markets
impacting the medium- to
long-term outlook
Technology upgrade
Investments in cutting edge
manufacturing technology
enable the Segment to
maintain / expand its
leading position in gears
and synchronizer systems
into commercial vehicles
and to further strengthen
its competitive position in
clutch modules
Reorganization Financial impact
Reduction of cost base
─ Streamlining of
portfolio/product offering
─ Order selectivity
Resizing of global
workforce; workforce in
US already reduced by
approximately 250 FTEs
Reorganization measures initiated to adapt
to current market trends
20160115_Oerlikon Presentation_Bellevue Meet Management 2016Page 21
Fix Drive Systems Segment to allow for value-creating options

It's not allowed to change the master It's not allowed to change the master
8,6
4,7
8,0
9,1
6,6
8,3
0,9
0,5
Version September 2012
Agenda
20160115_Oerlikon Presentation_Bellevue Meet Management 2016Page 22
1 Oerlikon priorities
– INVEST: Surface Solutions Segment
– MANAGE: Manmade Fibers Segment
– FIX: Drive Systems Segment
– Group & Summary
2 Appendix

It's not allowed to change the master It's not allowed to change the master
8,6
4,7
8,0
9,1
6,6
8,3
0,9
0,5
Version September 2012
Costs and savings related to reorganization
Structural adaptation and reorganization
costs in Manmade Fibers and Drive
Systems Segment totaling
CHF 90 to 100 million in 2015
Noncash goodwill impairment in Drive
Systems Segment of around
CHF 470 million
Expected annual savings of
CHF 50 to 60 million starting 2016
Addressing cost base by reorganization and
continued operational excellence
20160115_Oerlikon Presentation_Bellevue Meet Management 2016Page 23
Entire program centrally led by Group
Business Services
Productivity improvement with a focus on
supply chain management
Expected annual gross savings of
~CHF 40 million to compensate for
market-driven factors and cost inflation
Cost savings related to operational excellence program
Operational
Excellence
Recurring annual gross savings of up to CHF 100 million starting 2016
WCP = World Class Procurement; HSE = Health, Safety and Environment; WCM = World Class Manufacturing
It's not allowed to change the master It's not allowed to change the master
8,6
4,7
8,0
9,1
6,6
8,3
0,9
0,5
Version September 2012
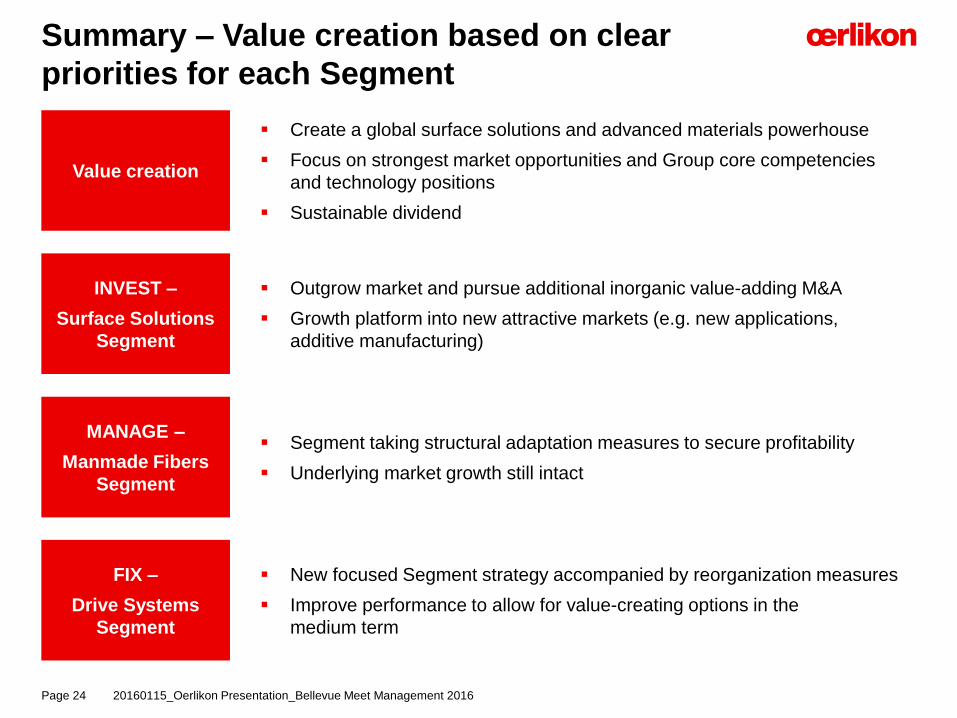
Summary – Value creation based on clear
priorities for each Segment
20160115_Oerlikon Presentation_Bellevue Meet Management 2016Page 24
Value creation
INVEST –
Surface Solutions
Segment
Create a global surface solutions and advanced materials powerhouse
Focus on strongest market opportunities and Group core competencies
and technology positions
Sustainable dividend
Outgrow market and pursue additional inorganic value-adding M&A
Growth platform into new attractive markets (e.g. new applications,
additive manufacturing)
MANAGE –
Manmade Fibers
Segment
Segment taking structural adaptation measures to secure profitability
Underlying market growth still intact
FIX –
Drive Systems
Segment
New focused Segment strategy accompanied by reorganization measures
Improve performance to allow for value-creating options in the
medium term
It's not allowed to change the master It's not allowed to change the master
8,6
4,7
8,0
9,1
6,6
8,3
0,9
0,5
Version September 2012
Agenda
20160115_Oerlikon Presentation_Bellevue Meet Management 2016Page 25
1 Oerlikon priorities
– INVEST: Surface Solutions Segment
– MANAGE: Manmade Fibers Segment
– FIX: Drive Systems Segment
– Group & Summary
2 Appendix

It's not allowed to change the master It's not allowed to change the master
8,6
4,7
8,0
9,1
6,6
8,3
0,9
0,5
Version September 2012
Oerlikon – a global industrial player
Oerlikon
Group
Sales: CHF 3 215m
EBITDA: CHF 525m
>15 500 employees
> 200 locations
36 countries
CHF 121m in R&D
Vacuum
Segment2
CHF 390m
CHF 41m
Drive
Systems
Segment
CHF 779m
CHF 82m
Manmade
Fibers
Segment
CHF 1 073m
CHF 217m
Surface
Solutions
Segment1
CHF 973m
CHF 183m
20160115_Oerlikon Presentation_Bellevue Meet Management 2016Page 26
1 Metco consolidated for seven months; 2 Signed an agreement on Nov. 20, 2015, to divest Vacuum Segment to Atlas Copco

It's not allowed to change the master It's not allowed to change the master
8,6
4,7
8,0
9,1
6,6
8,3
0,9
0,5
Version September 2012
We want to acquire businesses that…
generate profitable growth above the
industry average
are innovation driven
extend / strengthen our technology
portfolio and/or market access
(customer access, geographic footprint)
offer a special value proposition to
customers
reduce earnings cyclicality
Acquisition criteriaCapital allocation priorities
Clearly defined capital allocation priorities
and acquisition criteria
20160115_Oerlikon Presentation_Bellevue Meet Management 2016Page 27
Sustainable annual dividend
Pri
ori
tie
s
1. Invest in organic growth, R&D
and capital expenditure
2. Invest in “String of pearls”
(bolt-on M&A)
3. M&A in existing or adjacent
technologies/markets

It's not allowed to change the master It's not allowed to change the master
8,6
4,7
8,0
9,1
6,6
8,3
0,9
0,5
Version September 2012
A balanced portfolio with high share of
service business
Vacuum (discontinued operations)
Drive Systems
Manmade Fibers
Surface Solutions
Rest of World
Europe
Asia / Pacific
North America
Sales Q3 2015: CHF 722 million Sales Q3 2015 : CHF 722 million
41%
12%
22%
25%
39%37%
20%
4%
Segment split Regional split
Goods, Equipment
& Components
Service & Spare Parts
Sales Q3 2015 : CHF 722 million
67%
33%
Sales split
20160115_Oerlikon Presentation_Bellevue Meet Management 2016Page 28

It's not allowed to change the master It's not allowed to change the master
8,6
4,7
8,0
9,1
6,6
8,3
0,9
0,5
Version September 2012
In CHF million In CHF million In CHF million; in % of sales
Adverse global developments in key end markets and regions as well as negative currency effects
Currency development impacts Group top-line in the amount of ~ minus 5 %
Q3 impact on profitability from Metco transaction: CHF 2.2m integration cost & CHF 7.4m amortization
Accelerated market weaknesses and
unfavorable FX impacted top-line
761722
851
-10.6%
Q3 2015Q3 20141 Q3 2015 at
constant FX
1 Q3 2014 restated for the divestment of the Advanced Technologies Segment
15.9% 16.3%
726691
825
-12.0%
Q3 2015 at
constant FX
Q3 2015Q3 20141
20160115_Oerlikon Presentation_Bellevue Meet Management 2016Page 29
Order intake Sales EBITDA (margin)
122118135
-9.6%
Q3 2015Q3 20141 Q3 2015 at
constant FX
16.0%

It's not allowed to change the master It's not allowed to change the master
8,6
4,7
8,0
9,1
6,6
8,3
0,9
0,5
Version September 2012
In CHF million In CHF million
Order intake Sales
In CHF million; in % of sales
EBITDA (margin)
FX impact on Orders, Sales and EBITDA
Q3 2015
726691
Trans-
lation
effects
Q3 2015
FX
impact
adj.
+42
Trans-
action
effects
-7
Q3 2015
reported
5.1%
122118
Q3 2015
FX
impact
adj.
Q3 2015
reported
+6-2
3.4%
Trans-
lation
effects
Trans-
action
effects
16.016.3
Margin in %
20160115_Oerlikon Presentation_Bellevue Meet Management 2016Page 30
761722
-6
Q3 2015
reported
Trans-
lation
effects
+45
Trans-
action
effects
5.4%
Q3 2015
FX
impact
adj.
Impact mainly related to translation as a result of reporting currency CHF
Appreciation of currencies (INR, USD, CNY) against CHF – EUR with devaluation against CHF
Limited impact on EBITDA margin
Impact on Segments varies in line with their global (currency) positioning

It's not allowed to change the master It's not allowed to change the master
8,6
4,7
8,0
9,1
6,6
8,3
0,9
0,5
Version September 2012
in CHF million Q3 2015 Q3 2014 Δ
Order intake 299 317 -5.7 %
Sales (to 3rd parties) 296 312 -5.1 %
EBITDA 63 46 +37.0 %
EBITDA margin1 21.3 % 14.6 % +6.7 pp
EBIT 38 18 >100 %
EBIT margin1 12.8 % 5.7 % +7.1 pp
Surface Solutions Segment – Strong
profitability despite lower top-line
RoW
5%
Asia /
Pacific
27%
North America
20%
Europe48%
Automotive
22%
Tooling37%22%
General
Industry
Aviation
Power Generation
12%
7%
1 as % of sales
Strong profitability achieved early cost
saving measures
Integration well on track further moving
toward normal operations
Continuous deployment of new products,
competence and applications
Europe shows positive development,
weakening in Asia; US behind expectation
MRO market flat; Automotive growth
slowed down, in particular China/Europe
Oil & Gas industry down (no prediction for
recovery short term)
Power Generation strong
Operational
performance
Market
development
Key figures
Sales
Q3 2015
Sales
Q3 2015
20160115_Oerlikon Presentation_Bellevue Meet Management 2016Page 31

It's not allowed to change the master It's not allowed to change the master
8,6
4,7
8,0
9,1
6,6
8,3
0,9
0,5
Version September 2012
Financial impact of Metco transaction –
Reality check confirms initial assumptions
2015E 2016E 2017E
>CHF 30 million >CHF 30 million >CHF 30 million
Integration costs
>CHF 10 million <CHF 10 million
~CHF 5 million >CHF 10 million
Top-line synergies
Cash
ite
ms
No
n-c
ash
ite
ms
20160115_Oerlikon Presentation_Bellevue Meet Management 2016Page 32
Amortization of acquired identified intangibles assets
Cost synergies (cumulative)Reality check as of Sept. 30, 2015
Inte
gra
tio
n c
os
tsA
mo
rtiz
ati
on
Guidance
FY 2015:
>CHF 10m
9M 2015:
CHF 8.5m
Guidance FY 2015: >CHF 30m
9M 2015:
CHF 22.0m

It's not allowed to change the master It's not allowed to change the master
8,6
4,7
8,0
9,1
6,6
8,3
0,9
0,5
Version September 2012
Illustrations of the advantages of surface
solutions
Page 33 20160115_Oerlikon Presentation_Bellevue Meet Management 2016
Surface
Solutions
Reliability
Safe, lifelong sealing for
subsea valves
Cost saving
Twenty-fold
increase in mine
dewatering pumps
and tar sand
screen life
Productivity
Coatings enable a
10% p.a. increase
in productivity
Energy efficiency
1 million liters of fuel saved
per hour, globally
Increased lifetime
Over 25 000 hours of
operation between services
Environmentally
friendly
Enabling up to 5% fuel
savings through reduction
of friction for heavy-duty
diesel engines1
Aerospace
Power generation
AutomotiveTools
Mining
Oil & Gas
1 Source: DEER 2007, Diesel Engine-Efficiency and Emissions Research Conference, Detroit.
It's not allowed to change the master It's not allowed to change the master
8,6
4,7
8,0
9,1
6,6
8,3
0,9
0,5
Version September 2012
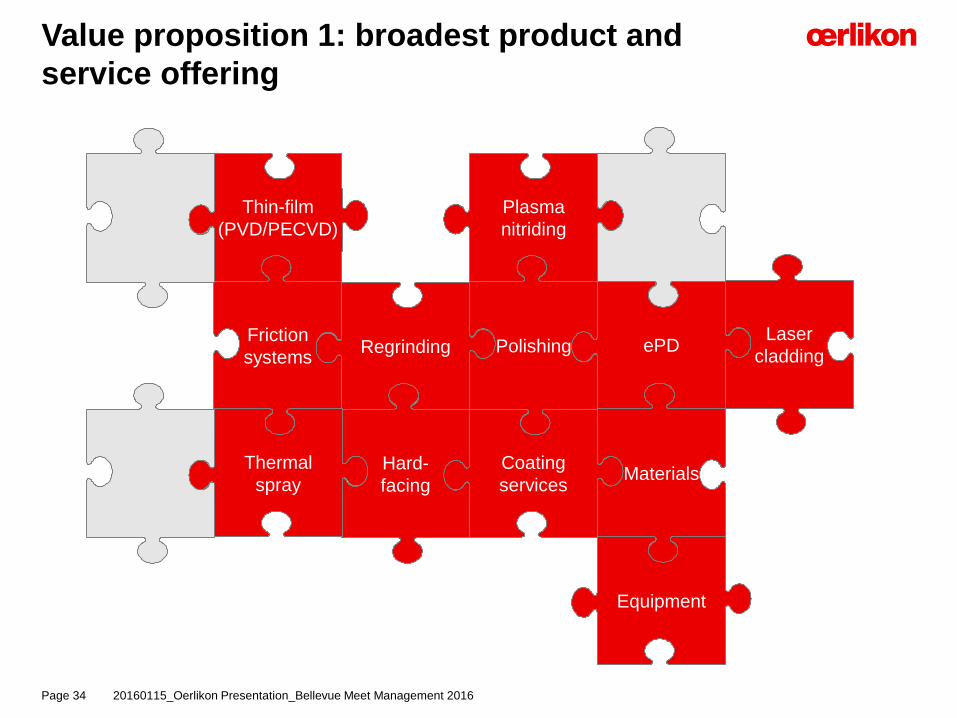
Value proposition 1: broadest product and
service offering
20160115_Oerlikon Presentation_Bellevue Meet Management 2016Page 34
Friction
systemsRegrinding
Thin-film
(PVD/PECVD)
Polishing ePD
Plasma
nitriding
Coating
servicesMaterials
Hard-
facing
Laser
cladding
Thermal
spray
Equipment

It's not allowed to change the master It's not allowed to change the master
8,6
4,7
8,0
9,1
6,6
8,3
0,9
0,5
Version September 2012
Customer example: customer in the automotive industry facing a problem with cylinder bores
Friction reduction by matching of inner bore thermal spray and PVD piston ring coating
Oerlikon delivers solutions for most challenging surface requirements through distinct technology and engineering know-how
Value proposition 2: strong application
engineering competence
20160115_Oerlikon Presentation_Bellevue Meet Management 2016Page 35
Performance requirement Application engineering Coating solution
Customer facing a
problem in product
development
Oerlikon application
engineering know-how
Materials
Processes
Systems
Coatings part of
product design
Standard coating
service process
Coating integral part of next-generation product

It's not allowed to change the master It's not allowed to change the master
8,6
4,7
8,0
9,1
6,6
8,3
0,9
0,5
Version September 2012
Value proposition 3: largest coating service
center network worldwide
20160115_Oerlikon Presentation_Bellevue Meet Management 2016Page 36
24–48 hrs from pickup at customer site to reshipment
Incoming
inspection
Cleaning Pre-
treatment
Loading Coating Outgoing
inspection
Post-
treatment
Packaging /
shipping
Pickup /
delivery
Over 140 service and production
centers in 36 countries worldwide
Example of PVD coating service:

It's not allowed to change the master It's not allowed to change the master
8,6
4,7
8,0
9,1
6,6
8,3
0,9
0,5
Version September 2012
Value proposition 4: broad and versatile
portfolio of materials and equipment
20160115_Oerlikon Presentation_Bellevue Meet Management 2016Page 37
AgglomeratedAgglomerated
& sinteredAgglomerated
& HOSPAgglomerated
& densified
Sintered &crushed
Fused &crushed
Wateratomized
Gasatomized
Mechanicallyclad
Chemicallyclad
Drawn, swagedor rolled
Filled & drawn,swaged or rolled
Material feeder
Spray gun
Thermal spray materials Thermal spray equipment
Constantly developing new materials
with new properties, based on customer /
application requirements

It's not allowed to change the master It's not allowed to change the master
8,6
4,7
8,0
9,1
6,6
8,3
0,9
0,5
Version September 2012
Reconditioning = regrinding and recoating
ReconditioningConventional coat vs. BALINIT coat
Coatings on cutting tools significantly
increase productivity and tool life
20160115_Oerlikon Presentation_Bellevue Meet Management 2016Page 38
BALINIT Pertura coat from Oerlikon Balzers
…increases drilling speed by factor of
2.5 from 80 m/min to 210 m/min and
therefore increases productivity by 85%
…extends tool life time by ~67%
(1 000 holes instead of 600 holes)
+ + + + + +
4 new tools
100%total costs
1 new tool
reconditioned 3×
50%cost savings
A used tool can be reconditioned up to
three times (some tools up to eight times)
and has the same performance as a virgin
tool but at 50% of the costs
37
20
0
10
20
30
40
BALINIT®
PERTURA
+85%
Conventional
coat
Holes/minute
1,000
750
250
0
500
BALINIT®
PERTURA
Conventional
coat
+67%
600
1,000
Tool life time (# of drilled holes)

It's not allowed to change the master It's not allowed to change the master
8,6
4,7
8,0
9,1
6,6
8,3
0,9
0,5
Version September 2012
Significant savings in production costsCoated vs. uncoated forming tools
When forming stainless steel, untreated
tools quickly approach their limits. The
series production of heat shields, for
instance, will stop at about 2 000
produced parts due to cracks in the
tool surface
With thin-film coatings, the life of the
forming tool can be extended by a
factor of ten
Coatings on forming tools reduce
production costs by more than 80%
20160115_Oerlikon Presentation_Bellevue Meet Management 2016Page 39
20,000
Tool costs
(EUR)
2,000
Tool life
(number of
formed heat
shields)
11,080
10,000
+900%
+11%
Uncoated forming tool
Coated forming tool
5,245,00
0,750,55
Tool costs
per produced
part (EUR)
Total
production
costs per
part (EUR)1
-89% -86%
1 Production costs of € 0.20; extra cost per part for uncoated tools of € 0.04.
It's not allowed to change the master It's not allowed to change the master
8,6
4,7
8,0
9,1
6,6
8,3
0,9
0,5
Version September 2012
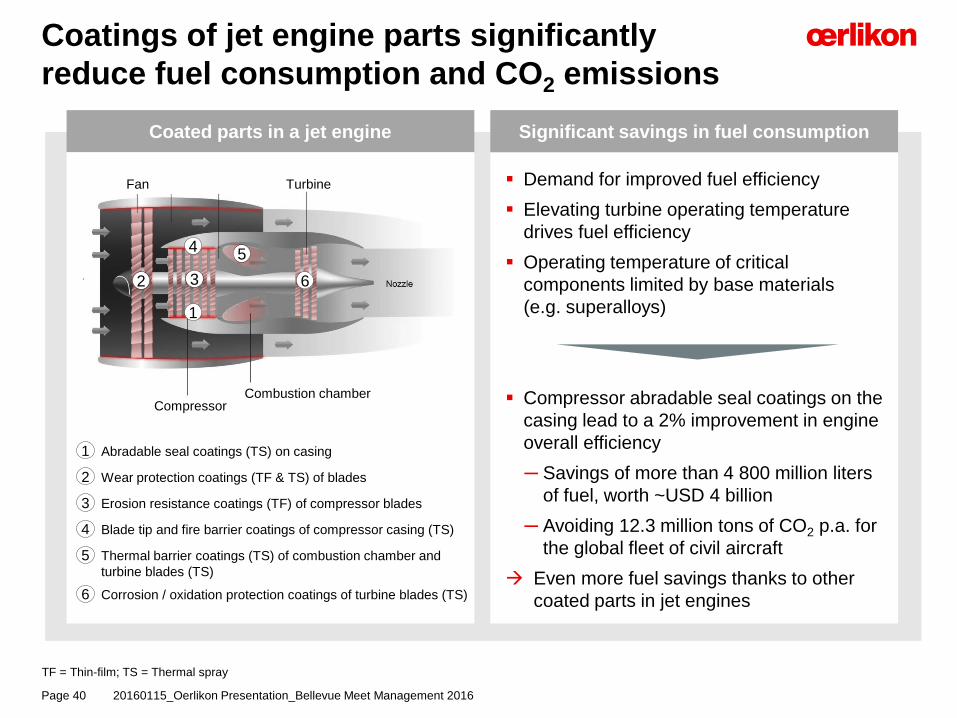
Demand for improved fuel efficiency
Elevating turbine operating temperature
drives fuel efficiency
Operating temperature of critical
components limited by base materials
(e.g. superalloys)
Compressor abradable seal coatings on the
casing lead to a 2% improvement in engine
overall efficiency
─ Savings of more than 4 800 million liters
of fuel, worth ~USD 4 billion
─ Avoiding 12.3 million tons of CO2 p.a. for
the global fleet of civil aircraft
Even more fuel savings thanks to other
coated parts in jet engines
Significant savings in fuel consumptionCoated parts in a jet engine
Coatings of jet engine parts significantly
reduce fuel consumption and CO2 emissions
20160115_Oerlikon Presentation_Bellevue Meet Management 2016Page 40
Turbine
Combustion chamberCompressor
Fan
5
63
4
2
1
1 Abradable seal coatings (TS) on casing
2 Wear protection coatings (TF & TS) of blades
3 Erosion resistance coatings (TF) of compressor blades
4 Blade tip and fire barrier coatings of compressor casing (TS)
5 Thermal barrier coatings (TS) of combustion chamber and
turbine blades (TS)
6 Corrosion / oxidation protection coatings of turbine blades (TS)
TF = Thin-film; TS = Thermal spray
It's not allowed to change the master It's not allowed to change the master
8,6
4,7
8,0
9,1
6,6
8,3
0,9
0,5
Version September 2012
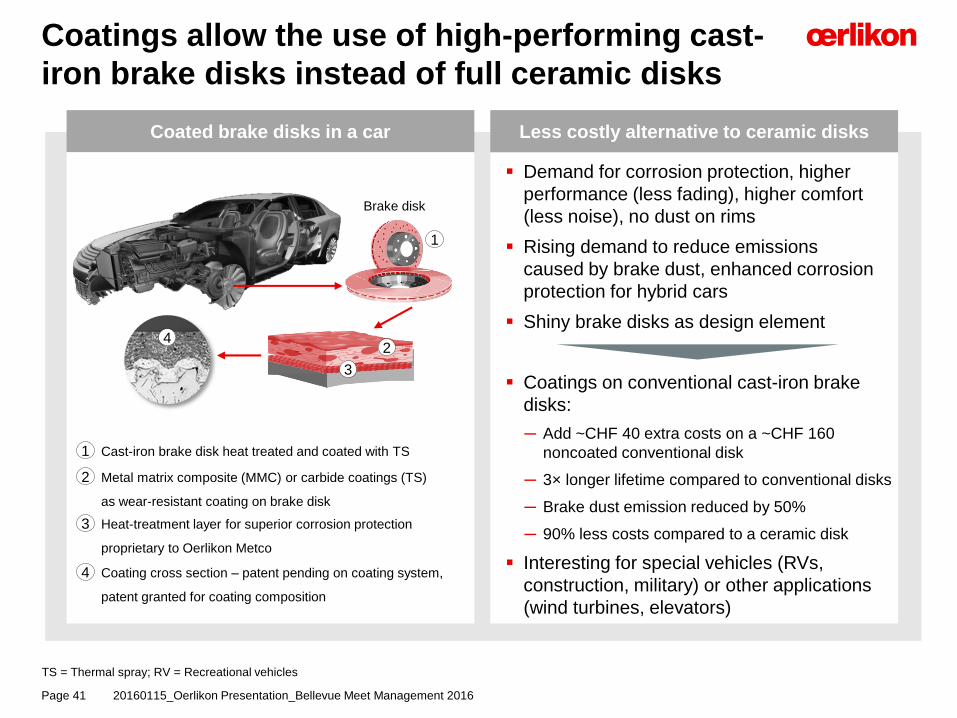
Coatings allow the use of high-performing cast-
iron brake disks instead of full ceramic disks
20160115_Oerlikon Presentation_Bellevue Meet Management 2016Page 41
Demand for corrosion protection, higher
performance (less fading), higher comfort
(less noise), no dust on rims
Rising demand to reduce emissions
caused by brake dust, enhanced corrosion
protection for hybrid cars
Shiny brake disks as design element
Coatings on conventional cast-iron brake
disks:
─ Add ~CHF 40 extra costs on a ~CHF 160
noncoated conventional disk
─ 3× longer lifetime compared to conventional disks
─ Brake dust emission reduced by 50%
─ 90% less costs compared to a ceramic disk
Interesting for special vehicles (RVs,
construction, military) or other applications
(wind turbines, elevators)
Less costly alternative to ceramic disks Coated brake disks in a car
1 Cast-iron brake disk heat treated and coated with TS
2 Metal matrix composite (MMC) or carbide coatings (TS)
as wear-resistant coating on brake disk
3 Heat-treatment layer for superior corrosion protection
proprietary to Oerlikon Metco
4 Coating cross section – patent pending on coating system,
patent granted for coating composition
2
3
4
Brake disk
1
TS = Thermal spray; RV = Recreational vehicles

It's not allowed to change the master It's not allowed to change the master
8,6
4,7
8,0
9,1
6,6
8,3
0,9
0,5
Version September 2012
Success story Metco integration –
combining leading surface technologies
20160115_Oerlikon Presentation_Bellevue Meet Management 2016Page 42
Status quo
Technology:
Joint development by Balzers application
and Metco process engineers
Low-temperature plasma nitriding
process for austenitic stainless steel
Market rollout:
02.2015 Process development
07.2015 Customer sampling in Germany,
Italy, France and UK
01.2016 Production
Oerlikon’s solution
Customer perspective:
Food industry has special surface
requirements: easy to clean, no abrasion
Efficient processes needed for abrasion
protection of stainless steel parts
Market is looking for an improvement on
existing solution
Oerlikon perspective:
Balzers worked on stainless steel surface
treatments, yet so far had no competitive
solution for the food industry
Metco has know-how in nitriding
Development of solution only possible
due to combined R&D forces

It's not allowed to change the master It's not allowed to change the master
8,6
4,7
8,0
9,1
6,6
8,3
0,9
0,5
Version September 2012
Ac
qu
isit
ion
his
tory
Inve
stm
en
t fo
cu
s
Surface Solutions Segment accounting for majority of capital expenditure within Oerlikon
Capex/depreciation ratio > 1 (excluding amortization of acquired intangible assets)
─ Expansion of capacity in existing coating centers
─ Technology upgrade (combining technologies from Balzers and Metco)
─ Develop new coatings, materials and applications
─ Two to four new coating centers each year
Surface Solutions Segment accounting for the majority of R&D expenditures within
Oerlikon Group
Business constantly expanding since 2011,
major step forward with Metco acquisition
20160115_Oerlikon Presentation_Bellevue Meet Management 2016Page 43
Hartec
(ePD)
Rox
(regrinding)
Metco
(thermal spray
& materials)
2011 2012 2013 2014 2015 …
All recent acquisitions within Oerlikon Group related to the Surface Solutions Segment
Laser Cladding Services

It's not allowed to change the master It's not allowed to change the master
8,6
4,7
8,0
9,1
6,6
8,3
0,9
0,5
Version September 2012
Acquisition of Laser Cladding Services to
service upstream energy and offshore markets
20160115_Oerlikon Presentation_Bellevue Meet Management 2016Page 44
Company background
Industry leader in
protective coatings
Houston, USA
Founded 2001
Protective coating design,
manufacturing and
restoration of new and
used parts mainly in the
energy and oil & gas
sectors
Service offering:
─ Laser cladding
─ Thermal spray
─ Laser hardening
─ Precision grinding
Laser cladding technology
Technology:
Laser cladding is a process to apply
metal coatings using a laser as heat
source. The laser melts the base material
and an additive powder to create a
protective coating. Unlike welding, laser
cladding provides a strong metallurgical
bond with minimal dilution of the base
material, exceptional thickness control
and a small heat-affected zone.
Typical applications:
Impellers
Pump shafts
Bearing sleeves
Axle housings
Nozzles
Expanding laser cladding activities
and complementary to thermal
spray offering of Oerlikon Metco
It's not allowed to change the master It's not allowed to change the master
8,6
4,7
8,0
9,1
6,6
8,3
0,9
0,5
Version September 2012
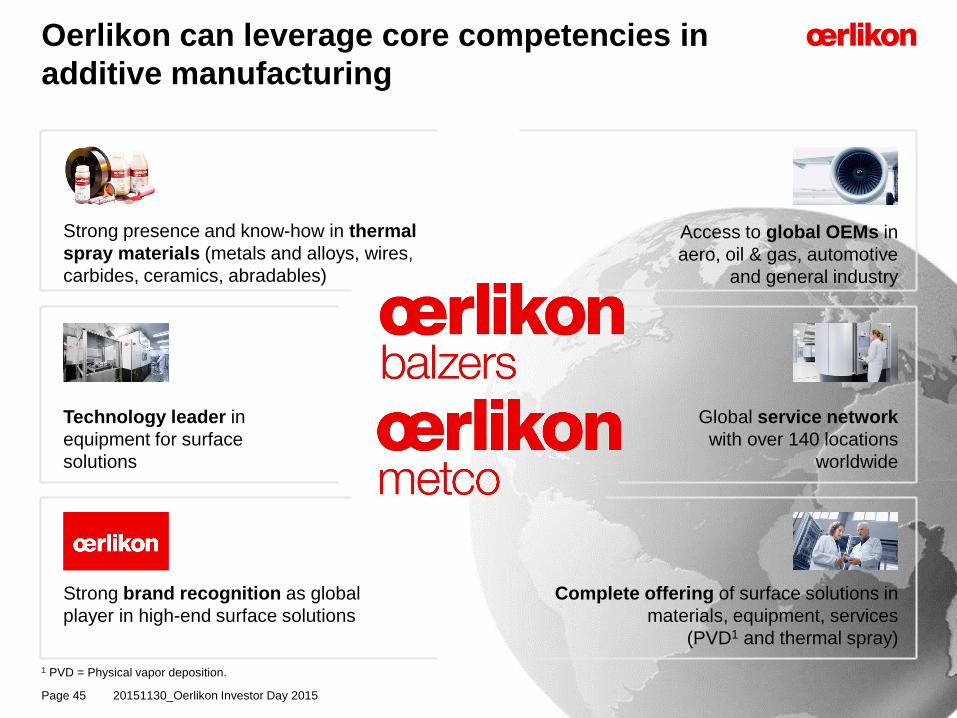
Technology leader in
equipment for surface
solutions
Strong brand recognition as global
player in high-end surface solutions
Access to global OEMs in
aero, oil & gas, automotive
and general industry
Strong presence and know-how in thermal
spray materials (metals and alloys, wires,
carbides, ceramics, abradables)
Global service network
with over 140 locations
worldwide
Complete offering of surface solutions in
materials, equipment, services
(PVD1 and thermal spray)
Oerlikon can leverage core competencies in
additive manufacturing
20151130_Oerlikon Investor Day 2015Page 45
1 PVD = Physical vapor deposition.
It's not allowed to change the master It's not allowed to change the master
8,6
4,7
8,0
9,1
6,6
8,3
0,9
0,5
Version September 2012
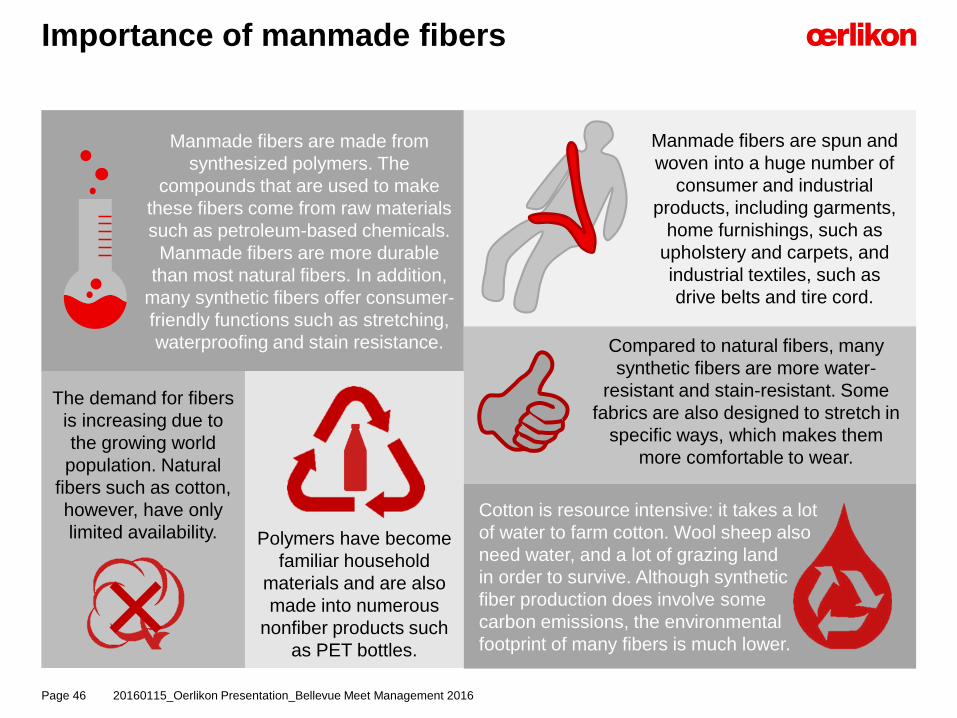
Manmade fibers are made from
synthesized polymers. The
compounds that are used to make
these fibers come from raw materials
such as petroleum-based chemicals.
Manmade fibers are more durable
than most natural fibers. In addition,
many synthetic fibers offer consumer-
friendly functions such as stretching,
waterproofing and stain resistance.
Importance of manmade fibers
20160115_Oerlikon Presentation_Bellevue Meet Management 2016
The demand for fibers
is increasing due to
the growing world
population. Natural
fibers such as cotton,
however, have only
limited availability. Polymers have become
familiar household
materials and are also
made into numerous
nonfiber products such
as PET bottles.
Manmade fibers are spun and
woven into a huge number of
consumer and industrial
products, including garments,
home furnishings, such as
upholstery and carpets, and
industrial textiles, such as
drive belts and tire cord.
Compared to natural fibers, many
synthetic fibers are more water-
resistant and stain-resistant. Some
fabrics are also designed to stretch in
specific ways, which makes them
more comfortable to wear.
Cotton is resource intensive: it takes a lot
of water to farm cotton. Wool sheep also
need water, and a lot of grazing land
in order to survive. Although synthetic
fiber production does involve some
carbon emissions, the environmental
footprint of many fibers is much lower.×Page 46

It's not allowed to change the master It's not allowed to change the master
8,6
4,7
8,0
9,1
6,6
8,3
0,9
0,5
Version September 2012
Customer example – spinning plant
20160115_Oerlikon Presentation_Bellevue Meet Management 2016Page 47
3 × 200 t/d polycondensation
504 WINGS POY
144 WINGS FDY
648 spinning positions
Polycondensation
Polymer melt
Winder
Daily output: 365 000 bobbins (15 kg each) 1 train with 275 wagons (total length of 4 km)
It's not allowed to change the master It's not allowed to change the master
8,6
4,7
8,0
9,1
6,6
8,3
0,9
0,5
Version September 2012
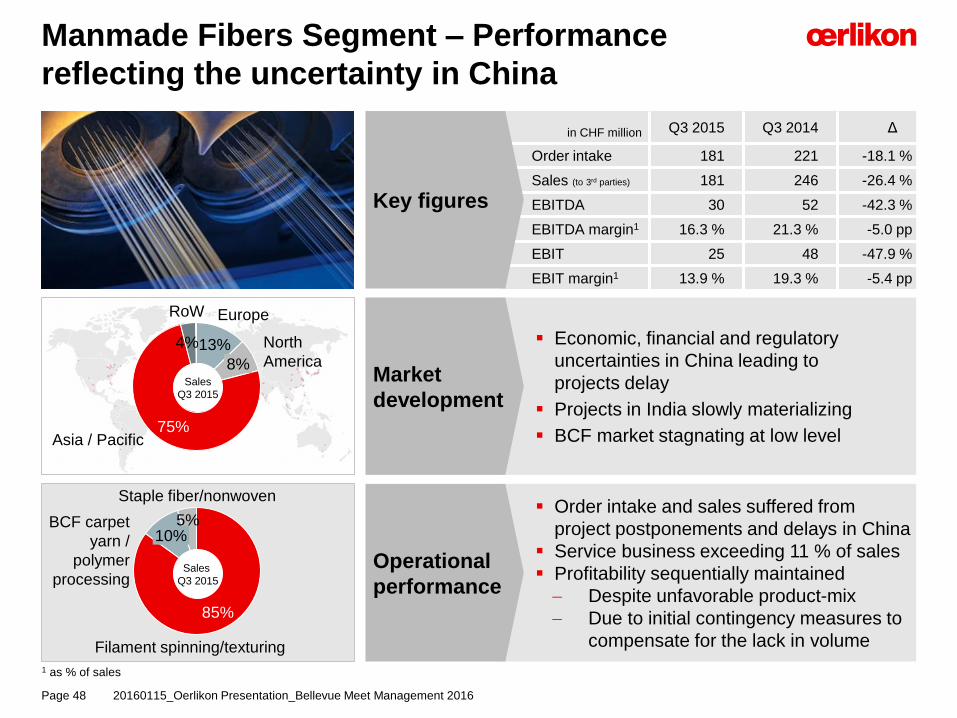
in CHF million Q3 2015 Q3 2014 Δ
Order intake 181 221 -18.1 %
Sales (to 3rd parties) 181 246 -26.4 %
EBITDA 30 52 -42.3 %
EBITDA margin1 16.3 % 21.3 % -5.0 pp
EBIT 25 48 -47.9 %
EBIT margin1 13.9 % 19.3 % -5.4 pp
Manmade Fibers Segment – Performance
reflecting the uncertainty in China
Order intake and sales suffered from
project postponements and delays in China
Service business exceeding 11 % of sales
Profitability sequentially maintained
Despite unfavorable product-mix
Due to initial contingency measures to
compensate for the lack in volume
Operational
performance
Economic, financial and regulatory
uncertainties in China leading to
projects delay
Projects in India slowly materializing
BCF market stagnating at low level
Market
development
North
America8%
Asia / Pacific
EuropeRoW
75%
13%
Staple fiber/nonwoven
85%
10%
Filament spinning/texturing
Key figures
1 as % of sales
4%
20160115_Oerlikon Presentation_Bellevue Meet Management 2016Page 48
Sales
Q3 2015
Sales
Q3 2015
BCF carpet
yarn /
polymer
processing
5%
It's not allowed to change the master It's not allowed to change the master
8,6
4,7
8,0
9,1
6,6
8,3
0,9
0,5
Version September 2012
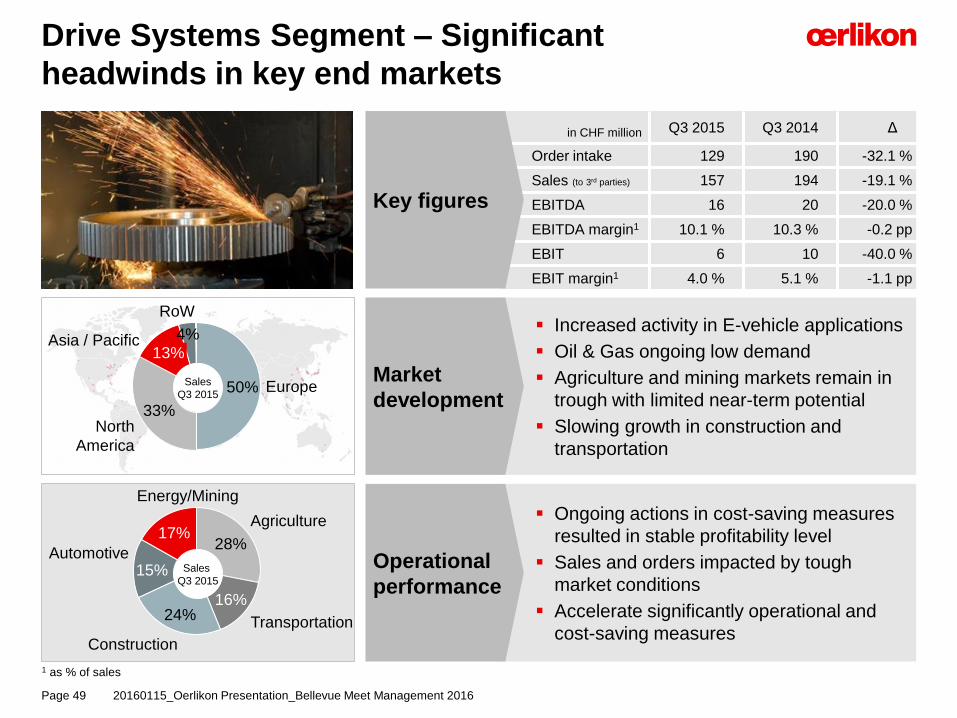
in CHF million Q3 2015 Q3 2014 Δ
Order intake 129 190 -32.1 %
Sales (to 3rd parties) 157 194 -19.1 %
EBITDA 16 20 -20.0 %
EBITDA margin1 10.1 % 10.3 % -0.2 pp
EBIT 6 10 -40.0 %
EBIT margin1 4.0 % 5.1 % -1.1 pp
Drive Systems Segment – Significant
headwinds in key end markets
RoW
Asia / Pacific13%
North
America
33%
Europe50%
Energy/Mining
17%
Automotive15%
Construction
24% Transportation
16%
Agriculture
28%
1 as % of sales
Ongoing actions in cost-saving measures
resulted in stable profitability level
Sales and orders impacted by tough
market conditions
Accelerate significantly operational and
cost-saving measures
Operational
performance
Increased activity in E-vehicle applications
Oil & Gas ongoing low demand
Agriculture and mining markets remain in
trough with limited near-term potential
Slowing growth in construction and
transportation
Market
development
Key figures
4%
20160115_Oerlikon Presentation_Bellevue Meet Management 2016Page 49
Sales
Q3 2015
Sales
Q3 2015

It's not allowed to change the master It's not allowed to change the master
8,6
4,7
8,0
9,1
6,6
8,3
0,9
0,5
Version September 2012
Core competencies
Under the brand
Oerlikon Fairfield, the
Segment is a leading
manufacturer of
engineered drive
products for OEMs
It is successfully
applying them in off-
highway equipment
as planetary drives
Increasing range of applications –
planetary drives for spray tractors
20160115_Oerlikon Presentation_Bellevue Meet Management 2016Page 50
Increase range of applications
In the field of spray tractors, OEMs are constantly evolving
these machines to make them more productive
Oerlikon Fairfield developed a new planetary drive with a
hydraulic or electric motor for self-propelled spray tractors
and compact construction vehicles
The new series offers a patented internal service brake
that improves safety and performance by eliminating the
potential for chemical corrosion present with external
braking mechanisms

It's not allowed to change the master It's not allowed to change the master
8,6
4,7
8,0
9,1
6,6
8,3
0,9
0,5
Version September 2012
Increasing range of applications –
bevel gear set for commercial vehicles
20160115_Oerlikon Presentation_Bellevue Meet Management 2016Page 51
Core competencies
Under the brand Oerlikon Graziano,
the Segment is a leading
manufacturer of bevel gear sets
Bevel gear sets are one of the
most demanding gear
configurations
Oerlikon Graziano is successfully
applying them in agriculture and
automotive applications as
differentials and power transfer
units
Increase range of applications
Oerlikon Graziano successfully expanded the
core technology into new markets and
applications, such as differentials for commercial
vehicles, all-terrain vehicles (ATV) and electric
cars
Oerlikon Graziano is also introducing
electronically controlled limited slip differentials
to the performance car market

It's not allowed to change the master It's not allowed to change the master
8,6
4,7
8,0
9,1
6,6
8,3
0,9
0,5
Version September 2012
2015 top-line targets aligned to new market
realities while profitability target confirmed
Order intake
EBITDA
Sales
2015E2014
At prior-year level
3 215
2015 Group Guidance
Oerlikon expects, compared to
2014 reported figures (continuing
operations) and based on constant
exchange rates:
Order intake to grow by low single-
digit
Sales to be at prior-year level
EBITDA1 margin to be at prior-
year level
Based on January exchange
rates, a translation effect of
11-12 % is estimated
1 Including full absorption of all related one-time integration and accounting effects from Metco transaction
525
2014 2015E
At constant
exchange rates
2015E
3 028
2014
Low single-digit growth
At constant
exchange rates
Margin around
prior-year level 16.3%
20160115_Oerlikon Presentation_Bellevue Meet Management 2016Page 52
It's not allowed to change the master It's not allowed to change the master
8,6
4,7
8,0
9,1
6,6
8,3
0,9
0,5
Version September 2012
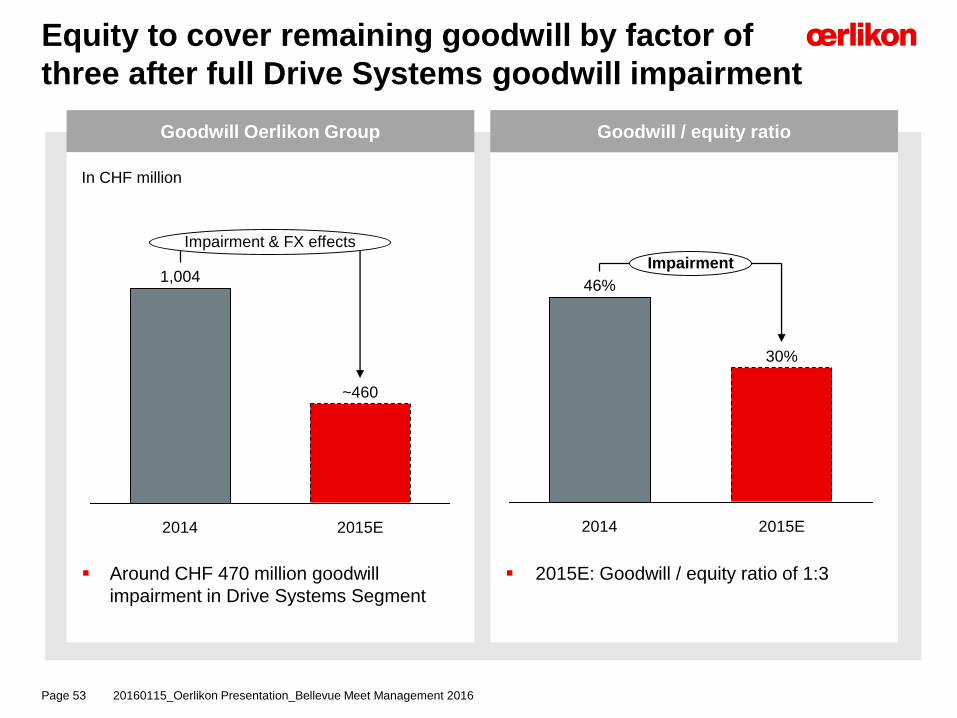
2015E: Goodwill / equity ratio of 1:3
Goodwill / equity ratioGoodwill Oerlikon Group
In CHF million
Around CHF 470 million goodwill
impairment in Drive Systems Segment
Equity to cover remaining goodwill by factor of
three after full Drive Systems goodwill impairment
20160115_Oerlikon Presentation_Bellevue Meet Management 2016Page 53
2014
1,004
2015E
Impairment & FX effects
~460
2014
Impairment
2015E
46%
30%

It's not allowed to change the master It's not allowed to change the master
8,6
4,7
8,0
9,1
6,6
8,3
0,9
0,5
Version September 2012
Sales 3rd 2015 (e) COGS 2015 (e)
Balanced FX profile across the Group –
Limited Swiss franc exposure
4%11%
20%
11%
54%
RMB OtherEUR USDCHF
20160115_Oerlikon Presentation_Bellevue Meet Management 2016Page 54
No major currency mismatch – natural hedge in place
Limited transaction risk
Translation effects from reporting currency CHF
25%
13%
48%
12%
2%
≈

It's not allowed to change the master It's not allowed to change the master
8,6
4,7
8,0
9,1
6,6
8,3
0,9
0,5
Version September 2012
R&D and CapEx on Segment level1
CapEx / Depr. & Amort. H1 2015
CapEx H1 2015
Depreciation & Amortization H1 2015
R&D expenses H1 2015
20160115_Oerlikon Presentation_Bellevue Meet Management 2016Page 55
Vacuum
(7 %)
19%
9%Drive Systems
(2 %)
Manmade Fibers (3 %)
55%
17%
Surface
Solutions (6 %)
9%
Drive Systems22%
Manmade Fibers
61%
Vacuum
8%
Surface
Solutions
CHF
65m
CHF
91m
Drive Systems
58% Surface
Solutions13%
Vacuum
8%
21%
Manmade Fibers
CHF
71m
0.75
VacuumManmade
Fibers
Surface
Solutions
1.01
Drive
Systems
1.13
0.86
Group (0.95)
1 H1 2015 continuing operations; 2 Amortization adjusted for amortization of acquired intangible (CHF 14.6 million)
(% of Segment sales)
2

It's not allowed to change the master It's not allowed to change the master
8,6
4,7
8,0
9,1
6,6
8,3
0,9
0,5
Version September 2012
Asset allocation and employees
on Segment level
Employees (FTE) by Region H1 2015
Net operating Assets H1 2015
Employees (FTE) by Segment H1 2015
Operating assets H1 2015
20160115_Oerlikon Presentation_Bellevue Meet Management 2016Page 56
Vacuum
7%
Drive Systems 30%
Manmade Fibers
16%
Surface
Solutions47%
Vacuum
7%
Drive Systems 34%
Manmade Fibers
7%
Surface
Solutions52%
CHF
3 439m
Corporate
1%
Vacuum
11%
Drive Systems 33%
Manmade Fibers
16%
Surface
Solutions39%
CHF
2 561m
RoW
2%
33%Asia / Pacific
North America
13%
Europe52%15 62915 629
It's not allowed to change the master It's not allowed to change the master
8,6
4,7
8,0
9,1
6,6
8,3
0,9
0,5
Version September 2012
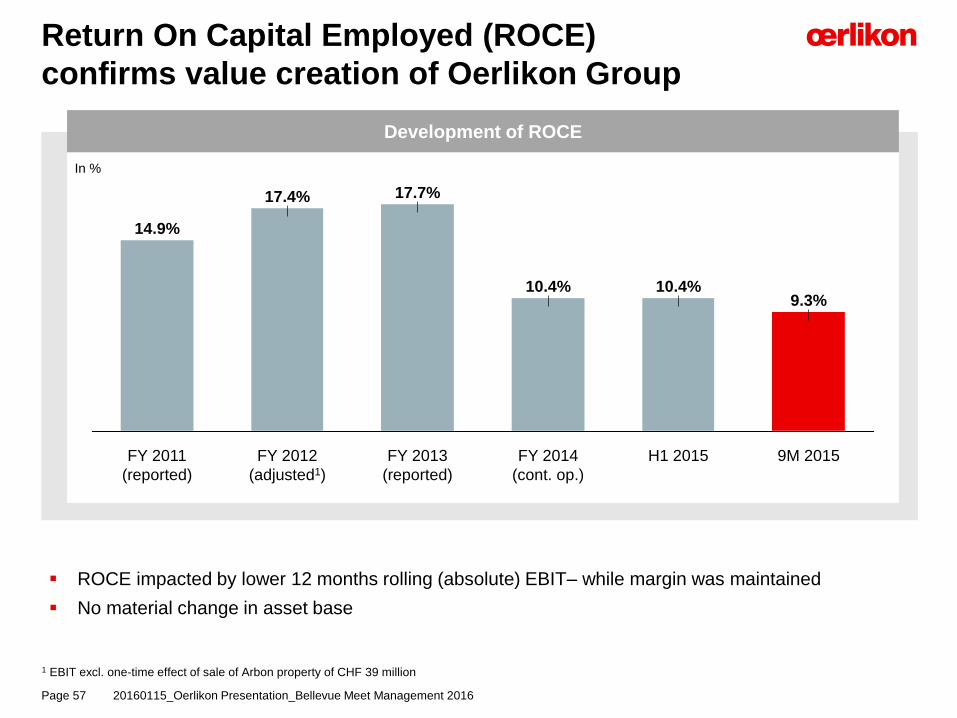
In %
Development of ROCE
Return On Capital Employed (ROCE)
confirms value creation of Oerlikon Group
FY 2012
(adjusted1)
17.7%
FY 2011
(reported)
14.9%
FY 2013
(reported)
H1 2015
10.4%
FY 2014
(cont. op.)
10.4%
17.4%
9.3%
9M 2015
20160115_Oerlikon Presentation_Bellevue Meet Management 2016Page 57
ROCE impacted by lower 12 months rolling (absolute) EBIT– while margin was maintained
No material change in asset base
1 EBIT excl. one-time effect of sale of Arbon property of CHF 39 million

It's not allowed to change the master It's not allowed to change the master
8,6
4,7
8,0
9,1
6,6
8,3
0,9
0,5
Version September 2012
as of December 31, 2015, indexed; 100 percent = closing price per December 30, 2014
Oerlikon share price development
as of December 31, 2015
Oerlikon shareholder structure1
Oerlikon shares
57.0%Free float
(incl. 0.1 %
treasury shares)
43.0%
Renova Group
1 Based on 339 758 576 shares outstanding and latest notification by Renova (as of December 15, 2015 of 146 222 889 shares)
Listed on Swiss Exchange (SIX) since 1973
Securities symbol: OERL
Securities number 81 682
ISIN: CH0000816824
No. of shares outstanding: 339 758 576 shares
(as of Sept. 30, 2015)
Re-entry to Swiss SMIM on April 17, 2012
Addition to STOXX Europe 600 as of June 18, 2012
Oerlikon shares
20160115_Oerlikon Presentation_Bellevue Meet Management 2016Page 58
60,0
80,0
100,0
120,0
140,0Oerlikon SMI SMIM STOXX Europe 600 STOXX Europe 600 Industrial

It's not allowed to change the master It's not allowed to change the master
8,6
4,7
8,0
9,1
6,6
8,3
0,9
0,5
Version September 2012
Coverage –
9 Buy/Accumulate & 5 Hold/Neutral
20160115_Oerlikon Presentation_Bellevue Meet Management 2016Page 59
Broker Analyst Recommendation Date of last
update
Target
price
AlphaValue Pierre-Yves Gauthier Buy 10.12.2015 12.00
Baader Helvea Reto Amstalden Buy 02.12.2015 12.50
Bank am Bellevue Alessandro Foletti Hold 04.12.2015 9.80
Berenberg Bank Sebastian Künne Hold 07.12.2015 9.20
Credit Suisse Patrick Laager Outperform 04.12.2015 11.00
Jefferies Graham Phillips Buy 28.10.2015 12.00
Kepler Cheuvreux Hans-Joachim Heimbürger Hold 01.12.2015 9.00
Mainfirst Michael Inauen Outperform 01.12.2015 11.50
Mirabaud Securities LLP Thomas Baumann Buy 01.12.2015 12.25
RBC Capital Markets Wasi Rizvi Outperform 01.12.2015 11.50
Société Générale Christophe Quarante Hold 10.12.2015 10.00
UBS André Rudolf von Rohr Buy 18.12.2015 10.50
Vontobel Michael Foeth Buy 03.12.2015 12.00
Zürcher Kantonalbank Armin Rechberger Marketweight 02.12.2015 -
Consensus 9 positive
5 neutral
11.02
It's not allowed to change the master It's not allowed to change the master
8,6
4,7
8,0
9,1
6,6
8,3
0,9
0,5
Version September 2012
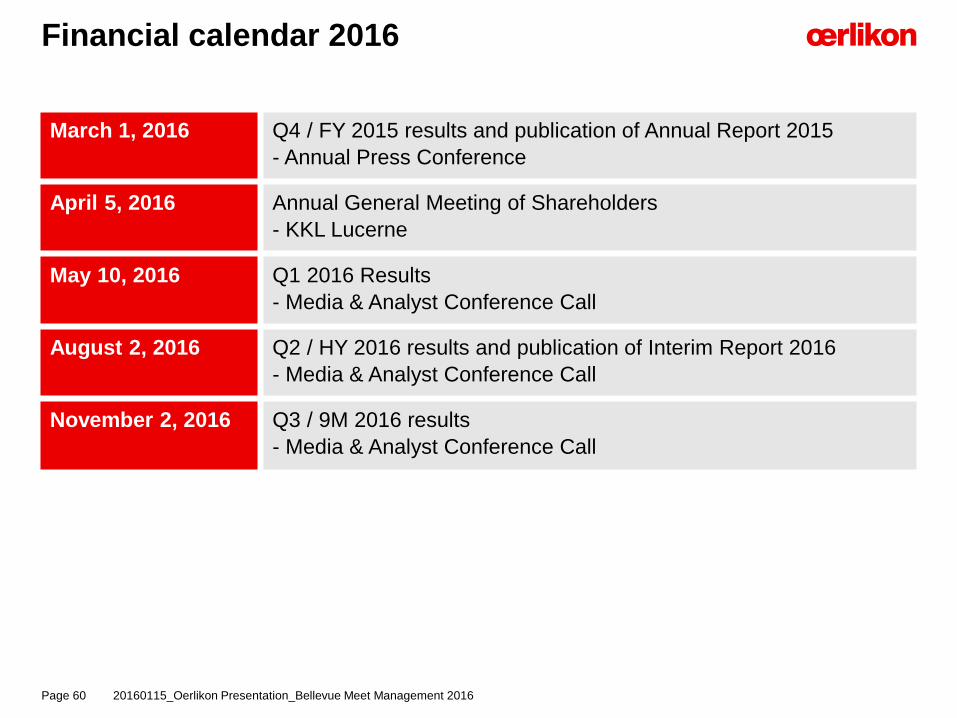
Financial calendar 2016
20160115_Oerlikon Presentation_Bellevue Meet Management 2016Page 60
March 1, 2016 Q4 / FY 2015 results and publication of Annual Report 2015
- Annual Press Conference
April 5, 2016 Annual General Meeting of Shareholders
- KKL Lucerne
May 10, 2016 Q1 2016 Results
- Media & Analyst Conference Call
August 2, 2016 Q2 / HY 2016 results and publication of Interim Report 2016
- Media & Analyst Conference Call
November 2, 2016 Q3 / 9M 2016 results
- Media & Analyst Conference Call

It's not allowed to change the master It's not allowed to change the master
8,6
4,7
8,0
9,1
6,6
8,3
0,9
0,5
Version September 2012
Investor Relations contact
20160115_Oerlikon Presentation_Bellevue Meet Management 2016Page 61
OC Oerlikon Management AG, Pfäffikon
Churerstrasse 120
CH – 8808 Pfäffikon SZ
Switzerland
Andreas Schwarzwälder
Head of Investor Relations
Phone: +41-58-360-9622
Mobile: +41-79-810-8211
E-mail: [email protected]

It's not allowed to change the master It's not allowed to change the master
8,6
4,7
8,0
9,1
6,6
8,3
0,9
0,5
Version September 2012
OC Oerlikon Corporation AG, Pfäffikon, (together with its affiliates hereinafter referred to as “Oerlikon”) hasmade great efforts to include accurate and up-to-date information in this document. However, Oerlikonmakes no representation or warranties, expressed or implied, as to the truth, accuracy or completeness ofthe information provided in this document, Neither Oerlikon nor any of its directors, officers, employees oradvisors, nor any other person connected or otherwise associated with Oerlikon, shall have any liabilitywhatsoever for loss howsoever arising, directly or indirectly, from any use of this document.
The contents of this document, including all statements made therein, is based on estimates, assumptionsand other information currently available to the management of Oerlikon. This document contains certainstatements related to the future business and financial performance or future events involving Oerlikonthat may constitute forward-looking statements. The forward-looking statements contained herein could besubstantially impacted by risks, influences and other factors, many of which are not foreseeable at presentand/or are beyond Oerlikon’s control, so that the actual results, including Oerlikon’s financial results andoperational results, may vary materially from and differ than those, expressly or implicitly, provided in theforward-looking statements, be they anticipated, expected or projected. Oerlikon does not give anyassurance, representation or warranty, expressed or implied, that such forward-looking statements will berealized. Oerlikon is under no obligation to, and explicitly disclaims any obligation to, update or otherwisereview its forward-looking statements, whether as a result of new information, future events or otherwise.
This document, including any and all information contained therein, is not intended as, and may not beconstrued as, an offer or solicitation by Oerlikon for the purchase or disposal of, trading or any transactionin any Oerlikon securities. Investors must not rely on this information for investment decisions and aresolely responsible for forming their own investment decisions.
Disclaimer
20160115_Oerlikon Presentation_Bellevue Meet Management 2016Page 62