creating an a3 architecture overview; a case study in
TRANSCRIPT

25th
Annual INCOSE International Symposium (IS2015)
Seattle, WA, July 13 – July 16, 2015
Creating an A3 Architecture Overview; a Case Study in SubSea Systems
Gerrit Muller
HBV-NISE
Kongsberg
Norway
Damien Wee
FMC Technologies
Martin Moberg
Aker Solutions
Copyright © 2015 by Gerrit Muller, Damien Wee, and Martin Moberg. Permission granted to INCOSE to publish and use.
Abstract. The subsea oil and gas domain suffers from complex and partially
incomplete information flows. As consequence, most employees in the involved
organizations lack overview of the systems and operations. Using conceptual
modeling and A3 architecture overviews, we have reconstructed the overview for the
workover system and its operation. The result triggers interest from the suppliers in
the oil and gas domain.
Introduction
The subsea oil and gas domain. Large oil and gas companies, such as Shell and
Statoil rely on a broad network of specialist companies for the development and
installation of subsea and topside equipment. The typical business model is that oil
and gas companies send an invitation to for tender (ITT). Suppliers respond to the ITT
with a quotation. When the oil and gas companies award the contract, suppliers start
an execution project to develop, engineer, and install the agreed systems. Figure 1
shows an artistic impression of a subsea production system.
Figure 1. Artistic impression of a subsea production system, by FMC Technologies
The information flow. Many suppliers in the oil and gas domain struggle with the
incoming information, which is a combination of customer specific requirements,
regulations, and multiple standards. The incoming information is typically a mix of
system requirements, design constraints, and predefined solutions. An additional
problem is that most inputs violate fundamental requirements management rules, such
as requirements must be specific, non-ambiguous, testable, and describe what, rather
than how. Finally, the operational needs tend to be missing in the input
documentation. Sometimes, the customers do not yet known them during the tender
phase, sometimes they consider the needs to be confidential. Tranøy (Tranøy 2014)
describes the significant negative consequences of missing operational needs.
A3 architecture overviews. Borches (Borches 2010, 2011) proposes the use of A3s,
named after the paper size, to document architecture overviews. The main idea behind
A3s is that the format is large enough to support multiple views. At the same time, the
limitation in size forces the creators to focus on essential information. Borches
provides a cookbook in his PhD thesis (Borches 2011); the cookbook is available as
pdf at http://www.gaudisite.nl/BorchesCookbookA3architectureOverview.pdf.
Borches ideas have inspired Polanscak, Kruse, and Frøvold1 (unpublished), and
Wiulsrød (Wiulsrød 2012), Kooistra (Kooistra 2012) Singh (Singh 2013), and Nilsen
(Nilsen 2014) to apply and evaluate A3s in industrial practice.
Conceptual Modeling. Borches (Borches 2011) proposes a number of elements as
standard content on A3s: physical models, functional models (dynamics), and
quantification. These elements coincide with the conceptual modeling approach in the
SEMA course2 at HBV, Kongsberg, Norway. This course has triggered related
research, see (Muller 2009), (Engebakken 2010), (Rypdal 2012), and (Stalsberg
2014).
Case. A homework project in the SEMA 2013 course modeled the workover
operation for subsea systems. The participants of this coursework worked in their
companies on part of the workover system, for instance the riser system, Lower
Workover Riser Package (LWRP), or the Workover Control System (WOCS). Oil
companies use a workover system to start production or to perform maintenance on
the well. In the first few days of the course, the participants identified the installation
time of the workover system as key performance parameter. The installation time
contributes significantly to the cost of workover operations.
A3 Architecture Overview of Workover Operations. The results of the homework
were a good illustration of conceptual modeling to an industry that uses either
extensive text based documents, or detailed schematics and CAD drawings. We
transformed the homework result in an example for the course. Finally, we
transformed the course material in an A3, combining the A3 architecture overview
research with conceptual modeling research.
Industrial Context and Needs
The subsea oil and gas domain is big business. For example, suppliers Aker Solutions
(AkSo) and FMC Technologies (FTI) had a turnover of between 40 and 50 Billion
NoK (between 6 and 7.5 Billion US dollar) in 2012. The supply chain for oil and gas
companies is a complex ecosystem. Consequence of the financial magnitude and the
1 Presented at KSEE 2011, see http://ksee.no/wp-content/uploads/2011/09/KSEE-2011-Kristian-Frovold-v3.pdf
2 Course description at http://www.gaudisite.nl/SEMA.html, course material at
http://www.gaudisite.nl/SEMAallSlides.pdf
amount of parties is that all players have large interests, while the organization and the
flow of information are complex.
Key drivers in this domain are:
Cost of oil and gas production (to ensure that production of subsea oil is
profitable)
Health, Safety, and Environment (HSE)
Robustness and reliability in harsh oceanic conditions
In this research, we take the perspective of suppliers like Aker Solutions and FMC and
study their needs in terms of knowledge management. Both companies supply subsea
equipment and related services. We use one specific operation in the life cycle of a
field as case, a workover operation, and the related Workover system (WOS).
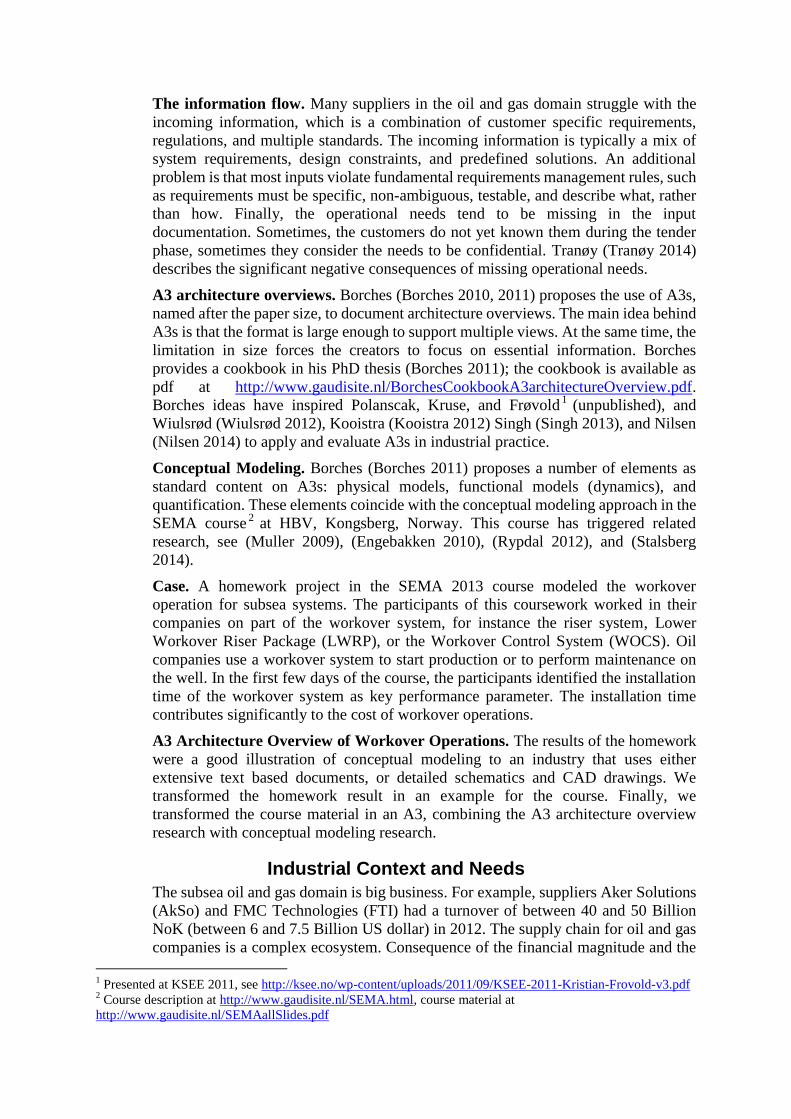
Figure 2. Typical project execution process.
These suppliers use a project execution model such as shown in Figure 2. The oil and
gas companies send out an invitation to tender. The suppliers submit the tender within
a due date, which can be between a few days and a number of months. The execution
phase can take years.
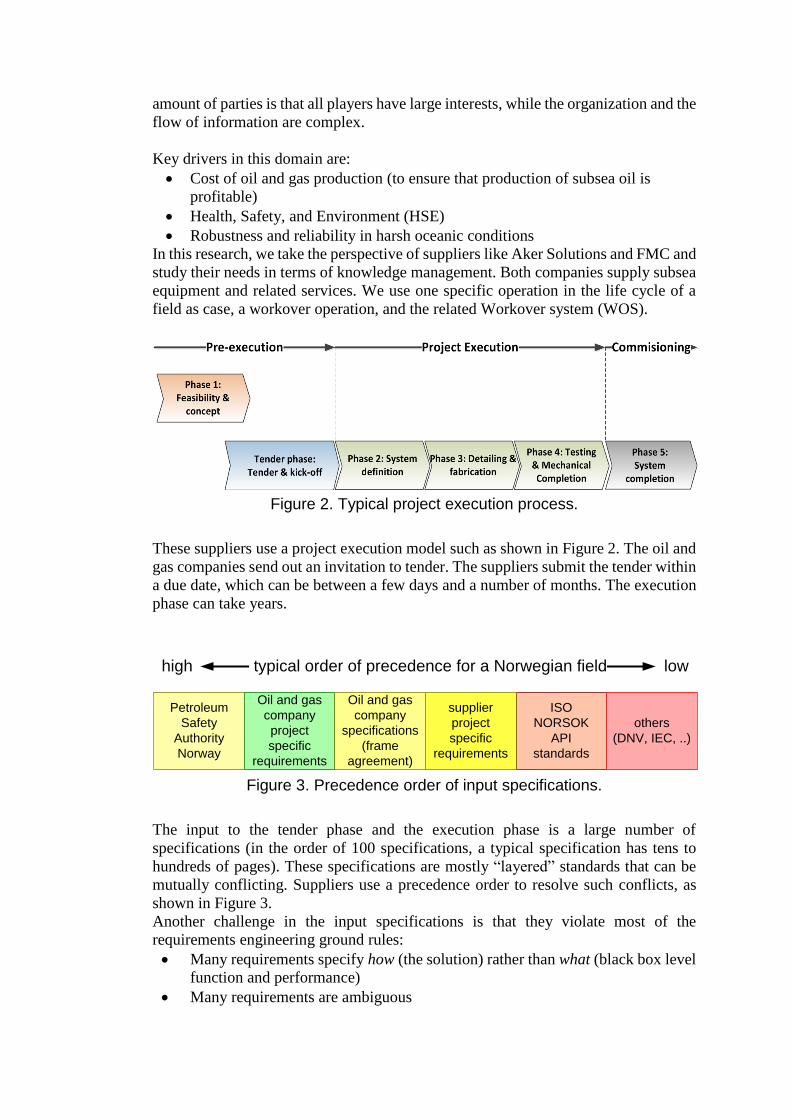
typical order of precedence for a Norwegian field high low
Petroleum
Safety
Authority
Norway
Oil and gas
company
project
specific
requirements
Oil and gas
company
specifications
(frame
agreement)
ISO
NORSOK
API
standards
others
(DNV, IEC, ..)
supplier
project
specific
requirements
Figure 3. Precedence order of input specifications.
The input to the tender phase and the execution phase is a large number of
specifications (in the order of 100 specifications, a typical specification has tens to
hundreds of pages). These specifications are mostly “layered” standards that can be
mutually conflicting. Suppliers use a precedence order to resolve such conflicts, as
shown in Figure 3.
Another challenge in the input specifications is that they violate most of the
requirements engineering ground rules:
Many requirements specify how (the solution) rather than what (black box level
function and performance)
Many requirements are ambiguous
Many requirements are not quantified and verifiable
Finally, oil and gas companies lack some relevant knowledge at the time of tendering,
resulting in variation orders during project execution. These variation orders are
costly, may cause delays, and changes may propagate to other parts of the system.
The suppliers have a strong project drive. This is a logical consequence of the tender
model and the large economic impact of project success. At the same time, the
suppliers try to create reusable assets, products, to increase efficiency. Creation of
such product portfolio is strategic, a long-term objective. Projects have a short-term
focus.
Current Knowledge Management
Suppliers have large amounts of documentation stored in project, product, and
discipline oriented repositories. The dominating forms of documentation are
text-based documents, spreadsheets, and schematics. The schematics are typically
CAD related, for example 2D (piping and instrumentation diagrams), or 3D.
The documentation works well at detail level, although stakeholders frequently
express the need for more interface management and improved traceability. However,
this form of documentation lacks a few essential elements:
Dynamic behavior is lacking (how do components interact, how do they behave
in various circumstances, such as installation, testing, and start-up)
Explicit definition of key performance parameters, and how the system achieves
key performance parameters is lacking (examples are capacity, pressure and
temperature capabilities, sealing of hydrocarbons, installation time)
The overview (how do all parts fit together and how will they fit stakeholder
needs) is missing
The overview of the documentation is missing. As consequence, there is an
excessive amount of documentation with its related support and maintenance
effort.
Customer and operational needs are missing (the rationale behind most
requirements)
A3 Architecture Overviews and Conceptual Modeling
header
dynamic
behavior
(functional
model)
physical view
visual aids
key performance parameters
decisions and considerations
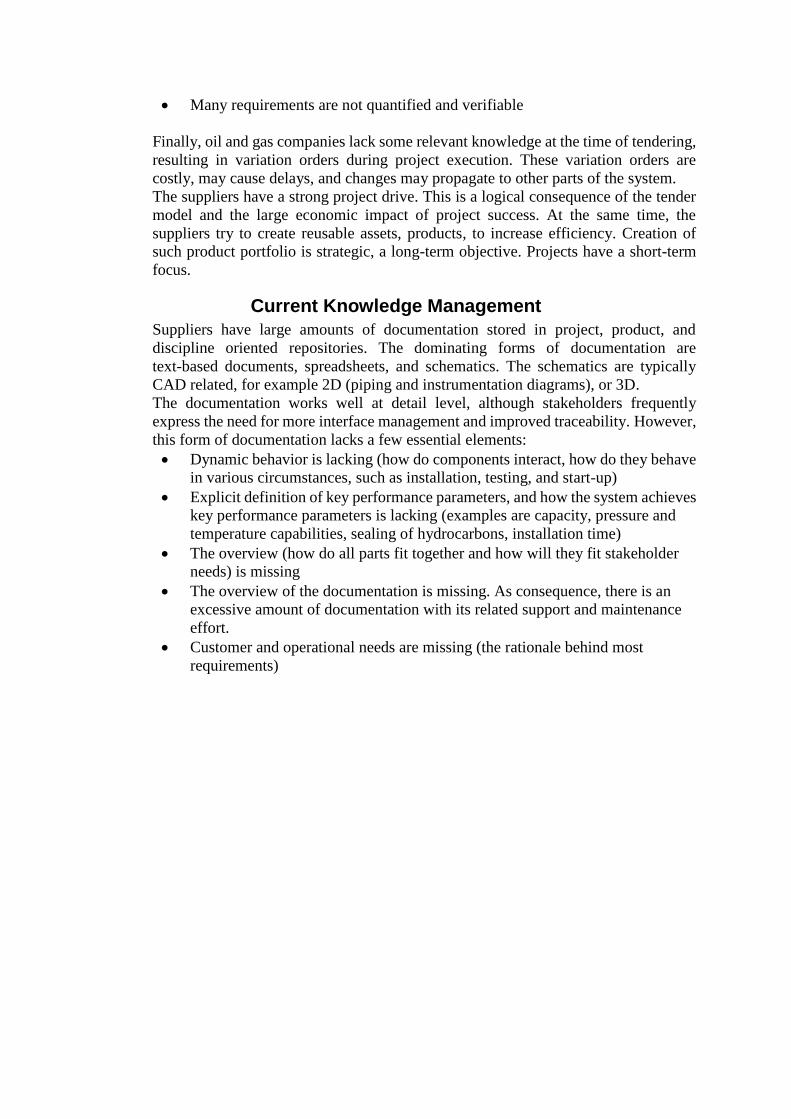
Figure 4. Example A3AO layout
Borches (Borches 2011) proposes to combine at least the following views on an A3
Architecture Overview (A3AO): Physical view, dynamic behavior (functional
model), visual aids, and quantified key performance parameters. He also suggests
mentioning key decisions and considerations, and relations between all views and
elements. Figure 4 shows an example layout for an A3AO.
In conceptual modeling, we use the same views as basis for further modeling. Based
on physical model, dynamic behavior, and key performance parameters, we can select
topics that deserve further modeling. For example, a mathematical formula that
captures how the system achieves key performance using this dynamic behavior and
this physical model.
Through our research of A3AO, we have seen that one of the main challenges in
making effective A3s is the ability to visualize effectively. Visualization and the
human factors of the readers is a research files on its own. Koning (Koning 2008)
provides several guidelines for visualization. An example is the use of block sizes to
convey information, or, when the size of a bock does not have semantics, the
recommendation to keep all blocks the same size. The rationale is that readers may
interpret the block size with unintended meaning, such as importance or weight.

objectives
principles recommendations
Time-box
Iterate
Multi-view
Measure and validate
Quantify early
Visualize
System and its context
Analysis of accuracy and
credibility
(Simple) mathematical models
Multiple levels of abstraction
use feedback
work incremental
work evolutionary
support communication
facilitate reasoning
support decision making
be explicit
make issues tangible
create
maintain
understanding
insight
overview
translate into
translate into
help to
achieve
Figure 5, Conceptual modeling principles, objectives, and recommendations
Figure 5 shows the principles, objectives, and recommendations for conceptual
modeling. Objectives of conceptual modeling are to support communication, facilitate
reasoning, support decision-making, and to create and maintain understanding,
insight, and overview. Principles to achieve these objectives are to use feedback, and
to make issues tangible by making them explicit.
An essential recommendation for conceptual modeling is to use multiple levels of
abstraction. Similarly, we observe that people making A3s tend to discover that they
need multiple levels of A3s at various abstraction levels. Figure 6 shows how A3s
map on abstraction levels in the system and abstraction levels in the system context.
The background of Figure 6 consists of two pyramids, where the vertical axis shows
an exponential scale with the number of details. The bottom pyramid is the system
itself; the inverted pyramid on top shows the context of the system. The pyramids
show that both system and context contain billions of details. Conceptual modeling
simplifies that detailed world many orders of magnitude. Figure 6 shows that A3AOs
cover a part of the architecture description:
Top-level A3s connect stakeholder needs to system requirements
Quality A3s focus on a single quality, connecting specific stakeholder needs to
specific solution approaches. An example is installation duration.
Aspect A3s elaborate specific solution aspects. An example is oil and gas
containment design.

Figure 6. Using multiple levels of A3s to capture multiple levels of abstraction
Case study: Workover Operation A3
Participants of the SEMA course in 2013 selected a workover system as case for the
course. Oil and gas companies regularly perform maintenance on the well, for
instance, once or twice per year. For subsea systems a workover system, as shown in
Figure 7 provides access to the subsea well. A platform or vessel transports the
workover system to the well. The crew assembles, positions, and connects the
workover system, so that the operator can go in with workover tooling.
Figure 7 shows the subsystems of the workover system and in italics the function of
each subsystem is briefly stated.
vessel or
platform
rig
well
EDP
LRP
riser
conduit for running
tools to well
XT
TF
SFT
wireline
coil tubing BOP
provides well control
well
head
tension frame connects
riser to rig tension system
surface flow tree
provides well control
emergency disconnect package
provides disconnect functionlower riser package
provides well control functionXmas tree
provides well control
structural and pressure-
containing interface
WOCS work over control system
monitoring and control
of subsea installation
ROV
ROV
remotely operated vehicle
one for observation
one for operation
Figure 7. Physical model of a workover system, annotated with function per part.
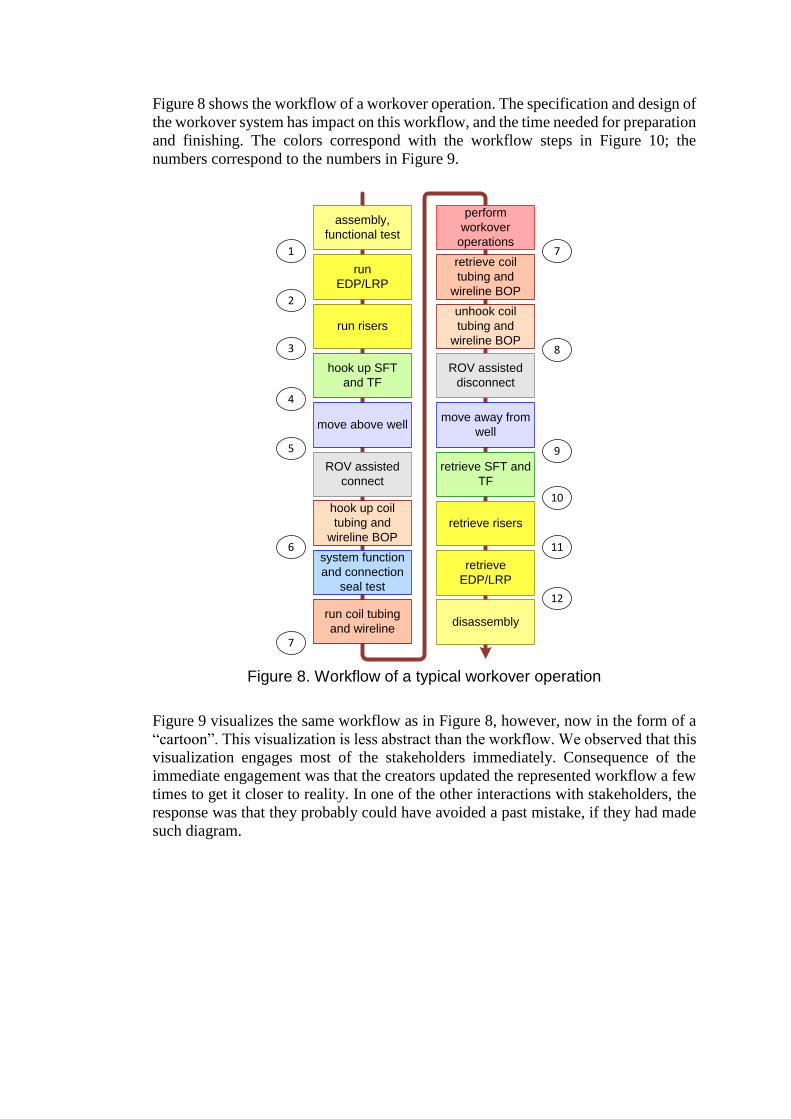
Figure 8 shows the workflow of a workover operation. The specification and design of
the workover system has impact on this workflow, and the time needed for preparation
and finishing. The colors correspond with the workflow steps in Figure 10; the
numbers correspond to the numbers in Figure 9.
assembly,
functional test
run
EDP/LRP
run risers
hook up SFT
and TF
hook up coil
tubing and
wireline BOP
system function
and connection
seal test
run coil tubing
and wireline
retrieve coil
tubing and
wireline BOP
retrieve SFT and
TF
retrieve risers
retrieve
EDP/LRP
perform
workover
operations
move above wellmove away from
well
disassembly
3
2
1
4
5
7
6
unhook coil
tubing and
wireline BOP
12
11
10
9
7
8
ROV assisted
connect
ROV assisted
disconnect
Figure 8. Workflow of a typical workover operation
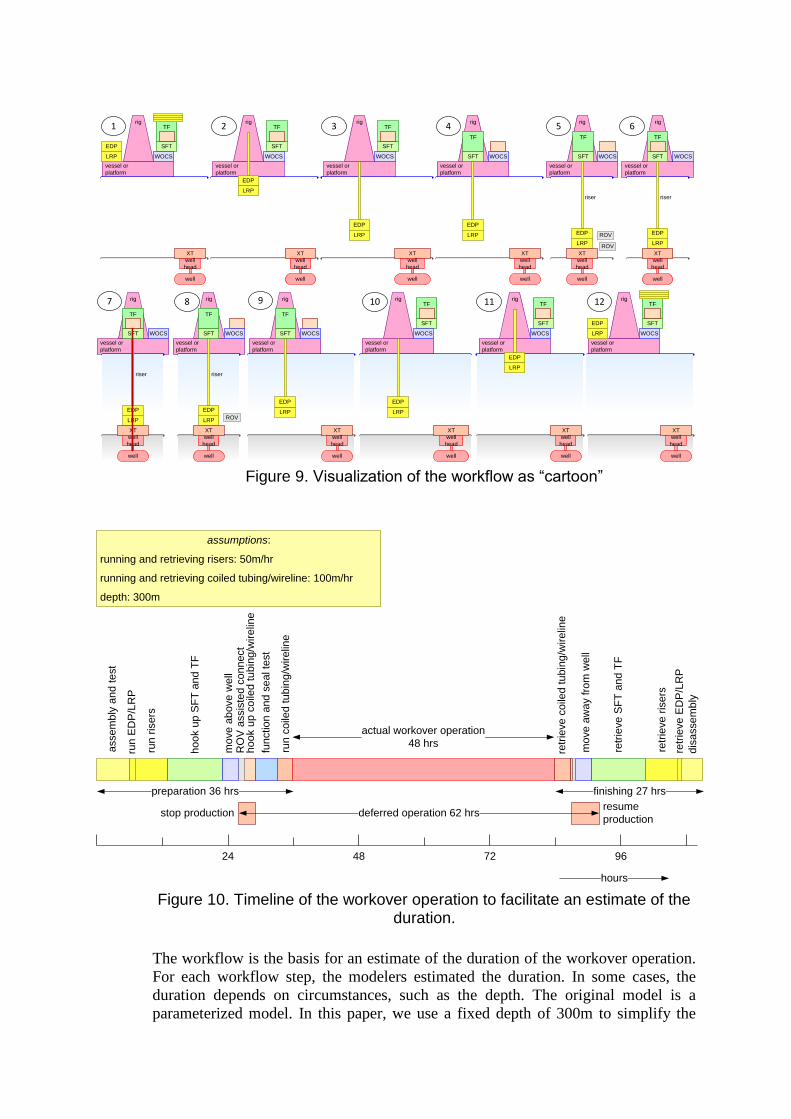
Figure 9 visualizes the same workflow as in Figure 8, however, now in the form of a
“cartoon”. This visualization is less abstract than the workflow. We observed that this
visualization engages most of the stakeholders immediately. Consequence of the
immediate engagement was that the creators updated the represented workflow a few
times to get it closer to reality. In one of the other interactions with stakeholders, the
response was that they probably could have avoided a past mistake, if they had made
such diagram.
vessel or
platform
rig
vessel or
platform
EDP
LRP
riser
XT
well
TF
SFT
well
head
WOCS
rig
vessel or
platform
EDP
LRP
riser
XT
well
TF
SFT
well
head
WOCS
rig
vessel or
platform
EDP
LRP
riser
XT
well
TF
SFT
well
head
WOCS
rig
vessel or
platform
EDP
LRP
TF
SFT
WOCS
XT
well
well
head
rig
vessel or
platform
EDP
LRP
riser
XT
well
TF
SFT
well
head
WOCS
ROV
ROV
rig
vessel or
platform
EDP
LRP
TF
SFT
WOCS
XT
well
well
head
rigTF
SFT
WOCS
XT
well
well
head
EDP
LRP
rig
vessel or
platform
TF
SFT
WOCS
XT
well
well
head
EDP
LRP
vessel or
platform
rigTF
SFT
WOCS
XT
well
well
head
EDP
LRP
vessel or
platform
rig
TF
SFT WOCS
XT
well
well
head
EDP
LRP
ROV
1 2 3 4 5 6
7 8 11 12
vessel or
platform
rig
TF
SFT WOCS
XT
well
well
head
LRP
9
EDP
vessel or
platform
rigTF
SFT
WOCS
XT
well
well
head
LRP
10
EDP
Figure 9. Visualization of the workflow as “cartoon”
run
ED
P/L
RP
ho
ok u
p c
oile
d t
ub
ing/w
ire
line
fun
ction
and s
ea
l te
st
run
coile
d t
ub
ing
/wir
elin
e
asse
mb
ly a
nd
te
st
run
ris
ers
retr
ieve
co
iled
tu
bin
g/w
ire
line
ho
ok u
p S
FT
an
d T
F
retr
ieve
SF
T a
nd T
F
retr
ieve
ris
ers
retr
ieve
ED
P/L
RP
actual workover operation
48 hrs
24 48 72 96
hours
dis
asse
mb
ly
assumptions:
running and retrieving risers: 50m/hr
running and retrieving coiled tubing/wireline: 100m/hr
depth: 300m
preparation 36 hrs finishing 27 hrs
stop productionresume
productiondeferred operation 62 hrs
mo
ve
ab
ove w
ell
mo
ve
aw
ay fro
m w
ell
RO
V a
ssis
ted
co
nn
ect
Figure 10. Timeline of the workover operation to facilitate an estimate of the duration.
The workflow is the basis for an estimate of the duration of the workover operation.
For each workflow step, the modelers estimated the duration. In some cases, the
duration depends on circumstances, such as the depth. The original model is a
parameterized model. In this paper, we use a fixed depth of 300m to simplify the

entire set of models. Figure 9 shows the duration per step on a timeline. Oil companies
need to know how long the workover operation defers the production. Deferred
production translates into an operational loss. Figure 10 shows the duration of
deferred production as well.
We can now estimate the cost by estimating resource costs, and multiplying them with
the duration. Similarly, we can estimate the cost of deferring oil production. Figure 11
shows the cost estimate for a single workover operation.
workover cost per day
platform, rig
equipment
crew
total
assumed cost (MNoK)
2
0.2
0.1
2.3 MNoK/day
deferred operation per day
production delay
ongoing cost operation
total
assumed cost (MNoK)
0.1
0.2
0.3 MNoK/day
workover duration
transportation
preparation
workover
finishing
total
estimated duration (hours)
24
36
48
27
135 (5.6 days)
production loss
6
48
8
62 (2.6 days)
cost = costworkover/day * tworkover + costdeferred op./day * tdeferred op.
~= 2.3 * 5.6 + 0.3 * 2.6 ~= 14 MNoK / workover
Figure 11. Cost model and estimate, using the estimated duration.
The models as we have discussed them so far are highly simplified. They ignore
aspects, such as disruptions. The SEMA course calls such simplest model a zero-order
model. A zero-order model is useful to get a feel for the numbers and the relations. For
example, the duration model shows that preparation and finishing together takes more
time than the actual workover operation.
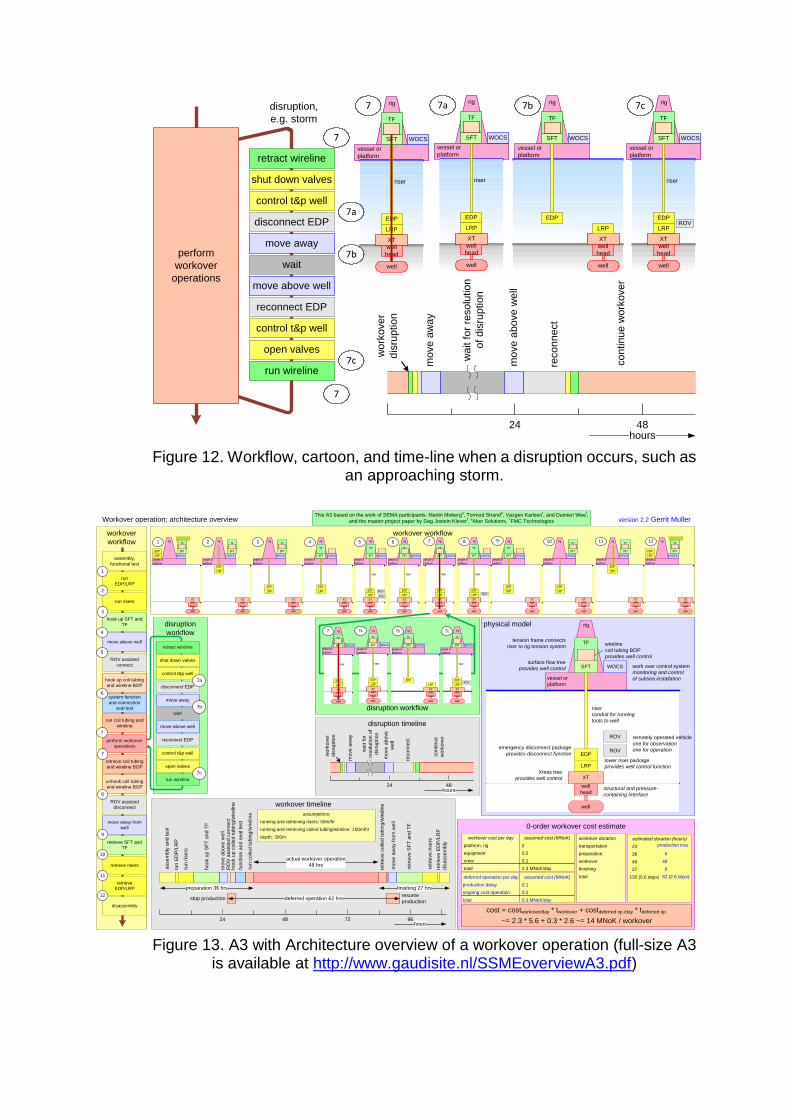
Modelers can expand a zero-order model into a first order model. In workover
operations, the effect of disruptions, for example because of weather conditions, is
significant. A first order model requires an adaptation in the workflow. Figure 12
shows the disruption workflow, the related “cartoon”, and time-line, in case of an
approaching storm.
shut down valves
control t&p well
disconnect EDP
reconnect EDP
perform
workover
operations
wait
run wireline
retract wireline
rig
vessel or
platform
EDP
LRP
riser
XT
well
TF
SFT
well
head
WOCS
ROV
rig
vessel or
platform
WOCS
XT
well
well
head
EDP
LRP
TF
SFT
rig
vessel or
platform
EDP
LRP
riser
XT
well
TF
SFT
well
head
WOCS
wa
it f
or
resolu
tio
n
of
dis
rup
tio
n
mo
ve
aw
ay
wo
rko
ve
r
dis
rup
tio
n
reco
nn
ect
co
ntin
ue
wo
rkover
hours24 48
disruption,
e.g. storm
move above well
move away
open valves
control t&p well
mo
ve
abo
ve
we
ll
rig
vessel or
platform
EDP
LRP
riser
XT
well
TF
SFT
well
head
WOCS
7 7a 7b 7c
7
7a
7b
7c
7
Figure 12. Workflow, cartoon, and time-line when a disruption occurs, such as an approaching storm.
disruption workflow
This A3 based on the work of SEMA participants: Martin Moberga, Tormod Strand
a, Vazgen Karlsen
f, and Damien Wee
f,
and the master project paper by Dag Jostein Kleverf.
aAker Solutions,
f FMC TechnologiesWorkover operation; architecture overview
workover workflowworkover
workflow
disruption
workflow
version 2.2 Gerrit Muller
physical model
vessel or
platform
rig
well
EDP
LRP
riser
conduit for running
tools to well
XT
TF
SFT
wireline
coil tubing BOP
provides well control
well
head
tension frame connects
riser to rig tension system
surface flow tree
provides well control
emergency disconnect package
provides disconnect function
lower riser package
provides well control functionXmas tree
provides well control
structural and pressure-
containing interface
WOCS work over control system
monitoring and control
of subsea installation
ROV
ROV
remotely operated vehicle
one for observation
one for operation
0-order workover cost estimate
workover cost per day
platform, rig
equipment
crew
total
assumed cost (MNoK)
2
0.2
0.1
2.3 MNoK/day
deferred operation per day
production delay
ongoing cost operation
total
assumed cost (MNoK)
0.1
0.2
0.3 MNoK/day
disruption timeline
workover timeline
assembly,
functional test
run
EDP/LRP
run risers
hook up SFT and
TF
hook up coil tubing
and wireline BOP
system function
and connection
seal test
run coil tubing and
wireline
move above well
3
2
1
4
6
ROV assisted
connect
retrieve coil tubing
and wireline BOP
retrieve SFT and
TF
retrieve risers
retrieve
EDP/LRP
perform workover
operations
move away from
well
disassembly
unhook coil tubing
and wireline BOP
ROV assisted
disconnect
7
5
7
8
9
10
11
12
rig
vessel or
platform
EDP
LRP
riser
XT
well
TF
SFT
well
head
WOCS
rig
vessel or
platform
EDP
LRP
TF
SFT
WOCS
XT
well
well
head
rig
vessel or
platform
EDP
LRP
riser
XT
well
TF
SFT
well
head
WOCS
ROV
ROV
rig
vessel or
platform
TF
SFT
WOCS
XT
well
well
head
EDP
LRP
vessel or
platform
rigTF
SFT
WOCS
XT
well
well
head
EDP
LRP
vessel or
platform
rig
TF
SFT WOCS
XT
well
well
head
EDP
LRP
1 2 3 4 5 6
vessel or
platform
rig
vessel or
platform
EDP
LRP
riser
XT
well
TF
SFT
well
head
WOCS
rig
vessel or
platform
EDP
LRP
riser
XT
well
TF
SFT
well
head
WOCS
rig
vessel or
platform
EDP
LRP
TF
SFT
WOCS
XT
well
well
head
rigTF
SFT
WOCS
XT
well
well
head
EDP
LRP
vessel or
platform
rig
TF
SFT WOCS
XT
well
well
head
EDP
LRP
vessel or
platform
rigTF
SFT
WOCS
XT
well
well
head
EDP
LRPROV
7 8 9 10 11 12
shut down valves
control t&p well
disconnect EDP
reconnect EDP
wait
run wireline
retract wireline
move above well
move away
open valves
control t&p well
7a
7b
7c
wa
it fo
r
reso
lutio
n o
f
dis
rup
tio
n
mo
ve
aw
ay
wo
rko
ve
r
dis
rup
tio
n
reco
nn
ect
co
ntin
ue
wo
rko
ve
r
hours24 48
mo
ve
ab
ove
we
ll
run
ED
P/L
RP
ho
ok u
p c
oile
d tu
bin
g/w
ire
line
fun
ctio
n a
nd
se
al te
st
run
co
iled
tu
bin
g/w
ire
line
asse
mb
ly a
nd
te
st
run
ris
ers
retr
ieve
co
iled
tu
bin
g/w
ire
line
ho
ok u
p S
FT
an
d T
F
retr
ieve S
FT
an
d T
F
retr
ieve
ris
ers
retr
ieve
ED
P/L
RP
actual workover operation
48 hrs
24 48 72 96hours
dis
asse
mb
ly
preparation 36 hrs finishing 27 hrs
stop productionresume
productiondeferred operation 62 hrs
mo
ve
ab
ove
we
ll
mo
ve
aw
ay fro
m w
ell
RO
V a
ssis
ted
co
nn
ect
assumptions:
running and retrieving risers: 50m/hr
running and retrieving coiled tubing/wireline: 100m/hr
depth: 300m workover duration
transportation
preparation
workover
finishing
total
estimated duration (hours)
24
36
48
27
135 (5.6 days)
production loss
6
48
8
62 (2.6 days)
cost = costworkover/day * tworkover + costdeferred op./day * tdeferred op.
~= 2.3 * 5.6 + 0.3 * 2.6 ~= 14 MNoK / workover
rig
vessel or
platform
EDP
LRP
riser
XT
well
TF
SFT
well
head
WOCS
ROV
rig
vessel or
platform
WOCS
XT
well
well
head
EDP
LRP
TF
SFT
rig
vessel or
platform
EDP
LRP
riser
XT
well
TF
SFT
well
head
WOCS
rig
EDP
LRP
riser
XT
well
TF
SFT
well
head
WOCS
7 7a 7b 7c
vessel or
platform
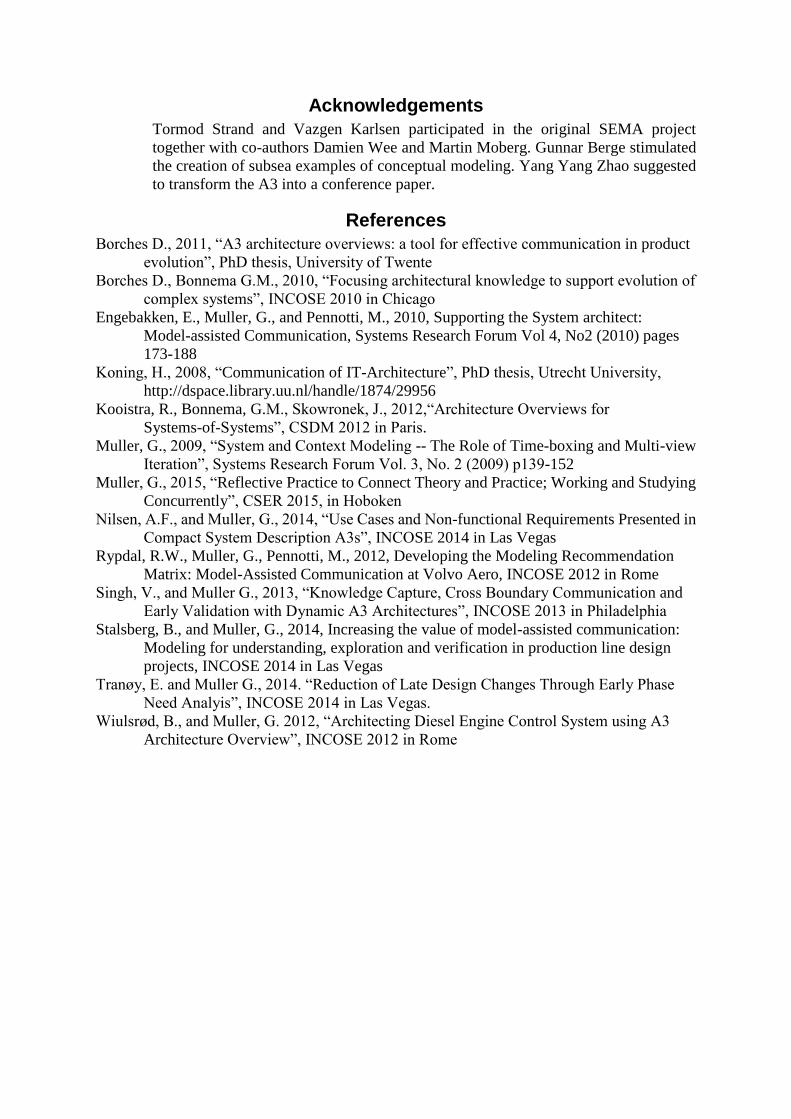
Figure 13. A3 with Architecture overview of a workover operation (full-size A3 is available at http://www.gaudisite.nl/SSMEoverviewA3.pdf)

The course participants used these models to explore improvements that would reduce
the installation time of the WOS to reduce the cost of the workover operation. Based
on our observation about the state of practice of knowledge and documentation
handling, we have used the same models to construct an A3AO for workover
operations, as shown in Figure 13. The A3 has all elements as shown in Figures 7 to
12. However, we unfolded the workflow of Figure 8, and the timeline of Figure 9,
since an A3 has sufficient space to fit them unfolded.
This single A3 provides now an explanation of the cost of workover operations and all
underlying models. Benefit of having all these models concurrently, is that
stakeholders can point to complementary models when reasoning about improvement
options.
Discussion on extending and using A3AOs in subsea oil and gas
A good moment to create an A3 is when a topic is hot. Systems engineers can facilitate
the discussion at such moment by recovering the overview on a single A3. However,
while making this A3, the creators rely on a shared understanding of the context of the
topic of interest. Unfortunately, this shared context understanding tends to lack as
well. Consequently, the “above” A3, providing the context of the topic is needed too.
At the same time, the discussion quickly requires more depth, e.g. a more detailed
understanding of several aspects. This results in the need for A3s “below” the topic of
interest.
In this particular case, cost of workover operations is not limited to work at a single
well. In a broader context, several vessels and platforms operating from harbors serve
multiple wells, and multiple fields. Figure 14 shows contextual A3 as workover
operations. At the bottom, Figure 14 shows some examples of more detailed A3s
elaborating a single aspect that is relevant for the topic of interest. These aspect
elaborations will typically address more design and implementation.
workover
duration
and cost
workover
health safety
environment
workover
robustness
navigation
and
positioning
ROV
handling
barrier and
containment
connect and
disconnect
workover
operations
A3AO topic
of interest
contextual
A3AO
A3AOs aspect
elaboration
Figure 14. Neighboring A3s
Figure 14 shows that there probably will be similar A3s capturing the other key
drivers. These levels of A3s correspond with Figure 6. However, the number of levels
depends on domain and its complexity. In this particular example, workover

operations, is only part of the subsea oil and gas subsea operations. Hence, we expect
at least one higher level A3.
Before building this larger structure of A3s, we need acceptance of the subsea
suppliers for the A3 approach. We have seen that the oil and gas industry is
conservative. At the one hand, we see that the suppliers are aware that systems
engineering may help the subsea oil and gas industry. At the other hand, most attempts
to introduce systems engineering methods and techniques experience a lot of
resistance. When we use this A3AO in current contacts with the subsea suppliers, we
get at least an enthusiastic response.
The current documentation focuses on static, mostly physical, and interface-oriented
information. The dynamic behavior captured in the workflow and visualized in the
“cartoon” bridges the current physical-oriented mindset and the dynamic operation of
the system.. Stakeholders in the oil and gas industry gave an enthusiastic response to a
number of characteristics of this A3.
The “cartoon” relates immediately to problems they experienced in the past.
They recognized that they could have prevented some past problems if they
would have followed such approach.
The A3 connects the technical system to the business interests in terms of time
and costs.
The A3 approach is pragmatic. It fits and complements the current way of
working that has emerged under a combination of high cost and time pressure
and high demands for safety, reliability, and lifetime at the same time.
Approaches that are more formal seem yet to be beyond current domain culture;
they are perceived as time-consuming and not applicable (Muller 2015). For
example, attempts at using IDEF0 and SysML typically meet skepticism and
resistance.
Conclusions
The subsea oil and gas industry is a multi-billion industry that is suffering from delays
and cost overruns. One of the causes is a complicated information flow, where
overview is lacking. We have applied conceptual modeling in combination with A3
architecture overviews to construct an A3 for workover operations. This A3 combines
physical model, dynamic behavior, and quantification. This combination facilitates
discussion of duration and cost of workover operations. The A3 is sufficiently close to
the mental world of the subsea and gas suppliers that they respond positive to the A3.
Future work
Employees from the suppliers applied conceptual modeling as project for the SEMA
course. We have to evaluate conceptual modeling, when applying it in hectic
industrial settings. Similarly, we need to evaluate the use of A3s in the same
circumstances. Significant effort is required to get support for a broader application
and evaluation of A3s and conceptual modeling in the subsea industry.
A research question that needs further study is the amount of levels of A3s that works
well. Related research questions are how A3s complement other ways of working,
such as conventional documents, knowledge and requirement databases, and Model
Based Systems Engineering (MBSE). The work on Dynamic A3s (Singh 2013)
deserves follow-up since it makes an attempt at combining A3s and MBSE.
Acknowledgements
Tormod Strand and Vazgen Karlsen participated in the original SEMA project
together with co-authors Damien Wee and Martin Moberg. Gunnar Berge stimulated
the creation of subsea examples of conceptual modeling. Yang Yang Zhao suggested
to transform the A3 into a conference paper.
References
Borches D., 2011, “A3 architecture overviews: a tool for effective communication in product
evolution”, PhD thesis, University of Twente
Borches D., Bonnema G.M., 2010, “Focusing architectural knowledge to support evolution of
complex systems”, INCOSE 2010 in Chicago
Engebakken, E., Muller, G., and Pennotti, M., 2010, Supporting the System architect:
Model-assisted Communication, Systems Research Forum Vol 4, No2 (2010) pages
173-188
Koning, H., 2008, “Communication of IT-Architecture”, PhD thesis, Utrecht University,
http://dspace.library.uu.nl/handle/1874/29956
Kooistra, R., Bonnema, G.M., Skowronek, J., 2012,“Architecture Overviews for
Systems-of-Systems”, CSDM 2012 in Paris.
Muller, G., 2009, “System and Context Modeling -- The Role of Time-boxing and Multi-view
Iteration”, Systems Research Forum Vol. 3, No. 2 (2009) p139-152
Muller, G., 2015, “Reflective Practice to Connect Theory and Practice; Working and Studying
Concurrently”, CSER 2015, in Hoboken
Nilsen, A.F., and Muller, G., 2014, “Use Cases and Non-functional Requirements Presented in
Compact System Description A3s”, INCOSE 2014 in Las Vegas
Rypdal, R.W., Muller, G., Pennotti, M., 2012, Developing the Modeling Recommendation
Matrix: Model-Assisted Communication at Volvo Aero, INCOSE 2012 in Rome
Singh, V., and Muller G., 2013, “Knowledge Capture, Cross Boundary Communication and
Early Validation with Dynamic A3 Architectures”, INCOSE 2013 in Philadelphia
Stalsberg, B., and Muller, G., 2014, Increasing the value of model-assisted communication:
Modeling for understanding, exploration and verification in production line design
projects, INCOSE 2014 in Las Vegas
Tranøy, E. and Muller G., 2014. “Reduction of Late Design Changes Through Early Phase
Need Analyis”, INCOSE 2014 in Las Vegas.
Wiulsrød, B., and Muller, G. 2012, “Architecting Diesel Engine Control System using A3
Architecture Overview”, INCOSE 2012 in Rome

Biography
Gerrit Muller, originally from the Netherlands, received his
Master’s degree in physics from the University of Amsterdam in
1979. He worked from 1980 until 1997 at Philips Medical Systems as
a system architect, followed by two years at ASML as a manager of
systems engineering, returning to Philips (Research) in 1999. Since
2003 he has worked as a senior research fellow at the Embedded
Systems Institute in Eindhoven, focusing on developing system
architecture methods and the education of new system architects,
receiving his doctorate in 2004. In January 2008, he became a full
professor of systems engineering at Buskerud and Vestfold
University College in Kongsberg, Norway. He continues to work as a
senior research fellow at the Embedded Systems Innovations by
TNO in Eindhoven in a part-time position.
All information (System Architecture articles, course material,
curriculum vitae) can be found at: Gaudí systems architecting
http://www.gaudisite.nl/
Martin Moberg is a Systems Engineer in Aker Solutions. He has 4
years’ experience from the Oil & Gas industry. His project
experience includes involvement in Subsea Productions Systems,
Workover Systems and Subsea Compressions Systems, as well as
process improvement project internally in the Aker Solutions
organization. He received both his Bachelor’s degree in
mechanical engineering and his Master’s degree in Systems
Engineering from Buskerud and Vestfold University College.
Damien Wee received his Bachelor's degree in mechanical
engineering with honors from the National University of Singapore
and is currently pursuing his Master's degree in System Engineering
from the Buskerud and Vestfold University College. He has been
working on the engineering, testing and installation of subsea oil and
gas production and workover systems for the past 9 years. His current
field of specialization is in the systems design of open water and in
marine type workover system. His most recent role is as a Specialist
System Engineer for the Well Access Systems group in FMC
Technologies.
Gerrit Muller.
Damien Wee