creating and delivering effective...
TRANSCRIPT
Creating and Delivering Effective Presentations
Debora B. Freitas LópezLinks Media, LLC
March 09, 2011

Presenter (English)
Debora B. Freitas LópezDirector of Integrated Marketing CommunicationsLinks Media, LLC.
Creating and Delivering Effective Presentations
Presenter (Spanish)
Sandra SanchezSr. Outreach and Social Marketing AdvisorLinks Media, LLC.

This talk presents different elements used to create and deliver an effective presentation
1
Reasons why the audience may tune out a presentation
2
How to create and delivery an effective presentation
3
Before and after PowerPoint slide examples with changes in the initial version

Reasons why the audience tunes out a presentation

What comes to mind when you see this slide?
Reynolds, G. 2008. Sample slides: Here are a few before/after slides.

What comes to mind when you see this slide?

What comes to mind when you see this slide?
Reynolds, G. 2008. Sample slides: Here are a few before/after slides. http://blog.slideshare.net/2008/03/12/slide-design/.

What come to mind when you see this slide?
Reynolds, G. 2008. Sample slides: Here are a few before/after slides.
What three things would you not like to see in a presentation?

Mini survey results: Three things you would not like to see in a presentation
0 5 10 15
Not useful or relevant
Confusing
Too repetitive
Poor slide design

Reasons why people do not pay attention during a presentation

Visual cortexVisual
Auditory cortexSpokenWritten
The major pathways in the brain for processing information
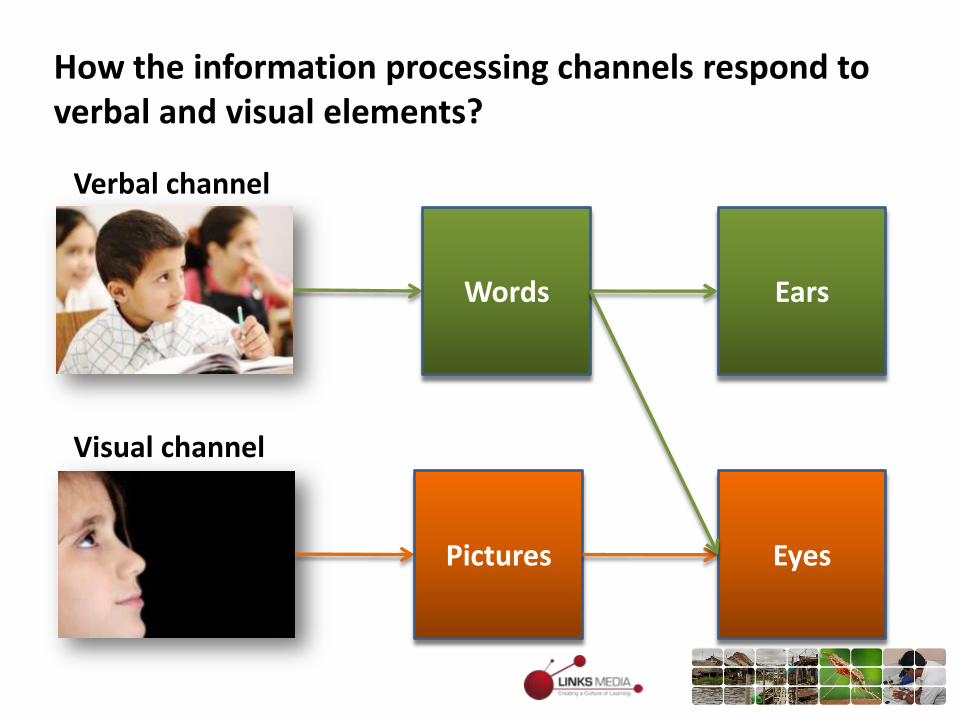
How the information processing channels respond to verbal and visual elements?
Visual channel
Verbal channel
Pictures Eyes
Words Ears

Do presenters with their traditional presentations with bullets take advantage of information processing?


0 20 40 60 80
Text
Pictures and words
Adding images can help to better remember information

Vision trumps all of the other senses for retaining information
0 20 40 60 80
Oral
Visual
Oral and visual
3x
6x

• Hefner developed a dynamic electro-thermal model for IGBT, from of the
temperature-dependent IGBT silicon chip, packages and heat sinks. The temperature-
dependent IGBT electrical model describes the instantaneous electrical behavior in
terms of the instantaneous temperature of the IGBT silicon chip surface. The
instantaneous power dissipated in the IGBT is calculated using the electrical model
and determines the instantaneous heat rate that is applied to the surface of the silicon
chip thermal model. Hefner incorporated this methodology into the SABER circuit
simulator.
• Adams, Joshi and Blackburn considered thermal interactions between the heat
sources, substrate, and encloses walls as affected by the thermal conductance of the
walls and substrate with the intent of determining which physical effects and level of
detail are necessary to accurately predict thermal behavior of discretely heated
enclosures.
• Chen, Wu and Borojevich are modeling of thermal and electrical behavior using
several commercial softwares (I-DEAS, Maxwell, Flotherm and Saber) and 3-D,
transient approaches.
What is the most common communication mistake of presenters?
[Parker, 2001], [Tufte, 2003], [Schwartz, 2003], [Keller, 2003]

What is the most common communication mistake of presenters?
Observations
Segment C (not on the 520 Main St. Property) represents the dominant feature
The characteristics of Segment C are vastly different than those of Segments A and B (which are located on the subject property)
The characteristics of the dominant portion of the system (Segment C) are suggestive of a perennial stream
Direct observations are needed
A detailed technical analysis is needed by a qualified, independent hydrologist.
[Parker, 2001], [Tufte, 2003], [Schwartz, 2003], [Keller, 2003]

The audience’s attention after 10 minutes steadily drops

Every 10 minutes, do something interesting in yourpresentation to grab the audience’s attention

How to create and deliver an effective presentation?

Several texts challenge the use of default PowerPoint options for more visual slides
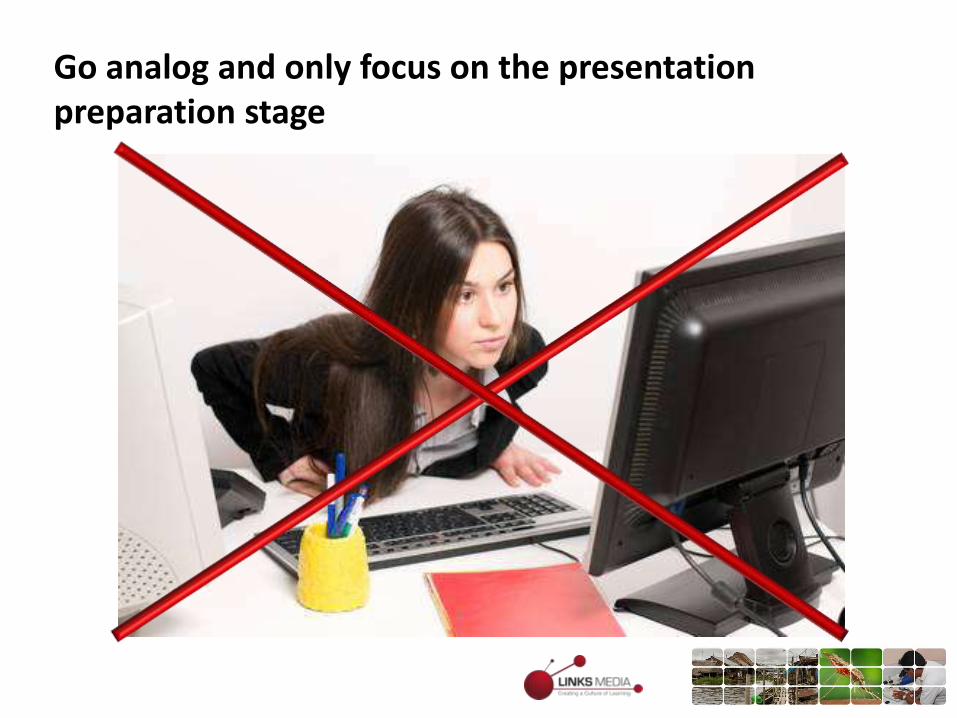
Go analog and only focus on the presentation preparation stage

Plan your content first because this should drive your design
Reynolds, G. 2008. Takeaways 7 Quotes from Dr. John Medina’sBrain Rules What all presnters need to know. Available at http://www.slideshare.net/garr/brain-rules-for-presenters.

Middle
Organize your ideas and points, and draft a map of your presentation
EndingBeginning

Include as many criteria as possible for outlining the presentation

Break up your story into more digestible bites
Middle
Ending
Methods to Reduce Sulfur Dioxide EmissionsFrom Coal-Fueled Utilities
Cynthia SchmidtMechanical Engineering DepartmentUniversity of Texas
Three classes of methods exist forreducing emissions of sulfur dioxide
post-combustionmethods
combustionmethods
pre-combustion methods
Coal switching and coal cleaningare two pre-combustion methods
Coal CleaningCoal Switching
High Sulfur Mine Low Sulfur Mine
Three classes of methods exist forreducing emissions of sulfur dioxide
post-combustionmethods
combustionmethods
pre-combustion methods
By using these methods, coal utilitiescan greatly reduce SO2 emissions
Percentage Reduction of SO2
coal cleaning
coal switching
fluidized bed
absorption
adsorption
25 50 75
40%40%
80%
90%
95%
80%
Beginning

Write a clear headline that explains the main idea of every slide
Clear assertion, no more than two lines

Xenon headlights illuminate signs better than halogen headlights do
[Sylvania, 2008 ]
Xenon Headlight
Halogen Headlight
SilverStar Ultra TM
Standard Halogen
Xenon
Headline: 28- point font bold Sans-serif font:
Body: 18-24 point font bold
References: 14 point font bold
Write a clear headline that explains the main idea of every slide

How can we reduce the load of information on PowerPoint slides?
Reynolds, G. 2008. Sample slides: Here are a few
before/after slides.
http://blog.slideshare.net/2008/03/12/slide-design/

Outline
Introduction
Background
Pre-Combustion methods– Coal switching
– Coal cleaning
Combustion method– Atmospheric fluidized bed
Post-Combustion methods– Absorption
– Adsorption
Conclusions
Acknowledgments
Questions
Remove everything that does not support your main idea
[Schmidt, C. 1989. “Methods to Reduce Sulfur Dioxide Emissions from Coal-Fired Utilities,” presentation .(Austin, TX: Mechanical Engineering Department, December 8, 1989). Cited by Alley, M. 2002. The Craft of Scientific Presentation. New York: Springer, p. 59, 147-148.] (Modified).
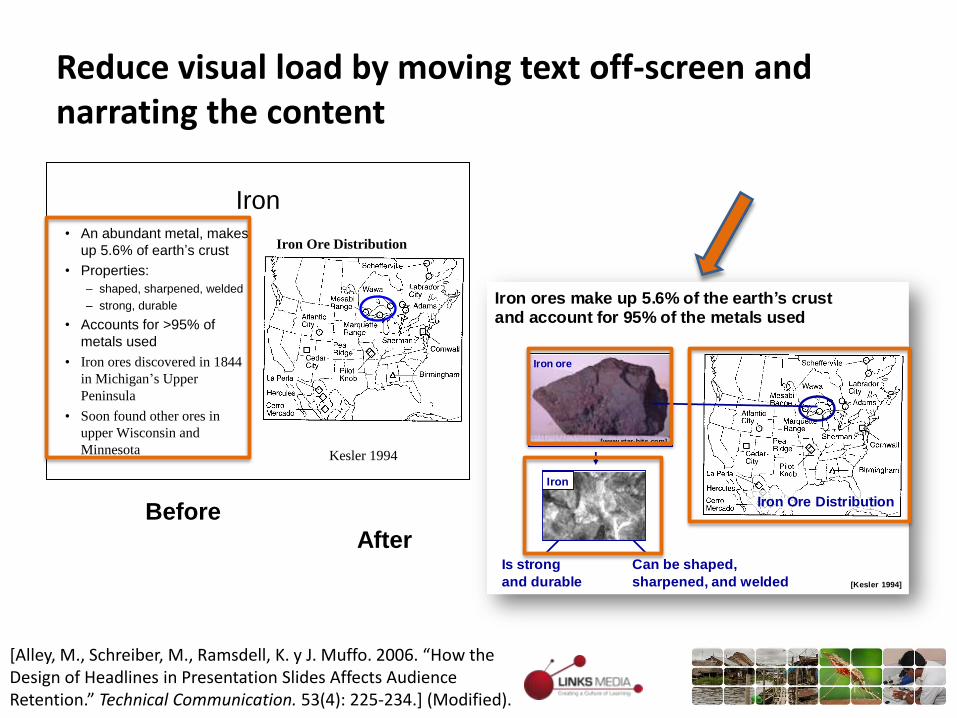
Reduce visual load by moving text off-screen and narrating the content
Iron • An abundant metal, makes
up 5.6% of earth’s crust
• Properties:
– shaped, sharpened, welded
– strong, durable
• Accounts for >95% of
metals used
• Iron ores discovered in 1844
in Michigan’s Upper
Peninsula
• Soon found other ores in
upper Wisconsin and
Minnesota Kesler 1994
Iron Ore Distribution
[Kesler 1994]
Iron Ore Distribution
[www.star-bits.com]
Iron ore
Where is the largest concentration of iron ores in North America?Iron ores make up 5.6% of the earth’s crustand account for 95% of the metals used
Can be shaped,
sharpened, and welded
Is strong
and durable
Iron
Before
After
[Alley, M., Schreiber, M., Ramsdell, K. y J. Muffo. 2006. “How the Design of Headlines in Presentation Slides Affects Audience Retention.” Technical Communication. 53(4): 225-234.] (Modified).
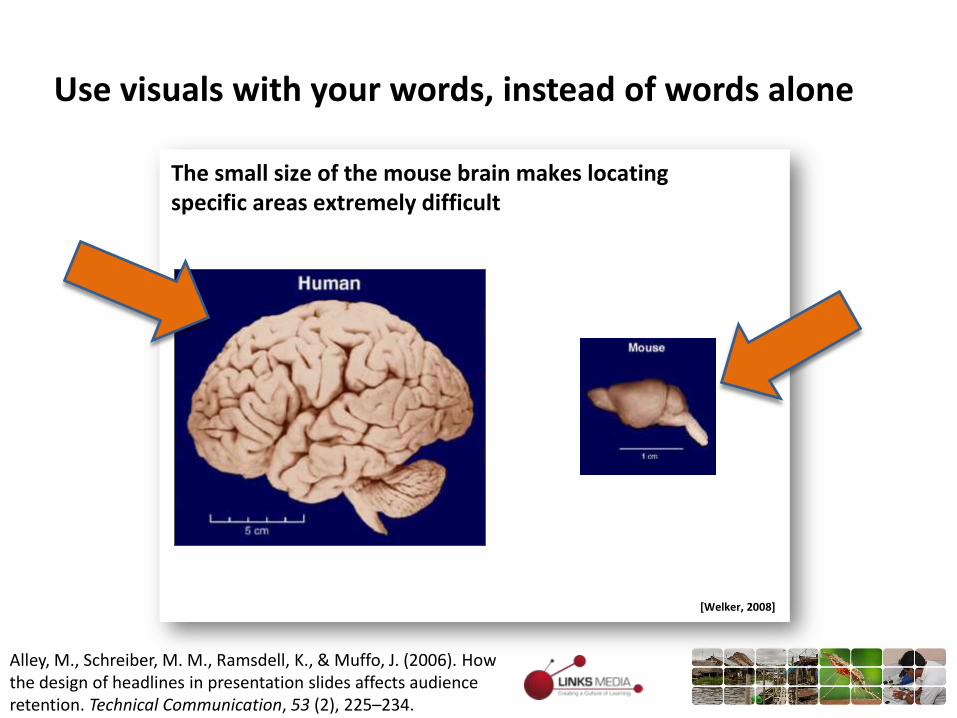
The small size of the mouse brain makes locating specific areas extremely difficult
52 [Welker, 2008]
Use visuals with your words, instead of words alone
Alley, M., Schreiber, M. M., Ramsdell, K., & Muffo, J. (2006). How the design of headlines in presentation slides affects audience retention. Technical Communication, 53 (2), 225–234.

Preparing yourself is the key to a successful performance as a speaker

What to take into consideration during the presentation

What to take into consideration during the presentation

Before and after slides examples with changes in the initial version
U.S. Resource Use
• The United States uses:
– 42% of all the aluminum produced worldwide
– 31% of all the petroleum
– 29% of all the phosphate
– 27% of all the copper
– 27% of the nitrogen
– 25% of the zinc
• Approximately 30% of all resources worldwide
Although the U.S. has 5% of the world's population, we use an average of 30% of all resources
United States use of specific resources
(percentage of worldwide use)
Before
After
Cited by Alley, M. 2002. The Craft of Scientific Presentation. New York: Springer, p. 59, 147-148. (Modified).

How can the design layout of the slide help deliver the message?
Before
After

How can slide makeover help to delivery the message?
Reynolds, G. 2008. Sample slides: Here are a few before/after slides. http://blog.slideshare.net/2008/03/12/slide-design/
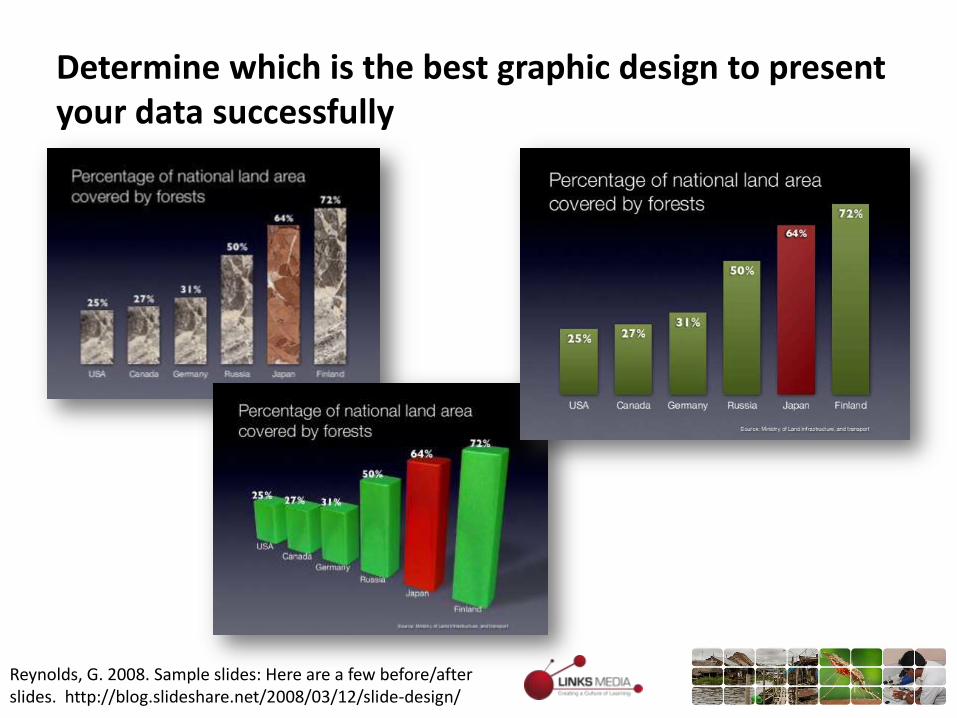
Determine which is the best graphic design to present your data successfully
Reynolds, G. 2008. Sample slides: Here are a few before/after slides. http://blog.slideshare.net/2008/03/12/slide-design/

Determine which is the best graphic design to present your data successfully
Reynolds, G. 2008. Sample slides: Here are a few before/after slides. http://blog.slideshare.net/2008/03/12/slide-design/

Use symbols to present your Infromation in a creative way
Reynolds, G. 2008. Sample slides: Here are a few before/after slides. http://blog.slideshare.net/2008/03/12/slide-design/

Find the time to master this new perspective on presentations

The PowerPoint is not the presentation,You are the presentation

In summary, there several elements to consider when creating and delivering effective presentations
Although the U.S. has 5% of the world's population, we use an average of 30% of all resources
United States use of specific resources
(percentage of worldwide use)

Although the U.S. has 5% of the world's population, we use an average of 30% of all resources
United States use of specific resources
(percentage of worldwide use)

Links Media, LLC.
707 Conservation Lane, Suite 300
Gaithersburg, MD 20878, USA
Tel. +1 301.987.5497
Fax. +1 301.987.5498
www.linksmedia.net
www.usaidami.org
Thank you!