creating curve data on local roads to support safety … creating curve data on local...creating...
TRANSCRIPT

CREATING CURVE DATA ON LOCAL ROADS
TO SUPPORTSAFETY ANALYSIS
Vermont Agency of Transportation
Session 1.4.3
April 11, 2017 – 2:30pm
Michael Trunzo, VTrans, Montpelier, VT
Joe Breyer, Works Consulting, Gilbert AZ

VTrans has curve data for all of our state highways,
but not for any local roads which make up over
80% of Vermont’s highways.
We need this data to support crash analysis, but it
would be too expensive to collect the data in the
field through traditional methods.
Works Consulting provides a better solution:
generate curve data directly from the road
centerline geometry.

Rural roads are the deadliest roads.
Dugway Rd. Richmond, VT March 2016

The majority of highway fatalities occur on rural roads.
In 2014, 19% of the U.S. population lived in rural areas, but rural fatalities accounted for 51% of fatal crashes.

Mud Season
In not necessarily the most ideal conditions….


By analyzing curves combined with crash data, we can identify
locations in need of safety
improvements.

So how to generate curve data for the rural local roads in a cost effective manner, and with good accuracy and reliability to feed the analytical tools?
Works Consulting is providing the solution for the creation of the curve data through processing of the road centerline geometry. Joe Breyer can provide some insight to the process and how this is done.

START WITH POLYLINE M
FEATURES
Prior to VTrans providing their data, we went to FHWA and had the LRS from previous HPMS submittals on DVD.
Alternatively, we could build routes on provided arcs, but that would establish (perhaps different measures).
Either way, we screen the UPACS route network – or the arcs built upon Route ID values – for LRS anomalies using our LRS Data Reviewer.
Polyline ZM also usable, though we would drop the Z’s to calculate the curve wedges
75,169 arcs
20,053 miles

WEDGE GENERATION
Wedges are created along a route using “Construct Horizontal Curves”
Calculated by one of 2 analytic methods. All wedge begins and ends are reported by route measure
Where road direction reverses (S-curves), curve direction reverses into a new wedge
Sharp corners (i.e. two vertices with more than “Maximum Chord Length”) are not allowed to participate in a wedge.
Raw 3-point curve calculations –helpful for discerning variable curvature (i.e. spirals)
These curves paint in solid shapes

See
Detail to
Right
WEDGES GENERATED

WEDGE DISSOLVE
• Adjacent curve wedges are
merged into composite curves
using “Dissolve Horizontal Curves”
• Adjacent wedges with similar intra-
vertex spacings are merged together and radius/degree is
recalculated on the composite
• Tool assumes that “radically”
different spacings on adjacent
vertices suggests variable
curvature. Allows for spiral curves
to be detectable by preventing adjoining wedges from merging
• These wedges render hollow in map with outline florescent shapes

• Raw on white
• Dissolved on white
• Raw and Dissolved
on white
• Dissolved on
Imagery

WIDER AREA EXAMPLE

WEDGE SUMMARIZE
• Polygonal curve wedges are
turned into polyline events using
“Compile Horizontal Curves”
• The PolylineM routes are utilized for
rendering – even though the LRS
details were traveling with the
wedges
• The output feature class is linear
and makes for easier labeling
• And there is tabular output that
satisfies your cravings for curvature
event data – already calibrated to your LRS routes.

CURVATURE LINES (WITH WEDGES)
• See the lines?
• Now ArcMap can draw
better labels
TABULAR ATTRIBUTES• Cyan highlights show
the 4 wedges at right
• Notice two “F” curves in
a row? An S-curve.
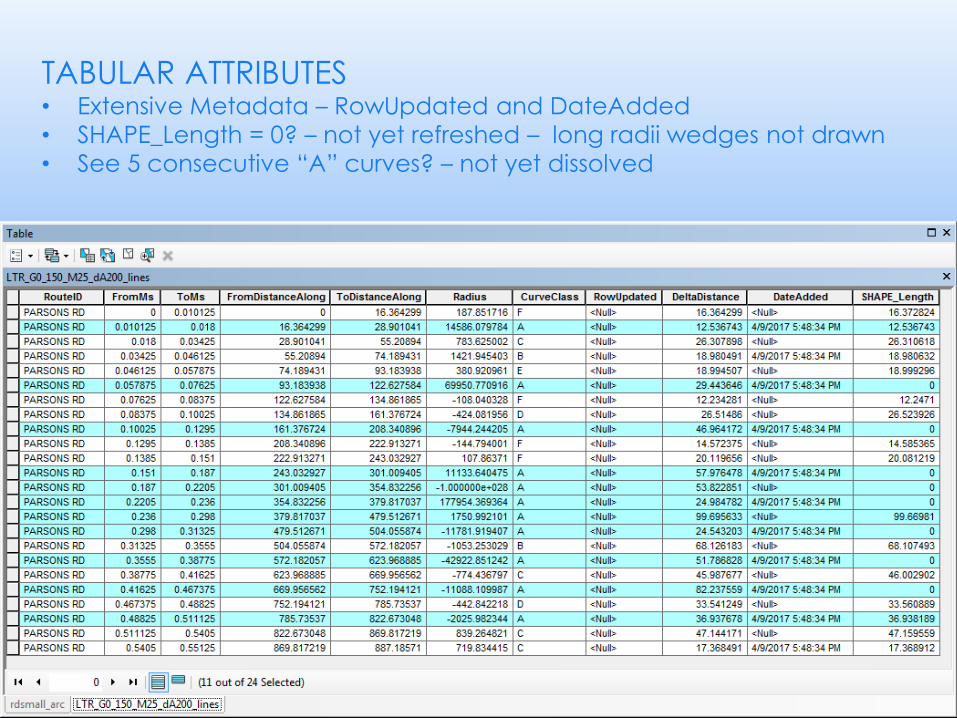
TABULAR ATTRIBUTES• Extensive Metadata – RowUpdated and DateAdded
• SHAPE_Length = 0? – not yet refreshed – long radii wedges not drawn
• See 5 consecutive “A” curves? – not yet dissolved

MANUAL SOLUTION
• User can always check
results with simple 3-point
geometric solution
• Also, use the Select,
Replace, and Apply buttons
to override the automatic
calculations of the Raw and Dissolve tools (That’s why
attribute “RowUpdated” exists)
• Change the shape and
color of the drawn points
with the “P” and “C” button
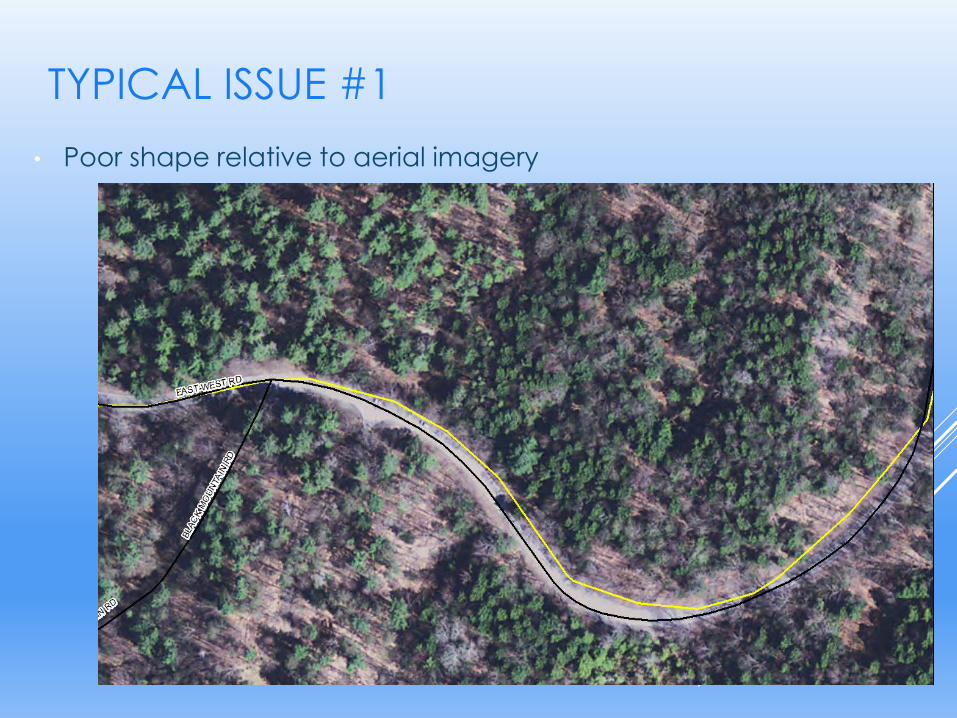
TYPICAL ISSUE #1
• Poor shape relative to aerial imagery

TYPICAL ISSUE #2
• Poor visibility of roadway due to tree cover (maybe?)

TYPICAL ISSUE #3
• Erratic vertex spacing suggesting variability in curvature.
>90deg
=90deg
=90deg
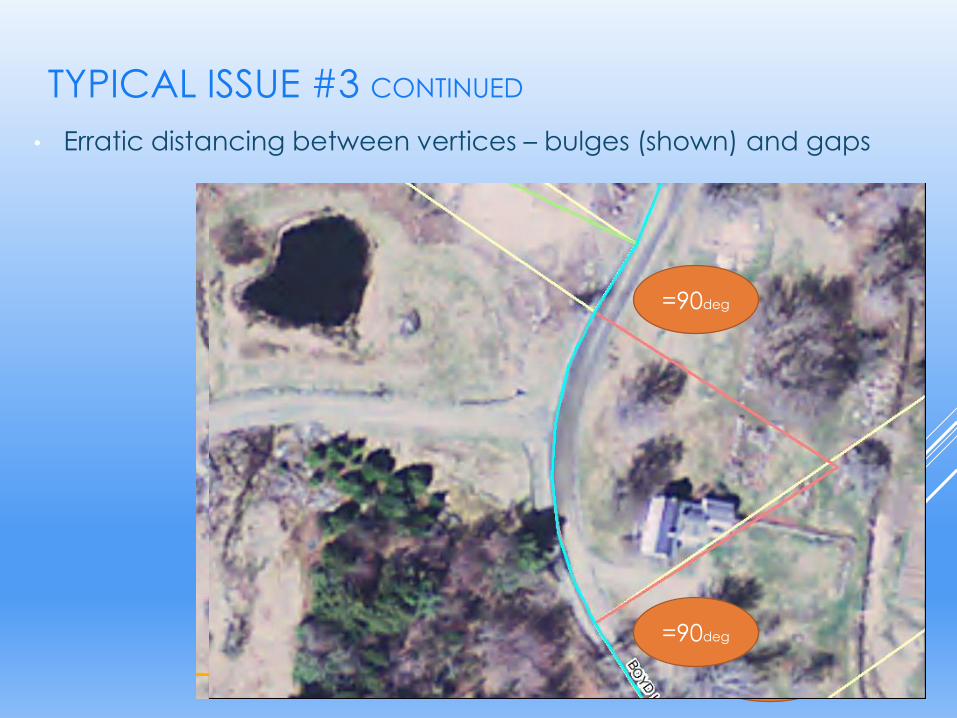
TYPICAL ISSUE #3 CONTINUED
• Erratic distancing between vertices – bulges (shown) and gaps

FIXING THE DATA (QUALITY CONTROL)
Majority of the project
focused on improving
digitization of Vermont’s
centerline file
Resources: imagery, LIDAR
Pan Tracker tool
Consultant focus on
Vermont’s local roads with
the most crashes and highest
curve indices
VTrans staff focus on federal aid roads

CURVY ROADS
Challenge Larry (the Cable
Guy) assertion that the
Dragon (in TN) is the
curviest road in
America?
We have a way of
measuring that now on a nationwide basis – thanks
to ARNOLD.

CURVINESS INDEX
“A-Curves” have the lowest value (1), and “F-curves” have the highest value (6)
Weighted-average curvature of a route
Useful in prioritizing the roads which will (or might) require the most editing.
Challenge Larry (the Cable
Guy) assertion that the Dragon (in TN) is the curviest road in America?

POTENTIAL ERROR
Statistical analysis – What’s the probability that my curve begin and curve end is accurate enough for analysis without further editing?
Helps answer the question as to whether an agency should invest in better digitization to improve curve data.
Employ “Point and Reach” tool to gather observations for roads that have been edited to determine the feet of potential error in diagnosing whether a crash within so many feet of a curve is actually on the curve.
Plot 1st, 2nd, and 3rd standard deviations
Sampling of Edited
Collectors and Arterials
1
2
3

PERFORMANCE
MEASUREMENT
The benefit of
editing vertices to
improve the validity
of curve data can
be measured using
before and after
(i.e. editing) studies on the Curve Class
value.
The measure of the
route is essentially a
static and minimally affected by vertex
movements.

107. Curve Identifiers/Linkages
108. Curve Feature Type
109.Horizontal Curvature
Degree (or Radius)
110.Horizontal Curve Deflection
Angle
111.Superelevation
112.Spiral Curve Presence
113.Intersection/Deflection
Angle
114.Curve Direction
MIRE DATA ELEMENTS

OTHER ITEMS OF
INTEREST
Budget/Schedule continuing
through August
Consultant is using
disconnected editing in Gilbert AZ with nightly check-ins to
Montpelier VT.
VTrans has legacy curve events
culled from construction plans
for comparison.
Curve & Grade Tools for ArcGIS
– we didn’t talk about gradient!
Our booth…

