creating foundations for sustainable growth€¦ · · 2018-03-15annual port 2017 bmmi 7 openings...
TRANSCRIPT

Cre
atin
gFo
unda
tions
for
Sus
tain
able
Gro
wth
Ann
ual R
epor
t 201
7

Head Office812 Shaikh Jaber Al AhmedAl Subah HighwayP.O. Box 828, SitraKingdom of BahrainTelephone: +973 17 739 444Fax: +973 17 735 111Commercial Registration10999
Authorised Capital200,000,000 shares ofBD 0.100 each: BD 20,000,000
Paid Up CapitalBD 14,642,854 divided into 146,428,540 ordinary shares each with a nominal value of BD 0.100 fully paid
Reviewing AccountantsErnst & Young
Company SecretaryMr. Jad Moukheiber
DirectorsMr. Abdulla Hassan BuhindiChairmanMr. Abdulla Mohammed JumaVice ChairmanMrs. Mona Yousif AlmoayyedMr. Mohammed Farouq AlmoayyedMr. Jehad Yousif AmeenMr. Redha Abdulla FarajMr. Shawki Ali FakhrooMr. Suhail Mohammed Hajee
BankersNational Bank of Bahrain B.S.C.Ahli United Bank B.S.C.Bank of Bahrain & Kuwait B.S.C.Standard Chartered BankHSBC Bank Middle EastBMI Bank B.S.C.BNP Paribas

His Royal HighnessPrince Khalifa bin Salman Al KhalifaThe Prime Minister of the Kingdom of Bahrain
His MajestyKing Hamad bin Isa Al KhalifaThe King of the Kingdom of Bahrain
His Royal HighnessPrince Salman bin Hamad Al KhalifaThe Crown Prince, First Deputy Prime Minister & Deputy Supreme CommanderKingdom of Bahrain

Foundations for
Sustainable Growth
BMMI
2
BMMIP03 Our Vision, Mission & Values
P05 About Us
P06 2017 Milestones
P08 Board of Directors
P09 Executive Management
P10 Financial Summary
P13 People & Places
P14 Statements
P20 Financial Statements

Annual Report
2017
BMMI
3
The delivery of exceptional service is driven by our values
honesty excellence achievement recognition team spiritOur Vision To be recognised as a dynamic international company that inspires its individual businesses to deliver outstanding results.
Our MissionWinning the hearts and minds of our customers by delivering exceptional service.

Foundations for
Sustainable Growth
BMMI
4
BMMI is filled with people who aspire to greatness, and we want to make BMMI the place where they can make it happen.

Annual Report
2017
BMMI
5
Welcome to BMMI - a name synonymous with sustainability and success for over 130 years.
Based in the Kingdom of Bahrain, with international operations, BMMI is a diversified retail and distribution, hospitality, and contract services and supply group, powered by a world-class integrated logistics capability and unrivalled heritage.
Today, BMMI represents a dynamic portfolio of global household brands and is a forerunner in the wholesale, distribution, retail and production of food and beverages. The Group is also a fully-fledged international provider of end-to-end supply chain solutions, integrated facility management, logistics and procurement services to various governments and organisations.
Listed on the Bahrain Bourse, BMMI is one of the fastest growing multinational companies and a leading private sector business enterprise in the GCC region. The Group also adopts an untiring performance-driven and customer-focused approach that meets the finest international standards and best global practices.
About Us
4 Key Areas
BMMI is recognised as a dynamic international company with its diversified portfolio spread across four key areas of retail, distribution, hospitality and contract services & supply logistics.

Foundations for
Sustainable Growth
BMMI
6
Awards CSR
• Nader Trading received two awards from its principal Henkel to recognise them with the Highest Market Growth and Regional Distributor of the Year for 2017.
• GSS awarded with a major one-year contract from a US-based contractor for end-to-end supply chain management in Iraq, to encompass food procurement, acquisition, logistics and delivery services.
• Bahrain’s Ministry of Tourism declares La Vinoteca Barcelona as 'Best Fine Dining Restaurant' at the Food and Travel Arabia Bahrain Awards.
• 2017 Citi Fact award for Best Mediterranean restaurant for La Vinoteca Barcelona.
• Downtown Rotana recognised by Bahrain Electricity and Water Authority for the hotel’s exceptional energy saving efforts in 2017.
2017 Milestones
• BMMI launches Employment Facilitation Training Service (EFTS) in partnership with The Bahrain Society for Children with Behavioural and Communication Difficulties (BSCBCD), and in collaboration with Tamkeen and Project SEARCH. Fourteen apprentices with Autism Spectrum Disorder (ASD) gain valuable workplace training in Alosra Saar and Janabiya.
• BMMI partners with Conserving Bounties to help tackle food waste in the Kingdom of Bahrain.
• Alosra Charitable Foundation invests BD50K with Conserving Bounties to set up Bahrain's first soup kitchen.
135 Years
In 2018, BMMI will celebrate 135 years of delivering exceptional services and uninterrupted international operations.

Annual Report
2017
BMMI
7
Openings Initiatives
• BMMI launches the Winning Moments Recognition initiative, giving heads of departments in Bahrain the opportunity to recognise and instantly reward high performers and those who display our ‘Winning Hearts’ culture.
• EPIC, the second edition of BMMI's in-house ‘experience-sharing’ training initiative, takes place. The leadership programme helps develop participants’ skills in experience, people, innovation and culture.
• Alto, a trendy Middle Eastern inspired lounge, opens its doors on the 25th floor of Downtown Rotana in Manama, Bahrain.
• Alosra’s second branch in Saudi Arabia and the 9th in total launches at Al Safa in Dammam.
• Elios Craft Cafe relaunches, with updated and reimagined offerings, in the BMMI Tower in Seef District, Bahrain.
• La Vinoteca Barcelona relaunches with a major design makeover and revised value proposition.
We can be proud of our achievements as we look over the last year and with the foundations we have put in place, we are very excited about what lies ahead.
9 Supermarkets
With the opening of its second branch in Saudi Arabia in Al Safa, Dammam in 2017, Alosra now operates a total of nine stores across the KSA and Bahrain.

Foundations for
Sustainable Growth
BMMI
8
Mr. Shawki Ali FakhrooDirector
Mr. Abdulla Hassan BuhindiChairman
Mrs. Mona Yousif AlmoayyedDirector
Mr. Suhail Mohammed HajeeDirector
Mr. Redha Abdulla FarajDirector
Mr. Abdulla Mohammed JumaVice Chairman
Mr. Jehad Yousif AmeenDirector
Mr. Mohammed FarouqAlmoayyedDirector
Board of Directors

Annual Report
2017
BMMI
9
Executive Management
Marek SheridanCEO
Mr. Ammar Aqeel AlhassanDeputy CEO & CFO
Mr. Robert SmithCOO, Contracting & Logistics
Remuneration andNomination CommitteeMr. Abdulla Buhindi ChairmanMr. Shawki Fakhroo Vice-ChairmanMr. Jehad Yousif Amin DirectorMrs. Mona Almoayyed Director
Audit CommitteeMr. Mohammed Farouq Almoayyed ChairmanMr. Redha Abdulla Faraj DirectorMr. Abdulla Mohammed Juma Director
Executive CommitteeMr. Shawki Fakhroo ChairmanMrs. Mona Yousif Almoayyed DirectorMr. Jehad Yousif Ameen Director
Investment CommitteeMr. Abdulla Hassan Buhindi ChairmanMrs. Mona Yousif Almoayyed DirectorMr. Jehad Yousif Ameen DirectorMr. Shawki Ali Fakhroo DirectorMr. Suhail Mohammed Hajee Director
Foundations for
Sustainable Growth
BMMI
10
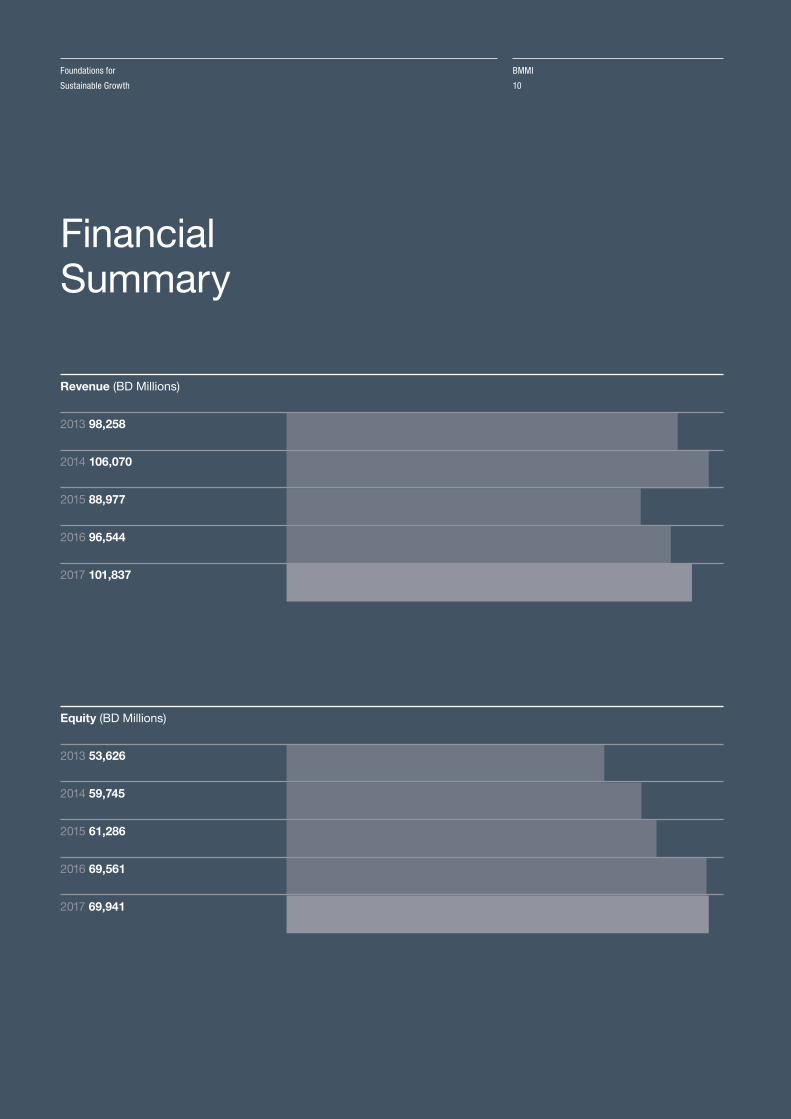
Financial Summary
Equity (BD Millions)
2013 53,626
2014 59,745
2015 61,286
2016 69,561
2017 69,941
Revenue (BD Millions)
2013 98,258
2014 106,070
2015 88,977
2016 96,544
2017 101,837

Annual Report
2017
BMMI
11
Earnings per Share (fils)
2013 80 2014 90 2015 73 2016 68 2017 62
Net Profit (BD Millions)
2013 10.1
2014 11.3
2015 10.1
2016 9.4
2017 8.6
EBITDA (BD Millions)
2013 11.9
2014 13.2
2015 12.0
2016 13.4
2017 13.8

The Group’s overseas presence now covers nine countries, including Djibouti, Ghana, Iraq, Kenya, Qatar, Saudi Arabia, Republic of the Sudan and South Sudan, in addition to the head office in Bahrain.

Annual Report
2017
BMMI
13
People &Places
1500+ Employees
help exceed customer expectations.
BMMI is recognised for its size, strength and diversity, with overseas presence covering over nine countries across the GCC and Africa.
40+ Nationalities
drive diversity of thought and innovation.
Employees by County
Bahrain 820
Saudi Arabia 63
Qatar 48
Iraq 7
Djibouti 45
Kenya 62
Sudan 284
South Sudan 148
Ghana 121
Total 1598
51.3%
3.9%
3.0%
0.4%
2.8%
3.8%
17.7%
9.2%
7.5%

Foundations for
Sustainable Growth
BMMI
14
StatementsP16 Chairman’s Statement
P18 CEO’s Statement

Annual Report
2017
BMMI
15
2017 was a year in which we strengthened our business foundations to best meet market conditions while creating a platform for future growth.

Foundations for
Sustainable Growth
BMMI
16
Chairman'sStatement
It gives me immense pride in announcing the fact that despite a backdrop of a tumultuous regional and international climate and several economic setbacks and mutations in addition to our geographies of operation, BMMI Group has once again delivered a solid performance. We have succeeded in turning the tide of unpredictability into strong, expected results that we can all be proud of.
BD13.8m
The operational performance for BMMI Group was strong, delivering EBITDA of BD13.8m, up 3% from the previous year.

Annual Report
2017
BMMI
17
Abdulla Hassan BuhindiChairman
Resilience and agility are the cornerstones of our business that give us a competitive advantage, drive our momentum and help us deliver tremendous shareholder value. We stand committed to our corporate strategy, our vision, and our values that are a source of pride among our stakeholders, shareholders, and employees. The changes in taxation and the rapidly fluctuating markets have been part of the key lessons we’ve learnt in 2017. In terms of achieving long-term growth, we are continually reviewing our strategic plans to keep up with the dynamic challenges of ever-changing market conditions. This approach is also combined with a more astute focus on risk monitoring and mitigation. In 2017, BMMI witnessed several key growth areas. Alosra in El Mercado at Janabiya continues to raise the bar by exceeding expectations. While Nader Trading – our consumer goods business – has demonstrated a
complete turnaround with a strong growth forecast for the upcoming year.We continued giving back to Bahrain socially and economically with our CSR activities. We have contributed to the Alosra Charitable Foundation and corporate sponsorship schemes as well as other local initiatives. We stand committed to sustainable development across all areas of our operation.
I want to take this opportunity to thank Gordon Boyle for his untiring contribution over the past 15 years to BMMI and equally welcome Marek Sheridan whose seamless integration into his new role has contributed to a very successful and rewarding year. On behalf of the Board of Directors, I would like to express my sincere gratitude to His Majesty King Hamad Bin Isa Al Khalifa, His Royal Highness the Prime Minister, Prince Khalifa Bin Salman Al Khalifa, and His Royal Highness the Crown Prince, Deputy Supreme Commander and First Deputy Prime Minister Prince Salman Bin Hamad Al Khalifa for their visionary leadership, support and encouragement to the Kingdom’s private sector. My gratitude extends to all Government entities and ministries, especially the Central Bank of Bahrain, the Bahrain Bourse and the Ministry of Industry, Commerce, and Tourism for their continued support. I also take this opportunity to express my appreciation and gratitude to our shareholders, customers and business
partners, and my sincere thanks to our management and staff across all our operations and territories. It is their perseverance and relentless commitment that has made 2017 a successful year for the BMMI Group.
2018 will bring us new challenges, global economic volatility, and tough competitive waters all around. But our readiness to adapt, coupled with our strong foundations makes us confident of sailing through and conquering new horizons.
Abdulla Hassan BuhindiChairman

Foundations for
Sustainable Growth
BMMI
18
CEO Statement
2017 was a year in which we strengthened our business foundations to best meet market conditions while creating a platform for future growth. The first significant change was my introduction to the team as I formally took over the role of CEO from Gordon Boyle who successfully led BMMI for 15 years. I wanted to build on our culture of Winning Hearts through excellence and achievement, while gaining the buy in of the whole team to evolve and become more comfortable with being challenged. After all, great things rarely come from our comfort zones.
Planning for 2017, we had a lot to consider. In a world where change and volatility are the only norms, our corporate strategy strikes a careful balance between sustainability and growth and as such is built around four key commitments: people and performance, cost efficiency, exceeding customer expectations and defining new profit growth areas.
The operational performance for BMMI Group was strong, delivering EBITDA of BD13.8m, up 3% from the previous year. Our group net profit of BD8.6m missed budget by 8% largely due to an unbudgeted restructuring cost of our non-performing businesses in Africa. While impacting 2017 results this decision does place us in a stronger position for sustainable profit growth in the years ahead.
Our consumer goods division Nader Trading, which represents global brands such as Red Bull, Mars and Colgate delivered a profit growth of 60%. We also made key investments in our planning and operations and the evolution has been extraordinary, creating a really strong proposition for our Principal partners and customers.
BMMI has set a new benchmark in retailing when it comes to our supermarket business. Alosra’s flagship Janabiya outlet in El Mercado has been hugely successful in 2017, delivering a great customer experience and achieving strong results. Alosra is part of the fabric of BMMI and it is the place where the majority of our customers can experience who we are and what we offer. That’s why we are so
Marek SheridanCEO

Annual Report
2017
BMMI
19
EFTS Program
BMMI is not all about business, we are also about community and caring for the people around us. BMMI worked with the Bahrain Society for Children with Behavioural & Communication Difficulties to become the first business host for the Employment Facilitation Training Service (EFTS) program.
invested in creating great and relevant customer experiences, whether it is bringing in artisan cheese makers to delight, or developing our local supplier infrastructure. This also ties into our thriving Think Local initiative, which elevates the needs of the communities in which we operate by integrating local producers and farmers into our supply chain. This provides support to the local workforce, as well as an excellent variety of choice for our customers.
BMMI integrates our CSR work into what we do everyday so we can add more value and ensure all our initiatives are sustainable. One example is our work with the Bahrain Society for Children with Behavioral & Communication Difficulties as the first business host for an Employment Facilitation Training Service (EFTS) program for individuals with disabilities – there is a massive need from the community in the area of inclusive employment generation and we can play a key part in making a real difference.
BMMI is filled with people who aspire to greatness, and we want to make BMMI the place where they can make it happen. We can be proud of our achievements as we look over the last year and with the foundations we have put in place, we are excited about what lies ahead.
While we have achieved some strong results in 2017, our real focus has been on laying the foundations for even greater results in years to come. We have a clear corporate objective of delivering sustainable profit growth, which we will do by reinforcing our key strategies of exceeding customer expectations, cost effectiveness, reducing our reliance on a single market and focusing on our people and performance.
2018 is about exceptional execution which we will achieve by empowering and motivating our team to constantly challenge how we can exceed expectations in all that we do, every day.
Marek SheridanCEO
In a world where change and volatility are the only norms, our corporate strategy strikes a careful balance between sustainability and growth and is built around four key commitments: people and performance, cost efficiency, exceeding customer expectations and defining new profit growth areas.

Foundations for
Sustainable Growth
BMMI
20
Financial Statements
P22 Independent Auditor's Report to the Shareholders
P26 Consolidated Statement of Financial Position
P27 Consolidated Statement of Income
P28 Consolidated Statement of Comprehensive Income
P29 Consolidated Statement of Cash Flows
P31 Consolidated Statement of Changes in Equity
P33 Notes to the Consolidated Financial Statements

Annual Report
2017
BMMI
21
Our readiness to adapt, coupled with our strong foundations makes us confident of sailing through and conquering new horizons.

Foundations for
Sustainable Growth
BMMI
22
Independent Auditor's Report to the Shareholders of BMMI B.S.C
Report on the Audit of the Consolidated Financial Statements
OpinionWe have audited the accompanying consolidated financial statements of BMMI B.S.C. (“the Company”) and its subsidiaries (together “the Group”), which comprise the consolidated statement of financial position as at 31 December 2017, and the consolidated statements of income, other comprehensive income, cash flows and changes in equity for the year then ended, and notes to the consolidated financial statements, including a summary of significant accounting policies.
In our opinion, the accompanying consolidated financial statements present fairly, in all material respects, the consolidated financial position of the Group as at 31 December 2017, its consolidated financial performance and its consolidated cash flows for the year then ended in accordance with International Financial Reporting Standards (IFRSs).
Basis for opinionWe conducted our audit in accordance with International Standards on Auditing (ISAs). Our responsibilities under those standards are further described in the auditor’s responsibilities for the audit of the consolidated financial statements section of our report. We are independent of the Group in accordance with the International Ethics Standards Board for Accountants’ Code of Ethics for Professional Accountants (IESBA Code), and we have fulfilled our other ethical responsibilities in accordance with the IESBA Code. We believe that the audit evidence we have obtained is sufficient and appropriate to provide a basis for our opinion.
Key audit mattersKey audit matters are those matters that, in our professional judgement, were of most significance in our audit of the consolidated financial statements for the year ended 31 December 2017. These matters were addressed in the context of our audit of the consolidated financial statements as a whole, and in
forming our opinion thereon, and we do not provide a separate opinion on these matters. For each matter below, our description of how our audit addressed the matter is provided in that context.
We have fulfilled the responsibilities described in the auditor’s responsibilities for the audit of the consolidated financial statements section of our report, including in relation to these matters. Accordingly, our audit included the performance of procedures designed to respond to our assessment of the risks of material misstatement of the consolidated financial statements. The results of our audit procedures, including the procedures performed to address the matters below, provide the basis for our audit opinion on the accompanying consolidated financial statements.
1. Impairment of property, plant and equipment of Banader Hotels Company B.S.C. Refer to notes 3 and 5 to the consolidated financial statements.
Key audit matter
Property, plant and equipment of the Group includes BD 40,630,847 (or 36% of the Group’s total assets) relating to Downtown Rotana Hotel owned by the Group through its subsidiary, Banader Hotels Company B.S.C. The hotel is in a start-up phase and is incurring losses. The internal assessment of the impairment of property, plant and equipment was carried out by the management by comparing its carrying value to the recoverable amount, which is higher of value in use and the fair value less costs to sell as at 31 December 2017.
Management have used the fair value less costs to sell approach under IAS 36 ""Impairment of Assets"". As they have not identified any impairment they have not considered value in use. The impairment review involves a number of significant judgments to be made by management and therefore we considered this area as a key audit matter.
How the key audit matter was addressed in the audit Our procedures included, amongst others, evaluation of the competencies, capabilities and objectivity of the management personnel involved in the assessment of impairment. We obtained, understood and challenged management's impairment review and checked that it was in compliance with the requirements of IAS 36. We evaluated the underlying assumptions used in the impairment assessment of property, plant and equipment, such as comparable market rates for a similar property.
We also evaluated the appropriateness of disclosures made in the notes 3 and 5 to the consolidated financial statements.

Annual Report
2017
BMMI
23
2. Provision for slow moving and obsolete inventories Refer to notes 3 and 10 to the consolidated financial statements.
Key audit matter
The Group imports and sells food and other products which have a short life span and expiry period. The Group has gross inventories of BD 11,451,931 as at 31 December 2017.
This area was important for the audit as significant judgement is required in assessing the appropriate level of provision for items which may be slow moving and obsolete. Such judgements include management’s expectations of forecast inventory demand, product expiry dates and inventories disposal plan for near expiry items.
How the key audit matter was addressed in the audit Our audit procedures included, amongst others, observing physical inventory counts at major locations, performing detailed testing of a sample of items to assess the cost basis and net realisable value of inventory and evaluating the adequacy of provision for slow moving and obsolete inventories as at 31 December 2017. We also reviewed the budget for the next year in order to gain an understanding the forecast inventory demand, product expiry dates and inventories disposal plan for near expiry items.
Other information included in the Group’s 2017 annual reportOther information consists of the information included in the Group’s 2017 Annual Report, other than the consolidated financial statements and our auditor’s report thereon. The Board of Directors is responsible for the other information. Prior to the date of this auditors’ report, we obtained the Chairman’s report which forms part of the annual report, and the remaining sections of the annual report are expected to be made available to us after that date.
Our opinion on the consolidated financial statements does not cover the other information and we do not express any form of assurance conclusion thereon.
In connection with our audit of the consolidated financial statements, our responsibility is to read the other information identified above when it becomes available and, in doing so, consider whether the other information is materially inconsistent with the consolidated financial statements or
our knowledge obtained in the audit, or otherwise appears to be materially misstated. If, based on the work we have performed on the other information obtained prior to the date of the auditor’s report, we conclude that there is a material misstatement of this other information, we are required to report that fact. We have nothing to report in this regard.
Responsibilities of the Board of Directors for the consolidated financial statementsThe Board of Directors is responsible for the preparation and fair presentation of the consolidated financial statements in accordance with IFRSs and for such internal control as the Board of Directors determines is necessary to enable the preparation of consolidated financial statements that are free from material misstatement, whether due to fraud or error.
In preparing the consolidated financial statements, the Board of Directors is responsible for assessing the Group’s ability to continue as a going concern, disclosing, as applicable, matters
related to going concern and using the going concern basis of accounting unless the Board of Directors either intends to liquidate the Group or to cease operations, or has no realistic alternative but to do so.
Independent Auditor's Report to the Shareholders of BMMI B.S.C (Continued)

Foundations for
Sustainable Growth
BMMI
24
Auditor’s responsibilities for the audit of the consolidated financial statements Our objectives are to obtain reasonable assurance about whether the consolidated financial statements as a whole are free from material misstatement, whether due to fraud or error, and to issue an auditor’s report that includes our opinion. Reasonable assurance is a high level of assurance, but is not a guarantee that an audit conducted in accordance with ISAs will always detect a material misstatement when it exists. Misstatements can arise from fraud or error and are considered material if, individually or in the aggregate, they could reasonably be expected to influence the economic decisions of users taken on the basis of these consolidated financial statements.
As part of an audit in accordance with ISAs, we exercise professional judgment and maintain professional scepticism throughout the audit. We also:
• Identify and assess the risks of material misstatement of the consolidated financial statements, whether due to fraud or error, design and perform audit procedures responsive to those risks, and obtain audit evidence that is sufficient and appropriate to provide a basis for our opinion. The risk of not detecting a material misstatement resulting from fraud is higher than for one resulting from error, as fraud may involve collusion, forgery, intentional omissions, misrepresentations, or the override of internal control.
• Obtain an understanding of internal control relevant to the audit in order to design audit procedures that are appropriate in the circumstances, but not for the purpose of expressing an opinion on the effectiveness of the Group’s internal control.
• Evaluate the appropriateness of accounting policies used and the reasonableness of accounting estimates and related disclosures made by the Board of Directors.
• Conclude on the appropriateness of the Board of Directors’ use of the going concern basis of accounting and, based on the audit evidence obtained, whether a material uncertainty exists related to events or conditions that may cast significant doubt on the Group’s ability to continue as a going concern. If we conclude that a material uncertainty exists, we are required to draw attention in our auditor’s report to the related disclosures in the consolidated financial statements or, if such disclosures are inadequate, to modify our opinion. Our conclusions are based on the audit evidence obtained up to the date of our auditor’s report. However, future events or conditions may cause the Group to cease to continue as a going concern
• Evaluate the overall presentation, structure and content of the consolidated financial statements, including the disclosures, and whether the consolidated financial statements represent the underlying transactions and events in a manner that achieves fair presentation.
• Obtain sufficient appropriate audit evidence regarding the financial information of the entities or business activities within the Group to express an opinion on the consolidated financial statements. We are responsible for the direction, supervision and performance of the Group audit. We remain solely responsible for our audit opinion.
We communicate with the Board of Directors regarding, among other matters, the planned scope and timing of the audit and significant audit findings, including any significant deficiencies in internal control that we identify during our audit.
We also provide the Board of Directors with a statement that we have complied with relevant ethical requirements regarding independence, and to communicate with them all relationships and other matters that may reasonably be thought to bear on our independence, and where applicable, related safeguards.
Independent Auditor's Report to the Shareholders of BMMI B.S.C (Continued)

Annual Report
2017
BMMI
25
From the matters communicated with Board of Directors, we determine those matters that were of most significance in the audit of the consolidated financial statements of the current period and are therefore the key audit matters. We describe these matters in our auditor’s report unless law or regulation precludes public disclosure about the matter or when, in extremely rare circumstances, we determine that a matter should not be communicated in our report because the adverse consequences of doing so would reasonably be expected to outweigh the public interest benefits of such communication.
Report on other Legal and Regulatory Requirements
We report that:a) as required by the Bahrain
Commercial Companies Law:i) the Company has maintained
proper accounting records and the consolidated financial statements are in agreement therewith;
ii) the financial information contained in the Report of the Board of Directors is consistent with the consolidated financial statements; and
iii) satisfactory explanations and information have been provided to us by management in response to all our requests; and
b) we are not aware of any violations of the Bahrain Commercial Companies Law, the Central Bank of Bahrain (CBB) Rule Book (applicable provisions of Volume 6) and CBB directives, regulations and associated resolutions, rules and procedures of the Bahrain Bourse or the terms of the Company’s memorandum and articles of association during the year ended 31 December 2017 that might have had a material adverse effect on the business of the Group or on its consolidated financial position.
The partner in charge of the audit resulting in this independent auditor’s report is Nader Rahimi.
Partner's Registration No. 11512 February 2018Manama, Kingdom of Bahrain
Independent Auditor's Report to the Shareholders of BMMI B.S.C (Continued)

Foundations for
Sustainable Growth
BMMI
26
Consolidated Statement of Financial PositionAs at 31 December 2017
Abdulla Hassan BuhindiChairman
Abdulla Mohammed JumaVice Chairman
Notes2017
BD2016
BDASSETSNon-current assetsProperty, plant and equipment 5 52,529,157 54,565,220 Investment properties 6 9,262,923 8,835,497 Investments in joint ventures 7 2,846,058 1,914,452 Investments 8 12,815,618 12,893,278 Loan to a joint venture 25 - 881,148 Goodwill - 119,528
77,453,756 79,209,123
Current assetsInventories 10 10,985,831 10,432,434 Trade and other receivables 11 22,905,583 18,062,561 Cash, bank balances and short-term deposits 12 3,093,958 2,409,183
36,985,372 30,904,178 TOTAL ASSETS 114,439,128 110,113,301
EQUITY AND LIABILITIESEquityShare capital 13 14,642,854 14,642,854 Treasury shares 14 (2,699,662) (2,699,662)Other reserves 16 13,487,496 12,271,918 Retained earnings 39,545,852 38,717,548 Equity attributable to equity holders of the BMMI B.S.C. 64,976,540 62,932,658 Non-controlling interests 4,964,692 6,628,015 Total equity 69,941,232 69,560,673
Non-current liabilitiesLoans and borrowings 17 19,082,611 20,029,755 Employees' end of service benefits 18 1,485,138 1,363,748
20,567,749 21,393,503
Current liabilitiesTrade and other payables 19 16,223,304 13,683,702 Loans and borrowings 17 5,112,625 2,288,147 Retentions payable 1,599,956 2,780,273 Bank overdrafts 12 895,452 364,767 Income tax payable 98,810 42,236
23,930,147 19,159,125 Total liabilities 44,497,896 40,552,628 TOTAL EQUITY AND LIABILITIES 114,439,128 110,113,301
The attached note 1 to 34 form an integral part of these Consolidated Financial Statements.

Annual Report
2017
BMMI
27
Consolidated Statement of IncomeFor the year ended 31 December 2017
Abdulla Hassan BuhindiChairman
Abdulla Mohammed JumaVice Chairman
Notes2017
BD2016
BD
Revenue 101,837,443 96,543,583
Cost of revenue 20 (73,451,285) (68,488,557)
GROSS PROFIT 28,386,158 28,055,026
Other operating income 21 2,882,855 1,662,483
Selling and distribution expenses (9,192,255) (8,472,305)
General and administrative expenses (15,563,483) (14,400,439)
PROFIT FROM OPERATIONS 6,513,275 6,844,765
Net share of results of joint ventures and an associate 7 1,117,577 (73,961)
Net investment income 22 755,441 842,032
Finance costs 20 (1,241,095) (897,284)
Impairment of goodwill (119,528) (100,000)
Net losses on investments carried at fair value through profit or loss 8 (4,613) (2,220)
Gain on disposal of investment properties 6 - 1,118,685
PROFIT BEFORE INCOME TAX 7,021,057 7,732,017
Income tax expense 23 (75,155) (119,604)
PROFIT OF THE GROUP FOR THE YEAR 20 6,945,902 7,612,413
of which loss attributable to non-controlling interests 1,663,323 1,805,967
PROFIT OF THE GROUP FOR THE YEAR ATTRIBUTABLE TOTHE EQUITY HOLDERS OF BMMI B.S.C. 8,609,225 9,418,380
BASIC AND DILUTED EARNINGS PER SHARE (FILS) 24 62 68
The attached note 1 to 34 form an integral part of these Consolidated Financial Statements.
Foundations for
Sustainable Growth
BMMI
28
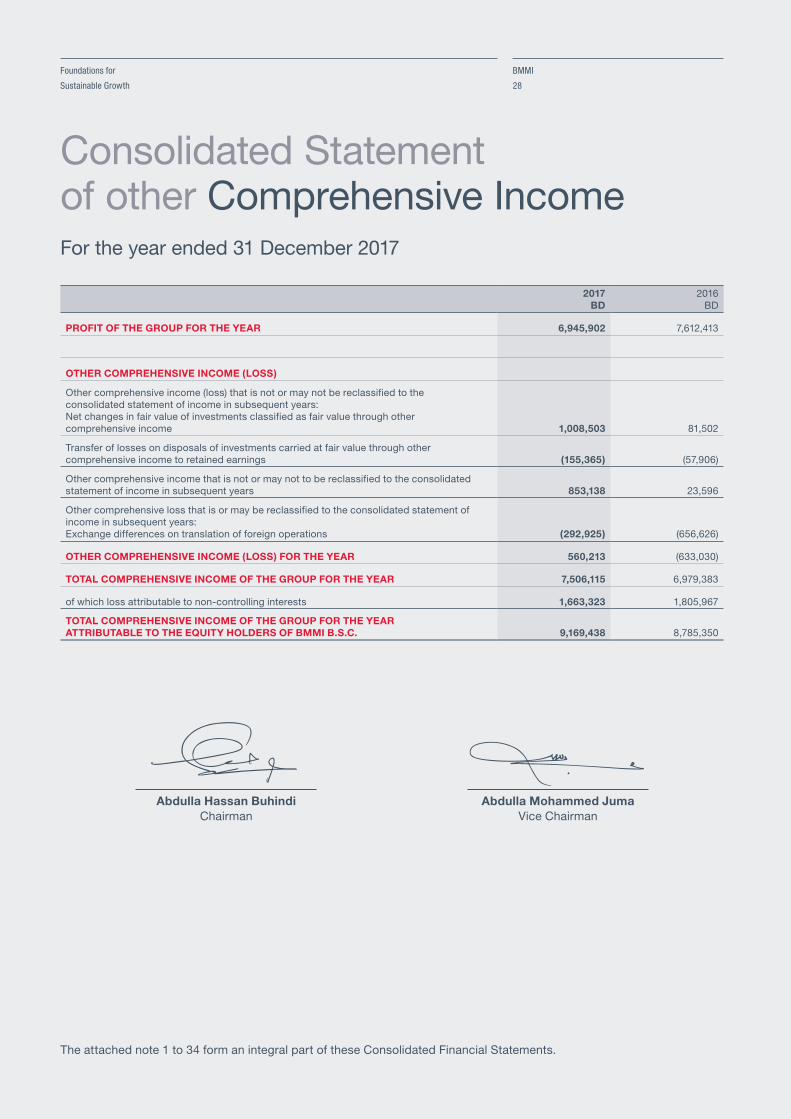
Consolidated Statement of other Comprehensive IncomeFor the year ended 31 December 2017
2017BD
2016BD
PROFIT OF THE GROUP FOR THE YEAR 6,945,902 7,612,413
OTHER COMPREHENSIVE INCOME (LOSS)
Other comprehensive income (loss) that is not or may not be reclassified to the consolidated statement of income in subsequent years:Net changes in fair value of investments classified as fair value through other comprehensive income 1,008,503 81,502
Transfer of losses on disposals of investments carried at fair value through other comprehensive income to retained earnings (155,365) (57,906)
Other comprehensive income that is not or may not to be reclassified to the consolidated statement of income in subsequent years 853,138 23,596
Other comprehensive loss that is or may be reclassified to the consolidated statement of income in subsequent years:Exchange differences on translation of foreign operations (292,925) (656,626)
OTHER COMPREHENSIVE INCOME (LOSS) FOR THE YEAR 560,213 (633,030)
TOTAL COMPREHENSIVE INCOME OF THE GROUP FOR THE YEAR 7,506,115 6,979,383
of which loss attributable to non-controlling interests 1,663,323 1,805,967
TOTAL COMPREHENSIVE INCOME OF THE GROUP FOR THE YEAR ATTRIBUTABLE TO THE EQUITY HOLDERS OF BMMI B.S.C. 9,169,438 8,785,350
Abdulla Hassan BuhindiChairman
Abdulla Mohammed JumaVice Chairman
The attached note 1 to 34 form an integral part of these Consolidated Financial Statements.

Annual Report
2017
BMMI
29
Consolidated Statement of Cash FlowsFor the year ended 31 December 2017
Notes2017
BD2016
BD
OPERATING ACTIVITIESProfit before income tax 7,021,057 7,732,017
Adjustments for:
Depreciation 5 3,764,296 2,899,350
Impairment of property, plant and equipment of GSS Gabon 5 1,169,678 -
Gain on disposal of investment properties 6 - (1,118,685)
Impairment of goodwill 119,528 100,000
Share of results of joint ventures and an associate 7 (1,117,577) 73,961 Net losses on investments carried at fair valuethrough profit or loss 8 4,613 2,220
Provision for slow moving and obsolete inventories 10 132,702 106,962
Allowance for impairment of trade receivables 11 406,282 573,765
Provision for employees’ end of service benefits 18 613,001 323,965
Finance costs 20 1,241,095 897,284
Net investment income 22 (755,441) (842,032)
Operating profit before working capital changes 12,599,234 10,748,807
Working capital changes:
Inventories (686,099) 694,303
Trade and other receivables (5,522,525) (546,472)
Trade and other payables 2,337,018 (5,554,843)
Cash generated from operations 8,727,628 5,341,795
Income tax paid (18,581) (341,060)
Directors' remuneration paid (139,000) (139,000)
Employees’ end of service benefits paid 18 (352,283) (228,957)Net movements in advances against employees' end of service benefits (139,328) 48,766
Net cash flows from operating activities 8,078,436 4,681,544
INVESTING ACTIVITIESPurchase of property, plant and equipment 5 (2,751,901) (2,555,127)
Additions to investment properties 6 (427,426) -
Proceeds from disposal of investment properties 6 - 1,518,685
Dividends received from joint ventures 7 1,074,679 305,303
Additional investment in a joint venture 7 (7,560) -
Proceeds from disposal of investments 8 926,185 537,668
Purchase of investments 8 - (277,053)
Dividends and interest received 1,028,662 1,194,186
Loan received from a joint venture - 263,474 Movement in short term deposit with original maturity of morethan three months 35,170 (35,170)
Acquisition of a subsidiary 29 - 1,286,655
Net cash flows (used in) from investing activities (122,191) 2,238,621
The attached note 1 to 34 form an integral part of these Consolidated Financial Statements.

Foundations for
Sustainable Growth
BMMI
30
Consolidated Statement of Cash Flows (Continued)
For the year ended 31 December 2017
Notes2017
BD2016
BD
FINANCING ACTIVITIES
Dividends paid to equity holders of BMMI B.S.C. 30 (6,780,331) (6,859,946)
Loans and borrowings availed 30 4,588,492 300,000
Loans and borrowings repaid 30 (2,711,158) (872,577)
Finance costs paid (1,244,736) (897,284)
Repayment of retentions payable 30 (1,180,317) (314,344)
Cash flows used in financing activities (7,328,050) (8,644,151)
NET INCREASE (DECREASE) IN CASH AND CASH EQUIVALENTS 628,195 (1,723,986)
Net foreign exchange differences (438,935) (622,393)
Cash and cash equivalents at 1 January 2,009,246 4,355,625
CASH AND CASH EQUIVALENTS AT 31 DECEMBER 12 2,198,506 2,009,246
Non-cash items
• Dividend and interest income receivable amounting to BD 273,221 (2016: BD 352,154) have been excluded from the movement of trade and other receivables.
• Transfer of loan to a joint venture amounting to BD 881,148 (2016: nil) to investments in joint ventures has been
excluded from additional investment in a joint venture. • Unclaimed dividends pertaining to prior years amounting to BD 156,857 (2016: BD 77,242) have been excluded from
the movement in trade and other payables. • Unpaid donations to relating to the Charity Reserve amounting to BD 188,368 (2016: BD 201,760) have been excluded
from the movements of trade and other payables.
The attached note 1 to 34 form an integral part of these Consolidated Financial Statements.

Annual Report
2017
BMMI
31
Consolidated Statement of Changes in EquityFor the year ended 31 December 2017
Equity attributable to equity holders of the BMMI B.S.C. Non-controlling
interestsBD
Totalequity
BDNotes
Sharecapital
BD
Treasuryshares
BD
Other reserves(note 16)
BD
Retainedearnings
BDTotal
BD
At 1 January 2017 14,642,854 (2,699,662) 12,271,918 38,717,548 62,932,658 6,628,015 69,560,673
Profit (loss) for the year - - - 8,609,225 8,609,225 (1,663,323) 6,945,902
Other comprehensive income - - 560,213 - 560,213 - 560,213
Net losses on disposal of investments carried at fair value through other comprehensive income - - 155,365 (155,365) - - -
Total comprehensive income (loss) - - 715,578 8,453,860 9,169,438 (1,663,323) 7,506,115
Final dividend for 2016 15 - - - (4,162,313) (4,162,313) - (4,162,313)
Interim dividend for 2017 15 - - - (2,774,875) (2,774,875) - (2,774,875)
Transfer to general reserve 16 - - 500,000 (500,000) - - -
Transfer to charity reserve - - 188,368 (188,368) - - -
Distribution to Alosra Charitable Foundation - - (188,368) - (188,368) - (188,368)
As at 31 December 2017 14,642,854 (2,699,662) 13,487,496 39,545,852 64,976,540 4,964,692 69,941,232
Retained earnings include non-distributable reserves amounting to BD 405,681 relating to the subsidiaries as at 31 December 2017.
The attached note 1 to 34 form an integral part of these Consolidated Financial Statements.
Foundations for
Sustainable Growth
BMMI
32
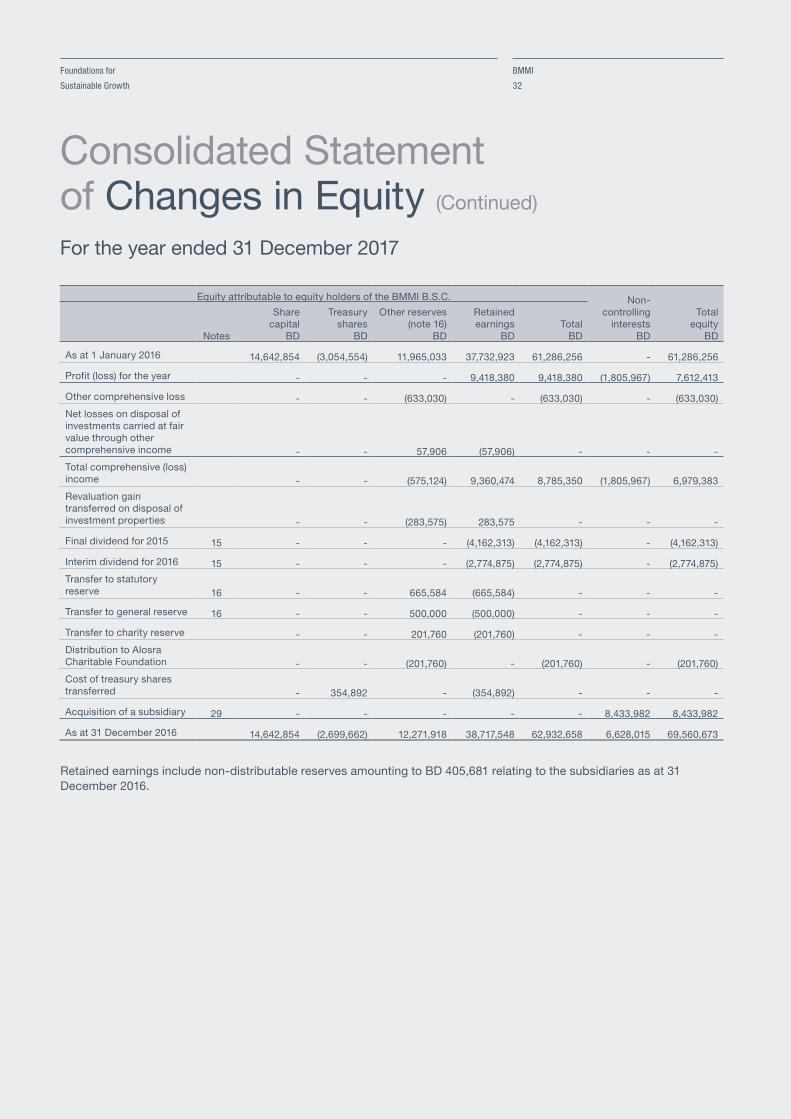
Consolidated Statement of Changes in Equity (Continued)
For the year ended 31 December 2017
Equity attributable to equity holders of the BMMI B.S.C. Non-controlling
interestsBD
Totalequity
BDNotes
Sharecapital
BD
Treasuryshares
BD
Other reserves(note 16)
BD
Retainedearnings
BDTotal
BD
As at 1 January 2016 14,642,854 (3,054,554) 11,965,033 37,732,923 61,286,256 - 61,286,256
Profit (loss) for the year - - - 9,418,380 9,418,380 (1,805,967) 7,612,413
Other comprehensive loss - - (633,030) - (633,030) - (633,030)
Net losses on disposal of investments carried at fair value through other comprehensive income - - 57,906 (57,906) - - -
Total comprehensive (loss) income - - (575,124) 9,360,474 8,785,350 (1,805,967) 6,979,383
Revaluation gain transferred on disposal of investment properties - - (283,575) 283,575 - - -
Final dividend for 2015 15 - - - (4,162,313) (4,162,313) - (4,162,313)
Interim dividend for 2016 15 - - - (2,774,875) (2,774,875) - (2,774,875)
Transfer to statutory reserve 16 - - 665,584 (665,584) - - -
Transfer to general reserve 16 - - 500,000 (500,000) - - -
Transfer to charity reserve - - 201,760 (201,760) - - -
Distribution to Alosra Charitable Foundation - - (201,760) - (201,760) - (201,760)
Cost of treasury shares transferred - 354,892 - (354,892) - - -
Acquisition of a subsidiary 29 - - - - - 8,433,982 8,433,982
As at 31 December 2016 14,642,854 (2,699,662) 12,271,918 38,717,548 62,932,658 6,628,015 69,560,673
Retained earnings include non-distributable reserves amounting to BD 405,681 relating to the subsidiaries as at 31 December 2016.

Annual Report
2017
BMMI
33
Notes to the ConsolidatedFinancial StatementsAs at 31 December 2017
1 CORPORATE INFORMATION AND ACTIVITIES
BMMI B.S.C. ("the Company") is a public joint stock company, whose shares are publicly traded on the Bahrain Bourse, incorporated in the Kingdom of Bahrain and is registered with the Ministry of Industry, Commerce and Tourism under commercial registration (CR) number 10999. The postal address of the Company's registered head office is P.O. Box 828, Sitra, Kingdom of Bahrain.
The principal activities of the Company and its subsidiaries (together "the Group") are the wholesale and retail of food, beverages and other consumable items. The Group also provides logistics and shipping services. The Group's operations are located in the Kingdom of Bahrain, State of Qatar, United Arab Emirates, Kingdom of Saudi Arabia, Republic of Iraq, United States of America, Republic of Djibouti, Gabonese Republic, Republic of Mali, Republic of South Sudan, Republic of Sudan, Republic of Ghana and Republic of Kenya.
The consolidated financial statements were authorised for issue in accordance with a resolution of the Board of Directors on 12 February 2018.
The subsidiaries of the Company are as follows:
Name
Ownership interest Country of incorporation Principal activities2017 2016
Nader Trading Company W.L.L. 100% 100% Kingdom of BahrainManaging various consumer agencies.
Alosra Supermarket W.L.L. 100% 100% Kingdom of Bahrain Supermarket management.
Alosra Supermarket International Company 100% 100% Kingdom of Saudi Arabia Supermarket management.
Banader Hotels Company B.S.C. 54% 54% Kingdom of BahrainOwnership and operations of Downtown Rotana Bahrain.
BMMI s.a.r.l. 100% 100% Republic of DjiboutiAir transport activity, storage and distribution, import and export.
Bayader Company Restaurant Management S.P.C. 100% 100% Kingdom of BahrainManagement services for hotels and restaurants for tourists.
Fasttrack Export L.L.C. 100% 100% State of Florida, U.S.A.No business activities have commenced yet.
Ardh Al Ahad For General Trading L.L.C. 100% 100% Republic of IraqNo business activities have commenced yet.
BMMI International Holding S.P.C. 100% 100% Kingdom of Bahrain
Holding company for a group of commercial, industrial or service companies.
BMMI International Holding S.P.C. has the following subsidiaries at the reporting date:
Global Sourcing and Supply East Holding S.P.C. 100% 100% Kingdom of Bahrain
Holding company for a group of commercial, industrial or service companies.
Global Sourcing and Supply South Holding S.P.C. 100% 100% Kingdom of Bahrain
Holding company for a group of commercial, industrial or service companies.
Global Sourcing and Supply North Holding S.P.C. 100% 100% Kingdom of Bahrain
Holding company for a group of commercial, industrial or service companies.
Global Sourcing and Supply West Holding S.P.C. 100% 100% Kingdom of Bahrain
Holding company for a group of commercial, industrial or service companies.

Foundations for
Sustainable Growth
BMMI
34
1 CORPORATE INFORMATION AND ACTIVITIES (Continued)
Global Sourcing and Supply East Holding S.P.C. has the following subsidiaries at the reporting date:
Name
Ownership interest Country of incorporation Principal activities2017 2016
Global Sourcing and Supply Services Co. Limited (ODSCO Catering JV) 100% 100% Republic of Sudan
Provisioning of catering and housekeeping services.
Global Sourcing and Supply Services Co. Limited * 100% * 100% Republic of South SudanProvisioning of catering and housekeeping services.
Global Sourcing and Supply Kenya Limited 100% 100% Republic of KenyaProvision of catering and beverage services.
Global Sourcing and Supply South Holding S.P.C. has the following subsidiary at the reporting date:
GSS Gabon SA** 100% 100% Gabonese RepublicSales and distribution of foods products.
Global Sourcing and Supply North Holding S.P.C. has the following subsidiary at the reporting date:
GSS Mali SA 100% 100% Republic of MaliProvisioning of catering and housekeeping services.
Global Sourcing and Supply West Holding S.P.C. has the following subsidiary at the reporting date:
International Sourcing and Supply Limited – Ghana 100% 100% Republic of GhanaProvisioning of catering, janitorial and other related services.
*Representseffectiveownershipinterest.
**TheBoardofDirectorsofGSSInternationalHoldingS.P.C.decidedtoceasetheoperationsandplacedGSSGabonSAundervoluntarilyliquidation
effective1October2017.
The Group's joint ventures are as follows:
Name
Ownership interestCountry of incorporation Principal activities2017 2016
Qatar & Bahrain International Company W.L.L. 50% 50% State of QatarManaging various consumer agencies.
B & B Logistics W.L.L. 50% 50% Kingdom of BahrainConstructing and operating of warehouses.
Inchcape Shipping Services W.L.L. 50% 50% Kingdom of Bahrain Rendering of shipping services.
Zad Marketing & Distribution W.L.L. 50% 50% State of QatarFood and household goods wholesale and distributor.
UQLC Facility Management Company Limited 50% 50% United Arab Emirates
Provision of facility management, business consultancy, management consultancy overseas and to act as a holding company.
Notes to the ConsolidatedFinancial Statements (Continued)
As at 31 December 2017

Annual Report
2017
BMMI
35
Notes to the ConsolidatedFinancial Statements (Continued)
As at 31 December 2017
2 SIGNIFICANT ACCOUNTING POLICIES
Basis of preparationThe consolidated financial statements are prepared under the historical cost basis, except for investments and investment properties that have been measured at fair value.
Statement of complianceThe consolidated financial statements of the Group have been prepared in accordance with the International Financial Reporting Standards (IFRSs), as issued by the International Accounting Standards Board (IASB), and in conformity with the Bahrain Commercial Companies Law, the Central Bank of Bahrain (CBB) Rule Book (applicable provisions of Volume 6) and CBB directives, regulations and associated resolutions, rules and procedures of the Bahrain Bourse.
Presentational and functional currencyThe consolidated financial statements have been prepared in Bahraini Dinars (BD), being the presentational currency of Group and functional currency of the Company. Basis of consolidationThe consolidated financial statements comprise the financial statements of the BMMI B.S.C. and its subsidiaries as at 31 December. Control is achieved when the Group is exposed, or has rights, to variable returns from its involvement with the investee and has the ability to affect those returns through its power over the investee. Specifically, the Group controls an investee if and only if the Group has:
• power over the investee (i.e. existing rights that give it the current ability to direct the relevant activities of the investee);• exposure, or rights, to variable returns from its involvement with the investee; and• the ability to use its power over the investee to affect its returns.
Generally, there is a presumption that a majority of voting rights result in control. To support this presumption and when the Group has less than a majority of the voting or similar rights of an investee, the Group considers all relevant facts and circumstances in assessing whether it has power over an investee, including:
• the contractual arrangement with the other vote holders of the investee;• rights arising from other contractual arrangements; and • the Group’s voting rights and potential voting rights.
The Group re-assesses whether or not it controls an investee if facts and circumstances indicate that there are changes to one or more of the three elements of control. Consolidation of a subsidiary begins when the Group obtains control over the subsidiary and ceases when the Group loses control of the subsidiary. Assets, liabilities, income and expenses of a subsidiary acquired or disposed of during the year are included in the consolidated financial statements from the date the Group obtains control until the date the Group ceases to control the subsidiary.
Profit or loss and each component of other comprehensive income (OCI) are attributed to the equity holders of the parent of the Group and to the non-controlling interests, even if this results in the non-controlling interests having a deficit balance. When necessary, adjustments are made to the financial statements of subsidiaries to bring their accounting policies into line with the Group’s accounting policies. All intra-group assets and liabilities, equity, income, expenses and cash flows relating to transactions between members of the Group are eliminated in full on consolidation.
A change in the ownership interest of a subsidiary, without a loss of control, is accounted for as an equity transaction. If the Group losses control over a subsidiary, it derecognises the related assets (including goodwill), liabilities, non-controlling interest and other components of equity while any resultant gain or loss is recognised in the consolidated statement of income. Any investment retained is recognised at fair value.
Foundations for
Sustainable Growth
BMMI
36
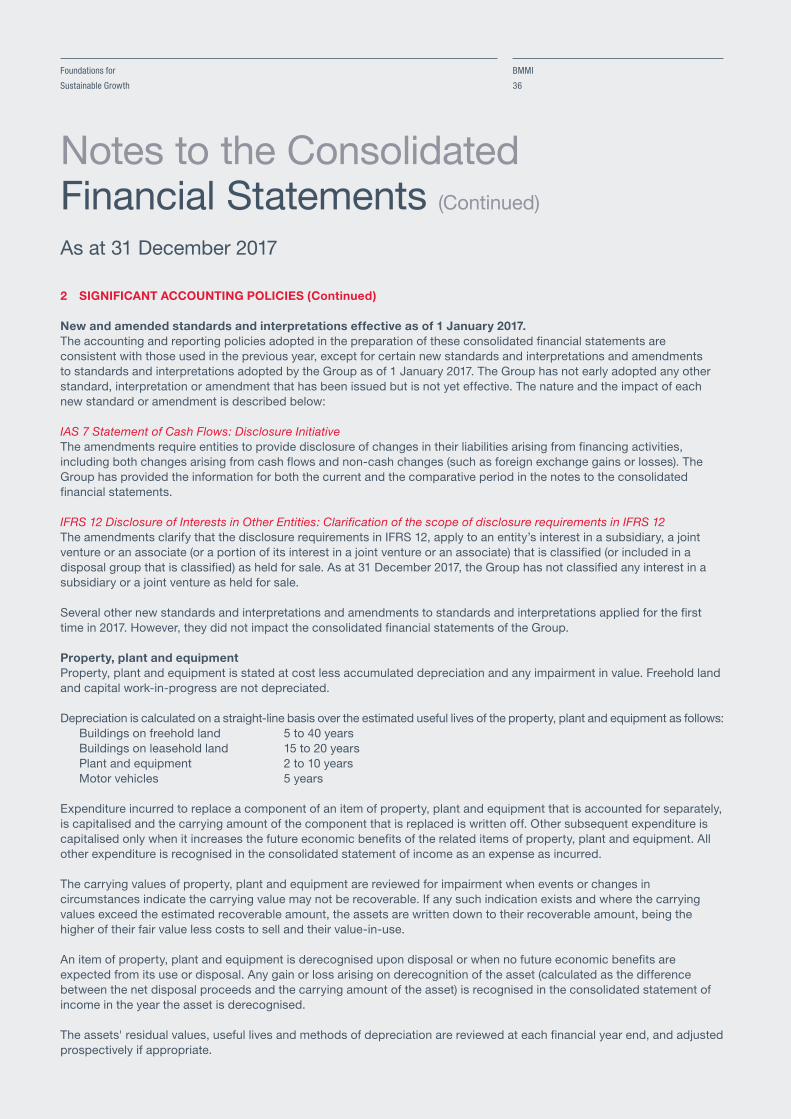
2 SIGNIFICANT ACCOUNTING POLICIES (Continued)
New and amended standards and interpretations effective as of 1 January 2017.The accounting and reporting policies adopted in the preparation of these consolidated financial statements are consistent with those used in the previous year, except for certain new standards and interpretations and amendments to standards and interpretations adopted by the Group as of 1 January 2017. The Group has not early adopted any other standard, interpretation or amendment that has been issued but is not yet effective. The nature and the impact of each new standard or amendment is described below:
IAS7StatementofCashFlows:DisclosureInitiativeThe amendments require entities to provide disclosure of changes in their liabilities arising from financing activities, including both changes arising from cash flows and non-cash changes (such as foreign exchange gains or losses). The Group has provided the information for both the current and the comparative period in the notes to the consolidated financial statements.
IFRS12DisclosureofInterestsinOtherEntities:ClarificationofthescopeofdisclosurerequirementsinIFRS12The amendments clarify that the disclosure requirements in IFRS 12, apply to an entity’s interest in a subsidiary, a joint venture or an associate (or a portion of its interest in a joint venture or an associate) that is classified (or included in a disposal group that is classified) as held for sale. As at 31 December 2017, the Group has not classified any interest in a subsidiary or a joint venture as held for sale.
Several other new standards and interpretations and amendments to standards and interpretations applied for the first time in 2017. However, they did not impact the consolidated financial statements of the Group.
Property, plant and equipment Property, plant and equipment is stated at cost less accumulated depreciation and any impairment in value. Freehold land and capital work-in-progress are not depreciated.
Depreciation is calculated on a straight-line basis over the estimated useful lives of the property, plant and equipment as follows: Buildings on freehold land 5 to 40 years Buildings on leasehold land 15 to 20 years Plant and equipment 2 to 10 years Motor vehicles 5 years Expenditure incurred to replace a component of an item of property, plant and equipment that is accounted for separately, is capitalised and the carrying amount of the component that is replaced is written off. Other subsequent expenditure is capitalised only when it increases the future economic benefits of the related items of property, plant and equipment. All other expenditure is recognised in the consolidated statement of income as an expense as incurred.
The carrying values of property, plant and equipment are reviewed for impairment when events or changes in circumstances indicate the carrying value may not be recoverable. If any such indication exists and where the carrying values exceed the estimated recoverable amount, the assets are written down to their recoverable amount, being the higher of their fair value less costs to sell and their value-in-use.
An item of property, plant and equipment is derecognised upon disposal or when no future economic benefits are expected from its use or disposal. Any gain or loss arising on derecognition of the asset (calculated as the difference between the net disposal proceeds and the carrying amount of the asset) is recognised in the consolidated statement of income in the year the asset is derecognised.
The assets' residual values, useful lives and methods of depreciation are reviewed at each financial year end, and adjusted prospectively if appropriate.
Notes to the ConsolidatedFinancial Statements (Continued)
As at 31 December 2017

Annual Report
2017
BMMI
37
2 SIGNIFICANT ACCOUNTING POLICIES (Continued)
GoodwillThe goodwill was recognised on acquisition of BMMI International Holding S.P.C.
Goodwill is initially measured at cost, being the excess of the aggregate of the consideration transferred and the amount recognised for non-controlling interests, and any previous interest held, over the net identifiable assets acquired and liabilities assumed.
After initial recognition, goodwill is measured at cost less any accumulated impairment losses. For the purpose of impairment testing, goodwill acquired in a business combination is, from the acquisition date, allocated to each of the Group’s cash-generating units (CGUs) that are expected to benefit from the combination, irrespective of whether other assets or liabilities of the acquiree are assigned to those CGUs.
InventoriesInventories are valued at the lower of cost and net realisable value. Costs include those expenses incurred in bringing each product to its present location and condition and is determined on a first-in, first-out basis with the exception of goods for sale - retail, the cost for which is determined on weighted average basis.
Net realisable value is the estimated selling price in the ordinary course of business, less estimated costs of completion and the estimated costs necessary to make the sale.
Impairment of non-financial assetsThe Group assesses at each reporting date whether there is an indication that an asset may be impaired. If any indication exists, or when annual impairment testing for an asset is required, the Group estimates the asset’s recoverable amount. An asset’s recoverable amount is the higher of an asset’s or cash-generating unit’s (CGU) fair value less costs to sell and its value in use and is determined for an individual asset, unless the asset does not generate cash inflows that are largely independent of those from other assets or groups of assets.
Where the carrying amount of an asset or CGU exceeds its recoverable amount, the asset is considered impaired and is written down to its recoverable amount. In assessing value-in-use, the estimated future cash flows are discounted to their present value using a pre-tax discount rate that reflects current market assessments of the time value of money and the risks specific to the asset. In determining fair value less costs to sell, an appropriate valuation model is used. These calculations are corroborated by earnings multiples quoted share prices or other available fair value indicators.
An assessment is made at each reporting date as to whether there is any indication that previously recognised impairment losses may no longer exist or may have decreased. If such indication exists, the Group estimates the asset’s or CGU’s recoverable amount. A previously recognised impairment loss is reversed only if there has been a change in the assumptions used to determine the asset’s recoverable amount since the last impairment loss was recognised. The reversal is limited so that the carrying amount of the asset does not exceed its recoverable amount, nor exceed the carrying amount that would have been determined, net of depreciation, had no impairment loss been recognised for the asset in prior years. Such reversal is recognised in the consolidated statement of income.
Notes to the ConsolidatedFinancial Statements (Continued)
As at 31 December 2017

Foundations for
Sustainable Growth
BMMI
38
2 SIGNIFICANT ACCOUNTING POLICIES (Continued)
Impairment of non-financial assets (Continued)The following criteria are also applied in assessing impairment of goodwill. Goodwill is tested for impairment annually (as at 31 December) and when circumstances indicate that the carrying value may be impaired.
Impairment is determined for goodwill by assessing the recoverable amount of each cash-generating unit (or group of cash-generating units) to which the goodwill relates. Where the recoverable amount of the cash-generating unit is less than its carrying amount, an impairment loss is recognised in the consolidated statement of income, impairment losses relating to goodwill cannot be reversed in future periods.
Investment propertiesProperties held for either rental income or capital appreciation or both purposes are classified as investment properties. Investment properties are measured initially at cost, including transaction costs. The carrying amount includes the cost of replacing part of an existing investment property at the time that cost is incurred if the recognition criteria are met; and excludes the costs of day to day servicing of an investment property. Subsequent to initial recognition, investment properties are stated at fair value, which reflects market conditions at the reporting date. Gains or losses arising from changes in the fair values of investment properties are recognised in the consolidated statement of income in the year in which they arise.
Investment properties are derecognised when either they are disposed off or when the investment property is permanentlywithdrawn from use and no future economic benefit is expected from its disposal. The difference between the net disposal proceeds and the carrying amount of the asset is recognised in the consolidated statement of income in the year of derecognition.
Transfers are made to or from investment properties only when there is a change in use. For a transfer from investment properties to owner occupied properties, the deemed cost for subsequent accounting is the fair value at the date of change in use. If owner occupied properties becomes investment properties, the Group accounts for such properties in accordance with the policy stated under property, plant and equipment up to the date of change in use.
Investments in joint venturesA joint venture is a type of joint arrangement whereby the parties that have joint control of the arrangement have rights to the net assets of the joint venture. Joint control is the contractually agreed sharing of control of an arrangement, which exists only when decisions about the relevant activities require unanimous consent of the parties sharing control.
The considerations made in determining joint control are similar to those necessary to determine control over subsidiaries.
The Group’s investments in joint ventures are accounted for using the equity method.
Under the equity method, the investment in a joint venture is initially recognised at cost. The carrying amount of the investment is adjusted to recognise changes in the Group’s share of net assets of the joint venture since the acquisition date. Goodwill relating to the joint venture is included in the carrying amount of the investment and is neither amortised nor individually tested for impairment.
The consolidated statement of income reflects the Group’s share of the results of operations of the joint venture. Any change in other comprehensive income of those investees is presented as part of the consolidated statement of other comprehensive income. In addition, when there has been a change recognised directly in the equity of the joint venture, the Group recognises its share of any changes, when applicable, in the consolidated statement of changes in equity. Unrealised gains and losses resulting from transactions between the Group and the joint venture are eliminated to the extent of the interest in the joint venture.
Notes to the ConsolidatedFinancial Statements (Continued)
As at 31 December 2017

Annual Report
2017
BMMI
39
2 SIGNIFICANT ACCOUNTING POLICIES (Continued)
Investments in joint ventures (Continued)The aggregate of the Group’s share of results of joint ventures is shown on the face of the consolidated statement of income outside operating profit and represents results after tax and non-controlling interests in the subsidiaries of the joint venture. The financial statements of the joint ventures are prepared for the same reporting period as the Group. When necessary, adjustments are made to bring the accounting policies in line with those of the Group.
After application of the equity method, the Group determines whether it is necessary to recognise an impairment loss on its investment in the joint venture. At each reporting date, the Group determines whether there is objective evidence that the investment in the joint venture is impaired. If there is such evidence, the Group calculates the amount of impairment as the difference between the recoverable amount of the joint venture and its carrying value, then recognises the loss as ‘share of results of joint ventures’ in the consolidated statement of income.
Upon loss of joint control over the joint venture, the Group measures and recognises any retained investment at its fair value. Any difference between the carrying amount of the joint venture upon loss of joint control and the fair value of the retained investment and proceeds from disposal is recognised in the consolidated statement of income.
Current versus non-current classificationThe Group presents assets and liabilities in the consolidated statement of financial position based on a current/non-current classification.
An asset is current when it is:
• expected to be realised or intended to be sold or consumed in the normal operating cycle;• held primarily for the purpose of trading;• expected to be realised within twelve months after the reporting period; or• cash or cash equivalent unless restricted from being exchanged or used to settle a liability for at least
twelve months after the reporting period.
All other assets are classified as non-current.
A liability is current when:
• it is expected to be settled in the normal operating cycle;• it is held primarily for the purpose of trading;• it is due to be settled within twelve months after the reporting period; or• there is no unconditional right to defer the settlement of the liability for at least twelve months after the reporting period.
All other liabilities are classified as non-current.
Cash, bank balances and short-term depositsCash, bank balances and short-term deposits included in the consolidated statement of financial position comprise of bank balances, cash in hand and short-term deposits with original maturities of three months or less, which are subject to an insignificant risk of changes in value, net of outstanding bank overdrafts.
Financial instruments - recognition and measurementA financial instrument is any contract that gives rise to a financial asset of one entity and a financial liability or equity instrument of another entity.
Notes to the ConsolidatedFinancial Statements (Continued)
As at 31 December 2017

Foundations for
Sustainable Growth
BMMI
40
2 SIGNIFICANT ACCOUNTING POLICIES (Continued)
Financial Instruments - Recognition and Measurement (Continued)Financial assets Initialrecognition,measurementandsubsequentmeasurementThe Group early adopted IFRS 9 Financial Instrument, with effect from 1 January 2011. Pursuant to that adoption, the Group classifies its financial assets in the following categories: those measured at amortised cost and those measured at fair value. This classification depends on both the contractual characteristics of the assets and the business model adopted for their management.
The Group's financial assets include investments, loans to a joint venture, a portion of trade and other receivables and cash, bank balances and short term-deposits.
All regular way purchases or sales of financial assets are recognised and derecognised on a trade date basis. Regular way purchases or sales are purchases or sales of financial assets that require delivery of assets within the time established by regulation or convention in the marketplace
Financial assets measured at amortised costAll recognised financial assets are subsequently measured in their entirety at either amortised cost or fair value, depending on the classification of the financial assets as described below:
A financial asset is classified as ‘amortised cost’ only if both of the following criteria are met:
• the asset is held within a business model whose objective is to hold assets in order to collect contractual cash flows; and• the contractual terms of the instrument give rise on specified dates to cash flows that are solely payments of principal
and interest on the principal amount outstanding.
Financial assets meeting these criteria are measured initially at fair value plus transaction costs that are directly attributable to the acquisition of the financial assets. They are subsequently measured at amortised cost using the effective interest method (EIR) less any impairment.
The Group has not designated any debt instruments at amortised cost.
LoansandreceivablesThis category is most relevant to the Group. Loans and receivables are non-derivative financial assets with fixed or determinable payments that are not quoted in an active market. After initial measurement, such financial assets are subsequently measured at amortised cost using the EIR, less impairment. Amortised cost is calculated by taking into account any discount or premium on acquisition and fee or costs that are an integral part of the EIR. Gains and losses are recognised in the consolidated statement of income when the loans and receivables are derecognised or impaired, as well as through the amortisation process. Bad debts are written off in the consolidated statement of income when identified.
Financial assets measured at fair valueFinancial assets classified as Fair Value through Profit or Loss (FVTPL)Investments in equity instruments are classified as FVTPL, unless the Group designates an investment that is not held-for-trading as fair value through other comprehensive income (FVTOCI) on initial recognition.
Debt instruments that do not meet the amortised cost criteria are measured at FVTPL. In addition, debt instruments that meet the amortised cost criteria but are designated as at FVTPL are measured at fair value through profit or loss. A debt instrument may be designated as FVTPL upon initial recognition if such designation eliminates or significantly reduces a measurement or recognition inconsistency that would arise from measuring assets or liabilities or recognising gains or losses on them on different basis. The Group designated its debt instruments as FVTPL.
Notes to the ConsolidatedFinancial Statements (Continued)
As at 31 December 2017
Annual Report
2017
BMMI
41
2 SIGNIFICANT ACCOUNTING POLICIES (Continued)
Financial Instruments - Recognition and Measurement (Continued)Financial assets (Continued)Initial recognition, measurement and subsequent measurement (Continued)Financial assets measured at fair value (Continued)Debt instruments are reclassified from amortised cost to FVTPL when the business model is changed such that the amortised cost criteria are no longer met. Reclassification of debt instruments that are designated as FVTPL on initial recognition is not allowed.
Financial assets at FVTPL are measured at fair value at the end of each reporting period, with any gains or losses arising on remeasurement recognised in the consolidated statement of income.
Interest income on debt instruments designated as FVTPL is included in the consolidated statement of income. Dividend income on investments in equity instruments measured at FVTPL is recognised in the consolidated statement of income when the Group's right to receive the dividends is established in accordance with IAS 18 Revenue. FinancialassetsatFairValuethroughOtherComprehensiveIncome(FVTOCI)On initial recognition, the Group can make an irrevocable election (on an instrument-by-instrument basis) to designate investments in equity instruments as at FVTOCI. Designation at FVTOCI is not permitted if the equity investment is held-for-trading. A financial asset is held-for-trading if: • it has been acquired principally for the purpose of selling it in the near term; or• on initial recognition it is part of a portfolio of identified financial instruments that the Group manages together
and has evidence of a recent actual pattern of short-term profit-taking; or• it is a derivative that is not designated and effective as a hedging instrument or a financial guarantee.
Investments in equity instruments at FVTOCI are initially measured at fair value plus transaction costs. Subsequently, they are measured at fair value with gains and losses arising from changes in fair value recognised in the consolidated statement of other comprehensive income and accumulated in the investments revaluation reserve. The cumulative gain or loss will not be reclassified to the consolidated statement of income on disposal of the investments.
The Group has designated most of its investments in equity instruments at FVTOCI on initial application of IFRS 9, as the Board of Directors believes that this provides a more meaningful presentation for medium or long-term strategic investments, than reflecting changes in fair value immediately in the consolidated statement of income.
Dividends on these investments in equity instruments are recognised in the consolidated statement of income when the Group's right to receive the dividends is established in accordance with IAS 18 Revenue, unless the dividends clearly recover part of the cost of the investment.
Derecognition of financial assetsA financial asset (or, where applicable a part of a financial asset or part of a group of similar financial assets) is derecognised when:
• the rights to receive cash flows from the asset have expired or• the Group has transferred its rights to receive cash flows from the asset or has assumed an obligation to pay the
received cash flows in full without material delay to a third party under a ‘pass-through’ arrangement and either (a) the Group has transferred substantially all the risks and rewards of the asset, or (b) the Group has neither transferred nor retained substantially all the risks and rewards of the asset, but has
transferred control of the asset.
Notes to the ConsolidatedFinancial Statements (Continued)
As at 31 December 2017

Foundations for
Sustainable Growth
BMMI
42
2 SIGNIFICANT ACCOUNTING POLICIES (Continued)
Financial Instruments - Recognition and Measurement (Continued)Financial assets (Continued)Derecognition of financial assets (Continued)On derecognition of a financial asset measured at amortised cost or at fair value through profit or loss, the difference between the asset's carrying amount and the sum of the consideration received and receivable is recognised in the consolidated statement of income. On derecognition of a financial asset that is classified as FVTOCI, the cumulative gain or loss previously accumulated in the investments revaluation reserve is not reclassified to the consolidated statement of income, but is reclassified to retained earnings.
Impairment of financial assets For financial assets carried at amortised cost, the Group first assesses whether impairment exists individually for financial assets that are individually significant, or collectively for financial assets that are not individually significant. If the Group determines that no objective evidence of impairment exists for an individually assessed financial asset, whether significant or not, it includes the asset in a group of financial assets with similar credit risk characteristics and collectively assesses them for impairment. Assets that are individually assessed for impairment and for which an impairment loss is, or continues to be, recognised are not included in a collective assessment of impairment.
The amount of any impairment loss identified is measured as the difference between the asset’s carrying amount and the present value of estimated future cash flows (excluding future expected credit losses that have not yet been incurred). The present value of the estimated future cash flows is discounted at the financial asset’s original EIR.
The carrying amount of the asset is reduced through the use of an allowance account and the loss is recognised in the consolidated statement of income. Interest income (recorded as finance income in the consolidated statement of income) continues to be accrued on the reduced carrying amount and is accrued using the rate of interest used to discount the future cash flows for the purpose of measuring the impairment loss. Loans together with the associated allowance are written off when there is no realistic prospect of future recovery and all collateral has been realised or has been transferred to the Group. If, in a subsequent year, the amount of the estimated impairment loss increases or decreases because of an event occurring after the impairment was recognised, the previously recognised impairment loss is increased or reduced by adjusting the allowance account. If a write-off is later recovered, the recovery is credited to finance costs in the consolidated statement of income.
Financial liabilities Initial recognition and measurementFinancial liabilities within the scope of IFRS 9 are initially classified as financial liabilities at amortised cost and measured at fair value net of transaction cost. The Group's financial liabilities include loans and borrowings, retentions payable, a portion of trade and other payables and bank overdrafts.
Subsequent measurementFinancial liabilities within the scope of IFRS 9 are subsequently measured at either amortised cost using the EIR or at FVTPL.
Loansandborrowings After initial recognition, interest bearing loans and borrowings are subsequently measured at amortised cost using the EIR. Gains and losses are recognised in the consolidated statement of income when the liabilities are derecognised as well as through the EIR amortisation process.
All borrowing costs are expensed in the period they occur.
Notes to the ConsolidatedFinancial Statements (Continued)
As at 31 December 2017

Annual Report
2017
BMMI
43
2 SIGNIFICANT ACCOUNTING POLICIES (Continued)
Fair value measurement (Continued)Financial liabilities (Continued)Financialliabilitiesatamortisedcost-tradeandotherpayablesLiabilities for trade and other payables are subsequently measured at amortised cost, which is the fair value of the consideration to be paid in the future for goods and services received, whether or not billed to the Group.
Derecognition of financial liabilities A financial liability is derecognised when the obligation under the liability is discharged or cancelled, or expires. When an existing financial liability is replaced by another from the same lender on substantially different terms, or the terms of an existing liability are substantially modified, such an exchange or modification is treated as the derecognition of the original liability and the recognition of a new liability. The difference in the respective carrying amounts is recognised in the consolidated statement of income.
Offsetting of financial instrumentsFinancial assets and financial liabilities are offset and the net amount reported in the consolidated statement of financial position if, and only if, there is a currently enforceable legal right to offset the recognised amounts and there is an intention to settle on a net basis, or to realise the assets and settle the liabilities simultaneously. Amortised cost of financial instrumentsThe EIR is a method of calculating the amortised cost of a debt instrument and of allocating interest income over the relevant period. The EIR is the rate that exactly discounts estimated future cash receipts (including all fees and points paid or received that form an integral part of the EIR, transaction costs and other premiums or discounts) through the expected life of the debt instrument, or, where appropriate, a shorter period, to the net carrying amount on initial recognition.
Fair value measurement The Group measures financial instruments, such as, investments and non-financial assets such as investment properties, at fair value at each reporting date.
Fair value is the price that would be received to sell an asset or paid to transfer a liability in an orderly transaction between market participants at the measurement date. The fair value measurement is based on the presumption that the transaction to sell the asset or transfer the liability takes place either:
• in the principal market for the asset or liability, or• in the absence of a principal market, in the most advantageous market for the asset or liability. The principal or the most advantageous market must be accessible by the Group.
The fair value of an asset or a liability is measured using the assumptions that market participants would use when pricing the asset or liability, assuming that market participants act in their economic best interest.
A fair value measurement of a non-financial asset takes into account a market participant's ability to generate economic benefits by using the asset in its highest and best use or by selling it to another market participant that would use the asset in its highest and best use.
The Group uses valuation techniques that are appropriate in the circumstances and for which sufficient data are available to measure fair value, maximising the use of relevant observable inputs and minimising the use of unobservable inputs.
Notes to the ConsolidatedFinancial Statements (Continued)
As at 31 December 2017

Foundations for
Sustainable Growth
BMMI
44
2 SIGNIFICANT ACCOUNTING POLICIES (Continued)
Fair value measurement (Continued)All assets and liabilities for which fair value is measured or disclosed in the consolidated financial statements are categorised within the fair value hierarchy, described as follows, based on the lowest level input that is significant to the fair value measurement as a whole:
• Level 1 – Quoted (unadjusted) market prices in active markets for identical assets or liabilities;• Level 2 – Valuation techniques for which the lowest level input that is significant to the fair value measurement is
directly or indirectly observable; and• Level 3 – Valuation techniques for which the lowest level input that is significant to the fair value measurement is
unobservable. For assets and liabilities that are recognised in the consolidated financial statements on a recurring basis, the Group determines whether transfers have occurred between Levels in the hierarchy by re-assessing categorisation (based on the lowest level input that is significant to the fair value measurement as a whole) at the end of each reporting period.
The Group’s Management, with discussion with the Investment and Finance Committee, determines the policies and procedures for both recurring fair value measurement, such as investment properties and unquoted investments, and for non-recurring measurement, such as assets held for distribution in discontinued operation. External valuers are involved for valuation of significant assets, such as investment properties and investments, and significant liabilities, such as contingent consideration. Involvement of external valuers is decided upon annually after discussion with the Company's Board of Directors. Selection criteria include market knowledge, reputation, independence and whether professional standards are maintained.
For the purpose of fair value disclosures, the Group has determined classes of assets and liabilities on the basis of the nature, characteristics and risks of the asset or liability and the level of the fair value hierarchy as explained above.
Treasury sharesOwn equity instruments which are reacquired (treasury shares) are deducted from equity. No gain or loss is recognised in the consolidated statement of income on the purchase, sale, issue or cancellation of the Group's treasury shares.
Employees' end of service benefitsThe Group makes contributions to relevant government schemes for its employees in each jurisdiction, calculated as a percentage of the employees' salaries. The Group's obligations are limited to these contributions, which are expensed when due. The Group also provides for end of service benefits to its expatriate employees. The entitlement to these benefits is based upon the employee's final salary and length of service. The expected costs of these benefits are accrued over the period of employment. LeasesOperatingleases-GroupasalesseeA lease is classified at the inception date as a finance lease or an operating lease. Leases where the lessor retains substantially all the risks and benefits of ownership of the asset are classified as operating leases. Operating lease payments are recognised as an expense in the consolidated statement of income on a straight-line basis over the lease term.
Notes to the ConsolidatedFinancial Statements (Continued)
As at 31 December 2017
Annual Report
2017
BMMI
45
2 SIGNIFICANT ACCOUNTING POLICIES (Continued)
Fair value measurement (Continued)Operatingleases-GroupasalessorLeases in which the Group retains substantially all the risks and benefits of ownership of the asset are classified as operating leases. Initial direct costs incurred in negotiating an operating lease are added to the carrying amount of the leased asset and recognised over the lease term on the same bases as rental income.
Revenue recognitionRevenue is recognised to the extent that it is probable that the economic benefits will flow to the Group and the revenue can be reliably measured, regardless of when the payment is being made. Revenue is measured at the fair value of the consideration received or receivable, taking into account contractually defined terms of payment and excluding taxes or duty. The Group has concluded that it is the principal in all of its revenue arrangements since it is the primary obligor in all the revenue arrangements, has pricing latitude and is also exposed to inventory and credit risks. The specific recognition criteria described below must also be met before revenue is recognised: SaleofgoodsRevenue from the sale of goods is recognised when the significant risks and rewards of ownership of the goods have passed to the buyer, usually on delivery of the goods.
RenderingofservicesRevenue from rendering of services is recognised when the outcome of the transaction can be estimated reliably, by reference to the stage of completion of the transaction at the reporting date. RentalincomeRental income arising from operating leases and sub-leases are recognised on a straight-line basis over the lease term and is included in other operating income in the consolidated statement of income due to its operating nature. InterestincomeFor all financial instruments measured at amortised cost and interest-bearing financial assets, interest income is recorded using the EIR. Interest income is included in other operating income in the consolidated statement of income.
DividendsDividend income is recognised when the Group's right to receive the dividend is established, which is generally when shareholders of the investee approve the dividend. OtherrevenueOther revenue is recognised on an accrual basis when income is earned.
TaxationThere is no tax on corporate income in the Kingdom of Bahrain. Taxation on foreign subsidiaries is provided in accordance with the fiscal regulations applicable in the respective country.
Income tax in the consolidated statement of income for the year comprises current tax. Income tax is recognised in the consolidated statement of income except to the extent that it relates to items recognised directly in equity, in which case it is recognised in equity.
Notes to the ConsolidatedFinancial Statements (Continued)
As at 31 December 2017

Foundations for
Sustainable Growth
BMMI
46
2 SIGNIFICANT ACCOUNTING POLICIES (Continued)
Taxation (Continued)CurrentincometaxCurrent income tax assets and liabilities for the current period are measured at the amount expected to be recovered from or paid to the taxation authorities. The tax rates and tax laws used to compute the amount are those that are enacted or substantively enacted, at the reporting date in the countries where the Group operates and generates taxable income. Current income tax relating to items recognised directly in consolidated statement of other comprehensive income is recognised in consolidated statement of other comprehensive income and not in the consolidated statement of income. Management periodically evaluates positions taken in the tax returns with respect to situations in which applicable tax regulations are subject to interpretation and establishes provisions where appropriate. ProvisionsProvisions are recognised when the Group has a present obligation (legal or constructive) as a result of a past event, it is probable that an outflow of resources embodying economic benefits will be required to settle the obligation and a reliable estimate can be made of the amount of the obligation. Where the Group expects some or all of a provision to be reimbursed, for example under an insurance contract, the reimbursement is recognised as a separate asset but only when the reimbursement is virtually certain. The expense relating to any provision is presented in the consolidated statement of income net of any reimbursement. Cash dividend to equity holders of the CompanyThe Company recognises a liability to make cash distributions to equity holders of the Company when the distribution is authorised and the distribution is no longer at the discretion of the Company. As per the Bahrain Commercial Companies Law, a distribution is authorised when it is approved by the shareholders in their General Meeting. A corresponding amount is recognised directly in equity.
Foreign currencyThe Group’s consolidated financial statements are presented in Bahraini Dinars, which is the Company's functional currency. That is the currency of the primary economic environment in which the Company operates. Each entity in the Group determines its own functional currency and items included in the financial statements of each entity are measured using that functional currency.
TransactionsandbalancesTransactions in foreign currencies are initially recorded at their respective functional currency spot rates at the date the transaction first qualifies for recognition.
Monetary assets and liabilities denominated in foreign currencies are retranslated at the functional currency spot rate of exchange at the reporting date.
All differences arising on settlement or translation of monetary items are taken to the consolidated statement of income.
Non-monetary items that are measured in terms of historical cost in a foreign currency are translated using the exchange rates as at the dates of the initial transactions. Non-monetary items measured at fair value in a foreign currency are translated using the exchange rates at the date when the fair value is determined. The gain or loss arising on retranslation of non-monetary items is treated in line with the recognition of gain or loss on change in fair value of the item (i.e., translation differences on items whose fair value gain or loss is recognised in the consolidated statement of other comprehensive income or the consolidated statement of income is also recognised in the consolidated statement of other comprehensive income or the consolidated statement of income, respectively).
Notes to the ConsolidatedFinancial Statements (Continued)
As at 31 December 2017

Annual Report
2017
BMMI
47
2 SIGNIFICANT ACCOUNTING POLICIES (Continued)
Foreign currency (Continued)Groupcompanies Upon consolidation, the assets and liabilities of foreign operations are translated into Bahraini Dinars (BD) at the rate of exchange prevailing at the reporting date and their statements of income are translated at exchange rates prevailing at the dates of the transactions. The exchange differences arising on translation for consolidation are recognised in the consolidated statement of other comprehensive income. On disposal of a foreign operation, the component of consolidated statement of other comprehensive income relating to that particular foreign operation is recognised in the consolidated statement of income.
3 SIGNIFICANT ACCOUNTING JUDGEMENTS AND ESTIMATES The preparation of the Group's consolidated financial statements requires the Board of Directors to make judgements, estimates and assumptions that affect the reported amounts of revenues, expenses, assets, liabilities and the disclosure of contingent liabilities, at the reporting date. However, uncertainty about these assumptions and estimates could result in outcomes that require a material adjustment to the carrying amount of the asset or liability affected in future periods.
JudgementsIn the process of applying the Group’s accounting policies, the Board of Directors has made the following judgements, which have the most significant effect on the amounts recognised in the consolidated financial statements:
GoingconcernThe Company's Board of Directors has made an assessment of the Group's ability to continue as a going concern and is satisfied that the Group has the resources to continue the business for the foreseeable future. Furthermore, the Board of Directors is not aware of any material uncertainties that may cast a significant doubt about the Group's ability to continue as a going concern. Therefore, the consolidated financial statements continue to be prepared on a going concern basis.
ClassificationofinvestmentsFinancial assets under IFRS 9 are classified as "Fair Value Through Profit or Loss", "Amortised Cost" or "Fair Value Through Other Comprehensive Income" on the basis of the entity's business model for managing the assets and the contractual cash flow characteristics of the financial assets. However, the entity may make an irrevocable election at initial recognition for particular investments in equity instruments that would otherwise be measured at fair value through profit or loss to present subsequent changes in fair value in other comprehensive income. The management determined the classification of investment in initial recognition based on the nature and risk characteristic.
ClassificationofpropertiesProperties which are purchased with the intention to earn rental income or capital appreciation or both are classified as investment properties. All other properties are classified as property, plant and equipment.
LeasesThe determination of whether an arrangement is, or contains a lease is based on the substance of the arrangement at inception date, whether fulfillment of the arrangement is dependent on the use of a specific asset or assets or the arrangement conveys a right to use the asset even if that right is not explicitly specified in an arrangement. Operatingleases-GroupasalessorThe Group has entered into commercial property leases for commercial offices and outlets. The Group has determined, based on an evaluation of the terms and conditions of the arrangements, such as the lease term not constituting a substantial portion of the economic life of the commercial property, that it retains all the significant risks and rewards of ownership of these properties and accounts for the contracts as operating leases.
Notes to the ConsolidatedFinancial Statements (Continued)
As at 31 December 2017
Foundations for
Sustainable Growth
BMMI
48
3 SIGNIFICANT ACCOUNTING JUDGEMENTS AND ESTIMATES (Continued)
Leases(Continued)Operatingleases-GroupasalesseeThe Group has entered into commercial property leases for its office premises and outlets. The Group has determined, based on an evaluation of the terms and conditions of the arrangements that the lessor retains all the significant risks and rewards of ownership of the land and so accounts for the contracts as operating leases.
EstimatesThe key assumptions concerning the future and other key sources of estimation uncertainty at the reporting date, that have a significant risk of causing a material adjustment to the carrying amounts of assets and liabilities within the next financial year, are described below. The Group based its assumptions and estimates on parameters available when the consolidated financial statements were prepared. Existing circumstances and assumptions about future developments, however, may change due to market changes or circumstances arising beyond the control of the Group. Such changes are reflected in the assumptions when they occur. Impairmentofproperty,plantandequipmentandgoodwillThe Group assesses at each reporting date whether there is any indication that an asset may be impaired. If any such indication exists, or when annual impairment testing for an asset or goodwill is required, the Group makes an estimate of the asset's or cash generating unit's (CGU) recoverable amount. An asset’s or CGU's recoverable amount is higher of an asset’s or cash-generating unit’s fair value less costs to sell and its value in use and is determined for an individual asset or CGU, unless the asset or CGU does not generate cash inflows that are largely independent of those from other assets or group of assets. Where the carrying amount of an asset or CGU exceeds its recoverable amount, the asset or CGU is considered impaired and is written down to its recoverable amount. In assessing value in use, the estimated future cash flows are discounted to their present value using a discount rate that reflects the current market assessment of the time value of money and the risks specific to the assets or CGU. The Board of Directors do not believe there is any impairment in the value of property, plant and equipment as at 31 December 2016. The Board of Directors, based on the detailed analysis of the performance of the CGU to which the goodwill relates, has recognised an impairment loss on goodwill amounting to BD 119,528 (2016: BD 100,000) during the year ended 31 December 2017. Usefullivesofproperty,plantandequipmentThe Group's management determines the estimated useful lives of its property, plant and equipment for calculating depreciation. This estimate is determined after considering the expected usage of the asset or physical wear and tear. Management reviews the residual values and useful lives annually and future depreciation charges would be adjusted where the management believes the useful lives differ from previous estimates.
ImpairmentofinvestmentsinjointventuresThe management determines whether it is necessary to recognise an impairment loss on the Group’s investments in its joint ventures. The Group determines at each reporting date whether there is any objective evidence that the investment in a joint venture is impaired. If this is the case, the Group calculates the amount of impairment as the difference between the recoverable amount of the investment in a joint venture and its carrying value and recognises the amount in the consolidated statement of income. The Board of Directors reassessed the impairment and believe that there is no impairment of investments in joint ventures as at 31 December 2017 and 31 December 2016.
Notes to the ConsolidatedFinancial Statements (Continued)
As at 31 December 2017

Annual Report
2017
BMMI
49
3 SIGNIFICANT ACCOUNTING JUDGEMENTS AND ESTIMATES (Continued)
Estimates(Continued)FairvalueofinvestmentpropertiesInvestment properties comprises of buildings (principally commercial offices) which are not occupied substantially for use by, or in the operations of, the Group, but are held primarily to earn rental income and capital appreciation. The fair values of the investment properties have been determined by the Investment and Finance Committee based on the valuations performed by an independent valuer. The valuations undertaken are based on open market value, supported by market evidence in which an asset could be exchanged between a knowledgeable willing buyer and a knowledgeable willing seller in an arm's length transaction at the date of valuations and appropriate adjustments for liquidity and other discount factors. ValuationofunquotedequityinvestmentsManagement uses its best judgement in determining fair values of the unquoted private equity investments by reference to recent, material arms' length transactions involving third parties. The fair values of unquoted investments have been estimated using indicative bids provided by the fund administrators or using other valuation techniques.
ProvisionforslowmovingandobsoleteinventoriesInventories are held at the lower of cost and net realisable value. When inventories become old or obsolete, an estimate is made of their net realisable value. For individually significant amounts this estimation is performed on an individual basis. Amounts which are not individually significant, but which are old or obsolete, are assessed collectively and a provision applied according to the inventory type and the degree of ageing or obsolescence, based on historical selling prices.
At the reporting date, gross inventories (excluding goods-in-transit) were BD 10,764,817 (2016: BD 9,617,272) with a provision for slow moving and obsolete inventories of BD 466,100 (2016: BD 532,317). Any difference between the amounts actually realised in future periods and the amounts expected will be recognised in the consolidated statement of income.
ImpairmentoftradereceivablesAn estimate of the collectible amount of trade receivables is made when collection of the full amount is no longer probable. For individually significant amounts, this estimation is performed on an individual basis. Amounts which are not individually significant, but which are past due, are assessed collectively and an allowance applied according to the length of time past due, based on historical recovery rates.
At the reporting date, gross trade receivables were BD 15,725,438 (2016: BD 14,020,916), with an allowance for impairment of BD 1,056,972 (2016: BD 2,001,786). Any difference between the amounts actually collected in future periods and the amounts expected will be recognised in the consolidated statement of income.
TaxesUncertainties exist with respect to the interpretation of complex tax regulations, changes in tax laws, and the amount and timing of future taxable income. Given the wide range of international business relationships and the long-term nature and complexity of existing contractual agreements, differences arising between the actual results and the assumptions made, or future changes to such assumptions, could necessitate future adjustments to taxable income and expense already recorded. The Group establishes provisions, based on reasonable estimates, for possible consequences of audits by the tax authorities of the respective counties in which it operates. The amount of such provisions is based on various factors, such as experience of previous tax audits and differing interpretations of tax regulations by the taxable entity and the responsible tax authority.
Notes to the ConsolidatedFinancial Statements (Continued)
As at 31 December 2017
Foundations for
Sustainable Growth
BMMI
50
4 STANDARDS AND INTERPRETATIONS ISSUED BUT NOT YET EFFECTIVE Standards issued but not yet effective up to the date of issuance of the consolidated financial statements are listed below. This listing is of standards and interpretations issued, which the Group reasonably expects to be applicable at a future date. The Group intends to adopt these standards when they become effective. IFRS15RevenuefromContractswithCustomersIFRS 15 was issued in May 2014 and establishes a new five-step model that will apply to revenue arising from contracts with customers. Under IFRS 15 revenue is recognised at an amount that reflects the consideration to which an entity expects to be entitled in exchange for transferring goods or services to a customer. The principles in IFRS 15 provide a more structured approach to measuring and recognising revenue.
The new revenue standard is applicable to all entities and will supersede all current revenue recognition requirements under IFRS. Either a full or modified retrospective application is required for annual periods beginning on or after 1 January 2018 with early adoption permitted. The Group's preliminary assessment indicates the new standard would not likely to have a significant impact on the results of the Group, however, there would be certain classification within the consolidated statements of income.
IFRS16LeasesIFRS 16 was issued in January 2016 and it replaces IAS 17 Leases, IFRIC 4 Determining whether an Arrangement contains a Lease, SIC-15 Operating Leases-Incentives and SIC-27 Evaluating the Substance of Transactions Involving the Legal Form of a Lease. IFRS 16 sets out the principles for the recognition, measurement, presentation and disclosure of leases and requires lessees to account for all leases under a single statement of financial position model similar to the accounting for finance leases under IAS 17. The standard includes two recognition exemptions for lessees – leases of ’low-value’ assets (e.g., personal computers) and short-term leases (i.e., leases with a lease term of 12 months or less). At the commencement date of a lease, a lessee will recognise a liability to make lease payments (i.e., the lease liability) and an asset representing the right to use the underlying asset during the lease term (i.e., the right-of-use asset). Lessees will be required to separately recognise the interest expense on the lease liability and the depreciation expense on the right-of-use asset.
Lessees will be also required to remeasure the lease liability upon the occurrence of certain events (e.g., a change in the lease term, a change in future lease payments resulting from a change in an index or rate used to determine those payments). The lessee will generally recognise the amount of the remeasurement of the lease liability as an adjustment to the right-of-use asset. Lessor accounting under IFRS 16 is substantially unchanged from today’s accounting under IAS 17. Lessors will continue to classify all leases using the same classification principle as in IAS 17 and distinguish between two types of leases: operating and finance leases.
IFRS 16 also requires lessees and lessors to make more extensive disclosures than under IAS 17.
IFRS 16 is effective for annual periods beginning on or after 1 January 2019. Early application is permitted, but not before an entity applies IFRS 15. A lessee can choose to apply the standard using either a full retrospective or a modified retrospective approach. The Group is currently assessing the potential impact of IFRS 16 and plans to adopt the new standard on the required effective date.
Notes to the ConsolidatedFinancial Statements (Continued)
As at 31 December 2017

Annual Report
2017
BMMI
51
4 STANDARDS AND INTERPRETATIONS ISSUED BUT NOT YET EFFECTIVE (Continued)
IAS40InvestmentProperties(Amendments)-TransfersofInvestmentPropertyThe amendments clarify when an entity should transfer property, including property under construction or development into, or out of investment property. The amendments state that a change in use occurs when the property meets, or ceases to meet, the definition of investment property and there is evidence of the change in use. A mere change in management’s intentions for the use of a property does not provide evidence of a change in use. Entities should apply the amendments prospectively to changes in use that occur on or after the beginning of the annual reporting period in which the entity first applies the amendments. An entity should reassess the classification of property held at that date and, if applicable, reclassify property to reflect the conditions that exist at that date. Retrospective application in accordance with IAS 8 is only permitted if it is possible without the use of hindsight. Effective for annual periods beginning on or after 1 January 2018. Early application of the amendments is permitted and must be disclosed. The Group will apply amendments when they become effective. However, since Group’s current practice is in line with the clarifications issued, the Group does not expect any effect on its consolidated financial statements.
AmendmentstoIFRS10andIAS28:SaleorContributionofAssetsbetweenanInvestoranditsAssociateorJointVentureThe amendments address the conflict between IFRS 10 and IAS 28 in dealing with the loss of control of a subsidiary that is sold or contributed to an associate or joint venture. The amendments clarify that the gain or loss resulting from the sale or contribution of assets that constitute a business, as defined in IFRS 3, between an investor and its associate or joint venture, is recognised in full. Any gain or loss resulting from the sale or contribution of assets that do not constitute a business, however, is recognised only to the extent of unrelated investors’ interests in the associate or joint venture. These amendments must be applied prospectively and are effective for annual periods beginning on or after 1 January 2016, with early adoption permitted. These amendments are not expected to have any impact on the Group's consolidated financial statements.
IFRICInterpretation22ForeignCurrencyTransactionsandAdvanceConsiderationThe Interpretation clarifies that, in determining the spot exchange rate to use on initial recognition of the related asset, expense or income (or part of it) on the derecognition of a non-monetary asset or non-monetary liability relating to advance consideration, the date of the transaction is the date on which an entity initially recognises the non-monetary asset or non-monetary liability arising from the advance consideration. If there are multiple payments or receipts in advance, then the entity must determine the transaction date for each payment or receipt of advance consideration. Entities may apply the amendments on a fully retrospective basis.
Alternatively, an entity may apply the Interpretation prospectively to all assets, expenses and income in its scope that are initially recognised on or after:
(i) The beginning of the reporting period in which the entity first applies the interpretation; or
(ii) The beginning of a prior reporting period presented as comparative information in the consolidated financial statements of the reporting period in which the entity first applies the interpretation.
The Interpretation is effective for annual periods beginning on or after 1 January 2018. Early application of interpretation is permitted and must be disclosed. However, since the Group’s current practice is in line with the Interpretation, the Group does not expect any effect on its consolidated financial statements.
Other amendments resulting from new standards and interpretations and amendments to standards and interpretation will not have any impact on the accounting policies, consolidated financial position or consolidated financial performance of the Group.
Notes to the ConsolidatedFinancial Statements (Continued)
As at 31 December 2017

Foundations for
Sustainable Growth
BMMI
52
5 PROPERTY, PLANT AND EQUIPMENT
Freeholdland
BDBuildings
BD
Plant andequipment
BD
Motorvehicles
BD
Capital work-in-progress
BDTotal
BDCost:At 1 January 2017 6,174,332 47,667,583 13,204,103 2,101,581 1,763,420 70,911,019
Additions 516,426 5,000 1,916,324 - 314,151 2,751,901
Transfers 324,346 - 1,088,945 71,994 (1,485,285) -
Impairment of assets of GSS Gabon SA - (674,643) (1,940,913) (228,864) - (2,844,420)
Disposals - - (666,908) - - (666,908)
Exchange adjustments - 89,538 223,355 (5,389) - 307,504
At 31 December 2017 7,015,104 47,087,478 13,824,906 1,939,322 592,286 70,459,096
Depreciation:At 1 January 2017 - 6,229,003 8,356,997 1,759,799 - 16,345,799
Charged during the year - 452,776 3,223,873 87,647 - 3,764,296
Relating to impairment - (289,440) (1,175,581) (209,721) - (1,674,742)
Relating to disposals - - (666,908) - - (666,908)
Exchange adjustments - 31,699 118,350 11,445 - 161,494
At 31 December 2017 - 6,424,038 9,856,731 1,649,170 - 17,929,939
Net carrying values:At 31 December 2017 7,015,104 40,663,440 3,968,175 290,152 592,286 52,529,157
FreeholdlandBD
BuildingsBD
Plant andequipment
BD
Motorvehicles
BD
Capital work-in-progress
BDTotal
BD
Cost:At 1 January 2016 3,126,019 8,322,356 10,672,922 2,002,021 473,805 24,597,123
Additions - 801,115 359,892 104,505 1,289,615 2,555,127
Acquisition of a subsidiary 3,048,313 38,564,316 2,245,723 26,525 - 43,884,877
Exchange adjustments - (20,204) (74,434) (31,470) - (126,108)
At 31 December 2016 6,174,332 47,667,583 13,204,103 2,101,581 1,763,420 70,911,019
Depreciation:At 1 January 2016 - 4,617,008 7,132,073 1,652,121 - 13,401,202
Charged during the year - 1,537,517 1,238,682 123,151 - 2,899,350
Acquisition of a subsidiary - 81,671 48,153 7,298 - 137,122
Exchange adjustments - (7,193) (61,911) (22,771) - (91,875)
At 31 December 2016 - 6,229,003 8,356,997 1,759,799 - 16,345,799
Net carrying values:At 31 December 2016 6,174,332 41,438,580 4,847,106 341,782 1,763,420 54,565,220
The management performed an impairment test of property, plant and equipment of the hotel owned by the Group as at 31 December 2017 which indicate that no impairment provision is required as at 31 December 2017 and as at 31 December 2016. Certain of the Group's property, plant and equipment with a carrying value of BD 40,630,847 (2016: BD 42,267,135) are mortgaged as a security against loans and borrowings, refer to note 17.
Notes to the ConsolidatedFinancial Statements (Continued)
As at 31 December 2017

Annual Report
2017
BMMI
53
5 PROPERTY, PLANT AND EQUIPMENT (Continued)
The depreciation charge has been allocated in the consolidated statement of income as follows:
2017BD
2016BD
Cost of revenue (note 20) 204,156 26,501
Selling and distribution expenses 224,518 89,593
General and administrative expenses 3,335,622 2,783,256
3,764,296 2,899,350
6 INVESTMENT PROPERTIES
The Group's investment properties consist of buildings on freehold land (principally commercial offices) located in the Kingdom of Bahrain and held for capital appreciation and rental purposes. These investment properties have been carried at fair value as at 31 December 2017 and as at 31 December 2016.
Buildings onfreehold land
BD
At 1 January 2016 9,235,497
Disposals (400,000)
At 31 December 2016 8,835,497
Additions 427,426
At 31 December 2017 9,262,923
The fair values of the above investment properties have been determined by the Investment and Finance Committee based on the valuations performed by an independent valuer. The valuer is an industry specialist in valuing these types of properties and has recent experience in the location and category of the properties being valued. The valuations undertaken are based on open market value, supported by market evidence in which an asset could be exchanged between a knowledgeable willing buyer and a knowledgeable willing seller in an arm's length transaction at the date of valuations and appropriate adjustments for liquidity and other discount factors. In 2016, the Group disposed off an investment property in Adliyah for a consideration of BD 1,518,685 which resulted in a gain of BD 1,118,685. There was no such transaction during the year ended 31 December 2017.
2017BD
2016BD
Rental income derived from investment properties 632,360 573,000
The Group has no restrictions on the realisability of its investment properties and no contractual obligations to either purchase, construct or develop investment properties or for repairs, maintenance and enhancements. Fair value hierarchy disclosures for investment properties have been provided in note 9.
Notes to the ConsolidatedFinancial Statements (Continued)
As at 31 December 2017

Foundations for
Sustainable Growth
BMMI
54
7 INVESTMENTS IN JOINT VENTURES
The movements in the carrying values of investments in joint ventures are as follows:
2017BD
2016BD
At 1 January 1,914,452 1,949,878
Share of results for the year 1,117,577 269,877
Transfer of loan to a joint venture 881,148 -
Dividends received during the year (1,074,679) (305,303)
Additional investment 7,560 -
At 31 December 2,846,058 1,914,452
The share of results included in the consolidated statement of income are as follows:
2017BD
2016BD
Share of results from joint ventures 1,117,577 269,877
Share of results from an associate - (343,838)
Total share of results of joint ventures and an associate 1,117,577 (73,961)
The following table illustrates summarised unaudited financial information of the Group's investments in joint ventures:
Joint ventures' summarised statements of financial position:2017
BD2016
BD
Current assets 5,113,613 6,154,142
Non-current assets 3,120,673 2,882,169
Current liabilities (2,542,170) (3,548,608)
Non-current liabilities - (1,658,800)
Equity 5,692,116 3,828,903
Proportion of the Group' ownership 50% 50%
Carrying value of investments in joint ventures as at 31 December 2,846,058 1,914,452
Summarised statements of comprehensive income:2017
BD2016
BD
Revenue 8,871,188 9,034,932
Cost of sales (5,134,456) (5,514,419)
General and administrative expenses (524,436) (251,685)
Selling and distribution expenses (728,426) (2,708,771)
Depreciation expenses (248,717) (20,303)
Profit for the year 2,235,153 539,754
Proportion of the Group' ownership 50% 50%
Group's share of results for the year 1,117,577 269,877
The joint ventures had no material contingent liabilities or capital commitments as at 31 December 2017 and 31 December 2016. The joint ventures cannot distribute its profits until it obtains the consent from both venture partners.
The share of results of the joint ventures are recorded based on the approved management accounts for the year ended 31 December 2017.
Notes to the ConsolidatedFinancial Statements (Continued)
As at 31 December 2017

Annual Report
2017
BMMI
55
8 INVESTMENTS
2017BD
2016BD
Fair value through other comprehensive income - quoted investments 8,474,847 8,511,776
Fair value through other comprehensive income - unquoted investments 1,884,792 1,920,906
Fair value through profit or loss - quoted investments 2,455,979 2,460,596
12,815,618 12,893,278
QuotedinvestmentsThe fair values of the quoted investments are determined by reference to published price quotations in an active market.
UnquotedinvestmentsThe fair values of unquoted investments have been estimated using indicative bids provided by the fund administrators, using of recent arm’s length market transactions, current fair value of another similar instrument or other appropriate valuation techniques.
The movements in the fair values of investments are as follows:
2017BD
2016BD
At 1 January 12,893,278 13,132,517
Purchase during the year - 277,053
Disposed during the year (926,185) (537,668)
Changes in fair value for the year 853,138 23,596
Net losses on FVTPL (4,613) (2,220)
At 31 December 12,815,618 12,893,278
9 FAIR VALUE HIERARCHY
The following table provides the fair value measurement hierarchy of the Group’s assets and liabilities:
31 December 2017Date of
valuation
Fair value measurement usingQuoted prices
in active marketsLevel 1
BD
Significantobservable inputs
Level 2BD
Significantunobservable inputs
Level 3BD
TotalBD
Assets measured at fair value:Investment properties (note 6) - Buildings 31 Dec 2017 - - 9,262,923 9,262,923 Investments (note 8)Fair value through other comprehensive income - quoted investments 31 Dec 2017 8,474,847 - - 8,474,847 - unquoted investments 31 Dec 2017 - - 1,884,792 1,884,792 Fair value through profit or loss - quoted investments 31 Dec 2017 2,455,979 - - 2,455,979
10,930,826 - 1,884,792 12,815,618 10,930,826 - 11,147,715 22,078,541
Notes to the ConsolidatedFinancial Statements (Continued)
As at 31 December 2017

Foundations for
Sustainable Growth
BMMI
56
9 FAIR VALUE HIERARCHY (Continued)
Liabilities measured at fair value:There were no liabilities measured at fair value as of 31 December 2017.
31 December 2016Date of
valuation
Fair value measurement using
Quoted pricesin active markets
Level 1BD
Significantobservable inputs
Level 2BD
Significantunobservable inputs
Level 3BD
TotalBD
Assets measured at fair value:
Investment properties (note 6)
- Buildings 31 Dec 2016 - - 8,835,497 8,835,497
Investments (note 8)
Fair value through other
Comprehensive income
- quoted investments 31 Dec 2016 8,511,776 - - 8,511,776
- unquoted investments 31 Dec 2016 - - 1,920,906 1,920,906
Fair value through profit or loss
- quoted investments 31 Dec 2016 2,460,596 - - 2,460,596
10,972,372 - 1,920,906 12,893,278
10,972,372 - 10,756,403 21,728,775
Liabilities measured at fair value: There were no liabilities measured at fair value as of 31 December 2016.
During the reporting years ended 31 December 2017 and 31 December 2016, there were no transfers between Level 1 and Level 2 fair value measurements, and no transfers into and out of Level 3 fair value measurements.
Level 3 equity securities have been valued based on indicative bids provided by the fund administrators or using other valuation techniques and for fair value of investment properties, refer note 6.
Notes to the ConsolidatedFinancial Statements (Continued)
As at 31 December 2017

Annual Report
2017
BMMI
57
9 FAIR VALUE HIERARCHY (Continued)
Reconciliation of fair value measurements of Level 3 assetsThe Group has investment properties and certain unquoted equity shares classified as fair value through other comprehensive income which are classified as level 3 within the fair value hierarchy. The movements in the fair value of level 3 financial and non-financial assets are as follows:
Non-financial assetsBD
Financial assetsBD
TotalBD
1 January 2017 8,835,497 1,920,906 10,756,403
Additions during the year 427,426 - 427,426
Changes in fair values - (36,114) (36,114)
31 December 2017 9,262,923 1,884,792 11,147,715
1 January 2016 9,235,497 2,142,746 11,378,243
Disposals during the year (400,000) (136,486) (536,486)
Changes in fair values - (85,354) (85,354)
31 December 2016 8,835,497 1,920,906 10,756,403
10 INVENTORIES
2017BD
2016BD
Goods held for sale 8,740,202 7,760,132
Goods held for sale - retail 2,024,615 1,857,140
Goods-in-transit 687,114 1,347,479
11,451,931 10,964,751
Provision for slow moving and obsolete inventories (466,100) (532,317)
10,985,831 10,432,434
Movements in the provision for slow moving and obsolete inventories are as follows:
2017BD
2016BD
At 1 January 532,317 625,284
Provided during the year 132,702 106,962
Written off during the year (198,919) (199,929)
At 31 December 466,100 532,317
Notes to the ConsolidatedFinancial Statements (Continued)
As at 31 December 2017

Foundations for
Sustainable Growth
BMMI
58
11 TRADE AND OTHER RECEIVABLES
2017BD
2016BD
Trade receivables [net of allowance for impairment of BD 1,056,972 (2016: BD 2,001,786)] 14,668,466 12,019,130
Advances to suppliers 2,097,157 436,183
Other receivables 4,482,990 3,818,193
Due from related parties (note 25) 555,470 461,329
Prepayments 1,101,500 1,327,726
22,905,583 18,062,561
Trade receivables include an amount of BD 148,988 (2016: BD 314,005) due from related parties (refer to note 25).
Trade receivables amounting to BD 400,458 (2016: BD 330,315) are secured against loans and borrowings, refer to note 17.
Terms and conditions of the above financial assets are as follows:• Trade receivables are non-interest bearing and are generally settled on 30 - 90 day terms.• Other receivables are non-interest bearing and have terms ranging between one and six months.• For terms and conditions relating to due from related parties, refer to note 25.
Trade receivables at a nominal value of BD 1,056,972 (2016: BD 2,001,786) were impaired and provided for as at 31 December 2017. Movements in the allowance for impairment of trade receivables are as follows:
2017BD
2016BD
At 1 January 2,001,786 1,662,896
Charge for the year 406,282 573,765
Written off during the year (1,351,096) (234,875)
At 31 December 1,056,972 2,001,786
The ageing analysis of unimpaired trade receivables as at 31 December, is as follows:
Total BD
Neither past due nor
impaired BD
Past due but not impaired
Less than 30 days
BD
30 to 60 days
BD
61 to 90 days
BD
91 to 120 days
BD
More than 120 days
BD
2017 14,668,466 5,718,674 3,199,851 1,820,552 1,107,844 897,411 1,924,134
2016 12,019,130 6,159,505 1,870,228 939,696 530,038 690,210 1,829,453
Notes to the ConsolidatedFinancial Statements (Continued)
As at 31 December 2017

Annual Report
2017
BMMI
59
12 CASH AND CASH EQUIVALENTS
2017BD
2016BD
Cash at banks and on hand 3,093,958 2,374,013
Short-term deposits - 35,170
Cash, bank balances and short-term deposits 3,093,958 2,409,183
Bank overdrafts (895,452) (364,767)
Less: short-term deposits with original maturity of more than three months - (35,170)
Cash and cash equivalents 2,198,506 2,009,246
Bank balances earn interest at floating rates based on daily bank deposit rates. Short-term deposits are made for varying periods of between one day and three months, depending on the immediate cash requirement of the Group, and earn interest at the respective short-term fixed deposit rates. The effective interest rate on short-term deposits was 2.25% to 2.5% per annum as at 31 December 2016. Bank overdrafts carry interest at commercial rates.
13 SHARE CAPITAL
2017BD
2016BD
Authorised:
200,000,000 (2016: 200,000,000) shares of 100 fils each 20,000,000 20,000,000
Issued, subscribed and fully paid-up:
146,428,549 (2016: 146,428,549) shares of 100 fils each 14,642,854 14,642,854
Notes to the ConsolidatedFinancial Statements (Continued)
As at 31 December 2017

Foundations for
Sustainable Growth
BMMI
60
13 SHARE CAPITAL (Continued)
The names and nationalities of the major shareholders and the number of shares in which they have an interest of 5% or more of total issued shares are as follows:
Names
Country ofincorporation/Nationality
2017 2016
Number ofshares
Percentageof total
outstandingshare
Number ofshares
Percentageof total
outstandingshare
A.M. Yateem Bros. W.L.L. Bahraini 14,646,989 10.00 14,596,989 9.97
Mr. Yousif Abdullah Amin Bahraini 9,612,991 6.56 9,022,991 6.16
Bahrain Duty Free Company B.S.C. Bahraini 9,608,513 6.56 9,608,513 6.56
Yousuf Khalil Almoayyed & Sons B.S.C. (c) Bahraini 8,742,189 5.97 8,742,189 5.97
Distribution schedule of shares, setting out the number of shareholders and percentage of shareholding of the total outstanding shares in the respective categories is as follows:
Categories
2017 2016
Number ofshares
Number ofshareholders
Percentageof total
outstandingshare
Number ofshares
Number ofshareholders
Percentageof total
outstandingshare
Less than 1% 50,124,872 360 34 50,927,277 357 34
1% up to less than 5% 53,692,995 18 37 53,530,590 18 37
5% up to less than 10% 27,963,693 3 19 27,323,693 3 19
10% up to less than 20% 14,646,989 1 10 14,646,989 1 10
146,428,549 382 100 146,428,549 379 100
The details of the nationality of the shareholders and the percentage of shareholding of the total outstanding shares is as follows:
Nationality
2017 2016
Number ofshares
Number ofshareholders
Percentageof total
outstandingshare
Number ofshares
Number ofshareholders
Percentageof total
outstandingshare
Bahraini 142,565,688 347 97.36 142,481,578 343 97.30
Kuwaiti 3,071,915 5 2.10 3,111,915 5 2.13
Saudi 483,143 12 0.33 458,143 12 0.31
Indian 202,089 10 0.14 203,969 10 0.14
Others 105,714 8 0.07 172,944 9 0.12
146,428,549 382 100.00 146,428,549 379 100.00
Notes to the ConsolidatedFinancial Statements (Continued)
As at 31 December 2017

Annual Report
2017
BMMI
61
13 SHARE CAPITAL (Continued)
The details of the total ownership interest held by the directors are as follows:
Director
2017 2016
Number ofshares
Percentageof total
outstandingshare
Number ofshares
Percentageof total
outstandingshare
Mr. Abdulla Hassan Buhindi 651,259 0.44 1,145,677 0.78
Mr. Shawki Ali Fakhroo 587,882 0.40 587,882 0.40
Mr. Jehad Yousif Ameen 580,000 0.40 500,000 0.34
Mr. Mohammed Farooq Yusuf Almoayyed 387,273 0.26 387,273 0.26
Mrs. Mona Yousif Almoayyed 336,153 0.23 336,153 0.23
Mr. Abdulla Mohammed Juma 291,108 0.20 291,108 0.20
Mr. Suhail Mohamed Hussain Hajee 110,000 0.08 110,000 0.08
2,943,675 2.01 3,358,093 2.29
14 TREASURY SHARES
Treasury shares represent the purchase by the Group of its own shares. The Group held 7,684,799 shares (2016: 7,684,799 shares) as at 31 December 2017.
2017 2016
Number of treasury shares 7,684,799 7,684,799
Treasury shares as a percentage of total shares in issue (a) 5.2% 5.2%
Cost of treasury shares (BD / share) 0.351 0.351
Market price of treasury shares (BD / share) 0.700 0.830
Market value of treasury shares (BD) 5,379,359 6,378,383
Notes to the ConsolidatedFinancial Statements (Continued)
As at 31 December 2017

Foundations for
Sustainable Growth
BMMI
62
15 DIVIDEND PAID AND PROPOSED
The Board of Directors has proposed a total cash dividend of 50 fils per share (excluding treasury shares), totalling BD 6,937,188 (2016: 50 fils per share totalling BD 6,937,188) for the year ended 31 December 2017 of which 20 fils per share totalling BD 2,774,875 (2016: 20 fils per share totalling BD 2,774,875) was paid as an interim dividend. The proposed final dividend equals 30 fils per share, totalling BD 4,162,313 (2016: 30 fils per share totalling BD 4,162,313).
The Board of Directors has also proposed Directors' remuneration of BD 139,000 (2016: BD 139,000).
The Board of Directors has also proposed a transfer of BD 172,184 (2016: BD 188,368) to the charity reserve and a transfer of BD 500,000 (2016: BD 500,000) to the general reserve.
The proposed appropriations and the Directors' committee fees are in accordance with the Company's articles of association and are subject to approval by the shareholders at the Annual General Meeting.
16 OTHER RESERVES
Statutoryreserve
BD
Investmentrevaluation
reserveBD
Charityreserve
BD
Generalreserve
BD
Foreigncurrency
translationreserve
BDTotal
BD
As at 1 January 2017 7,321,427 109,653 - 6,500,000 (1,659,162) 12,271,918
Other comprehensive income - 853,138 - - (292,925) 560,213
Net losses on disposal of investments carriedat fair value through other comprehensive income - 155,365 - - - 155,365
Transferred to statutory reserve - - - - - -
Transfer to general reserve - - - 500,000 - 500,000
Transfer to charity reserve - - 188,368 - - 188,368
Foundation [refer note 16 (b)] - - (188,368) - - (188,368)
At 31 December 2017 7,321,427 1,118,156 - 7,000,000 (1,952,087) 13,487,496
Statutoryreserve
BD
Investmentrevaluation
reserveBD
Revaluationreserve
BD
Charityreserve
BD
Generalreserve
BD
Foreigncurrency
translationreserve
BDTotal
BD
As at 1 January 2016 6,655,843 28,151 283,575 - 6,000,000 (1,002,536) 11,965,033
Other comprehensive income (loss) - 23,596 - - - (656,626) (633,030)
Net losses on disposal of investments carried at fair value through other comprehensive income - 57,906 - - - - 57,906
Transferred to statutory reserve 665,584 - - - - - 665,584
Transferred on disposal of investment properties - - (283,575) - - - (283,575)
Transfer to general reserve - - - - 500,000 - 500,000
Transfer to charity reserve - - - 201,760 - - 201,760
Foundation [refer note 16 (b)] - - - (201,760) - - (201,760)
At 31 December 2016 7,321,427 109,653 - - 6,500,000 (1,659,162) 12,271,918
Notes to the ConsolidatedFinancial Statements (Continued)
As at 31 December 2017

Annual Report
2017
BMMI
63
16 OTHER RESERVES (Continued)
a) Statutory reserveAs required by the Bahrain Commercial Companies Law, the Company is required to transfer 10% of the profit for the year to a statutory reserve until such reserve equals 50% of the paid-up share capital. The shareholders have resolved to discontinue the transfer of profit to statutory reserve as the reserve equal to 50% of the paid-up share capital (2016: BD 665,584). The reserve is not distributable except in such circumstances as stipulated in the Bahrain Commercial Companies Law.
b) Charity reserve In accordance with the Company's articles of association and the recommendation of the Board of Directors, an amount not exceeding 2% of the Group's profit for the year is transferred to the charity reserve.
In 2008, the Company established Alosra Charitable Foundation ('the Foundation') for this purpose. In 2008 and 2009, the Foundation was controlled by the Company and formed part of the Group's consolidated financial statements consisting of the reserve and cash at bank. In 2010, the Company relinquished control of the Foundation to an independent Board of Directors thus reducing the reserve and bank balances of the Group by the sum included in the Foundation's bank account. The charity reserve now represents amounts approved as appropriations by the Board of Directors and shareholders of the Company less cash transferred to the Foundation.
The Board of Directors has proposed a transfer of BD 172,185 (2016: BD 188,368) to the charity reserve in the current year. This is subject to approval by the shareholders at the Annual General Meeting.
c) General reserveIn accordance with the Company's articles of association and the recommendation of the Board of Directors, specific amounts are transferred to the general reserve. The Board of Directors has proposed a transfer of BD 500,000 (2016: BD 500,000) to the general reserve in the current year. This is subject to approval by the shareholders at the Annual General Meeting.
d) Investment revaluation reserveThis reserve relates to fair value changes of investments carried at fair value through other comprehensive income.
e) Foreign currency translation reserveThe foreign currency translation reserve is used to record exchange differences arising from the translation of the financial statements of foreign operations.
17 LOANS AND BORROWINGS
2017BD
2016BD
Term loan (a) 21,356,342 21,665,437
Short term loan (b) 2,838,894 652,465
24,195,236 22,317,902
Non-current 19,082,611 20,029,755
Current 5,112,625 2,288,147
24,195,236 22,317,902
Notes to the ConsolidatedFinancial Statements (Continued)
As at 31 December 2017

Foundations for
Sustainable Growth
BMMI
64
17 LOANS AND BORROWINGS (Continued)
(a) This represents term loan facility obtained by Banader Hotels Company B.S.C. of BD 25,000,000 from HSBC Bank Middle East Limited to finance the settlement of a Murabaha facility, fund the construction of the hotel and the hotel's pre-operating expenses until the soft opening of the hotel, and fund the repayment of retention to the contractors.
The loan carries interest rates varying from 2.2% to 2.45% plus the BIBOR or T-bills rate, as applicable, and is repayable in 29 quarterly instalments ranging from BD 131,139 to BD 657,011 and final payment of BD 11,145,000. The final instalment is falling due on 31 March 2023. The loan is secured against the freehold land and building of the hotel bearing title deed number 146959 and assignment of Banader's receivables until the settlement of loan including the interest.
(b) This represents a credit facility obtained from a commercial bank in the Kingdom of Bahrain to finance procurement of goods for sale. The facility carries interest at 3 months LIBOR plus 1.75% (2016: LIBOR plus 1.75%) per annum with tenor up to 30 days.
18 EMPLOYEES' END OF SERVICE BENEFITS
Movements in the provision recognised in the consolidated statement of financial position are as follows:
2017BD
2016BD
At 1 January 1,857,403 1,718,567
Provided during the year (note 20) 613,001 323,965
End of service benefits paid (352,283) (228,957)
Acquisition of a subsidiary (note 29) - 43,828
Provision as at 31 December 2,118,121 1,857,403
Net movement in advances paid to employees (632,983) (493,655)
Net provision as at 31 December 1,485,138 1,363,748
19 TRADE AND OTHER PAYABLES
2017BD
2016BD
Trade payables 9,953,170 5,290,293
Accrued expenses 4,045,328 5,324,026
Other payables 1,443,426 2,444,860
Unclaimed dividends 781,380 624,523
16,223,304 13,683,702
Trade payables and other payables include amounts of BD 273,305 (2016: BD 78,313) due to related parties (refer to note 25).
Terms and conditions of the above financial liabilities are as follows:• Trade payables are non-interest bearing and are normally settled on 60 day terms.• Other payables are non-interest bearing and have terms ranging between one and three months.• Unclaimed dividends are payable on demand.• For terms and conditions relating to amounts due to related parties, refer to note 25.
Notes to the ConsolidatedFinancial Statements (Continued)
As at 31 December 2017

Annual Report
2017
BMMI
65
20 PROFIT OF THE GROUP FOR THE YEAR The profit of the Group for the year is stated after charging:
2017BD
2016BD
Staff costs
Short term benefits 15,896,440 16,018,392
Contributions to the Social Insurance Organisation (SIO) 614,050 551,011
End of service benefits (note 18) 613,001 323,965
17,123,491 16,893,368
The staff costs have been allocated in the consolidated statement of income as follows:
2017BD
2016BD
Cost of revenue 6,653,482 5,322,458
Selling and distribution expenses 6,203,655 4,746,173
General and administrative expenses 4,266,354 6,824,737
17,123,491 16,893,368
2017BD
2016BD
Finance costs
Interest on term loan 1,019,071 792,911
Interest on short-term loan and bank overdraft 166,900 85,855
Bank charges 55,124 18,518
1,241,095 897,284
2017BD
2016BD
Rental charges - operating leases 1,265,586 992,349
Foreign exchange gains, net 36,820 66,376
2017BD
2016BD
Cost of revenue comprise of:
Inventories recognised as expense upon sale of finished goods 56,629,708 53,462,499
Consumption cost 6,459,313 6,339,630
Labour cost 6,653,482 5,322,458
Other direct costs 3,202,226 3,124,023
Warehouse rent 302,400 213,446
Depreciation (note 5) 204,156 26,501
73,451,285 68,488,557
Notes to the ConsolidatedFinancial Statements (Continued)
As at 31 December 2017
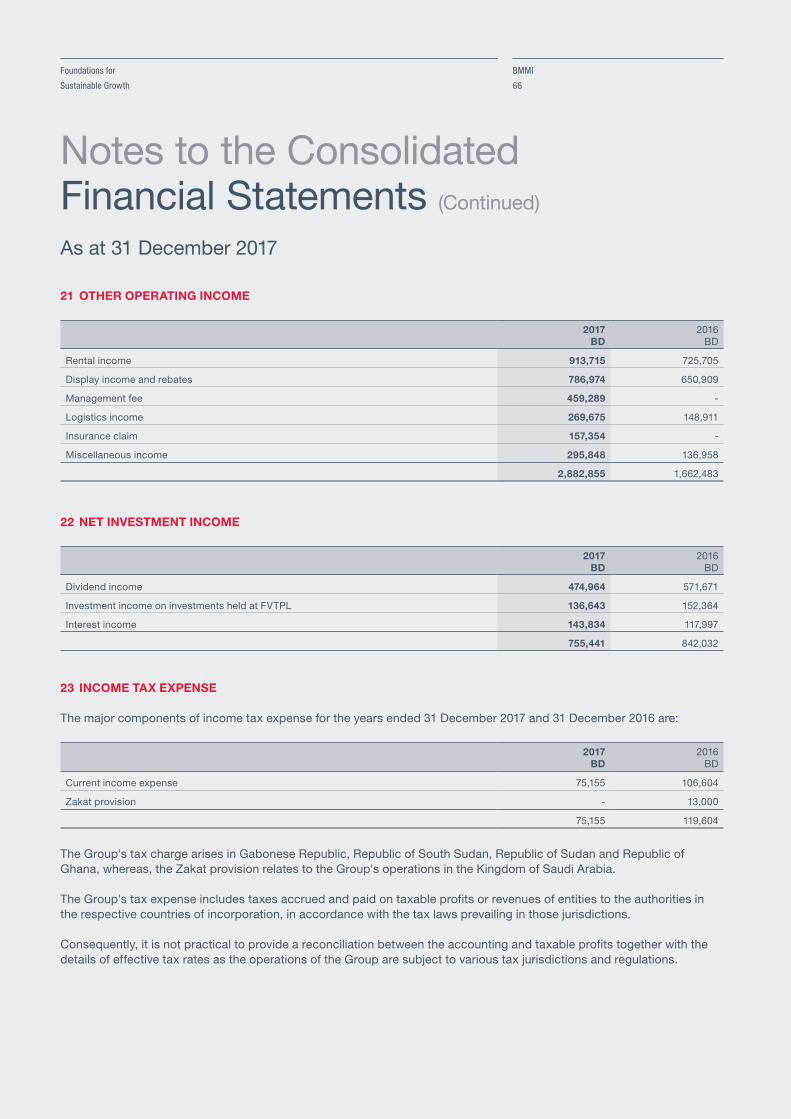
Foundations for
Sustainable Growth
BMMI
66
21 OTHER OPERATING INCOME
2017BD
2016BD
Rental income 913,715 725,705
Display income and rebates 786,974 650,909
Management fee 459,289 -
Logistics income 269,675 148,911
Insurance claim 157,354 -
Miscellaneous income 295,848 136,958
2,882,855 1,662,483
22 NET INVESTMENT INCOME
2017BD
2016BD
Dividend income 474,964 571,671
Investment income on investments held at FVTPL 136,643 152,364
Interest income 143,834 117,997
755,441 842,032
23 INCOME TAX EXPENSE The major components of income tax expense for the years ended 31 December 2017 and 31 December 2016 are:
2017BD
2016BD
Current income expense 75,155 106,604
Zakat provision - 13,000
75,155 119,604
The Group's tax charge arises in Gabonese Republic, Republic of South Sudan, Republic of Sudan and Republic of Ghana, whereas, the Zakat provision relates to the Group's operations in the Kingdom of Saudi Arabia.
The Group's tax expense includes taxes accrued and paid on taxable profits or revenues of entities to the authorities in the respective countries of incorporation, in accordance with the tax laws prevailing in those jurisdictions.
Consequently, it is not practical to provide a reconciliation between the accounting and taxable profits together with the details of effective tax rates as the operations of the Group are subject to various tax jurisdictions and regulations.
Notes to the ConsolidatedFinancial Statements (Continued)
As at 31 December 2017

Annual Report
2017
BMMI
67
24 EARNINGS PER SHARE
Basic earnings per share is calculated by dividing the profit for the year attributable to ordinary equity holders of BMMI B.S.C. by the weighted average number of ordinary shares outstanding during the year, net of treasury shares. The following reflects the profit and share data used in the basic earnings per share computations:
2017BD
2016BD
Profit for the year attributable to ordinary equity holders of BMMI B.S.C. 8,609,225 9,418,380
Weighted average number of shares, net of treasury shares 138,743,750 138,743,750
Basic and diluted earnings per share (fils) 62 68
Basic and diluted earnings per share are the same as the Company has not issued any instruments that would have a dilutive effect. There have been no other transactions involving ordinary or potential ordinary shares between the reporting date and the date of completion of these consolidated financial statements, that would have a dilutive effect.
25 RELATED PARTY DISCLOSURES
Related parties represent the joint ventures, major shareholders, directors and key management personnel of the Group entities, and entities controlled, jointly controlled or significantly influenced by such parties. Pricing policies and terms of these transactions are approved by the Group's management.
Transactions with related parties included in the consolidated statement of income are as follows:
2017 2016Selling and distribution expenses
BDCost of revenue
BDSelling and distribution expenses
BD Cost of revenue
BD
Other related parties:
Banz Group B.S.C. (c) 24,000 - 18,000 -
Joint ventures:
Inchcape Shipping Services W.L.L. - 679,633 - 217,092
24,000 679,633 18,000 217,092
Transactions with related parties are made at normal market prices in the ordinary course of business.
Balances with related parties included in the consolidated statement of financial position are as follows:
31 December 2017Trade receivables
BDDue from
BDTrade & other payables
BDJoint ventures:
B&B Logistics W.L.L. 37,498 - - Zad Marketing & Distribution W.L.L. 107,195 137,133 - Inchcape Shipping Services W.L.L. 4,295 149,350 273,305 UQLC Facility Management Company Limited - 268,987 -
148,988 555,470 273,305
Notes to the ConsolidatedFinancial Statements (Continued)
As at 31 December 2017

Foundations for
Sustainable Growth
BMMI
68
25 RELATED PARTY DISCLOSURES (Continued)
31 December 2016
Trade receivablesBD
Loan toBD
Due from
BDTrade & other payables
BD
Joint ventures:
B&B Logistics W.L.L. 37,498 - - -
Zad Marketing & Distribution W.L.L. 107,195 - 88,251 -
Inchcape Shipping Services W.L.L. 169,312 - 143,810 78,313
UQLC Facility Management Company Limited [note (i)] - 881,148 229,268 -
314,005 881,148 461,329 78,313
(i) This represents the Group's share of the loan provided to a joint venture jointly by BMMI B.S.C. and Gulftainer Company Limited. The maximum loan amount which can be utilised as per the agreements is USD 4.4 million which can only be used in the operations of the subsidiary of UQLC in Iraq and for certain other activities as per the joint venture agreement. During the year, the Group transferred the loan as investment in joint ventures.
Terms and conditions of balances with related parties except loans to a joint venture Outstanding balances at the year-end are unsecured and interest free and settlement occurs in cash except for loans given to a joint venture (refer above). There have been no guarantees provided or received for any related party receivables or payables. For the years ended 31 December 2017 and 31 December 2016, the Group has not recorded any impairment of receivables relating to amounts owed by related parties. This assessment is undertaken each financial year through examining the financial position of the related party and the market in which the related party operates.
Compensation of key management personnelKey management personnel are those persons having responsibility for planning, directing and controlling the activities of the Group. The key management personnel comprise members of the board of directors, the Chief Executive Officer, the Chief Financial Officer and the Chief Operating Officer and their compensation is as follows:
2017BD
2016BD
Board of Directors' remuneration 139,000 139,000
Board of Directors' meetings attendance fee 101,000 78,000
Keymanagementpersonnel
Short-term benefits 602,822 773,114
Employees’ end of service benefits 27,972 40,184
630,794 813,298
870,794 1,030,298
Notes to the ConsolidatedFinancial Statements (Continued)
As at 31 December 2017

Annual Report
2017
BMMI
69
26 COMMITMENTS AND CONTINGENCIES
ContingenciesThe Group had contingencies in the form of bank guarantees issued by its banks in the ordinary course of business amounting to BD 1,177,215 (2016: BD 861,435) as at 31 December 2017, from which it is anticipated that no material liabilities will arise.
LegalcaseThe Group is also involved in certain other pending legal cases as of 31 December 2017 in the normal course of business. The management believes, based on the legal advice from independent lawyers, that the outcome of the legal cases cannot be presently determined. Accordingly, the management has not recognised a provision in the consolidated statement of income for these pending legal cases as at 31 December 2017 and 31 December 2016.
CapitalcommitmentsThe Group had capital expenditure commitments of BD 33,568 (2016: BD 86,072) as at 31 December 2017.
Commitments relating to confirmed purchase orders at the reporting date amounted to BD 2,796,564 (2016: BD 2,135,751).
OperatingleasecommitmentsFuture minimum rentals payable under non-cancellable operating leases as at 31 December, are as follows:
2017BD
2016BD
Within one year 794,159 803,901
After one year but not more than five years 2,222,703 2,640,959
More than five years 1,198,411 1,618,079
Aggregate operating lease expenditure contracted
for at the reporting date 4,215,273 5,062,939
The future minimum rentals payable above include BD 819,060 (2016: BD 1,216,620) which represents the extended lease agreement to manage Najibi Centre up to 31 May 2019 and BD 1,432,340 (2016: BD 1,611,280) to manage Amwaj Centre up to 31 December 2025.
27 MATERIAL PARTLY-OWNED SUBSIDIARY
Financial information of subsidiary that has material non-controlling interests is provided below:
Country of incorporation 2017 2016
Ownership interest held by non-controlling interestsBanader Hotels Company B.S.C. ("Banader") Kingdom of Bahrain 46.09% 46.09%
2017BD
2016BD
Accumulated balances of material non-controlling interests 4,964,692 6,628,015
Loss allocated to material non-controlling interests (1,663,323) (1,805,967)
Notes to the ConsolidatedFinancial Statements (Continued)
As at 31 December 2017

Foundations for
Sustainable Growth
BMMI
70
27 MATERIAL PARTLY-OWNED SUBSIDIARY (Continued)
The summarised financial information of the subsidiary is provided below. This information is based on amounts before inter-company eliminations.
2017BD
2016BD
Summarised statement of comprehensive income:
Revenue 3,033,611 1,806,117
Cost of revenue (1,548,268) (1,852,078)
Selling and distribution expenses (872,514) (225,774)
General and administrative expenses (2,994,992) (2,853,703)
Finance costs (1,226,695) (792,911)
Loss for the year and total comprehensive loss (3,608,858) (3,918,349)
Attributable to non-controlling interests (1,663,323) (1,805,967)
2017BD
2016BD
Summarised statement of financial position:
Property, plant and equipment (non-current) 40,630,847 42,267,135
Inventories (current) 61,514 153,608
Trade and other receivables (current) 400,458 330,315
Cash, bank balances and short term deposits (current) 225,000 497,662
Employees' end of service benefits (non-current) (60,867) (65,309)
Amount due to a related party (non-current) (7,001,254) (3,698,473)
Loans and borrowings (non-current) (19,082,611) (20,029,755)
Loans and borrowings (current) (2,273,731) (1,636,132)
Trade and other payable (current) (527,666) (658,185)
Retentions payables (current) (1,599,956) (2,780,273)
Equity 10,771,734 14,380,593
Attributable to non-controlling interest 4,964,692 6,628,015
2017BD
2016BD
Summarised statement of cash flows information:
Net cash flows used in operating activities (1,709,803) (3,558,262)
Net cash flows used in investing activities (329,400) (651,221)
Net cash flows from financing activities 1,766,541 4,608,819
Net (decrease) increase in cash and cash equivalents (272,662) 399,336
Notes to the ConsolidatedFinancial Statements (Continued)
As at 31 December 2017

Annual Report
2017
BMMI
71
28 OPERATING SEGMENTS
The primary segment reporting format is determined to be business segments as the Group’s risks and rates of return are affected predominantly by differences in the products and services provided. Secondary information is reported geographically. The operating businesses are organised and managed separately according to the nature of the products and services provided, with each segment representing a strategic business unit that offers different products and serves different markets.
For management purposes, the Group is organised into four main operating segments:
Contract services and supply - Contract supply of food, beverages and other consumer products and related services.
Retail and distribution - Retail and distribution of food, beverages and other consumer products.
Investments and other activities - This consists of investment properties, investments, bank balances, and certain payables that are managed on a Group basis. Hospitality - This consist of the Group's hotel business.
Management monitors the operating results of the operating segments separately for the purpose of making decisions about resource allocation and performance assessment. Segment performance is evaluated based on operating results and is measured consistently with operating results in the consolidated financial statements.
Transfer prices between operating segments are on an arm's length basis in a manner similar to transactions with third parties, and are eliminated on consolidation.
Geographicinformation
Revenue from external customers2017
BD2016
BD
Kingdom of Bahrain 86,170,294 79,325,624
Other GCC countries 2,309,357 1,512,852
Other foreign countries - Africa 13,357,792 15,705,107
Total revenue as per the consolidated statement of income 101,837,443 96,543,583
The revenue information above is based on the location of the customer.
The table below summarises the distribution of total assets and liabilities into geographical segments:
Total assets Total liabilities2017
BD2016
BD2017
BD2016
BD
Kingdom of Bahrain 103,816,395 93,312,634 38,749,109 34,302,646
Other GCC countries 2,202,255 3,459,302 305,769 866,913
Other foreign countries - Africa 8,420,478 13,341,365 5,443,018 5,383,069
Total 114,439,128 110,113,301 44,497,896 40,552,628
Notes to the ConsolidatedFinancial Statements (Continued)
As at 31 December 2017

Foundations for
Sustainable Growth
BMMI
72
28 OPERATING SEGMENTS (Continued)
Contract services and supply Retail and distribution Investment and other activities Hospitality Adjustments and eliminations Total2017
BD2016
BD2017
BD2016
BD2017
BD2016
BD2017
BD2016
BD2017
BD2016
BD2017
BD2016
BD
Revenue - external customers 16,774,919 18,386,740 82,028,913 76,350,726 - - 3,033,611 1,806,117 - - 101,837,443 96,543,583
Revenue - inter-segment - - (446,873) (389,214) - - - - 446,873 389,214 - -
Total revenue 16,774,919 18,386,740 81,582,040 75,961,512 - - 3,033,611 1,806,117 446,873 389,214 101,837,443 96,543,583
Cost of revenue (13,640,896) (14,530,238) (57,815,248) (51,717,027) - - (1,548,268) (1,852,078) (446,873) (389,214) (73,451,285) (68,488,557)
Gross profit (loss) 3,134,023 3,856,502 23,766,792 24,244,485 - - 1,485,343 (45,961) - - 28,386,158 28,055,026
Investment properties - - - - - 1,118,685 - - - - - 1,118,685
Share of results of joint venture and an associate (120,644) (153,970) 1,238,221 423,847 - (343,838) - - - - 1,117,577 (73,961)
Losses on investments carried at FVTPL - - - - (4,613) (2,220) - - - - (4,613) (2,220)
Gains on disposal of investment income - - - - 755,441 842,032 - - - - 755,441 842,032
Other operating income 476,853 - 1,096,029 650,909 2,241,394 1,751,892 - - (931,421) (740,318) 2,882,855 1,662,483
Expenses excluding depreciation (3,109,319) (3,667,414) (12,955,496) (11,210,493) (3,748,605) (3,061,507) (1,901,818) (1,457,010) 723,796 (576,970) (20,991,442) (19,973,394)
Depreciation (90,312) (177,185) (824,754) (880,737) (883,542) (218,961) (1,965,688) (1,622,467) - - (3,764,296) (2,899,350)
Finance costs (45,821) (29,317) (52,152) (57,011) (124,052) (88,160) (1,226,695) (792,911) 207,625 70,115 (1,241,095) (897,284)
Impairment of goodwill (119,528) (100,000) - - - - - - - - (119,528) (100,000)
Income tax expense (75,155) (106,604) - (13,000) - - - - - - (75,155) (119,604)
Profit (loss) for the year 50,097 (377,988) 12,268,640 13,158,000 (1,763,977) (2,077) (3,608,858) (3,918,349) - (1,247,173) 6,945,902 7,612,413
Capital expenditure 1,916,324 8,541,862 - 1,339,757 506,177 - 329,400 - - (7,326,492) 2,751,901 2,555,127
Operating assets 8,709,893 10,312,791 17,689,834 15,686,634 64,474,002 62,125,971 41,317,819 43,248,720 (17,752,420) (21,260,815) 114,439,128 110,113,301
Operating liabilities 5,415,274 11,774,388 10,483,986 10,771,009 5,533,798 3,248,374 30,576,613 28,898,656 (7,511,775) (14,139,799) 44,497,896 40,552,628
Inter-segment transactions are eliminated upon consolidation and reflected in the "adjustments and elimination" column.
Notes to the ConsolidatedFinancial Statements (Continued)
As at 31 December 2017

Annual Report
2017
BMMI
73
28 OPERATING SEGMENTS (Continued)
Contract services and supply Retail and distribution Investment and other activities Hospitality Adjustments and eliminations Total2017
BD2016
BD2017
BD2016
BD2017
BD2016
BD2017
BD2016
BD2017
BD2016
BD2017
BD2016
BD
Revenue - external customers 16,774,919 18,386,740 82,028,913 76,350,726 - - 3,033,611 1,806,117 - - 101,837,443 96,543,583
Revenue - inter-segment - - (446,873) (389,214) - - - - 446,873 389,214 - -
Total revenue 16,774,919 18,386,740 81,582,040 75,961,512 - - 3,033,611 1,806,117 446,873 389,214 101,837,443 96,543,583
Cost of revenue (13,640,896) (14,530,238) (57,815,248) (51,717,027) - - (1,548,268) (1,852,078) (446,873) (389,214) (73,451,285) (68,488,557)
Gross profit (loss) 3,134,023 3,856,502 23,766,792 24,244,485 - - 1,485,343 (45,961) - - 28,386,158 28,055,026
Investment properties - - - - - 1,118,685 - - - - - 1,118,685
Share of results of joint venture and an associate (120,644) (153,970) 1,238,221 423,847 - (343,838) - - - - 1,117,577 (73,961)
Losses on investments carried at FVTPL - - - - (4,613) (2,220) - - - - (4,613) (2,220)
Gains on disposal of investment income - - - - 755,441 842,032 - - - - 755,441 842,032
Other operating income 476,853 - 1,096,029 650,909 2,241,394 1,751,892 - - (931,421) (740,318) 2,882,855 1,662,483
Expenses excluding depreciation (3,109,319) (3,667,414) (12,955,496) (11,210,493) (3,748,605) (3,061,507) (1,901,818) (1,457,010) 723,796 (576,970) (20,991,442) (19,973,394)
Depreciation (90,312) (177,185) (824,754) (880,737) (883,542) (218,961) (1,965,688) (1,622,467) - - (3,764,296) (2,899,350)
Finance costs (45,821) (29,317) (52,152) (57,011) (124,052) (88,160) (1,226,695) (792,911) 207,625 70,115 (1,241,095) (897,284)
Impairment of goodwill (119,528) (100,000) - - - - - - - - (119,528) (100,000)
Income tax expense (75,155) (106,604) - (13,000) - - - - - - (75,155) (119,604)
Profit (loss) for the year 50,097 (377,988) 12,268,640 13,158,000 (1,763,977) (2,077) (3,608,858) (3,918,349) - (1,247,173) 6,945,902 7,612,413
Capital expenditure 1,916,324 8,541,862 - 1,339,757 506,177 - 329,400 - - (7,326,492) 2,751,901 2,555,127
Operating assets 8,709,893 10,312,791 17,689,834 15,686,634 64,474,002 62,125,971 41,317,819 43,248,720 (17,752,420) (21,260,815) 114,439,128 110,113,301
Operating liabilities 5,415,274 11,774,388 10,483,986 10,771,009 5,533,798 3,248,374 30,576,613 28,898,656 (7,511,775) (14,139,799) 44,497,896 40,552,628
Inter-segment transactions are eliminated upon consolidation and reflected in the "adjustments and elimination" column.
Notes to the ConsolidatedFinancial Statements (Continued)
As at 31 December 2017

Foundations for
Sustainable Growth
BMMI
74
29 ACQUISITION OF A SUBSIDIARY THROUGH CONVERSION OF ASSOCIATE'S PREFERENCE SHARES
The Group had a 30.48% stake in Banader Hotels Company B.S.C. (Banader) and owned 60,000 convertible preference shares in Banader until 9 April 2016. On 10 April 2016, the Group increased its holding in the share capital of Banader to 53.91% through the conversion of 60,000 preference shares into 78 million ordinary shares. As a result, effective 10 April 2016, Banader became a subsidiary of the Group and has been consolidated from that date. The Group invested in Banader to diverse its operations in the hospitality industry. Banader owns the Downtown Rotana Hotel in the Kingdom of Bahrain, which is managed by Rotana Hotel Management Corporation Limited L.L.C. under a 10 year agreement.
The acquisition was provisionally accounted for using carrying values of the property, plant and equipment as the fair values were not available at the acquisition date. During the current year, the Group completed the fair valuation exercise which did not result any change in the fair value of assets acquired and liabilities assumed at the acquisition date. The fair values of assets acquired and liabilities assumed of Banader on the date of acquisition are as follows:
Fair values recognised on acquisition
BD
Assets
Property, plant and equipment 43,747,755
Inventories 536,249
Trade and other receivables 436,058
Bank balance and cash 1,286,655
46,006,717
Liabilities
Loans and borrowings 22,006,120
Employees' end of service benefits (note 18) 43,828
Retentions payable 3,094,617
Trade and other payables 2,562,813
27,707,378
Total indefinable net assets at fair value 18,299,339
Less: Carrying value of Banader already carried in the books (9,200,400)
Less: Non-controlling interests (8,433,982)
Gain on acquisition 664,957
NET LOSS ON ACQUISITION
Loss on revaluation of associate on acquisition (694,670)
Gain on acquisition 664,957
Net loss on acquisition included in general and administrative expenses (29,713)The net cash inflow on the acquisition of Banader is as follows:Bank balance and cash 1,286,655
From the date of acquisition, Banader Hotels has contributed BD 1,806,117 of revenue and a loss of BD 3,949,275 to the results of the Group. If the acquisition had taken place at the beginning of 2016, revenue of the Group for the year ended 31 December 2016 would have been BD 96,660,449 and results of the Group for the year ended 31 December 2016 would have been BD 6,828,175.
Notes to the ConsolidatedFinancial Statements (Continued)
As at 31 December 2017

Annual Report
2017
BMMI
75
30 FINANCIAL RISK MANAGEMENT OBJECTIVES AND POLICIES
The Group's principal financial liabilities comprise of loans and borrowings, retentions payable, a portion of trade and other payables and bank overdrafts. The main purpose of these financial liabilities is to finance the Group's day-to-day operations and capital expenditure. The Group has a portion of trade and other receivables and cash, bank balances and short-term deposits that arise directly from its operations. The Group also holds investments and loan to a joint venture. The Group is exposed to market, credit, liquidity and operational risks The Group's senior management oversees the management of these risks. The Group’s senior management is supported by an Investment and Finance Committee that advises on financial risks and the appropriate financial risk governance framework for the Group. The Investment and Finance Committee provides assurance to the Group’s senior management that the Group’s financial risk-taking activities are governed by appropriate policies and procedures and that financial risks are identified, measured and managed in accordance with Group's policies and Group's risk appetite. The Board of Directors reviews and agrees policies for managing each of these risks which are summarised below:
Market risk Market risk is the risk that the fair value of future cash flows of a financial instrument will fluctuate because of changes in market prices. Market risk comprises of interest rate risk, equity price risk and foreign currency risk. Financial instruments affected by market risk include, a portion of trade and other receivables, bank balances and short-term deposits, investments, loans and borrowings, retentions payable, bank overdrafts and a portion of trade and other payables.
The sensitivity analysis in the following sections relate to the position as at 31 December 2017 and 31 December 2016.
The sensitivity analysis have been prepared on the basis that the proportion of financial instruments in foreign currencies are all constant at 31 December 2017 and 31 December 2016.
The analysis excludes the impact of movements in market variables on the carrying value of end of service benefits, provisions and on the non-financial assets and liabilities of foreign operations.
The following assumptions have been made in calculating the sensitivity analysis:
(a) The consolidated statement of financial position sensitivity relates to investments, loan to a joint venture, cash, bank balances and short-term deposits, a portion of trade and other receivables, a portion of trade and other payables and bank overdrafts.
(b) The sensitivity of the consolidated statement of income is the effect of the assumed changes in market risk. This is based on the financial assets and financial liabilities held at 31 December 2017 and 31 December 2016.
InterestRateRiskInterest rate risk is the risk that the fair value or future cash flows of a financial instrument will fluctuate because of changes in market interest rates.
The Group is exposed to interest rate risk on its variable interest bearing assets and liabilities (loans and borrowings and bank overdrafts).
The sensitivity, to a reasonably possible change in interest rates with all other variables held constant, on the Group's profit is as follows:
2017 2016
Increase (decrease) in basis points +50 -25 +50 -25
(Decrease) increase in profit [in BD] (125,453) 62,727 (113,413) 56,707
Notes to the ConsolidatedFinancial Statements (Continued)
As at 31 December 2017
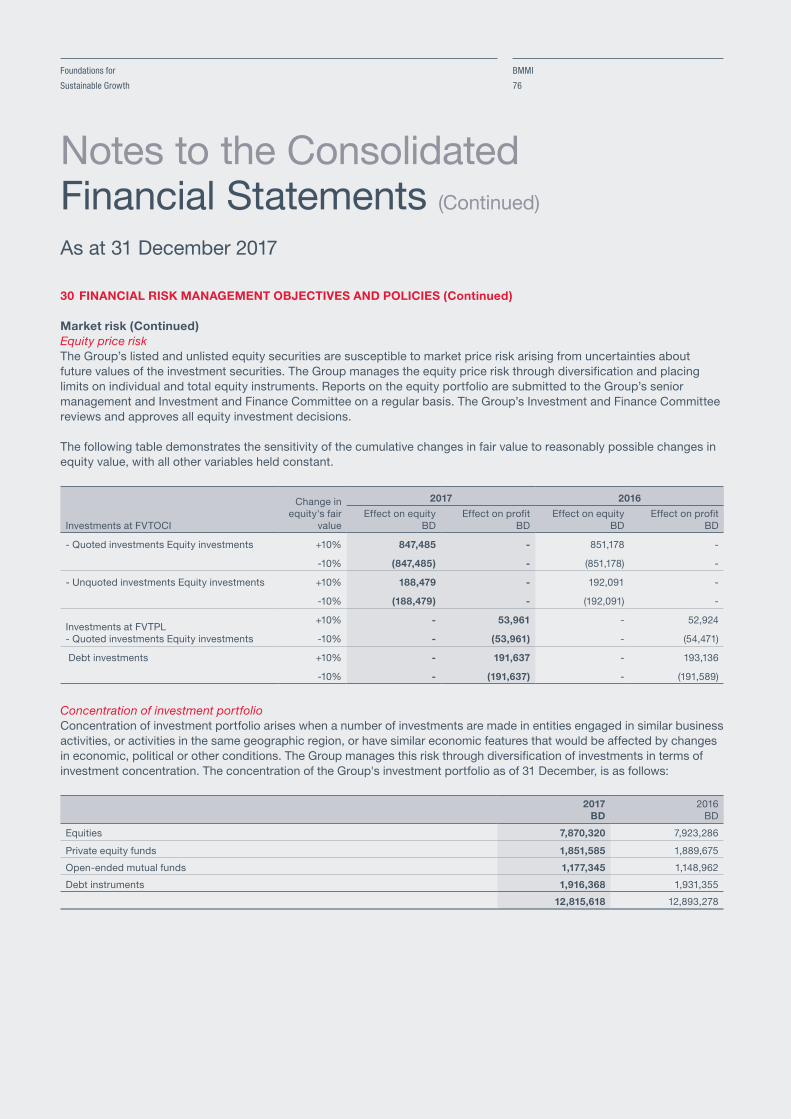
Foundations for
Sustainable Growth
BMMI
76
30 FINANCIAL RISK MANAGEMENT OBJECTIVES AND POLICIES (Continued)
Market risk (Continued)EquitypriceriskThe Group’s listed and unlisted equity securities are susceptible to market price risk arising from uncertainties about future values of the investment securities. The Group manages the equity price risk through diversification and placing limits on individual and total equity instruments. Reports on the equity portfolio are submitted to the Group’s senior management and Investment and Finance Committee on a regular basis. The Group’s Investment and Finance Committee reviews and approves all equity investment decisions. The following table demonstrates the sensitivity of the cumulative changes in fair value to reasonably possible changes in equity value, with all other variables held constant.
Investments at FVTOCI
Change in equity's fair
value
2017 2016Effect on equity
BDEffect on profit
BDEffect on equity
BDEffect on profit
BD
- Quoted investments Equity investments +10% 847,485 - 851,178 -
-10% (847,485) - (851,178) -
- Unquoted investments Equity investments +10% 188,479 - 192,091 -
-10% (188,479) - (192,091) -
Investments at FVTPL- Quoted investments Equity investments
+10% - 53,961 - 52,924
-10% - (53,961) - (54,471)
Debt investments +10% - 191,637 - 193,136
-10% - (191,637) - (191,589)
ConcentrationofinvestmentportfolioConcentration of investment portfolio arises when a number of investments are made in entities engaged in similar business activities, or activities in the same geographic region, or have similar economic features that would be affected by changes in economic, political or other conditions. The Group manages this risk through diversification of investments in terms of investment concentration. The concentration of the Group's investment portfolio as of 31 December, is as follows:
2017BD
2016BD
Equities 7,870,320 7,923,286
Private equity funds 1,851,585 1,889,675
Open-ended mutual funds 1,177,345 1,148,962
Debt instruments 1,916,368 1,931,355
12,815,618 12,893,278
Notes to the ConsolidatedFinancial Statements (Continued)
As at 31 December 2017

Annual Report
2017
BMMI
77
30 FINANCIAL RISK MANAGEMENT OBJECTIVES AND POLICIES (Continued)
Market risk (Continued)ForeigncurrencyriskForeign currency risk is the risk that the fair value or future cash flows of a financial instrument will fluctuate because of changes in foreign exchange rates. The Group’s exposure to the risk of changes in foreign exchange rates relates primarily to the Group’s operating activities (when revenue or expense are denominated in a different currency from the Group’s presentational currency) and the Group’s net investments in foreign subsidiaries.
As the Bahraini Dinar is pegged to the US Dollar, balances in the US Dollars and currencies pegged with the US Dollar are not considered to represent a significant foreign currency risk. The Group's exposure to foreign currency financial assets and liabilities, are as follows:
2017 2016
AssetsBD equivalent
LiabilitiesBD equivalent
AssetsBD equivalent
LiabilitiesBD equivalent
Euro 30,150 67,528 121,256 129,096
Pound Sterling (GBP) 6,702 8,750 40,132 42,647
Other currencies 5,782,990 772,327 4,329,902 1,736,178
The table below indicates the Group’s sensitivity to foreign currency exposure at 31 December, as a result of its monetary assets and liabilities. The analysis calculates the effect of a 5% upward movement of the Bahraini Dinar currency rate against the Euro, the Pound Sterling (GBP) and other currencies, with all other variables held constant, on the consolidated statement of income (due to the fair value of currency sensitive monetary assets and liabilities and the Group's consolidated statement of other comprehensive income due to changes in the net investment in foreign subsidiaries).
2017 2016
Effect on profitBD
Effect on equityBD
Effect on profitBD
Effect on equityBD
Change in foreign exchange rates ±5% ±5% ±5% ±5%
Euro 1,869 - 392 -
Pound Sterling (GBP) 102 - 126 -
Other currencies - (250,533) - (129,686)
Credit riskCredit risk is the risk that a counterparty will not meet its obligations under a financial instrument or customer contract, leading to a financial loss. The Group is exposed to credit risk from its operating activities (primarily for trade receivables) and from its investing activities, including bank balances and short-term deposits with banks and financial institutions, investments in debt instruments and other financial instruments.
TradereceivablesandloanstoajointventureThe Group trades only with recognised, creditworthy third parties. It is the Group’s policy that all customers who wish to trade on credit terms are subject to credit verification procedures. In addition, receivable balances are monitored on an ongoing basis with the result that the Group’s exposure to bad debts is not significant. The management does not believe that there is any significant credit risk associated with the loan to a joint venture.
Notes to the ConsolidatedFinancial Statements (Continued)
As at 31 December 2017

Foundations for
Sustainable Growth
BMMI
78
30 FINANCIAL RISK MANAGEMENT OBJECTIVES AND POLICIES (Continued)
Credit risk (Continued)Bankbalances,short-termdepositsandinvestmentsindebtinstrumentsWith respect to credit risk from the financial assets of the Group, which comprise bank balances, short- term deposits and investments in debt instruments, the Group’s exposure to credit risk arises from default of the counterparty. The maximum exposure equals to the carrying amount of these instruments. The Group limits credit risk by dealing only with reputable banks and investing in government bonds.
GrossmaximumexposureThe table below shows the gross maximum exposure to credit risk for the Group's consolidated statement of financial position headings which are considered to be performing:
2017BD
2016BD
Bank balances and short-term deposits 2,909,088 2,233,935
Trade and other receivables 19,706,926 16,298,652
Investments (debt instruments) 1,916,368 1,931,355
Loan to a joint venture - 881,148
24,532,382 21,345,090
The Group investments in debt instruments as of 31 December 2017 and 31 December 2016, were neither past due nor impaired.
CreditriskconcentrationsConcentrations of credit risk arise when a number of counterparties are engaged in similar business activities, or activities in the same geographic region, or have similar economic features that would cause their ability to meet contractual obligations to be similarly affected by changes in economic, political or other conditions. Concentrations of credit risk indicate the relative sensitivity of the Group’s performance to developments affecting a particular industry or geographic location. The Group sells its products to a large number of wholesalers and retailers. Its five largest customers account for 15% (2016: 9%) of the outstanding trade receivables at 31 December 2017.
The distribution of the Group's financial assets are as follows:
31 December 2017
Investments in debt instruments
BD
Loans and receivables
BD
Bank balances and short-term deposits
BDGeographic regions
Bahrain 1,586,874 15,896,472 1,126,117 Other GCC countries 329,494 310,593 259,391 African countries - 3,499,861 1,523,580
1,916,368 19,706,926 2,909,088
31 December 2016
Investments in debt instruments
BDLoans and receivables
BD
Bank balances and short-term deposits
BD
Geographic regions
Bahrain 1,591,048 9,652,150 1,639,799
Other GCC countries 340,307 1,562,789 65,197
African countries - 4,854,445 511,594
Republic of Iraq - 1,110,416 17,345
1,931,355 17,179,800 2,233,935
Notes to the ConsolidatedFinancial Statements (Continued)
As at 31 December 2017

Annual Report
2017
BMMI
79
30 FINANCIAL RISK MANAGEMENT OBJECTIVES AND POLICIES (Continued)
Credit risk (Continued)Creditriskconcentrations(Continued)
31 December 2017
Investments in debt instruments
BD
Trade and other receivables
BD
Bank balances and short-term deposits
BD
Industry sectors
Banking 774,116 - 2,909,088
Government 1,142,252 - -
Trading - 19,706,926 -
Total 1,916,368 19,706,926 2,909,088
31 December 2016
Investments in debt instruments
BD
Trade and other receivables
BD
Bank balances andshort-term deposits
BD
Industry sectors
Banking 767,798 - 2,233,935
Government 1,163,557 - -
Trading - 17,179,800 -
Total 1,931,355 17,179,800 2,233,935
Liquidity riskThe Group limits its liquidity risk by ensuring bank facilities are available. The Group's terms of sales require amounts to be paid within 30-90 days of the date of sale. Trade payables are normally settled within 60 days of the date of purchase. The table below summarises the maturity profile of the Group’s financial liabilities as at 31 December, based on contractual undiscounted payment and current market interest rates.
31 December 2017On demand
BD Less than 3 months
BD 3 to 12 months
BD 1 to 10 years
BD Total
BD
Bank overdrafts 895,452 - - - 895,452
Trade and other payables 781,380 11,396,596 - - 12,177,976
Loans and borrowings - 3,673,911 2,470,792 22,241,386 28,386,089
Retentions payable - - 1,599,956 - 1,599,956
1,676,832 15,070,507 4,070,748 22,241,386 43,059,473
31 December 2016On demand
BD Less than 3 months
BD 3 to 12 months
BD 1 to 10 years
BD Total BD
Bank overdrafts 364,767 - - - 364,767
Trade and other payables 624,523 7,735,153 - - 8,359,676
Loans and borrowings - 1,067,319 1,257,470 23,334,665 25,659,454
Retentions payable - - 2,780,273 - 2,780,273
989,290 8,802,472 4,037,743 23,334,665 37,164,170
Notes to the ConsolidatedFinancial Statements (Continued)
As at 31 December 2017

Foundations for
Sustainable Growth
BMMI
80
30 FINANCIAL RISK MANAGEMENT OBJECTIVES AND POLICIES (Continued)
Operational riskOperational risk is the risk of loss arising from system failure, human error, fraud or external events. When controls fail to perform, operational risks can cause damage to reputation, have legal or regulatory implications, or lead to financial loss. The Group cannot expect to eliminate all operational risks, but through a control framework and by monitoring and responding to potential risks, the Group is able to manage the risks. Controls include effective segregation of duties, access, authorisation and reconciliation procedures, staff education and assessment processes, including the use of internal audit.
Changes in liabilities arising from financing activities
As at 1 January 2017
BD
Cash flows Dividendrecognised
BDOthers
BD
As at 31 December2017
BDAvailed
BDPayments
BD
Loans and borrowings 22,317,902 4,588,492 (2,711,158) - - 24,195,236
Unclaimed dividend 624,523 - (6,780,331) 6,937,188 - 781,380
Retentions payable 2,780,273 - (1,180,317) - - 1,599,956
25,722,698 4,588,492 (10,671,806) 6,937,188 - 26,576,572
As at 1 January 2016
BD
Cash flows Dividend
recognisedBD
Acquisition ofsubsidiary
BD
As at 31 December
2016BD
AvailedBD
PaymentsBD
Loans and borrowings 884,359 300,000 (872,577) - 22,006,120 22,317,902
Unclaimed dividend 547,281 - (6,859,946) 6,937,188 - 624,523
Retentions payable - - (314,344) - 3,094,617 2,780,273
1,431,640 300,000 (8,046,867) 6,937,188 25,100,737 25,722,698
Capital managementThe primary objective of the Group’s capital management is to ensure that it maintains a strong credit rating and healthy capital ratios in order to support its business and maximize shareholders' value.
In order to achieve this overall objective, the Group’s capital management, amongst other things, aims to ensure that it meets financial covenants attached to the credit facility agreements that define capital structure requirements. Breaches in meeting the financial covenants would permit the bank to immediately call loans and borrowings. There have been no breaches in the financial covenants of any credit facility agreements in during the years ended 31 December 2017 and 31 December 2016.
The Group manages its capital structure and makes adjustments to it, in light of changes in economic conditions. To maintain or adjust the capital structure, the Group may adjust the dividend payment to shareholders or issue new shares. No changes were made in the objectives, policies or processes during the years ended 31 December 2017 and 31 December 2016, respectively. Equity comprises of share capital, other reserves, and retained earnings net of treasury shares attributable to the equity holders of BMMI B.S.C. and is measured at BD 64,976,540 (2016: BD 62,932,658) as at 31 December 2017.
Notes to the ConsolidatedFinancial Statements (Continued)
As at 31 December 2017

Annual Report
2017
BMMI
81
31 FAIR VALUE MEASUREMENT
Fair value is the price that would be received to sell an asset or paid to transfer a liability in an orderly transaction between market participants at the measurement date.
FairvalueoffinancialinstrumentsFinancial instruments of the Group comprise of financial assets and financial liabilities.
Financial assets consist of loan to a joint venture, investments, a portion of trade and other receivables and cash, bank balances and short-term deposits. Financial liabilities consist of loans and borrowings, retentions payable, a portion of trade and other payables and bank overdrafts.
Fair value of financial instruments is estimated based on the following methods and assumptions:
a) Cash, bank balances and short-term deposits, bank overdrafts, a portion of trade and other receivables, retentions payable and a portion of trade and other payables approximate their carrying amounts largely due to the short-term maturities of these instruments;
b) Loans and borrowings and loan to a joint venture are evaluated by the Group based on parameters such as interest rates. The carrying amounts are not materially different from their fair values as at 31 December 2017 and 31 December 2016; and
c) The fair values of the quoted investments are determined by reference to published price quotations in an active market.
Fairvaluesofnon-financialinstrumentsThe Group measured its investment properties at fair value and disclosures relating to the fair value have been disclosed in note 6.
FairvaluehierarchyFor fair value hierarchy of the Group's assets and liabilities, refer to note 9.
FinancialinstrumentsbycategoriesSet out below is an overview of financial instruments held by the Group:
31 December 2017Amortised cost
BD
Fair value through profit or loss
BD
Fair value through other comprehensive
incomeBD
TotalBD
Financial assets:Investments - 2,455,979 10,359,639 12,815,618 Trade and other receivables 19,706,926 - - 19,706,926 Cash, bank balances and short-term deposits 3,093,958 - - 3,093,958
22,800,884 2,455,979 10,359,639 35,616,502
Financial liabilities:Bank overdrafts 895,452 - - 895,452 Trade and other payables 12,177,976 - - 12,177,976 Loans and borrowings 24,195,236 - - 24,195,236 Retentions payable 1,599,956 - - 1,599,956
38,868,620 - - 38,868,620
Notes to the ConsolidatedFinancial Statements (Continued)
As at 31 December 2017

Foundations for
Sustainable Growth
BMMI
82
31 FAIR VALUE MEASUREMENT (Continued) Financialinstrumentsbycategories(Continued)
31 December 2016Amortised cost
BD
Fair value throughprofit or loss
BD
Fair value through other comprehensive income
BDTotal
BD
Financial assets:
Investments - 2,460,596 10,432,682 12,893,278
Trade and other receivables 16,298,652 - - 16,298,652
Cash, bank balances and short-term deposits 2,409,183 - - 2,409,183
Loan to a joint venture 881,148 - - 881,148
19,588,983 2,460,596 10,432,682 32,482,261
31 December 2016Amortised cost
BD
Fair value through profit or loss
BD
Fair value through other comprehensive income
BDTotal
BD
Financial liabilities:
Bank overdrafts 364,767 - - 364,767
Trade and other payables 8,359,676 - - 8,359,676
Loans and borrowings 22,317,902 - - 22,317,902
Retentions payable 2,780,273 - - 2,780,273
33,822,618 - - 33,822,618
32 RECLASSIFICATION OF COMPARATIVE FIGURE
Certain of the prior year amounts have been reclassified to conform to the presentation in the current year. Such reclassifications do not affect previously reported profit or equity.
33 CORPORATE GOVERNANCE DISCLOSURES
(i) Board, Board Members and ManagementBoardandDirectors’responsibilitiesThe Board of Directors is accountable to shareholders for the proper and prudent investment and preservation of shareholders' interests. The Board of Directors' role and responsibilities include but are not limited to:
• Monitoring the overall business performance;• Monitoring management's performance and succession plan for senior management;• Monitoring conflicts of interest and preventing abusive related party transactions;• Accurate preparation of the annual and quarterly consolidated financial statements;• Convening and preparing for the shareholders' meetings;• Recommend dividend to shareholders and ensure its execution;• Adopt, implement and monitor compliance with the Group’s Code of Conduct;• Review the Group’s objectives and policies relating to social responsibilities; and• Select, interview and appoint Chief Executive Officer and other selected members of the senior management.
In this respect, the Directors remain individually and collectively responsible for performing all of the Board of Director’s responsibilities.
Notes to the ConsolidatedFinancial Statements (Continued)
As at 31 December 2017

Annual Report
2017
BMMI
83
33 CORPORATE GOVERNANCE DISCLOSURES
(i) Board, Board Members and Management (Continued)Material transactions requiring board approval The following material transactions require Board's review, evaluation and approval:• The Company's strategy;• The annual budget;• Major resource allocations and capital investments; and• Management responsibilities and training, development and succession plan for senior management.
Election system of directors and termination processElection / re-election of the Board members take place every three years at the meeting of the shareholders. The last election of Board members was held on 16 March 2015.
Termination of a Board member’s mandate usually occurs by dismissal at the meeting of the shareholders or by the member’s resignation from the Board of Directors.
Directors trading of the Company's sharesDuring the year ended 31 December 2017,Chairman Abdulla Hassan Buhindi sold 494,418 of BMMI's shares which brought his share ownership down from 1,145,677 shares to 651,259 shares (0.444% of the total outstanding shares). Furthermore, Board Member, Mr. Jehad Yousif Amin bought 80,000 of BMMI's shares which brought his share ownership up from 500,000 shares to 580,000 shares ( 0.396% of the total outstanding shares).
Code of conduct and procedures adopted by the Board for monitoring complianceThe Board of Directors and the Group’s employees are expected to maintain the highest level of corporate ethics and personal behaviour. The Group has established a BMMI's Code of Conduct which provides an ethical and legal framework for all employees in the conduct of its business. The BMMI's Code of Conduct defines how the Group relates to its employees, shareholders and the community in which the Group operates.
The Board of Directors has adopted the BMMI Code of Business Conduct and a Company's Whistleblower Policy to monitor compliance with the Group's ethics. The Code of Business Conduct provides clear directions on conducting business internationally, interacting with governments, communities, business partners and general workplace behaviour having regard to the best practice of corporate governance models and ethics.
Notes to the ConsolidatedFinancial Statements (Continued)
As at 31 December 2017

Foundations for
Sustainable Growth
BMMI
84
33 CORPORATE GOVERNANCE DISCLOSURES (Continued)
(i) Board, Board Members and Management (Continued)The following table summarises the information about the business title, experience in years and the qualifications of each member of the Executive Management as at 31 December 2017:
Name of Executive member Designation / Business title Experience in years Qualification
Mr. Marek Sheridan Chief Executive Officer 33 Master of Business Administration.
Mr. Ammar Aqeel Chief Financial Officer 21Master of Business Administration and Fellow member of CIMA and AAT.
Mr. Robert Smith COO - Contracting Services 32Bachelor's Degree in Business Administration and Diploma in Hotel and Catering operations.
The following table summarises the total remuneration paid to members of the Executive Management during the year:
2017BD
2016BD
Salaries 343,082 436,781
Bonuses 149,852 189,470
Allowances 109,888 146,863
Employees’ end of service benefits 27,972 40,184
Total 630,794 813,298
Notes to the ConsolidatedFinancial Statements (Continued)
As at 31 December 2017

Annual Report
2017
BMMI
85
33 CORPORATE GOVERNANCE DISCLOSURES (Continued)
(i) Board, Board Members and Management (Continued)The Board of Directors consist of 8 members (2016: 8 members) as of 31 December 2017.
The Board has been elected on 16 March 2015 for a period of 3 years.
The following table summarises the information about the profession, business title, experience in years and start date of the current Board members:
Name of Board Member Profession Business TitleExecutive/non ExecutiveIndependent/ non Independent
Experience in years Start date
Mr. Abdulla Hassan Buhindi Businessman Chairman Non-executive/non-independent 51 2004
Mr. Abdulla Mohammed Juma Businessman Vice-Chairman Non-executive/ independent 47 2004
Mr. Shawki Fakhroo Businessman Director Non-executive/ independent 42 1992
Mr. Jehad Amin Businessman Director Non-executive/non-independent 40 2004
Mrs. Mona Almoayyed Businesswoman Director Non-executive/non-independent 43 2004
Mr. Mohammed Almoayyed Businessman Director Non-executive/non-independent 19 2004
Mr. Redha Faraj Businessman Director Non-executive/ independent 56 2006
Mr. Suhail Hajee Businessman Director Non-executive/ independent 26 2011
The following board members had directorship in the board of other listed companies in Bahrain:
Name of the Board memberNumber of directorships in other listed companies in Bahrain
Mr. Abdulla Hassan Buhindi 3
Mr. Shawki Fakhroo 2
Mr. Jehad Amin 6
Mr. Mohammed Almoayyed 1
Mr. Redha Faraj 1
Mr. Suhail Hajee 1
Notes to the ConsolidatedFinancial Statements (Continued)
As at 31 December 2017

Foundations for
Sustainable Growth
BMMI
86
33 CORPORATE GOVERNANCE DISCLOSURES (Continued)(i) Board, Board Members and Management (Continued)The Group should hold a minimum of five Board meetings during each year. During the year ended 31 December 2017, six meetings (2016: six meetings) of Board of Directors were held. The following table summarises the information about Board of Directors meeting dates and attendance of directors at each meeting:
Date Members attended Members not attended
13 February 2017 Mr. Abdulla Hassan Buhindi
Mr. Abdulla Mohammed Juma
Mr. Shawki Fakhroo
Mrs. Mona Almoayyed
Mr. Mohammed Almoayyed
Mr. Redha Faraj
Mr. Suhail Hajee
Mr. Jehad Amin
15 March 2017 Mr. Abdulla Hassan Buhindi
Mr. Abdulla Mohammed Juma
Mr. Shawki Fakhroo
Mrs. Mona Almoayyed
Mr. Redha Faraj
Mr. Jehad Amin
Mr. Mohammed Almoayyed
Mr. Suhail Hajee
27 April 2017 Mr. Abdulla Hassan Buhindi
Mr. Abdulla Mohammed Juma
Mr. Shawki Fakhroo
Mrs. Mona Almoayyed
Mr. Mohammed Almoayyed
Mr. Redha Faraj
Mr. Jehad Amin
Mr. Suhail Hajee
21 June 2017 Mr. Abdulla Hassan Buhindi
Mr. Abdulla Mohammed Juma
Mr. Shawki Fakhroo
Mrs. Mona Almoayyed
Mr. Mohammed Almoayyed
Mr. Redha Faraj
Mr. Jehad Amin
Mr. Suhail Hajee
Notes to the ConsolidatedFinancial Statements (Continued)
As at 31 December 2017

Annual Report
2017
BMMI
87
33 CORPORATE GOVERNANCE DISCLOSURES (Continued)
(i) Board, Board Members and Management (Continued)
Date Members attended Members not attended
30 October 2017 Mr. Abdulla Hassan Buhindi Mr. Mohammed Almoayyed
Mr. Abdulla Mohammed Juma
Mr. Shawki Fakhroo
Mrs. Mona Almoayyed
Mr. Redha Faraj
Mr. Jehad Amin
Mr. Suhail Hajee
27 November 2017 . Mr. Abdulla Hassan Buhindi
Mr. Abdulla Mohammed Juma
Mr. Shawki Fakhroo
Mrs. Mona Almoayyed
Mr. Mohammed Almoayyed
Mr. Redha Faraj
Mr. Jehad Amin
Mr. Suhail Hajee
Remuneration policyThe remuneration policy is based on basic and attendance fees amounted to BD 78,000 (2016: BD 78,000).
The total director's remuneration for the year amounted to BD 139,000 (2016: BD 139,000).
Notes to the ConsolidatedFinancial Statements (Continued)
As at 31 December 2017

Foundations for
Sustainable Growth
BMMI
88
Notes to the ConsolidatedFinancial Statements (Continued)
As at 31 December 2017
33 CORPORATE GOVERNANCE DISCLOSURES (Continued)
(ii) Committees of Board of DirectorsThe following table summarises the information about Board's Committees, their members and objectives:
Board committee Objective Members Executive/non- ExecutiveIndependent/ non- Independent
Executive Committee The Executive Committee is formed to discuss matters with the Group's managementregarding senior staffing, financial performance, operational performance, strategies and all other issues as directed by the Board.
Mr. Shawki Fakhroo
Mrs. Mona Almoayyed
Mr. Jehad Amin
Non-executive/ independent, Chairman
Non-executive/non-independent
Non-executive/non-independent
Investment and Finance Committee
The Investment and Finance Committee of BMMI is responsible for approving the Group's investment policies, strategies, transactions and reviewing the performance of the Group's investments. The Committee is also to provide assistance to the Board in the review and oversight of the Group's objectives, strategies and policies.
Mr. Abdulla Hassan Buhindi
Mrs. Mona Almoayyed
Mr. Jehad Ameen
Mr. Shawki Fakhro
Mr. Suhail Hajee
Non-executive / non-independent, Chairman
Non-executive / non-independent
Non-executive / non-independent
Non-executive/ independent
Non-executive/ independent
Audit Committee The Audit Committees is responsible for:1) Monitoring the integrity of the Financial
Reporting Process, BMMI's systems of Internal Control, review of the consolidated financial statements and reports, compliance of the Board with legal and regulatory requirements and the performance of the Group's Internal Audit function.
2) To recommend the appointment of External Auditors, agreeing their compensation, overseeing their independence and preparing reports required to be prepared by the Audit Committee pursuant to Central Bank of Bahrain, Bahrain Bourse, Bahrain Commercial Companies Law and other regulatory authorities in the Kingdom of Bahrain.
Mr. Mohammed Al Moayyed
Mr. Abdullah Mohammed Juma
Mr. Redha Faraj
Non-executive/ independent
Non-executive/ independent
Non Executive/ independent
Remuneration and Nomination Committee
Review and advise the Board on the Board's Composition, new directors nominations in addition to Board and Senior Management remuneration.
Mr. Abdulla Hassan Buhindi
Mr. Shawki Fakhroo
Mrs. Mona Al Moayyed
Mr. Jehad Amin
Non-executive/ non-independent, Chairman
Non-executive/ independent
Non-executive/non-independent
Non-executive/non-independent

Annual Report
2017
BMMI
89
33 CORPORATE GOVERNANCE DISCLOSURES (Continued)
(ii) Committees of Board of Directors(Continued)Executive CommitteeThe Group should hold a minimum of eight Executive Committee meetings each year. During the year ended 31 December 2017, eight meetings (2016: nine meetings) of the Executive Committee were held. The following table summarises the information about Committee meetings dates and attendance of directors at each meeting:
Date Members attended Members not attended
22 January 2017 Mr. Shawki Fakhroo
Mrs. Mona Almoayyed
Mr. Jehad Ameen
12 March 2017 Mr. Shawki Fakhroo
Mrs. Mona Almoayyed
Mr. Jehad Ameen
9 April 2017 Mr. Shawki Fakhroo
Mrs. Mona Almoayyed
Mr. Jehad Ameen
14 May 2017 Mr. Shawki Fakhroo
Mrs. Mona Almoayyed
Mr. Jehad Ameen
11 June 2017 Mr. Shawki Fakhroo
Mrs. Mona Almoayyed
Mr. Jehad Ameen
6 August 2017 Mr. Shawki Fakhroo
Mrs. Mona Almoayyed
Mr. Jehad Ameen
10 September 2017 Mr. Shawki Fakhroo
Mrs. Mona Almoayyed
Mr. Jehad Ameen
15 October 2017 Mr. Shawki Fakhroo
Mrs. Mona Almoayyed
Mr. Jehad Ameen
12 November 2017 Mr. Shawki Fakhroo
Mrs. Mona Almoayyed
Mr. Jehad Ameen
The total remuneration for the Executive Committee amounted to BD 31,500 (2016: BD 31,500).
Notes to the ConsolidatedFinancial Statements (Continued)
As at 31 December 2017

Foundations for
Sustainable Growth
BMMI
90
33 CORPORATE GOVERNANCE DISCLOSURES (Continued)
(ii) Committees of Board of Directors(Continued)Investment and Finance CommitteeThe Group should hold a minimum of four Investment and Finance Committee meetings each year. During the year ended 31 December 2017, four meetings (2016: four meetings) of the Investment and Finance Committee were held. The following table summarises the information about the Committee meetings dates and attendance of directors at each meeting:
Date Members attended Members not attended
13 February 2017 Mr. Abdulla Hassan Buhindi
Mrs. Mona Almoayyed
Mr. Jehad Ameen
Mr. Shawki Fakhro
Mr. Suhail Hajee
27 April 2017 Mr. Abdulla Hassan Buhindi
Mrs. Mona Almoayyed
Mr. Jehad Ameen
Mr. Shawki Fakhro
Mr. Suhail Hajee
30 October 2017 Mr. Abdulla Hassan Buhindi
Mrs. Mona Almoayyed
Mr. Jehad Ameen
Mr. Shawki Fakhro
Mr. Suhail Hajee
27 November 2017 Mr. Abdulla Hassan Buhindi
Mrs. Mona Almoayyed
Mr. Jehad Ameen
Mr. Shawki Fakhro
Mr. Suhail Hajee
The total remuneration for the Investment and Finance Committee amounted to BD 21,000 (2016: BD 21,000).
Notes to the ConsolidatedFinancial Statements (Continued)
As at 31 December 2017

Annual Report
2017
BMMI
91
33 CORPORATE GOVERNANCE DISCLOSURES (Continued)
(ii) Committees of Board of Directors(Continued)Audit CommitteeThe Group should hold a minimum of five Audit Committee meetings each year. During the year ended 31 December 2017, five meetings (2016: five meetings) of the Audit Committee were held. The following table summarises the information about the Committee meetings dates and attendance of directors at each meeting:
Date Members attended Members not attended
25 January 2017 Mr. Redha Faraj
Mr. Abdullah Juma
Mr. Mohammed Almoayyed
24 April 2017 Mr. Redha Faraj
Mr. Abdullah Juma
Mr. Mohammed Almoayyed
29 May 2017 Mr. Redha Faraj
Mr. Abdullah Juma
Mr. Mohammed Almoayyed
18 September 2017 Mr. Redha Faraj
Mr. Abdullah Juma
Mr. Mohammed Almoayyed
20 November 2017 Mr. Redha Faraj
Mr. Abdullah Juma
Mr. Mohammed Almoayyed
The total remuneration for the Audit Committee amounted to BD 17,500 (2016: BD 17,500).
Remuneration and Nomination Committee The Group should hold a minimum of two Remuneration and Nomination Committee meetings during each year. During the year ended 31 December 2017, two meetings (2016: two meetings) of the Remuneration and Nomination Committee were held. The following table summarises the information about Committee meetings dates and attendance of directors at each meeting:
Date Members attended Members not attended
13 February 2017 Mr. Abdulla Hassan Buhindi
Mr. Shawki Fakhroo
Mrs. Mona Almoayyed
Mr. Jehad Ameen
27 November 2017 Mr. Abdulla Hassan Buhindi
Mr. Shawki Fakhroo
Mrs. Mona Almoayyed
Mr. Jehad Ameen
The total remuneration for the Remuneration and Nomination Committee amounted to BD 8,000 (2016: BD 8,000)
Notes to the ConsolidatedFinancial Statements (Continued)
As at 31 December 2017

Foundations for
Sustainable Growth
BMMI
92
33 CORPORATE GOVERNANCE DISCLOSURES (Continued)
(iii) Corporate Governance CorporategovernancecodeThe Board and the Group’s employees are expected to maintain the highest level of corporate ethics and personal behaviour. The Group has established a BMMI Code of Business Conduct ('the Code') which provides an ethical and legal framework for all employees in the conduct of its business. The Code defines how the Group relates to its employees, shareholders and the community in which the Group operates.
The Board of Directors has adopted the Code and a Group's Whistleblower policy to monitor compliance with Group ethics. The Code provides clear directions on conducting business internationally, interacting with governments, communities, business partners and general workplace behaviour having regard to the best practice corporate governance models. The Code sets out a behavioural framework for all employees in the context of a wide range of ethical and legal issues. The Code is published in the ‘Corporate Governance’ section of the Company’s website.
ChangestotheGroup'sCorporategovernanceguidelinesandcompliancewiththeCodeofCorporateGovernanceDuring the year, BMMI has revisited its corporate governance framework and guidelines to ensure compliance with the Corporate Governance Code enacted in 2010.
Conflictofinterest:In 2017, no conflict of interest has occurred. In the instance of a conflict of interest arising as a result of any business transaction or any type of resolution to be taken, the concerned Board member shall refrain from participating at the discussion of such transaction or resolution to be taken. In this respect, BMMI’s Board members usually inform the Board of a potential conflict of interest prior to the discussion of any transaction or resolution. The concerned Board member(s) also refrain from voting in any instances where conflict of interest may arise. The abstention of Board members from voting is also recorded in the minutes of the meeting where the conflict of Interest has occurred.
EvaluationofBoardPerformanceThe Annual General Meeting of the shareholders evaluates on annual basis the Board of Directors’ performance and absolves it from liabilities.
ChairmanandCEOPerformanceThe Chairman and CEO Performance are evaluated by the Board of Directors on annual basis.
Notes to the ConsolidatedFinancial Statements (Continued)
As at 31 December 2017

Annual Report
2017
BMMI
93
33 CORPORATE GOVERNANCE DISCLOSURES (Continued)
(iii) Corporate Governance (Continued)MeansofcommunicationwithshareholdersandinvestorsThe Group is committed to providing relevant and timely information to its shareholders in accordance with its continuous disclosure obligations under the Code of Corporate Governance.
Information is communicated to shareholders through the distribution of the Group's Annual Report and other communications. All releases are posted on the Group's website and released to the shareholders and Bahrain Bourse in a timely manner.
The Company Secretary is responsible for communications with the shareholders and Bahrain Bourse and ensuring that the Company meets its continuous disclosure obligations.
ManagementofprincipalrisksanduncertaintiesfacedbytheGroupThe management of principal risks and uncertainties faced by the Group is managed by the Executive Committee and the Board of Directors.
ReviewofinternalcontrolprocessesandproceduresThe review of internal control process and procedures is performed regularly by the Group's internal auditors, which is outsourced, to ensure independence, transparency and efficiency.
34 SOCIAL RESPONSIBILITY
The Group discharges its social responsibilities through corporate donations and sponsorships and Alosra Charity Foundation’ expenditure on projects aiming at social sustainable development and relief.
Notes to the ConsolidatedFinancial Statements (Continued)
As at 31 December 2017