creative regional strategies february 14, 2010. a recent survey of college graduates found that 3 of...
TRANSCRIPT

Creative Regional Strategies
February 14, 2010

A recent survey of college graduates found that 3 of 4 ranked location as more
important than availability of a job when selecting a place to live.

Who Works in Creative Class?
Creative Class: TAPE
T = Technology and R&D Innovation
A = Arts and Culture
P = Professional and Managerial
E = Educating and Training

Why Occupations?
Among all people who either work in the IT industry or work in an IT occupation (or both):–50.2% work in an IT occupation but not in the IT industry–25.7% work in the IT industry but aren't in an IT occupation–Only 24.1% work in an IT occupation in the IT industry
IT IndustryIT Occupations

The Rise of the Creative Class

The Rise of the Creative Class

7
Share of creativity-oriented jobs is increasing

What is the Creative Class ?
What You Do (Job Occupation)
vs.
Where You Work (Industry)
10 Year Job Growth Estimate• Working Class 10%• Service Class 14%• Creative Class 20%

9
U.S. Creative Economy
Knowledge Service Working
Workers (Talent) 40,379,520 59,769,270 31,949,350
% of Workforce 30.5% 45.1% 24.1%
% of Wages 48.8% 30.4% 20.6%

U.S. Creative Class
•30 (% of the workforce)•40 (million people)•50 (% of the wages)•70 (% of the discretionary income)

Who are the 40,000,000?
Occupations Workers Salary ($B)
TComputer and mathematical 3,076,200 213.0
Architecture and engineering 2,430,250 160.9
Life, physical, and social science 1,231,070 73.4
Healthcare practitioners and technical 6,713,780 416.5
A Arts, design, entertainment, and media 1,727,380 79.6
PManagement 5,892,900 541.7
Business and financial operations 5,826,140 349.6
Legal 976,740 83.4
Sales and related occupations 4,298,620 147.7
E Education, training, and library occupations 8,206,440 371.9
Total 40,379,520 2,437.7
11

U.S. Creative Growth
Occupations Growth (2004-2014)
New Jobs(000; by 2014)
TComputer and mathematical 30.7% 1,389
Architecture and engineering 17.1% 876
Life, physical, and social science 16.4% 531
Healthcare practitioners and technical 25.8% 3,047
A Arts, design, entertainment, and media 14.9% 851
PManagement 11.3% 2,757
Business and financial operations 19.1% 2,163
Legal 15.9% 336
Sales and related occupations 9.6% 408
E Education, training, and library occupations 20.0% 3,558
12
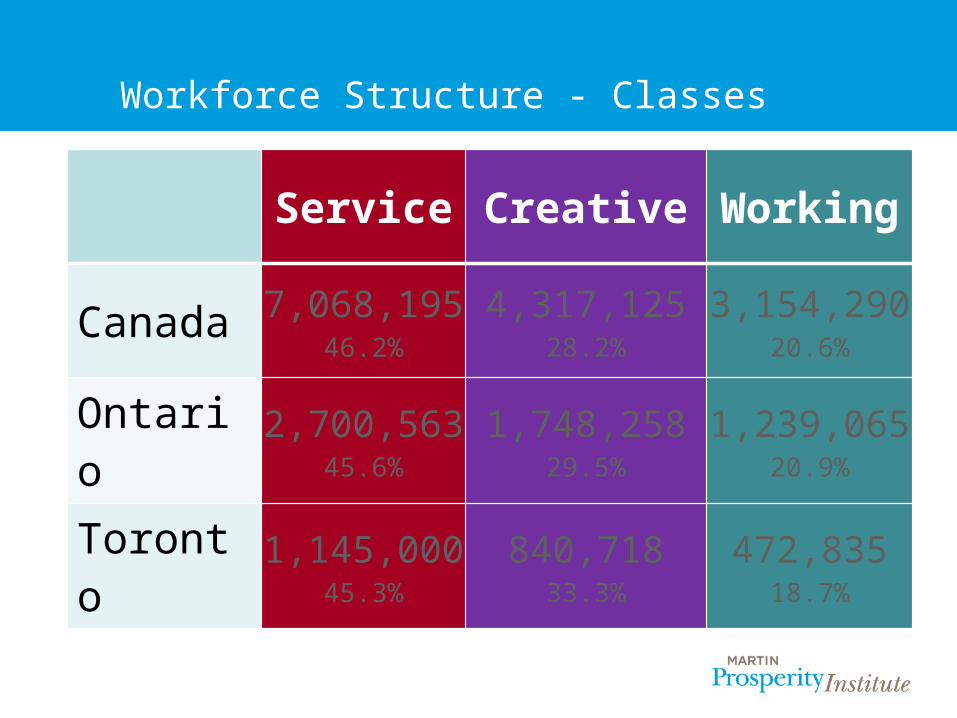
Workforce Structure - Classes
Service Creative Working
Canada 7,068,19546.2%
4,317,12528.2%
3,154,29020.6%
Ontario 2,700,56345.6%
1,748,25829.5%
1,239,06520.9%
Toronto 1,145,00045.3%
840,71833.3%
472,83518.7%

Employment Structure of the Labour Market, 2008
Creative Service Working0%
5%
10%
15%
20%
25%
30%
35%
40%
45%
50%
28%
46%
21%
42%
35%
20%
Canada
Employment Wages

Employment Structure of the Labour Market, 2008
Creative Service Working0%
10%
20%
30%
40%
50%
60%
30%
46%
21%
49%
29%23%
Ontario
Employment Wages

Employment Structure of the Labour Market, 2008
Creative Service Working0%
10%
20%
30%
40%
50%
60%
33%
45%
19%
54%
29%
17%
Toronto
Employment Wages

17

- Creative jobs are more common in larger cities- Eastern Ontario somewhat higher mainly due to Ottawa
Creative Ontario
34.7%
37.5%
37.0%
43.9%
26.4%
26.6%
26.0%
27.8%
0.0% 10.0% 20.0% 30.0% 40.0% 50.0%
Ontario
Eastern Ontario
Ontario
Eastern Ontario
Ontario
Eastern Ontario
Ontario
Eastern Ontario
TO
TA
LC
MA
CA
RU
RA
LPercent of labour force
18

Creative Jobs as a Percent of Total Employment
19

Service Class Jobs as a Percent of Total Employment
20

Working Class Jobs as a Percent of Total Employment
21

Agricultural Jobs as a Percent of Total Employment
22

23
City Size & the Creative Class

Service OccupationsOccupation Canada Ontario Toronto
B5 Clerical occupations 21.90% 22.92% 26.01%
G9 Sales and service occupations, n.e.c. 17.38% 16.99% 14.75%
G2 Retail salespersons and sales clerks 9.74% 10.08% 10.21%
A2 Managers in retail trade, food and accommodation services 6.35% 6.34% 6.03%
E2 Paralegals, social services workers and occupations in education and religion, n.e.c. 4.98% 4.66% 4.51%
B3 Administrative and regulatory occupations 4.73% 5.12% 5.62%
G1 Wholesale, technical, insurance, real estate sales specialists, and retail, wholesale and grain buyers 4.71% 5.13% 6.31%
G3 Cashiers 4.34% 4.20% 3.87%
G6 Occupations in protective services 3.70% 3.60% 2.77%
G5 Occupations in food and beverage service 3.59% 3.20% 2.79%
G8 Child care and home support workers 3.47% 3.23% 3.12%
D3 Assisting occupations in support of health services 3.46% 3.13% 2.38%
A3 Other managers, n.e.c. 3.43% 3.61% 3.94%
G4 Chefs and cooks 3.30% 2.80% 2.59%
G7 Occupations in travel and accommodation, including attendants in recreation and sport 1.92% 1.82% 1.82%
G0 Sales and service supervisors 1.76% 1.82% 1.70%
B4 Clerical supervisors 1.24% 1.34% 1.58%

Service Occupations – Average Wage (full-time)Occupation Canada Ontario Toronto
G5 Occupations in food and beverage service $ 18,761 17,995 19,816
G3 Cashiers 20,140 21,123 22,231
G8 Child care and home support workers 23,522 24,667 24,173
G4 Chefs and cooks 24,284 25,291 26,383
G9 Sales and service occupations, n.e.c. 26,160 27,915 28,994
D3 Assisting occupations in support of health services 30,909 33,006 35,284
E2 Paralegals, social services workers and occupations in education and religion, n.e.c. 31,723 34,573 36,811
G0 Sales and service supervisors 33,766 35,184 37,645
G7 Occupations in travel and accommodation, including attendants in recreation and sport 34,618 36,812 37,627
G2 Retail salespersons and sales clerks 34,959 38,365 41,287
B5 Clerical occupations 37,313 39,172 40,017
A2 Managers in retail trade, food and accommodation services 44,186 47,228 51,931
B4 Clerical supervisors 49,425 51,304 52,700
B3 Administrative and regulatory occupations 50,612 52,650 56,589
G6 Occupations in protective services 55,697 58,431 54,425
G1 Wholesale, technical, insurance, real estate sales specialists, and retail, wholesale and grain buyers 59,004 62,930 66,015
A3 Other managers, n.e.c. 81,331 88,495 101,177

Service Class Hours Worked (Ontario)
%>50HRS
%41-40HRS
%30-40HRS
%20-29HRS
%1-19HRS
Average HRS
0.0% 10.0% 20.0% 30.0% 40.0% 50.0% 60.0%
0 5 10 15 20 25 30 35 40
13.2%
9.6%
52.1%
11.8%
13.3%
35.1

Workforce Structure – Part-Time Workforce
Service Creative Working
Canada 1,750,42524.8%
590,97013.7%
245,7107.8%
Ontario 677,75025.1%
226,55013.0%
95,6157.7%
Toronto 259,19822.6%
98,90311.8%
34,7257.3%

Workforce Structure – Age Breakdown
Canada Ontario Toronto%
Workforce%
Service%
Workforce%
Service%
Workforce%
Service
15-24 15.8% 22.0% 15.7% 22.5% 14.0% 20.7%
25-65 81.6% 75.7% 81.7% 75.0% 83.5% 76.8%
Over 65 2.6% 2.3% 2.6% 2.5% 2.5% 2.5%

Ratio: Service Class Industry Share to Regional Industry Share (Ontario)
72 Accommodation and food services 45 Retail Trade 44 Retail Trade
53 Real estate and rental and leasing 49 Delivery and warehousing
56 Administrative and support, waste management and remediation services 81 Other services (except public administration)
62 Health care and social assistance 91 Public administration
41 Wholesale trade 71 Arts, entertainment and recreation
52 Finance and insurance 51 Information and cultural industries
55 Management of companies and enterprises 54 Professional, scientific and technical services
61 Educational services 31 Manufacturing - Consumables
22 Utilities 48 Transportation
32 Manufacturing - Resource Goods 33 Manufacturing - Durables
21 Mining and oil and gas extraction 23 Construction
11 Agriculture, forestry, fishing and hunting
0 0.5 1 1.5 2 2.5

Service Share Visible Minorities/Immigrants(vs. overall regional share)
Visible Minorities
Immigrants
Canada 16.1% (15.0%) 20.8% (21.2%)
Ontario 21.9% (21.4%) 29.3% (30.5%)
Toronto 41.3% (40.3%) 50.0% (50.9%)

Service Class Education
Share BA & Above
Ratio SC to Workforce
Canada 13.1% 0.46
Ontario 15.4% 0.47
Toronto 21.2% 0.49

Service Class Education
Canada Ontario% NoCert 16.4% 15.6%% HighSch 33.3% 34.3%% Apprentice 10.5% 6.9%% Coll CEGEP 22.0% 23.5%% Univ Below BA 4.6% 4.3%% BA 9.9% 11.3%% Masters 3.1% 4.0%% PhD 0.2% 0.2%

Employment Structure of the Labour Market, 2008
Total Work-force
Working Service Creative0%
10%
20%
30%
40%
50%
60%
70%
80%
90%
100%
64%
86%
64%48%
36%
14%
36%52%
Canada
Men Women

Employment Structure of the Labour Market, 2008
Total Work-force
Working Service Creative0%
10%
20%
30%
40%
50%
60%
70%
80%
90%
100%
63%
83%
63%49%
37%
17%
37%51%
Ontario
Men Women

Employment Structure of the Labour Market, 2008
Total Work-force
Working Service Creative0%
10%
20%
30%
40%
50%
60%
70%
80%
90%
100%
61%79%
61%52%
39%21%
39%48%
Toronto
Men Women

Upstate New York

Upstate New York Super-Region


Talent Measures
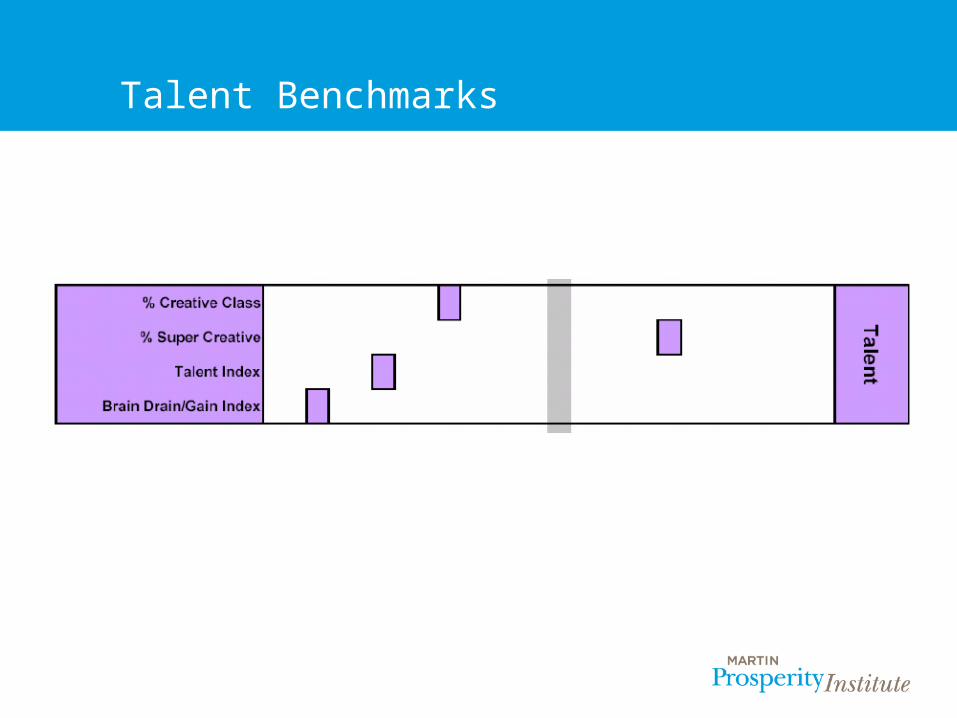
Talent Benchmarks


“Future” Talent


Regional Brain Drain

Brain Drain/Gain


Creative Workforce

Creative Workforce


Major Occupational Clusters

National Growth

Occupation Clusters by Growth

Occupational Cluster Strengths

Occupation Clusters


• Source: U.S. Bureau of Labor Statistics, U.S. Bureau of the Census.
• Percentage of the employed population in the region in occupations in the following categories:– Computer and mathematical occupations– Architecture and engineering occupations– Life, physical and social science occupations– Education, training and library occupations– Arts, design, entertainment, and media occupations
• MSA-level data is directly calculated. County-level data is estimated based on industry and occupation employment data from the Census. (R2 of estimation equation is above 0.98.) Estimates generated from 2000 Census data. MSA data is from 2001 data.
% Super Creative

• Source: U.S. Bureau of Labor Statistics, U.S. Bureau of the Census.
• Percentage of the employed population in the region in the Super Creative occupations (see above) and occupations in the following categories:– Management occupations– Business and financial operations occupations– Legal occupations– Healthcare practitioners and technical occupations (does not include
healthcare support)– High-end sales and sales management
• MSA level data is directly calculated. County level data is estimated based on industry and occupation employment data from the Census. (R2 of estimation equation is above 0.98.) Estimates generated from 2000 Census data. MSA data is from 2001 data.
% Creative

• Source: U.S. Bureau of the Census.• Percentage of the population age 25 and above in the region that has a bachelor's degree or above. Based on data from the 2000 census.
Talent Index

• Source: U.S. Bureau of the Census and proprietary data and calculations.
• Percentage of the workforce, age 25 and above, with at least a bachelor’s degree divided by the percentage of the population age 20 to 34 currently attending college. A value of 1.0 shows that the two percentages are equal – the region is retaining the college educated at the same rate at which it is educating them. A value greater than 1.0 is given to a region that not only keeps its own college graduates but also attracts them from other regions. A value less than 1.0 is given to a region that is keeping and attracting a lower percentage of the college educated than it is creating – the region is exporting its newly generated talent to other regions.
Brain Drain/Gain Index

Toronto


Ontario
Wages
Creative
Class
Working
Class
Service
Class
Average $64,174 $40,792 $37,653