creative unemployment - iza institute of labor …ftp.iza.org/dp5373.pdfargue that the essential...
TRANSCRIPT

DI
SC
US
SI
ON
P
AP
ER
S
ER
IE
S
Forschungsinstitut zur Zukunft der ArbeitInstitute for the Study of Labor
Creative Unemployment
IZA DP No. 5373
December 2010
Knut RøedJens Fredrik Skogstrøm

Creative Unemployment
Knut Røed Ragnar Frisch Centre for Economic Research
and IZA
Jens Fredrik Skogstrøm Ragnar Frisch Centre for Economic Research
Discussion Paper No. 5373 December 2010
IZA
P.O. Box 7240 53072 Bonn
Germany
Phone: +49-228-3894-0 Fax: +49-228-3894-180
E-mail: [email protected]
Any opinions expressed here are those of the author(s) and not those of IZA. Research published in this series may include views on policy, but the institute itself takes no institutional policy positions. The Institute for the Study of Labor (IZA) in Bonn is a local and virtual international research center and a place of communication between science, politics and business. IZA is an independent nonprofit organization supported by Deutsche Post Foundation. The center is associated with the University of Bonn and offers a stimulating research environment through its international network, workshops and conferences, data service, project support, research visits and doctoral program. IZA engages in (i) original and internationally competitive research in all fields of labor economics, (ii) development of policy concepts, and (iii) dissemination of research results and concepts to the interested public. IZA Discussion Papers often represent preliminary work and are circulated to encourage discussion. Citation of such a paper should account for its provisional character. A revised version may be available directly from the author.

IZA Discussion Paper No. 5373 December 2010
ABSTRACT
Creative Unemployment* We examine the impact of job loss on entrepreneurship behavior in Norway. Our identification strategy relies on the use of mass layoffs caused by bankruptcies as indicators of exogenous displacement. We find that working in a company which is going to close down due to bankruptcy during the next four years raises the subsequent entrepreneur rate by 3.7 percentage points (155 %) for men and 1.8 percentage points (180 %) for women, compared to working in a stable firm. These estimates are much larger than what has previously been reported in the literature. Taking into account that many workers lose their jobs in the comparison group of stable firms also, we reckon that the full effects of displacement are even larger. JEL Classification: L26, J65, M13 Keywords: entrepreneurship, self-employment, unemployment Corresponding author: Knut Røed The Ragnar Frisch Centre for Economic Research Gaustadalléen 21 0349 Oslo Norway E-mail: [email protected]
* This paper is part of the project “Entrepreneurship and gender in Norway”, financed by the Norwegian Research Council (grant no. 201336). Thanks to Espen Moen for valuable comments.

3
1. Introduction
Unemployment is potentially a destructive experience. Existing empirical evidence sug-
gests that job displacement undermines workers’ future employment opportunities and
earnings, raises their likelihood of entering disability programs, raises their risk of divorce,
and even raises their risk of early death; see Bratsberg et al. (2010) and references therein.
But unemployment also triggers creativity. In particular, it may foster entrepreneurship
since it most likely reduces the opportunity cost of setting up a new business. A number of
previous studies have established that a significant fraction of new entrants to self-
employment were recently unemployed, and that unemployed individuals have a higher
probability of starting up their own business than employed workers; see, e.g., Meager
(1992), Blanchflower and Meyer (1994), Kuhn and Schuetze (2001), and Berglann et al.
(2010). However, this does not imply that unemployment causes entrepreneurship; it
might as well be the case that entrepreneurship causes cycles of unemployment and self-
employment or that entrepreneur types also tend to be high-unemployment types.
The empirical evidence on the direct causal relationship between job-loss and en-
trepreneurship is sparse and inconclusive. Farber (1999) examined “alternative employ-
ment arrangements” among displaced and non-displaced workers in the United States,
based on various supplements to the Current Population Surveys. While he found that job
losers tended to be overrepresented in subsequent temporary and part-time jobs, they were
underrepresented in self-employment. Von Greiff (2009) examined the impacts of dis-
placement due to firm closure on subsequent self-employment in Sweden, based on ad-
ministrative register data. Her baseline estimate was that displacement raises the probabili-
ty of being self-employed next year by 1.2 percentage points, or 87 %.

4
The present paper seeks to establish the causal effect of job-loss on entrepreneur-
ship propensity in Norway by exploiting events of exogenous displacement triggered by
mass layoffs. It thus relates closely to the paper by von Greiff (2009), and more loosely to
a broader international literature addressing the consequences of job displacement; see,
e.g., Hamermesh (1987), Ruhm (1991), Neal (1995), Kletzer (1998), Kuhn (2002), and
Hallock (2009). The paper draws on the recent finding reported by Bratsberg et al. (2010)
that mass layoffs identified from employer-employee registers tend to contain a large frac-
tion of “false” layoffs, in the form of organizational restructuring, demergers, and takeov-
ers, but that auxiliary data from bankruptcy court proceedings can be used to identify the
genuine events of mass layoff. It also takes advantage of a new register-based strategy for
identifying entrepreneurs proposed by Berglann et al. (2010), ensuring that individuals
who are employed in a firm directly or indirectly owned by themselves are counted as en-
trepreneurs, together with the self-employed.
Our key finding is that displacement has a much larger positive impact on entre-
preneurship entry that what has previously been recognized in the literature. Our baseline
estimates imply that being employed in a company which is going to close down due to
bankruptcy during the next four years raises the probability of being an entrepreneur four
years later by 3.7 percentage points (155 %) for men and by 1.8 percentage points (180 %)
for women, compared to working in a stable or growing firm, ceteris paribus. Since a
number of workers lose their jobs in stable and growing firms also, these estimates do not
capture the full effect of displacement, however. Adjusting for this source of “contamina-
tion bias” we estimate – admittedly with considerable uncertainty – that the causal effects
of displacement are as large as 4.8 percentage points (392 %) for men and 2.3 percentage

5
points (665 %) for women. We also present evidence indicating that workers embarking
on entrepreneurship in response to displacement perform relatively well as entrepreneurs.
Around 43 % of them raise their personal income compared to the level that prevailed
prior to displacement. Approximately 55 % organize their entrepreneurship activity
through a limited liability company, rather than becoming self-employed. And on average,
the displaced limited liability entrepreneurs contribute to the establishment of around six
jobs (including their own).
2. Data and empirical approach
The foundation for our analysis is administrative register data from Norway, combining
employer-employee registers with information on earnings and business income, firm
ownership, and bankruptcy data from 2001 through 2005. In order to estimate the causal
impact of job loss on entrepreneurship propensity, we seek to exploit a quasi-experimental
dimension of our non-experimental administrative register data. In general, we expect the
event of displacement to be highly correlated with observed and unobserved worker cha-
racteristics that also potentially affect entrepreneurship. We will argue, however, that a full
closure due to bankruptcy can be considered exogenously assigned from the perspective
of each employee, provided that the firm is sufficiently large and that the employee is not
also an owner, a board member, or a central executive officer (CEO). But even though the
event of a mass-layoff can be considered exogenous, it is in many cases possible for the
employee to respond to it ex ante, e.g., by searching for a new job in anticipation of the
forthcoming closure. Hence, employees actually employed at the time of a bankruptcy
may constitute a selected subset of the group of workers who would have been employed
in the absence of the mass-layoff. To avoid this sorting problem, we apply a forward-

6
looking empirical approach; i.e., we investigate the impacts of working in a firm which is
going to go bankrupt during the next few years as opposed to working in a firm which re-
mains in the market without significant downsizings.
To be precise, we start out with all full-time employees in single-plant private sec-
tor firms with at least 25 employees by the end of 2001.1 We then drop from the sample
workers who had key positions in the firm (owner, board member, CEO). We also drop
workers who had been employed for less than a year and workers above 50 years of age.
The rest constitute our risk group of potential entrepreneurs. The outcome of interest is
engagement in entrepreneurship during the next four years. Our main dependent variable
is a dichotomous variable indicating entrepreneurship status in 2005. But, since it is possi-
ble that displaced workers engage in entrepreneurship projects with a different probability
of survival than other entrepreneurship projects, we also use the cumulative incidence of
any entrepreneurship activity from 2002 through 2005 as a dependent variable. We set up
probability models aimed at investigating how the occurrence of entrepreneurship depends
on the fate of the firm in which the employee was originally employed (in 2001), includ-
ing downsizing and closure events.
It is common in the literature to equate entrepreneurship to self-employment; see,
e.g., Parker (2004) for a recent overview. However, many individuals who start new busi-
nesses do so by establishing small limited liability companies, either alone or together
with friends/colleagues. They then become employed in their own company – or, in some
cases, in another company which is again owned by their own company. These individuals
1 The reason why we restrict attention to single-plant firms is that accounting and closure/takeover data are available at the company level only. By focusing on single-plant firms we also avoid complications caused by within-company job transfers following plant closures (Huttunen et al., 2010).
.

7
will typically be classified as employed in register-based analyses of entrepreneurship,
even though they may have played a pivotal role in setting up their own workplace and are
exposed to the risks associated with being the residual claimant to the firm’s earnings.
Berglann et al. (2010) show that the inclusion of “active owner” employees into the entre-
preneurship definition doubles the number of non-primary-sector entrepreneurs in Norway
compared to a pure self-employment definition. From an economics perspective, we will
argue that the essential features of entrepreneurship are that a person engages both labor
and capital into the creation of an economic activity and operates as a residual claimant to
the firm’s earnings, while the mode of ownership is of secondary importance. We there-
fore employ an entrepreneurship concept incorporating self-employed as well as em-
ployees who own their own workplace, either directly or indirectly through other compa-
nies.2
Table 1 provides a descriptive overview of our analysis population. There where
around 111,000 men and 40,000 women who satisfied all our employee inclusion criteria
in 2001 (full-time employee below 50 years in private sector firm with at least 25 em-
ployees, at least one year employment). Half of them worked in stable or growing firms,
i.e., firms that did not downsize by more than 10 percent from 2001 to 2005. Only around
2.7 percent of the men and 2.1 percent of the women worked in firms that closed down
due to bankruptcy in this period. This does not imply, however, that displacements are
rare. According to Salvanes (1997), as many as 10 percent of Norwegian jobs are elimi-
2 Following Berglann et al. (2010), we define an employee as entrepreneur if he/she owns at least 30 percent of the firm (directly or indirectly) or owns at least 10 percent and is a board member or CEO. Note that our definition of entrepreneurship does not require that the firm is “new”; nor does it require that the entrepreneur is necessarily the founder of the firm. The central feature of our definition is the combined employment of capital and labor into a business activity. Whether this occurs through the establishment of a new firm or through takeover – and potentially revitalization – of an existing firm is of secondary impor-tance.

8
nated every year. We therefore expect displacement to be relatively common even in sta-
ble or growing firms.3 Columns II and VIII in Table 1 show how the downsizing and clo-
sure indicators correlate with subsequent incidences of registered unemployment over the
whole four-year period in our data. With unemployment incidence rates of 64 percent for
men and 73 percent for women, entry into registered unemployment is indeed much higher
among workers exposed to a bankruptcy-driven closure than among other workers. It is
nonetheless clear from the table that unemployment is relatively frequent irrespective of
downsizing events at the initial workplace. If we take the fraction of unemployment inci-
dences in the “closure with bankruptcy category” as an estimate of the fraction of dis-
placed workers who tends to register as unemployed, we can use the reported unemploy-
ment frequencies in Columns II and VIII to back out the number of job losses in other
types of firms as well; see Bratsberg et al. (2010). Doing this separately for men and
women, we “guesstimate” that 33 percent of the male and 31 percent of the female em-
ployees in our dataset did lose their job at some time during the 2002-2005 period.4 Even
in the no-downsizing bracket, we estimate that the four-year job-loss rate is around 21-22
percent for both men and women (indicating that around 6 % of the workers lose their job
every year). In comparison, we find that 31.9 % of the men and 33.4 % of the women in-
itially employed in non-downsizing firms leave their firm before the end of 2005. Hence,
our estimates imply that around two thirds of the job-separations in stable/growing private
3 Job losses in stable and growing firms do often not involve formal dismissals, but rather non-renewal of temporary contracts and encouragements to quit “voluntarily” (sometimes in the form of sever-ance packages). From a theoretical point of view, one may question whether the distinction between quits and layoffs is meaningful at all; see, e.g., McLaughlin (1991).
4 These numbers are almost exactly equal to what would be expected on the basis of the 10 percent annual job elimination rate reported by Salvanes (1997), which – provided that the risk is independently dis-tributed across individuals over time – yields a 34 percent cumulative displacement rate over a four-year period (1-0.94).

9
sector firms can be interpreted as job losses, in the sense that they are not initiated by em-
ployees.
The assumption that the propensity for unemployment registration is the same for
job losses in stable and bankrupt firms is of course questionable. On the one hand, one
could argue that a worker laid off from a stable firm might be negatively selected, and
hence has weaker labor market prospects than the average employee displaced from a
bankrupt firm. This may imply higher unemployment registration propensities for job
losses in stable firms, and thus fewer actual job losses behind a given number of registered
unemployed. On the other hand, job losses in continuing firms are typically announced
well in advance of the event, giving displaced workers more time to search for new jobs
and hence avoid being registered as unemployed. In addition, job losses in continuing
firms are often organized such that the employee is not eligible for unemployment benefits
(due to “voluntary” quits and severance payments) and thus have weaker incentives to reg-
ister at the employment office. And congestion effects in local labor markets may imply
that mass layoffs have larger adverse consequences than selective layoffs. Such factors
suggest lower registration frequencies for job losses in stable firms.
- Table 1 around here -
Table 1 also shows that 3.7 percent of the men and 1.4 percent of the women in our
analysis population engaged in entrepreneurship at some time during the four year out-
come period; see Columns III and IX. The probability that a worker engages in entrepre-
neurship rises monotonously with downsizing, and it is an order of magnitude larger for
workers in bankruptcy firms than for workers in stable firms (8.8 versus 3.1 percent for
men and 3.9 versus 1.2 percent for women). Finally, Columns IV-VII and X-XII report the

10
labor market states recorded at the end of our outcome period, i.e., in 2005, for men and
women, respectively. We distinguish between entrepreneurship, employment and no long-
er being in work. A first point to note is that roughly 75 percent of those who tried entre-
preneurship are still entrepreneurs at this point, and this fraction is similar for entrepre-
neurs from stable and closing firms. A second point to note is that working in a bankruptcy
firm implies a substantially higher probability of becoming inactive, particularly for wom-
en. As much as 49 percent of the bankruptcy-hit women were not working at all in 2005,
as opposed to 18 percent of the women initially working in stable or growing firms. For
men, the corresponding rates where 26 (bankruptcy firms) and 10 (stable firms) percent.
Given that we are interested in the causal impacts of firms’ future downsizing or
closure on their workers’ entrepreneurship endeavors, we clearly need to take into account
that the composition of workers may vary across the various types of firms. Table 2 pro-
vides some summary statistics regarding the employee-composition in stable, downsizing,
and closing firms. Employees in firms that close down due to bankruptcy have on average
lower education and lower earnings than employees in stable, growing, or moderately
downsizing firms. Bankruptcy firms also tend to have been through some turbulence dur-
ing the two years prior to the start of our analysis period, with higher downsizing and
turnover rates than other firms. These latter differences suggest that a sorting process may
already have occurred at our baseline, a point to which we return below. It is also worth
noting that employees in firms that close down due to liquidation or takeover have higher
education and higher earnings than workers in other types of firms.
- Table 2 around here -

11
3. The effect of displacement on the entrepreneurship propensity
We estimate the impacts of downsizing and closure on entrepreneurship propensity by
means of logit probability models, i.e;
'Pr 1|ln ,
Pr 0 |i i
iit i
y xx
y x
(1)
where iy is a dichotomous outcome variable and ix is a vector of explanatory variables.
We use two alternative outcome measures in this section: i) entry into entrepreneurship at
some point during 2002-2005, and ii) being an entrepreneur in 2005. The covariates in-
clude 7 indicators for downsizing/closure, corresponding to the grouping in Table 1. In
order to minimize the likelihood that compositional differences across firm types bias the
estimated effects of downsizing/closure, we control for observed worker heterogeneity
with a minimum of functional form restrictions, i.e., by representing most variables with a
separate dummy for each possible value. Age is represented by 29 dummy variables (one
for each year), nationality is represented by 7 dummy variables (representing immigrants
and descendants from different parts of the world), and geography is represented by 18
dummy variables (one for each county in Norway), in addition to 4 size-of-municipality
dummy variables. Occupation is represented in the model by 19 dummy variables combin-
ing the level of education with industry. Finally, we use 4 dummy variables to represent
firm size.
In this section, we report the estimated average marginal effects of the downsiz-
ing/closure variables on the subsequent entrepreneurship probabilities. Average marginal
effects are computed on the basis of relevant comparisons only, implying that for dummy
variable sets with more than two categories, each category’s average marginal effect is

12
calculated for observations belonging to the category in question and the reference catego-
ry only; see Bartus (2005). A complete list of explanatory variables and estimation results
is reported in the Appendix.
3.1 Main results
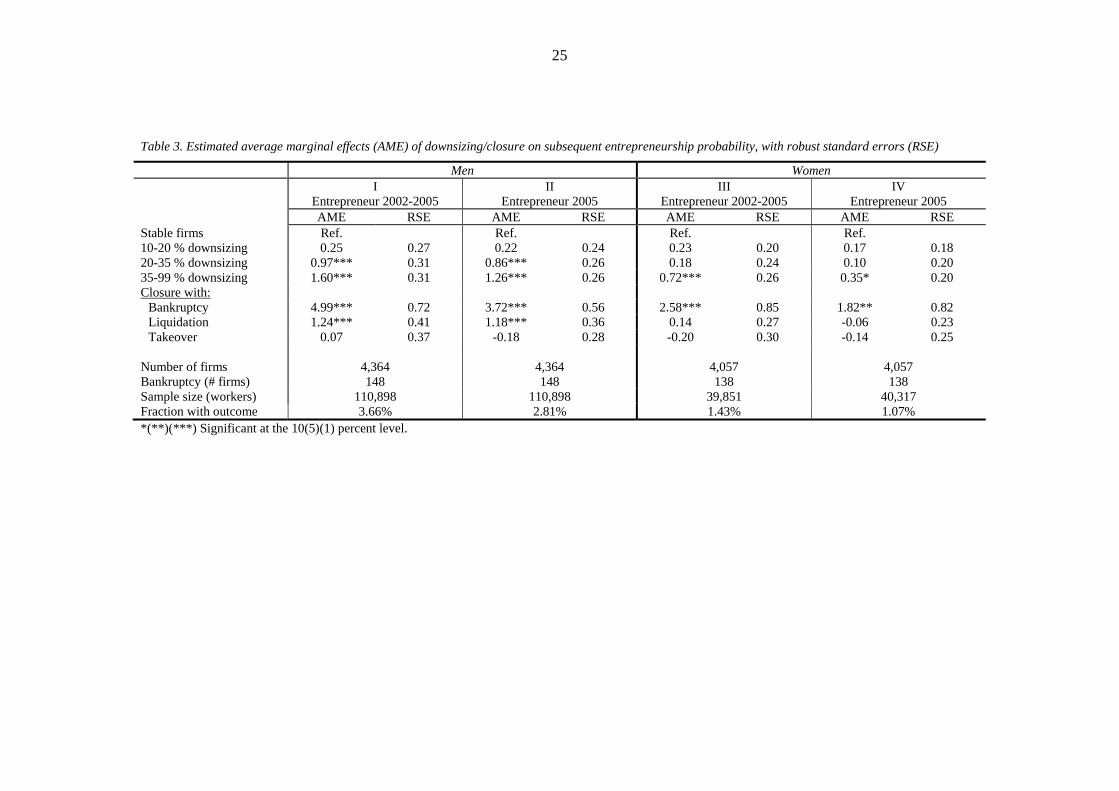
Table 3 provides the key regression results. Downsizing and closure clearly boost entre-
preneurial activities. And working in a firm which is going to close down due to bankrupt-
cy raises entrepreneurship propensities a lot. For example, the probability that a full-time
employed man in 2001 is an entrepreneur in 2005 is estimated to rise with 3.7 percentage
points if he worked in a bankruptcy-doomed firm rather than in a stable or growing firm,
ceteris paribus; see Column II. Since the average entrepreneur rate in stable firms was
around 2.4 %, this corresponds to a 155 % rise in entrepreneurship propensity. For wom-
en, the corresponding effect is estimated to 1.8 percentage points (180 %); see Column IV.
- Table 3 around here -
It is clear from Table 3, Columns I and III, that the marginal impact of displace-
ment on entrepreneurship entry at any time during 2002-2005 (without conditioning on
entrepreneurship survival until 2005) is even larger than the impact on entrepreneurship
propensity in 2005. However, relative to the overall number of entrepreneurship attempts,
the effects are virtually the same as those reported for 2005-entrepreneurship. This sug-
gests that the “failure rate”, i.e., the fraction of entrepreneurship endeavors that do not sur-
vive until the end of the observations period, is not particularly high for entrepreneurship
triggered by job loss.
Since workers lose their jobs in stable and growing firms also (conf. Table 1), the
estimated effects of working in a bankruptcy firm do not capture the full effect of dis-
13
placement. To identify the causal effect of displacement, we need to eliminate the conta-
mination bias caused by job losses occurring in the reference group of stable and growing
firms. Building on the estimate referred to in the previous section that around 21 % of the
workers in stable or growing firms actually lost their jobs during 2002-2005, and assuming
that job loss has the same effect on entrepreneurship propensities regardless of its cause,
we infer that the estimated average effect of displacement on the 2005 entrepreneurship
rate is as large as 4.8 percentage points, which corresponds to a proportional rise of 392 %.
For women, the corresponding displacement effects are 2.3 percentage points (665 %).5
These numbers imply that around 56 % of all male and 68 % of all female entrepreneur-
ship transitions (from 2001 to 2005) in our data can be directly attributed to job loss. Job
loss thus seems to be a major force behind entrepreneurship endeavors among initially
full-time employed workers in Norway.6
The assumption that job loss has the same effect on entrepreneurship propensity
regardless of its cause is questionable. In particular, we may suspect that a job loss caused
by bankruptcy has a particularly large effect on entrepreneurship because new firms may
arise directly from the ashes of the old one. To examine the empirical relevance of this ar-
gument, we drop from our sample the 569 entrepreneurship entrants (15 %) who became
“active owners” in exactly the same industry as they were previously employed in (based
5 The average marginal effect of displacement is computed as the average marginal effect of work-ing in a bankruptcy as opposed to a stable firm divided by estimated fraction of non-displaced workers in stable firms (3.7/(1-0.21)=4.7).
6 Note, however, that moving from full-time-employment to entrepreneurship is not the most com-mon gateway to entrepreneurship in Norway. Based on our data, we estimate that approximately 32 % of entrepreneurship entrants were full-time employed October 1 in the year prior to entrepreneurship entry, while 20 % were part-time employed, and 9 % were unemployed (all numbers based on 2001-2005 aver-ages). The most common gateway to entrepreneurship is thus to enter directly from outside the labor force.

14
on standard industrial classification code, SIC), and re-estimate the models.7 Focusing on
the impact on being entrepreneur in 2005, we find that the estimated marginal effect of
working in a bankruptcy firm then drops from 3.72 to 3.43 (standard error 0.54) for men
and from 1.82 to 1.73 (0.73) for women (not shown in the table). However, since the over-
all entrepreneurship rates are also lower in the reduced sample (it declines from 2.81 to
2.37 % for men and from 1.07 to 0.95 % for women), the relative effects of bankruptcy are
actually larger when we focus more strongly on new-industry-entrepreneurship. Hence,
the hypothesis that the large impact of bankruptcy-displacement primarily is caused by
former employees taking over the old firm’s activities is not supported by the data.
3.2 Robustness
The estimated impacts of working in a bankruptcy firm may be biased if the population of
workers in bankruptcy firms differs systematically from the population of workers in sta-
ble firms, even conditional on our vector of explanatory variables. This section examines
robustness with respect to the composition of the analysis population. The exposition fo-
cuses on entrepreneurship in 2005 as the outcome measure. Using the 2002-2005-outcome
instead does not change anything of interest.
- Table 4 around here -
Could our results be explained by entrepreneurial types being disproportionally
sorted into the bankruptcy firms rather than by the bankruptcies themselves causing entre-
preneurship? One way this could happen is trough ex ante sorting out of already declining
firms. We saw in Table 2 that many bankruptcy firms had already been in decline for some
7 Note that we do not observe industry for self-employed entrepreneurs (44 % of the entrepreneur-ship entrants).

15
time at baseline, and we may worry that the most risk averse – and least entrepreneurial –
workers tend to leave for safer havens first. In the first robustness analysis, we thus limit
the analysis to firms for which no downsizing at all occurred during the two years prior to
the start of our analysis period. As is evident from Table 4, Columns II and VI, however,
this limitation does not reduce the estimated impacts. To the contrary, limiting the analysis
to firms that were stable ex ante raises the estimated impact of bankruptcy on future entre-
preneurship.
Even though our results are not driven by sorting due to ex ante downsizing, it
could still be the case that entrepreneurial types are sorted into high-risk firms. To investi-
gate this hypothesis, we would clearly have liked to check whether employees in bank-
ruptcy firms showed signs of being particularly entrepreneurial not only in the future, but
also in the past. Since we do not have data on entrepreneurship prior to 2000, we cannot
do this directly. What we can do, however, is to focus on workers for which we can identi-
fy a long period of stable employment. Hence, in the second robustness analysis we re-
strict the analysis to employees with at least five years tenure in the current firm. This re-
striction obviously implies a significant loss of observations; the sample of workers is re-
duced by 67 % for men and 80 % for women, while the number of included firms is re-
duced by 25 % for men and 40 % for women. The results, however, remain essentially un-
changed; see Columns III and VII. The estimated impacts of working in a bankruptcy firm
are even slightly larger than in the baseline model.
Could our results be explained by reverse causality, i.e., that entrepreneurial activi-
ty among the employees sometimes contributes to the bankruptcy? One way to address
this potential problem is to focus on very large companies only, for which it is unlikely

16
that a single (or a few) employees can cause bankruptcy. By limiting the analysis to firms
with minimum 25 employees, we have indeed taken this problem into consideration al-
ready in the setup of our baseline model. Restricting the dataset to even larger firms re-
duce the sample of firms and bankruptcies considerably. In our final robustness analysis,
we use firms with at least 50 employees only. This implies that we remove around 65 % of
the firms and – more importantly – almost 80 % of the bankruptcies. The estimation re-
sults reported in Columns IV and VIII indicate smaller effects of bankruptcy compared to
the estimates from the baseline model, though still highly significant for men. Given the
low number of bankruptcies among large firms (33 in the male sample and 30 in the fe-
male sample), the (clustered) standard errors are relatively large for the bankruptcy coeffi-
cient (not shown in the table), and the estimates are not statistically significantly different
from those of the baseline model. For men, a 95 % confidence interval ranges from 0.9 %
to 3.7 %, while for women it ranges from -0.8 % to 3.5 %.
4. Proactive and reactive entrepreneurship performance compared
How do displaced workers perform as entrepreneurs compared to non-displaced workers?
We can gain some insight into this question by comparing entrepreneurs originating in
stable/growing and bankruptcy firms. Recall, however, that job losses occur in both stable
and closing firms, and that some entrepreneurs from bankruptcy firms would have become
entrepreneurs even without the job loss. We label entrepreneurship that is triggered by job
loss reactive and entrepreneurship that is not triggered by job loss proactive. A “back-of-
the-envelope” calculation based on the estimates reported in the previous section suggests
that close to 50 % of the entrepreneurs from stable/growing firms and around 80 % of the
entrepreneurs from bankruptcy firms are reactive. Hence, while a comparison of the two

17
groups clearly does not correspond to a comparison of reactive and proactive entrepre-
neurs, it may shed light on systematic differences between them.
We look at two dimensions of “performance” for the group of entrepreneurs who
were still active in 2005. The first focuses on private returns. We use a comprehensive
personal income concept for this purpose, encompassing all sources of registered income,
including wage earnings, dividends, and other sources of capital income. Based on admin-
istrative records, we compute incomes for all entrepreneurs, before and after entrepreneur-
ship entry. We use registered income in 2001 (the baseline year) to proxy the “before-
income” and the average of annual incomes in 2005 and 2006 (discounted to 2001-value)
to proxy the “after-income”.8 The second performance measure focuses on the companies
in which the entrepreneurs were engaged. We report the firms’ operating surpluses in 2005
and their numbers of employees. We also report changes in these numbers from 2001 to
2005 to the extent that the firms existed prior to the entrepreneurship entry. These meas-
ures can only be computed for the subset of entrepreneurs (around 50 %) that engaged in
limited liability companies for which audited accounts are available.
- Table 5 around here -
Table 5 summarizes our main findings. While the average entrepreneur from a sta-
ble/growing firm raised his/her personal income by 152,000 NOK from 2001 to
2005/2006, the average entrepreneur from bankrupt firms lowered his/her income by
60,000 NOK. The difference in income growth between the two groups is thus 218,000
NOK, which is sizeable number corresponding to roughly half of the average annual earn-
8 Note that there was an important announced tax reform in 2006, introducing a 28% tax on divi-dends (above a certain “safe return” level). This gave investors strong incentives to take out their profits in 2005, rather than in 2006; see Berglann et al. (2010) for details. That is why we have chosen to report the average incomes for these two years.

18
ings for fulltime employees in Norway. However, this large difference in average out-
comes was strongly influenced by a relatively small number of extremely successful en-
trepreneurs emanating from stable/growing firms. For the median entrepreneurs from the
two groups the difference in income growth was only 33,000 NOK. Figure 1 presents the
distribution of personal income gains by type of origin firm in more detail. In both groups,
the majority of entrepreneurs experienced moderate gains or losses. The fraction of entre-
preneurs with negative income development was somewhat larger among entrepreneurs
from bankruptcy firms than for entrepreneurs from stable/growing firms (57.1 versus 45.5
%). Moreover, the fraction with really big gains – more than 1 million NOK – was signifi-
cantly larger among entrepreneurs from stable/growing firms (4.5 versus 1.4 %). Higher
incomes for proactive than for reactive entrepreneurs is not very surprising, given that
reactive entrepreneurs have embarked on entrepreneurship in response to displacement,
while proactive entrepreneurs have had the “luxury” of being able to choose entrepreneur-
ship only to the extent that it is expected to pay off in relation to the baseline income.
- Figure 1 around here -
Around 55 % of the entrepreneurs engaged in limited liability companies (rather
than in self-employment). This number was roughly the same for entrepreneurs from sta-
ble/growing and bankrupt firms. But while as much as 69 % of the limited-liability-
entrepreneurs from bankrupt firms started a new company (as opposed to buying an exist-
ing one), this was only the case for 52 % of the entrepreneurs from stable/growing firms.
On average, entrepreneurs from stable/growing firms engaged in companies that subse-
quently experienced much larger surpluses and much larger surplus growth than entrepre-
neurs from bankrupt firms. But again, the large average difference is heavily influenced by

19
a relatively low number of very successful firms. The difference is much smaller when we
compare the median than when we compare the mean entrepreneurs in each group. It is
also worth noting that entrepreneurs from bankrupt firms tended to engage in companies
with similar or even slightly higher employment growth than the companies in which en-
trepreneurs from stable/growing firms engaged. The latter point is illustrated in more de-
tail in Figure 2. While 58.9 of the limited liability entrepreneurs from bankruptcy firms
contributed to generating jobs for others (i.e., established at least two jobs) this was the
case for 54.9 of the entrepreneurs from stable or growing firms.
- Figure 2 around here -
5. Concluding remarks
Reactive entrepreneurship is empirically important in Norway, and job-loss is the trigger-
ing event behind more than half of the transitions from fulltime employment to entrepre-
neurship. This conclusion is somewhat at odds with recent questioner-based evidence
based on the Global Entrepreneurship Monitor (Ardagna, 2008, p.37), which indicates that
entrepreneurship motivated by the failure to find regular employment is virtually non-
existent in Norway: Only 3 % of the entrepreneurs in this study – defined as individuals
who start a new business or are owners/managers of a young firm – report to have taken
this role “because they could find no better economic work”.9 By contrast, 85 % claim to
have become entrepreneurs “to take advantage of a business opportunity”. Our results
suggest that these numbers give a distorted picture of why people become entrepreneurs.
9 This was the lowest fraction among all the 37 countries covered by the study. The average fraction in all OECD-countries was 15%.

20
Shocks to alternative employment opportunities play a key role, and job displacement
more than quadruples the subsequent entry rate to entrepreneurship.
The findings presented in this paper may indicate that workers are reluctant to
leave the relative safety of fulltime employment in favor of risky entrepreneurship endea-
vors. Those who do embark on entrepreneurship projects without being pushed by job-loss
tend to raise their incomes substantially as a result. Workers’ hesitation to voluntarily
leave fulltime employment for entrepreneurship may reflect risk aversion and lack of so-
cial insurance safety net in entrepreneurship.
Even among reactive entrepreneurs – i.e., persons “pushed” into entrepreneurship
by the loss of regular employment – there appears to be many success stories. Roughly 43
% experience an income gain compared to their pre-displacement earnings. 55 % take over
or establish a limited liability company. And on average the limited liability entrepreneurs
from bankrupt firms contribute to the establishment of around six jobs. Hence, it seems
that the concept of creative destruction can be given a dual interpretation in Norway: Not
only is creativity the source of destruction; destruction also seems to be a source of crea-
tivity.
References
Ardagna, S. (2008) Explaining International Differences in Entrepreneurship: The Role
of Individual Characteristics and Regulatory Constraints. NBER Working Paper
Series 14012.
Bartus, T. (2005) Estimation of Marginal Effects Using Margeff. The Stata Journal, Vol.
5, No. 3, 309

21
Berglann, H., Moen, E. R., Røed, K. and Skogstrøm, J. F. (2010) Entrepreneurship: Ori-
gins and Returns. Labour Economics, forthcoming.
Blanchflower, D. G. and Meyer, B. (1994) A Longitudinal Analysis of the Young Self-
Employed in Australia and the United States. Small Business Economics, Vol. 6,
1-19.
Bratsberg, B., Fevang, E., and Røed, K. (2010) Disability in the Welfare State – An Un-
employment Problem in Disguise? IZA Discussion Paper No. 4897.
Farber, H. S. (1999) Alternative and Part-Time Employment Arrangements as a Response
to Job Loss. Journal of Labor Economics, Vol. 17, No. 4, pt.2, S142-S169.
Hallock, K. F. (2009) Job Loss and the Fraying of the Implicit Employment Contract.
Journal of Economic Perspectives, Vol. 23, No. 4, 69-93.
Hamermesh, D. (1987) The Costs of Worker Displacement. Quarterly Journal of Eco-
nomics, Vol. 102, No. 1, 51-76.
Huttunen, K., Møen, J., and Salvanes, K. G. (2010) How Destructive is Creative Destruc-
tion? Effects of Job Loss on Mobility, Withdrawal and Income. Journal of the Eu-
ropean Economic Association, forthcoming.
Kletzer, L. G. (1998.) Job Displacement. Journal of Economic Perspectives, Vol. 12, No.
1, 115-136.
Kuhn, P. J. and Schuetze, H. J. (2001) Self-Employment Dynamics and Self-Employment
Trends: A study of Canadian Men and Women, 1982-1998. Canadian Journal of
Economics, Vol. 34, 760-784.
Kuhn, P. J., ed. (2002). Losing Work, Moving On. International Perspectives on Worker

22
Displacement. W.E. Upjohn Institute for Employment Research, Kalamazoo,
Michigan.
McLaughlin, K. J. (1991) A Theory of Quits and Layoffs with Efficient Turnover. Jour-
nal of Political Economy, Vol. 99, No. 1, 1-29.
Meager, N. (1992) Does Unemployment Lead to Self-Employment? Small Business Eco-
nomics, Vol. 4, 87-103.
Neal, D. (1995) Industry-Specific Human Capital: Evidence from Displaced Workers.
Journal of Labor Economics, Vol. 13, No. 4, 653-677.
Parker, S. C. (2004) The Economics of Self-Employment and Entrepreneurship. Cam-
bridge University Press.
Ruhm, C. J. (1991) Are Workers Permanently Scarred by Job Displacements? The Amer-
ican Economic Review, Vol. 81, No. 1, 319-324.
Salvanes, K. G. (1997) Market Rigidities and Labour Market Flexibility: An International
Comparison. The Scandinavian Journal of Economics, Vol. 99, No. 2, pp. 315-
333.
Von Greiff, J. (2009) Displacement and Self-Employment Entry. Labour Economics, Vol
16, 556-565.

Table 1. Full-time employees below 50 years in single-plant private sector firms with at least 25 employees (end of 2001)
Men Women I
N II
Unemp. 02-05
III Entr. 02-05
IV Entr. 05
V Empl.
05
VI No work
05
VII N
VIII Unemp. 02-05
IX Entr. 02-05
X Entr. 05
XI Empl.
05
XII No work
05 Employees all firms 110,898 21.0 % 3.7 % 2.8 % 83.7 % 13.5 % 39,873 23.0 % 1.4 % 1.1 % 75.5 % 23.4 % Employees in:
Stable firms 57,324 14.2 % 3.1 % 2.4 % 87.2 % 10.4 % 20,173 15.3 % 1.2 % 1.0 % 80.8 % 18.2 % 10-20 % downsizing 11,062 20.5 % 3.3 % 2.5 % 84.2 % 13.3 % 4,286 22.1 % 1.5 % 1.2 % 76.4 % 22.4 % 20-35 % downsizing 10,633 26.6 % 3.9 % 3.1 % 81.8 % 15.1 % 4,108 28.9 % 1.4 % 1.0 % 72.2 % 26.8 % 35-99 % downsizing 18,937 31.6 % 4.2 % 3.2 % 77.6 % 19.2 % 6,541 36.2 % 1.8 % 1.2 % 66.8 % 32.0 % Closure 12,942 30.8 % 5.5 % 4.1 % 78.1 % 17.8 % 4,761 33.5 % 1.7 % 1.3 % 67.4 % 31.3 %
Closure with: Bankruptcy 2,957 63.8 % 8.8 % 6.7 % 67.7 % 25.6 % 840 72.7 % 3.7 % 2.6 % 48.3 % 49.1 % Liquidation 4,788 24.3 % 5.3 % 4.3 % 79.3 % 16.4 % 1,953 30.7 % 1.5 % 1.1 % 71.8 % 27.1 % Takeover 4,295 16.9 % 3.1 % 2.1 % 83.7 % 14.2 % 1,598 17.8 % 1.0 % 0.9 % 71.0 % 28.2 % Undecided 902 23.4 % 6.2 % 4.4 % 78.8 % 16.8 % 370 28.1 % 1.1 % 0.5 % 71.9 % 27.6 %

24
Table 2. Descriptive statistics by firm closure and downsizing status.
Men Women I
Closure w bankruptcy
II Liquidation or takeover
III Downsizing
IV No downsiz-ing (<10%)
V Closure w bankruptcy
VI Liquidation or takeover
VII Downsizing
VIII No downsiz-ing (<10%)
Age 36.3 36.3 37.1 36.9 36.3 36.4 36.6 37.1 Education (%)
Compulsory 25.9 % 18.8 % 22.5 % 20.3 % 31.1 % 21.6 % 25.4 % 20.8 % Secondary 53.3 % 47.9 % 51.4 % 52.2 % 43.9 % 40.5 % 43.5 % 43.4 % College/University Unknown
20.0 % 0.8 %
32.6 % 0.7 %
25.3% 0.8 %
26.8 % 0.7 %
23.0 % 0.2 %
36.7 % 1.2 %
30.1 % 1.0 %
35.1 % 0.7 %
Earnings 2001 (1000 NOK) 347,973 422,232 373,876 393,228 280,039 335,653 310,203 320,537 Plant size (# employees) 92.0 104.2 183.5 138.7 69.5 89.4 139.1 151.3 Turnover 2000/2001 Downsizing>20% 00/01 (%)
17.0 % 12.3 %
16.1 % 6.2 %
15.1 % 12.1 %
14.5 % 5.9 %
21.5 % 14.3 %
18.5 % 10.7 %
19.2 % 11.0 %
17.5 % 4.6 %
Non-western immigrants (%) 2.5 % 1.8 % 2.7 % 1.6 % 4.8 % 4.1 % 3.4 % 2.4 % Sample size (N) 2,957 9,083 40,632 57,324 840 3,551 14,917 20,173 Number of firms 148 379 1557 2222 138 355 1459 2048
25
Table 3. Estimated average marginal effects (AME) of downsizing/closure on subsequent entrepreneurship probability, with robust standard errors (RSE)
Men Women I
Entrepreneur 2002-2005 II
Entrepreneur 2005 III
Entrepreneur 2002-2005 IV
Entrepreneur 2005 AME RSE AME RSE AME RSE AME RSE Stable firms Ref. Ref. Ref. Ref. 10-20 % downsizing 0.25 0.27 0.22 0.24 0.23 0.20 0.17 0.18 20-35 % downsizing 0.97*** 0.31 0.86*** 0.26 0.18 0.24 0.10 0.20 35-99 % downsizing 1.60*** 0.31 1.26*** 0.26 0.72*** 0.26 0.35* 0.20 Closure with:
Bankruptcy 4.99*** 0.72 3.72*** 0.56 2.58*** 0.85 1.82** 0.82 Liquidation 1.24*** 0.41 1.18*** 0.36 0.14 0.27 -0.06 0.23 Takeover 0.07 0.37 -0.18 0.28 -0.20 0.30 -0.14 0.25
Number of firms Bankruptcy (# firms)
4,364 148
4,364 148
4,057 138
4,057 138
Sample size (workers) 110,898 110,898 39,851 40,317 Fraction with outcome 3.66% 2.81% 1.43% 1.07% *(**)(***) Significant at the 10(5)(1) percent level.

26
Table 4. Robustness: Estimated average marginal effects (AME) of downsizing/closure on entrepreneurship in 2005
Men Women I
Baseline II
No prev. downsizing (2000/2001)
III Workers w stable emp.
only
IV Large firms
only (>49 empl.)
V Baseline
VI No prev.
downsizing (2000/2001)
VII Workers w stable emp.
only
VIII Large firms
only (>49 empl.)
Stable firms Ref. Ref. Ref. Ref. Ref. Ref. Ref. Ref. 10-20 % downsizing 0.22 0.17 0.39 0.16 0.17 0.14 0.42 0.19 20-35 % downsizing 0.86*** 0.76** 0.86** 0.56 0.10 0.07 -0.09 0.17 35-99 % downsizing 1.26*** 1.28*** 1.16*** 1.07*** 0.35* 0.36* 0.62 0.61** Closure with:
Bankruptcy 3.72*** 4.13*** 3.95*** 2.30*** 1.82** 2.11** 2.25 1.37 Liquidation 1.17*** 1.23*** 1.48** 1.10** -0.06 0.01 0.86 -0.13 Takeover -0.18 -0.17 -0.60* 0.01 -0.14 -0.11 -0.32 0.11
Sample size (# workers) 110,898 103,131 37,199 72,006 39,851 36,945 7,848 25,894 Fraction with outcome Fraction with bankruptcy
2.81 % 2.67 %
2.81 % 2.55 %
2.36 % 2.19 %
2.11 % 1.85 %
1.07 % 2.11%
1.09 % 1.96 %
0.83 % 1.89 %
0.88 % 1.43 %
# firms 4,364 4,026 3,268 1,569 4,057 3,739 2,421 1527 # bankruptcy firms 148 129 88 33 138 120 58 30 *(**)(***) Significant at the 10(5)(1) percent level.

27
Table 5. Performance of entrepreneurs from stable/growing and bankrupt firms
I Entrepreneurs from sta-
ble or growing firms
II Entrepreneurs from
bankrupt firms I. Individual income # Entrepreneurs 1,550 219 Average income at baseline (2001), 1000 NOK 554 475 Average income gain from 2001 to 2005/2006 (2001-value), 1000 NOK 152 -60 Average ratio of 2005/2006-income (in 2001-value) to 2001-income 2.05 1.03 Median income at baseline (2001), 1000 NOK 351 360 Median income gain from 2001 to 2005/2006 (2001-value), 1000 NOK 12 -21 Median ratio of 2005/2006- income (in 2001-value) to 2001-income 1.03 0.93 II. Firm performance # Firms 853 124 Fraction of firms established by “our” entrepreneur (new firms) 0.52 0.69 Average number of employees in 2005 18.7 7.5 Average change in the number of employees from 2001 to 2005 (0 employees in 2001 for new firms) 5.9 6.6 Average running surplus in 2005, 1000 NOK 1,757 444 Average change in running surplus from 2001 to 2005 (0 surplus in 2001 for new firms), 1000 NOK 1,124 394 Median number of employees in 2005 6 4 Median change in the number of employees from 2001 to 2005 (0 employees in 2001 for new firms) 3 4 Median running surplus in 2005, 1000 NOK 243 138 Median change in running surplus from 2001 to 2005 (0 surplus in 2001 for new firms), 1000 NOK 122 99 Note: The data on firm performance include limited liability companies only (not self-employed).

28
Figure 1. The distribution of personal income gains (from 2001 to 2005/2006) for entrepre-neurs from stable/growing and bankruptcy firms (1000 NOK)
Figure 2. The distribution of employment growth from 2000 to 2005 in companies with en-trepreneurs from stable/growing and bankruptcy firms.

29
Appendix
Table A1. Estimated Average Marginal Effects (AME) in the baseline models Men Women Entrepreneur
2002-2005 Entrepreneur
2005 Entrepreneur 2002-2005
Entrepreneur 2005
AME (stand. error)
AME (stand. error)
AME (stand. error)
AME (stand. error)
Downsizing/closure Stable or growing firm Ref. Ref. Ref. Ref. 10-20 % downsizing 0.25 0.22 0.23 0.17 (0.27) (0.24) (0.20) (0.18) 20-35 % downsizing 0.97 0.86 0.18 0.10 (0.31) (0.26) (0.24) (0.20) 35-99 % downsizing 1.60 1.26 0.72 0.35 (0.31) (0.26) (0.26) (0.20) Bankruptcy 4.99 3.72 2.58 1.82 (0.72) (0.56) (0.85) (0.82) Liquidation 1.24 1.18 0.14 0.06 (0.42) (0.36) (0.27) (0.23) Takeover 0.07 -0.18 -0.20 -0.14 (0.37) (0.28) (0.30) (0.25) Undecided 1.51 0.94 -0.40 -0.54 (0.61) (0.52) (0.39) (0.30) Age Age 22 -1.10 -0.75 -0.96 -0.64 (0.44) (0.41) (0.25) (0.17) Age 23 -0.55 -0.26 0.12 -0.03 (0.44) (0.40) (0.58) (0.41) Age 24 -1.06 -0.69 -0.55 -0.20 (0.41) (0.38) (0.36) (0.33) Age 25 -0.45 -0.02 -0.09 0.09 (0.45) (0.42) (0.45) (0.40) Age 26 -0.69 -0.49 -0.04 -0.02 (0.40) (0.35) (0.43) (0.34) Age 27 -0.57 -0.59 -0.29 -0.07 (0.39) (0.33) (0.34) (0.31) Age 28 0.11 -0.01 0.07 0.32 (0.43) (0.37) (0.43) (0.43) Age 29 -0.30 -0.33 0.35 0.11 (0.40) (0.34) (0.51) (0.36) Age 30 0.08 0.01 0.12 0.14 (0.41) (0.36) (0.43) (0.36) Age 31 0.06 0.16 0.16 0.24 (0.41) (0.38) (0.45) (0.40) Age 32 0.22 0.15 0.25 0.31 (0.43) (0.38) (0.48) (0.42) Age 33 -0.02 0.01 0.66 0.72 (0.39) (0.35) (0.56) (0.54) Age 34 0.20 0.09 0.57 0.79 (0.42) (0.37) (0.54) (0.56) Age 35 -0.05 -0.31 0.49 0.56 (0.41) (0.34) (0.52) (0.49) Age 36 0.07 0.18 0.00 0.03

30
Men Women Entrepreneur
2002-2005 Entrepreneur
2005 Entrepreneur 2002-2005
Entrepreneur 2005
AME (stand. error)
AME (stand. error)
AME (stand. error)
AME (stand. error)
(0.41) (0.37) (0.42) (0.35) Age 37 0.28 0.02 0.34 0.53 (0.42) (0.36) (0.47) (0.50) Age 38 -0.25 -0.31 0.46 0.51 (0.38) (0.32) (0.53) (0.49) Age 39 0.53 0.43 0.61 0.66 (0.46) (0.41) (0.57) (0.54) Age 40 Ref. Ref. Ref. Ref. Age 41 0.29 0.01 0.41 0.53 (0.45) (0.39) (0.54) (0.51) Age 42 -0.19 -0.16 0.75 0.85 (0.40) (0.36) (0.60) (0.58) Age 43 -0.16 -0.34 -0.33 0.02 (0.42) (0.35) (0.35) (0.36) Age 44 -0.37 -0.56 0.36 0.46 (0.40) (0.34) (0.53) (0.49) Age 45 -0.11 -0.13 -0.21 0.05 (0.43) (0.38) (0.38) (0.37) Age 46 -0.51 -0.49 -0.26 0.08 (0.40) (0.35) (0.38) (0.39) Age 47 -0.01 -0.19 -0.09 0.23 (0.44) (0.38) (0.43) (0.43) Age 48 -0.45 -0.38 -0.26 0.17 (0.42) (0.37) (0.40) (0.42) Age 49 -0.40 -0.37 -0.24 0.17 (0.42) (0.37) (0.42) (0.43) Age 50 -0.85 -1.02 -0.01 0.29 (0.39) (0.31) (0.48) (0.47) Age 51 -1.02 -1.02 -0.38 0.02 (0.38) (0.31) (0.39) (0.40) Education and industry Low education*primary industry 1.16 -0.45 (1.65) (1.14) Low education*manufacturing Ref. Ref. Ref. Ref. Low education*retail 0.29 0.22 1.13 1.05 (0.29) (0.27) (0.43) (0.41) Low education*hotel, restaurants 2.32 1.56 1.46 1.09 (0.81) (0.73) (0.53) (0.47) Low education*transport 0.85 0.58 0.27 0.16 (0.41) (0.33) (0.34) (0.28) Low education*finance 2.18 1.59 1.14 0.70 (0.52) (0.45) (0.41) (0.32) Low education*education 3.87 3.34 (3.27) (2.48) Low education*health service 1.33 1.02 0.41 0.04 (0.86) (0.74) (0.37) (0.25) Low education*other industry 0.21 0.11 0.94 0.49 (0.72) (0.66) (0.56) (0.45) Medium education*primary industry 1.79 0.87 4.09 4.63 (1.46) (1.17) (3.30) (3.63) Medium education*manufacturing 1.07 0.86 0.74 0.57 (0.20) (0.18) (0.30) (0.27) Medium education*retail 0.94 0.70 0.84 0.76

31
Men Women Entrepreneur
2002-2005 Entrepreneur
2005 Entrepreneur 2002-2005
Entrepreneur 2005
AME (stand. error)
AME (stand. error)
AME (stand. error)
AME (stand. error)
(0.31) (0.27) (0.38) (0.37) Medium education*hotel, restaurants 2.76 1.58 2.08 1.91 (0.66) (0.57) (0.65) (0.67) Medium education*transport 0.85 0.49 0.14 0.18 (0.36) (0.32) (0.29) (0.29) Medium education*finance 1.86 1.42 0.95 0.64 (0.42) (0.38) (0.35) (0.29) Medium education*education 4.00 2.71 0.91 0.34 (2.12) (1.86) (0.99) (0.78) Medium education*health service -0.13 0.03 0.42 0.23 (0.57) (0.53) (0.42) (0.35) Medium education*other industry 2.47 1.55 1.27 0.30 (1.02) (0.76) (0.75) (0.46) Bachelor degree 1.67 1.07 1.25 0.92 (0.29) (0.24) (0.37) (0.32) Graduate school 1.30 0.80 1.42 0.82 (0.35) (0.29) (0.48) (0.36) Other/Missing 0.69 0.20 0.61 0.70 (0.75) (0.63) (0.63) (0.64) Immigrant status Immigrant OECD 0.15 -0.15 0.07 0.11 (0.42) (0.37) (0.40) (0.35) Immigrant Eastern Europe -1.13 -0.41 -0.40 -0.06 (0.47) (0.46) (0.45) (0.45) Immigrant Middle East/Africa -1.50 -0.90 0.64 0.36 (0.50) (0.48) (1.17) (1.01) Immigrant Other Africa -2.03 -1.46 -0.51 (0.75) (0.69) (0.95) Immigrant SE Asia -1.72 -1.38 -0.38 -0.35 (0.50) (0.44) (0.42) (0.33) Immigrant Other Asia -0.69 -0.27 -1.08 -0.71 (0.69) (0.60) (0.38) (0.38) Immigrant South America -2.58 -2.26 0.36 -0.50 (0.57) (0.41) (0.97) (0.59) County of residence Oslo Ref. Ref. Ref. Ref. Østfold -0.73 -0.32 0.10 0.16 (0.34) (0.31) (0.38) (0.33) Akershus 0.10 -0.03 -0.00 0.10 (0.32) (0.28) (0.27) (0.24) Hedmark -1.52 -1.07 -0.00 0.05 (0.37) (0.33) (0.49) (0.45) Oppland -0.72 -0.77 -0.34 -0.29 (0.48) (0.39) (0.38) (0.31) Buskerud 0.01 -0.26 -0.39 -0.32 (0.40) (0.32) (0.28) (0.22) Vestfold -0.97 -0.82 0.14 0.17 (0.37) (0.32) (0.41) (0.37) Telemark -0.12 -0.02 -0.94 -0.70 (0.56) (0.46) (0.28) (0.23) Aust-Agder -0.26 -0.30 -0.44 -0.14 (0.53) (0.45) (0.51) (0.49) Vest-Agder -0.44 -0.30 -0.09 0.25 (0.44) (0.40) (0.47) (0.47)

32
Men Women Entrepreneur
2002-2005 Entrepreneur
2005 Entrepreneur 2002-2005
Entrepreneur 2005
AME (stand. error)
AME (stand. error)
AME (stand. error)
AME (stand. error)
Rogaland -0.60 -0.50 -0.47 -0.33 (0.40) (0.35) (0.23) (0.19) Hordaland -0.73 -0.75 0.01 -0.05 (0.31) (0.26) (0.28) (0.23) Sogn og Fjordane -1.88 -1.38 -0.27 0.13 (0.41) (0.37) (0.50) (0.52) Møre og Romsdal -1.73 -1.45 -0.33 -0.04 (0.31) (0.25) (0.35) (0.34) Sør-Trøndelag -1.41 -1.12 -0.28 -0.24 (0.30) (0.27) (0.32) (0.26) Nord-Trøndelag -1.57 -1.52 -0.16 0.35 (0.53) (0.42) (0.63) (0.67) Nordland -2.13 -1.77 -0.29 -0.11 (0.31) (0.26) (0.38) (0.36) Troms -1.20 -1.20 -0.56 -0.29 (0.45) (0.37) (0.51) (0.47) Finnmark -2.15 -2.11 -0.53 -0.02 (0.53) (0.36) (0.66) (0.71) Size of municipality Municipality population<2000 0.78 0.97 0.22 0.28 (0.58) (0.53) (0.78) (0.70) Municipality population 2000-5000 0.89 0.89 0.30 -0.00 (0.33) (0.29) (0.36) (0.28) Municipality population 5000-10000 0.17 0.26 0.08 -0.22 (0.25) (0.22) (0.27) (0.21) Municipality population 10-50000 0.01 0.09 -0.04 -0.17 (0.19) (0.17) (0.19) (0.15) Municipality population>50000 Ref. Ref. Ref. Ref. Size of firm # of employees 25-49 Ref. Ref. Ref. Ref. # of employees 50-74 -1.43 -1.11 -0.50 -0.36 (0.22) (0.19) (0.17) (0.15) # of employees 75-99 -2.10 -1.64 -0.22 -0.11 (0.24) (0.20) (0.25) (0.20) # of employees 100-199 -2.69 -2.02 -0.61 -0.45 (0.19) (0.16) (0.16) (0.14) # of employees >199 -3.53 -2.79 -1.08 -0.87 (0.16) (0.13) (0.15) (0.12)