credicorp ltd
TRANSCRIPT

SECURITIES AND EXCHANGE COMMISSION
Washington, D.C. 20549
FORM 6-K
Report of Foreign Private IssuerPursuant to Rule 13a-16 or 15d-16 under the
Securities Exchange Act of 1934
For the month of November 2019
Commission File Number: 001-14014
CREDICORP LTD.(Translation of registrant’s name into English)
Clarendon House
Church StreetHamilton HM 11 Bermuda
(Address of principal executive office)
Indicate by check mark whether the registrant files or will file annual reports under cover of Form 20-F or Form 40-F.
Form 20-F ☒ Form 40-F ☐ Indicate by check mark if the registrant is submitting the Form 6-K in paper as permitted by Regulation S-T Rule 101(b)(1): ____ Indicate by check mark if the registrant is submitting the Form 6-K in paper as permitted by Regulation S-T Rule 101(b)(7): ____

The information in this Form 6-K (including any exhibit hereto) shall not be deemed “filed” for purposes of Section 18 of the Securities Exchange Act of1934 (the “Exchange Act”) or otherwise subject to the liabilities of that section, nor shall it be deemed incorporated by reference in any filing under theSecurities Act of 1933 or the Exchange Act.

SIGNATURE
Pursuant to the requirements of the Securities Exchange Act of 1934, the registrant has duly caused this report to be signed on its behalf by the
undersigned, thereunto duly authorized.
Date: November 8th, 2019 CREDICORP LTD. (Registrant) By: /s/ Miriam Bottger Miriam Bottger Authorized Representative

Exhibit 99.1
CREDICORP Ltd.
Lima, Peru, November 7th, 2019 – Credicorp (NYSE: BAP) announced its unaudited results for the third quarter of 2019. These results are consolidatedaccording to IFRS in Soles.
Third Quarter Results 2019
In 3Q19, Credicorp reported net income of S/ 1,093.0 million, which translated into an ROAE and ROAA of 17.1% and 2.4%, respectively. This resultrepresented a decline of -0.5% and growth of +8.1% and +8.8% in net income QoQ, YoY and at year-to-date respectively. The QoQ evolution registered an increase in net interest income (NII), in line with an uptick in loan growth. The aforementioned was offset by an increase inthe expense for provisions for loan losses, mainly at BCP Stand-alone, and by growth in operating expenses. The increase in net income YoY and at the year-to-date level was mainly attributable to growth in net interest income (NII) and to an increase in non-financialincome, which was driven by an increase in the net gain on sales of securities. This was partially offset by an increase in the expense for provisions for loanlosses and by growth in operating expenses. The results in 3Q19 reveal: • QoQ expansion of average daily loan balances in all segments, which was primarily attributable to loan growth in Retail Banking. In the YoY analysis,which eliminates the seasonal effect, total loans measured in average daily balances grew 7.0%, which represented an improvement over last quarter’s figure.Growth was led by Retail Banking through the Mortgage, Credit Card and Consumer segments. Additionally, portfolio growth was mainly in local currency. • NII expanded +0.9% QoQ and +6.5% YoY in line with loan growth, which offset higher interest expenses on bonds and subordinated notes that was relatedto the liability management in BCP Stand-alone that affected both local as well as foreign currency. This extended maturities and reduced rates on bothissuances. Additionally, related with better-than-expected demand, BCP raise new money from this transaction in both currencies. At the year-to-date level,the evolution was similar: NII expanded +7.7% due to growth in total loans, which registered growth primarily in higher-margin segments within BCP Stand-alone and in local currency. However, because interest earning assets grew at a higher pace than NII, the net interest margin (NIM) fell -8 bps QoQ and -13pbs YoY. YTD, NIM increased +6 bps. • Provisions for loan losses net of recoveries registered growth of 12.2%, 14.4% and 18.7% QoQ, YoY and in YTD terms respectively. In this scenario, thecost of risk (CofR) increased +15 bps QoQ, +12 bps YoY and +16 bps in YTD terms, which was primarily due to an increase in the CofR at BCP Stand-aloneafter the provisions requirement for the Retail Banking portfolio rose. • In this context, risk-adjusted NIM fell -18 bps QoQ, -18 bps YoY and -5 bps at the YTD, in line with growth in the CofR. • Non-financial income expanded +6.6% QoQ. This growth was primarily attributable to an increase in the net gain on sales of securities due to favorableevolution at BCP Stand-alone and, to a lesser extent, to growth in fee income. It is important to note that the pace of growth of fee income has slowedthroughout the years due to regulatory changes that affect the fees charged to retail clients; more competition in the market; and the current transactionalstrategy to encourage clients to migrate to digital channels. • The insurance underwriting result reported an increase of +6.0% QoQ, 3.7% YoY and +1.0% at the YTD level, which was primarily attributable to anincrease in net earned premiums for life insurance and property and casualty insurance. • The efficiency ratio increased +10 bps QoQ, in line with a seasonal increase in operating expenses given that expenses tend to be higher in the second halfof the year. The efficiency ratio fell -40 bps both YoY and at the YTD level, in line with growth in net interest income (NII), which offset the increase insalaries and employee benefits.

Table of Contents Credicorp (NYSE: BAP): Third Quarter Results 2019 3 Financial Overview 3 Credicorp and subsidiaries 41. Interest-earning assets (IEA) 5 1.1. Evolution of IEA 5 1.2. Credicorp Loans 6 1.2.1. Loan evolution by business segment 6 1.2.2. Evolution of the level of dollarization by segment 8 1.2.3. BCRP de-dollarization plan at BCP Stand-alone 9 1.2.4. Market share in loans 102. Funding Sources 11 2.1. Funding Structure 11 2.2. Deposits 12 2.2.1. Deposits: dollarization level 13 2.2.2. Market share in Deposits 14 2.3. Other funding sources 14 2.4. Loan / Deposit (L/D) 15 2.5. Funding Cost 163. Portfolio quality and Provisions for loan losses 18 3.1. Provisions for loan losses 18 3.2. Portfolio Quality: Delinquency ratios 19 3.2.1. Delinquency indicators by business line 204. Net Interest Income (NII) 25 4.1. Interest Income 25 4.2. Interest Expenses 26 4.3. Net Interest Margin (NIM) and Risk-Adjusted NIM 275. Non-Financial Income 29 5.1. Fee Income 30 5.1.1. By subsidiary 30 5.1.2. Fee income in the Banking Business 316. Insurance Underwriting Result 33 6.1. Net earned premiums 34 6.2. Net claims 35 6.3. Acquisition cost 357. Operating Expenses and Efficiency 37 7.1. Credicorp’s Administrative, General and Tax Expenses 39 7.2. Efficiency Ratio 408. Regulatory Capital 42 8.1. Regulatory Capital – BAP 42 8.2. Regulatory Capital – BCP Stand-alone based on Peru GAAP 439. Distribution channels 45 9.1. Universal Banking 45 9.1.1. Points of Contact – BCP Stand-alone 45 9.1.2. Points of contact by geographic area – BCP Stand-alone 45 9.1.3. Transactions per channel – BCP Stand-alone 46 9.1.4. Points of Contact – BCP Bolivia 47 9.2. Microfinance 47 9.2.1. Points of Contact – Mibanco 4710. Economic Perspectives 48 10.1. Peru Economic Forecasts 48 10.2. Main Economic Variables 4811. Appendix 52 11.1. Credicorp 52 11.2. BCP Consolidated 54 11.3. Mibanco 57 11.4. BCP Bolivia 58 11.5. Credicorp Capital 59 11.6. Atlantic Security Bank 60 11.7. Grupo Pacífico 62 11.8. Prima AFP 64 11.9. Table of calculations 65
Credicorp (NYSE: BAP): Third Quarter Results 2019
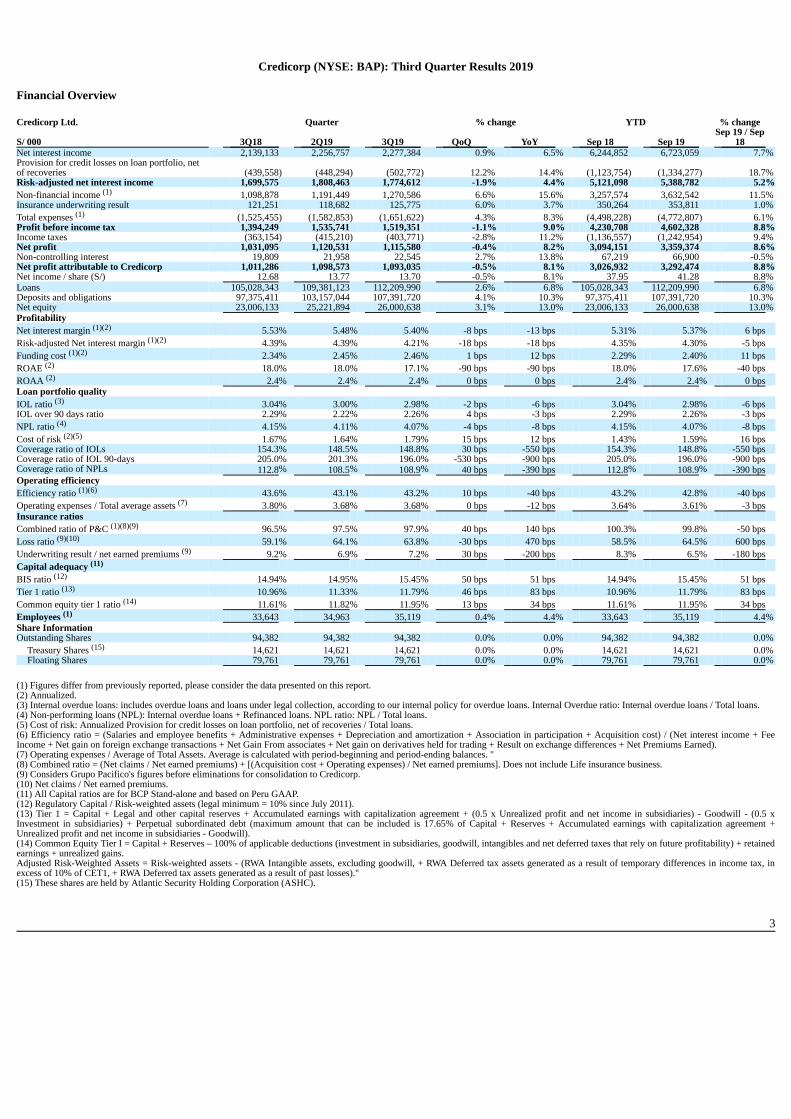
Financial Overview Credicorp Ltd. Quarter % change YTD % change
S/ 000 3Q18 2Q19 3Q19 QoQ YoY Sep 18 Sep 19 Sep 19 / Sep
18 Net interest income 2,139,133 2,256,757 2,277,384 0.9% 6.5% 6,244,852 6,723,059 7.7%Provision for credit losses on loan portfolio, netof recoveries (439,558) (448,294) (502,772) 12.2% 14.4% (1,123,754) (1,334,277) 18.7%Risk-adjusted net interest income 1,699,575 1,808,463 1,774,612 -1.9% 4.4% 5,121,098 5,388,782 5.2%Non-financial income (1) 1,098,878 1,191,449 1,270,586 6.6% 15.6% 3,257,574 3,632,542 11.5%Insurance underwriting result 121,251 118,682 125,775 6.0% 3.7% 350,264 353,811 1.0%Total expenses (1) (1,525,455) (1,582,853) (1,651,622) 4.3% 8.3% (4,498,228) (4,772,807) 6.1%Profit before income tax 1,394,249 1,535,741 1,519,351 -1.1% 9.0% 4,230,708 4,602,328 8.8%Income taxes (363,154) (415,210) (403,771) -2.8% 11.2% (1,136,557) (1,242,954) 9.4%Net profit 1,031,095 1,120,531 1,115,580 -0.4% 8.2% 3,094,151 3,359,374 8.6%Non-controlling interest 19,809 21,958 22,545 2.7% 13.8% 67,219 66,900 -0.5%Net profit attributable to Credicorp 1,011,286 1,098,573 1,093,035 -0.5% 8.1% 3,026,932 3,292,474 8.8%Net income / share (S/) 12.68 13.77 13.70 -0.5% 8.1% 37.95 41.28 8.8%Loans 105,028,343 109,381,123 112,209,990 2.6% 6.8% 105,028,343 112,209,990 6.8%Deposits and obligations 97,375,411 103,157,044 107,391,720 4.1% 10.3% 97,375,411 107,391,720 10.3%Net equity 23,006,133 25,221,894 26,000,638 3.1% 13.0% 23,006,133 26,000,638 13.0%Profitability Net interest margin (1)(2) 5.53% 5.48% 5.40% -8 bps -13 bps 5.31% 5.37% 6 bps Risk-adjusted Net interest margin (1)(2) 4.39% 4.39% 4.21% -18 bps -18 bps 4.35% 4.30% -5 bps Funding cost (1)(2) 2.34% 2.45% 2.46% 1 bps 12 bps 2.29% 2.40% 11 bps ROAE (2) 18.0% 18.0% 17.1% -90 bps -90 bps 18.0% 17.6% -40 bps ROAA (2) 2.4% 2.4% 2.4% 0 bps 0 bps 2.4% 2.4% 0 bps Loan portfolio quality IOL ratio (3) 3.04% 3.00% 2.98% -2 bps -6 bps 3.04% 2.98% -6 bps IOL over 90 days ratio 2.29% 2.22% 2.26% 4 bps -3 bps 2.29% 2.26% -3 bps NPL ratio (4) 4.15% 4.11% 4.07% -4 bps -8 bps 4.15% 4.07% -8 bps Cost of risk (2)(5) 1.67% 1.64% 1.79% 15 bps 12 bps 1.43% 1.59% 16 bps Coverage ratio of IOLs 154.3% 148.5% 148.8% 30 bps -550 bps 154.3% 148.8% -550 bps Coverage ratio of IOL 90-days 205.0% 201.3% 196.0% -530 bps -900 bps 205.0% 196.0% -900 bps Coverage ratio of NPLs 112.8% 108.5% 108.9% 40 bps -390 bps 112.8% 108.9% -390 bps Operating efficiency Efficiency ratio (1)(6) 43.6% 43.1% 43.2% 10 bps -40 bps 43.2% 42.8% -40 bps Operating expenses / Total average assets (7) 3.80% 3.68% 3.68% 0 bps -12 bps 3.64% 3.61% -3 bps Insurance ratios Combined ratio of P&C (1)(8)(9) 96.5% 97.5% 97.9% 40 bps 140 bps 100.3% 99.8% -50 bps Loss ratio (9)(10) 59.1% 64.1% 63.8% -30 bps 470 bps 58.5% 64.5% 600 bps Underwriting result / net earned premiums (9) 9.2% 6.9% 7.2% 30 bps -200 bps 8.3% 6.5% -180 bps Capital adequacy (11) BIS ratio (12) 14.94% 14.95% 15.45% 50 bps 51 bps 14.94% 15.45% 51 bps Tier 1 ratio (13) 10.96% 11.33% 11.79% 46 bps 83 bps 10.96% 11.79% 83 bps Common equity tier 1 ratio (14) 11.61% 11.82% 11.95% 13 bps 34 bps 11.61% 11.95% 34 bps Employees (1) 33,643 34,963 35,119 0.4% 4.4% 33,643 35,119 4.4%Share Information Outstanding Shares 94,382 94,382 94,382 0.0% 0.0% 94,382 94,382 0.0%
Treasury Shares (15) 14,621 14,621 14,621 0.0% 0.0% 14,621 14,621 0.0%Floating Shares 79,761 79,761 79,761 0.0% 0.0% 79,761 79,761 0.0%
(1) Figures differ from previously reported, please consider the data presented on this report.(2) Annualized.(3) Internal overdue loans: includes overdue loans and loans under legal collection, according to our internal policy for overdue loans. Internal Overdue ratio: Internal overdue loans / Total loans.(4) Non-performing loans (NPL): Internal overdue loans + Refinanced loans. NPL ratio: NPL / Total loans.(5) Cost of risk: Annualized Provision for credit losses on loan portfolio, net of recoveries / Total loans.(6) Efficiency ratio = (Salaries and employee benefits + Administrative expenses + Depreciation and amortization + Association in participation + Acquisition cost) / (Net interest income + FeeIncome + Net gain on foreign exchange transactions + Net Gain From associates + Net gain on derivatives held for trading + Result on exchange differences + Net Premiums Earned).(7) Operating expenses / Average of Total Assets. Average is calculated with period-beginning and period-ending balances. "(8) Combined ratio = (Net claims / Net earned premiums) + [(Acquisition cost + Operating expenses) / Net earned premiums]. Does not include Life insurance business.(9) Considers Grupo Pacifico's figures before eliminations for consolidation to Credicorp.(10) Net claims / Net earned premiums.(11) All Capital ratios are for BCP Stand-alone and based on Peru GAAP.(12) Regulatory Capital / Risk-weighted assets (legal minimum = 10% since July 2011).(13) Tier 1 = Capital + Legal and other capital reserves + Accumulated earnings with capitalization agreement + (0.5 x Unrealized profit and net income in subsidiaries) - Goodwill - (0.5 xInvestment in subsidiaries) + Perpetual subordinated debt (maximum amount that can be included is 17.65% of Capital + Reserves + Accumulated earnings with capitalization agreement +Unrealized profit and net income in subsidiaries - Goodwill).(14) Common Equity Tier I = Capital + Reserves – 100% of applicable deductions (investment in subsidiaries, goodwill, intangibles and net deferred taxes that rely on future profitability) + retainedearnings + unrealized gains.Adjusted Risk-Weighted Assets = Risk-weighted assets - (RWA Intangible assets, excluding goodwill, + RWA Deferred tax assets generated as a result of temporary differences in income tax, inexcess of 10% of CET1, + RWA Deferred tax assets generated as a result of past losses)."(15) These shares are held by Atlantic Security Holding Corporation (ASHC).
3

Credicorp and subsidiaries Earnings contribution * Quarter % change YTD % change S/ 000 3Q18 2Q19 3Q19 QoQ YoY Sep 18 Sep 19 Sep 19 / Sep 18 Universal Banking BCP Stand-alone 712,427 790,383 831,423 5.2% 16.7% 2,163,603 2,437,771 12.7%BCP Bolivia 15,360 26,806 25,575 -4.6% 66.5% 55,384 65,021 17.4%Microfinance Mibanco (1) 102,426 96,906 95,137 -1.8% -7.1% 345,391 291,654 -15.6%Encumbra 1,310 1,263 852 -32.5% -35.0% 3,171 3,940 24.3%Insurance and Pensions Grupo Pacifico (2) 97,269 97,133 88,949 -8.4% -8.6% 243,638 263,239 8.0%Prima AFP 41,476 50,367 42,394 -15.8% 2.2% 109,115 149,761 37.3%Investment Banking and WealthManagement Credicorp Capital 17,770 10,823 13,010 20.2% -26.8% 49,973 39,252 -21.5%Atlantic Security Bank 35,089 50,592 43,376 -14.3% 23.6% 94,894 143,716 51.4%Others (3) (11,841) (25,700) (47,681) 85.5% 302.7% (38,237) (101,879) 166.4%Net income attributed to Credicorp 1,011,286 1,098,573 1,093,035 -0.5% 8.1% 3,026,932 3,292,475 8.8%
*Contributions to Credicorp reflect the eliminations for consolidation purposes (e.g. eliminations for transactions among Credicorp’s subsidiaries or between Credicorp and its subsidiaries).(1) The figure is lower than the net income of Mibanco because Credicorp owns 99.921% of Mibanco (directly and indirectly).(2) The contribution is higher than Grupo Pacifico’s net income because Credicorp owns 65.20% directly, and 33.59% through Grupo Credito.(3) Includes Grupo Credito excluding Prima (Servicorp and Emisiones BCP Latam), others of Atlantic Security Holding Corporation and others of Credicorp Ltd.
Quarter YTD ROAE 3Q18 2Q19 3Q19 Sep 18 Sep 19
Universal Banking BCP Stand-alone 21.0% 21.5% 21.7% 21.1% 21.5%BCP Bolivia 9.5% 15.8% 14.4% 11.4% 12.2%Microfinance Mibanco (1) 22.4% 20.0% 18.7% 26.6% 19.7%Encumbra 8.9% 8.4% 5.8% 7.4% 9.1%Insurance and Pensions Grupo Pacifico (2) 15.4% 13.6% 11.0% 12.1% 11.7%Prima 27.6% 33.3% 26.0% 23.4% 30.6%Investment Banking and Wealth Management Credicorp Capital 9.8% 7.7% 9.3% 8.8% 8.4%Atlantic Security Bank 18.6% 25.7% 20.3% 15.2% 22.8%Credicorp 18.0% 18.0% 17.1% 18.0% 17.6% (1) ROAE including goodwill of BCP from the acquisition of Edyficar (Approximately US$ 50.7 million) was 20.8% in 3Q18, 18.6% in 2Q19 and 17.5% in3Q19. YTD was 24.7% for September 2018 and 18.4% for September 2019.(2) Figures include unrealized gains or losses that are considered in Pacifico’s Net Equity from the investment portfolio of Pacifico Vida. ROAE excludingsuch unrealized gains was 18.7% in 3Q18, 18.6% in 2Q19 and 16.3% in 3Q19." YTD was 15.3% for September 2018 and 15.7% for September 2019.
4
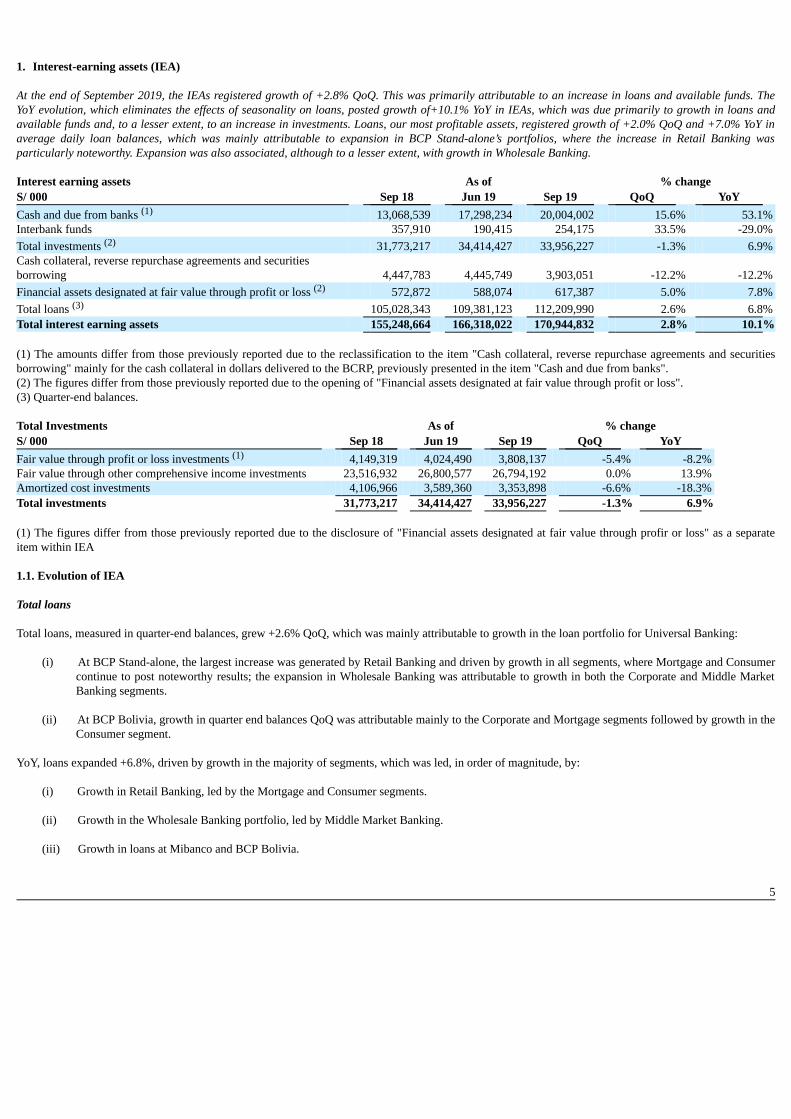
1. Interest-earning assets (IEA) At the end of September 2019, the IEAs registered growth of +2.8% QoQ. This was primarily attributable to an increase in loans and available funds. TheYoY evolution, which eliminates the effects of seasonality on loans, posted growth of+10.1% YoY in IEAs, which was due primarily to growth in loans andavailable funds and, to a lesser extent, to an increase in investments. Loans, our most profitable assets, registered growth of +2.0% QoQ and +7.0% YoY inaverage daily loan balances, which was mainly attributable to expansion in BCP Stand-alone’s portfolios, where the increase in Retail Banking wasparticularly noteworthy. Expansion was also associated, although to a lesser extent, with growth in Wholesale Banking. Interest earning assets As of % change S/ 000 Sep 18 Jun 19 Sep 19 QoQ YoY Cash and due from banks (1) 13,068,539 17,298,234 20,004,002 15.6% 53.1%Interbank funds 357,910 190,415 254,175 33.5% -29.0%Total investments (2) 31,773,217 34,414,427 33,956,227 -1.3% 6.9%Cash collateral, reverse repurchase agreements and securitiesborrowing 4,447,783 4,445,749 3,903,051 -12.2% -12.2%Financial assets designated at fair value through profit or loss (2) 572,872 588,074 617,387 5.0% 7.8%Total loans (3) 105,028,343 109,381,123 112,209,990 2.6% 6.8%Total interest earning assets 155,248,664 166,318,022 170,944,832 2.8% 10.1% (1) The amounts differ from those previously reported due to the reclassification to the item "Cash collateral, reverse repurchase agreements and securitiesborrowing" mainly for the cash collateral in dollars delivered to the BCRP, previously presented in the item "Cash and due from banks".(2) The figures differ from those previously reported due to the opening of "Financial assets designated at fair value through profit or loss".(3) Quarter-end balances. Total Investments As of % change S/ 000 Sep 18 Jun 19 Sep 19 QoQ YoY Fair value through profit or loss investments (1) 4,149,319 4,024,490 3,808,137 -5.4% -8.2%Fair value through other comprehensive income investments 23,516,932 26,800,577 26,794,192 0.0% 13.9%Amortized cost investments 4,106,966 3,589,360 3,353,898 -6.6% -18.3%Total investments 31,773,217 34,414,427 33,956,227 -1.3% 6.9% (1) The figures differ from those previously reported due to the disclosure of "Financial assets designated at fair value through profir or loss" as a separateitem within IEA 1.1. Evolution of IEA Total loans Total loans, measured in quarter-end balances, grew +2.6% QoQ, which was mainly attributable to growth in the loan portfolio for Universal Banking:
(i) At BCP Stand-alone, the largest increase was generated by Retail Banking and driven by growth in all segments, where Mortgage and Consumercontinue to post noteworthy results; the expansion in Wholesale Banking was attributable to growth in both the Corporate and Middle MarketBanking segments.
(ii) At BCP Bolivia, growth in quarter end balances QoQ was attributable mainly to the Corporate and Mortgage segments followed by growth in theConsumer segment.
YoY, loans expanded +6.8%, driven by growth in the majority of segments, which was led, in order of magnitude, by:
(i) Growth in Retail Banking, led by the Mortgage and Consumer segments. (ii) Growth in the Wholesale Banking portfolio, led by Middle Market Banking. (iii) Growth in loans at Mibanco and BCP Bolivia.
5

Investments Total investments fell -1.3% QoQ. In the YoY evolution, total investments increased +6.9%, which reflected a slight recomposition where fair value throughother comprehensive income investments (formerly securities available for sale) increased their share of total investments while investments at amortized costand fair value through profit and loss investments posted decreases. Other IEA Available funds grew 15.6% QoQ and 53.1% YoY due to growth in FC funds held at BCRP and, to a lesser extent, to an increase in FC balances in foreignbanks after the level of foreign currency funding at BCP Stand-alone rose. 1.2. Credicorp Loans 1.2.1. Loan evolution by business segment The chart below shows the composition of loans by subsidiary and loan segment measured in average daily balances. These balances provide the mostaccurate platform to analyze the evolution of income generation from interest on loans, which constitutes Credicorp’s main source of income. Additionally,average daily balances reflect trends or variations to a different degree than quarter-end balances which may include pre-payments or loans made at the end ofthe quarter, that affect average daily balances less than quarter-end balances. Average daily loan balances posted growth of +2.0% QoQ. Similar to last quarter, this expansion was driven by the results of the Mortgage and Consumersegments. YoY, average daily loan balances expanded +7.0%. This evolution reflected a significant increase in the Mortgage segment followed by slighterincreases in Credit Cards, Consumer and SME-Pyme. Growth was also driven, albeit to a lesser extent, to an improvement in the results for WholesaleBanking, where Middle Market banking drove expansion. Growth in loan balances both QoQ and YoY was concentrated in local currency.
Loan evolution measured in average daily balances by segment (1)
TOTAL LOANS Expressed in million S/ % Change % Part. in total loans 3Q18 2Q19 3Q19 QoQ YoY 3Q18 2Q19 3Q19 BCP Stand-alone 85,289 89,632 91,700 2.3% 7.5% 81.8% 81.9% 82.1%
Wholesale Banking 44,963 45,883 46,434 1.2% 3.3% 43.1% 41.9% 41.6%Corporate 27,499 28,065 28,024 -0.1% 1.9% 26.4% 25.6% 25.1%Middle - Market 17,464 17,818 18,410 3.3% 5.4% 16.7% 16.3% 16.5%
Retail Banking 40,326 43,749 45,266 3.5% 12.3% 38.7% 40.0% 40.5%SME - Business 5,384 5,340 5,544 3.8% 3.0% 5.2% 4.9% 5.0%SME - Pyme 8,939 9,558 9,851 3.1% 10.2% 8.6% 8.7% 8.8%Mortgage 14,159 15,539 16,095 3.6% 13.7% 13.6% 14.2% 14.4%Consumer 7,275 7,878 8,239 4.6% 13.2% 7.0% 7.2% 7.4%Credit Card 4,569 5,433 5,538 1.9% 21.2% 4.4% 5.0% 5.0%
Mibanco 9,585 10,031 10,068 0.4% 5.0% 9.2% 9.2% 9.0%Bolivia 6,888 7,244 7,431 2.6% 7.9% 6.6% 6.6% 6.7%ASB 2,551 2,530 2,467 -2.5% -3.3% 2.4% 2.3% 2.2%BAP’s total loans 104,313 109,436 111,666 2.0% 7.0% 100.0% 100.0% 100.0%
Highest growth in volumes
Largest contraction in volumes
For consolidation purposes, loans generated in FC are converted to LC.(1) Includes Work out unit, and other banking.
6

Loan Growth QoQ in Average Daily BalancesExpressed in millions of S/
+2.0% QoQ
In the analysis by segment, we see that QoQ growth in loans measured in average daily balances reflects:
(i) Growth across BCP Stand-alone’s portfolios and in the portfolios of other subsidiaries with the exception of ASB.
(ii) The Retail Banking segments at BCP Stand-alone -fueled mainly by expansion in the Mortgage and Consumer segments- contributed the most toportfolio growth.
It is important to note that real loan growth in average daily balances was situated at +1.2% QoQ if we eliminate the effect of +2.6% QoQ appreciation of thedollar.
Loan Growth YoY in Average Daily Balances
Expressed in millions of S/
+7.0% YoY
7

The YoY analysis by segment, measured in average daily balances, shows the following:
(i) Within Retail Banking, the Mortgage segment evolution stands out (+S/1,936 million, +13.7% YoY), growing consistently through severalprevious quarters.
(ii) Other significant variations were seen in the Credit Card segment (+S/969 million), Consumer (+S/964 million) and SME-Pyme (+S/912 million)within Retail Banking and in Middle Market Banking (+S/945 million) and Corporate (+S/526 million) in Wholesale Banking.
(iii) Loan growth at BCP Bolivia was situated at +7.9% YoY. This evolution was mainly attributable to growth in the Corporate and Mortgage
(regulated) portfolio followed by loan expansion in the Consumer portfolio. (iv) Loan growth at Mibanco (+5.0% YoY), which reflects the bank’s strategy to grow loans hand-in-hand with its commitment to expanding financial
exclusion (bringing new clients into the system) while supporting the development of current clients. It is important to note that real loan growth YoY in average daily balances was situated at +6.3% if we eliminate the effect of appreciation in the US Dollarover the year (+2.5% YoY). 1.2.2. Evolution of the level of dollarization by segment
Loan evolution by currency - average daily balances (1)
DOMESTIC CURRENCY LOANS FOREIGN CURRENCY LOANS % part. by currency Expressed in million S/ Expressed in million US$ 3Q19
3Q18 2Q19 3Q19 QoQ YoY 3Q18 2Q19 3Q19 QoQ YoY LC FC BCP Stand-alone 52,659 56,165 57,636 2.6% 9.5% 9,919 10,075 10,132 0.6% 2.1% 62.9% 37.1%
Wholesale Banking 20,149 19,876 19,964 0.4% -0.9% 7,544 7,829 7,873 0.6% 4.4% 43.0% 57.0%Corporate 11,775 11,581 11,320 -2.3% -3.9% 4,780 4,962 4,969 0.1% 3.9% 40.4% 59.6%Middle-Market 8,374 8,295 8,644 4.2% 3.2% 2,763 2,867 2,905 1.3% 5.1% 47.0% 53.0%
Retail Banking 32,510 36,289 37,672 3.8% 15.9% 2,376 2,246 2,258 0.6% -4.9% 83.2% 16.8%SME - Business 2,484 2,542 2,614 2.9% 5.2% 881 843 871 3.4% -1.2% 47.2% 52.8%SME - Pyme 8,672 9,324 9,628 3.3% 11.0% 81 70 66 -5.8% -18.3% 97.7% 2.3%Mortgage 11,328 13,008 13,632 4.8% 20.3% 861 762 733 -3.9% -14.9% 84.7% 15.3%Consumer 6,111 6,732 7,057 4.8% 15.5% 354 345 352 1.9% -0.7% 85.7% 14.3%Credit Card 3,916 4,684 4,742 1.2% 21.1% 199 226 237 4.9% 19.3% 85.6% 14.4%
Mibanco 9,048 9,489 9,522 0.4% 5.2% 163 163 162 -0.5% -0.7% 94.6% 5.4%Bolivia - - - - - 2,094 2,181 2,210 1.3% 5.5% - 100.0%ASB - - - - - 775 762 734 -3.7% -5.4% - 100.0%Total loans 61,707 65,654 67,158 2.3% 8.8% 12,952 13,181 13,238 0.4% 2.2% 60.1% 39.9%
Highest growth in volumes
Largest contraction in volumes (1) Includes Work out unit, and other banking. The analysis of loan expansion by currency shows that QoQ and YoY growth in the Retail segment and at the Mibanco subsidiary were attributable to the LCportfolio. In contrast, growth in Wholesale Banking and at other subsidiaries was mainly associated with the FC portfolio.
8

YoY evolution of the level of dollarization by segment (1)(2)(3)
(1) Average daily balances.(2) The FC share of Credicorp’s loan portfolio is calculated including BCP Bolivia and ASB, however the chart shows only the loan books of BCP Stand-alone and Mibanco.(3) The year with the historic maximum level of dollarization for Wholesale Banking was 2012, for Mibanco was 2016 and for the rest of segments was 2009. At BCP Stand-alone, the loan dollarization level fell to 37%. As expected, the Mortgage segment continues to post a downward trend in the dollarization levelof its portfolio, which fell from 20% in September 2018 to 15% in September 2019. The aforementioned was attributable to the fact that a large proportion oftotal loan disbursements was in LC. It is important to note that, as is evident in the following figure, the percentage of the loan portfolio that is highly exposed to FX risk on credit risk remainsvery low.
FX risk on credit risk – BCP Stand-alone
1.2.3. BCRP de-dollarization plan at BCP Stand-alone At the end of 2014, BCRP set up a Program to reduce the dollarization level of the loan book in the Peruvian Banking System. As part of this Program, BCRPset some targets to reduce the loan balances in US Dollars progressively at the end of June 2015, December 2015, December 2016, December 2017,December 2018 and December 2019. The balances that are subject to reduction targets are the total FC portfolio, with some exceptions, and the balance of thejoint mortgage and car loan portfolio. The balance required at the end of December 2019 is as follows:
(i) For the total portfolio in FC, the goal set for 2018 will continue to apply. In this context, the balance at the end of December 2018 must representno more than 80% of the total loan balance in FC reported at the end of September 2013 (excluding loans that meet certain requirements.) At the end of September 2019, BCP Stand-alone reported a compliance level of 106% with regard to the goal set by BCRP for December 2019.
9

(ii) For the combined FC Mortgage and Car portfolio, the target was adjusted in December 2018 to stipulate that the balance at the end of December
of 2019 must represent no more than 40% of the balance of the combined Mortgage and Car portfolio reported at the end of February 2013. Everyyear, the target will be adjusted by 10% to reach a minimum of 5% of Net Equity.
At the end of September 2019, BCP Stand-alone reported a compliance level of 87% with regard to the dedollarization goal set by BCRPindicated above.
1.2.4. Market share in loans
Market share in Peru(1)
(1) Market shares are different that previously reported because now includes non-performing loans in the sample. Peruvian Financial System At the end of August 2019, BCP Stand-alone continued to lead the Peruvian financial market(1) with a market share (MS) of 28.7%, which outpaced the17.7% share posted by our closest competitor. This level was higher to that obtained in 2Q19 (+20 bps) but fell below that posted in 3Q18 (-30bps). Mibancoregistered a market share of total loans in the Financial System of 3.2%, similar to the levels seen in 2Q19 and 3Q18. Within Wholesale Banking, the Corporate Banking segment registered an improvement of +110 bps in its MS with regard to 2Q19’s result, which contrastswith the evolution of Middle Market Banking’s result, which fell -20 bps during the same period. In the YoY evolution, Corporate Banking reported anincrease of +50 bps in MS while Middle Market Banking maintained the same level posted in 3Q18. It is important to note that both of these BCP segmentscontinue to lead their respective markets. Within Retail Banking, BCP continued to lead the Mortgage loan market, posting growth of +20 bps QoQ and +110 bps YoY due to a large increase in loanbalances in this segment. The SME-Business segment at BCP, which tied for first place in MS in 2Q19 with a share of 31.3%(2), pulled ahead of its closestcompetitor this quarter with an MS of 32.4% versus 31.7% for the runner-up. In the Consumer and Credit Card segments, BCP ranks second in the market. In the SME-Pyme segment, Mibanco continues to lead with an MS of 21.9%, which falls below the MS reported in 2Q19 and 3Q18 of 22.2%. BCP is secondin the segment with an MS of 11.4%. Bolivian Financial System Finally, the MS reported by BCP Bolivia fell YoY and QoQ; nevertheless, the subsidiary continues to rank fifth in the Bolivian financial system with a 9.3%share of the market.
(1) Includes Multipurpose Banks, Finance Companies, Municipal and Rural Banks, EDPYMEs and Leasing and Mortgages Companies.(2) Market share as of May 2019, showed in our previous 2Q19 Earnings Release.
10

2. Funding Sources At the end of 3Q19, total funding increased QoQ and YoY. The funding structure at Credicorp registered an expansion in deposits and obligations, the group’smain source of funding, posting an increase in their share of total funding. The increase in the funding volume was also attributable to a variation in theliability management of corporate bonds at BCP Stand-alone in LC and FC with extended maturity horizons and reduced rates. All of the aforementionedoffset the drop in BCRP instruments and Repurchase agreements. In this context, Credicorp’s funding cost remained relatively stable. Funding As of % change S/ 000 Sep 18 Jun 19 Sep 19 QoQ YoY Demand deposits 29,312,361 29,863,335 32,626,001 9.3% 11.3%Saving deposits 30,396,175 32,604,309 33,681,765 3.3% 10.8%Time deposits 30,186,076 32,472,216 33,194,331 2.2% 10.0%Severance indemnity deposits 6,923,829 7,609,448 7,205,449 -5.3% 4.1%Interest payable 556,970 607,736 684,174 12.6% 22.8%Deposits and obligations 97,375,411 103,157,044 107,391,720 4.1% 10.3%Due to banks and correspondents 7,509,183 9,222,278 8,624,286 -6.5% 14.8%BCRP instruments 4,851,806 6,304,186 4,144,908 -34.3% -14.6%Repurchase agreements 2,739,630 2,455,665 2,031,025 -17.3% -25.9%Bonds and notes issued 15,194,775 15,058,760 17,160,564 14.0% 12.9%Total funding 127,670,805 136,197,933 139,352,503 2.3% 9.1% 2.1. Funding Structure
Evolution of the funding structure and cost – BAP(S/ billions)
The graph depicting the evolution of Credicorp’s funding structure is calculated with quarter-end balances. The funding structure reflects:
(i) The on-going importance of deposits as the main source of funding, which imply lower costs than other alternatives in the mix, posted asignificant increase in their share of total funding both QoQ (+140 bps) and YoY (+80bps) to situate at a level of 77.1% (vs. 75.7% in Jun 19and 76.3% in Sep 18). Growth in deposits was due primarily to an increase in the volume of demand deposits and savings deposits.
(ii) The deposit mix continues to reflect significant shares for savings deposits and demand deposits, which grew QoQ and YoY. At the end of Sep
19 these deposits represented 61.7% of total deposits (vs. 60.6% in Jun 19 and 61.3% in Sep 18). Both types of deposits are considered lower-cost alternatives within the deposit mix. Also, it is important to note on-going growth in time deposits, which negatively impacted the fundingcost through volume and rate effects.
11

(iii) Within other sources of funding, the QoQ analysis reveals a contraction that was mainly associated with a decrease in the volume of BCRP
Instruments, which fell from 4.8% at the end of Jun 19 to 3.0% at the close of Sep 19, to post the lowest level reported since 2014. The drop involume was also due, albeit to a lesser extent, to a decrease in Due to banks and Correspondents (6.2% in Sep 19 vs. 6.8% in Jun 19) and inRepurchase agreements (1.5% in Sep 19 vs. 1.8% in Jun 19).
(iv) It is important to note the growth in Bonds and notes issued (14.0% QoQ and 12.9% YoY), which posted an increase in their share of other
sources of funding (53.7% in Sep 19 vs. 45.6% in Jun 19 and 50.2% in Sep 18). This evolution was attributable to a liability management ofcorporate bond issuances at BCP Stand-alone.
All of the aforementioned has allowed Credicorp to maintain a relatively stable cost of funding since 2015. 2.2. Deposits Deposits and obligations As of % change S/ 000 Sep 18 Jun 19 Sep 19 QoQ YoY Demand deposits 29,312,361 29,863,335 32,626,001 9.3% 11.3%Saving deposits 30,396,175 32,604,309 33,681,765 3.3% 10.8%Time deposits 30,186,076 32,472,216 33,194,331 2.2% 10.0%Severance indemnity deposits 6,923,829 7,609,448 7,205,449 -5.3% 4.1%Interest payable 556,970 607,736 684,174 12.6% 22.8%Deposits and obligations 97,375,411 103,157,044 107,391,720 4.1% 10.3% Deposits and obligations reported growth of 4.1% QoQ. The QoQ evolution of the deposit mix shows:
(i) An increase in demand deposits, which grew 9.3% QoQ due to an increase in the volume of interest-bearing and non-interest bearing demanddeposits (50% increase in each deposit type) at BCP Stand-alone. It is important to note that growth in non-interest bearing deposits was seenprimarily in LC (75% of the increase in LC) while growth in interest-bearing demand deposits is associated with FC (86% of the increase inFC).
(ii) Growth in savings deposits, mainly in LC, reflects the results of campaigns to capture savings, mainly through digital channels, which have
good acceptance and use levels among BCP Stand-alone’s clients. These high levels of acceptance are mainly attributable to the use of the Yapepayment application, which hit a level of a million and a half users in 3Q19.
(iii) The increase in the volume of time deposits at BCP Stand-alone, which was primarily attributable to an increase in the deposit balances of
Wholesale Banking clients in FC and to the evolution at BCP Bolivia, which rolled out a strategy to capture deposits that are more stable in themid-term.
The aforementioned was attenuated by the QoQ drop in:
(i) Severance indemnity deposits, due to seasonality, given that clients use the surplus available in their severance accounts (after the first yearlypayment is made in 2Q).
In YoY terms, total deposits and obligations reported growth in all types of deposits, which reflects an increase of 10.3% in the main source of funding.
12

2.2.1. Deposits: dollarization level
Dollarization Level of Deposits (1) – BAP
(1) Q-end balances.
Credicorp - Deposit Dollarization measured in quarter-end balances
The dollarization level of deposits at Credicorp fell slightly QoQ given that growth in LC volumes surpassed the expansion posted by FC volumes. Growth in volumes in both LC and FC was posted for all types of deposits with the exception of Severance indemnity deposits. The increase in the LCvolume was attributable primarily to demand deposits, particularly non-interest bearing deposits, and to a lesser extent to savings deposits. The increase in FCwas due to growth in the level of demand deposits, specifically interest-bearing deposits, and in time deposits. The YoY evolution followed a trend similar to that posted for the QoQ evolution; YoY, LC deposits grew 13.1% while FC deposits expanded 7.7%. Theaforementioned was attributable to the fact that all LC deposits posted growth, led by an increase in savings deposits and demand deposits. Deposits in FCgrew across deposit types with the exception of Severance indemnity deposits. These results are proof that we are on track in terms of our goal to maintain anasset and liability currency match that is aligned with Credicorp’s appetite.
13
2.2.2. Market share in Deposits
Market share in Peru
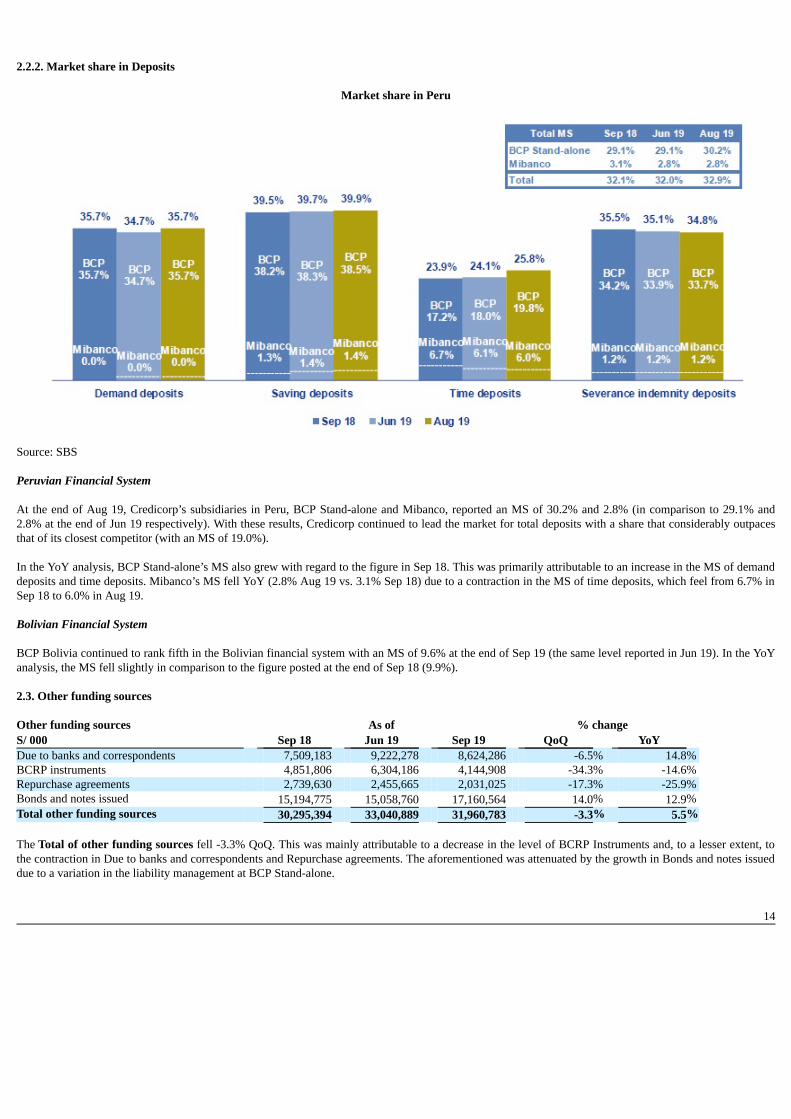
Source: SBS Peruvian Financial System At the end of Aug 19, Credicorp’s subsidiaries in Peru, BCP Stand-alone and Mibanco, reported an MS of 30.2% and 2.8% (in comparison to 29.1% and2.8% at the end of Jun 19 respectively). With these results, Credicorp continued to lead the market for total deposits with a share that considerably outpacesthat of its closest competitor (with an MS of 19.0%). In the YoY analysis, BCP Stand-alone’s MS also grew with regard to the figure in Sep 18. This was primarily attributable to an increase in the MS of demanddeposits and time deposits. Mibanco’s MS fell YoY (2.8% Aug 19 vs. 3.1% Sep 18) due to a contraction in the MS of time deposits, which feel from 6.7% inSep 18 to 6.0% in Aug 19. Bolivian Financial System BCP Bolivia continued to rank fifth in the Bolivian financial system with an MS of 9.6% at the end of Sep 19 (the same level reported in Jun 19). In the YoYanalysis, the MS fell slightly in comparison to the figure posted at the end of Sep 18 (9.9%). 2.3. Other funding sources Other funding sources As of % change S/ 000 Sep 18 Jun 19 Sep 19 QoQ YoY Due to banks and correspondents 7,509,183 9,222,278 8,624,286 -6.5% 14.8%BCRP instruments 4,851,806 6,304,186 4,144,908 -34.3% -14.6%Repurchase agreements 2,739,630 2,455,665 2,031,025 -17.3% -25.9%Bonds and notes issued 15,194,775 15,058,760 17,160,564 14.0% 12.9%Total other funding sources 30,295,394 33,040,889 31,960,783 -3.3% 5.5% The Total of other funding sources fell -3.3% QoQ. This was mainly attributable to a decrease in the level of BCRP Instruments and, to a lesser extent, tothe contraction in Due to banks and correspondents and Repurchase agreements. The aforementioned was attenuated by the growth in Bonds and notes issueddue to a variation in the liability management at BCP Stand-alone.
14

Due to banks and correspondents, which contracted due to: (i) a drop in the level of debt held with foreign financial institutions after some of BCP Stand-alone’s obligations came due in the month of August for a total of $300 million and (ii) a drop in the exchange rate. In the case of BCRP Instruments, the QoQ decline was attributable to a drop in the level of regular repos with BCRP, which expired. These instrumentsdropped at both BCP Stand-alone and Mibanco. Repurchase agreements fell QoQ after repos and Certificates of Deposit (CD) expired. The majority of these expirations were registered in LC through BCPStand-alone and in FC through ASB. Bonds and notes issued were the only funding source that posted growth QoQ. This increase was attributable to the liability management of corporate bondsat BCP Stand-alone. Growth in LC was attributable to restructuring operations to convert a S/2,000 million issuance with an expiration date in 2020 and acoupon rate of 4.85% into a new issuance composed of a repurchase of S/1,600 million plus “New Money” for S/900 million with a new expiration date inSeptember 2024 and a coupon rate of 4.60%. In the case of FC, an issuance of $700 million with an expiration date in 2020 and a coupon rate of 5.375% intoa new issuance composed of a repurchase of $425 million plus “New Money” for $275 million with a new expiration date in January 2025 and a coupon rateof 2.70%. In the YoY evolution, other funding sources posted growth of 5.5%. This was attributable to an increase in the level of Bonds and notes issued and Due tobanks and correspondents, mainly at BCP Stand-alone and in both currencies. 2.4. Loan / Deposit (L/D)
Loan / Deposit Ratio by Subsidiary
The L/D ratio at Credicorp fell QoQ, situating at 104.5%. This was attributable to the fact that growth in deposits (+4.1%) outpaced the increase registered byloans (+2.6%). In the analysis by subsidiary reveals the same trend at BCP Stand-alone (105.9% Sep 19 vs. 107.5% Jun 19). The QoQ drop in the L/D at BCP Stand-alonetook place in a scenario in which growth in the deposit volume (+4.2%) was greater than the expansion registered for loans (+2.6%). On the deposit side, theincrease was driven by an expansion in the level of demand deposits and savings deposits. In the case of Mibanco, QoQ growth in the L/D was attributable tothe fact that loan growth (+0.9%) outpaced the expansion in deposits (0.4%). In the YoY analysis, the L/D for Credicorp and its subsidiaries mirrors the dynamism seen in the QoQ analysis. At the Credicorp level, on-going growth indeposits outpaces the expansion registered for loans (10.3% vs. 6.8%, respectively).
15

Loan / Deposit Ratio by Currency
Local Currency Foreign Currency
In the QoQ analysis by currency, the L/D ratio in LC at Credicorp remained stable given that the increase in deposits and loans was proportional. The L/D inFC at Credicorp fell QoQ in a scenario in which growth in deposits (+7.7%) outpaced the expansion registered for loans (+2.6%). The aforementioned wasdriven by growth in FC deposits (+4.2%) and by a contraction in FC loans (-0.9%) at BCP Stand-alone. In the YoY analysis, Credicorp reported a drop in the L/D ratio for LC and FC. This was primarily driven by the fact that the level of deposits in bothcurrencies grew at a faster rate than the expansion registered for loans. 2.5. Funding Cost
Funding Cost – Credicorp (1)
(1) The funding cost by currency is calculated with the average of period-beginning and period-end balances.
Credicorp’s funding cost increased QoQ and YoY. The QoQ evolution shows:
(i) Growth in the funding cost in LC (+31 bps), was mainly attributable to an increase in interest expenses on bonds and notes issued, whichrepresents 92% of the increase in LC expenses. Expansion in this line was associated with the liability management of bonds at BCP Stand-alone. Excluding the liability management one-off effects, funding cost in LC is 2.61%.
(ii) The slight increase in the total funding cost (+1 bps), was primarily due to an increase in expenses for bonds and notes issued, which accounted
for 45% of the increase in expenses, and for deposits, which accounted 40% of the increase.
In the case of deposits, the increase was attributable to the volume effect and deposit mix given that interest-bearing demand deposits and timedeposits represent 46% of the growth in total deposits. The aforementioned was partially attenuated by the increase in non-interest bearingdeposits and savings deposits, which grew 5.4% and 3.3% respectively. These last two deposits are the lowest cost alternatives in the fundingmix. In this context, the ratio remained relatively stable.
16

(iii) The reduction registered in the funding cost in FC (-26 bps) was primarily attributable to a decrease in interest expenses on bonds and notes after
the rate for the liability management bonds at BCP Stand-alone dropped (going from 5.375% to 2.70%), which offset the volume effect.Excluding liability management one-off effects, funding cost in FC is 2.30%.
In the YoY analysis, growth in the funding cost was attributable to:
(i) The volume effect and mix, where time deposits increased 10% to represent 30% of the growth in the deposit volume. Consequently, time
deposits registered an increase in their share of the funding mix. It is important to note that 73% of the increase in interest expenses on depositswas attributable to LC funding. The variation in funding in local currency was attributable to growth in the volumes of all deposit types in LC;time deposits represented 23% of growth.
(ii) The 14.3% increase in other interest expenses due to the application of IFRS 16, which stipulates that expenses for leasing must be included in
interest expenses.
(iii) A higher volume of Bonds and notes issued in LC following the liability management of bonds at BCP Stand-alone, which occurred despite arate drop (going from 4.85% to 4.65%). The aforementioned was attenuated by a reduction in interest expenses in FC after international interestrates dropped; this helped mitigate the impact.
The funding cost by subsidiary is shown in the figure below:
Funding Cost by subsidiary– Credicorp
(i) The funding cost at BCP Stand-alone followed the same trend seen with Credicorp’s funding cost, where growth both QoQ and YoY was
primarily associated with an increase in the volumes of time deposits and bonds and notes issued.
(ii) The funding cost at Mibanco reported growth QoQ and YoY, which reflected efforts to roll out a strategy to capture more retail funding byoffering competitive rates. In the QoQ analysis, the increase posted in the ratio, which occurred despite a drop in interest expenses (-5.8%), wasattributable to a contraction in total funding (-13.9%). YoY, interest expenses increased 3.1% due to an increase in rates while total fundingcontracted -11.1% after a drop was registered in debt obligations.
(iii) The funding cost at BCP Bolivia increased QoQ and YoY. This was primarily attributable to an increase in interest expenses (3.8% and 10.4%
respectively) on deposits; the volume and mix effect (where time deposits posted the highest growth); and other interest expenses (leasing).
17
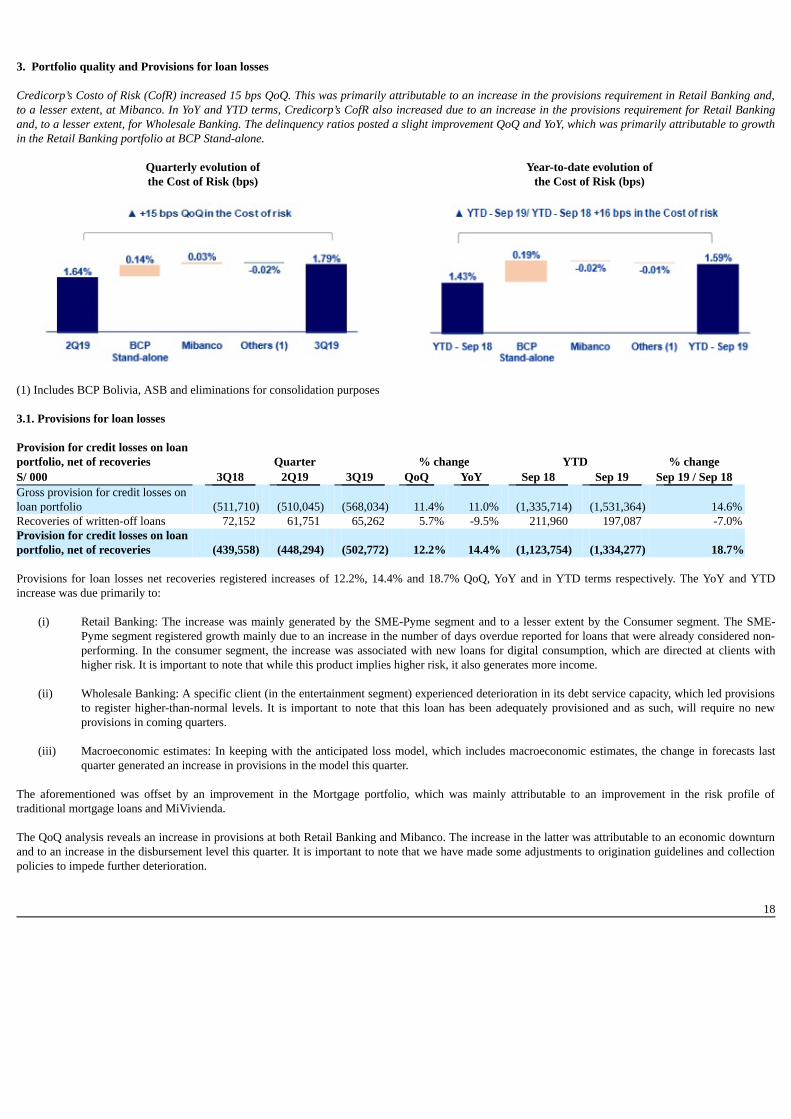
3. Portfolio quality and Provisions for loan losses Credicorp’s Costo of Risk (CofR) increased 15 bps QoQ. This was primarily attributable to an increase in the provisions requirement in Retail Banking and,to a lesser extent, at Mibanco. In YoY and YTD terms, Credicorp’s CofR also increased due to an increase in the provisions requirement for Retail Bankingand, to a lesser extent, for Wholesale Banking. The delinquency ratios posted a slight improvement QoQ and YoY, which was primarily attributable to growthin the Retail Banking portfolio at BCP Stand-alone.
Quarterly evolution of Year-to-date evolution ofthe Cost of Risk (bps) the Cost of Risk (bps)
(1) Includes BCP Bolivia, ASB and eliminations for consolidation purposes 3.1. Provisions for loan losses Provision for credit losses on loanportfolio, net of recoveries Quarter % change YTD % change S/ 000 3Q18 2Q19 3Q19 QoQ YoY Sep 18 Sep 19 Sep 19 / Sep 18 Gross provision for credit losses onloan portfolio (511,710) (510,045) (568,034) 11.4% 11.0% (1,335,714) (1,531,364) 14.6%Recoveries of written-off loans 72,152 61,751 65,262 5.7% -9.5% 211,960 197,087 -7.0%Provision for credit losses on loanportfolio, net of recoveries (439,558) (448,294) (502,772) 12.2% 14.4% (1,123,754) (1,334,277) 18.7% Provisions for loan losses net recoveries registered increases of 12.2%, 14.4% and 18.7% QoQ, YoY and in YTD terms respectively. The YoY and YTDincrease was due primarily to:
(i) Retail Banking: The increase was mainly generated by the SME-Pyme segment and to a lesser extent by the Consumer segment. The SME-
Pyme segment registered growth mainly due to an increase in the number of days overdue reported for loans that were already considered non-performing. In the consumer segment, the increase was associated with new loans for digital consumption, which are directed at clients withhigher risk. It is important to note that while this product implies higher risk, it also generates more income.
(ii) Wholesale Banking: A specific client (in the entertainment segment) experienced deterioration in its debt service capacity, which led provisions
to register higher-than-normal levels. It is important to note that this loan has been adequately provisioned and as such, will require no newprovisions in coming quarters.
(iii) Macroeconomic estimates: In keeping with the anticipated loss model, which includes macroeconomic estimates, the change in forecasts last
quarter generated an increase in provisions in the model this quarter.
The aforementioned was offset by an improvement in the Mortgage portfolio, which was mainly attributable to an improvement in the risk profile oftraditional mortgage loans and MiVivienda.
The QoQ analysis reveals an increase in provisions at both Retail Banking and Mibanco. The increase in the latter was attributable to an economic downturnand to an increase in the disbursement level this quarter. It is important to note that we have made some adjustments to origination guidelines and collectionpolicies to impede further deterioration.
18

Cost of risk Quarter % change YTD % change Cost of risk and Provisions 3Q18 2Q19 3Q19 QoQ YoY Sep 18 Sep 19 Sep 19 / Sep 18 Cost of risk (1) 1.67% 1.64% 1.79% 15 bps 12 bps 1.43% 1.59% 16 bps Provision for credit losses on loanportfolio, net of recoveries / Net interestincome 20.5% 19.9% 22.1% 230 bps 150 bps 18.0% 19.8% 100 bps (1) Annualized Provision for credit losses on loan portfolio, net of recoveries / Total loans. In this context, the CofR at Credicorp deteriorated QoQ, YoY and YTD terms given that growth in provisions outpaced that of loans. 3.2. Portfolio Quality: Delinquency ratios Portfolio quality and Delinquency ratios As of % change S/ 000 Sep 18 Jun 19 Sep 19 QoQ YoY Total loans (Quarter-end balance) 105,028,343 109,381,123 112,209,990 2.6% 6.8%Allowance for loan losses 4,920,319 4,878,150 4,977,809 2.0% 1.2%Write-offs 366,709 407,348 456,932 12.2% 24.6%Internal overdue loans (IOLs) (1) 3,188,393 3,285,279 3,346,389 1.9% 5.0%Internal overdue loans over 90-days (1) 2,399,945 2,423,771 2,539,751 4.8% 5.8%Refinanced loans 1,172,338 1,212,669 1,225,691 1.1% 4.6%Non-performing loans (NPLs) (2) 4,360,731 4,497,948 4,572,080 1.6% 4.8%IOL ratio 3.04% 3.00% 2.98% -2 bps -6 bps IOL over 90-days ratio (3) 2.29% 2.22% 2.26% 4 bps -3 bps NPL ratio 4.15% 4.11% 4.07% -4 bps -8 bps Coverage ratio of IOLs 154.3% 148.5% 148.8% 30 bps -550 bps Coverage ratio of IOL 90-days 205.0% 201.3% 196.0% -530 bps -900 bps Coverage ratio of NPLs 112.8% 108.5% 108.9% 40 bps -390 bps (1) Includes overdue loans and loans under legal collection. (Quarter-end balances)(2) Non-performing loans include internal overdue loans and refinanced loans. (Quarter-end balances)(3) Figures differ from previously reported, please consider the data presented in this report. When examining the portfolio’s delinquency ratios, it is important to note that:
(i) The total IOL Portfolio reported slight growth QoQ and YoY, in line with the portfolio’s evolution. The IOL over 90 days portfolio increased4.8% QoQ. This growth was mainly attributable to the Consumer segment and SME-Pyme segment, in line with the increase in provisionsoutlined in section 3.1. Provisions for Loan Losses.
(ii) The NPL portfolio increase 1.6% QoQ and 4.8% YoY. This was primarily driven by growth in the IOL portfolio.
Consequently, the delinquency ratios registered an improvement, which was driven by a context in which both the IOL portfolio and the NPL portfolio postedlower growth than gross loans. It is important to note that a portion of the reduction in these ratios is attributable to the sale of approximately S/60 million ofunder legal collection loans this quarter. These loans could not be written off because real guarantees were in place. The coverage ratios improved QoQ given that growth in provisions for loan losses outpaced the expansion registered for the IOL portfolio and refinancedbalances. Nevertheless, in the YoY analysis, the coverage ratios deteriorated due to an increase in charge-offs since the first quarter of the year. Prior to analyzing the evolution of delinquency indicators, it is important to remember that:
(i) Traditional delinquency ratios (IOL and NPL ratios) continue to be distorted by the presence of loans with real estate collateral (commercial andresidential properties). This means that a significant portion of loans that are more than 150 days past due cannot be written-off (despite the factthat provisions have been set aside) given that a judicial process must be initiated to liquidate the collateral, which takes five years on average.
19
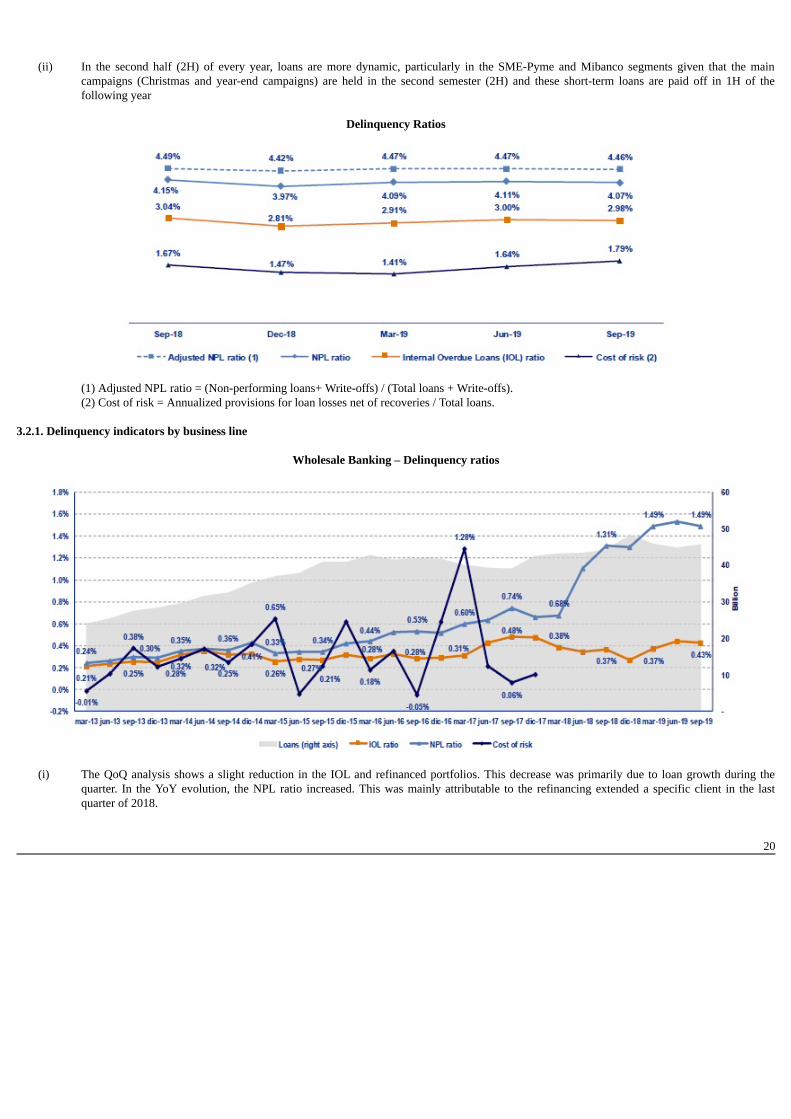
(ii) In the second half (2H) of every year, loans are more dynamic, particularly in the SME-Pyme and Mibanco segments given that the main
campaigns (Christmas and year-end campaigns) are held in the second semester (2H) and these short-term loans are paid off in 1H of thefollowing year
Delinquency Ratios
(1) Adjusted NPL ratio = (Non-performing loans+ Write-offs) / (Total loans + Write-offs).(2) Cost of risk = Annualized provisions for loan losses net of recoveries / Total loans.
3.2.1. Delinquency indicators by business line
Wholesale Banking – Delinquency ratios
(i) The QoQ analysis shows a slight reduction in the IOL and refinanced portfolios. This decrease was primarily due to loan growth during the
quarter. In the YoY evolution, the NPL ratio increased. This was mainly attributable to the refinancing extended a specific client in the lastquarter of 2018.
20

SME-Business – Delinquency ratios
(ii) The IOL and NPL ratios posted increases both QoQ and YoY. This was mainly attributable to the deterioration of the debt service capacity of a
small number of clients. These loans have been fully provisioned and are backed by guarantees. It is important to note that this segment’s riskquality indicators are within the appetite for risk that has been set where the objective is to maximize the portfolio’s profitability by striking anadequate balance between risk quality and growth.
SME - Pyme – Delinquency ratios
(iii) In the SME-Pyme loan book, it is important to analyze the early delinquency ratio, which excludes loans that are overdue less than 60 days
(volatile loans whose percentage of recovery is very high) and those overdue more than 150 days (loans that have been provisioned but whichcannot be written off due to the existence of real estate collateral- commercial properties - that take five years on average to liquidate).
In 3Q19, the IOL and NPL ratios posted a slight improvement QoQ and YoY, mainly due to the sale of a portion of the under legal collectionloans this quarter. The early delinquency ratio registered a slight improvement QoQ of 13 bps but reported a deterioration of 27 bps YoY. Thisdeterioration was attributable to an increase in the number of clients whose loans are more than 60 days past due, which triggered an increase inprovisions.
21
It is important to note that since 2017, this segment has situated comfortably within the risk appetite levels set for the segment, where theobjective is to maximize the portfolio’s profitability while striking an adequate balance between risk quality and portfolio growth that is inaccordance with the organization’s risk framework.
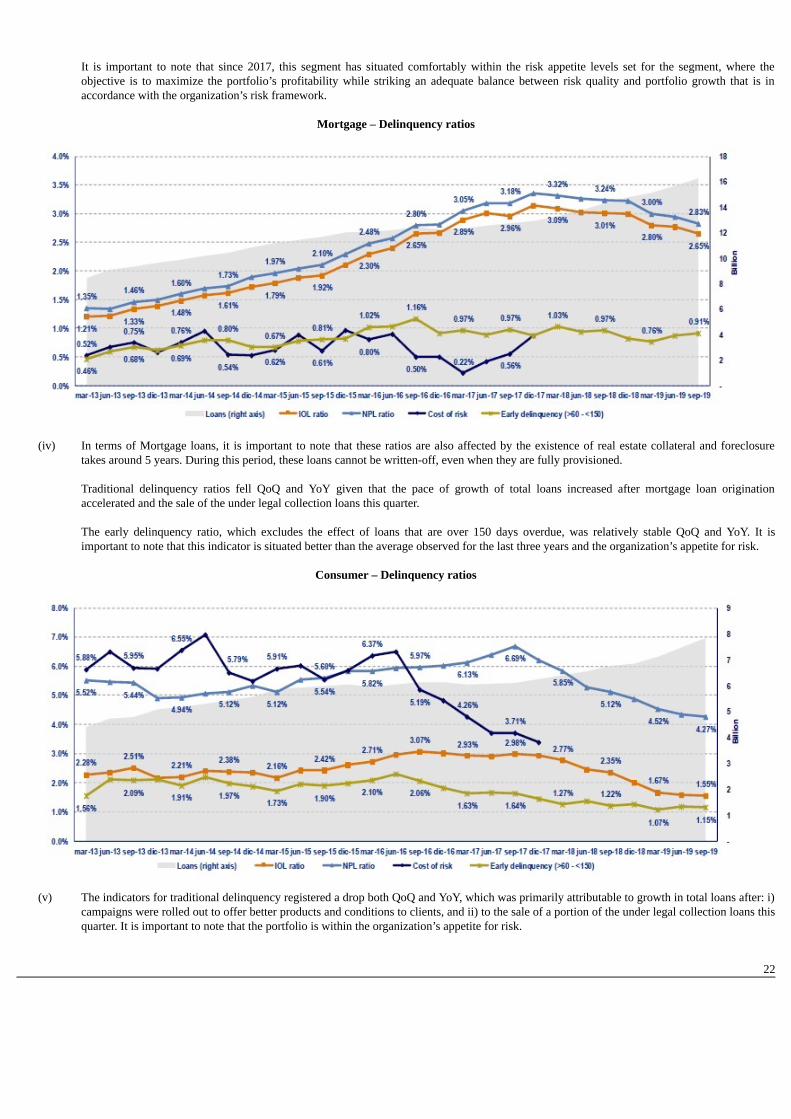
Mortgage – Delinquency ratios
(iv) In terms of Mortgage loans, it is important to note that these ratios are also affected by the existence of real estate collateral and foreclosure
takes around 5 years. During this period, these loans cannot be written-off, even when they are fully provisioned.
Traditional delinquency ratios fell QoQ and YoY given that the pace of growth of total loans increased after mortgage loan originationaccelerated and the sale of the under legal collection loans this quarter.
The early delinquency ratio, which excludes the effect of loans that are over 150 days overdue, was relatively stable QoQ and YoY. It isimportant to note that this indicator is situated better than the average observed for the last three years and the organization’s appetite for risk.
Consumer – Delinquency ratios
(v) The indicators for traditional delinquency registered a drop both QoQ and YoY, which was primarily attributable to growth in total loans after: i)
campaigns were rolled out to offer better products and conditions to clients, and ii) to the sale of a portion of the under legal collection loans thisquarter. It is important to note that the portfolio is within the organization’s appetite for risk.
22

Our traditional delinquency and early delinquency levels are both at the lowest levels that we have seen in the last five years, which speaks wellof our risk management and collections initiatives.
Delinquency ratios have improved; nonetheless, the consumer segment has registered an increase in provisions. This was due, in part, to thehigher risk assumed when generating digital sales. These products may imply greater risk, but the upside is that they are accompanied by higherincome.
Credit Card – Delinquency ratios
(vi) The Credit Card segment registered a decline in its traditional delinquency ratios QoQ. This was primarily due to the sale of the under legalcollection loans this quarter and to the effect of statutory bonus payments to dependent employees in July, which prompted some clients to paycredit card debts. The early delinquency ratio posted a drop given that growth in total loans was greater than the expansion posted by loansoverdue by 60 and 150 days.
In the YoY analysis, the traditional delinquency ratios also improved. This was mainly due to growth in total loans and to the sale of a portion ofthe portfolio. Nevertheless, early delinquency rose, driven primarily by an increase in loans that are more than 90 days overdue.
Mibanco – Delinquency ratios
23

(vii) The IOL ratio improved slightly QoQ and YoY due to the decrease of the write-offs. The NPL portfolio posted and improvement both QoQ and
YoY due to initiatives to optimize new loan acceptance, which has help cut the number of refinanced loans.
The cost of risk deteriorated QoQ due to the effect of macroeconomic estimates, as indicated in section 3.1. Provisions for Loan Losses, and tothe increase in new disbursements. In the YoY analysis, the probability of improved.
BCP Bolivia – Delinquency ratios
(viii) BCP Bolivia reported deterioration QoQ and YoY in its traditional delinquency ratios. This result was primarily attributable to Retail Banking
and is aligned with the evolution posted by the financial system in general in Bolivia. Nonetheless, it is important to note that BCP Bolivia hasone of the lowest delinquency ratios in the system.
In terms of the cost of risk, it presented an improvement QoQ and YoY due to the decrease in over-due days of some clients that already thatalready presented deteriorated loans, which represents a reduction in the probability of default in the expected loss model.
24

4. Net Interest Income (NII) In 3Q19, NII, Credicorp’s main source of income, increased +0.9% QoQ and +6.5% YoY while average interest earning assets rose +2.4% QoQ and +8.9%YoY. The aforementioned led NIM to deteriorate -8 bps QoQ and - 13bps YoY. YTD, NII increased +7.7%, which translated into an increase of +6bps in NIM.These results were attributable to an improvement in the evolution this year versus last. Nevertheless, due to the increase in the cost of risk, risk-adjusted NIMcontracted -18bps QoQ, -18bps YoY and -5bps YTD. Net interest income Quarter % change YTD % change
S/ 000 3Q18 2Q19 3Q19 QoQ YoY Sep 18 Sep 19 Sep 19 /Sep 18
Interest income 2,887,326 3,083,623 3,123,672 1.3% 8.2% 8,489,090 9,208,969 8.5%Interest on loans 2,538,591 2,632,649 2,701,117 2.6% 6.4% 7,415,916 7,896,052 6.5%Dividends on investments 2,893 8,914 2,915 -67.3% 0.8% 18,186 21,496 18.2%Interest on deposits with banks 36,448 85,477 79,723 -6.7% 118.7% 95,672 251,899 163.3%Interest on securities 304,528 341,930 325,311 -4.9% 6.8% 925,591 1,000,029 8.0%Other interest income 4,866 14,653 14,606 -0.3% 200.2% 33,725 39,493 17.1%
Interest expense 748,193 826,866 846,288 2.3% 13.1% 2,244,238 2,485,910 10.8%Interest on deposits 293,512 364,997 372,822 2.1% 27.0% 877,403 1,091,653 24.4%Interest on borrowed funds 148,565 152,832 151,221 -1.1% 1.8% 465,796 449,356 -3.5%Interest on bonds and subordinated notes 231,129 227,869 236,567 3.8% 2.4% 677,773 690,934 1.9%Other interest expense (1) 74,987 81,168 85,678 5.6% 14.3% 223,266 253,967 13.8%
Net interest income (1) 2,139,133 2,256,757 2,277,384 0.9% 6.5% 6,244,852 6,723,059 7.7%Risk-adjusted Net interest income (1) 1,699,575 1,808,463 1,774,612 -1.9% 4.4% 5,121,098 5,388,782 5.2%Average interest earning assets 154,824,731 164,668,086 168,631,427 2.4% 8.9% 156,895,533 166,952,088 6.4%Net interest margin (1)(2) 5.53% 5.48% 5.40% -8bps -13bps 5.31% 5.37% 6bpsNIM on loans (1)(2) 7.84% 7.66% 7.74% 8bps -10bps 7.72% 7.46% -26bpsRisk-adjusted Net interest margin (1)(2) 4.39% 4.39% 4.21% -18bps -18bps 4.35% 4.30% -5bpsNet provisions for loan losses / Net interest income (1)(2) 20.55% 19.86% 22.08% 222bps 153bps 17.99% 19.85% 186bps
(1) Figures differ from previously reported, please consider the data presented on this report.(2) Annualized. 4.1. Interest Income
Interest Income - LC Interest Income – FC(S/ millions) (S/ millions)
In the QoQ analysis, the increase of +1.3% in Interest Income was due primarily to growth in interest income on loans, which was in turn attributable to:
(i) Slight acceleration in the growth of average daily loan balances (+2.1% QoQ), which was led by Retail Banking. (ii) The mix by segment given that although Wholesale Banking continues to represent the highest share of total loans with 41.6%, Retail Banking
has increased its share of total loans, going from 40.0% in 2Q19 to 40.5% in 3Q19. Additionally, although mortgage loans continue to leadgrowth in volumes, segments with higher margins, such as consumer and SME-Pyme, have also registered significant increases.
25
(iii) The currency mix given that a larger portion of loan expansion was generated by LC products, which offer better margins than their FC
counterparts. The effect of the currency mix also favored growth in interest income on loans.
In the YoY analysis, interest income expanded +8.2%, which represented a slower pace of growth than that registered in 2Q19. Growth in net interest incomewas mainly attributable to an increase in interest income from loans (+6.4%). YTD, interest income rose +8.5%, which was due primarily to an increase in income from interest on loans, which was in turn attributable to:
(i) The volume effect due to an uptick in the growth of average daily balances in all segments with the exception of ASB, which translates into totalloan growth of +7.1%. This increase was driven mainly by Retail Banking, which registered a +12.3% increase in average daily loan balancesYoY.
(ii) The mix by segment as Retail Banking represented 40.5% of total loans versus 38.7% in 3Q18. (iii) The currency mix was also favorable, given that the expansions reported in average daily balances was mainly attributable to growth in the LC
portfolio of +15.9% YoY.
To a lesser extent, interest income increased due to:
(i) Growth in interest on deposits in other banks, which reflects an increase in the volume of BCRP funds. It is important to note that the majority offunds held in BCRP are in FC because the reserve requirement for FC is significantly higher than that required for LC.
(ii) The increase in interest on securities, which corresponds to growth of 13.9% YoY in the fair value through other comprehensive income
investments portfolio. Portfolio growth at the Credicorp level was attributable to expansion in the portfolios of BCP Stand-alone and Pacifico,which grew 28% and 16% respectively.
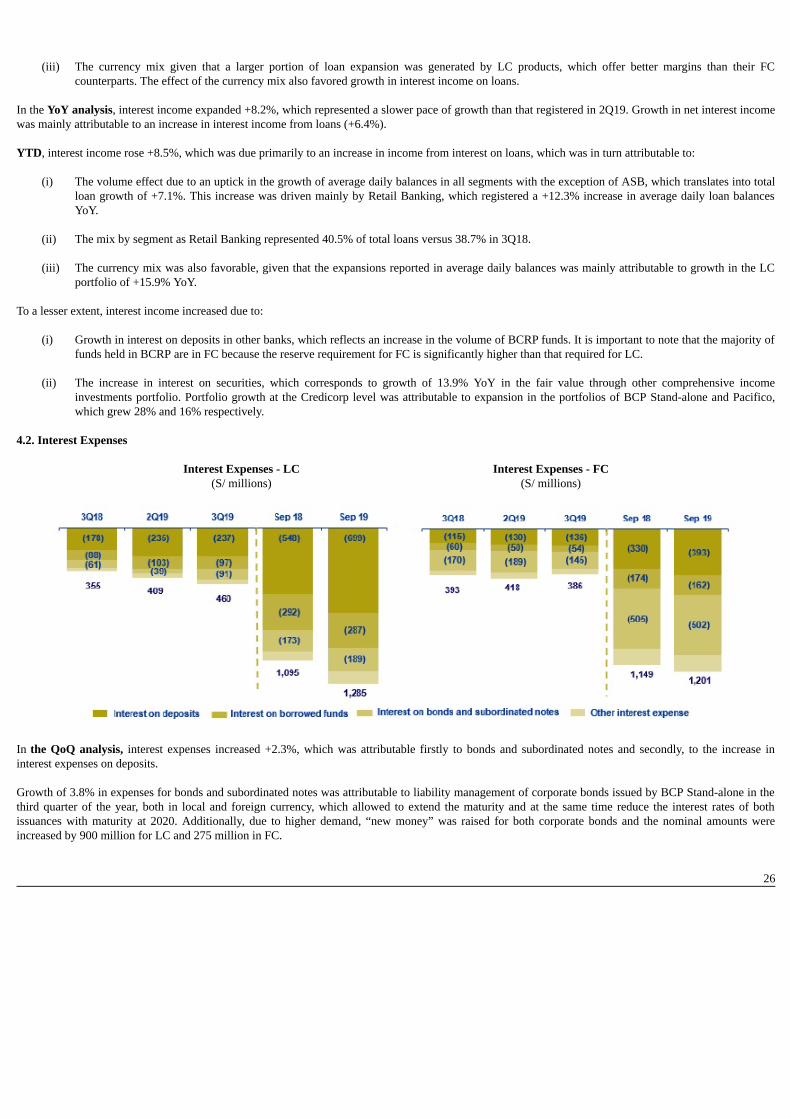
4.2. Interest Expenses
Interest Expenses - LC Interest Expenses - FC(S/ millions) (S/ millions)
In the QoQ analysis, interest expenses increased +2.3%, which was attributable firstly to bonds and subordinated notes and secondly, to the increase ininterest expenses on deposits. Growth of 3.8% in expenses for bonds and subordinated notes was attributable to liability management of corporate bonds issued by BCP Stand-alone in thethird quarter of the year, both in local and foreign currency, which allowed to extend the maturity and at the same time reduce the interest rates of bothissuances with maturity at 2020. Additionally, due to higher demand, “new money” was raised for both corporate bonds and the nominal amounts wereincreased by 900 million for LC and 275 million in FC.
26
The factors that explain the 2.1% increase in interest expenses on deposits QoQ are:
(i) The volume effect given that the total deposit balance grew 4.1% QoQ.
(ii) The deposit mix given that the corresponding increase was mainly due to growth in balances for interest-bearing deposits, specifically savingsdeposits (+3.3%) and time deposits (+2.2%).
(iii) The effect of the currency mix given that the increase in the deposit volume was generated by LC deposits, which pay higher rates than FCdeposits.
In the YoY analysis, interest expenses grew +13.1%. Growth in this component was mainly driven by the +27% YoY expansion registered for interestexpenses on deposits. YTD, interest expenses grew +10.8%. This growth was primarily attributable to the +24.4% expansion in interest income on deposits, which was in turn dueto:
(i) The volume effect given that all deposit types increased YoY.
(ii) The effect of the deposit mix given that the deposits that posted the highest increases in volume were savings deposits (+10.8%) followed by time
deposits (+10%). (iii) The currency mix effect given that the increase in the deposit volume was generated by LC deposits.
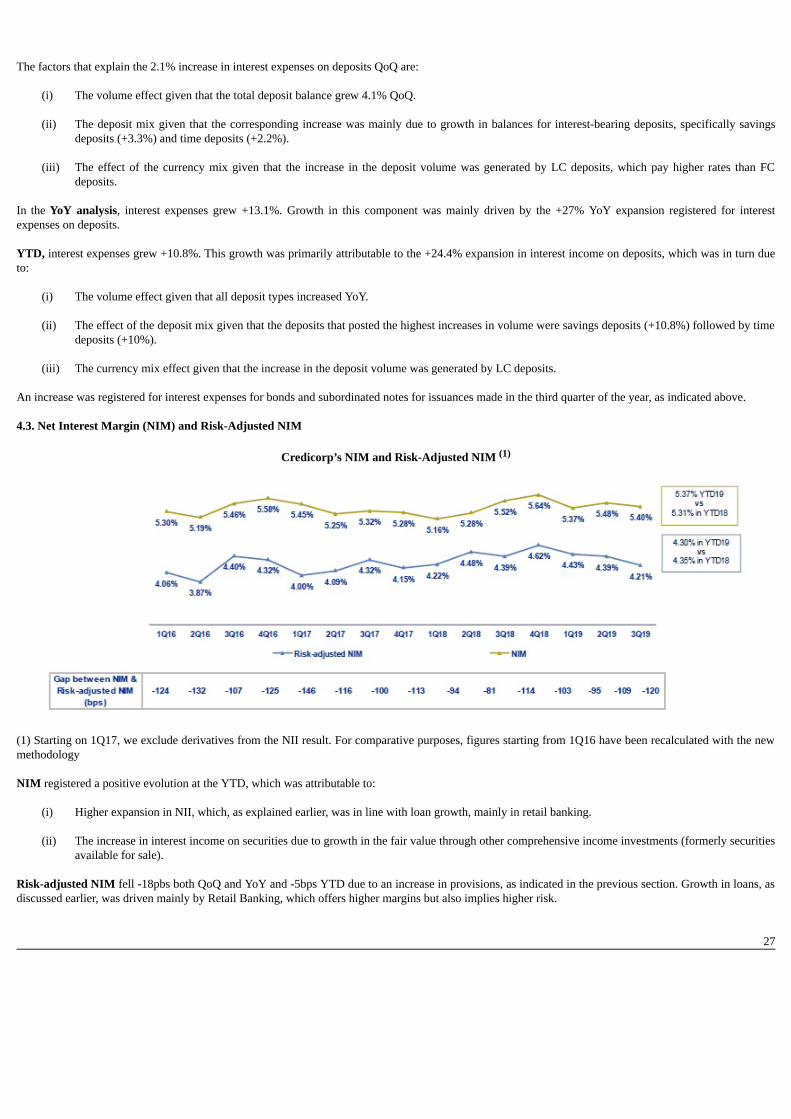
An increase was registered for interest expenses for bonds and subordinated notes for issuances made in the third quarter of the year, as indicated above. 4.3. Net Interest Margin (NIM) and Risk-Adjusted NIM
Credicorp’s NIM and Risk-Adjusted NIM (1)
(1) Starting on 1Q17, we exclude derivatives from the NII result. For comparative purposes, figures starting from 1Q16 have been recalculated with the newmethodology NIM registered a positive evolution at the YTD, which was attributable to:
(i) Higher expansion in NII, which, as explained earlier, was in line with loan growth, mainly in retail banking. (ii) The increase in interest income on securities due to growth in the fair value through other comprehensive income investments (formerly securities
available for sale). Risk-adjusted NIM fell -18pbs both QoQ and YoY and -5bps YTD due to an increase in provisions, as indicated in the previous section. Growth in loans, asdiscussed earlier, was driven mainly by Retail Banking, which offers higher margins but also implies higher risk.
27

NIM on loans deteriorated YoY (-10 bps) and at the YTD (-26 bps) in acontext of low market rates. The drop-in rates has hit the WholesaleBanking segments at BCP Stand-alone which are more sensitive tomovements in interest rates-hardest but have also affected, albeit to a lesserextent, Retail Banking and Mibanco.
It is also important to analyze the NIM by subsidiary. The table below shows the interest margins for each of Credicorp’s main subsidiaries.
NIM Breakdown BCP
Stand-alone (1) Mibanco BCP
Bolivia (1) Credicorp(1)(2) 3Q18 4.83% 15.92% 3.93% 5.53%2Q19 4.86% 14.89% 3.66% 5.48%3Q19 4.83% 15.16% 3.72% 5.40%YTD - Sep 18 4.56% 16.01% 3.66% 5.31%YTD - Sep 19 4.75% 14.85% 3.59% 5.37% NIM: Annualized Net interest income / Average period end and period beginning interest earning assets.(1) Figures differ from previously reported, please consider the data presented on this report.(2) Credicorp also includes Credicorp Capital, Prima, Grupo Credito and Eliminations for consolidation purposes. In the YTD evolution at Credicorp, we see a slight recovery that corresponds to an improvement in NIM at BCP Individual, which represents around 69%of net interest income. This increase offset the deterioration in NIM at BCP Bolivia and Mibanco. The improvement in the margin is in line with loan growthin higher-margin segments, specifically Retail Banking loans. Mibanco, which represents around 21% of net interest income, posted a noteworthy QoQ recovery in NIM, which was attributable to an improvement inasset and liabilities management that allowed to obtain cheaper funding (deposits). Nevertheless, YoY and at the YTD, Mibanco’s NIM deteriorated. This wasprimarily attributable to a drop in LC rates in a highly competitive environment, which negatively affected interest income generation.
(3) NIM on loans is calculated as follows:
The share of loans within total earning assets is calculated by dividing the average of the beginning and closing balances of total loans for the reportingperiod, by the average of the beginning and closing balances of the interest earning assets for the reporting period.
28

5. Non-Financial Income In 3Q19, non-financial income registered growth QoQ, YoY and Year-to-date (YTD). This increase was due primarily to growth in the Net gain on securities,which posted an increase in its share of non-financial income, which situated at 11.8% (vs 8.5% in 2Q19 and 4.6% in 3Q18). The aforementioned wasattributable to an improvement in the evolution of business at BCP Stand-alone with regard to sales and revaluation of its investments. Fee income, the mainsource of non-financial income, posted an improvement in results, in line with an uptick in transactional activity at BCP Stand-alone. Non-financial income Quarter % change YTD % change S/ 000 3Q18 2Q19 3Q19 QoQ YoY Sep 18 Sep 19 Sep 19 /Sep 18 Fee income 773,529 787,250 815,403 3.6% 5.4% 2,290,215 2,385,575 4.2%Net gain on foreign exchange transactions 182,777 188,358 188,073 -0.2% 2.9% 525,741 554,854 5.5%Net gain on securities (1) 50,192 100,987 150,427 49.0% 199.7% 123,436 364,959 195.7%Net gain from associates (1) (2) 15,698 20,478 21,842 6.7% 39.1% 53,410 57,106 6.9%Net gain on derivatives held for trading 674 (724) 2,158 398.1% 220.2% 14,959 (1,000) -106.7%Net gain from exchange differences 8,834 (3,603) (1,964) 45.5% -122.2% 15,754 2,093 -86.7%Other non-financial income 67,174 98,703 94,647 -4.1% 40.9% 234,060 268,955 14.9%Total non-financial income, net 1,098,878 1,191,449 1,270,586 6.6% 15.6% 3,257,575 3,632,542 11.5% (1) The gain from other investments in related companies has been included in the item "Net gain from associates"; which previously was presented in theitem "Net gain on sales of securities".(2) Includes gains on other investments, mainly made up of the profit of Banmedica. Quarter % change YTD % change (S/ millions ) 3Q18 2Q19 3Q19 QoQ YoY Sep 18 Sep 19 Sep 19 / Sep 18 (+) EPS contribution (50%) 10,686 12,758 14,720 15.4% 37.8% 37,223 36,396 -2.2%(-) Private health insurance deduction (50%) (5,711) (4,746) (5,350) 12.7% -6.3% (14,355) (12,832) -10.6%(=) Net gain from association with Banmedica 4,974 8,012 9,380 17.1% 88.6% 22,867 23,574 3.1% The QoQ evolution shows expansion of 6.6% in non-financial income due to:
(i) An increase in the Net gain on securities due to the sale and fluctuation in the mark to market of securities at BCP Stand-alone. The increaseregistered for the sale of securities was attributable to gains in the Trading portfolio following the sale of Peruvian government bonds, while thefluctuation in securities was due to gains associated with bonds from the governments of Peru, Mexico and Colombia.
(ii) Growth in Fee Income, mainly at BCP Stand-alone, in line with the increase seen in the transactional level every second half of the year and, to a
lesser extent, due to growth in fee income from corporate finance and brokerage. All of the aforementioned was offset by:
(i) A contraction in Other non-financial income due to an increase in gains reported in 2Q19 for the sale of real estate at BCP Bolivia. The YoY analysis reveals a significant increase in non-financial income of 15.6% due to: (i) Growth in the Net gain on securities, mainly at BCP Stand-alone. This was primarily attributable to the sale of positions in the fair value through
other comprehensive income portfolio (formerly securities available for sale) and, to a lesser extent, to an improvement in the results posted bythe international and local fixed income portfolio at ASB. Growth at BCP Stand-alone was due to the fact that in 3Q18, losses were registered inthis line following the sale of some investments.
(ii) Growth of +5.4% in Fee Income due to an improvement in the evolution of banking commissions at BCP Stand-alone and, to a lesser extent, at
BCP Bolivia and Mibanco, as we will explain in section 5.1.2 Fee Income in the Banking Business.
29

(iii) The improvement in Other non-financial income, generated by Pacifico following the release of general and underwriting expenses and at BCP
Stand-alone for the sale of some real estate (branches) and holdings in the underlying collections portfolio in the months of July and August. All of the aforementioned was partially offset by:
(i) The contraction in the Net gain from exchange differences due to volatility in the exchange rate (USD/PEN), whose variation negativelyaffected the position of the balance. The volatility of the exchange rate was due primarily to political uncertainty and trade tensions between theUSA and China in 3Q19.
In the YTD (Sep 19 vs Sep 18), non-financial income increased due to growth in:
(i) The Net gain on securities, which was primarily attributable to improvements in the results posted by BCP Stand-alone and ASB and, to a lesserextent, by Credicorp Capital and Prima. The aforementioned was attributable to growth in gains in the proprietary investment portfolios at eachsubsidiary, which was driven by: i) an increase in the mark to market value (MtM) of fair value through profit and loss investments and ii) thesale of some positions of the fair value through other comprehensive income portfolio. It is important to note that the recovery registered in 2019versus 2018, given that last year, the increase in the international interest rates negatively affected the investment portfolio.
(ii) Fee income, which was mainly attributable to an improvement in business evolution at BCP Stand-alone and Mibanco, which we will describe ingreater detail in section 5.1.2 Fee income in the Banking Business.
All of the aforementioned was offset by:
(i) The contraction in the Net gain on derivatives held for trading at Credicorp Capital after income from the forward business dropped to coverexchange risk exposure on investments in the trading portfolio and for trading swaps.
(ii) The decrease in the Net gain from exchange differences at BCP Stand-alone, as explained in the YoY analysis.
5.1. Fee Income 5.1.1. By subsidiary The figure below shows the contribution of each of Credicorp’s subsidiaries to Fee Income at Credicorp in 3Q19.
Evolution of fee income QoQ by subsidiary (S/ Million)
*Others include Grupo Pacifico and eliminations for consolidation purposes.
30

The figure below shows the annual evolution of fee income by subsidiary:
Evolution of fee income YoY by subsidiary (S/ Million)
*Others include Grupo Pacifico and eliminations for consolidation purposes. 5.1.2. Fee income in the Banking Business The chart below shows the evolution of the main components of fee income in the banking business:
Composition of Fee Income in the Banking Business
Fee Income Quarter % change YTD % change S/ 000 3Q18 2Q19 3Q19 QoQ YoY Sep 18 Sep 19 Sep 19 / Sep 18 Miscellaneous accounts (1) 177,960 169,732 184,826 8.9% 3.9% 533,388 532,075 -0.2%Credit cards (2) 73,792 71,029 71,633 0.9% -2.9% 219,186 212,162 -3.2%Drafts and transfers 59,121 64,485 68,526 6.3% 15.9% 163,223 193,243 18.4%Personal loans (2) 23,119 24,922 24,989 0.3% 8.1% 69,418 73,511 5.9%SME loans (2) 17,342 16,971 16,970 0.0% -2.1% 49,562 52,505 5.9%Insurance (2) 21,509 23,544 26,951 14.5% 25.3% 61,627 72,696 18.0%Mortgage loans (2) 10,083 9,738 9,213 -5.4% -8.6% 29,028 28,379 -2.2%Off-balance sheet (3) 51,559 51,828 53,954 4.1% 4.6% 154,480 156,961 1.6%Payments and collections (3) 104,346 104,958 108,619 3.5% 4.1% 304,616 317,340 4.2%Commercial loans (3)(4) 20,566 20,823 21,633 3.9% 5.2% 60,562 64,973 7.3%Foreign trade (3) 11,850 9,792 9,561 -2.4% -19.3% 30,189 30,330 0.5%Corporate finance and mutual funds (4) 13,425 21,856 15,889 -27.3% 18.4% 44,046 52,806 19.9%ASB (4) 7,450 11,915 11,923 0.1% 60.0% 24,104 34,110 41.5%Others (4)(5) 60,476 73,360 80,253 9.4% 32.7% 182,347 223,415 22.5%Total fee income 652,597 674,954 704,940 4.4% 8.0% 1,925,775 2,044,507 6.2% Source: BCP(1) Saving accounts, current accounts, debit card and master account.(2) Mainly Retail fees.(3) Mainly Wholesale fees.(4) Figures differ from previously reported, please consider the data presented on this report.(5) Includes fees from BCP Bolivia, Mibanco, network usage and other services to third parties, among others. In the QoQ analysis, fee income in the banking business increased +4.4% QoQ. The components that registered the highest increase this quarter were:
(i) Miscellaneous accounts, mainly due to the increase in fees for debit cards due to charges for consumption to establishments and for exchangerate differences (exchange rate spread). Fees in the savings accounts also rose, driven by higher income for account maintenance and fundtransfers between accounts from clients.
31

(ii) Others, due to an increase in income at BCP Bolivia due to growth in the volume of foreign drafts and transfers and at Mibanco, due to a
methodological change in insurance reporting, as explained in 2Q19.
(iii) Drafts and transfers, mainly due to an increase in fees for transfers from savings products; transfers to the interior of the country; interbanktransfers; and foreign transfers.
Growth was slightly attenuated by:
(i) Corporate finance and mutual funds, which was attributable to a decrease in income this quarter after income hit an unusual level in 2Q19(peak since 2Q17) due to the recognition of deferred fee income for loan cancellations in June.
In the YoY analysis, the +8.0% growth was attributable to the same factors that drove the increase in income QoQ. The aforementioned offset the drop inincome for Foreign Trade, after lower fees were reported due to letters of credit for import and export, and Credit Cards due to a decrease in billing levels. In the YTD analysis (Sep 19 vs Sep 18), fee income in the banking business increased +6.2% due to:
(i) Others, primarily at Mibanco, due to an increase in insurance income, and at BCP Bolivia due to an increase in foreign drafts and transfers andfor fees in the contingent portfolio. The aforementioned led Others to increase their share of total fees for banking services to 10.9% in Sep 19 (vs9.5% in Sep 18).
(ii) The increase in Drafts and Transfers due to growth in domestic transfers, foreign transfers and interbank transfers, which was attributable to an
increase in transactional activity. (iii) An increase in the level of Payments and collections due to an increase in commissions for collections services, payments for company services
and collections for insurance products for clients. The aforementioned offset the drop in Credit Cards, which was attributable to the same factors discussed in the YoY analysis, and to MiscellaneousAccounts due to a decrease in income from account maintenance.
32

6. Insurance Underwriting Result The insurance underwriting result increased 6.0% QoQ due to an increase in the net earned premium in life insurance and property and casualty business(P&C), which was attenuated by an increase in the net claims and higher acquisition costs in both businesses. The YoY underwriting result increased 3.7%and 1.0% YTD, which was attributable to an increase in net earned premiums in P&C and Life businesses and to a decrease in the acquisition costs for lifeinsurance business. The aforementioned was offset by an increase in net claims for both businesses. Insurance underwriting result Quarter % change YTD % change S/ 000 3Q18 2Q19 3Q19 QoQ YoY Sep 18 Sep 19 Sep 19 / Sep 18 Net earned premiums 536,277 590,066 612,534 3.8% 14.2% 1,556,984 1,789,756 15.0%Net claims (318,644) (379,718) (392,520) 3.4% 23.2% (914,234) (1,158,759) 26.7%Acquisition cost (1) (96,382) (91,666) (94,239) 2.8% -2.2% (292,486) (277,186) -5.2%Total insurance underwriting result 121,251 118,682 125,775 6.0% 3.7% 350,264 353,811 1.0% (1) Includes net fees and underwriting expenses.
Total underwriting result by business(S/ millions)
In the QoQ analysis, the improvement in the underwriting result was attributable mainly to the life insurance business and to a lesser extent, to the P&Cbusiness. In life insurance business, the increase was due to growth in net premiums in Annuities, Credit Life and Group Life, which was attenuated by anincrease in net claims in Credit Life and Annuities lines, and to a lesser extent, in Individual Life, and to the increase in acquisition cost due to highercommissions, particularly in Credit Life and Group Life, in line with the increase in net premiums. In the P&C business, the increase in the result is due to anincrease in net earned premiums in the Medical Assistance, Personal Lines and Commercial lines, which was attenuated by an increase in net claims in theMedical Assistance and Personal lines. In the YoY analysis, the increase in the underwriting result is attributable to the life insurance business; growth was attenuated by the P&C business. In thelife insurance business, the variation was due to an increase in the net earned premium in Disability and Survivorship (D&S) lines and in Credit Life and to adecrease in the acquisition cost, which was attributable to a drop in commissions in Credit Life. This was attenuated by an increase in net claims in D&S,Annuities, Credit Life and Individual Life lines. In the P&C business, the decrease is due to an increase in net claims in the Medical Assistance, Cars andCommercial lines and to growth in the acquisition cost due to higher commissions in Personal Lines, Cars and the Commercial lines. These effects weremitigated by the increase in net earned premium, which was attributable to Medical Assistance, Personal Lines and Cars. In the YTD analysis, in 2019 the underwriting result reported an increase of +1.0%, which was primarily attributable to an improvement in the P&C businessdue to an increase in the net earned premium for Personal Lines, Medical Assistance and the Car Line. This was attenuated by an increase in net claims in lifeinsurance business, which was mainly driven by the D&S lines and to a lesser extent, by Annuities and Credit Life.
33

6.1. Net earned premiums
Written premiums by business Net earned premiums by business(S/ millions) (S/ millions)
Written premiums decreased -9.6% QoQ, which was primarily attributable to P&C business and, to a lesser extent, to the life insurance business:
(i) P&C business decreased in (i) Commercial Lines due to aviation and fire risks, given that last quarter, new accounts led to an increase in writtenpremiums, (ii) Cars due to lower production in the brokers and alliance channel, (iii) Medical Assistance due to a decrease in comprehensiveinsurance policies and (iv) Personal Lines due to drop in renewals this quarter.
(ii) The Life insurance business also posted a decrease, albeit smaller than that registered in P & C. The decrease in life was attributable to a drop in
sales in Annuities, which was primarily seen in the particular individual annuity line, and to D&S, which reported higher premiums in the secondquarter. This effect was mitigated by higher production in Credit Life and Individual Life through the bancassurance channel.
Net earned premiums increased +3.8% QoQ. This growth was driven by both the life insurance and P&C businesses. Life insurance registered growth in (i)Annuities, due to a decrease in underwriting reserves in line with the evolution of total premiums described above (ii) an increase in sales of Credit Lifethrough the bancassurance channel and (iii) Group Life due to SCTR and Collective Life, which was attributable to policy renewals at mining companies. TheP&C business registered an increase, which was primarily due to growth in the Medical Assistance and Personal Lines due to drop in provisions for unexpiredrisks, in line with a decrease in premiums that are billed annually. In the YoY analysis, Total premiums decreased -1.1% primarily through the P&C business, mitigated by life insurance business. In the P&C business, thereduction is attributable to a decrease in the Commercial Lines, specifically in the fire segment (annual renewal with Petroperu and Unacem in 3Q18), and toCars, where the decrease was mainly attributable to a drop in production. In life insurance business, the increase was attributable to higher premiums for theD&S lines, which was due to the fact that in January 2019, the company won two tranches of the tender process for SISCO IV contract4 (2019-2020) , whichcompares favorably with the single tranche under SISCO III (2017-2018); this was attenuated by a decrease in Annuities line. Net earned premiums increased +14.2% YoY in the life insurance business, which was mainly attributable to: i) the D&S lines, due to an increase inpremiums associated with SISCO IV and ii) Credit Life, due to an increase in sales in the bancassurance channel. In the P&C business, an increase inproduction was attributable to the Medical Assistance and Personal Lines. In the YTD analysis, in 2019, net premiums increased +15.0% compared to 2018. This was primarily attributable to the life insurance business, where growthwas driven by the D&S Lines (through the tranches won in the SISCO tender) and by Individual Life. In the P&C business, growth was attributable toPersonal Lines, Medical Assistance and the Cars line.
4 Insurance companies that obtain tranches through a public tender process to manage the disability and survival risk of AFP affiliates.
34

6.2. Net claims
Net claims by business(S/ millions)
Net claims increased +3.4% QoQ in the Life and P&C business. In life insurance, the increase was attributable to (i) Credit Life, due to an increase inreported cases through the alliance channel, (ii) Annuities, due to higher pension payments through individual annuity and (iii) Individual life, after moreincurred but not reported reserves were set aside. In P&C, the increase was attributable to Medical Assistance after reserves were increased forcomprehensive products and Personal Lines. In the YoY analysis, net claims increased +23.2%. This was driven by both the Life and P&C businesses. The increase reported in life insurance wasattributable to (i) D&S, after Pacifico won two tranches of the SISCO IV versus one tranche under SISCO III; (ii) Annuities, due to pension paymentsthrough the “Rental Flex “product and (iii) Credit Life, through the bancassurance and alliance channel. In P&C business growth was attributable to: i) theMedical Assistance line, given that reserves were released in 3Q18, ii) the Cars Line, which registered an increase in claims frequency for the SOAT productand iii) the Commercial Lines, due to claims readjustments in favor in 3Q18. In the YTD analysis, net claims increased +26.7% due to growth in claims in the life insurance business through the D&S line, via SISCO IV; Annuities(“Renta Flex” and individual annuities products); and Credit Life, via the bancassurance channel. In the P&C business, the increase in the net claims wasattributable to the Medical Assistance, Cars and Personal Lines. 6.3. Acquisition cost
Acquisition cost by Business(S/ millions)
35
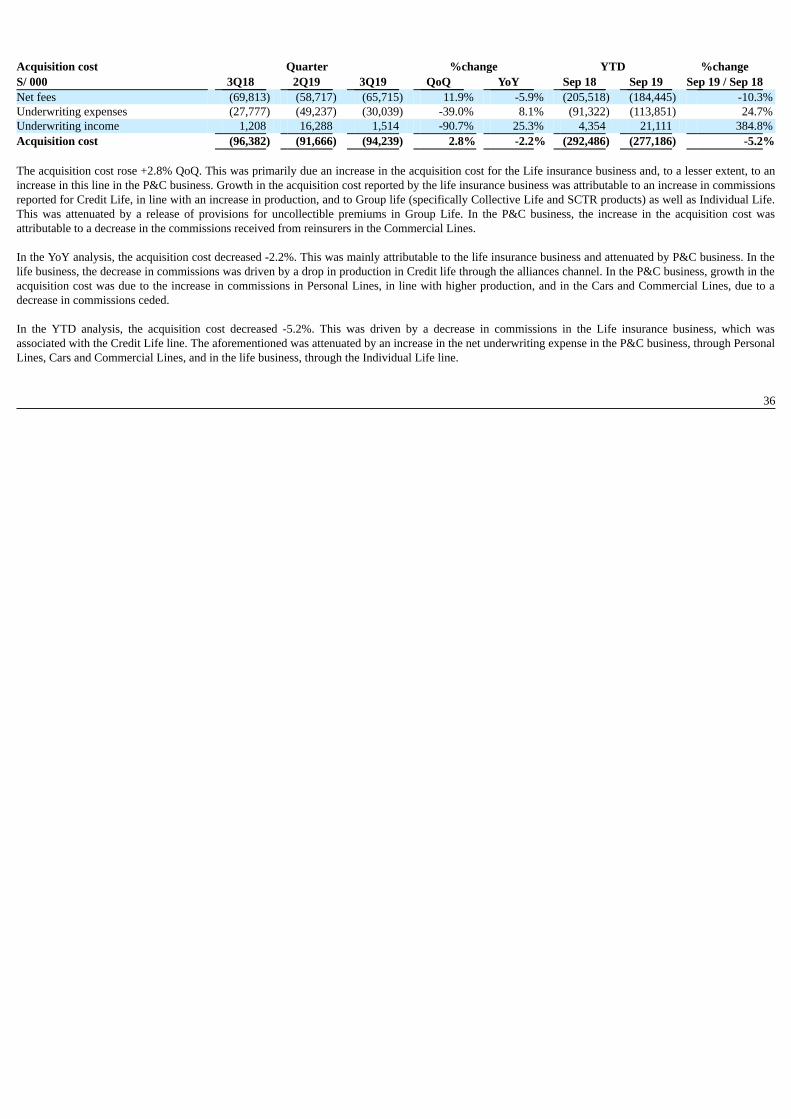
Acquisition cost Quarter %change YTD %change S/ 000 3Q18 2Q19 3Q19 QoQ YoY Sep 18 Sep 19 Sep 19 / Sep 18 Net fees (69,813) (58,717) (65,715) 11.9% -5.9% (205,518) (184,445) -10.3%Underwriting expenses (27,777) (49,237) (30,039) -39.0% 8.1% (91,322) (113,851) 24.7%Underwriting income 1,208 16,288 1,514 -90.7% 25.3% 4,354 21,111 384.8%Acquisition cost (96,382) (91,666) (94,239) 2.8% -2.2% (292,486) (277,186) -5.2% The acquisition cost rose +2.8% QoQ. This was primarily due an increase in the acquisition cost for the Life insurance business and, to a lesser extent, to anincrease in this line in the P&C business. Growth in the acquisition cost reported by the life insurance business was attributable to an increase in commissionsreported for Credit Life, in line with an increase in production, and to Group life (specifically Collective Life and SCTR products) as well as Individual Life.This was attenuated by a release of provisions for uncollectible premiums in Group Life. In the P&C business, the increase in the acquisition cost wasattributable to a decrease in the commissions received from reinsurers in the Commercial Lines. In the YoY analysis, the acquisition cost decreased -2.2%. This was mainly attributable to the life insurance business and attenuated by P&C business. In thelife business, the decrease in commissions was driven by a drop in production in Credit life through the alliances channel. In the P&C business, growth in theacquisition cost was due to the increase in commissions in Personal Lines, in line with higher production, and in the Cars and Commercial Lines, due to adecrease in commissions ceded. In the YTD analysis, the acquisition cost decreased -5.2%. This was driven by a decrease in commissions in the Life insurance business, which wasassociated with the Credit Life line. The aforementioned was attenuated by an increase in the net underwriting expense in the P&C business, through PersonalLines, Cars and Commercial Lines, and in the life business, through the Individual Life line.
36

7. Operating Expenses and Efficiency In the YoY and YTD analysis, the 40 bps improvement in the efficiency ratio was attributable to the fact that operating income grew at a faster pace thanoperating expenses. The increase in operating income was due primarily to growth in net interest income, which offset the increase in salaries and employeebenefits. Operating expenses Quarter % change YTD % change S/ 000 3Q18 2Q19 3Q19 QoQ YoY Sep 18 Sep 19 Sep 19 / Sep 18 Salaries and employees benefits 794,634 845,835 845,345 -0.1% 6.4% 2,352,806 2,525,497 7.3%Administrative, general and tax expenses 590,491 531,336 560,780 5.5% -5.0% 1,647,927 1,605,257 -2.6%Depreciation and amortization (1) 105,517 180,381 185,574 2.9% 75.9% 318,710 506,652 59.0%Association in participation 5,711 4,746 5,348 12.7% -6.4% 14,355 12,830 -10.6%Acquisition cost (2) 96,382 91,666 94,239 2.8% -2.2% 292,486 277,186 -5.2%Operating expenses (3) 1,592,735 1,653,964 1,691,286 2.3% 6.2% 4,626,284 4,927,422 6.5%Operating income (4) 3,656,922 3,838,582 3,915,430 2.0% 7.1% 10,701,915 11,511,443 7.6%Efficiency ratio (5) 43.6% 43.1% 43.2% 10 bps -40 bps 43.2% 42.8% -40 bps Operating expenses / Total average assets (6) 3.80% 3.68% 3.68% 0 bps -12 bps 3.64% 3.61% -3 bps (1) Since the 1Q19, the application of IFRS 16 is in effect, which corresponds to a greater depreciation for the asset for right-of-use". Likewise, the expensesrelated to the depreciation of improvements in building for rent is being reclassified to the item "Other expenses".(2) The acquisition cost of Pacifico includes net fees and underwriting expenses.(3) Operating expenses = Salaries and employee’s benefits + Administrative, general and tax expenses + Depreciation and amortization + Acquisition cost +Association in participation.(4) Operating income = Net interest income + Fee income + Net gain on foreign exchange transactions + Net gain from associates + Net gain on derivativesheld for trading + Result on exchange differences + Net premiums earned.(5) Figures differ from previously reported, please consider the data presented on this report. Operating expenses / Operating income.(6) Figures differ from previously reported, please consider the data presented on this report. Operating expenses / Average of Total Assets. Average iscalculated with period-beginning and period-ending balances. In the QoQ analysis, the deterioration in the efficiency ratio was due to seasonal effects on operating expenses; as such, the YoY analysis provides a clearerpicture of the evolution of efficiency. In the YoY analysis, a 40 bps increase is evident in the efficiency ratio. This took place in a context in which growth in operating income outpaced theexpansion posted by operating expenses. The figure below shows the impact generated by each item of income and operating expenses on the efficiency ratio:
YoY evolution of the efficiency ratio by account
(1) Other operating income includes: Net gain on foreign exchange transactions, Net gain from associates, Net gain on derivatives held for trading and Netgain from exchange difference.(2) Other operating expenses includes: Acquisition cost and Association in participation The analysis of the impact of operating income shows that the improvement in the efficiency ratio YoY was due to the following:
(i) Growth in net interest income, in line with the expansion of average daily loans balances in the vast majority of segments, as indicated in section4.1. Interest income.
(ii) The increase in net earned premiums at Pacifico, which was generated by both the P&C line and life insurance, as we will explain in the section
6.1 Net earned premiums.
37
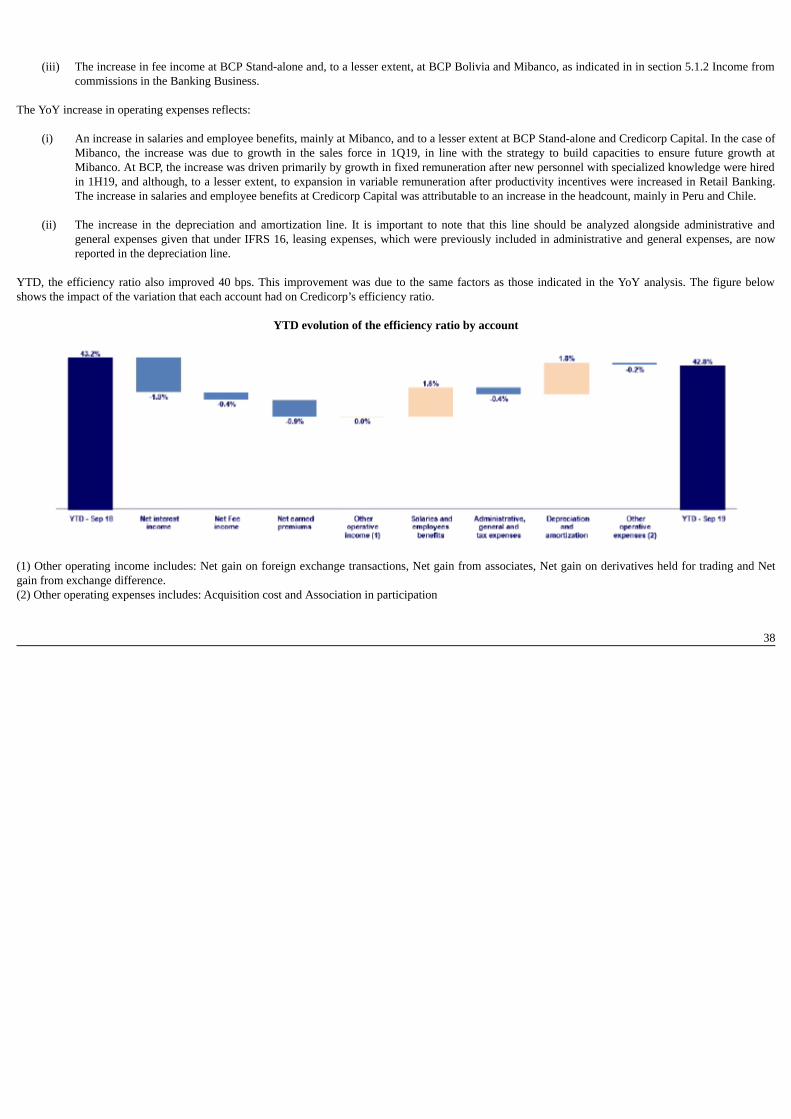
(iii) The increase in fee income at BCP Stand-alone and, to a lesser extent, at BCP Bolivia and Mibanco, as indicated in in section 5.1.2 Income from
commissions in the Banking Business. The YoY increase in operating expenses reflects:
(i) An increase in salaries and employee benefits, mainly at Mibanco, and to a lesser extent at BCP Stand-alone and Credicorp Capital. In the case ofMibanco, the increase was due to growth in the sales force in 1Q19, in line with the strategy to build capacities to ensure future growth atMibanco. At BCP, the increase was driven primarily by growth in fixed remuneration after new personnel with specialized knowledge were hiredin 1H19, and although, to a lesser extent, to expansion in variable remuneration after productivity incentives were increased in Retail Banking.The increase in salaries and employee benefits at Credicorp Capital was attributable to an increase in the headcount, mainly in Peru and Chile.
(ii) The increase in the depreciation and amortization line. It is important to note that this line should be analyzed alongside administrative and
general expenses given that under IFRS 16, leasing expenses, which were previously included in administrative and general expenses, are nowreported in the depreciation line.
YTD, the efficiency ratio also improved 40 bps. This improvement was due to the same factors as those indicated in the YoY analysis. The figure belowshows the impact of the variation that each account had on Credicorp’s efficiency ratio.
YTD evolution of the efficiency ratio by account
(1) Other operating income includes: Net gain on foreign exchange transactions, Net gain from associates, Net gain on derivatives held for trading and Netgain from exchange difference.(2) Other operating expenses includes: Acquisition cost and Association in participation
38

7.1. Credicorp’s Administrative, General and Tax Expenses
Credicorp’s administrative, general and tax expenses
Administrative, general and tax expenses (1) Quarter % change YTD % change S/ 000 3Q18 % 2Q19 % 3Q19 % QoQ YoY Sep 18 Sep 19 Sep 19 / Sep 18 Marketing 80,618 14% 87,714 17% 86,768 15% -1.1% 7.6% 225,369 252,982 12.3%Taxes and contributions 60,213 10% 64,182 12% 65,981 12% 2.8% 9.6% 175,755 196,872 12.0%Insfrastructure 72,622 12% 76,788 14% 76,718 14% -0.1% 5.6% 210,415 221,450 5.2%Systems outsourcing 58,283 10% 44,410 8% 47,933 9% 7.9% -17.8% 165,889 124,216 -25.1%Programs and systems 67,685 11% 69,538 13% 69,462 12% -0.1% 2.6% 188,789 202,849 7.4%Communications 20,845 4% 21,223 4% 18,937 3% -10.8% -9.2% 63,367 62,874 -0.8%Rent 47,446 8% 21,028 4% 12,037 2% -42.8% -74.6% 144,118 63,528 -55.9%Consulting 53,478 9% 30,864 6% 61,082 11% 97.9% 14.2% 132,253 125,720 -4.9%Channels 58,127 10% 61,144 12% 62,333 11% 1.9% 7.2% 160,893 176,244 9.5%Gastos Legales 9,873 2% 10,513 2% 8,793 2% -16.4% -10.9% 28,181 25,979 -7.8%Gastos de Representación 3,303 1% 5,068 1% 5,300 1% 4.6% 60.5% 12,411 15,482 24.7%Seguros 13,305 2% 13,767 3% 16,417 3% 19.2% 23.4% 31,176 41,739 33.9%Others (2) 44,691 8% 25,097 5% 29,018 5% 15.6% -35.1% 109,310 95,321 -12.8%Total administrative and general expenses 590,491 100% 531,336 100% 560,780 100% 5.5% -5.0% 1,647,927 1,605,257 -2.6%
(1) Administrative, general and tax expenses differ from previously reported because BCP Bolivia has been included.(2) Others include ASB, BCP Bolivia, Grupo Credito and eliminations for consolidation. The QoQ increase in administrative and general expenses was mainly due to a seasonal effect. This effect is reflected in the Consultants line and is mainlyattributable to transformation projects and more specifically, to digital issues at BCP Stand-alone. The YoY analysis, which excludes the seasonal effect on operating expenses, shows a drop in expenses, mainly due to a decrease in expenses for systemsOutsourcing and Leasing. This was attributable to the application of IRFS 16, which indicates that financial leasing expenses will not be included inadministrative and general expenses and taxes. Now, a portion of systems outsourcing and leasing expenses (approximately 90%) are included in depreciationand amortization and the rest in financial expenses. The aforementioned offset the increase in:
(i) Expenses for Consultants for the factors discussed in the QoQ analysis and to a lesser extent, the increase in Credicorp Capital due a project thataims to optimize the way in which support teams operate between countries.
(ii) An increase in Marketing, mainly at BCP Stand-alone due to an increase in expenses for the Latam Miles Program and for different advertising
campaigns for Yape and the celebration of BCP’s 130 year anniversary and; (iii) Higher expenses in our channels due to an increase in fee income, in line with growth in the volume of transfers at the national level and abroad,
as indicated in chapter 5.1.2. Fee Income in the Banking Business.
In the YTD operating efficiency ratio there is a slight reduction in expenses, which is mainly attributable to the effect of IFRS 16, as indicated in the YoYanalysis. The aforementioned offset the increase in Marketing and Channels, which was attributable to the same factors indicated in the YoY analysis.
39
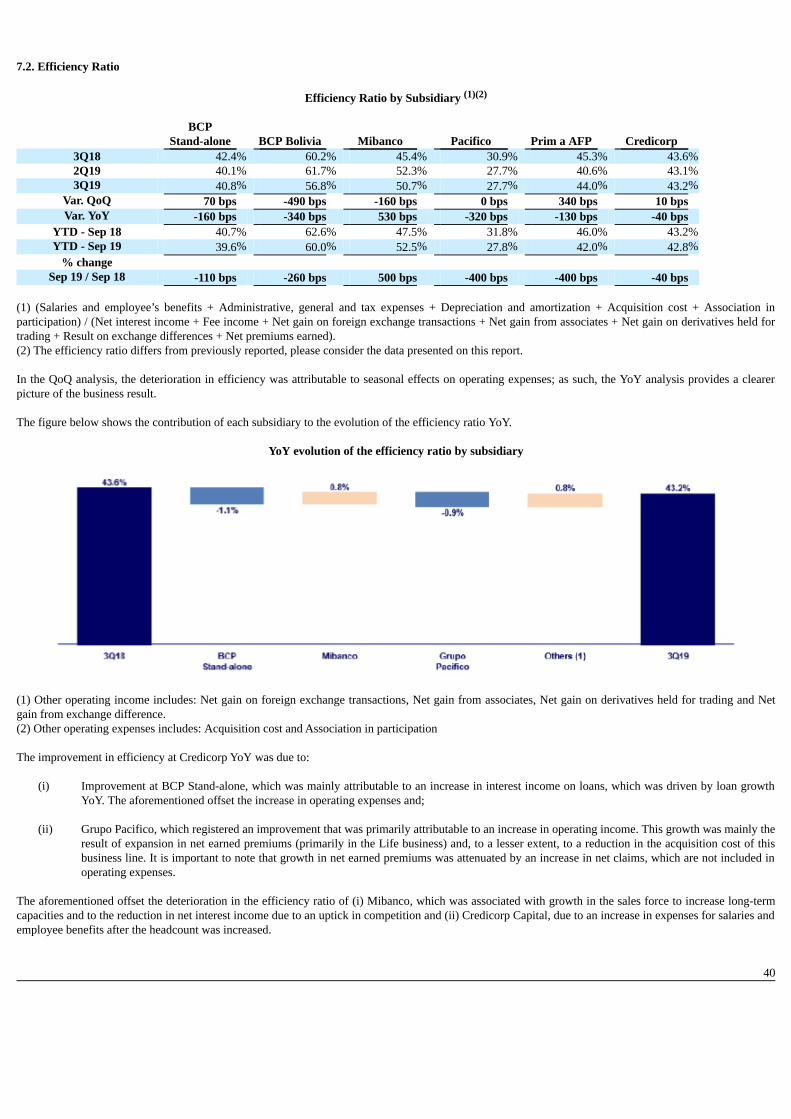
7.2. Efficiency Ratio
Efficiency Ratio by Subsidiary (1)(2)
BCP
Stand-alone BCP Bolivia Mibanco Pacifico Prim a AFP Credicorp 3Q18 42.4% 60.2% 45.4% 30.9% 45.3% 43.6%2Q19 40.1% 61.7% 52.3% 27.7% 40.6% 43.1%3Q19 40.8% 56.8% 50.7% 27.7% 44.0% 43.2%
Var. QoQ 70 bps -490 bps -160 bps 0 bps 340 bps 10 bps Var. YoY -160 bps -340 bps 530 bps -320 bps -130 bps -40 bps
YTD - Sep 18 40.7% 62.6% 47.5% 31.8% 46.0% 43.2%YTD - Sep 19 39.6% 60.0% 52.5% 27.8% 42.0% 42.8%
% change Sep 19 / Sep 18 -110 bps -260 bps 500 bps -400 bps -400 bps -40 bps
(1) (Salaries and employee’s benefits + Administrative, general and tax expenses + Depreciation and amortization + Acquisition cost + Association inparticipation) / (Net interest income + Fee income + Net gain on foreign exchange transactions + Net gain from associates + Net gain on derivatives held fortrading + Result on exchange differences + Net premiums earned).(2) The efficiency ratio differs from previously reported, please consider the data presented on this report. In the QoQ analysis, the deterioration in efficiency was attributable to seasonal effects on operating expenses; as such, the YoY analysis provides a clearerpicture of the business result. The figure below shows the contribution of each subsidiary to the evolution of the efficiency ratio YoY.
YoY evolution of the efficiency ratio by subsidiary
(1) Other operating income includes: Net gain on foreign exchange transactions, Net gain from associates, Net gain on derivatives held for trading and Netgain from exchange difference.(2) Other operating expenses includes: Acquisition cost and Association in participation
The improvement in efficiency at Credicorp YoY was due to:
(i) Improvement at BCP Stand-alone, which was mainly attributable to an increase in interest income on loans, which was driven by loan growth
YoY. The aforementioned offset the increase in operating expenses and;
(ii) Grupo Pacifico, which registered an improvement that was primarily attributable to an increase in operating income. This growth was mainly theresult of expansion in net earned premiums (primarily in the Life business) and, to a lesser extent, to a reduction in the acquisition cost of thisbusiness line. It is important to note that growth in net earned premiums was attenuated by an increase in net claims, which are not included inoperating expenses.
The aforementioned offset the deterioration in the efficiency ratio of (i) Mibanco, which was associated with growth in the sales force to increase long-termcapacities and to the reduction in net interest income due to an uptick in competition and (ii) Credicorp Capital, due to an increase in expenses for salaries andemployee benefits after the headcount was increased.
40

YTD, the efficiency ratio by subsidiary posted results similar to that seen YoY. The figure below shows the impact of the variation of each subsidiary on theefficiency ratio at Credicorp:
YTD evolution of the efficiency ratio by subsidiary
(1) Other operating income includes: Net gain on foreign exchange transactions, Net gain from associates, Net gain on derivatives held for trading and Netgain from exchange difference.(2) Other operating expenses includes: Acquisition cost and Association in participation
41

8. Regulatory Capital 8.1. Regulatory Capital – BAP Regulatory Capital and Capital Adequacy Ratios As of % Change S/ 000 3Q18 2Q19 3Q19 QoQ YoY Capital Stock 1,318,993 1,318,993 1,318,993 0.0% 0.0%Treasury Stocks (207,994) (207,839) (207,839) 0.0% -0.1%Capital Surplus 249,398 227,380 222,605 -2.1% -10.7%Legal and Other capital reserves (1) 17,576,109 19,423,324 19,416,912 0.0% 10.5%Minority interest (2) 311,469 357,067 357,157 0.0% 14.7%Loan loss reserves (3) 1,476,168 1,608,215 1,633,135 1.5% 10.6%Perpetual subordinated debt 660,000 575,225 592,025 2.9% -10.3%Subordinated Debt 4,680,739 4,735,573 4,778,365 0.9% 2.1%Investments in equity and subordinated debt of
financial and insurance companies (604,352) (777,011) (775,048) -0.3% 28.2%Goodwill (635,968) (601,333) (621,686) 3.4% -2.2%Deduction for subordinated debt limit (50% of Tier I
excluding deductions) (4) — — — — — Deduction for Tier I Limit (50% of Regulatory capital)(4) — — — — — Total Regulatory Capital (A) 24,824,563 26,659,594 26,714,619 0.2% 7.6%Tier 1 (5) 13,464,685 14,746,304 14,739,047 0.0% 9.5%Tier 2 (6) + Tier 3 (7) 11,359,877 11,913,290 11,975,572 0.5% 5.4%Financial Consolidated Group (FCG) Regulatory
Capital Requirements (8) 19,110,797 19,877,961 20,170,802 1.5% 5.5%Insurance Consolidated Group (ICG) CapitalRequirements (9) 983,100 1,090,628 1,139,617 4.5% 15.9%FCG Capital Requirements related to operations withICG (225,561) (235,272) (236,036) 0.3% 4.6%ICG Capital Requirements related to operations withFCG — — — — — Total Regulatory Capital Requirements (B) 19,868,336 20,733,318 21,074,383 1.6% 6.1%Regulatory Capital Ratio (A) / (B) 1.25 1.29 1.27 Required Regulatory Capital Ratio (10) 1.00 1.00 1.00 (1) Legal and other capital reserves include restricted capital reserves (S/ 13,465 million) and optional capital reserves (S/ 5,952 million).(2) Minority interest includes Tier I (S/ 357 million)(3) Up to 1.25% of total risk-weighted assets of Banco de Credito del Peru, Solucioo Empresa Administradora Hipotecaria, Mibanco and Atlantic SecurityBank.(4) Tier II + Tier III cannot be more than 50% of total regulatory capital.(5) Tier I = capital + restricted capital reserves + Tier I minority interest - goodwill - (0.5 x investment in equity and subordinated debt of financial andinsurance companies) + perpetual subordinated debt.(6) Tier II = subordinated debt + TierII minority interest tier + loan loss reserves - (0.5 x investment in equity and subordinated debt of financial and insurancecompanies).(7) Tier III = Subordinated debt covering market risk only.(8) Includes regulatory capital requirements of the financial consolidated group.(9) Includes regulatory capital requirements of the insurance consolidated group.(10) Regulatory Capital / Total Regulatory Capital Requirements (legal minimum = 1.00). Credicorp’s total regulatory capital remained stable QoQ but increased 7.6% YoY due to growth in legal and other capital reserves, as announced in 1Q19.The total regulatory capital requirement increased 1.6% QoQ and 6.1% YoY. Credicorp’s Regulatory Capital Ratio continued to be situated at a comfortable level at the end of 3Q19 and represented 1.27 times the capital required by thePeruvian regulator at the end of 3Q19.
42

8.2. Regulatory Capital – BCP Stand-alone based on Peru GAAP Regulatory Capital and Capital Adequacy Ratios As of % change S/ 000 3Q18 2Q19 3Q19 QoQ YoY Capital Stock 8,770,365 10,217,387 10,217,387 0.0% 16.5%Legal and Other capital reserves 4,184,309 4,695,118 4,695,118 0.0% 12.2%Accumulated earnings with capitalization agreement — — 850,000 Loan loss reserves (1) 1,190,912 1,298,104 1,320,345 1.7% 10.9%Perpetual subordinated debt 660,000 575,225 592,025 2.9% -10.3%Subordinated Debt 4,133,057 4,197,063 4,319,204 2.9% 4.5%Unrealized profit (loss) — — — Investment in subsidiaries and others, net of
unrealized profit and net income (1,323,808) (1,722,979) (1,722,979) 0.0% 30.2%Investment in subsidiaries and others (1,845,441) (1,903,858) (2,006,574) 5.4% 8.7%Unrealized profit and net income in subsidiaries 521,633 180,879 283,595 56.8% -45.6%
Goodwill (122,083) (122,083) (122,083) 0.0% 0.0%Total Regulatory Capital 17,492,752 19,137,835 20,149,017 5.3% 15.2%Off-balance sheet 83,769,728 84,178,682 88,421,907 5.0% 5.6%Tier 1 (2) 12,830,686 14,504,157 15,370,957 6.0% 19.8%Tier 2 (3) + Tier 3 (4) 4,662,065 4,633,677 4,778,060 3.1% 2.5%Common Equity Tier 1 13,487,881 14,682,446 15,048,138 2.5% 11.6%Total risk-weighted assets - SBS 117,083,174 128,023,739 130,413,864 1.9% 11.4%Market risk-weighted assets (5) 1,256,762 2,701,436 2,143,263 -20.7% 70.5%Credit risk-weighted assets 106,878,174 115,994,876 118,791,053 2.4% 11.1%Operational risk-weighted assets 8,948,239 9,327,427 9,479,548 1.6% 5.9%Adjusted Risk-Weighted Assets - Basel 116,212,161 124,260,803 125,960,200 1.4% 8.4%Total risk-weighted assets 117,083,174 128,023,739 130,413,864 1.9% 11.4%
(-) RWA Intangible assets, excluding goodwill. 1,426,100 4,168,753 4,846,465 16.3% 239.8%(+) RWA Deferred tax assets generated as a result
of temporary differences in income tax, inexcess of 10% of CET1 555,087 405,816 392,802 -3.2% —
(+) RWA Deferred tax assets generated as a resultof past losses — — — — —
Total capital requirement 15,012,149 16,265,477 16,547,822 1.7% 10.2%Market risk capital requirement (5) 125,676 270,144 214,326 -20.7% 70.5%Credit risk capital requirement 10,687,817 11,599,488 11,879,105 2.4% 11.1%Operational risk capital requirement 894,824 932,743 947,955 1.6% 5.9%Additional capital requirements 3,303,831 3,463,103 3,506,435 1.3% 6.1%Capital ratios Tier 1 ratio (6) 10.96% 11.33% 11.79% Common Equity Tier 1 ratio (7) 11.61% 11.82% 11.95% BIS ratio (8) 14.94% 14.95% 15.45% Risk-weighted assets / Regulatory capital (9) 6.69 6.69 6.47 (1) Up to 1.25% of total risk-weighted assets.(2) Tier 1 = Capital + Legal and other capital reserves + Accumulated earnings with capitalization agreement + (0.5 x Unrealized profit and net income insubsidiaries) - Goodwill - (0.5 x Investment in subsidiaries) + Perpetual subordinated debt (maximum amount that can be included is 17.65% of Capital +Reserves + Accumulated earnings with capitalization agreement + Unrealized profit and net income in subsidiaries - Goodwill).(3) Tier 2 = Subordinated debt + Loan loss reserves + (0.5 x Unrealized profit and net income in subsidiaries) - (0.5 x Investment in subsidiaries).(4) Tier 3 = Subordinated debt covering market risk only. Tier 3 exists since 1Q10.(5) It includes capital requirement to cover price and rate risk.(6) Tier 1 / Total Risk-weighted assets(7) Common Equity Tier I = Capital + Reserves – 100% of applicable deductions (investment in subsidiaries, goodwill, intangibles and net deferred taxes thatrely on future profitability) + retained earnings + unrealized gains.Adjusted Risk-Weighted Assets = Risk-weighted assets - (RWA Intangible assets, excluding goodwill, + RWA Deferred tax assets generated as a result oftemporary differences in income tax, in excess of 10% of CET1, + RWA Deferred tax assets generated as a result of past losses)."(8) Regulatory Capital / Risk-weighted assets (legal minimum = 10% since July 2011)(9) Since July 2012, Risk-weighted assets = Credit risk-weighted assets * 1.00 + Capital requirement to cover market risk * 10 + Capital requirement to coveroperational risk * 10 * 1.00 (since July 2014).
43

At the end of 3Q19, the BIS and Tier 1 Ratios at BCP Stand-alone increased QoQ to situate at 15.45% and 11.79% respectively. This was due to a +5.3%increase in total regulatory capital in a context in which total RWAs grew 1.9%. Total regulatory capital fell QoQ due to an increase in subordinated debt corresponding to issuances made in the third quarter of the year. Total RWAsincreased due to growth in Credit RWAs, which was primarily attributable to the effect of a 2.6% expansion QoQ in quarter-end loan balances. In the YoY evolution, the BIS and Tier1 ratios registered an increase with regard to the levels posted in 3Q18. This result was generated in a context in whichtotal regulatory capital and Tier 1 outpaced the expansion reported for Credit RWAs. In the YoY evolution of total RWAs, Credit RWAs posted the highest growth, followed by growth in Market and Operational RWAs. The increase in CreditRWAs is attributable to a YoY expansion of 7.0% in quarter-end balances and to the incorporation of unutilized lines of credit in the calculation of RWAs asof 2019 (according to requirements set forth by the Peruvian regulating entity).
Common Equity Tier 1 Ratio – BCP Stand-alone
June 2019 September 2019
(1) Includes investments in BCP Bolivia and other subsidiaries. Finally, the Tier 1 Common Equity Ratio (CET1), which is considered the most rigorous ratio with which to measure capitalization levels, reported growth of+13 bps QoQ to situate at 11.95% at the end of 3Q19. This result was primarily due to a +2.5% increase in the CET1, in line with the quarter’s YTD results.In the YoY analysis, the CET1 ratio increased 34 bps in a context in which adjusted RWAs increase 8.4% and CET1, +11.6%.
44
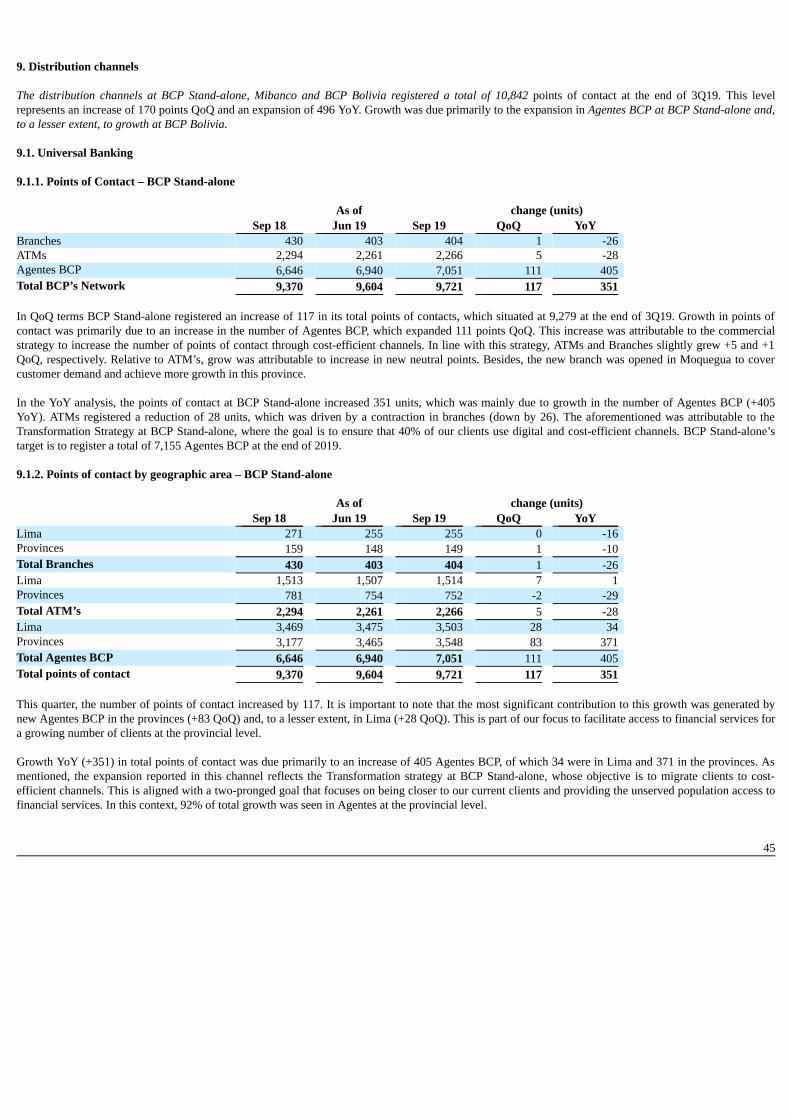
9. Distribution channels The distribution channels at BCP Stand-alone, Mibanco and BCP Bolivia registered a total of 10,842 points of contact at the end of 3Q19. This levelrepresents an increase of 170 points QoQ and an expansion of 496 YoY. Growth was due primarily to the expansion in Agentes BCP at BCP Stand-alone and,to a lesser extent, to growth at BCP Bolivia. 9.1. Universal Banking 9.1.1. Points of Contact – BCP Stand-alone As of change (units)
Sep 18 Jun 19 Sep 19 QoQ YoY Branches 430 403 404 1 -26 ATMs 2,294 2,261 2,266 5 -28 Agentes BCP 6,646 6,940 7,051 111 405 Total BCP’s Network 9,370 9,604 9,721 117 351 In QoQ terms BCP Stand-alone registered an increase of 117 in its total points of contacts, which situated at 9,279 at the end of 3Q19. Growth in points ofcontact was primarily due to an increase in the number of Agentes BCP, which expanded 111 points QoQ. This increase was attributable to the commercialstrategy to increase the number of points of contact through cost-efficient channels. In line with this strategy, ATMs and Branches slightly grew +5 and +1QoQ, respectively. Relative to ATM’s, grow was attributable to increase in new neutral points. Besides, the new branch was opened in Moquegua to covercustomer demand and achieve more growth in this province. In the YoY analysis, the points of contact at BCP Stand-alone increased 351 units, which was mainly due to growth in the number of Agentes BCP (+405YoY). ATMs registered a reduction of 28 units, which was driven by a contraction in branches (down by 26). The aforementioned was attributable to theTransformation Strategy at BCP Stand-alone, where the goal is to ensure that 40% of our clients use digital and cost-efficient channels. BCP Stand-alone’starget is to register a total of 7,155 Agentes BCP at the end of 2019. 9.1.2. Points of contact by geographic area – BCP Stand-alone As of change (units) Sep 18 Jun 19 Sep 19 QoQ YoY Lima 271 255 255 0 -16 Provinces 159 148 149 1 -10 Total Branches 430 403 404 1 -26 Lima 1,513 1,507 1,514 7 1 Provinces 781 754 752 -2 -29 Total ATM’s 2,294 2,261 2,266 5 -28 Lima 3,469 3,475 3,503 28 34 Provinces 3,177 3,465 3,548 83 371 Total Agentes BCP 6,646 6,940 7,051 111 405 Total points of contact 9,370 9,604 9,721 117 351 This quarter, the number of points of contact increased by 117. It is important to note that the most significant contribution to this growth was generated bynew Agentes BCP in the provinces (+83 QoQ) and, to a lesser extent, in Lima (+28 QoQ). This is part of our focus to facilitate access to financial services fora growing number of clients at the provincial level. Growth YoY (+351) in total points of contact was due primarily to an increase of 405 Agentes BCP, of which 34 were in Lima and 371 in the provinces. Asmentioned, the expansion reported in this channel reflects the Transformation strategy at BCP Stand-alone, whose objective is to migrate clients to cost-efficient channels. This is aligned with a two-pronged goal that focuses on being closer to our current clients and providing the unserved population access tofinancial services. In this context, 92% of total growth was seen in Agentes at the provincial level.
45
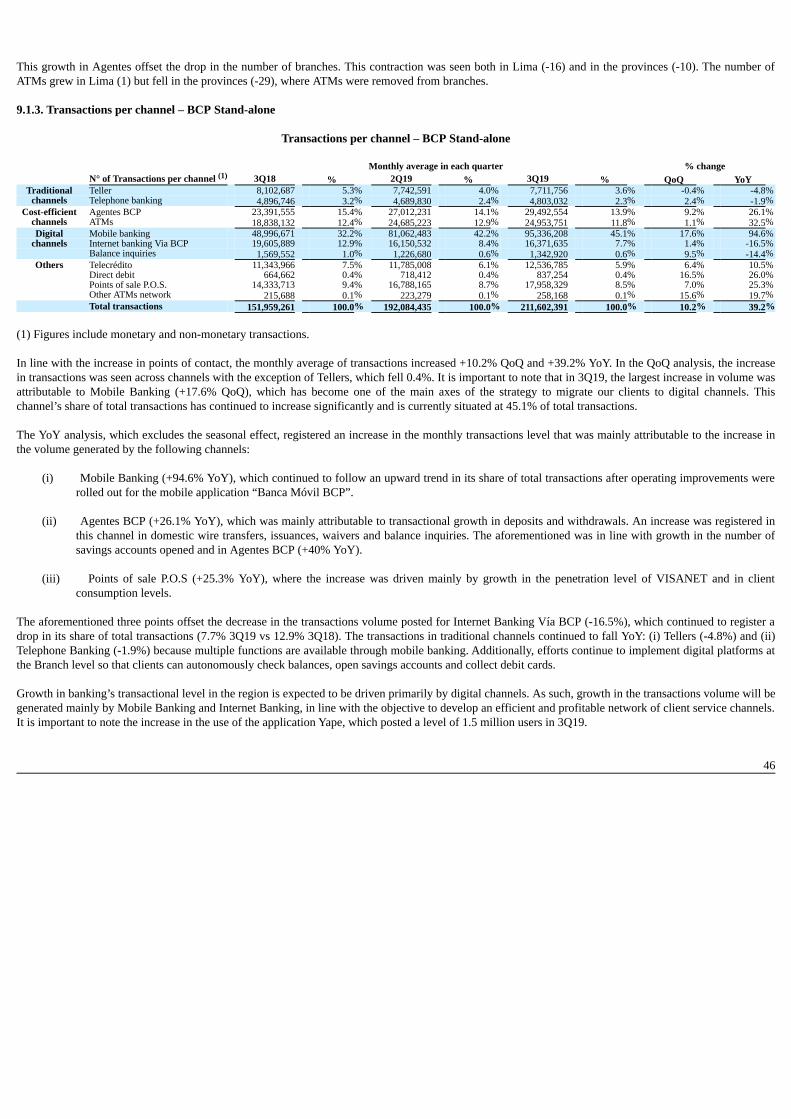
This growth in Agentes offset the drop in the number of branches. This contraction was seen both in Lima (-16) and in the provinces (-10). The number ofATMs grew in Lima (1) but fell in the provinces (-29), where ATMs were removed from branches. 9.1.3. Transactions per channel – BCP Stand-alone
Transactions per channel – BCP Stand-alone
Monthly average in each quarter % change N° of Transactions per channel (1) 3Q18 % 2Q19 % 3Q19 % QoQ YoY
Traditional Teller 8,102,687 5.3% 7,742,591 4.0% 7,711,756 3.6% -0.4% -4.8%channels Telephone banking 4,896,746 3.2% 4,689,830 2.4% 4,803,032 2.3% 2.4% -1.9%
Cost-efficient Agentes BCP 23,391,555 15.4% 27,012,231 14.1% 29,492,554 13.9% 9.2% 26.1%channels ATMs 18,838,132 12.4% 24,685,223 12.9% 24,953,751 11.8% 1.1% 32.5%Digital Mobile banking 48,996,671 32.2% 81,062,483 42.2% 95,336,208 45.1% 17.6% 94.6%
channels Internet banking Via BCP 19,605,889 12.9% 16,150,532 8.4% 16,371,635 7.7% 1.4% -16.5% Balance inquiries 1,569,552 1.0% 1,226,680 0.6% 1,342,920 0.6% 9.5% -14.4%
Others Telecrédito 11,343,966 7.5% 11,785,008 6.1% 12,536,785 5.9% 6.4% 10.5% Direct debit 664,662 0.4% 718,412 0.4% 837,254 0.4% 16.5% 26.0% Points of sale P.O.S. 14,333,713 9.4% 16,788,165 8.7% 17,958,329 8.5% 7.0% 25.3% Other ATMs network 215,688 0.1% 223,279 0.1% 258,168 0.1% 15.6% 19.7%
Total transactions 151,959,261 100.0% 192,084,435 100.0% 211,602,391 100.0% 10.2% 39.2%
(1) Figures include monetary and non-monetary transactions. In line with the increase in points of contact, the monthly average of transactions increased +10.2% QoQ and +39.2% YoY. In the QoQ analysis, the increasein transactions was seen across channels with the exception of Tellers, which fell 0.4%. It is important to note that in 3Q19, the largest increase in volume wasattributable to Mobile Banking (+17.6% QoQ), which has become one of the main axes of the strategy to migrate our clients to digital channels. Thischannel’s share of total transactions has continued to increase significantly and is currently situated at 45.1% of total transactions. The YoY analysis, which excludes the seasonal effect, registered an increase in the monthly transactions level that was mainly attributable to the increase inthe volume generated by the following channels:
(i) Mobile Banking (+94.6% YoY), which continued to follow an upward trend in its share of total transactions after operating improvements wererolled out for the mobile application “Banca Móvil BCP”.
(ii) Agentes BCP (+26.1% YoY), which was mainly attributable to transactional growth in deposits and withdrawals. An increase was registered in
this channel in domestic wire transfers, issuances, waivers and balance inquiries. The aforementioned was in line with growth in the number ofsavings accounts opened and in Agentes BCP (+40% YoY).
(iii) Points of sale P.O.S (+25.3% YoY), where the increase was driven mainly by growth in the penetration level of VISANET and in client
consumption levels. The aforementioned three points offset the decrease in the transactions volume posted for Internet Banking Vía BCP (-16.5%), which continued to register adrop in its share of total transactions (7.7% 3Q19 vs 12.9% 3Q18). The transactions in traditional channels continued to fall YoY: (i) Tellers (-4.8%) and (ii)Telephone Banking (-1.9%) because multiple functions are available through mobile banking. Additionally, efforts continue to implement digital platforms atthe Branch level so that clients can autonomously check balances, open savings accounts and collect debit cards. Growth in banking’s transactional level in the region is expected to be driven primarily by digital channels. As such, growth in the transactions volume will begenerated mainly by Mobile Banking and Internet Banking, in line with the objective to develop an efficient and profitable network of client service channels.It is important to note the increase in the use of the application Yape, which posted a level of 1.5 million users in 3Q19.
46
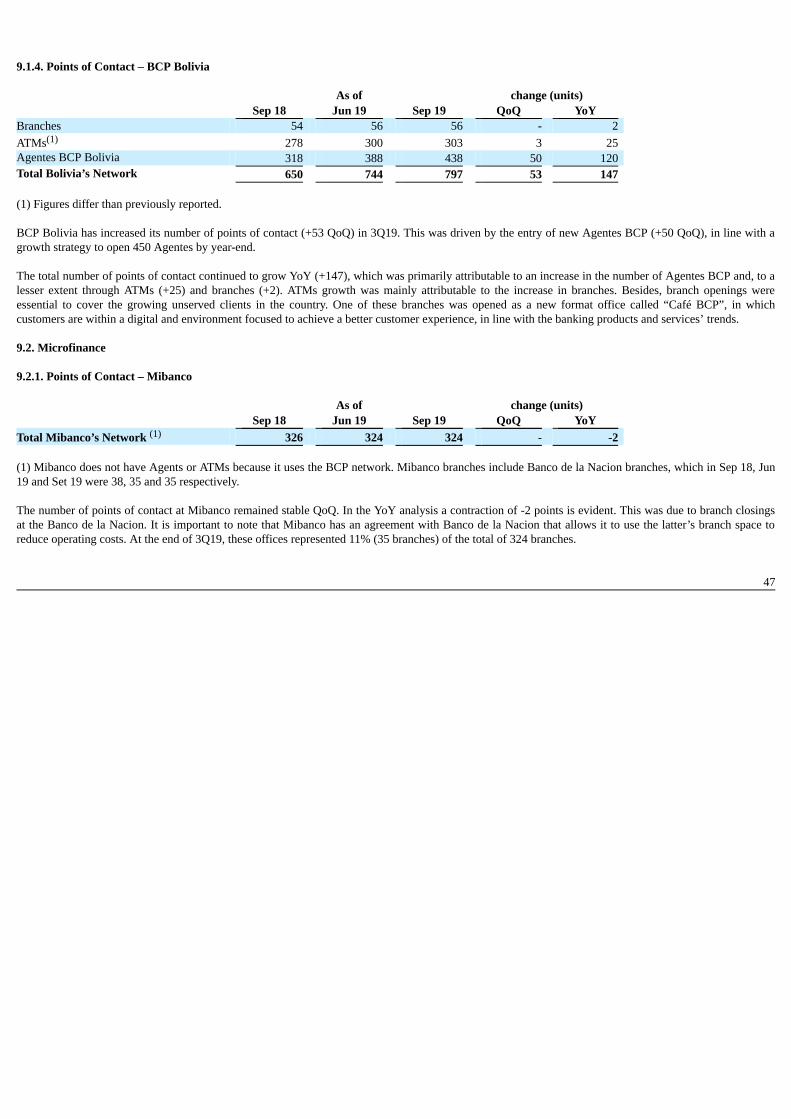
9.1.4. Points of Contact – BCP Bolivia As of change (units) Sep 18 Jun 19 Sep 19 QoQ YoY Branches 54 56 56 - 2 ATMs(1) 278 300 303 3 25 Agentes BCP Bolivia 318 388 438 50 120 Total Bolivia’s Network 650 744 797 53 147 (1) Figures differ than previously reported. BCP Bolivia has increased its number of points of contact (+53 QoQ) in 3Q19. This was driven by the entry of new Agentes BCP (+50 QoQ), in line with agrowth strategy to open 450 Agentes by year-end. The total number of points of contact continued to grow YoY (+147), which was primarily attributable to an increase in the number of Agentes BCP and, to alesser extent through ATMs (+25) and branches (+2). ATMs growth was mainly attributable to the increase in branches. Besides, branch openings wereessential to cover the growing unserved clients in the country. One of these branches was opened as a new format office called “Café BCP”, in whichcustomers are within a digital and environment focused to achieve a better customer experience, in line with the banking products and services’ trends. 9.2. Microfinance 9.2.1. Points of Contact – Mibanco As of change (units) Sep 18 Jun 19 Sep 19 QoQ YoY Total Mibanco’s Network (1) 326 324 324 - -2 (1) Mibanco does not have Agents or ATMs because it uses the BCP network. Mibanco branches include Banco de la Nacion branches, which in Sep 18, Jun19 and Set 19 were 38, 35 and 35 respectively. The number of points of contact at Mibanco remained stable QoQ. In the YoY analysis a contraction of -2 points is evident. This was due to branch closingsat the Banco de la Nacion. It is important to note that Mibanco has an agreement with Banco de la Nacion that allows it to use the latter’s branch space toreduce operating costs. At the end of 3Q19, these offices represented 11% (35 branches) of the total of 324 branches.
47

10. Economic Perspectives 10.1. Peru Economic Forecasts
Peru 2015 2016 2017 2018 2019 GDP (US$ Millions) 191,323 194,653 214,397 225,364 224,000 Real GDP (% change) 3.3 4.0 2.5 4.0 2.5 GDP per capita (US$) 6,132 6,179 6,742 6,999 6,892 Domestic demand (% change) 2.6 1.1 1.4 4.3 2.8
Total consumption (% change) 4.9 3.2 2.3 3.6 2.6 Private Consumption (% change) 4.0 3.7 2.6 3.8 3.0
Gross fixed investment (as % GDP) 23.7 21.9 20.5 21.4 21.5 Private Investment (% change) -4.2 -5.4 0.2 4.4 3.0 Public Investment (% change) -6.9 0.3 -1.8 6.8 0.5
Public Debt (as % GDP) 23.3 23.9 24.9 25.7 26.5 System loan growth (% change)(1) 14.4 4.9 5.6 10.1 - Inflation(2) 4.4 3.2 1.4 2.2 2.0 Reference Rate 3.75 4.25 3.25 2.75 2.25 Exchange rate, end of period 3.41 3.36 3.24 3.37 3.35-3.40 Exchange rate, (% change) 14.6% -1.7% -3.5% 4.1% -0.6%Fiscal balance (% GDP) -2.1 -2.6 -3.1 -2.5 -2.0 Trade balance (US$ Millions) -2,916 1,953 6,571 7,049 4,200 (As % GDP) -1.5% 1.0% 3.1% 3.1% 1.9%Exports 34,414 37,082 45,275 48,942 45,900 Imports 37,331 35,128 38,704 41,893 41,700 Current account balance (US$ Millions) -9,169 -5,303 -2,537 -3,349 -4,928 (As % GDP) -4.8% -2.7% -1.2% -1.5% -2.2%Net international reserves (US$ Millions) 61,485 61,686 63,621 60,121 68,800 (As % GDP) 32.1% 31.7% 29.7% 26.7% 30.7%(As months of imports) 20 21 20 17 20 Source: Estimates by BCP Economic Research as of October 2019; INEI, BCRP, and SBS.(1) Financial System, Current Exchange Rate(2) Inflation target: 1% - 3% 10.2. Main Economic Variables
Economic Activity – GDP (% change YoY)
48

Our estimates suggest GDP grew around 3.3% YoY in 3Q19 (2Q19: 1.2%), the higher growth rate of the year. The performance of the quarter is explained bythe recovery of the primary sectors, which expanded 2.5% YoY after the 4.2% YoY contraction on 2Q19. Particularly, primary resource manufacturing stoodout (in Jul/Aug-19 it grew 10% YoY after a 18% YoY decline on 2Q19). On the other hand, non-primary sectors slightly accelerated to 3.4% YoY (2Q19:2.9%). The expansion on non-primary sectors was underpinned by the advance of the services sectors (in Jul/Aug-19 they grew 3.8% YoY, similar to the 3.5%YoY expansion of the 2Q19).
Inflation and Monetary Policy rate (%)
Headline inflation closed 3Q19 at 1.9% YoY (2Q19: 2.3%) and stood below the midpoint of the target range of the Central Bank (1%-3%) for the first time ina year. On the other hand, core inflation stood at 2.2% YoY (2Q19: 2.3%); core inflation accumulates 1.68% for Jan/Sep-19 period, the lowest level for suchperiod in seven years. During the 3Q19, the Central Bank lowered its reference rate in 25pbs from 2.75% to 2.50%, the first cut in year-and-a-half. After making the cut on August,the Central Bank claimed that “this decision doesn’t necessarily imply additional rate reductions”. However, this statement was then secluded from theofficial statement on later meetings. Hence, the Central Bank’s Board considered appropriate to maintain the expansive monetary policy stance, and it remainsvigilant for new information regarding inflation and its determinants, to evaluate additional adjustments to its stance. It’s important to remark that in theInflation Report of September 2019, the Central Bank highlighted a downside bias for its inflation forecast due to a potentially lower-than-expected-growth ofdomestic demand.
Fiscal Result and Current Account Balance (% of GDP, Quarter)
In 3Q19 the annualized fiscal deficit represented 1.6% of GDP (2Q19: 1.5%), around its lowest level since 2015. The fiscal deficit remained relatively stableunder a context of lower fiscal revenues (from 19.8% of GDP in 2Q19 to 19.6% in 3Q19) while the non-financial general government spending represented20.0% of GDP (2Q19: 20.1%). In 3Q19, public investment of the general government decreased 4.4% YoY (2Q19: +7.9%), by which it declined 2.4% YTD.
49

In Jan/Aug-19, the trade balance adds up a surplus of USD 3,137 million, which is 34% below the same period of last year. Hence, exports decrease 6.8%YoY in the same period due to lower traditional exports (-9.9%, copper: -11.6%), while non-traditional exports advanced 1.9% YoY (agro-exports: +5.3%). Itis worth noticing that the contraction of total exports so far this year is mainly explained by a price effect. In contrast, imports fell 2.1% YoY in the sameperiod, although capital goods imports grew by 5.1% YoY. Lastly, on Aug-19, the terms of trade advanced 3.0% YoY after almost a year of consecutivecontraction.
Exchange rate (S/ per US$)
In 3Q19, the exchange rate closed at USDPEN 3.383, which means that the Peruvian Sol depreciated 2.9% compared to 2Q19 (USDPEN 3.287). In the thirdquarter of the year, periods of high volatility were observed due to the international environment amid trade tensions between US and the rest of the world,and to a lesser extent due to the local political context. In 3Q19, all currencies of the region depreciated: Colombian Peso (8.3%), Brazilian Real (8.0%), Chilean Peso (7.4%) y Mexican Peso (2.7%). On otherhand, during 3Q19 the Central Bank did not intervene in the spot FX market, and issued FX Swaps (short position in USD) for PEN 2,400 million duringAugust (during August the exchange rate escalated up to USDPEN 3.40). Lastly, Net International Reserves (NIR) stood at USD 67,680 million, whichimplied an advanced of USD 1,347 million compared to 2Q19 and USD 7,739 million so far this year.
50

Safe Harbor for Forward-Looking Statements This material includes “forward-looking statements” within the meaning of Section 21E of the Securities Exchange Act of 1934. All statements other thanstatements of historical information provided herein are forward-looking and may contain information about financial results, economic conditions, trendsand known uncertainties. Forward-looking statements are neither historical facts nor assurances of future performance. Instead, they are based only on theCompany’s current beliefs, expectations and assumptions regarding the future of our business, future plans and strategies, projections, anticipated events andtrends, the economy and other future conditions. Forward-looking statements can be identified by words such as: "anticipate”, "intend", "plan", "goal”, "seek”, "believe”, "project", "estimate”, "expect","strategy”, "future”, "likely”, "may”, "should”, "will" and similar references to future periods. Examples of forward-looking statements include, amongothers, statements or estimates we make regarding guidance relating to Return on Average Equity, Sustainable Return on Average Equity, Cost of Risk, Loangrowth, Efficiency ratio, BCP Stand-alone Common Equity Tier 1 Capital ratio and Net Interest Margin, current or future volatility in the credit markets andfuture market conditions, expected macroeconomic conditions, our belief that we have sufficient liquidity to fund our business operations during the nextyear, expectations of the effect on our financial condition of claims, litigation, environmental costs, contingent liabilities and governmental and regulatoryinvestigations and proceedings, strategy for customer retention, growth, product development, market position, financial results and reserves and strategy forrisk management. The Company cautions readers that actual results could differ materially from those expected by the Company, depending on the outcome of certain factors,including, without limitation: (1) adverse changes in the Peruvian economy with respect to the rates of inflation, economic growth, currency devaluation, andother factors, (2) adverse changes in the Peruvian political situation, including, without limitation, the reversal of market-oriented reforms and economicrecovery measures, or the failure of such measures and reforms to achieve their goals, and (3) adverse changes in the markets in which the Company operates,including increased competition, decreased demand for financial services, and other factors. Readers are cautioned not to place undue reliance on theseforward-looking statements, which speak only as of the date hereof. Our actual results and financial condition may differ materially from those indicated inthe forward-looking statements. Therefore, you should not rely on any of these forward-looking statements. Any forward-looking statement made in this material is based only on information currently available to the Company and speaks only as of the date onwhich it is made. The Company undertakes no obligation to release publicly the result of any revisions to these forward-looking statements which may bemade to reflect events or circumstances after the date hereof, including, without limitation, changes in the Company’s business strategy or planned capitalexpenditures, or to reflect the occurrence of unanticipated events
51
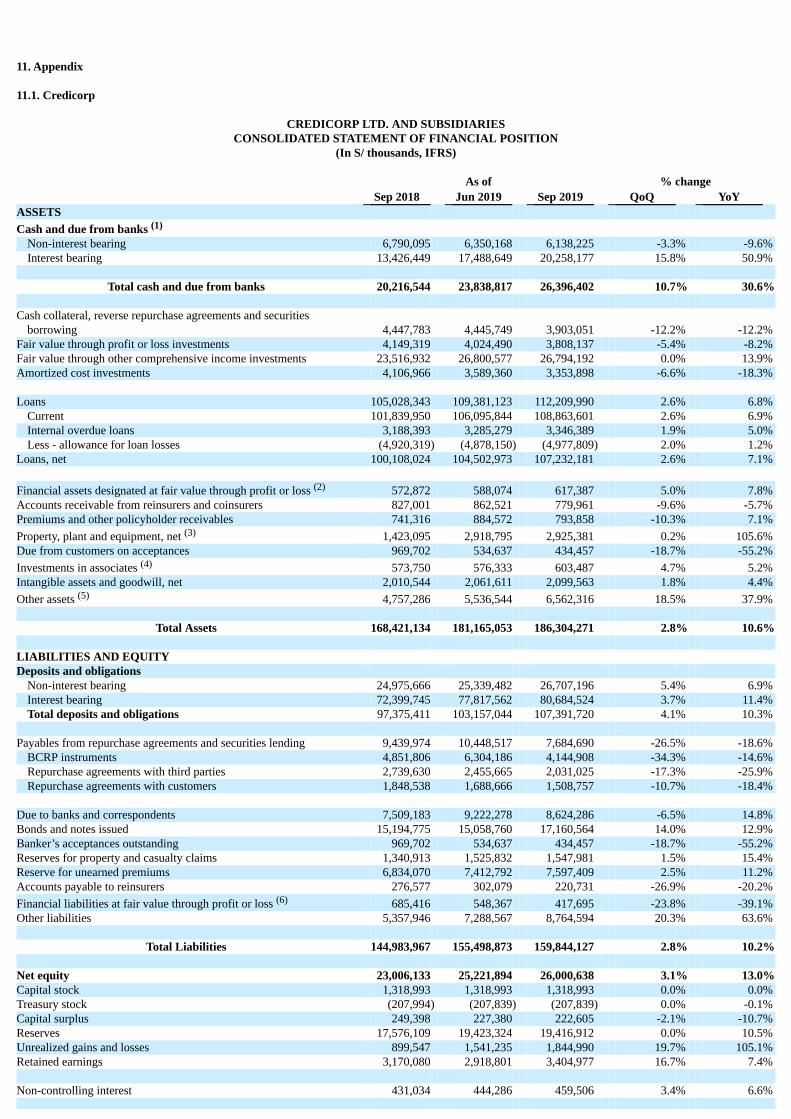
11. Appendix 11.1. Credicorp
CREDICORP LTD. AND SUBSIDIARIESCONSOLIDATED STATEMENT OF FINANCIAL POSITION
(In S/ thousands, IFRS)
As of % change Sep 2018 Jun 2019 Sep 2019 QoQ YoY ASSETS Cash and due from banks (1)
Non-interest bearing 6,790,095 6,350,168 6,138,225 -3.3% -9.6%Interest bearing 13,426,449 17,488,649 20,258,177 15.8% 50.9%
Total cash and due from banks 20,216,544 23,838,817 26,396,402 10.7% 30.6%
Cash collateral, reverse repurchase agreements and securities
borrowing 4,447,783 4,445,749 3,903,051 -12.2% -12.2%Fair value through profit or loss investments 4,149,319 4,024,490 3,808,137 -5.4% -8.2%Fair value through other comprehensive income investments 23,516,932 26,800,577 26,794,192 0.0% 13.9%Amortized cost investments 4,106,966 3,589,360 3,353,898 -6.6% -18.3% Loans 105,028,343 109,381,123 112,209,990 2.6% 6.8%
Current 101,839,950 106,095,844 108,863,601 2.6% 6.9%Internal overdue loans 3,188,393 3,285,279 3,346,389 1.9% 5.0%Less - allowance for loan losses (4,920,319) (4,878,150) (4,977,809) 2.0% 1.2%
Loans, net 100,108,024 104,502,973 107,232,181 2.6% 7.1% Financial assets designated at fair value through profit or loss (2) 572,872 588,074 617,387 5.0% 7.8%Accounts receivable from reinsurers and coinsurers 827,001 862,521 779,961 -9.6% -5.7%Premiums and other policyholder receivables 741,316 884,572 793,858 -10.3% 7.1%Property, plant and equipment, net (3) 1,423,095 2,918,795 2,925,381 0.2% 105.6%Due from customers on acceptances 969,702 534,637 434,457 -18.7% -55.2%Investments in associates (4) 573,750 576,333 603,487 4.7% 5.2%Intangible assets and goodwill, net 2,010,544 2,061,611 2,099,563 1.8% 4.4%Other assets (5) 4,757,286 5,536,544 6,562,316 18.5% 37.9%
Total Assets 168,421,134 181,165,053 186,304,271 2.8% 10.6%
LIABILITIES AND EQUITY Deposits and obligations
Non-interest bearing 24,975,666 25,339,482 26,707,196 5.4% 6.9%Interest bearing 72,399,745 77,817,562 80,684,524 3.7% 11.4%Total deposits and obligations 97,375,411 103,157,044 107,391,720 4.1% 10.3%
Payables from repurchase agreements and securities lending 9,439,974 10,448,517 7,684,690 -26.5% -18.6%
BCRP instruments 4,851,806 6,304,186 4,144,908 -34.3% -14.6%Repurchase agreements with third parties 2,739,630 2,455,665 2,031,025 -17.3% -25.9%Repurchase agreements with customers 1,848,538 1,688,666 1,508,757 -10.7% -18.4%
Due to banks and correspondents 7,509,183 9,222,278 8,624,286 -6.5% 14.8%Bonds and notes issued 15,194,775 15,058,760 17,160,564 14.0% 12.9%Banker’s acceptances outstanding 969,702 534,637 434,457 -18.7% -55.2%Reserves for property and casualty claims 1,340,913 1,525,832 1,547,981 1.5% 15.4%Reserve for unearned premiums 6,834,070 7,412,792 7,597,409 2.5% 11.2%Accounts payable to reinsurers 276,577 302,079 220,731 -26.9% -20.2%Financial liabilities at fair value through profit or loss (6) 685,416 548,367 417,695 -23.8% -39.1%Other liabilities 5,357,946 7,288,567 8,764,594 20.3% 63.6%
Total Liabilities 144,983,967 155,498,873 159,844,127 2.8% 10.2%
Net equity 23,006,133 25,221,894 26,000,638 3.1% 13.0%Capital stock 1,318,993 1,318,993 1,318,993 0.0% 0.0%Treasury stock (207,994) (207,839) (207,839) 0.0% -0.1%Capital surplus 249,398 227,380 222,605 -2.1% -10.7%Reserves 17,576,109 19,423,324 19,416,912 0.0% 10.5%Unrealized gains and losses 899,547 1,541,235 1,844,990 19.7% 105.1%Retained earnings 3,170,080 2,918,801 3,404,977 16.7% 7.4% Non-controlling interest 431,034 444,286 459,506 3.4% 6.6%

Total Net Equity 23,437,167 25,666,180 26,460,144 3.1% 12.9%
Total liabilities and equity 168,421,134 181,165,053 186,304,271 2.8% 10.6% Off-balance sheet 120,784,835 125,418,778 133,337,813 6.3% 10.4%Total performance bonds, stand-by and L/Cs. 18,723,556 19,666,170 20,416,414 3.8% 9.0%Undrawn credit lines, advised but not committed 74,633,738 76,368,545 80,887,384 5.9% 8.4%Total derivatives (notional) and others 27,427,541 29,384,063 32,034,015 9.0% 16.8% (1) The amounts differ from those previously reported in 2018 period, due to the reclassification to the item "Cash collateral, reverse repurchase agreementsand securities borrowing" mainly for the cash collateral in dollars delivered to the BCRP, previously presented in the item "Cash and due from banks".(2) In the 2019 period, this item was opened in the statement of financial position; previously presented under the item "Investments at fair value throughprofit or loss".(3) The amounts differ from those previously reported in 2018 period, due to the reclassification of the expenses on improvements in building for rent,previously presented in the item “Other assets”. Likewise, in the period 2019, the asset for the right to use the lease contracts was incorporated, in applicationof IFRS 16.(4) Includes investments in associates, mainly Banmedica and Visanet, among others.(5) Includes mainly accounts receivables from brokerage and others.(6) In the 2019 period, this item was opened in the statement of financial position; previously presented in the item "Other liabilities".
52
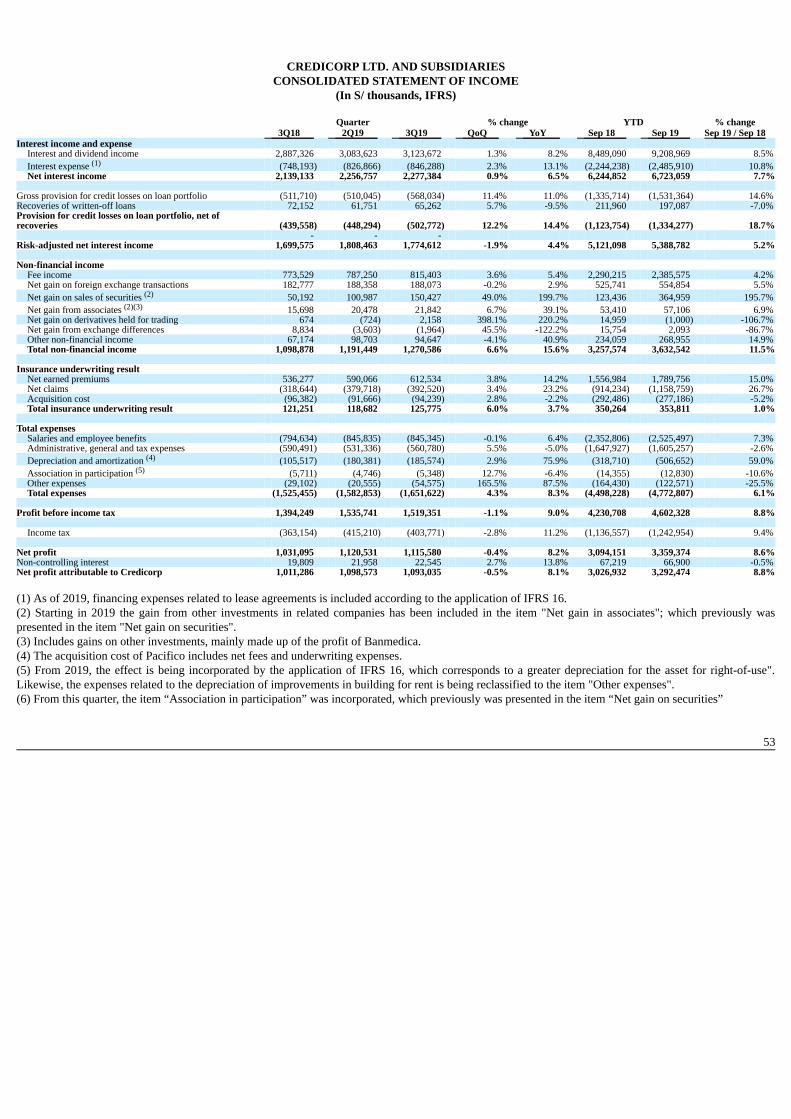
CREDICORP LTD. AND SUBSIDIARIES
CONSOLIDATED STATEMENT OF INCOME(In S/ thousands, IFRS)
Quarter % change YTD % change 3Q18 2Q19 3Q19 QoQ YoY Sep 18 Sep 19 Sep 19 / Sep 18
Interest income and expense Interest and dividend income 2,887,326 3,083,623 3,123,672 1.3% 8.2% 8,489,090 9,208,969 8.5%Interest expense (1) (748,193) (826,866) (846,288) 2.3% 13.1% (2,244,238) (2,485,910) 10.8%Net interest income 2,139,133 2,256,757 2,277,384 0.9% 6.5% 6,244,852 6,723,059 7.7%
Gross provision for credit losses on loan portfolio (511,710) (510,045) (568,034) 11.4% 11.0% (1,335,714) (1,531,364) 14.6%Recoveries of written-off loans 72,152 61,751 65,262 5.7% -9.5% 211,960 197,087 -7.0%Provision for credit losses on loan portfolio, net ofrecoveries (439,558) (448,294) (502,772) 12.2% 14.4% (1,123,754) (1,334,277) 18.7%
- - - Risk-adjusted net interest income 1,699,575 1,808,463 1,774,612 -1.9% 4.4% 5,121,098 5,388,782 5.2%
Non-financial income
Fee income 773,529 787,250 815,403 3.6% 5.4% 2,290,215 2,385,575 4.2%Net gain on foreign exchange transactions 182,777 188,358 188,073 -0.2% 2.9% 525,741 554,854 5.5%Net gain on sales of securities (2) 50,192 100,987 150,427 49.0% 199.7% 123,436 364,959 195.7%Net gain from associates (2)(3) 15,698 20,478 21,842 6.7% 39.1% 53,410 57,106 6.9%Net gain on derivatives held for trading 674 (724) 2,158 398.1% 220.2% 14,959 (1,000) -106.7%Net gain from exchange differences 8,834 (3,603) (1,964) 45.5% -122.2% 15,754 2,093 -86.7%Other non-financial income 67,174 98,703 94,647 -4.1% 40.9% 234,059 268,955 14.9%Total non-financial income 1,098,878 1,191,449 1,270,586 6.6% 15.6% 3,257,574 3,632,542 11.5%
Insurance underwriting result Net earned premiums 536,277 590,066 612,534 3.8% 14.2% 1,556,984 1,789,756 15.0%Net claims (318,644) (379,718) (392,520) 3.4% 23.2% (914,234) (1,158,759) 26.7%Acquisition cost (96,382) (91,666) (94,239) 2.8% -2.2% (292,486) (277,186) -5.2%Total insurance underwriting result 121,251 118,682 125,775 6.0% 3.7% 350,264 353,811 1.0%
Total expenses Salaries and employee benefits (794,634) (845,835) (845,345) -0.1% 6.4% (2,352,806) (2,525,497) 7.3%Administrative, general and tax expenses (590,491) (531,336) (560,780) 5.5% -5.0% (1,647,927) (1,605,257) -2.6%Depreciation and amortization (4) (105,517) (180,381) (185,574) 2.9% 75.9% (318,710) (506,652) 59.0%Association in participation (5) (5,711) (4,746) (5,348) 12.7% -6.4% (14,355) (12,830) -10.6%Other expenses (29,102) (20,555) (54,575) 165.5% 87.5% (164,430) (122,571) -25.5%Total expenses (1,525,455) (1,582,853) (1,651,622) 4.3% 8.3% (4,498,228) (4,772,807) 6.1%
Profit before income tax 1,394,249 1,535,741 1,519,351 -1.1% 9.0% 4,230,708 4,602,328 8.8% Income tax (363,154) (415,210) (403,771) -2.8% 11.2% (1,136,557) (1,242,954) 9.4%
Net profit 1,031,095 1,120,531 1,115,580 -0.4% 8.2% 3,094,151 3,359,374 8.6%Non-controlling interest 19,809 21,958 22,545 2.7% 13.8% 67,219 66,900 -0.5%Net profit attributable to Credicorp 1,011,286 1,098,573 1,093,035 -0.5% 8.1% 3,026,932 3,292,474 8.8% (1) As of 2019, financing expenses related to lease agreements is included according to the application of IFRS 16.(2) Starting in 2019 the gain from other investments in related companies has been included in the item "Net gain in associates"; which previously waspresented in the item "Net gain on securities".(3) Includes gains on other investments, mainly made up of the profit of Banmedica.(4) The acquisition cost of Pacifico includes net fees and underwriting expenses.(5) From 2019, the effect is being incorporated by the application of IFRS 16, which corresponds to a greater depreciation for the asset for right-of-use".Likewise, the expenses related to the depreciation of improvements in building for rent is being reclassified to the item "Other expenses".(6) From this quarter, the item “Association in participation” was incorporated, which previously was presented in the item “Net gain on securities”
53

11.2. BCP Consolidated
BANCO DE CREDITO DEL PERU AND SUBSIDIARIESCONSOLIDATED STATEMENT OF FINANCIAL POSITION
(In S/ thousands, IFRS) As of % change Sep 2018 Jun 2019 Sep 2019 QoQ YoY ASSETS Cash and due from banks
Non-interest bearing 5,579,636 5,039,035 4,778,987 -5.2% -14.3%Interest bearing 13,063,804 16,660,085 19,146,069 14.9% 46.6%Total cash and due from banks 18,643,440 21,699,120 23,925,056 10.3% 28.3%
Cash collateral, reverse repurchase agreements and
securities borrowing 3,286,785 3,255,249 2,969,737 -8.8% -9.6% Fair value through profit or loss investments 350,710 516,973 182,957 -64.6% -47.8%Fair value through other comprehensive income
investments 12,310,693 15,626,554 14,934,297 -4.4% 21.3%Amortized cost investments 3,799,355 3,347,118 3,293,125 -1.6% -13.3% Loans 95,616,875 99,791,392 102,338,510 2.6% 7.0%
Current 92,568,501 96,649,966 99,151,976 2.6% 7.1%Internal overdue loans 3,048,374 3,141,426 3,186,534 1.4% 4.5%Less - allowance for loan losses (4,684,448) (4,637,969) (4,734,401) 2.1% 1.1%
Loans, net 90,932,427 95,153,423 97,604,109 2.6% 7.3% Property, furniture and equipment, net (1) 1,234,451 2,662,063 2,670,154 0.3% 116.3%Due from customers on acceptances 969,702 534,637 434,457 -18.7% -55.2%Other assets (2) 3,709,396 4,638,680 5,195,664 12.0% 40.1%
Total Assets 135,236,959 147,433,817 151,209,556 2.6% 11.8% Liabilities and Equity Deposits and obligations
Non-interest bearing 22,012,074 23,243,024 24,483,137 5.3% 11.2%Interest bearing 63,902,968 69,210,922 71,620,420 3.5% 12.1%Total deposits and obligations 85,915,042 92,453,946 96,103,557 3.9% 11.9%
Payables from repurchase agreements and securities
lending 6,753,204 8,019,941 5,721,581 -28.7% -15.3%BCRP instruments 4,851,805 6,304,186 4,144,908 -34.3% -14.6%Repurchase agreements with third parties 1,901,399 1,715,756 1,576,673 -8.1% -17.1%
Due to banks and correspondents 7,666,566 9,280,977 8,714,198 -6.1% 13.7%Bonds and notes issued 14,450,969 14,429,601 16,546,780 14.7% 14.5%Banker’s acceptances outstanding 969,702 534,637 434,457 -18.7% -55.2%Financial liabilities at fair value through profit or loss 52,641 70,459 13,977 -80.2% -73.4%Other liabilities (3) 3,111,909 4,990,667 5,542,036 11.0% 78.1%
Total Liabilities 118,920,033 129,780,228 133,076,586 2.5% 11.9%
Net equity 16,177,667 17,539,343 18,013,914 2.7% 11.4%Capital stock 8,476,984 9,924,006 9,924,006 0.0% 17.1%Reserves 3,965,447 4,476,256 4,476,256 0.0% 12.9%Unrealized gains and losses 49,695 235,391 296,915 26.1% 497.5%Retained earnings 3,685,541 2,903,690 3,316,737 14.2% -10.0%
Non-controlling interest 139,259 114,246 119,056 4.2% -14.5%
Total Net Equity 16,316,926 17,653,589 18,132,970 2.7% 11.1%
Total liabilities and equity 135,236,959 147,433,817 151,209,556 2.6% 11.8% Off-balance sheet 109,893,890 112,550,680 119,919,107 6.5% 9.1%Total performance bonds, stand-by and L/Cs. 17,051,392 17,678,879 18,482,396 4.5% 8.4%Undrawn credit lines, advised but not committed 66,950,168 67,316,327 70,846,512 5.2% 5.8%Total derivatives (notional) and others 25,892,330 27,555,474 30,590,199 11.0% 18.1% (1) The amounts differ from those previously reported due to the reclassification of the expenses on improvements in building for rent, previously presentedin the item “Other assets”. Likewise, in the 2019 the asset is incorporated for the right to use the lease contracts, in application of the IFRS 16.(2) Mainly includes intangible assets, other receivable accounts and tax credit.(3) Mainly includes other payable accounts.

54

BANCO DE CREDITO DEL PERU AND SUBSIDIARIES
CONSOLIDATED STATEMENT OF INCOME(In S/ thousands, IFRS)
Quarter % change YTD % change 3Q18 2Q19 3Q19 QoQ YoY Sep 18 Sep 19 Sep 19 / Sep 18
Interest income and expense Interest and dividend income 2,553,311 2,727,447 2,780,173 1.9% 8.9% 7,527,500 8,163,835 8.5%Interest expense (1) (647,701) (720,654) (737,099) 2.3% 13.8% (1,948,132) (2,169,868) 11.4%Net interest income 1,905,610 2,006,793 2,043,074 1.8% 7.2% 5,579,368 5,993,967 7.4%
Provision for credit losses on loan portfolio (494,089) (494,492) (557,416) 12.7% 12.8% (1,294,212) (1,489,122) 15.1%Recoveries of written-off loans 71,616 60,861 64,728 6.4% -9.6% 209,628 195,425 -6.8%Provision for credit losses on loan portfolio, net ofrecoveries (422,473) (433,631) (492,688) 13.6% 16.6% (1,084,584) (1,293,697) 19.3%
Risk-adjusted net interest income 1,483,137 1,573,162 1,550,386 -1.4% 4.5% 4,494,784 4,700,270 4.6%
Non-financial income
Fee income 624,494 635,782 661,070 4.0% 5.9% 1,835,021 1,929,178 5.1%Net gain on foreign exchange transactions 174,330 184,131 184,383 0.1% 5.8% 500,951 538,533 7.5%Net gain on securities 1,405 20,431 85,506 318.5% 5985.8% 9,028 111,807 1138.4%Net gain on derivatives held for trading (7,316) 12,918 2,762 -78.6% -137.8% (4,546) 28,350 -723.6%Net gain from exchange differences 6,838 952 (4,515) -574.3% -166.0% 20,204 1,469 -92.7%Others 58,706 47,128 75,755 60.7% 29.0% 186,895 173,668 -7.1%Total other income 858,457 901,342 1,004,961 11.5% 17.1% 2,547,553 2,783,005 9.2%
Total expenses Salaries and employee benefits (606,897) (638,802) (638,819) 0.0% 5.3% (1,784,525) (1,904,389) 6.7%Administrative expenses (474,723) (413,990) (448,657) 8.4% -5.5% (1,304,761) (1,247,360) -4.4%Depreciation and amortization (2) (80,584) (149,447) (151,466) 1.4% 88.0% (243,668) (417,322) 71.3%Other expenses (33,057) (27,943) (39,504) 41.4% 19.5% (143,900) (98,540) -31.5%Total expenses (1,195,261) (1,230,182) (1,278,446) 3.9% 7.0% (3,476,854) (3,667,611) 5.5%
Profit before income tax 1,146,333 1,244,322 1,276,901 2.6% 11.4% 3,565,483 3,815,664 7.0%Income tax (311,995) (335,202) (326,799) -2.5% 4.7% (988,689) (1,018,887) 3.1%
Net profit 834,338 909,120 950,102 4.5% 13.9% 2,576,794 2,796,777 8.5%Non-controlling interest (4,563) (4,844) (4,729) -2.4% 3.6% (18,372) (14,504) -21.1%Net profit attributable to BCP Consolidated 829,775 904,276 945,373 4.5% 13.9% 2,558,422 2,782,273 8.7% (1) As of 2019, financing expenses related to lease agreements is included according to the application of IFRS 16.(2) From this quarter, the effect is being incorporated by the application of IFRS 16, which corresponds to a greater depreciation for the asset for right-of-use". Likewise, the expenses related to the depreciation of improvements in building for rent is being reclassified to the item "Other expenses".
55

BANCO DE CREDITO DEL PERU AND SUBSIDIARIES
SELECTED FINANCIAL INDICATORS Quarter YTD 3Q18 2Q19 3Q19 Sep 18 Sep 19 Profitability Earnings per share (1) 0.081 0.089 0.093 0.250 0.272 ROAA(2)(3) 2.5% 2.5% 2.5% 5.7% 5.8%ROAE(2)(3) 21.1% 21.2% 21.3% 21.6% 21.2%Net interest margin (2)(3) 5.93% 5.82% 5.79% 5.67% 5.72%Risk adjusted NIM (2)(3) 4.62% 4.56% 4.40% 4.57% 4.54%Funding Cost (2)(3)(4) 2.25% 2.38% 2.35% 2.21% 2.31% Quality of loan portfolio IOL ratio 3.19% 3.15% 3.11% 3.19% 3.11%NPL ratio 4.39% 4.34% 4.29% 4.39% 4.29%Coverage of IOLs 153.7% 147.6% 148.6% 153.7% 148.6%Coverage of NPLs 111.5% 107.1% 107.8% 111.5% 107.8%Cost of risk (5) 1.77% 1.74% 1.93% 1.51% 1.69% Operating efficiency Oper. expenses as a percent. of total income - reported (6) 43.0% 42.3% 42.9% 42.0% 42.0%Oper. expenses as a percent. of total income - including all
other items 43.2% 42.3% 41.9% 42.8% 41.8%Oper. expenses as a percent. of av. tot. assets (2)(3)(6) 3.45% 3.29% 3.32% 3.23% 3.22% Capital adequacy (7) Total regulatory capital (S/ Million) 17,493 19,138 20,149 17,493 20,149 Tier 1 capital (S/ Million) (8) 12,831 14,504 15,371 12,831 15,371 Common equity tier 1 ratio (9) 11.61% 11.82% 11.95% 11.61% 11.95%BIS ratio (10) 14.94% 14.95% 15.45% 14.94% 15.45% Share Information N° of outstanding shares (Million) 10,217 10,217 10,217 10,217.39 10,217.39 (1) Shares outstanding of 10,217 million is used for all periods since shares have been issued only for capitalization of profits.(2) Ratios are annualized.(3) Averages are determined as the average of period-beginning and period-ending balances.(4) The funding costs differs from previously reported due to a methodoloy change in the denominator, which no longer includes the following accounts:acceptances outstanding, reserves for property and casualty claims, reserve for unearned premiums, reinsurance payable and other liabilities.(5) Cost of risk: Annualized provision for loan losses / Total loans.(6) Total income includes net interest income, fee income, net gain on foreign exchange transactions, result on exchange difference and net gain onderivatives. Operating expenses includes Salaries and social benefits, administrative, general and tax expenses and depreciation and amortization.(7) All capital ratios are for BCP Stand-alone and based on Peru GAAP(8) Tier 1 = Capital + Legal and other capital reserves + Accumulated earnings with capitalization agreement + Unrealized profit and net income insubsidiaries - Goodwill - (0.5 x Investment in subsidiaries) + Perpetual subordinated debt (maximum amount that can be included is 17.65% of Capital +Reserves + Accumulated earnings with capitalization agreement + Unrealized profit and net income in subsidiaries - Goodwill).(9) Common Equity Tier I = Capital + Reserves – 100% of applicable deductions (investment in subsidiaries, goodwill, intangibles and net deferred taxes thatrely on future profitability) + retained earnings + unrealized gains.(10) Regulatory capital/ risk-weighted assets. Risk weighted assets include market risk and operational risk.
56

11.3. Mibanco
MIBANCO (1)
(In S/ thousands, IFRS)
As of % change Sep 18 Jun 19 Sep 19 QoQ YoY
ASSETS Cash and due from banks 922,284 1,021,867 1,138,736 11.4% 23.5% Investments 2,008,445 1,807,917 1,608,428 -11.0% -19.9% Total loans 9,785,229 10,256,643 10,348,630 0.9% 5.8%
Current 9,133,812 9,591,920 9,680,999 0.9% 6.0% Internal overdue loans 531,585 548,278 560,695 2.3% 5.5% Refinanced 119,832 116,445 106,936 -8.2% -10.8% Allowance for loan losses -913,037 -909,004 -925,705 1.8% 1.4%
Net loans 8,872,192 9,347,640 9,422,925 0.8% 6.2% Property, plant and equipment, net 174,951 187,951 177,728 -5.4% 1.6% Other assets 593,853 840,950 902,204 7.3% 51.9%
Total assets 12,571,725 13,206,324 13,250,021 0.3% 5.4%
LIABILITIES AND NETSHAREHOLDERS’ EQUITY
Deposits and obligations 8,135,187 8,216,878 8,279,992 0.8% 1.8% Due to banks and correspondents 1,592,198 1,823,461 1,920,244 5.3% 20.6% Bonds and subordinated debt 367,867 263,613 175,534 -33.4% -52.3% Other liabilities 552,644 867,815 740,737 -14.6% 34.0%
Total liabilities 10,647,896 11,171,768 11,116,507 -0.5% 4.4%
Net equity 1,923,829 2,034,557 2,133,514 4.9% 10.9% TOTAL LIABILITIES AND
NET SHAREHOLDERS’EQUITY 12,571,725 13,206,324 13,250,021 0.3% 5.4%
Quarter % change YTD % change 3Q18 2Q19 3Q19 QoQ YoY Sep 18 Sep 19 Sep 19 / Sep 18
Net interest income 495,385 473,889 478,189 0.9% -3.5% 1,471,557 1,420,019 -3.5%Provision for loan losses, net of
recoveries -138,001 -105,550 -115,458 9.4% -16.3% -319,814 -311,500 -2.6%Net interest income after
provisions 357,384 368,339 362,731 -1.5% 1.5% 1,151,742 1,108,519 -3.8%Non-financial income 26,589 43,129 42,400 -1.7% 59.5% 115,801 130,540 12.7%Total expenses -240,347 -273,032 -267,903 -1.9% 11.5% -768,770 -821,331 6.8%Translation result - - - 0.0% 0.0% - - 0.0%Income taxes -38,868 -39,294 -39,895 1.5% 2.6% -138,725 -119,344 -14.0%Net income 104,758 99,142 97,332 -1.8% -7.1% 360,049 298,384 -17.1% Efficiency ratio 45.4% 52.3% 50.7% -160 bps 530 bps 47.5% 52.5% 500 bps ROAE 22.4% 20.0% 18.7% -130 bps -370 bps 26.5% 19.7% -680 bps ROAE incl. goow dill 20.8% 18.6% 17.5% -110 bps -330 bps 24.8% 18.4% -640 bps L/D ratio 120.3% 124.8% 125.0% 20 bps 470 bps IOL ratio 5.4% 5.3% 5.4% 10 bps 0 bps NPL ratio 6.7% 6.5% 6.5% 0 bps -20 bps Coverage of IOLs 171.8% 165.8% 165.1% -70 bps 670 bps Coverage of NPLs 140.2% 136.7% 138.7% 200 bps -150 bps Branches (2) 326 324 324 - -2 Employees 10,087 11,545 11,355 -190 1,268 (1) Figures differ from previously reported, please consider the data presented on this report.(2) Includes Banco de la Nacion branches, which in September 18 were 38, in June 19 were 35 and in September 19 were 35.
57

11.4. BCP Bolivia
BCP BOLIVIA
(In S/ thousands, IFRS)
As of % change Sep 18 Jun 19 Set 19 QoQ YoY
ASSETS Cash and due from banks 1,131,992 1,437,175 1,458,634 1.5% 28.9% Investments 1,393,722 1,214,420 1,293,203 6.5% -7.2% Total loans 7,059,563 7,277,055 7,653,370 5.2% 8.4%
Current 6,903,039 7,115,507 7,479,263 5.1% 8.3% Internal overdue loans 136,115 139,487 155,533 11.5% 14.3% Refinanced 20,408 22,061 18,573 -15.8% -9.0% Allowance for loan losses -226,682 -231,814 -235,398 1.5% 3.8%
Net loans 6,832,881 7,045,241 7,417,972 5.3% 8.6% Property, plant and equipment, net 77,069 45,862 49,972 9.0% -35.2% Other assets 91,372 101,709 113,729 11.8% 24.5%
Total assets 9,527,036 9,844,408 10,333,511 5.0% 8.5%
LIABILITIES AND NETSHAREHOLDERS’ EQUITY
Deposits and obligations 8,457,011 8,589,045 8,985,603 4.6% 6.3% Due to banks and correspondents 30,026 27,151 29,501 8.7% -1.8% Bonds and subordinated debt 102,925 102,966 105,678 2.6% 2.7% Other liabilities 272,694 434,668 478,255 10.0% 75.4%
Total liabilities 8,862,656 9,153,830 9,599,036 4.9% 8.3%
Net equity 664,380 690,579 734,474 6.4% 10.6% TOTAL LIABILITIES AND
NET SHAREHOLDERS’EQUITY 9,527,036 9,844,408 10,333,511 5.0% 8.5%
Quarter % change YTD % change 3Q18 2Q19 3Q19 QoQ YoY Sep 18 Sep 19 Sep 19 / Sep 18
Net interest income 82,737 81,048 84,321 4.0% 1.9% 227,113 243,063 7.0%Provision for loan losses, net of
recoveries -15,325 -13,459 -8,866 -34.1% -42.1% -35,270 -36,885 4.6%Net interest income after
provisions 67,412 67,589 75,455 11.6% 11.9% 191,844 206,178 7.5%Non-financial income 22,775 30,232 34,036 12.6% 49.4% 92,846 93,280 0.5%Total expenses -64,798 -60,149 -66,523 10.6% 2.7% -197,570 -199,668 1.1%Translation result -13 -1 -7 N/A -47.7% -169 -14 -91.6%Income taxes -10,016 -10,864 -17,386 60.0% 73.6% -31,566 -34,755 10.1%Net income 15,360 26,807 25,575 -4.6% 66.5% 55,384 65,021 17.4% Efficiency ratio (1) 60.2% 61.7% 56.8% -490 bps -340 bps 62.6% 60.0% -260 pbs ROAE 9.5% 15.8% 14.4% -140 bps 489 bps 11.4% 12.2% 81 pbs L/D ratio 83.5% 84.7% 85.2% 50 bps 169 bps IOL ratio 1.93% 1.92% 2.03% 10 bps 10 bps NPL ratio 2.22% 2.22% 2.27% 10 bps 5 bps Coverage of IOLs 166.5% 166.2% 151.3% -1490 bps -1519 bps Coverage of NPLs 144.8% 143.5% 135.2% -830 bps -962 bps Branches 54 56 56 0 2 Agentes 318 388 438 50 120 ATMs (1) 278 300 303 3 25 Employees 1,732 1,729 1,723 -6 -9
(1) Figures differ from previously reported, please consider the data presented on this report.
58

11.5. Credicorp Capital Credicorp Capital Quarter YTD % change S/ 000 3Q18 2Q19 3Q19 Sep 18 Sep 19 Sep 19 / Sep 18 Net interest income -12,189 -6,206 -9,271 -33,166 -24,568 -25.9%Non-financial income 141,301 139,041 141,907 433,200 432,637 -0.1%
Fee income 95,200 90,644 96,586 299,443 281,880 -5.9%Net gain on foreign exchange transactions 8,414 9,041 11,469 23,768 30,635 28.9%Net gain on sales of securities 27,379 47,452 32,455 84,681 130,392 54.0%Derivative result 7,396 -13,806 123 18,819 -29,153 -254.9%Result from exposure to the exchange rate 1,108 -1,075 389 -5,407 1,002 -118.5%Other income 1,804 6,785 885 11,896 17,881 50.3%Operating expenses (1) -102,396 -118,246 -114,119 -328,035 -354,642 8.1%
Operating income 26,716 14,589 18,517 71,999 53,427 -25.8%Income taxes -8,766 -3,394 -5,559 -21,395 -13,703 -36.0%Non-controlling interest -180 -372 52 -631 -472 -25.2%Net income 17,770 10,823 13,010 49,973 39,252 -21.5% * Unaudited results.(1) Includes: Salaries and employee’s benefits + Administrative expenses + Assigned expenses + Depreciation and amortization + Tax and contributions +Other expenses
59

11.6. Atlantic Security Bank ASB Quarter % change US$ Millions 3Q18 2Q19 3Q19 QoQ YoY Total loans 766.4 736.2 732.6 -0.5% -4.4%Total investments 1,018.7 808.4 733.6 -9.3% -28.0%Total assets 1,921.0 1,920.0 1,991.8 3.7% 3.7%Total deposits 1,367.3 1,267.4 1,277.5 0.8% -6.6%Net shareholder’s equity 238.1 248.4 264.5 6.5% 11.1%Net income 10.7 15.2 12.9 -15.2% 21.1% Interest earning assets Interest earning assets* Quarter % change US$ 000 3Q18 2Q19 3Q19 QoQ YoY Due from banks 73 142 157 10.5% 114.3%Total loans 766 736 733 -0.5% -4.4%Investments 986 751 687 -8.5% -30.3%Total interest earning assets 1,826 1,629 1,576 -3.2% -13.6% * Excludes investments in equities and mutual funds. Liabilities Liabilities Quarter % change US$ 000 3Q18 2Q19 3Q19 QoQ YoY Deposits 1,367 1,267 1,278 0.8% -6.6%Borrowed Funds 272 228 83 -63.6% -69.5%Other liabilities 44 176 367 108.0% 739.2%Total liabilities 1,683 1,672 1,727 3.3% 2.6%
60

Assets under management and Deposits
(US$ Millions)
(1) Figures in 2Q19 differ from previously reported.
Portfolio distribution as of September 2019
61

11.7. Grupo Pacífico
GRUPO PACIFICO *(S/ in thousands)
As of % change Sep 18 Jun 19 Sep 19 QoQ YoY Total assets 11,965,692 13,154,757 13,640,680 3.7% 14.0% Invesment on securities (1) 8,846,602 9,642,535 10,331,786 7.1% 16.8% Technical reserves 8,183,706 8,946,136 9,151,080 2.3% 11.8% Net equity 2,596,213 3,097,078 3,423,666 10.5% 31.9% Quarter % change YTD % change 3Q18 2Q19 3Q19 QoQ YoY Sep 18 Sep 19 Sep 19 / Sep 18 Net earned premiums 538,742 592,546 615,145 3.8% 14.2% 1,563,448 1,796,633 14.9%Net claims 318,645 379,718 392,520 3.4% 23.2% 914,235 1,158,759 26.7%Net fees 141,979 138,357 147,821 6.8% 4.1% 424,756 420,685 -1.0%Net underwriting expenses 28,767 33,761 30,293 -10.3% 5.3% 95,244 101,065 6.1%Underwriting result 49,351 40,710 44,512 9.3% -9.8% 129,213 116,123 -10.1% Net financial income 142,449 150,249 126,226 -16.0% -11.4% 382,118 419,831 9.9% Total expenses 93,601 107,614 104,421 -3.0% 11.6% 302,129 319,486 5.7% Other income -6,779 8,772 14,208 62.0% -309.6% 14,086 30,079 113.5%Traslations results 1,547 -478 1,621 -439.4% 4.8% 3,949 643 -83.7%Net gain on associates - EPS business and
medical services 10,686 12,758 14,702 15.2% 37.6% 22,867 23,548 3.0%Medical Assistance insurance deduction 5,711 4,746 5,348 12.7% -6.4% 14,355 12,830 -10.6%Income tax -487 1,359 1,491 9.8% -406.2% 3,567 4,367 22.4% Income before minority interest 98,429 98,293 90,008 -8.4% -8.6% 246,537 266,371 8.0%Non-controlling interest 2,590 2,454 2,525 2.9% -2.5% 6,964 7,571 8.7% Net income 95,839 95,839 87,482 -8.7% -8.7% 239,573 258,800 8.0% Ratios Ceded 16.3% 18.5% 14.4% -410 bps -190 bps 14.7% 15.1% 40 bps Loss ratio (2) 59.1% 64.1% 63.8% -30 bps 470 bps 58.5% 64.5% 600 bps Fees + underwriting expenses, net / net earned
premiums 31.7% 29.0% 29.0% 0 bps -270 bps 33.3% 29.0% -430 bps Underwriting results / net earned premiums 9.2% 6.9% 7.2% 30 bps -200 bps 8.3% 6.5% -180 bps Operating expenses / net earned premiums 17.4% 18.2% 17.0% -120 bps -40 bps 19.3% 17.8% -150 bps ROAE (3)(4) 15.5% 13.7% 11.0% -270 bps -450 bps 12.1% 11.8% -30 bps Return on written premiums 11.0% 10.2% 10.1% -10 bps -90 bps 9.6% 9.6% 0 bps Combined ratio of P&C (5) 96.5% 97.5% 97.9% 40 bps 140 bps 100.3% 99.8% -50 bps *Financial statements without consolidation adjustments.(1) Excluding investments in real estate.(2) Net claims / Net earned premiums.(3) Includes unrealized gains.(4) Annualized and average are determined as the average of period beginning and period ending.(5) (Net claims / Net earned premiums) + [(Acquisition cost + total expenses) / Net earned premiums]. From 1Q15 and on, Grupo Pacifico’s financial statements reflect the association with Banmedica. This partnership includes:
(i) the private health insurance business, which is managed by Grupo Pacifico and incorporated in each line of Grupo Pacifico’s financialstatements;
(ii) corporate health insurance for payroll employees; and (iii) medical services.
The businesses described in ii) and iii) are managed by Banmedica, therefore they do not consolidate in Grupo Pacifico’s financial statements. The 50% ofnet income generated by Banmedica is recorded in Grupo Pacifico’s Income Statement as a gain/loss on investments in subsidiaries. As explained before, corporate health insurance and medical services businesses are consolidated by Banmedica. The following table reflects theconsolidated results from which Grupo Pacifico receives the 50% net income.
62

Corporate Health Insurance and Medical Services
(S/ in thousands)
Quarter % change YTD % change 3Q18 2Q19 3Q19 QoQ YoY Set 18 Set 19 Set 19 / Set 18 Results Net earned premiums 255,104 264,725 275,951 4.2% 8.2% 744,745 799,131 7.3%Net claims -220,993 -225,704 -233,949 3.7% 5.9% -623,847 -693,250 11.1%Net fees -11,740 -11,697 -12,365 5.7% 5.3% -33,483 -35,941 7.3%Net underwriting expenses -2,676 -2,492 -2,486 -0.3% -7.1% -8,951 -7,890 -11.9%Underwriting result 19,695 24,832 27,151 9.3% 37.9% 78,464 62,051 -20.9% Net financial income 1,158 1,070 1,612 50.6% 39.2% 3,589 4,187 16.7%Total expenses -18,211 -18,203 -18,352 0.8% 0.8% -54,698 -54,091 -1.1%Other income -164 621 251 -59.5% -253.6% 48 1,884 3793.8%Traslations results 44 -197 1,030 -623.3% N/A 75 817 991.8%Income tax -680 -2,670 -3,716 39.2% 446.6% -9,040 -4,772 -47.2% Net income before Medical services 1,842 5,452 7,976 46.3% 332.9% 18,438 10,076 -45.4% Net income of Medical services 19,448 19,983 21,341 6.8% 9.7% 55,766 62,432 12.0% Net income 21,290 25,435 29,317 15.3% 37.7% 74,204 72,508 -2.3%
63

11.8. Prima AFP Quarter % change YTD % change 3Q18 2Q19 3Q19 QoQ YoY Sep 18 Sep 19 Sep 19 / Sep 18 Income from commissions 94,417 105,867 97,099 -8.3% 2.8% 285,638 302,723 6.0%Administrative and sale expenses (38,229) (38,358) (33,617) -12.4% -12.1% -117,318 -109,267 -6.9%Depreciation and amortization (4,464) (4,725) (8,190) 73.3% 83.5% -14,024 -17,388 24.0%Operating income 51,724 62,783 55,292 -11.9% 6.9% 154,296 176,068 14.1%Other income and expenses, net (profitability of
lace) 6,737 8,108 4,500 -44.5% -33.2% 4,780 30,320 534.3%Income tax (16,811) (20,495) (17,097) -16.6% 1.7% -49,732 -56,421 13.5%Net income before translation results 41,650 50,396 42,695 -15.3% 2.5% 109,344 149,968 37.2%Translations results (175) (29) (301) 952.2% 72.1% -229 -206 -10.2%Net income 41,475 50,367 42,394 -15.8% 2.2% 109,115 149,761 37.3%ROAE 27.6% 33.3% 26.0% -730 bps -160 bps 23.4% 30.6% 720 bps
As of % change Sep 18 Jun 19 Sep 19 QoQ YoY Total assets 854,996 868,192 937,573 8.0% 8.0% Total liabilities 232,544 238,247 265,447 11.4% 11.4% Net shareholders’ equity (1) 622,452 629,945 672,126 6.7% 6.7% (1) Net shareholders' equity includes unrealized gains from Prima's investment portfolio. Funds under management Funds under management Jun 19 % share Sep 19 % share Fund 0 691 1.3% 713 1.4%Fund 1 5,774 11.2% 6,091 11.6%Fund 2 38,467 74.4% 39,303 74.8%Fund 3 6,793 13.1% 6,460 12.3%Total S/ Millions 51,724 100% 52,566 100% Source: SBS Nominal profitability over the last 12 months Jun 19 / Jun 18 Sep 19 / Sep 18 Fund 0 4.0% 4.2%Fund 1 10.2% 12.0%Fund 2 5.6% 7.5%Fund 3 -1.7% -0.8% AFP fees Fee based on flow 1.60% Applied to the affiliates’ monthly remuneration.Mixed fee Flow 0.18% Applied to the affiliates’ monthly remuneration since June 2017. Feb 17- may 17 =0.87%. Balance 1.25%
Applies annualy to the new balance since February 2013 for new affiliates to the system and beginning on June2013 for old affiliates who have chosen this commission scheme.
Main indicators Prima System % share Prima System % share Main indicators and market share 2Q19 2Q19 2Q19 3Q19 3Q19 3Q19Affiliates 2,334,751 7,224,167 32.3% 2,343,978 7,331,986 32.0%New affiliations (1) 68,300 96,917 70.5% - 73,526 0.0%Funds under management (S/ Millions) 51,724 165,755 31.2% 52,566 169,231 31.1%Collections (S/ Millions) (2) 1,337 3,716 36.0% 967 2,898 33.4%Voluntary contributions (S/ Millions) (2) 1000 2,032 49.2% 1,026 2,112 48.6%RAM (S/ Millions) (3) 2,933 7,772 37.7% 2,847 7,478 38.1% Source: SBS (1) As of June 2019, another AFP has the exclusivity of affiliations. August information not available on SBS(2) Information available to august 2019.(3) Prima AFP estimate: Average of aggregated income during the last 4 months, excluding special collections and voluntary contribution fees.
64

11.9. Table of calculations
(1) Averages are determined as the average of period-beginning and period-ending balances.(2) Includes total deposits, due to banks and correspondents, BCRP instruments, repurchase agreements and bonds and notes issued.(3) Does not include Life insurance business.(4) Tier 1 = Capital + Legal and other capital reserves + Accumulated earnings with capitalization agreement + (0.5 x Unrealized profit and net income insubsidiaries) - Goodwill - (0.5 x Investment in subsidiaries) + Perpetual subordinated debt (maximum amount that can be included is 17.65% of Capital +Reserves + Accumulated earnings with capitalization agreement + Unrealized profit and net income in subsidiaries - Goodwill).(5) Includes investment in subsidiaries, goodwill, intangibles and deferred tax that rely on future profitability.
65