credit suiss financial report 3q08
TRANSCRIPT
Financial Report
3Q 08
Financial highlights
in / end of % change in / end of % change
3Q08 2Q08 3Q07 QoQ YoY 9M08 9M07 YoY
Net income (CHF million)
Net income/(loss) (1,261) 1,215 1,302 – – (2,194) 7,220 –
Earnings per share (CHF)
Basic earnings per share (1.22) 1.18 1.27 – – (2.13) 6.86 –
Diluted earnings per share (1.22) 1.12 1.18 – – (2.13) 6.43 –
Return on equity (%)
Return on equity (13.1) 13.2 12.4 – – (7.5) 22.5 –
Core Results (CHF million)
Net revenues 3,109 7,830 6,020 (60) (48) 13,958 28,392 (51)
Provision for credit losses 131 45 4 191 – 327 37 –
Total operating expenses 5,471 6,214 4,733 (12) 16 17,125 19,410 (12)
Income/(loss) before taxes (2,493) 1,571 1,283 – – (3,494) 8,945 –
Core Results statement of income metrics (%)
Cost/income ratio 176.0 79.4 78.6 – – 122.7 68.4 –
Pre-tax income margin (80.2) 20.1 21.3 – – (25.0) 31.5 –
Effective tax rate 50.6 18.9 (2.5) – – 40.6 18.5 –
Net income margin (40.6) 15.5 21.6 – – (15.7) 25.4 –
Assets under management and net new assets (CHF billion)
Assets under management 1,370.0 1,411.9 1,571.3 (3.0) (12.8) 1,370.0 1,571.3 (12.8)
Net new assets 1.5 14.0 (9.7) – – 11.3 60.9 –
Balance sheet statistics (CHF million)
Total assets 1,393,599 1,229,825 1,376,442 13 1 1,393,599 1,376,442 1
Net loans 248,659 234,731 226,959 6 10 248,659 226,959 10
Total shareholders’ equity 39,023 36,848 41,965 6 (7) 39,023 41,965 (7)
Book value per share outstanding (CHF)
Total book value per share 37.47 35.99 41.12 4 (9) 37.47 41.12 (9)
Tangible book value per share 1 26.68 25.84 30.16 3 (12) 26.68 30.16 (12)
Shares outstanding (million)
Common shares issued 1,134.2 1,174.2 1,162.2 (3) (2) 1,134.2 1,162.2 (2)
Treasury shares (92.8) (150.5) (141.6) (38) (34) (92.8) (141.6) (34)
Shares outstanding 1,041.4 1,023.7 1,020.6 2 2 1,041.4 1,020.6 2
Market capitalization
Market capitalization (CHF million) 56,596 52,740 86,576 7 (35) 56,596 86,576 (35)
Market capitalization (USD million) 54,759 50,952 74,290 7 (26) 54,759 74,290 (26)
BIS statistics
Risk-weighted assets (CHF million) 2 308,142 301,817 298,688 2 3 308,142 298,688 3
Tier 1 ratio (%) 2 10.4 10.2 12.0 – – 10.4 12.0 –
Total capital ratio (%) 2 14.6 14.3 15.3 – – 14.6 15.3 –
Number of employees (full-time equivalents)
Number of employees 50,300 49,000 47,200 3 7 50,300 47,200 7
1 Based on tangible shareholders’ equity, which is calculated by deducting goodwill and other intangible assets from total shareholders’ equity. Management believes that the return on
tangible shareholders’ equity is meaningful as it allows consistent measurement of the performance of businesses without regard to whether the businesses were acquired. 2 Under
Basel II from January 1, 2008. Prior periods are reported under Basel I and are therefore not comparable. For further information, refer to IV – Treasury and Risk management – Treasury
management.
Dear shareholders
The financial services sector witnessed unprecedented market
disruption in September and extraordinary changes to the
competitive landscape. These events created a very difficult
operating environment, particularly in investment banking. The
result in Investment Banking reflects further writedowns in our
leveraged finance and structured products businesses and
other losses resulting from the exceptionally adverse trading
conditions in September. This led to an overall net loss for
Credit Suisse in the third quarter of CHF 1.3 billion. While
understandable in the context of a difficult market environ-
ment, this result is clearly disappointing.
Private Banking had strong net revenues, however, pre-tax
income of CHF 789 million was impacted by provisions total-
ing CHF 310 million relating to auction rate securities. The
strong inflow of net new assets of CHF 14.5 billion, compris-
ing CHF 11.3 billion in Wealth Management and CHF 3.2 bil-
lion in our Swiss Corporate & Retail Banking business, under-
scores the trust that clients place in Credit Suisse. While
trading positions in many areas of Investment Banking were
negatively impacted, there was good client activity across
some businesses, including global rates, foreign exchange,
electronic trading and prime services, with the latter benefiting
from substantial new balances. Asset Management recorded a
pre-tax loss of CHF 58 million.
Consistent with our strategy, we will continue to invest in
Private Banking and transform Investment Banking, reducing
our overall risk and diversifying our revenue streams. Our inte-
grated model is well suited to mastering the challenges of the
new, competitive environment. In terms of cross-divisional col-
laboration, we are encouraged to see that integrated bank
activities have contributed CHF 4.0 billion to our revenues this
year to date.
We are very pleased to have reached an agreement with
the Swiss Federal Banking Commission (SFBC) regarding
future capital targets and leverage requirements. In October,
Credit Suisse raised tier 1 capital from a small group of major
investors, the largest participant being Qatar Holding LLC.
This increased our tier 1 capital by approximately CHF 10 bil-
lion, taking the 10.4% tier 1 ratio as of September 30, 2008
to 13.7%, on a pro-forma basis.
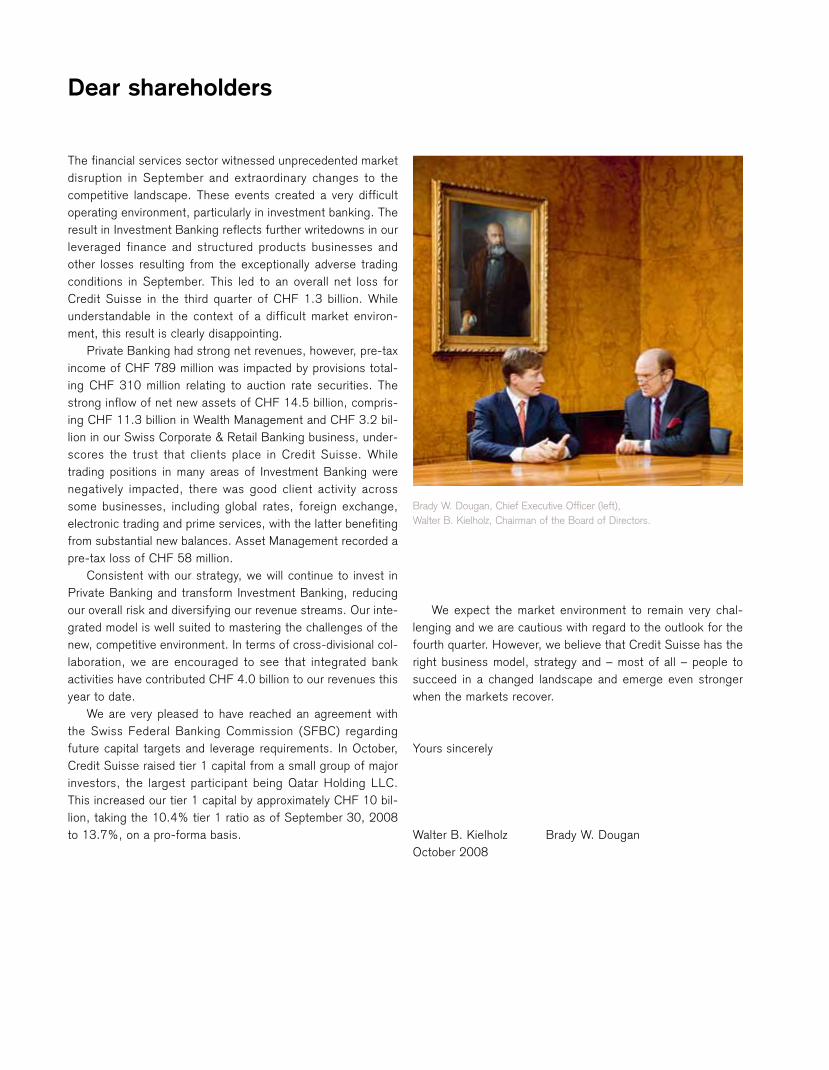
Brady W. Dougan, Chief Executive Officer (left),
Walter B. Kielholz, Chairman of the Board of Directors.
We expect the market environment to remain very chal-
lenging and we are cautious with regard to the outlook for the
fourth quarter. However, we believe that Credit Suisse has the
right business model, strategy and – most of all – people to
succeed in a changed landscape and emerge even stronger
when the markets recover.
Yours sincerely
Walter B. Kielholz Brady W. Dougan
October 2008

[THIS PAGE INTENTIONALLY LEFT BLANK]
Financial Report
3Q 08
For purposes of this report, unless the context otherwise
requires, the terms “Credit Suisse,” “the Group,” “we,” “us”
and “our” mean Credit Suisse Group AG and its consolidated
subsidiaries. The business of Credit Suisse, the Swiss bank
subsidiary of the Group, is substantially similar to the Group,
and we use these terms to refer to both when the subject is
the same or substantially similar. We use the term “the Bank”
when we are only referring to Credit Suisse, the Swiss bank
subsidiary of the Group, and its consolidated subsidiaries.
In various tables, use of “–” indicates not meaningful or not
applicable.
5 Credit Suisse results
6 Operating environment9 Credit Suisse
13 Core Results19 Key performance indicators
47 Overview of Results and
Assets under Management
48 Results50 Assets under Management
53 Treasury and Risk management
54 Treasury management60 Risk management
67 Condensed consolidated
financial statements – unaudited
69 Report of Independent Registered PublicAccounting Firm
71 Condensed consolidated financial statements –unaudited
77 Notes to the condensed consolidated financialstatements – unaudited
109 Investor information
110 Investor information
I
II
III
IV
V
VI
21 Results by division
22 Private Banking24 Wealth Management29 Corporate & Retail Banking32 Investment Banking40 Asset Management

Credit Suisse
Private
Banking
Investment
Banking
Asset
Management
As one of the world’s leading financial services providers, we are com-
mitted to delivering our combined financial experience and expertise to
corporate, institutional and government clients and high-net-worth indi-
viduals worldwide, as well as to retail clients in Switzerland. We serve
our diverse clients through our three divisions, which cooperate closely
to provide holistic financial solutions based on innovative products and
specially tailored advice. Founded in 1856, we have a truly global reach
today, with operations in over 50 countries and a team of around
50,300 employees from approximately 100 different nations.
In Private Banking, we offer comprehensive advice and a broad range
of wealth management solutions, including pension planning, life insur-
ance products, tax planning and wealth and inheritance advice, which
are tailored to the needs of high-net-worth individuals worldwide. In
Switzerland, we supply banking products and services to high-net-
worth, corporate and retail clients.
In Investment Banking, we offer investment banking and securities
products and services to corporate, institutional and government clients
around the world. Our products and services include debt and equity
underwriting, sales and trading, mergers and acquisitions advice,
divestitures, corporate sales, restructuring and investment research.
In Asset Management, we offer integrated investment solutions and
services to institutions, governments and private clients globally. We
provide access to the full range of investment classes, ranging from
equity and fixed income products and multi-asset class solutions to
alternative investments such as private equity, real estate and hedge
funds.
Credit Suisse at a glance
I6 Operating environment
9 Credit Suisse
13 Core Results
19 Key performance indicators
Credit Suisse results
6
Operating environmentThe operating environment in 3Q08 deteriorated significantly from 2Q08, with an unprecedented lack ofliquidity and instability in credit and financial markets and growing concern over the impact of the credit crisison the global economy.
Economic environment
There was an extremely sharp deterioration in credit and finan-
cial markets in 3Q08. The intensifying financial market turmoil
and, most notably, the unprecedented illiquidity in money mar-
kets and broader credit markets, exacerbated the slowdown in
the US and other economies. The economic deceleration was
evidenced by a further increase in the unemployment rate,
particularly in the US, a weakening of private consumption and
a general decrease in consumer confidence.
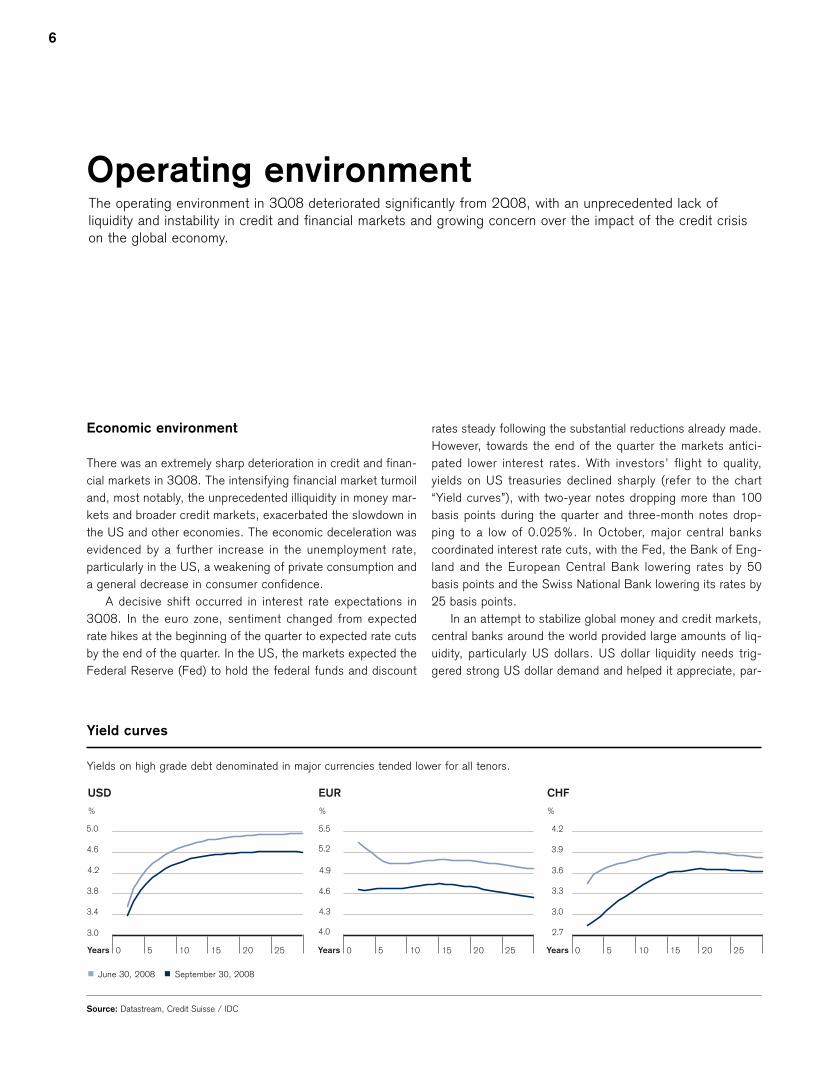
A decisive shift occurred in interest rate expectations in
3Q08. In the euro zone, sentiment changed from expected
rate hikes at the beginning of the quarter to expected rate cuts
by the end of the quarter. In the US, the markets expected the
Federal Reserve (Fed) to hold the federal funds and discount
rates steady following the substantial reductions already made.
However, towards the end of the quarter the markets antici-
pated lower interest rates. With investors’ flight to quality,
yields on US treasuries declined sharply (refer to the chart
“Yield curves”), with two-year notes dropping more than 100
basis points during the quarter and three-month notes drop-
ping to a low of 0.025%. In October, major central banks
coordinated interest rate cuts, with the Fed, the Bank of Eng-
land and the European Central Bank lowering rates by 50
basis points and the Swiss National Bank lowering its rates by
25 basis points.
In an attempt to stabilize global money and credit markets,
central banks around the world provided large amounts of liq-
uidity, particularly US dollars. US dollar liquidity needs trig-
gered strong US dollar demand and helped it appreciate, par-
%
USD
0 5 10 15 20 25
3.0
3.4
3.8
4.2
4.6
5.0
Years
%
EUR
0 5 10 15 20 25Years
%
CHF
0 5 10 15 20 25
2.7
3.0
3.3
3.6
3.9
4.2
Years
4.0
4.3
4.6
4.9
5.2
5.5
Yield curves
Yields on high grade debt denominated in major currencies tended lower for all tenors.
p June 30, 2008 p September 30, 2008
Source: Datastream, Credit Suisse / IDC
Credit Suisse results
Operating environment
7
ticularly against the euro and the pound sterling, despite
weakening fundamentals. In an environment of very high
volatility, carry trades were unwound.
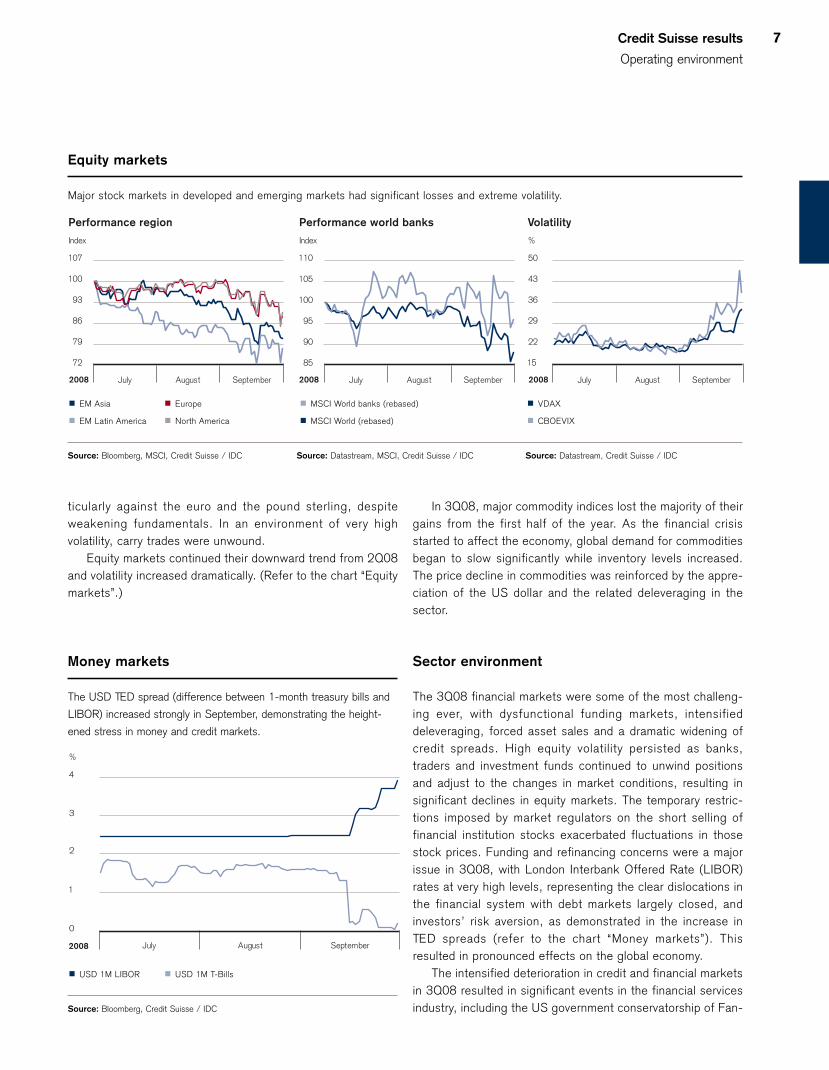
Equity markets continued their downward trend from 2Q08
and volatility increased dramatically. (Refer to the chart “Equity
markets”.)
In 3Q08, major commodity indices lost the majority of their
gains from the first half of the year. As the financial crisis
started to affect the economy, global demand for commodities
began to slow significantly while inventory levels increased.
The price decline in commodities was reinforced by the appre-
ciation of the US dollar and the related deleveraging in the
sector.
Sector environment
The 3Q08 financial markets were some of the most challeng-
ing ever, with dysfunctional funding markets, intensified
deleveraging, forced asset sales and a dramatic widening of
credit spreads. High equity volatility persisted as banks,
traders and investment funds continued to unwind positions
and adjust to the changes in market conditions, resulting in
significant declines in equity markets. The temporary restric-
tions imposed by market regulators on the short selling of
financial institution stocks exacerbated fluctuations in those
stock prices. Funding and refinancing concerns were a major
issue in 3Q08, with London Interbank Offered Rate (LIBOR)
rates at very high levels, representing the clear dislocations in
the financial system with debt markets largely closed, and
investors’ risk aversion, as demonstrated in the increase in
TED spreads (refer to the chart “Money markets”). This
resulted in pronounced effects on the global economy.
The intensified deterioration in credit and financial markets
in 3Q08 resulted in significant events in the financial services
industry, including the US government conservatorship of Fan-
Index
Performance region
July August September July August September July August September
72
79
86
93
100
107
2008
Index
Performance world banks
85
90
95
100
105
110
2008 2008
%
Volatility
15
22
29
36
43
50
Equity markets
Major stock markets in developed and emerging markets had significant losses and extreme volatility.
Source: Bloomberg, MSCI, Credit Suisse / IDC Source: Datastream, MSCI, Credit Suisse / IDC Source: Datastream, Credit Suisse / IDC
p EM Asia p Europe
p EM Latin America p North America
p MSCI World banks (rebased)
p MSCI World (rebased)
p VDAX
p CBOEVIX
July August September
%
0
1
2
3
4
2008
Money markets
The USD TED spread (difference between 1-month treasury bills and
LIBOR) increased strongly in September, demonstrating the height-
ened stress in money and credit markets.
p USD 1M LIBOR p USD 1M T-Bills
Source: Bloomberg, Credit Suisse / IDC

8
nie Mae and Freddie Mac, the bankruptcy of Lehman Broth-
ers, Bank of America’s agreement to acquire Merrill Lynch and
the Fed’s emergency loan to American International Group.
There was continued consolidation among financial institu-
tions. The Fed approved the application of Morgan Stanley and
Goldman Sachs to become bank holding companies, effec-
tively eliminating the large-scale independent investment
banking model from the US financial services industry. The
financial crisis spread to Europe where events included the
takeover of Halifax Bank of Scotland by Lloyds TSB and major
government interventions in Germany (Hypo Real Estate), Bel-
gium, the Netherlands and Luxemburg (Dexia and Fortis), the
UK (Bradford & Bingley) and Iceland (Glitnir).
In 3Q08, the US Department of the Treasury responded to
significant redemption pressure in money market funds by
establishing a temporary guarantee for certain US money mar-
ket funds. In October, the US Congress passed legislation to
facilitate the purchase of troubled assets from certain financial
institutions and increased deposit guarantees. Central banks
took steps to stabilize their markets by injecting liquidity and
easing collateral requirements for their lending facilities. To
increase confidence, many European countries issued guaran-
tees of bank deposits and, with the US, announced plans to
purchase direct equity stakes in banks.
Market volumes (growth in %)
Global Europe
QoQ YoY QoQ YoY
Equity trading volume 1 6 (3) 1 (13)
Fixed income trading volume 2 26 31 54 71
Announced mergers and acquisitions 3 1 (24) 44 (33)
Completed mergers and acquisitions 3 5 (28) (6) (21)
Equity underwriting 3 (53) (31) (66) (36)
Debt underwriting 3 (61) (31) (61) (30)
Syndicated lending – investment grade 3 (12) (30) – –
1 LSE, Borsa Italiana, Deutsche Börse, BME, SWX Europe, NYSE Euronext, NASDAQ 2 Deutsche Börse, Federal Reserve Bank of New York 3 Dealogic
The banking sector continued to experience further asset
valuation reductions and increased credit provisions, putting
significant pressure on capital levels and share prices and
increasing credit spreads significantly for many financial institu-
tions.
Regulators continued to discuss changes for the banking
sector, focusing on capital, balance sheet leverage ratios and
increased transparency of risk positions and off-balance sheet
exposures. G-7 finance ministers and central banks reiterated
their commitment to the implementation of the Financial Stabil-
ity Forum recommendations to strengthen supervision and reg-
ulation.
Market activity, which is seasonally lower during the third
quarter due to holiday periods, was further negatively affected
by the adverse market developments. Global debt underwriting
was down 61% and equity underwriting was down 53% com-
pared to 2Q08. Completed mergers and acquisitions were up
5% and announced mergers and acquisitions were up 1%
compared to 2Q08. The investment banking global fee pool,
as published by the financial data provider Dealogic, was down
35% compared to 2Q08 and 32% compared to 3Q07.
The global wealth and asset management industry was fur-
ther affected by the decline in investor confidence, increased
risk aversion and continued deleveraging.
Credit Suisse results
Credit Suisse
9
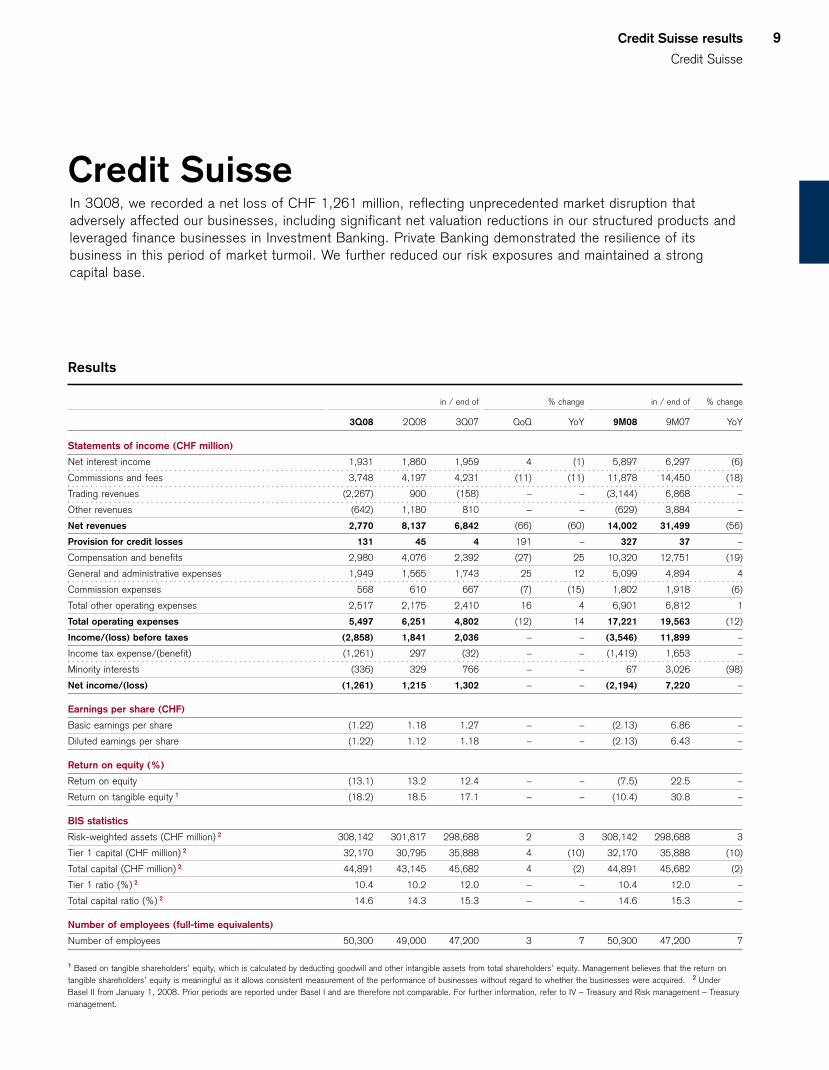
Credit Suisse In 3Q08, we recorded a net loss of CHF 1,261 million, reflecting unprecedented market disruption thatadversely affected our businesses, including significant net valuation reductions in our structured products andleveraged finance businesses in Investment Banking. Private Banking demonstrated the resilience of itsbusiness in this period of market turmoil. We further reduced our risk exposures and maintained a strongcapital base.
Results
in / end of % change in / end of % change
3Q08 2Q08 3Q07 QoQ YoY 9M08 9M07 YoY
Statements of income (CHF million)
Net interest income 1,931 1,860 1,959 4 (1) 5,897 6,297 (6)
Commissions and fees 3,748 4,197 4,231 (11) (11) 11,878 14,450 (18)
Trading revenues (2,267) 900 (158) – – (3,144) 6,868 –
Other revenues (642) 1,180 810 – – (629) 3,884 –
Net revenues 2,770 8,137 6,842 (66) (60) 14,002 31,499 (56)
Provision for credit losses 131 45 4 191 – 327 37 –
Compensation and benefits 2,980 4,076 2,392 (27) 25 10,320 12,751 (19)
General and administrative expenses 1,949 1,565 1,743 25 12 5,099 4,894 4
Commission expenses 568 610 667 (7) (15) 1,802 1,918 (6)
Total other operating expenses 2,517 2,175 2,410 16 4 6,901 6,812 1
Total operating expenses 5,497 6,251 4,802 (12) 14 17,221 19,563 (12)
Income/(loss) before taxes (2,858) 1,841 2,036 – – (3,546) 11,899 –
Income tax expense/(benefit) (1,261) 297 (32) – – (1,419) 1,653 –
Minority interests (336) 329 766 – – 67 3,026 (98)
Net income/(loss) (1,261) 1,215 1,302 – – (2,194) 7,220 –
Earnings per share (CHF)
Basic earnings per share (1.22) 1.18 1.27 – – (2.13) 6.86 –
Diluted earnings per share (1.22) 1.12 1.18 – – (2.13) 6.43 –
Return on equity (%)
Return on equity (13.1) 13.2 12.4 – – (7.5) 22.5 –
Return on tangible equity 1 (18.2) 18.5 17.1 – – (10.4) 30.8 –
BIS statistics
Risk-weighted assets (CHF million) 2 308,142 301,817 298,688 2 3 308,142 298,688 3
Tier 1 capital (CHF million) 2 32,170 30,795 35,888 4 (10) 32,170 35,888 (10)
Total capital (CHF million) 2 44,891 43,145 45,682 4 (2) 44,891 45,682 (2)
Tier 1 ratio (%) 2 10.4 10.2 12.0 – – 10.4 12.0 –
Total capital ratio (%) 2 14.6 14.3 15.3 – – 14.6 15.3 –
Number of employees (full-time equivalents)
Number of employees 50,300 49,000 47,200 3 7 50,300 47,200 7
1 Based on tangible shareholders’ equity, which is calculated by deducting goodwill and other intangible assets from total shareholders’ equity. Management believes that the return on
tangible shareholders’ equity is meaningful as it allows consistent measurement of the performance of businesses without regard to whether the businesses were acquired. 2 Under
Basel II from January 1, 2008. Prior periods are reported under Basel I and are therefore not comparable. For further information, refer to IV – Treasury and Risk management – Treasury
management.
10
Results summary
In 3Q08, we recorded a net loss of CHF 1,261 million, com-
pared to net income of CHF 1,302 million in 3Q07 and net
income of CHF 1,215 million in 2Q08. Private Banking deliv-
ered strong net new assets and good net revenues in both
Wealth Management and Corporate & Retail Banking. The Pri-
vate Banking results included provisions relating to settlement
agreements for auction rate securities (ARS) in Wealth Man-
agement. In Investment Banking, the unprecedented market
disruption adversely affected most of our businesses, including
our structured products and leveraged finance businesses,
corporate lending business, convertibles and long/short and
event and risk arbitrage strategies. However, Investment
Banking reported solid results in some businesses, including
global rates, foreign exchange, prime services and equity
derivatives. Asset Management results reflected net valuation
reductions on private equity, certain alternative investments
and securities purchased from our money market funds. Our
results benefited from significant fair value gains arising from
widening credit spreads on Credit Suisse debt. We continued
to manage down our exposures to assets most significantly
impacted by the dislocation in the mortgage and credit mar-
kets and to securities purchased from our money market
funds. Compensation and benefits and general and adminis-
trative expenses increased compared to 3Q07. The increased
income tax benefit was primarily due to the positive impact of
the geographical mix of results in 3Q08 and the recognition of
a tax benefit for the current period losses. We also released
valuation allowances related to prior period losses in the UK of
CHF 421 million.
Diluted earnings per share in 3Q08 were a loss of CHF
(1.22) compared to CHF 1.18 in 3Q07 and CHF 1.12 in
2Q08. Return on equity was (13.1)%, compared to 12.4% in
3Q07 and 13.2% in 2Q08.
Capital trends
Our capital position remained strong. Our consolidated BIS tier
1 ratio under Basel II was 10.4% as of the end of 3Q08, com-
pared to 10.2% as of the end of 2Q08, primarily reflecting
increased tier 1 capital.
At the Annual General Meeting (AGM) on May 4, 2007,
the shareholders approved a share buyback program of up to
CHF 8 billion, of which CHF 4.1 billion, or 52%, were repur-
chased as of the end of 3Q08. During 3Q08, no common
shares were repurchased. In light of the current market envi-
ronment, we cancelled this buyback program in October.
We announced on October 16, 2008 that we had reached
an agreement with the SFBC regarding capital targets and
leverage requirements. The terms of the agreement with the
SFBC do not constrain the ability of Credit Suisse to buy back
shares or pay dividends in the future. Consistent with the
agreed requirements, we also announced that we raised
approximately CHF 10 billion of tier 1 capital from a small
group of investors through the sale of treasury shares and the
issuance of mandatory convertible bonds and non-dilutive
hybrid tier 1 securities, increasing our tier 1 ratio as of Sep-
tember 30, 2008, on a pro-forma basis, to approximately
13.7%.
For further information, refer to IV – Treasury and Risk
management – Treasury management.
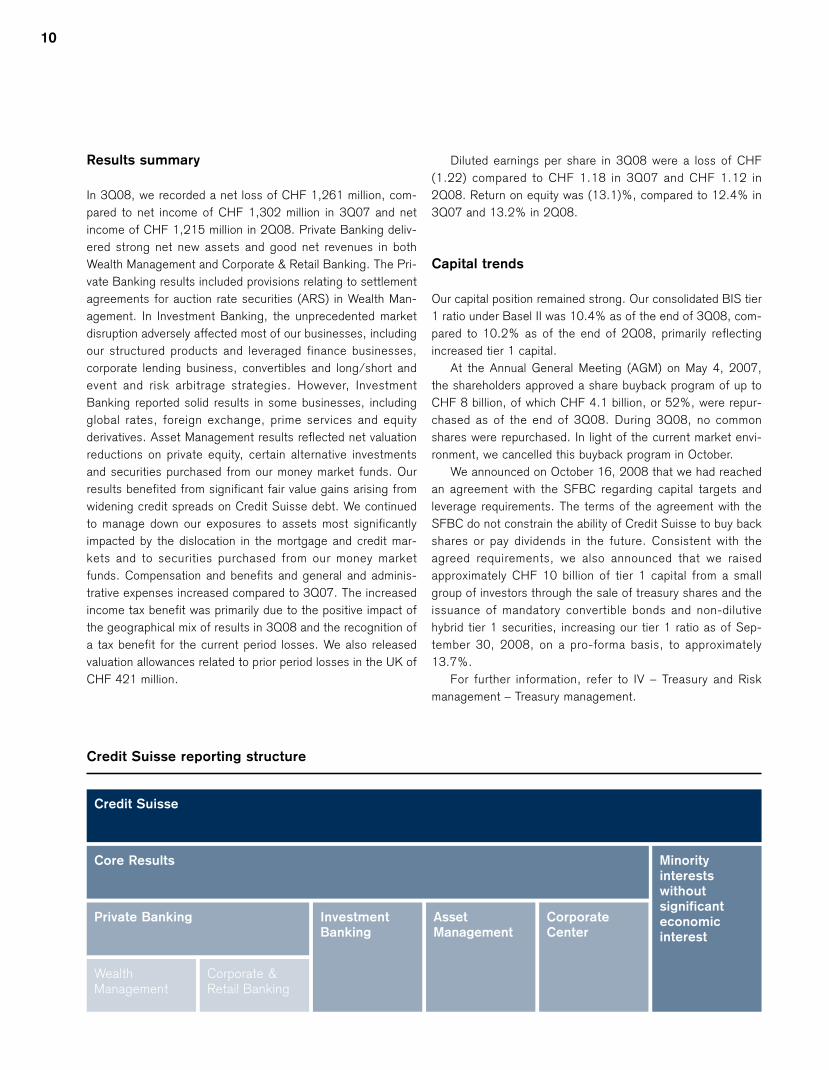
Credit Suisse
Core Results Minority
interests
without
significant
economic
interest
Investment
Banking
Private Banking Asset
Management
Corporate
Center
Wealth Management
Corporate & Retail Banking
Credit Suisse reporting structure
Credit Suisse results
Credit Suisse
11
Management changes
On August 22, 2008, we announced the appointment of
Hans-Ulrich Meister as CEO Switzerland, succeeding Ulrich
Körner. In this role, Mr. Meister joined the Executive Board of
Credit Suisse on September 1, 2008.
Core Results
Core Results include the results of our three segments and
the Corporate Center. Credit Suisse’s results also include rev-
enues and expenses from the consolidation of certain private
equity funds and other entities in which we do not have a sig-
nificant economic interest (SEI) in such revenues and
expenses. The consolidation of these entities does not affect
net income as the amounts recorded in net revenues and total
operating expenses are offset by corresponding amounts
reported as minority interests. In addition, our income tax
expense is not affected by these revenues and expenses.
These minority interest-related revenues and expenses are
reported as “Minority interests without SEI” in the “Credit
Suisse and Core Results” table.
Corporate Center includes parent company operations
such as Group financing, expenses for projects sponsored by
the Group and certain expenses that have not been allocated
to the segments. In addition, Corporate Center includes con-
solidation and elimination adjustments required to eliminate
intercompany revenues and expenses.
Certain reclassifications have been made to prior periods
to conform to the current presentation.
Funding
We centrally manage our funding activities. New securities for
funding and capital purposes are issued primarily by the Bank.
The Bank lends funds to our operating subsidiaries and affili-
ates on both a senior and subordinated basis, as needed, the
latter typically to meet capital requirements, or as desired by
management to capitalize on opportunities. Capital is distrib-
uted to the segments considering factors such as regulatory
capital requirements, utilized economic capital and the historic
and future potential return on capital. Transfer pricing, using
market rates, is used to record interest income and expense in
each of the segments for this capital and funding. Included in
this allocation are gains and losses recorded on the fair value
of Credit Suisse own debt.
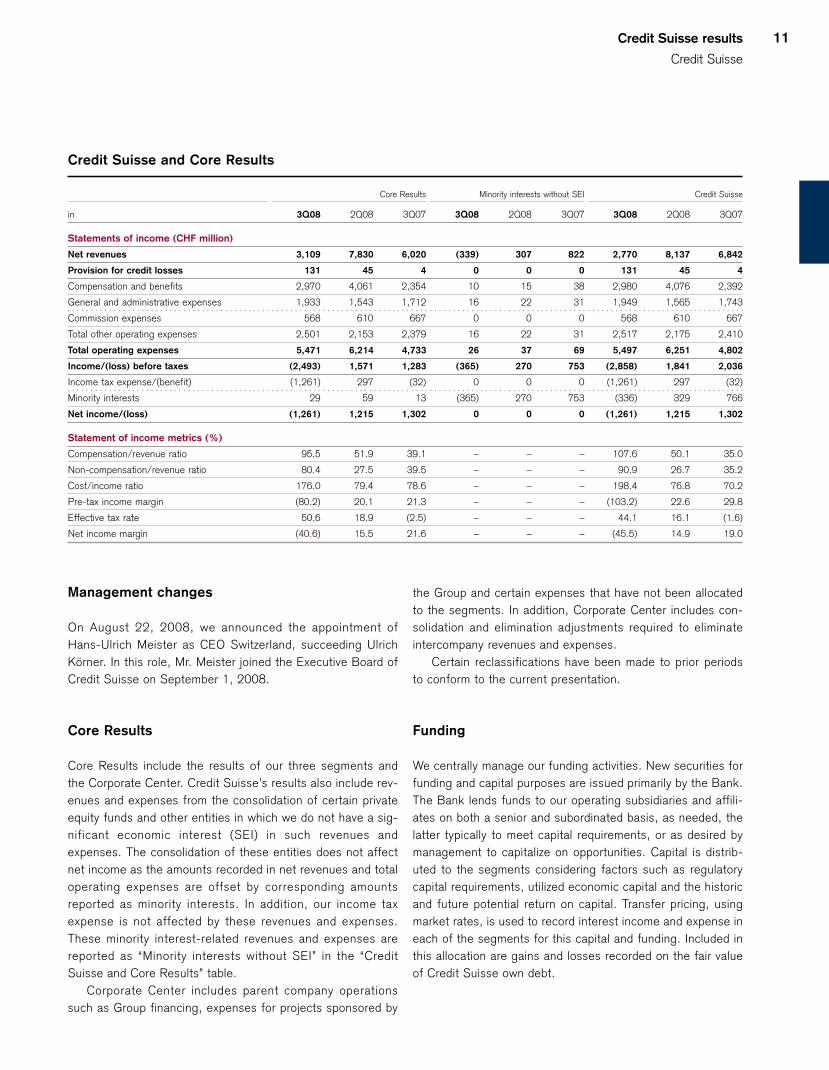
Credit Suisse and Core Results
Core Results Minority interests without SEI Credit Suisse
in 3Q08 2Q08 3Q07 3Q08 2Q08 3Q07 3Q08 2Q08 3Q07
Statements of income (CHF million)
Net revenues 3,109 7,830 6,020 (339) 307 822 2,770 8,137 6,842
Provision for credit losses 131 45 4 0 0 0 131 45 4
Compensation and benefits 2,970 4,061 2,354 10 15 38 2,980 4,076 2,392
General and administrative expenses 1,933 1,543 1,712 16 22 31 1,949 1,565 1,743
Commission expenses 568 610 667 0 0 0 568 610 667
Total other operating expenses 2,501 2,153 2,379 16 22 31 2,517 2,175 2,410
Total operating expenses 5,471 6,214 4,733 26 37 69 5,497 6,251 4,802
Income/(loss) before taxes (2,493) 1,571 1,283 (365) 270 753 (2,858) 1,841 2,036
Income tax expense/(benefit) (1,261) 297 (32) 0 0 0 (1,261) 297 (32)
Minority interests 29 59 13 (365) 270 753 (336) 329 766
Net income/(loss) (1,261) 1,215 1,302 0 0 0 (1,261) 1,215 1,302
Statement of income metrics (%)
Compensation/revenue ratio 95.5 51.9 39.1 – – – 107.6 50.1 35.0
Non-compensation/revenue ratio 80.4 27.5 39.5 – – – 90.9 26.7 35.2
Cost/income ratio 176.0 79.4 78.6 – – – 198.4 76.8 70.2
Pre-tax income margin (80.2) 20.1 21.3 – – – (103.2) 22.6 29.8
Effective tax rate 50.6 18.9 (2.5) – – – 44.1 16.1 (1.6)
Net income margin (40.6) 15.5 21.6 – – – (45.5) 14.9 19.0

12
Goodwill impairment review
The operating environment in 3Q08 was characterized by
intense disruption in the credit markets, extreme volatility in
equity markets and a number of significant adverse events.
The financial services sector witnessed extraordinary changes
to the competitive landscape, and falling share prices, espe-
cially during the end of September and beginning of October,
caused the market capitalization of many financial institutions
to decrease. In recognition of this situation, we have assessed
whether any of our recorded goodwill was impaired.
We have assessed our current and expected results and
have concluded that fair values remain above their respective
carrying amounts and no goodwill impairment is required. We
will continue to assess the impact of the current environment
on our recorded goodwill, including in our annual goodwill
impairment assessment, which occurs in 4Q08.
Remediation developments on certain internal
control matters
Our remediation plan with respect to internal controls over the
valuation of certain asset-backed securities (ABS) positions in
the collateralized debt obligations (CDO) trading business
within Investment Banking has progressed as planned. Key
controls have been designed and put in place. These controls
will be tested to ensure they are operating effectively as of the
end of 2008. We have performed alternative procedures
regarding the valuations of these positions and are confident
that, as a result of the alternative procedures performed, our
financial statements in this report are fairly presented in all
material respects, in accordance with accounting principles
generally accepted in the US.
Credit Suisse results
Core Results
13
Core Results In 3Q08, we recorded a net loss of CHF 1,261 million reflecting the extremely challenging operatingenvironment. Private Banking achieved strong net new assets and good net revenues, evidencing the strengthof our business in a period of unprecedented market turmoil. In Investment Banking, most of our businesseswere adversely affected, including net valuation reductions in our structured products and leveraged financebusinesses.
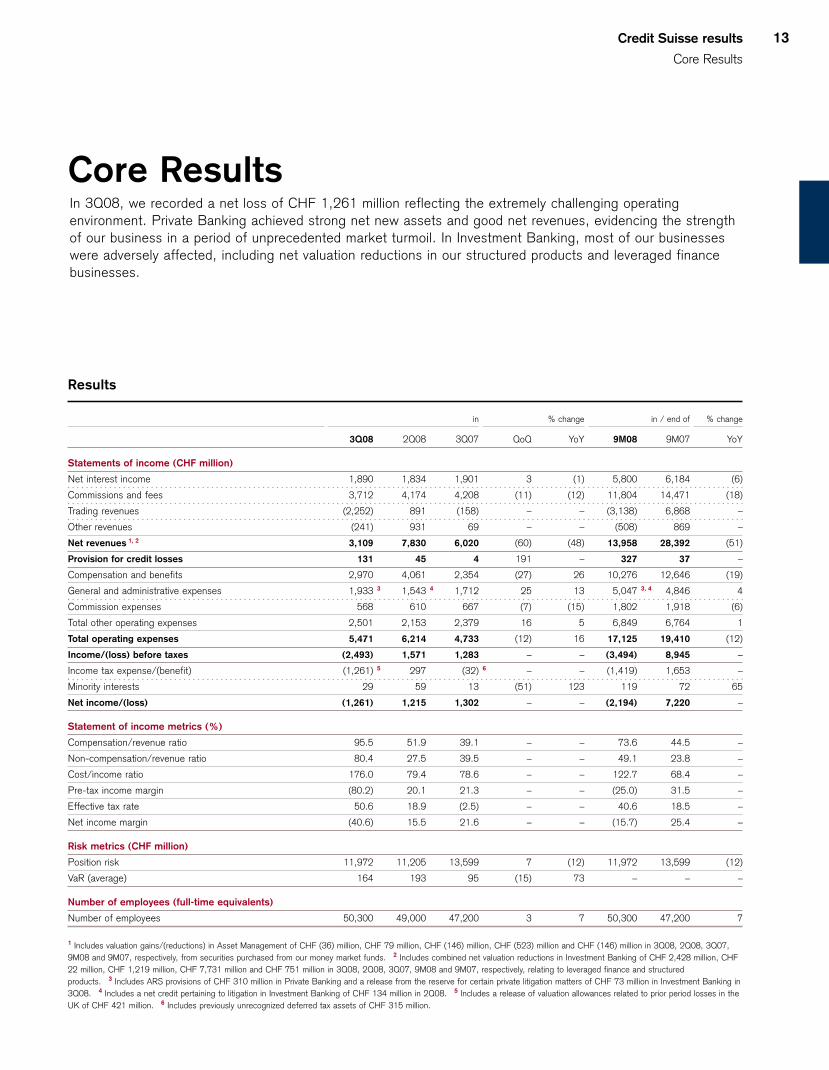
Results
in % change in / end of % change
3Q08 2Q08 3Q07 QoQ YoY 9M08 9M07 YoY
Statements of income (CHF million)
Net interest income 1,890 1,834 1,901 3 (1) 5,800 6,184 (6)
Commissions and fees 3,712 4,174 4,208 (11) (12) 11,804 14,471 (18)
Trading revenues (2,252) 891 (158) – – (3,138) 6,868 –
Other revenues (241) 931 69 – – (508) 869 –
Net revenues 1, 2 3,109 7,830 6,020 (60) (48) 13,958 28,392 (51)
Provision for credit losses 131 45 4 191 – 327 37 –
Compensation and benefits 2,970 4,061 2,354 (27) 26 10,276 12,646 (19)
General and administrative expenses 1,933 3 1,543 4 1,712 25 13 5,047 3, 4 4,846 4
Commission expenses 568 610 667 (7) (15) 1,802 1,918 (6)
Total other operating expenses 2,501 2,153 2,379 16 5 6,849 6,764 1
Total operating expenses 5,471 6,214 4,733 (12) 16 17,125 19,410 (12)
Income/(loss) before taxes (2,493) 1,571 1,283 – – (3,494) 8,945 –
Income tax expense/(benefit) (1,261) 5 297 (32) 6 – – (1,419) 1,653 –
Minority interests 29 59 13 (51) 123 119 72 65
Net income/(loss) (1,261) 1,215 1,302 – – (2,194) 7,220 –
Statement of income metrics (%)
Compensation/revenue ratio 95.5 51.9 39.1 – – 73.6 44.5 –
Non-compensation/revenue ratio 80.4 27.5 39.5 – – 49.1 23.8 –
Cost/income ratio 176.0 79.4 78.6 – – 122.7 68.4 –
Pre-tax income margin (80.2) 20.1 21.3 – – (25.0) 31.5 –
Effective tax rate 50.6 18.9 (2.5) – – 40.6 18.5 –
Net income margin (40.6) 15.5 21.6 – – (15.7) 25.4 –
Risk metrics (CHF million)
Position risk 11,972 11,205 13,599 7 (12) 11,972 13,599 (12)
VaR (average) 164 193 95 (15) 73 – – –
Number of employees (full-time equivalents)
Number of employees 50,300 49,000 47,200 3 7 50,300 47,200 7
1 Includes valuation gains/(reductions) in Asset Management of CHF (36) million, CHF 79 million, CHF (146) million, CHF (523) million and CHF (146) million in 3Q08, 2Q08, 3Q07,
9M08 and 9M07, respectively, from securities purchased from our money market funds. 2 Includes combined net valuation reductions in Investment Banking of CHF 2,428 million, CHF
22 million, CHF 1,219 million, CHF 7,731 million and CHF 751 million in 3Q08, 2Q08, 3Q07, 9M08 and 9M07, respectively, relating to leveraged finance and structured
products. 3 Includes ARS provisions of CHF 310 million in Private Banking and a release from the reserve for certain private litigation matters of CHF 73 million in Investment Banking in
3Q08. 4 Includes a net credit pertaining to litigation in Investment Banking of CHF 134 million in 2Q08. 5 Includes a release of valuation allowances related to prior period losses in the
UK of CHF 421 million. 6 Includes previously unrecognized deferred tax assets of CHF 315 million.
14
Core Results include the results of our integrated banking
organization and exclude revenues and expenses in respect of
minority interests in which we do not have significant eco-
nomic interest.
Results summary
In 3Q08, we recorded a net loss of CHF 1,261 million, com-
pared to net income of CHF 1,302 million in 3Q07. Net rev-
enues were CHF 3,109 million, down CHF 2,911 million, or
48%, compared to 3Q07, while total operating expenses were
CHF 5,471 million, up CHF 738 million, or 16%.
Our results for 3Q08 reflected the unprecedented disrup-
tion in the credit markets. In Private Banking, we achieved
strong net new assets and good net revenues, evidencing the
resilience of our business in this period of market turmoil. The
Private Banking results included provisions relating to settle-
ment agreements for ARS in Wealth Management. In Invest-
ment Banking, we recorded a significant loss before taxes,
including net valuation reductions in our structured products
and leveraged finance businesses. Other areas negatively
impacted by the turbulence in the market environment
included our corporate lending business, convertibles and
long/short and event and risk arbitrage strategies, which
recorded significant losses. In businesses less impacted by the
market disruption, including global rates, foreign exchange,
prime services and equity derivatives, we reported solid
results. Asset Management had a small loss before taxes,
reflecting net valuation reductions on private equity, certain
alternative investments and securities purchased from our
money market funds. We continued to reduce our exposures
to assets most significantly impacted by the dislocation in the
mortgage and credit markets and to securities purchased from
our money market funds. Our results included significant fair
value gains of CHF 2.0 billion due to widening credit spreads
on Credit Suisse debt, substantially all of which were recorded
in Investment Banking.
Total operating expenses increased compared to 3Q07,
reflecting higher performance-related compensation and gen-
eral and administrative expenses. The increased income tax
benefit was primarily due to the positive impact of the geo-
graphical mix of results in 3Q08 and the recognition of a tax
benefit for the current period losses. We also released valua-
tion allowances related to prior period losses in the UK of CHF
421 million.
Assets under management were CHF 1,370.0 billion as of
the end of 3Q08, a decrease of CHF 41.9 billion, or 3.0%,
compared to the end of 2Q08, reflecting adverse market
movements, partially offset by favorable foreign exchange-
related movements. We had net new assets of CHF 1.5 bil-
lion, primarily reflecting inflows of CHF 14.5 billion in Private
Banking (CHF 11.3 billion in Wealth Management and CHF
3.2 billion in Corporate & Retail Banking) and outflows of CHF
16.5 billion in Asset Management.
Risk trends
In 3Q08, our overall position risk, measured on the basis of
our economic risk capital model, increased 7% compared to
2Q08, mainly driven by the appreciation of the US dollar
against the Swiss franc. Excluding this US dollar translation
impact, position risk decreased 2%. Average Value-at-Risk
(VaR) for the Group’s trading books decreased to CHF 164
million compared to CHF 193 million in 2Q08.
For further information on risk trends, refer to IV – Trea-
sury and Risk management – Risk management.
Fair valuations
Fair value is considered the most relevant measurement for
financial instruments as it provides more transparency than a
historical cost-based model valuation and aligns the account-
ing for these financial instruments with how we manage our
business. The levels of the fair value hierarchy as defined by
the relevant accounting guidance are not a measurement of
economic risk, but rather an indication of the observability of
prices or valuation inputs. For further information, refer to
Note 1 – Summary of significant accounting policies and Note
21 – Fair value of financial instruments in V – Condensed con-
solidated financial statements – unaudited.
The fair value of the majority of the Group’s financial
instruments is based on quoted prices in active markets or
observable inputs. These instruments include government and
agency securities, commercial paper, most investment-grade
corporate debt, most high-yield debt securities, exchange-
traded and certain over-the-counter (OTC) derivative instru-
ments and certain listed equity securities.
In addition, the Group holds financial instruments for which
no prices are available and which have little or no observable
inputs. For these instruments, the determination of fair value
requires subjective assessment and varying degrees of judg-
ment depending on liquidity, concentration, pricing assump-
tions and the risks affecting the specific instrument. In such
circumstances, valuation is determined based on manage-
ment’s own assumptions about the assumptions that market
participants would use in pricing the asset or liability (including
assumptions about risk). These instruments include certain
Credit Suisse results
Core Results
15
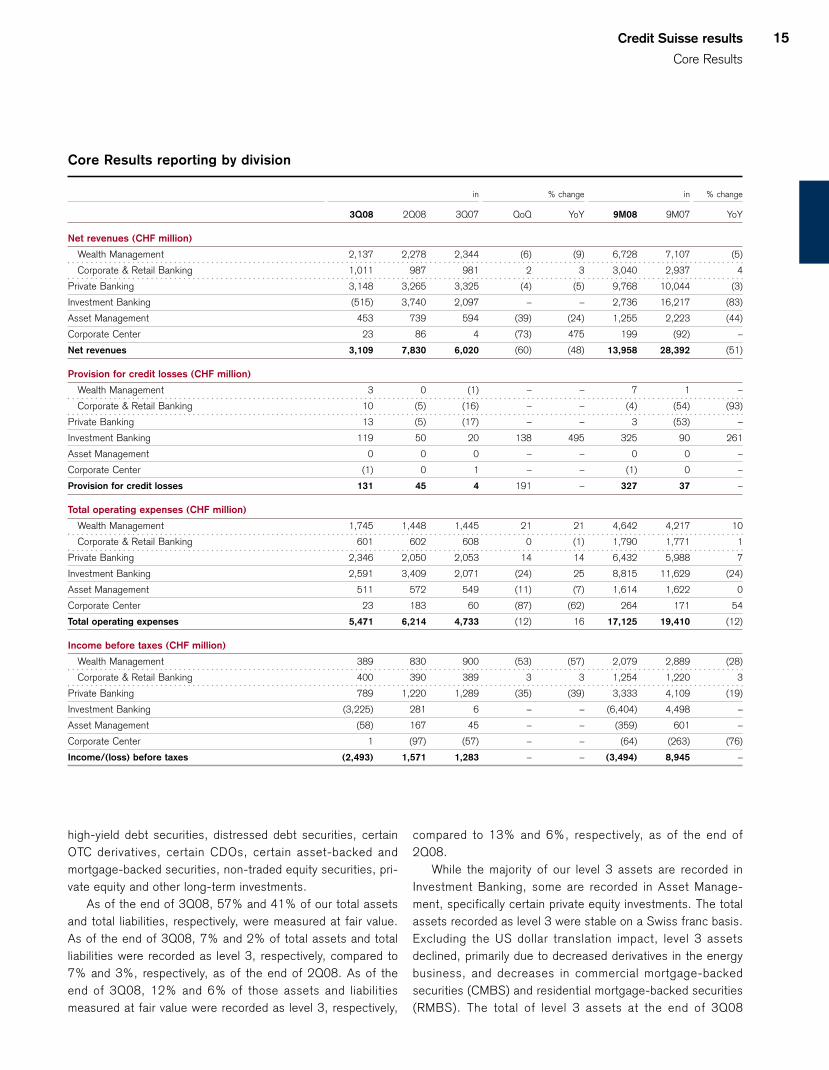
Core Results reporting by division
in % change in % change
3Q08 2Q08 3Q07 QoQ YoY 9M08 9M07 YoY
Net revenues (CHF million)
Wealth Management 2,137 2,278 2,344 (6) (9) 6,728 7,107 (5)
Corporate & Retail Banking 1,011 987 981 2 3 3,040 2,937 4
Private Banking 3,148 3,265 3,325 (4) (5) 9,768 10,044 (3)
Investment Banking (515) 3,740 2,097 – – 2,736 16,217 (83)
Asset Management 453 739 594 (39) (24) 1,255 2,223 (44)
Corporate Center 23 86 4 (73) 475 199 (92) –
Net revenues 3,109 7,830 6,020 (60) (48) 13,958 28,392 (51)
Provision for credit losses (CHF million)
Wealth Management 3 0 (1) – – 7 1 –
Corporate & Retail Banking 10 (5) (16) – – (4) (54) (93)
Private Banking 13 (5) (17) – – 3 (53) –
Investment Banking 119 50 20 138 495 325 90 261
Asset Management 0 0 0 – – 0 0 –
Corporate Center (1) 0 1 – – (1) 0 –
Provision for credit losses 131 45 4 191 – 327 37 –
Total operating expenses (CHF million)
Wealth Management 1,745 1,448 1,445 21 21 4,642 4,217 10
Corporate & Retail Banking 601 602 608 0 (1) 1,790 1,771 1
Private Banking 2,346 2,050 2,053 14 14 6,432 5,988 7
Investment Banking 2,591 3,409 2,071 (24) 25 8,815 11,629 (24)
Asset Management 511 572 549 (11) (7) 1,614 1,622 0
Corporate Center 23 183 60 (87) (62) 264 171 54
Total operating expenses 5,471 6,214 4,733 (12) 16 17,125 19,410 (12)
Income before taxes (CHF million)
Wealth Management 389 830 900 (53) (57) 2,079 2,889 (28)
Corporate & Retail Banking 400 390 389 3 3 1,254 1,220 3
Private Banking 789 1,220 1,289 (35) (39) 3,333 4,109 (19)
Investment Banking (3,225) 281 6 – – (6,404) 4,498 –
Asset Management (58) 167 45 – – (359) 601 –
Corporate Center 1 (97) (57) – – (64) (263) (76)
Income/(loss) before taxes (2,493) 1,571 1,283 – – (3,494) 8,945 –
high-yield debt securities, distressed debt securities, certain
OTC derivatives, certain CDOs, certain asset-backed and
mortgage-backed securities, non-traded equity securities, pri-
vate equity and other long-term investments.
As of the end of 3Q08, 57% and 41% of our total assets
and total liabilities, respectively, were measured at fair value.
As of the end of 3Q08, 7% and 2% of total assets and total
liabilities were recorded as level 3, respectively, compared to
7% and 3%, respectively, as of the end of 2Q08. As of the
end of 3Q08, 12% and 6% of those assets and liabilities
measured at fair value were recorded as level 3, respectively,
compared to 13% and 6%, respectively, as of the end of
2Q08.
While the majority of our level 3 assets are recorded in
Investment Banking, some are recorded in Asset Manage-
ment, specifically certain private equity investments. The total
assets recorded as level 3 were stable on a Swiss franc basis.
Excluding the US dollar translation impact, level 3 assets
declined, primarily due to decreased derivatives in the energy
business, and decreases in commercial mortgage-backed
securities (CMBS) and residential mortgage-backed securities
(RMBS). The total of level 3 assets at the end of 3Q08

16
included primarily internally managed private equity funds,
equity derivatives, RMBS, CDOs and CMBS. Models were
used to value these products. Models are developed internally
and are reviewed by functions independent of the front office
to ensure they are appropriate for current market conditions.
The models require subjective assessment and varying
degrees of judgment depending on liquidity, concentration,
pricing assumptions and risks affecting the specific instru-
ment. The models consider observable and unobservable
parameters in calculating the value of these products, includ-
ing certain indices relating to these products, which were
extremely volatile during 3Q08, particularly in September.
Consideration of these indices has become more significant in
our valuation techniques as the market for these products has
become less active.
For a description of our valuation techniques, refer to Note
33 – Financial instruments in V – Consolidated financial state-
ments – Credit Suisse Group in the Credit Suisse Annual
Report 2007. There were no changes to our valuation tech-
niques from those described in our annual report.
For all transfers to level 3, we determine and disclose as
level 3 events any gains or losses as measured from the first
day of the reporting period, even if the transfer occurred sub-
sequent to the first day of the reporting period. For all trans-
fers out of level 3, we determine and disclose as level 3
events any gains or losses through the last day of the report-
ing period, even if the transfer occurred prior to the last day of
the reporting period. We believe this provides greater trans-
parency over the financial impact of our level 3 assets and lia-
bilities. We believe that the range of any valuation uncertainty,
in the aggregate, would not be material to our financial condi-
tion.
For further information, refer to II – Results by division –
Investment Banking – Impact on results of the events in the
mortgage and credit markets.
Results detail
The following provides a comparison of our 3Q08 results ver-
sus 3Q07 (YoY) and versus 2Q08 (QoQ).
Net revenues
In managing the business, revenues are evaluated in the
aggregate, including an assessment of trading gains and
losses and the related interest income and expense from
financing and hedging positions. For this reason, individual
revenue categories may not be indicative of performance.
Core Results reporting by region
in % change in % change
3Q08 2Q08 3Q07 QoQ YoY 9M08 9M07 YoY
Net revenues (CHF million)
Switzerland 2,615 2,479 2,488 5 5 7,657 7,702 (1)
EMEA 415 1,092 1,999 (62) (79) 2,613 8,751 (70)
Americas (241) 3,648 740 – – 2,085 9,013 (77)
Asia Pacific 297 525 789 (43) (62) 1,404 3,018 (53)
Corporate Center 23 86 4 (73) 475 199 (92) –
Net revenues 3,109 7,830 6,020 (60) (48) 13,958 28,392 (51)
Income before taxes (CHF million)
Switzerland 1,217 1,049 1,048 16 16 3,484 3,498 0
EMEA (1,208) (1,097) 488 10 – (2,801) 2,605 –
Americas (2,161) 1,905 (508) – 325 (3,625) 2,037 –
Asia Pacific (342) (189) 312 81 – (488) 1,068 –
Corporate Center 1 (97) (57) – – (64) (263) (76)
Income/(loss) before taxes (2,493) 1,571 1,283 – – (3,494) 8,945 –
A significant portion of our business requires inter-regional coordination in order to facilitate the needs of our clients. The methodology for allocating our results by region is dependent on
management judgment. For Wealth Management, results are allocated based on the management reporting structure of our relationship managers and the region where the transaction is
recorded. For Investment Banking, trading results are allocated based on where the risk is primarily managed and fee-based results are allocated where the client is domiciled. For Asset
Management, results are allocated based on the location of the investment advisors and sales teams.

Credit Suisse results
Core Results
17
YoY: Down 48% from CHF 6,020 million to CHF 3,109 million
Net revenues declined in all three divisions compared to
3Q07.
In Private Banking, net revenues were down 5%. Net
interest income increased 5%. Total non-interest income
decreased 12%, mainly as a result of reduced transaction-
based revenues from very low client activity and lower asset-
based commissions and fees, reflecting the decline in average
assets under management.
In Investment Banking, net revenues were negative due to
the widespread market disruption that adversely affected most
of our businesses. Our combined leveraged finance and struc-
tured products businesses had net valuation reductions of
CHF 2,428 million in 3Q08, compared to net valuation reduc-
tions of CHF 1,219 million in 3Q07. Other areas were nega-
tively impacted by the turbulence in the market environment,
including losses of CHF 922 million in our corporate lending
business, losses of CHF 706 million in convertibles, losses of
CHF 469 million in long/short and CHF 140 million in event
and risk arbitrage strategies. In businesses less impacted by
the market disruption, including global rates, foreign
exchange, prime services and equity derivatives, we reported
solid results. The 3Q08 results also reflected fair value gains
of CHF 1,876 million on Credit Suisse debt compared to fair
value gains of CHF 622 million in 3Q07.
In Asset Management, net revenues were down 24%, pri-
marily reflecting net valuation reductions on private equity and
certain alternative investments and a significant decline in
average assets under management, partly offset by lower allo-
cated costs and lower net valuation reductions on securities
purchased from our money market funds. Private equity and
other investment-related losses were CHF 109 million, com-
pared to gains of CHF 59 million in 3Q07. Asset management
and administrative fees were higher for alternative investments
across most strategies.
QoQ: Down 60% from CHF 7,830 million to CHF 3,109 million
In Private Banking, net revenues were down 4%. Net interest
income was stable, and total non-interest income decreased
6%, mainly due to semi-annual performance-related fees in
2Q08 and a significant decline in transaction-based fees.
In Investment Banking, revenues were lower in most busi-
nesses, including the significant losses in our corporate lend-
ing business, convertibles and long/short and event and risk
arbitrage strategies. Net revenues also reflected fair value
gains on Credit Suisse debt of CHF 1,876 million compared to
fair value losses of CHF 503 million in 2Q08.
In Asset Management, net revenues decreased, primarily
reflecting the private equity and other investment-related losses
in 3Q08 compared to gains of CHF 50 million in 2Q08, semi-
annual performance fees in 2Q08 and net valuation reductions
on securities purchased from our money market funds com-
pared to net valuation gains in 2Q08. This was partly offset by
lower allocated costs.
Provision for credit losses
YoY: Up from CHF 4 million to CHF 131 million
The increase was driven primarily by additional provisions
relating to a guarantee provided in a prior year to a third-party
bank by Investment Banking.
QoQ: Up from CHF 45 million to CHF 131 million
The increase was driven primarily by additional provisions
relating to the third-party bank guarantee.
Operating expenses
Compensation and benefits
Compensation and benefits for a given year reflect the
strength and breadth of the business results and staffing lev-
els and include fixed components, such as salaries, benefits
and share-based compensation expense from prior-year
awards, and a variable component. The variable component
Number of employees by division
end of % change
3Q08 2Q08 3Q07 QoQ YoY
Number of employees by division (full-time equivalents)
Wealth Management 15,600 15,100 13,900 3 12
Corporate & Retail Banking 9,100 9,000 8,900 1 2
Private Banking 24,700 24,100 22,800 2 8
Investment Banking 21,300 20,500 20,300 4 5
Asset Management 3,600 3,700 3,400 (3) 6
Corporate Center 700 700 700 0 0
Number of employees 50,300 49,000 47,200 3 7
18
reflects the performance-based compensation for the current
year to be paid in cash. The portion of the performance-based
compensation for the current year deferred through share-
based awards is expensed in future periods. For further infor-
mation, refer to Note 17 – Employee share-based compensa-
tion and other benefits in V – Condensed consolidated
financial statements – unaudited.
YoY: Up 26% from CHF 2,354 million to CHF 2,970 million
A nominal performance-related compensation accrual was
recorded in Investment Banking in 3Q08. The increase prima-
rily reflected the very low performance-related compensation
in Investment Banking in 3Q07 when the credit crisis began,
following a record first half.
QoQ: Down 27% from CHF 4,061 million to CHF 2,970 million
The decrease was due primarily to lower performance-related
compensation reflecting the negative results.
General and administrative expenses
YoY: Up 13% from CHF 1,712 million to CHF 1,933 million
The increase primarily reflected the ARS provisions of CHF
310 million in Private Banking, partly offset by a release of
CHF 73 million from our reserve for certain private litigation
matters in Investment Banking, and lower professional fees.
QoQ: Up 25% from CHF 1,543 million to CHF 1,933 million
The increase primarily reflected the ARS provisions in Private
Banking and a net credit of CHF 134 million in Investment
Banking in 2Q08, which included a release from our reserve
for certain private litigation matters, partially offset by a charge
related to an agreement with the Parmalat Group to settle all
claims between the parties in Italy.
Income tax expense/(benefit)
YoY: From CHF (32) million to CHF (1,261) million
The increased income tax benefit was primarily due to the pos-
itive impact of the geographical mix of results in 3Q08 and the
recognition of a tax benefit for the current period losses. We
also released valuation allowances related to prior period
losses in the UK of CHF 421 million. The deferred tax asset in
the UK has an unlimited carry-forward period and no valuation
allowance has been recognized. The effective tax rate was
50.6% compared to (2.5)% in 3Q07.
QoQ: From CHF 297 million to CHF (1,261) million
The increased income tax benefit was primarily due to the pos-
itive impact of the geographical mix of results in 3Q08 and the
recognition of a tax benefit for the current period losses. We
also released valuation allowances related to prior period
losses in the UK of CHF 421 million.
Personnel
The number of employees increased by 1,300 full-time equiv-
alents compared to the end of 2Q08. The increase in Private
Banking included additional relationship managers and support
functions personnel in targeted markets of Wealth Manage-
ment. In Investment Banking, we are rebalancing our busi-
nesses by shifting our resources to take advantage of areas
with growth opportunities, such as prime services and deriva-
tives. In Asset Management, we reduced our headcount in line
with our strategy.
Credit Suisse results
Key performance indicators
19
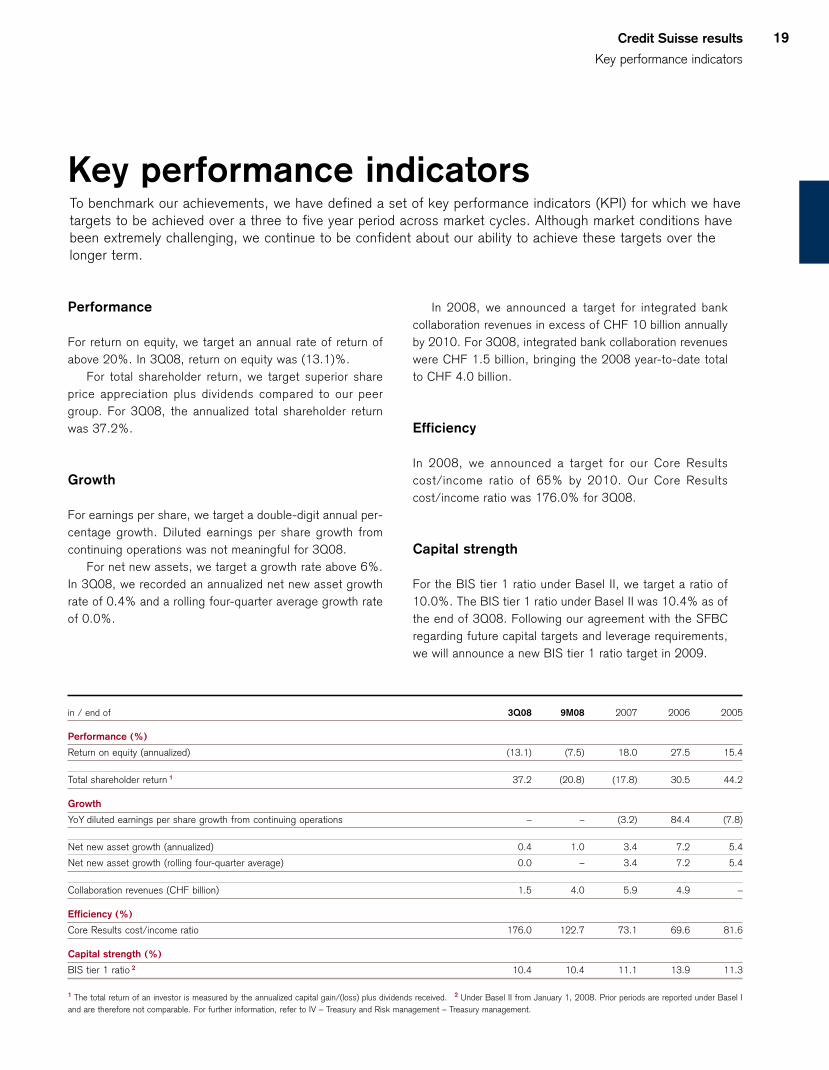
Key performance indicators To benchmark our achievements, we have defined a set of key performance indicators (KPI) for which we havetargets to be achieved over a three to five year period across market cycles. Although market conditions havebeen extremely challenging, we continue to be confident about our ability to achieve these targets over thelonger term.
in / end of 3Q08 9M08 2007 2006 2005
Performance (%)
Return on equity (annualized) (13.1) (7.5) 18.0 27.5 15.4
Total shareholder return 1 37.2 (20.8) (17.8) 30.5 44.2
Growth
YoY diluted earnings per share growth from continuing operations – – (3.2) 84.4 (7.8)
Net new asset growth (annualized) 0.4 1.0 3.4 7.2 5.4
Net new asset growth (rolling four-quarter average) 0.0 – 3.4 7.2 5.4
Collaboration revenues (CHF billion) 1.5 4.0 5.9 4.9 –
Efficiency (%)
Core Results cost/income ratio 176.0 122.7 73.1 69.6 81.6
Capital strength (%)
BIS tier 1 ratio 2 10.4 10.4 11.1 13.9 11.3
1 The total return of an investor is measured by the annualized capital gain/(loss) plus dividends received. 2 Under Basel II from January 1, 2008. Prior periods are reported under Basel I
and are therefore not comparable. For further information, refer to IV – Treasury and Risk management – Treasury management.
Performance
For return on equity, we target an annual rate of return of
above 20%. In 3Q08, return on equity was (13.1)%.
For total shareholder return, we target superior share
price appreciation plus dividends compared to our peer
group. For 3Q08, the annualized total shareholder return
was 37.2%.
Growth
For earnings per share, we target a double-digit annual per-
centage growth. Diluted earnings per share growth from
continuing operations was not meaningful for 3Q08.
For net new assets, we target a growth rate above 6%.
In 3Q08, we recorded an annualized net new asset growth
rate of 0.4% and a rolling four-quarter average growth rate
of 0.0%.
In 2008, we announced a target for integrated bank
collaboration revenues in excess of CHF 10 billion annually
by 2010. For 3Q08, integrated bank collaboration revenues
were CHF 1.5 billion, bringing the 2008 year-to-date total
to CHF 4.0 billion.
Efficiency
In 2008, we announced a target for our Core Results
cost/income ratio of 65% by 2010. Our Core Results
cost/income ratio was 176.0% for 3Q08.
Capital strength
For the BIS tier 1 ratio under Basel II, we target a ratio of
10.0%. The BIS tier 1 ratio under Basel II was 10.4% as of
the end of 3Q08. Following our agreement with the SFBC
regarding future capital targets and leverage requirements,
we will announce a new BIS tier 1 ratio target in 2009.

20
[THIS PAGE INTENTIONALLY LEFT BLANK]
II22 Private Banking
24 Wealth Management
29 Corporate & Retail Banking
32 Investment Banking
40 Asset Management
Results by division
22
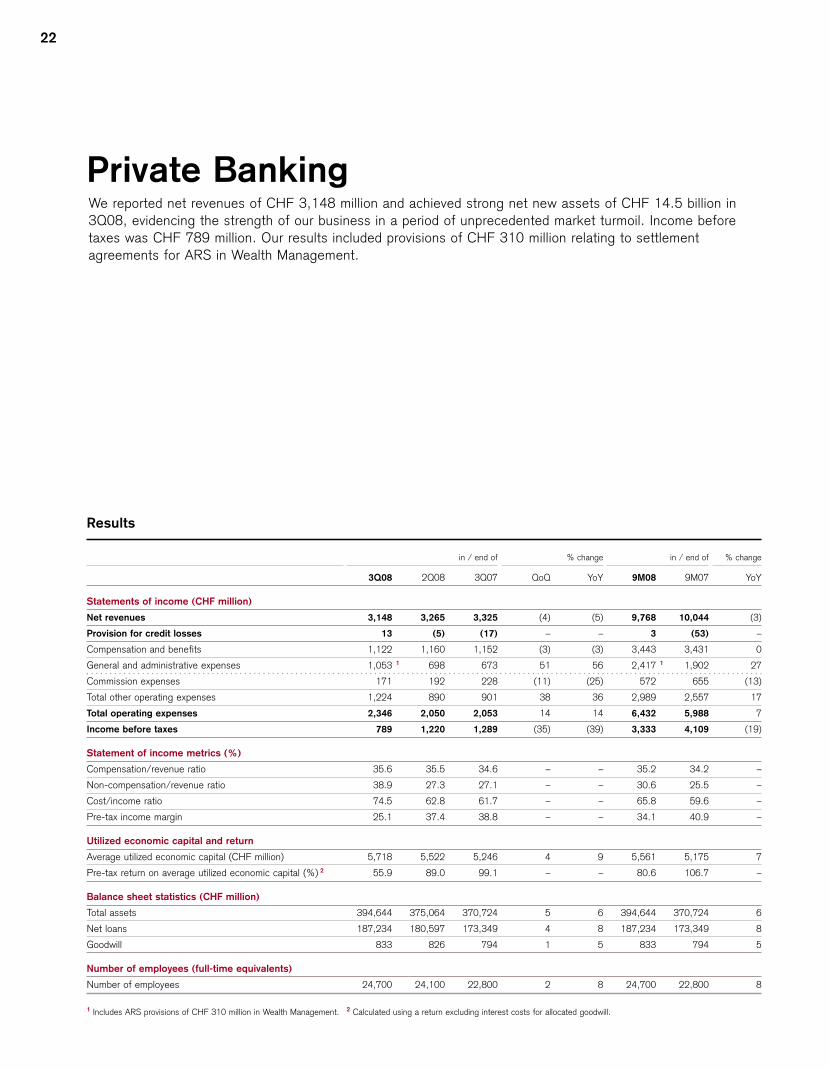
Private Banking We reported net revenues of CHF 3,148 million and achieved strong net new assets of CHF 14.5 billion in3Q08, evidencing the strength of our business in a period of unprecedented market turmoil. Income beforetaxes was CHF 789 million. Our results included provisions of CHF 310 million relating to settlementagreements for ARS in Wealth Management.
Results
in / end of % change in / end of % change
3Q08 2Q08 3Q07 QoQ YoY 9M08 9M07 YoY
Statements of income (CHF million)
Net revenues 3,148 3,265 3,325 (4) (5) 9,768 10,044 (3)
Provision for credit losses 13 (5) (17) – – 3 (53) –
Compensation and benefits 1,122 1,160 1,152 (3) (3) 3,443 3,431 0
General and administrative expenses 1,053 1 698 673 51 56 2,417 1 1,902 27
Commission expenses 171 192 228 (11) (25) 572 655 (13)
Total other operating expenses 1,224 890 901 38 36 2,989 2,557 17
Total operating expenses 2,346 2,050 2,053 14 14 6,432 5,988 7
Income before taxes 789 1,220 1,289 (35) (39) 3,333 4,109 (19)
Statement of income metrics (%)
Compensation/revenue ratio 35.6 35.5 34.6 – – 35.2 34.2 –
Non-compensation/revenue ratio 38.9 27.3 27.1 – – 30.6 25.5 –
Cost/income ratio 74.5 62.8 61.7 – – 65.8 59.6 –
Pre-tax income margin 25.1 37.4 38.8 – – 34.1 40.9 –
Utilized economic capital and return
Average utilized economic capital (CHF million) 5,718 5,522 5,246 4 9 5,561 5,175 7
Pre-tax return on average utilized economic capital (%) 2 55.9 89.0 99.1 – – 80.6 106.7 –
Balance sheet statistics (CHF million)
Total assets 394,644 375,064 370,724 5 6 394,644 370,724 6
Net loans 187,234 180,597 173,349 4 8 187,234 173,349 8
Goodwill 833 826 794 1 5 833 794 5
Number of employees (full-time equivalents)
Number of employees 24,700 24,100 22,800 2 8 24,700 22,800 8
1 Includes ARS provisions of CHF 310 million in Wealth Management. 2 Calculated using a return excluding interest costs for allocated goodwill.
Results by division
Private Banking
23
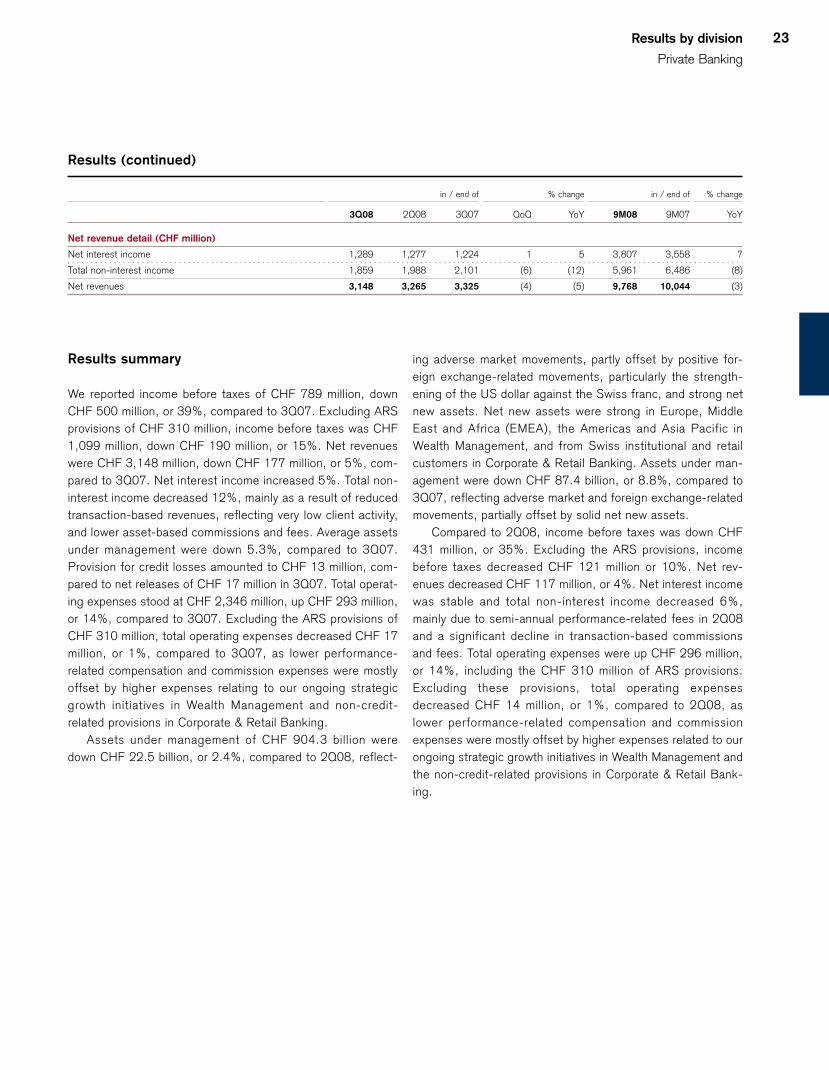
Results summary
We reported income before taxes of CHF 789 million, down
CHF 500 million, or 39%, compared to 3Q07. Excluding ARS
provisions of CHF 310 million, income before taxes was CHF
1,099 million, down CHF 190 million, or 15%. Net revenues
were CHF 3,148 million, down CHF 177 million, or 5%, com-
pared to 3Q07. Net interest income increased 5%. Total non-
interest income decreased 12%, mainly as a result of reduced
transaction-based revenues, reflecting very low client activity,
and lower asset-based commissions and fees. Average assets
under management were down 5.3%, compared to 3Q07.
Provision for credit losses amounted to CHF 13 million, com-
pared to net releases of CHF 17 million in 3Q07. Total operat-
ing expenses stood at CHF 2,346 million, up CHF 293 million,
or 14%, compared to 3Q07. Excluding the ARS provisions of
CHF 310 million, total operating expenses decreased CHF 17
million, or 1%, compared to 3Q07, as lower performance-
related compensation and commission expenses were mostly
offset by higher expenses relating to our ongoing strategic
growth initiatives in Wealth Management and non-credit-
related provisions in Corporate & Retail Banking.
Assets under management of CHF 904.3 bill ion were
down CHF 22.5 billion, or 2.4%, compared to 2Q08, reflect-
ing adverse market movements, partly offset by positive for-
eign exchange-related movements, particularly the strength-
ening of the US dollar against the Swiss franc, and strong net
new assets. Net new assets were strong in Europe, Middle
East and Africa (EMEA), the Americas and Asia Pacific in
Wealth Management, and from Swiss institutional and retail
customers in Corporate & Retail Banking. Assets under man-
agement were down CHF 87.4 billion, or 8.8%, compared to
3Q07, reflecting adverse market and foreign exchange-related
movements, partially offset by solid net new assets.
Compared to 2Q08, income before taxes was down CHF
431 million, or 35%. Excluding the ARS provisions, income
before taxes decreased CHF 121 million or 10%. Net rev-
enues decreased CHF 117 million, or 4%. Net interest income
was stable and total non-interest income decreased 6%,
mainly due to semi-annual performance-related fees in 2Q08
and a significant decline in transaction-based commissions
and fees. Total operating expenses were up CHF 296 million,
or 14%, including the CHF 310 million of ARS provisions.
Excluding these provisions, total operating expenses
decreased CHF 14 million, or 1%, compared to 2Q08, as
lower performance-related compensation and commission
expenses were mostly offset by higher expenses related to our
ongoing strategic growth initiatives in Wealth Management and
the non-credit-related provisions in Corporate & Retail Bank-
ing.
Results (continued)
in / end of % change in / end of % change
3Q08 2Q08 3Q07 QoQ YoY 9M08 9M07 YoY
Net revenue detail (CHF million)
Net interest income 1,289 1,277 1,224 1 5 3,807 3,558 7
Total non-interest income 1,859 1,988 2,101 (6) (12) 5,961 6,486 (8)
Net revenues 3,148 3,265 3,325 (4) (5) 9,768 10,044 (3)
24
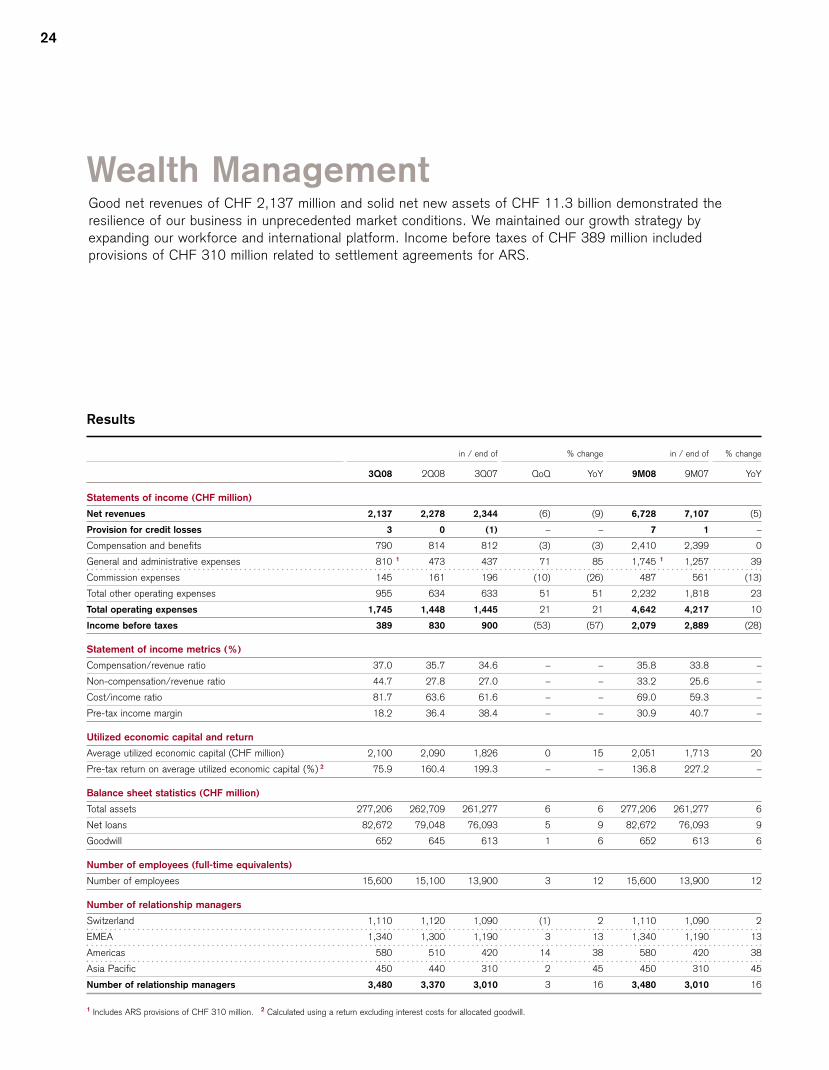
Wealth ManagementGood net revenues of CHF 2,137 million and solid net new assets of CHF 11.3 billion demonstrated theresilience of our business in unprecedented market conditions. We maintained our growth strategy byexpanding our workforce and international platform. Income before taxes of CHF 389 million includedprovisions of CHF 310 million related to settlement agreements for ARS.
Results
in / end of % change in / end of % change
3Q08 2Q08 3Q07 QoQ YoY 9M08 9M07 YoY
Statements of income (CHF million)
Net revenues 2,137 2,278 2,344 (6) (9) 6,728 7,107 (5)
Provision for credit losses 3 0 (1) – – 7 1 –
Compensation and benefits 790 814 812 (3) (3) 2,410 2,399 0
General and administrative expenses 810 1 473 437 71 85 1,745 1 1,257 39
Commission expenses 145 161 196 (10) (26) 487 561 (13)
Total other operating expenses 955 634 633 51 51 2,232 1,818 23
Total operating expenses 1,745 1,448 1,445 21 21 4,642 4,217 10
Income before taxes 389 830 900 (53) (57) 2,079 2,889 (28)
Statement of income metrics (%)
Compensation/revenue ratio 37.0 35.7 34.6 – – 35.8 33.8 –
Non-compensation/revenue ratio 44.7 27.8 27.0 – – 33.2 25.6 –
Cost/income ratio 81.7 63.6 61.6 – – 69.0 59.3 –
Pre-tax income margin 18.2 36.4 38.4 – – 30.9 40.7 –
Utilized economic capital and return
Average utilized economic capital (CHF million) 2,100 2,090 1,826 0 15 2,051 1,713 20
Pre-tax return on average utilized economic capital (%) 2 75.9 160.4 199.3 – – 136.8 227.2 –
Balance sheet statistics (CHF million)
Total assets 277,206 262,709 261,277 6 6 277,206 261,277 6
Net loans 82,672 79,048 76,093 5 9 82,672 76,093 9
Goodwill 652 645 613 1 6 652 613 6
Number of employees (full-time equivalents)
Number of employees 15,600 15,100 13,900 3 12 15,600 13,900 12
Number of relationship managers
Switzerland 1,110 1,120 1,090 (1) 2 1,110 1,090 2
EMEA 1,340 1,300 1,190 3 13 1,340 1,190 13
Americas 580 510 420 14 38 580 420 38
Asia Pacific 450 440 310 2 45 450 310 45
Number of relationship managers 3,480 3,370 3,010 3 16 3,480 3,010 16
1 Includes ARS provisions of CHF 310 million. 2 Calculated using a return excluding interest costs for allocated goodwill.
Results by division
Private Banking
25
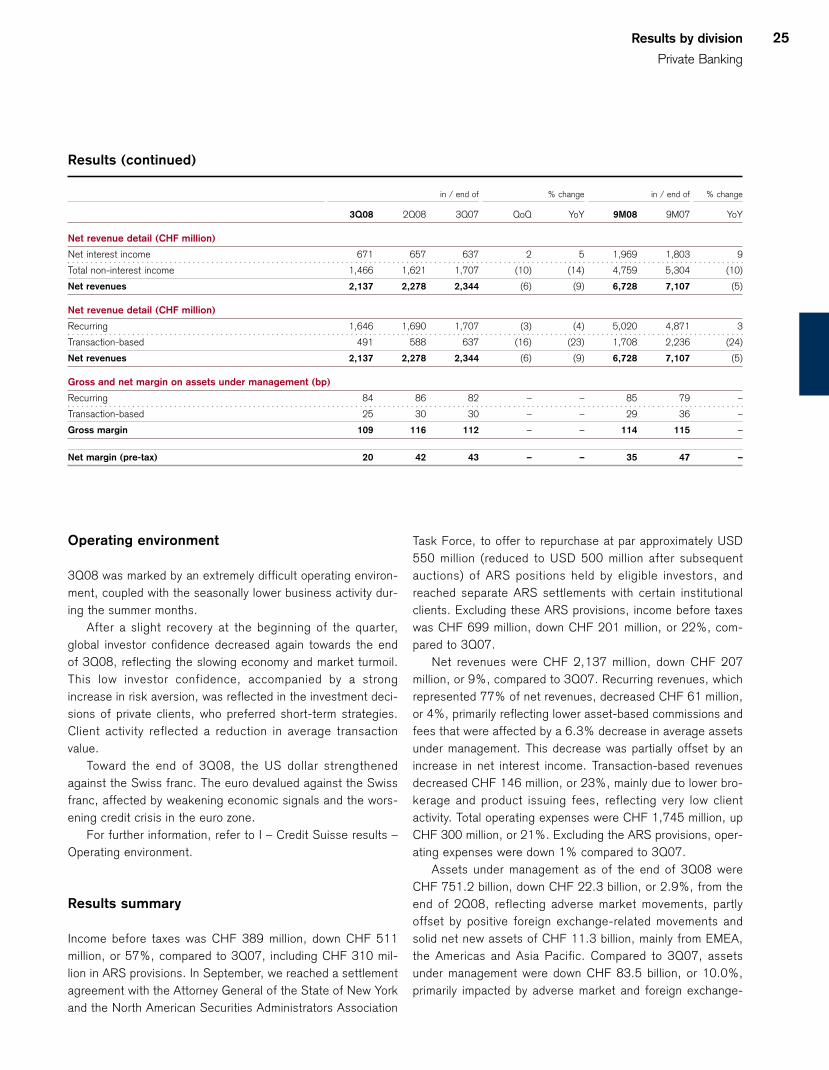
Operating environment
3Q08 was marked by an extremely difficult operating environ-
ment, coupled with the seasonally lower business activity dur-
ing the summer months.
After a slight recovery at the beginning of the quarter,
global investor confidence decreased again towards the end
of 3Q08, reflecting the slowing economy and market turmoil.
This low investor confidence, accompanied by a strong
increase in risk aversion, was reflected in the investment deci-
sions of private clients, who preferred short-term strategies.
Client activity reflected a reduction in average transaction
value.
Toward the end of 3Q08, the US dollar strengthened
against the Swiss franc. The euro devalued against the Swiss
franc, affected by weakening economic signals and the wors-
ening credit crisis in the euro zone.
For further information, refer to I – Credit Suisse results –
Operating environment.
Results summary
Income before taxes was CHF 389 million, down CHF 511
million, or 57%, compared to 3Q07, including CHF 310 mil-
lion in ARS provisions. In September, we reached a settlement
agreement with the Attorney General of the State of New York
and the North American Securities Administrators Association
Task Force, to offer to repurchase at par approximately USD
550 million (reduced to USD 500 million after subsequent
auctions) of ARS positions held by eligible investors, and
reached separate ARS settlements with certain institutional
clients. Excluding these ARS provisions, income before taxes
was CHF 699 million, down CHF 201 million, or 22%, com-
pared to 3Q07.
Net revenues were CHF 2,137 million, down CHF 207
million, or 9%, compared to 3Q07. Recurring revenues, which
represented 77% of net revenues, decreased CHF 61 million,
or 4%, primarily reflecting lower asset-based commissions and
fees that were affected by a 6.3% decrease in average assets
under management. This decrease was partially offset by an
increase in net interest income. Transaction-based revenues
decreased CHF 146 million, or 23%, mainly due to lower bro-
kerage and product issuing fees, reflecting very low client
activity. Total operating expenses were CHF 1,745 million, up
CHF 300 million, or 21%. Excluding the ARS provisions, oper-
ating expenses were down 1% compared to 3Q07.
Assets under management as of the end of 3Q08 were
CHF 751.2 billion, down CHF 22.3 billion, or 2.9%, from the
end of 2Q08, reflecting adverse market movements, partly
offset by positive foreign exchange-related movements and
solid net new assets of CHF 11.3 billion, mainly from EMEA,
the Americas and Asia Pacific. Compared to 3Q07, assets
under management were down CHF 83.5 billion, or 10.0%,
primarily impacted by adverse market and foreign exchange-
Results (continued)
in / end of % change in / end of % change
3Q08 2Q08 3Q07 QoQ YoY 9M08 9M07 YoY
Net revenue detail (CHF million)
Net interest income 671 657 637 2 5 1,969 1,803 9
Total non-interest income 1,466 1,621 1,707 (10) (14) 4,759 5,304 (10)
Net revenues 2,137 2,278 2,344 (6) (9) 6,728 7,107 (5)
Net revenue detail (CHF million)
Recurring 1,646 1,690 1,707 (3) (4) 5,020 4,871 3
Transaction-based 491 588 637 (16) (23) 1,708 2,236 (24)
Net revenues 2,137 2,278 2,344 (6) (9) 6,728 7,107 (5)
Gross and net margin on assets under management (bp)
Recurring 84 86 82 – – 85 79 –
Transaction-based 25 30 30 – – 29 36 –
Gross margin 109 116 112 – – 114 115 –
Net margin (pre-tax) 20 42 43 – – 35 47 –
26
related movements, partially offset by net new assets during
the period.
Compared to 2Q08, income before taxes was down CHF
441 million, or 53%. Excluding the ARS provisions, income
before taxes was CHF 131 million, or 16%, below 2Q08. Net
revenues were down 6%, mainly from lower transaction-based
revenues and semi-annual performance-based fees from
Hedging-Griffo in 2Q08. Total operating expenses were up
CHF 297 million, or 21%, reflecting the ARS provisions.
Excluding these ARS provisions, operating expenses were
down 1%.
We furthered our growth strategy by adding relationship
managers and related support staff and expanding our interna-
tional platform. We hired senior relationship managers across
all regions.
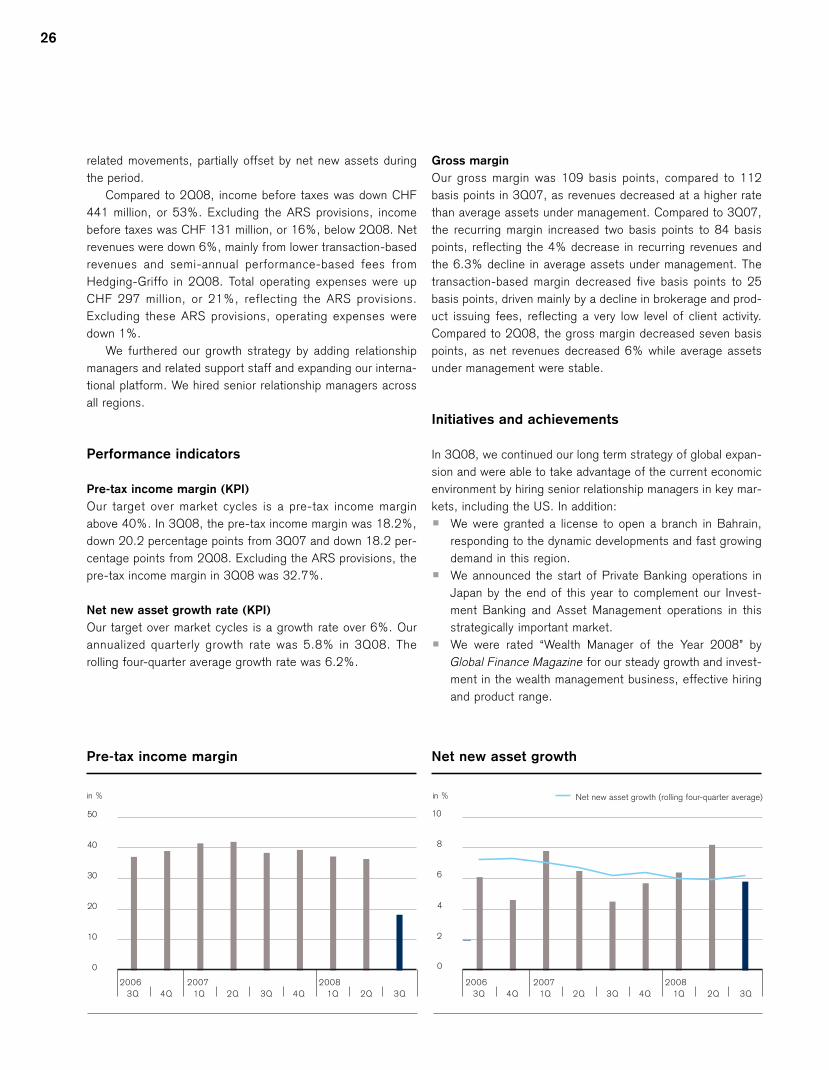
Performance indicators
Pre-tax income margin (KPI)
Our target over market cycles is a pre-tax income margin
above 40%. In 3Q08, the pre-tax income margin was 18.2%,
down 20.2 percentage points from 3Q07 and down 18.2 per-
centage points from 2Q08. Excluding the ARS provisions, the
pre-tax income margin in 3Q08 was 32.7%.
Net new asset growth rate (KPI)
Our target over market cycles is a growth rate over 6%. Our
annualized quarterly growth rate was 5.8% in 3Q08. The
rolling four-quarter average growth rate was 6.2%.
Gross margin
Our gross margin was 109 basis points, compared to 112
basis points in 3Q07, as revenues decreased at a higher rate
than average assets under management. Compared to 3Q07,
the recurring margin increased two basis points to 84 basis
points, reflecting the 4% decrease in recurring revenues and
the 6.3% decline in average assets under management. The
transaction-based margin decreased five basis points to 25
basis points, driven mainly by a decline in brokerage and prod-
uct issuing fees, reflecting a very low level of client activity.
Compared to 2Q08, the gross margin decreased seven basis
points, as net revenues decreased 6% while average assets
under management were stable.
Initiatives and achievements
In 3Q08, we continued our long term strategy of global expan-
sion and were able to take advantage of the current economic
environment by hiring senior relationship managers in key mar-
kets, including the US. In addition:
p We were granted a license to open a branch in Bahrain,
responding to the dynamic developments and fast growing
demand in this region.
p We announced the start of Private Banking operations in
Japan by the end of this year to complement our Invest-
ment Banking and Asset Management operations in this
strategically important market.
p We were rated “Wealth Manager of the Year 2008” by
Global Finance Magazine for our steady growth and invest-
ment in the wealth management business, effective hiring
and product range.
2006 2007 2008
0
10
20
30
40
50
in %
2Q 3Q 4Q 2Q 3Q1Q3Q 4Q 1Q
Pre-tax income margin
2006 2007 2008
0
2
4
6
8
10
in %
2Q 3Q 4Q 2Q 3Q1Q3Q 4Q 1Q
Net new asset growth (rolling four-quarter average)
Net new asset growth
Results by division
Private Banking
27
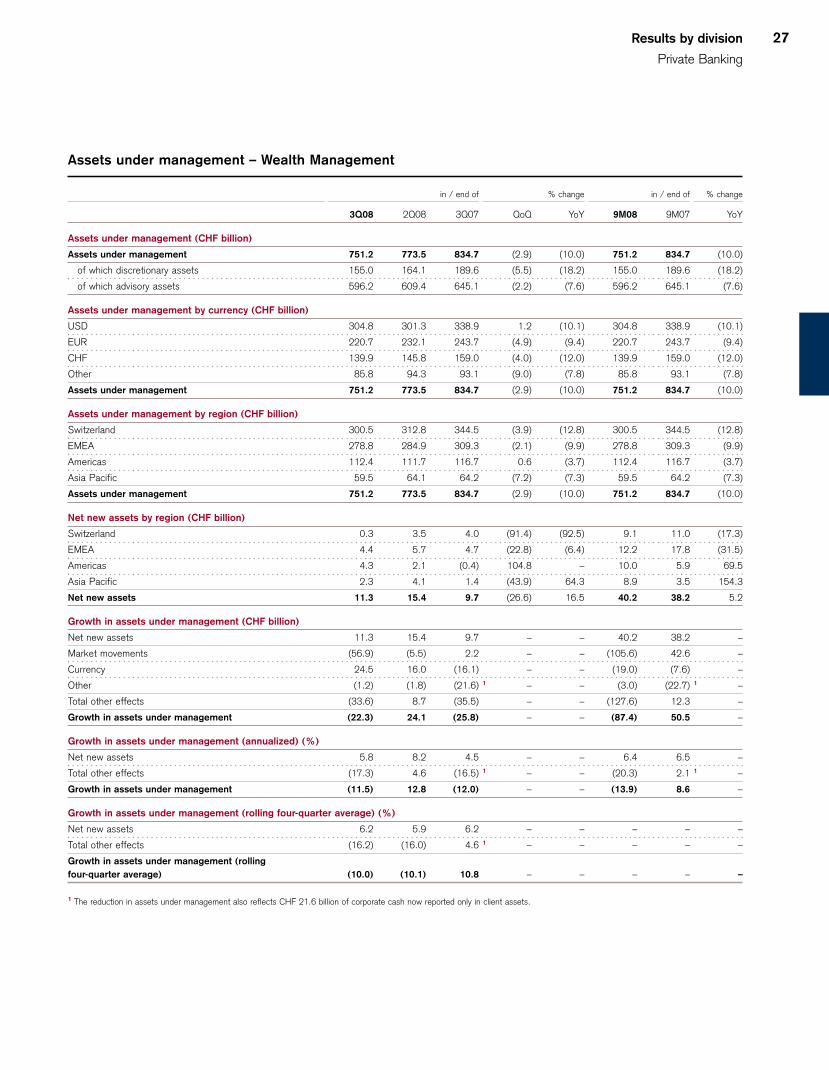
Assets under management – Wealth Management
in / end of % change in / end of % change
3Q08 2Q08 3Q07 QoQ YoY 9M08 9M07 YoY
Assets under management (CHF billion)
Assets under management 751.2 773.5 834.7 (2.9) (10.0) 751.2 834.7 (10.0)
of which discretionary assets 155.0 164.1 189.6 (5.5) (18.2) 155.0 189.6 (18.2)
of which advisory assets 596.2 609.4 645.1 (2.2) (7.6) 596.2 645.1 (7.6)
Assets under management by currency (CHF billion)
USD 304.8 301.3 338.9 1.2 (10.1) 304.8 338.9 (10.1)
EUR 220.7 232.1 243.7 (4.9) (9.4) 220.7 243.7 (9.4)
CHF 139.9 145.8 159.0 (4.0) (12.0) 139.9 159.0 (12.0)
Other 85.8 94.3 93.1 (9.0) (7.8) 85.8 93.1 (7.8)
Assets under management 751.2 773.5 834.7 (2.9) (10.0) 751.2 834.7 (10.0)
Assets under management by region (CHF billion)
Switzerland 300.5 312.8 344.5 (3.9) (12.8) 300.5 344.5 (12.8)
EMEA 278.8 284.9 309.3 (2.1) (9.9) 278.8 309.3 (9.9)
Americas 112.4 111.7 116.7 0.6 (3.7) 112.4 116.7 (3.7)
Asia Pacific 59.5 64.1 64.2 (7.2) (7.3) 59.5 64.2 (7.3)
Assets under management 751.2 773.5 834.7 (2.9) (10.0) 751.2 834.7 (10.0)
Net new assets by region (CHF billion)
Switzerland 0.3 3.5 4.0 (91.4) (92.5) 9.1 11.0 (17.3)
EMEA 4.4 5.7 4.7 (22.8) (6.4) 12.2 17.8 (31.5)
Americas 4.3 2.1 (0.4) 104.8 – 10.0 5.9 69.5
Asia Pacific 2.3 4.1 1.4 (43.9) 64.3 8.9 3.5 154.3
Net new assets 11.3 15.4 9.7 (26.6) 16.5 40.2 38.2 5.2
Growth in assets under management (CHF billion)
Net new assets 11.3 15.4 9.7 – – 40.2 38.2 –
Market movements (56.9) (5.5) 2.2 – – (105.6) 42.6 –
Currency 24.5 16.0 (16.1) – – (19.0) (7.6) –
Other (1.2) (1.8) (21.6) 1 – – (3.0) (22.7) 1 –
Total other effects (33.6) 8.7 (35.5) – – (127.6) 12.3 –
Growth in assets under management (22.3) 24.1 (25.8) – – (87.4) 50.5 –
Growth in assets under management (annualized) (%)
Net new assets 5.8 8.2 4.5 – – 6.4 6.5 –
Total other effects (17.3) 4.6 (16.5) 1 – – (20.3) 2.1 1 –
Growth in assets under management (11.5) 12.8 (12.0) – – (13.9) 8.6 –
Growth in assets under management (rolling four-quarter average) (%)
Net new assets 6.2 5.9 6.2 – – – – –
Total other effects (16.2) (16.0) 4.6 1 – – – – –
Growth in assets under management (rolling
four-quarter average) (10.0) (10.1) 10.8 – – – – –
1 The reduction in assets under management also reflects CHF 21.6 billion of corporate cash now reported only in client assets.
28
p The Handelsblatt Elite Report gave our Swiss and German
wealth management businesses summa cum laude, its
highest award.
p We were rated by Fuchsbriefe as the best wealth manager
in the German-speaking area in the “Top Wealth Manage-
ment Plus” and “Best Advisory Meeting” categories and
rated second in the category “all-time best list.”
Results detail
The following provides a comparison of our 3Q08 results ver-
sus 3Q07 (YoY) and versus 2Q08 (QoQ).
Net revenues
Recurring
Recurring revenues arise from recurring net interest income,
commissions and fees, including performance-based fees,
related to assets under management and custody assets, as
well as fees for general banking products and services.
YoY: Down 4% from CHF 1,707 million to CHF 1,646 million
The decrease primarily reflected lower asset-based commis-
sions and fees, particularly from managed investment prod-
ucts, as average assets under management declined 6.3%.
This decrease in revenues was partially offset by higher net
interest income.
QoQ: Down 3% from CHF 1,690 million to CHF 1,646 million
The decline mainly reflected the semi-annual performance-
based fees from Hedging-Griffo in 2Q08 and lower asset-
based fees from managed investment products in 3Q08.
Transaction-based
Transaction-based revenues arise primarily from brokerage
and product issuing fees, client foreign exchange income and
other transaction-based income.
YoY: Down 23% from CHF 637 million to CHF 491 million
The decrease was mainly driven by a decline in brokerage and
product issuing fees and lower client foreign exchange income
due to very low client activity.
QoQ: Down 16% from CHF 588 million to CHF 491 million
The decrease was mainly driven by lower brokerage and prod-
uct issuing fees due to very low client activity.
Provision for credit losses
YoY: From CHF (1) million to CHF 3 million
Provisions for credit losses were stable.
QoQ: From nil to CHF 3 million
Provisions for credit losses were stable.
Operating expenses
Compensation and benefits
YoY: Down 3% from CHF 812 million to CHF 790 million
The decrease was due to lower performance-related compen-
sation, reflecting the lower results, mostly offset by the impact
of higher salaries and benefits from increased headcount
related to international expansion.
QoQ: Down 3% from CHF 814 million to CHF 790 million
The decrease reflected the lower performance-related com-
pensation, mostly offset by higher salaries and benefits.
General and administrative expenses
YoY: Up 85% from CHF 437 million to CHF 810 million
The increase was primarily due to the ARS provisions of CHF
310 million. Excluding these provisions, general and adminis-
trative expenses increased 14%, mainly reflecting international
expansion infrastructure costs, including premises and equip-
ment and information technology expenses.
QoQ: Up 71% from CHF 473 million to CHF 810 million
The increase primarily reflected the ARS provisions. Excluding
these provisions, general and administrative expenses
increased CHF 27 million, or 6%, mainly from higher interna-
tional infrastructure costs.
Personnel
Since 3Q07, we have increased headcount by 1,700 and
strengthened our front-office teams. As of the end of 3Q08,
we had 3,480 relationship managers, an increase of 470 from
the end of 3Q07, primarily in the Americas, EMEA and Asia
Pacific. From the end of 2Q08, the number of relationship
managers increased by 110, mainly in the Americas, EMEA
and Asia Pacific. We continue to have a strong hiring pipeline
for experienced relationship managers and we plan to hire
additional relationship managers globally.
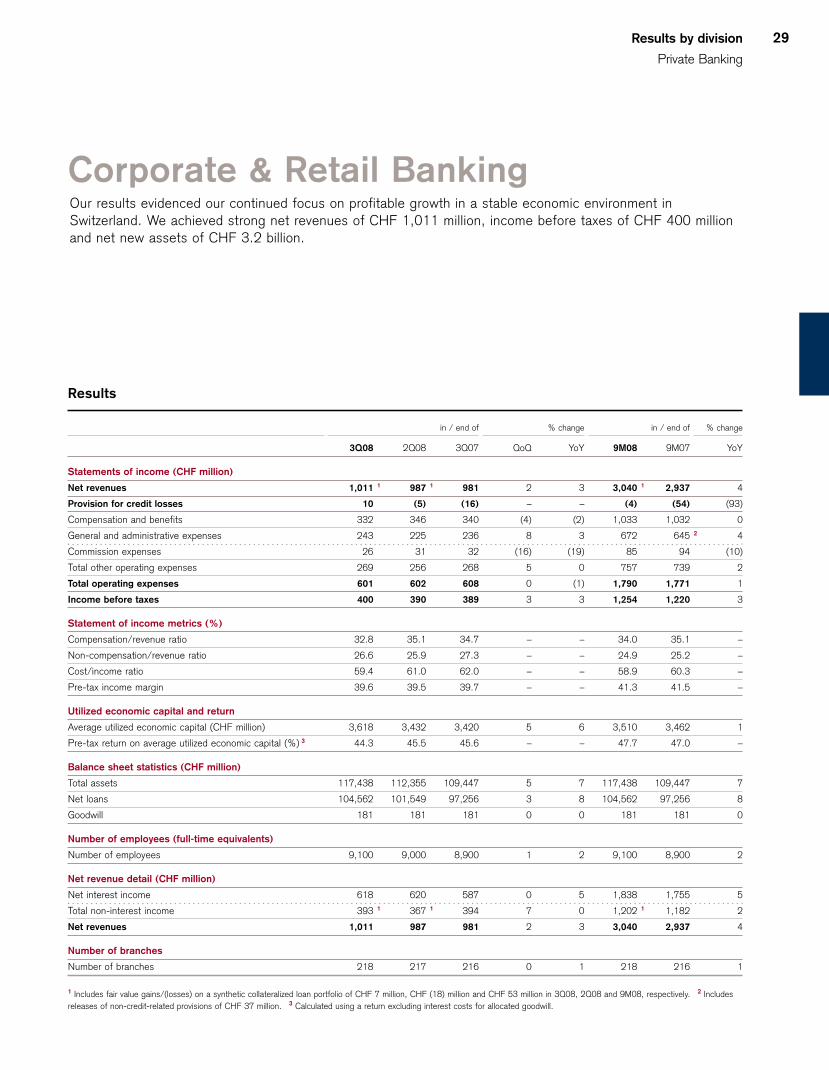
Results by division
Private Banking
29
Corporate & Retail BankingOur results evidenced our continued focus on profitable growth in a stable economic environment inSwitzerland. We achieved strong net revenues of CHF 1,011 million, income before taxes of CHF 400 millionand net new assets of CHF 3.2 billion.
Results
in / end of % change in / end of % change
3Q08 2Q08 3Q07 QoQ YoY 9M08 9M07 YoY
Statements of income (CHF million)
Net revenues 1,011 1 987 1 981 2 3 3,040 1 2,937 4
Provision for credit losses 10 (5) (16) – – (4) (54) (93)
Compensation and benefits 332 346 340 (4) (2) 1,033 1,032 0
General and administrative expenses 243 225 236 8 3 672 645 2 4
Commission expenses 26 31 32 (16) (19) 85 94 (10)
Total other operating expenses 269 256 268 5 0 757 739 2
Total operating expenses 601 602 608 0 (1) 1,790 1,771 1
Income before taxes 400 390 389 3 3 1,254 1,220 3
Statement of income metrics (%)
Compensation/revenue ratio 32.8 35.1 34.7 – – 34.0 35.1 –
Non-compensation/revenue ratio 26.6 25.9 27.3 – – 24.9 25.2 –
Cost/income ratio 59.4 61.0 62.0 – – 58.9 60.3 –
Pre-tax income margin 39.6 39.5 39.7 – – 41.3 41.5 –
Utilized economic capital and return
Average utilized economic capital (CHF million) 3,618 3,432 3,420 5 6 3,510 3,462 1
Pre-tax return on average utilized economic capital (%) 3 44.3 45.5 45.6 – – 47.7 47.0 –
Balance sheet statistics (CHF million)
Total assets 117,438 112,355 109,447 5 7 117,438 109,447 7
Net loans 104,562 101,549 97,256 3 8 104,562 97,256 8
Goodwill 181 181 181 0 0 181 181 0
Number of employees (full-time equivalents)
Number of employees 9,100 9,000 8,900 1 2 9,100 8,900 2
Net revenue detail (CHF million)
Net interest income 618 620 587 0 5 1,838 1,755 5
Total non-interest income 393 1 367 1 394 7 0 1,202 1 1,182 2
Net revenues 1,011 987 981 2 3 3,040 2,937 4
Number of branches
Number of branches 218 217 216 0 1 218 216 1
1 Includes fair value gains/(losses) on a synthetic collateralized loan portfolio of CHF 7 million, CHF (18) million and CHF 53 million in 3Q08, 2Q08 and 9M08, respectively. 2 Includes
releases of non-credit-related provisions of CHF 37 million. 3 Calculated using a return excluding interest costs for allocated goodwill.
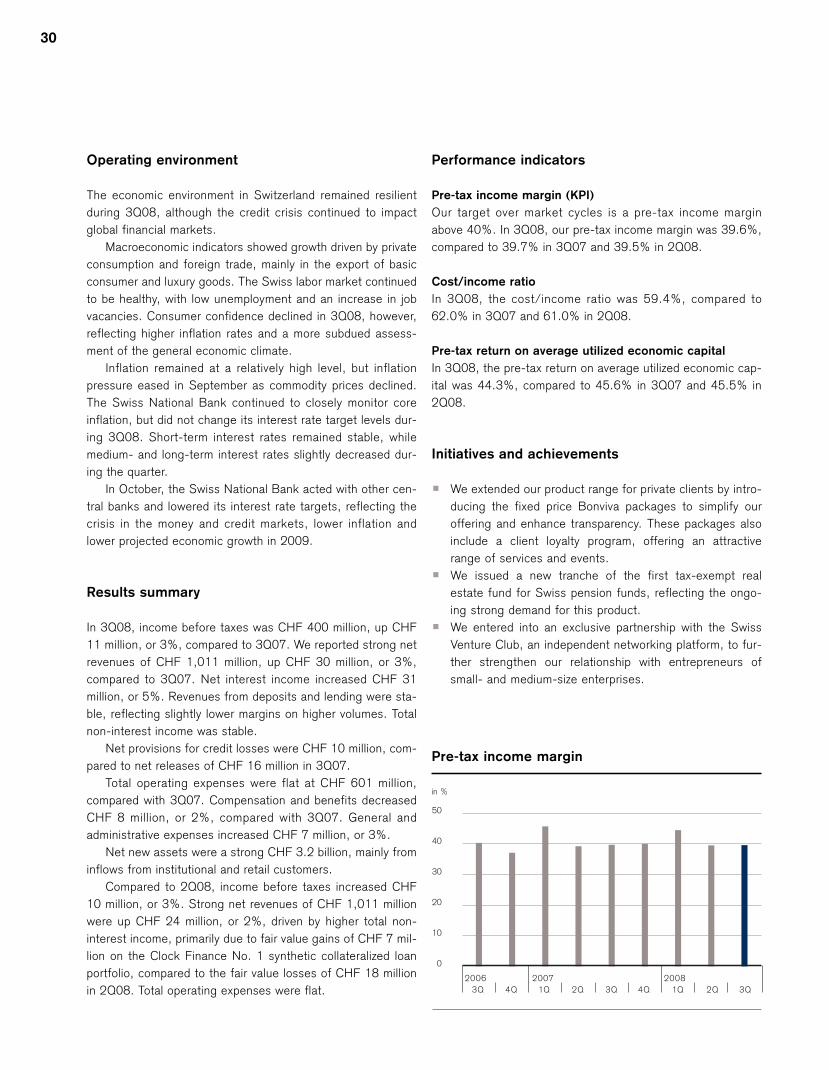
30
Operating environment
The economic environment in Switzerland remained resilient
during 3Q08, although the credit crisis continued to impact
global financial markets.
Macroeconomic indicators showed growth driven by private
consumption and foreign trade, mainly in the export of basic
consumer and luxury goods. The Swiss labor market continued
to be healthy, with low unemployment and an increase in job
vacancies. Consumer confidence declined in 3Q08, however,
reflecting higher inflation rates and a more subdued assess-
ment of the general economic climate.
Inflation remained at a relatively high level, but inflation
pressure eased in September as commodity prices declined.
The Swiss National Bank continued to closely monitor core
inflation, but did not change its interest rate target levels dur-
ing 3Q08. Short-term interest rates remained stable, while
medium- and long-term interest rates slightly decreased dur-
ing the quarter.
In October, the Swiss National Bank acted with other cen-
tral banks and lowered its interest rate targets, reflecting the
crisis in the money and credit markets, lower inflation and
lower projected economic growth in 2009.
Results summary
In 3Q08, income before taxes was CHF 400 million, up CHF
11 million, or 3%, compared to 3Q07. We reported strong net
revenues of CHF 1,011 million, up CHF 30 million, or 3%,
compared to 3Q07. Net interest income increased CHF 31
million, or 5%. Revenues from deposits and lending were sta-
ble, reflecting slightly lower margins on higher volumes. Total
non-interest income was stable.
Net provisions for credit losses were CHF 10 million, com-
pared to net releases of CHF 16 million in 3Q07.
Total operating expenses were flat at CHF 601 million,
compared with 3Q07. Compensation and benefits decreased
CHF 8 million, or 2%, compared with 3Q07. General and
administrative expenses increased CHF 7 million, or 3%.
Net new assets were a strong CHF 3.2 billion, mainly from
inflows from institutional and retail customers.
Compared to 2Q08, income before taxes increased CHF
10 million, or 3%. Strong net revenues of CHF 1,011 million
were up CHF 24 million, or 2%, driven by higher total non-
interest income, primarily due to fair value gains of CHF 7 mil-
lion on the Clock Finance No. 1 synthetic collateralized loan
portfolio, compared to the fair value losses of CHF 18 million
in 2Q08. Total operating expenses were flat.
Performance indicators
Pre-tax income margin (KPI)
Our target over market cycles is a pre-tax income margin
above 40%. In 3Q08, our pre-tax income margin was 39.6%,
compared to 39.7% in 3Q07 and 39.5% in 2Q08.
Cost/income ratio
In 3Q08, the cost/income ratio was 59.4%, compared to
62.0% in 3Q07 and 61.0% in 2Q08.
Pre-tax return on average utilized economic capital
In 3Q08, the pre-tax return on average utilized economic cap-
ital was 44.3%, compared to 45.6% in 3Q07 and 45.5% in
2Q08.
Initiatives and achievements
p We extended our product range for private clients by intro-
ducing the fixed price Bonviva packages to simplify our
offering and enhance transparency. These packages also
include a client loyalty program, offering an attractive
range of services and events.
p We issued a new tranche of the first tax-exempt real
estate fund for Swiss pension funds, reflecting the ongo-
ing strong demand for this product.
p We entered into an exclusive partnership with the Swiss
Venture Club, an independent networking platform, to fur-
ther strengthen our relationship with entrepreneurs of
small- and medium-size enterprises.
2006 2007 2008
0
10
20
30
40
50
in %
2Q 3Q 4Q 2Q 3Q1Q3Q 4Q 1Q
Pre-tax income margin
Results by division
Private Banking
31
Results detail
The following provides a comparison of our 3Q08 results ver-
sus 3Q07 (YoY) and versus 2Q08 (QoQ).
Net revenues
Net interest income
YoY: Up 5% from CHF 587 million to CHF 618 million
Revenues from deposits and lending were stable, reflecting
lower margins on higher volumes.
QoQ: Stable at CHF 618 million
Net interest income reflected slightly higher revenues from
deposits, primarily reflecting improved margins.
Total non-interest income
YoY: Stable at CHF 393 million
Total non-interest income was stable, with fair value gains of
CHF 7 million from the Clock Finance No. 1 synthetic collater-
alized loan portfolio offset by lower commissions and fees.
QoQ: Up 7% from CHF 367 million to CHF 393 million
The increase was mainly due to the fair value gains on Clock
Finance No. 1, compared to losses of CHF 18 million on this
portfolio in 2Q08.
Provision for credit losses
YoY: From CHF (16) million to CHF 10 million
We recorded net provisions of CHF 10 million, which included
provisions of CHF 31 million and releases of CHF 21 million,
reflecting a lower level of releases of credit provisions com-
pared to 3Q07.
QoQ: From CHF (5) million to CHF 10 million
We recorded net provisions of CHF 10 million, reflecting a
lower level of releases of credit provisions.
Operating expenses
Compensation and benefits
YoY: Down 2% from CHF 340 million to CHF 332 million
The decrease reflected lower salaries and benefits partially
offset by higher performance-related compensation.
QoQ: Down 4% from CHF 346 million to CHF 332 million
The decrease reflected lower performance-related compensa-
tion.
General and administrative expenses
YoY: Up 3% from CHF 236 million to CHF 243 million
The increase was due to higher non-credit-related provisions,
partially offset by lower sales and marketing expenses.
QoQ: Up 8% from CHF 225 million to CHF 243 million
The increase reflected the non-credit-related provisions, par-
tially offset by lower sales and marketing expenses.

32
Investment BankingWe reported a loss before taxes of CHF 3,225 million. Net revenues declined significantly to negative CHF515 million, reflecting unprecedented market disruption that adversely affected most of our businesses,including net valuation reductions in our structured products and leveraged finance businesses. Net revenuesincluded fair value gains on Credit Suisse own debt of CHF 1,876 million. We had strong results in the globalrates and foreign exchange businesses and good results in prime services and equity derivatives.
Results
in / end of % change in / end of % change
3Q08 2Q08 3Q07 QoQ YoY 9M08 9M07 YoY
Statements of income (CHF million)
Net revenues (515) 3,740 2,097 – – 2,736 16,217 (83)
Provision for credit losses 119 50 20 138 495 325 90 261
Compensation and benefits 1,492 2,462 839 (39) 78 5,672 8,111 (30)
General and administrative expenses 751 1 652 2 864 15 (13) 2,151 1, 2 2,494 (14)
Commission expenses 348 295 368 18 (5) 992 1,024 (3)
Total other operating expenses 1,099 947 1,232 16 (11) 3,143 3,518 (11)
Total operating expenses 2,591 3,409 2,071 (24) 25 8,815 11,629 (24)
Income/(loss) before taxes (3,225) 281 6 – – (6,404) 4,498 –
Statement of income metrics (%)
Compensation/revenue ratio – 65.8 40.0 – – 207.3 50.0 –
Non-compensation/revenue ratio – 25.3 58.8 – – 114.9 21.7 –
Cost/income ratio – 91.1 98.8 – – 322.2 71.7 –
Pre-tax income margin – 7.5 0.3 – – – 27.7 –
Utilized economic capital and return
Average utilized economic capital (CHF million) 17,562 16,580 20,221 6 (13) 17,787 20,315 (12)
Pre-tax return on average utilized economic capital (%) 3 (72.7) 7.5 1.2 – – (47.3) 30.6 –
Balance sheet statistics (CHF million)
Total assets 1,180,743 1,021,587 1,156,573 16 2 1,180,743 1,156,573 2
Net loans 61,308 54,011 53,097 14 15 61,308 53,097 15
Goodwill 7,424 6,864 7,551 8 (2) 7,424 7,551 (2)
Number of employees (full-time equivalents)
Number of employees 21,300 20,500 20,300 4 5 21,300 20,300 5
1 Includes a release from the reserve for certain private litigation matters of CHF 73 million. 2 Includes a net credit pertaining to litigation of CHF 134 million. 3 Calculated using a return
excluding interest costs for allocated goodwill.
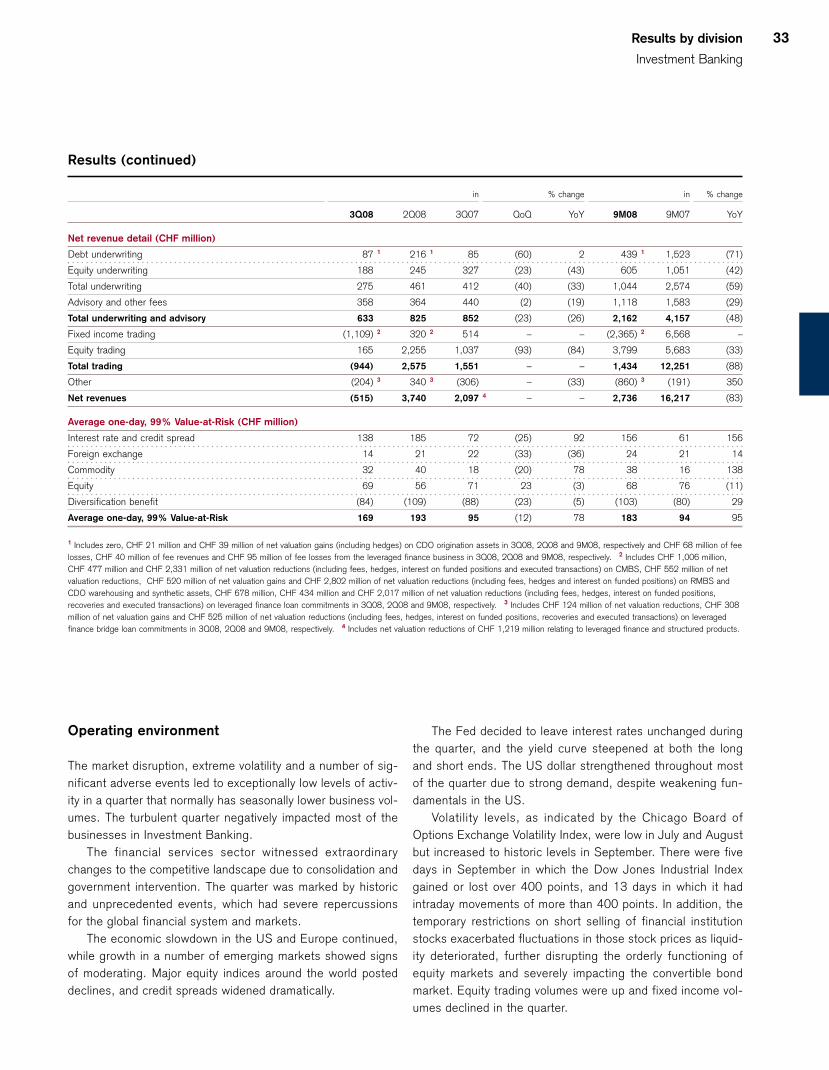
Results by division
Investment Banking
33
Operating environment
The market disruption, extreme volatility and a number of sig-
nificant adverse events led to exceptionally low levels of activ-
ity in a quarter that normally has seasonally lower business vol-
umes. The turbulent quarter negatively impacted most of the
businesses in Investment Banking.
The financial services sector witnessed extraordinary
changes to the competitive landscape due to consolidation and
government intervention. The quarter was marked by historic
and unprecedented events, which had severe repercussions
for the global financial system and markets.
The economic slowdown in the US and Europe continued,
while growth in a number of emerging markets showed signs
of moderating. Major equity indices around the world posted
declines, and credit spreads widened dramatically.
The Fed decided to leave interest rates unchanged during
the quarter, and the yield curve steepened at both the long
and short ends. The US dollar strengthened throughout most
of the quarter due to strong demand, despite weakening fun-
damentals in the US.
Volatility levels, as indicated by the Chicago Board of
Options Exchange Volatility Index, were low in July and August
but increased to historic levels in September. There were five
days in September in which the Dow Jones Industrial Index
gained or lost over 400 points, and 13 days in which it had
intraday movements of more than 400 points. In addition, the
temporary restrictions on short selling of financial institution
stocks exacerbated fluctuations in those stock prices as liquid-
ity deteriorated, further disrupting the orderly functioning of
equity markets and severely impacting the convertible bond
market. Equity trading volumes were up and fixed income vol-
umes declined in the quarter.
Results (continued)
in % change in % change
3Q08 2Q08 3Q07 QoQ YoY 9M08 9M07 YoY
Net revenue detail (CHF million)
Debt underwriting 87 1 216 1 85 (60) 2 439 1 1,523 (71)
Equity underwriting 188 245 327 (23) (43) 605 1,051 (42)
Total underwriting 275 461 412 (40) (33) 1,044 2,574 (59)
Advisory and other fees 358 364 440 (2) (19) 1,118 1,583 (29)
Total underwriting and advisory 633 825 852 (23) (26) 2,162 4,157 (48)
Fixed income trading (1,109) 2 320 2 514 – – (2,365) 2 6,568 –
Equity trading 165 2,255 1,037 (93) (84) 3,799 5,683 (33)
Total trading (944) 2,575 1,551 – – 1,434 12,251 (88)
Other (204) 3 340 3 (306) – (33) (860) 3 (191) 350
Net revenues (515) 3,740 2,097 4 – – 2,736 16,217 (83)
Average one-day, 99% Value-at-Risk (CHF million)
Interest rate and credit spread 138 185 72 (25) 92 156 61 156
Foreign exchange 14 21 22 (33) (36) 24 21 14
Commodity 32 40 18 (20) 78 38 16 138
Equity 69 56 71 23 (3) 68 76 (11)
Diversification benefit (84) (109) (88) (23) (5) (103) (80) 29
Average one-day, 99% Value-at-Risk 169 193 95 (12) 78 183 94 95
1 Includes zero, CHF 21 million and CHF 39 million of net valuation gains (including hedges) on CDO origination assets in 3Q08, 2Q08 and 9M08, respectively and CHF 68 million of fee
losses, CHF 40 million of fee revenues and CHF 95 million of fee losses from the leveraged finance business in 3Q08, 2Q08 and 9M08, respectively. 2 Includes CHF 1,006 million,
CHF 477 million and CHF 2,331 million of net valuation reductions (including fees, hedges, interest on funded positions and executed transactions) on CMBS, CHF 552 million of net
valuation reductions, CHF 520 million of net valuation gains and CHF 2,802 million of net valuation reductions (including fees, hedges and interest on funded positions) on RMBS and
CDO warehousing and synthetic assets, CHF 678 million, CHF 434 million and CHF 2,017 million of net valuation reductions (including fees, hedges, interest on funded positions,
recoveries and executed transactions) on leveraged finance loan commitments in 3Q08, 2Q08 and 9M08, respectively. 3 Includes CHF 124 million of net valuation reductions, CHF 308
million of net valuation gains and CHF 525 million of net valuation reductions (including fees, hedges, interest on funded positions, recoveries and executed transactions) on leveraged
finance bridge loan commitments in 3Q08, 2Q08 and 9M08, respectively. 4 Includes net valuation reductions of CHF 1,219 million relating to leveraged finance and structured products.
34
Debt and equity underwriting volumes were significantly
down in all regions from 2Q08 levels due to decreased
demand for all fixed income products, lower equity valuations
and general market uncertainty. Due to tightened lending
practices by banks and the inability to raise capital in the mar-
kets at acceptable levels, announced mergers and acquisitions
were down compared to 3Q07.
For further information, refer to I – Credit Suisse results –
Operating environment.
Results summary
In 3Q08, the loss before taxes was CHF 3,225 million, com-
pared to income before taxes of CHF 6 million in 3Q07. Net
revenues were negative CHF 515 million, compared to CHF
2,097 million in 3Q07, due to the widespread market disrup-
tion, exacerbated in September by the failure of a major finan-
cial institution, that adversely affected most of our businesses.
Our combined leveraged finance and structured products busi-
nesses had net valuation reductions of CHF 2,428 million in
3Q08. Other areas negatively impacted by the turbulence in
the market environment included our corporate lending busi-
ness, convertibles and our long/short and event and risk arbi-
trage strategies, which recorded significant losses. In busi-
nesses less impacted by the market disruption, including
global rates, foreign exchange, prime services and equity
derivatives, we reported solid results. Total operating expenses
were CHF 2,591 million, up CHF 520 million, or 25%. A nom-
inal performance-related compensation accrual was recorded
in 3Q08. The increase primarily reflected the very low per-
formance-related compensation in 3Q07 when the credit crisis
began, following a record first half.
Results in 3Q08 were negatively impacted by significantly
lower fixed income trading revenues. These results primarily
reflected net valuation reductions in our structured products
and leveraged finance business and losses in our corporate
lending business. The results also included net valuation
reductions from our investments in the preferred shares and
hybrid capital securities of certain financial institutions and
losses in commodities. These results were partially offset by
strong revenues in the global rates and foreign exchange busi-
nesses.
Equity trading revenues declined substantially, primarily
due to significant losses in convertibles and our long/short and
event and risk arbitrage strategies, as well as weaker results in
global cash equities. These results were partially offset by
good performance in prime services and equity derivatives.
Fixed income and equity trading benefited from fair value gains
of CHF 1,876 million due to widening credit spreads on Credit
Suisse debt.
Our underwriting and advisory businesses had lower rev-
enues compared to 3Q07, in line with the decline in overall
market activity.
Compared to 2Q08, the loss before taxes was driven by
lower revenues in most business areas, including significantly
League table positions
in / end of
3Q08 9M08 2007 2006
League table rank / market share (% – rounded) 1
Global fee pool 2 3 / 7% 7 / 5% 7 / 5% 4 / 6%
High yield 3 6 / 9% 3 / 12% 2 / 11% 3 / 12%
Investment grade 3 4 / 5% 12 / 4% 13 / 3% 13 / 3%
Asset-backed 3 8 / 4% 9 / 3% 10 / 5% 8 / 5%
Mortgage-backed 3 2 / 12% 2 / 11% 4 / 7% 5 / 7%
Total debt underwriting 3 7 / 5% 7 / 5% 11 / 4% 8 / 5%
IPO 2 2 / 10% 10 / 4% 3 / 8% 4 / 7%
Follow-on 2 1 / 10% 7 / 5% 7 / 6% 7 / 6%
Convertible 2 10 / 4% 10 / 3% 9 / 5% 11 / 4%
Total equity underwriting 2 2 / 9% 8 / 4% 7 / 6% 7 / 6%
Announced mergers and acquisitions 3 7 / 12% 7 / 17% 6 / 20% 6 / 19%
Completed mergers and acquisitions 3 11 / 15% 6 / 22% 8 / 18% 8 / 15%
1 Volume-based, except global fee pool 2 Dealogic 3 Thomson Financial
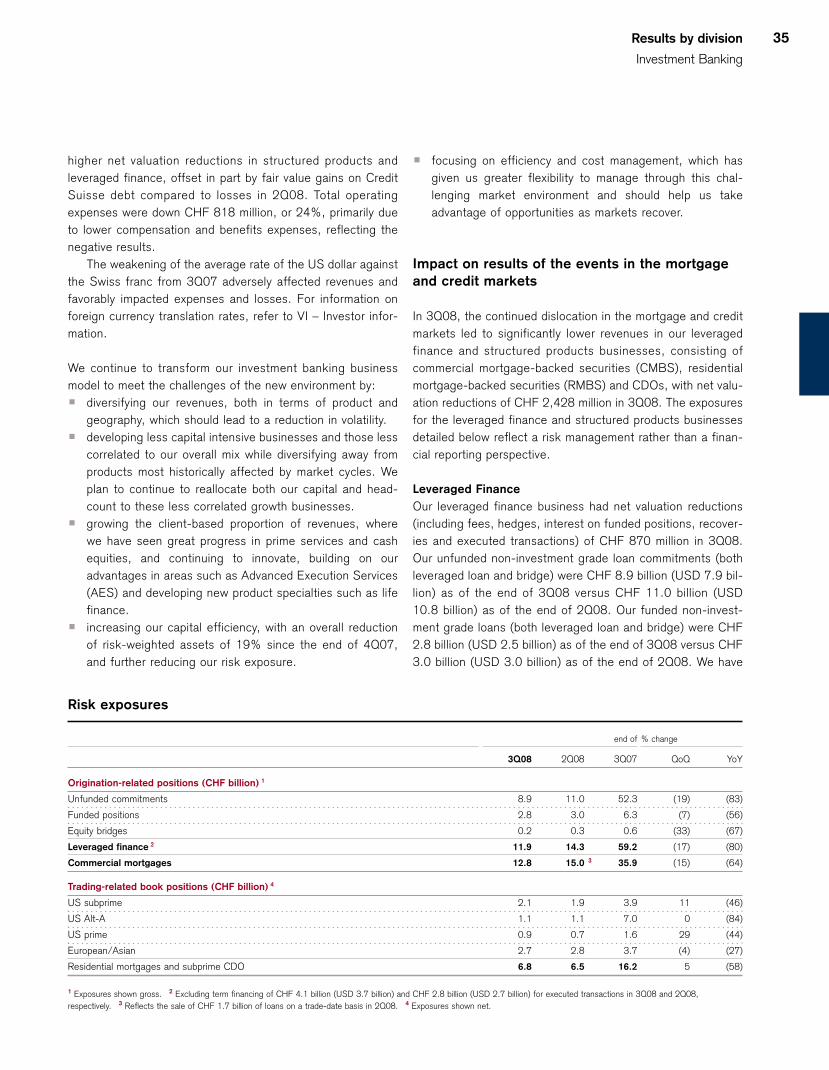
higher net valuation reductions in structured products and
leveraged finance, offset in part by fair value gains on Credit
Suisse debt compared to losses in 2Q08. Total operating
expenses were down CHF 818 million, or 24%, primarily due
to lower compensation and benefits expenses, reflecting the
negative results.
The weakening of the average rate of the US dollar against
the Swiss franc from 3Q07 adversely affected revenues and
favorably impacted expenses and losses. For information on
foreign currency translation rates, refer to VI – Investor infor-
mation.
We continue to transform our investment banking business
model to meet the challenges of the new environment by:
p diversifying our revenues, both in terms of product and
geography, which should lead to a reduction in volatility.
p developing less capital intensive businesses and those less
correlated to our overall mix while diversifying away from
products most historically affected by market cycles. We
plan to continue to reallocate both our capital and head-
count to these less correlated growth businesses.
p growing the client-based proportion of revenues, where
we have seen great progress in prime services and cash
equities, and continuing to innovate, building on our
advantages in areas such as Advanced Execution Services
(AES) and developing new product specialties such as life
finance.
p increasing our capital efficiency, with an overall reduction
of risk-weighted assets of 19% since the end of 4Q07,
and further reducing our risk exposure.
Results by division
Investment Banking
35
p focusing on efficiency and cost management, which has
given us greater flexibility to manage through this chal-
lenging market environment and should help us take
advantage of opportunities as markets recover.
Impact on results of the events in the mortgage
and credit markets
In 3Q08, the continued dislocation in the mortgage and credit
markets led to significantly lower revenues in our leveraged
finance and structured products businesses, consisting of
commercial mortgage-backed securities (CMBS), residential
mortgage-backed securities (RMBS) and CDOs, with net valu-
ation reductions of CHF 2,428 million in 3Q08. The exposures
for the leveraged finance and structured products businesses
detailed below reflect a risk management rather than a finan-
cial reporting perspective.
Leveraged Finance
Our leveraged finance business had net valuation reductions
(including fees, hedges, interest on funded positions, recover-
ies and executed transactions) of CHF 870 million in 3Q08.
Our unfunded non-investment grade loan commitments (both
leveraged loan and bridge) were CHF 8.9 billion (USD 7.9 bil-
lion) as of the end of 3Q08 versus CHF 11.0 billion (USD
10.8 billion) as of the end of 2Q08. Our funded non-invest-
ment grade loans (both leveraged loan and bridge) were CHF
2.8 billion (USD 2.5 billion) as of the end of 3Q08 versus CHF
3.0 billion (USD 3.0 billion) as of the end of 2Q08. We have
Risk exposures
end of % change
3Q08 2Q08 3Q07 QoQ YoY
Origination-related positions (CHF billion) 1
Unfunded commitments 8.9 11.0 52.3 (19) (83)
Funded positions 2.8 3.0 6.3 (7) (56)
Equity bridges 0.2 0.3 0.6 (33) (67)
Leveraged finance 2 11.9 14.3 59.2 (17) (80)
Commercial mortgages 12.8 15.0 3 35.9 (15) (64)
Trading-related book positions (CHF billion) 4
US subprime 2.1 1.9 3.9 11 (46)
US Alt-A 1.1 1.1 7.0 0 (84)
US prime 0.9 0.7 1.6 29 (44)
European/Asian 2.7 2.8 3.7 (4) (27)
Residential mortgages and subprime CDO 6.8 6.5 16.2 5 (58)
1 Exposures shown gross. 2 Excluding term financing of CHF 4.1 billion (USD 3.7 billion) and CHF 2.8 billion (USD 2.7 billion) for executed transactions in 3Q08 and 2Q08,
respectively. 3 Reflects the sale of CHF 1.7 billion of loans on a trade-date basis in 2Q08. 4 Exposures shown net.
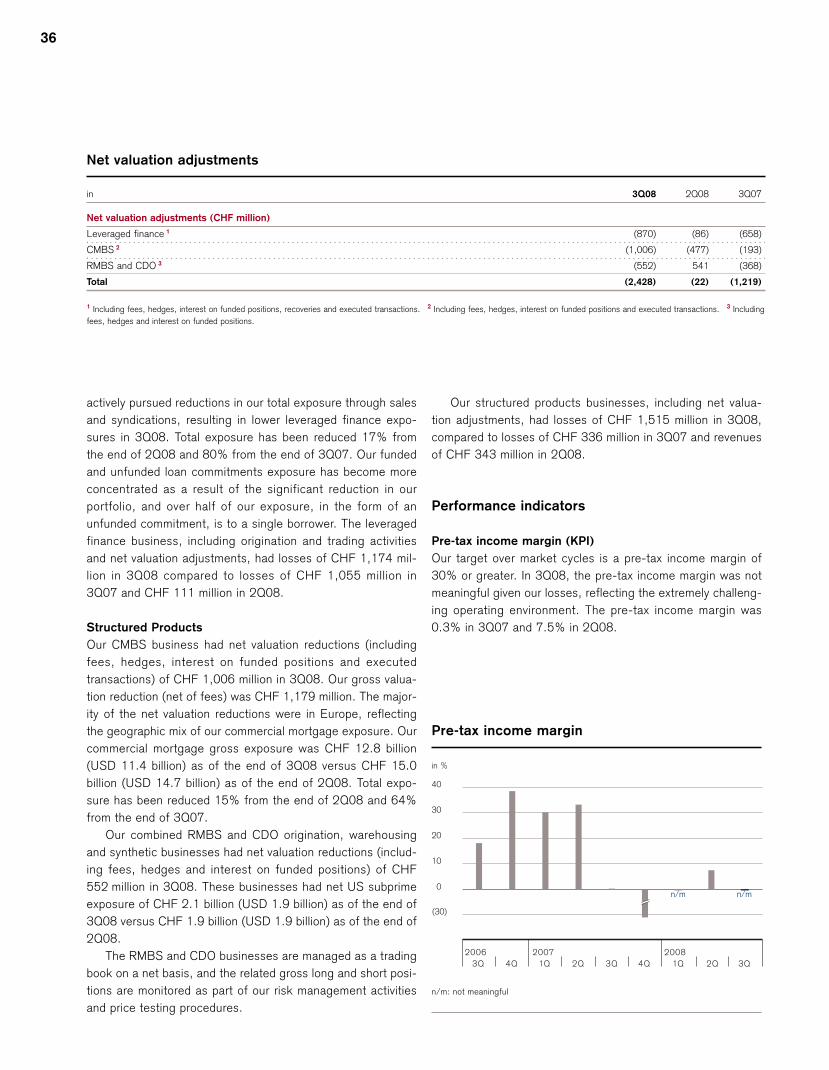
36
actively pursued reductions in our total exposure through sales
and syndications, resulting in lower leveraged finance expo-
sures in 3Q08. Total exposure has been reduced 17% from
the end of 2Q08 and 80% from the end of 3Q07. Our funded
and unfunded loan commitments exposure has become more
concentrated as a result of the significant reduction in our
portfolio, and over half of our exposure, in the form of an
unfunded commitment, is to a single borrower. The leveraged
finance business, including origination and trading activities
and net valuation adjustments, had losses of CHF 1,174 mil-
lion in 3Q08 compared to losses of CHF 1,055 million in
3Q07 and CHF 111 million in 2Q08.
Structured Products
Our CMBS business had net valuation reductions (including
fees, hedges, interest on funded positions and executed
transactions) of CHF 1,006 million in 3Q08. Our gross valua-
tion reduction (net of fees) was CHF 1,179 million. The major-
ity of the net valuation reductions were in Europe, reflecting
the geographic mix of our commercial mortgage exposure. Our
commercial mortgage gross exposure was CHF 12.8 billion
(USD 11.4 billion) as of the end of 3Q08 versus CHF 15.0
billion (USD 14.7 billion) as of the end of 2Q08. Total expo-
sure has been reduced 15% from the end of 2Q08 and 64%
from the end of 3Q07.
Our combined RMBS and CDO origination, warehousing
and synthetic businesses had net valuation reductions (includ-
ing fees, hedges and interest on funded positions) of CHF
552 million in 3Q08. These businesses had net US subprime
exposure of CHF 2.1 billion (USD 1.9 billion) as of the end of
3Q08 versus CHF 1.9 billion (USD 1.9 billion) as of the end of
2Q08.
The RMBS and CDO businesses are managed as a trading
book on a net basis, and the related gross long and short posi-
tions are monitored as part of our risk management activities
and price testing procedures.
Our structured products businesses, including net valua-
tion adjustments, had losses of CHF 1,515 million in 3Q08,
compared to losses of CHF 336 million in 3Q07 and revenues
of CHF 343 million in 2Q08.
Performance indicators
Pre-tax income margin (KPI)
Our target over market cycles is a pre-tax income margin of
30% or greater. In 3Q08, the pre-tax income margin was not
meaningful given our losses, reflecting the extremely challeng-
ing operating environment. The pre-tax income margin was
0.3% in 3Q07 and 7.5% in 2Q08.
2006 2007 2008
-20
-10
0
10
20
30
40
in %
2Q 3Q 4Q 2Q 3Q1Q3Q 4Q 1Q
n/m n/m
(30)
Pre-tax income margin
n/m: not meaningful
Net valuation adjustments
in 3Q08 2Q08 3Q07
Net valuation adjustments (CHF million)
Leveraged finance 1 (870) (86) (658)
CMBS 2 (1,006) (477) (193)
RMBS and CDO 3 (552) 541 (368)
Total (2,428) (22) (1,219)
1 Including fees, hedges, interest on funded positions, recoveries and executed transactions. 2 Including fees, hedges, interest on funded positions and executed transactions. 3 Including
fees, hedges and interest on funded positions.
Results by division
Investment Banking
37
Compensation/revenue ratio
The 3Q08 compensation/revenue ratio was not meaningful
given our losses. The compensation/revenue ratio was 40.0%
in 3Q07 and 65.8% in 2Q08.
Value-at-Risk
The 3Q08 average one-day, 99% VaR was CHF 169 million
compared to CHF 95 million in 3Q07 and CHF 193 million in
2Q08. For further information on VaR, refer to IV – Treasury
and Risk management – Risk management.
Pre-tax return on average utilized economic capital
The 3Q08 pre-tax return on average utilized economic capital
was negative 72.7% compared to 1.2% in 3Q07 and 7.5% in
2Q08.
Significant transactions and achievements
We executed a number of significant transactions, reflecting
the breadth and diversity of our investment banking franchise:
p Debt capital markets: We arranged key financings for a
diverse set of clients, including Ingersoll-Rand Company
Ltd. (global diversified industrial company), E.I. du Pont de
Nemours and Company (US diversified manufacturing
company), Booz Allen Hamilton Inc. (US consulting firm)
and Fresenius SE (German healthcare company).
p Equity capital markets: We executed equity offerings for
Companhia Vale do Rio Doce (Brazilian metals and mining
company), EnergySolutions, Inc. (US environmental serv-
ices company) and Century Aluminum Company (US alu-
minum production company) and a rights offering for
Natixis SA (French bank).
p Mergers and acquisitions: We advised on a number of
key transactions that were announced in 3Q08, including
the joint venture between ConocoPhillips (US energy com-
pany) and Origin Energy Ltd. (Australian energy company),
the acquisition by Commerzbank AG of Dresdner Bank AG
(both German banks) from Allianz SE (German financial
services company) and the tender offers for UnionBanCal
Corporation (US bank holding company) by Mitsubishi UFJ
Financial Group, Inc. (Japanese bank holding company)
and for Ciba Holdings AG (Swiss specialty chemicals com-
pany) by BASF SE (German chemicals company).
We received several industry awards and expanded our ability
to serve certain geographic and product markets:
p Equity research announced a new global alliance with Ger-
son Lehrman Group, a world-leading network of experts.
The relationship grants Credit Suisse access to Gerson
Lehrman Group’s network of more than 200,000 expert
consultants around the world, and reflects our continued
efforts to differentiate and grow our leading global equity
research brand.
p We ranked second in the Bloomberg Markets magazine
poll of “Top Research Firms.” The ranking is based on the
number of accurate stock calls each firm’s analysts made
on the 300 most volatile stocks globally in the 12 months
ending March 31, 2008. This result reflects our strong
focus on leveraging our global platform to provide our
clients with in-depth research.
p We were recognized for our leadership in a number of key
markets across products in Euromoney’s annual “Awards
for Excellence.” We were voted “Best Investment Bank” in
Latin America and Vietnam; “Best M&A House” in Latin
America, Indonesia and Denmark; “Best Project Finance
House” in North America; “Best Equity House” in Indone-
sia, Korea and Kazakhstan; “Best Debt House” in the
Philippines; and “Best Bank” in Switzerland.
p We were awarded the “Renewable Energy Transaction of
the Year” by Environmental Finance magazine for the two-
part sale of Airtricity Holdings Limited. Together, the two
transactions Credit Suisse advised on comprise the largest
mergers and acquisitions deal in the wind power sector
and reinforces our leading franchise in renewable energy.
p We ranked number one in International Securities
Finance’s Synthetic Prime Brokerage survey in which 200
hedge funds ranked their top swap providers. The Bank
ranked number one in seven of eleven categories.
Results detail
The following provides a comparison of our 3Q08 results ver-
sus 3Q07 (YoY) and versus 2Q08 (QoQ).
Net revenues
Debt underwriting
YoY: Up 2% from CHF 85 million to CHF 87 million
Lower net valuation reductions in our structured products busi-
ness were offset by weaker performance in our leveraged
finance business resulting from lower levels of high yield and
leveraged lending issuance activity compared to 3Q07. The
demand for most fixed income securities declined significantly
due to continued weakness in the credit markets.
QoQ: Down 60% from CHF 216 million to CHF 87 million
The decrease was primarily due to lower industry-wide high
grade debt issuance and net valuation reductions in leverage
finance in 3Q08 compared to net valuation gains in 2Q08.

38
Equity underwriting
YoY: Down 43% from CHF 327 million to CHF 188 million
The decrease was primarily due to significantly lower levels of
industry-wide equity issuance, resulting from lower equity mar-
ket valuations in 3Q08 compared with the favorable equity
markets in 3Q07. Global equity and equity-linked issuance
levels in 3Q08 were the lowest since 2Q03. The number of
initial public offerings (IPO) was the lowest in over ten years,
and many transactions were withdrawn from the market.
QoQ: Down 23% from CHF 245 million to CHF 188 million
The decrease was primarily due to a decline in industry-wide
equity issuance.
Advisory and other fees
YoY: Down 19% from CHF 440 million to CHF 358 million
The decrease was in line with lower levels of completed global
mergers and acquisitions.
QoQ: Down 2% from CHF 364 million to CHF 358 million
The decrease was primarily due to a decline in global mergers
and acquisitions market share, partially offset by a small
increase in revenues from the private fund group, which raises
capital for hedge funds, private equity and real estate funds.
Fixed income trading
YoY: From CHF 514 million to CHF (1,109) million
The decrease was primarily due to higher net valuation reduc-
tions in our combined structured products and leveraged
finance businesses, losses of CHF 922 million in our corpo-
rate lending business, losses in our commodities business in
the power sector, net valuation reductions of CHF 367 million
resulting from our investments in the preferred shares and
hybrid capital securities of certain financial institutions and
losses in our fixed income proprietary trading and emerging
markets businesses. These results were partially offset by a
fair value gain of CHF 1,688 million on Credit Suisse debt,
compared to fair value gains of CHF 560 million in 3Q07, and
higher revenues in the global rates, foreign exchange and
global high grade businesses.
QoQ: From CHF 320 million to CHF (1,109) million
The decrease was driven by net valuation reductions in our
structured products and leveraged finance businesses, losses
in our corporate lending business, losses in commodities, net
valuation reductions resulting from our investments in the pre-
ferred shares and hybrid capital securities of certain financial
institutions and losses in our fixed income proprietary trading
and emerging markets businesses. The decrease was partially
offset by fair value gains of CHF 1,688 million on Credit
Suisse debt compared to fair value losses of CHF 453 million
in 2Q08, and stronger results in our global high grade, foreign
exchange and rates businesses.
Equity trading
YoY: Down 84% from CHF 1,037 million to CHF 165 million
The decrease was primarily due to losses of CHF 706 million
in convertibles, reflecting the severe impact of the temporary
restrictions on short sales of financial institution stocks in Sep-
tember. We also incurred losses of CHF 469 million in
long/short and CHF 140 million in event and risk arbitrage
strategies. The results also reflected lower revenues in our
global cash business despite solid client flows and strong per-
formance in our AES business. Prime services revenues
increased compared to 3Q07 due to strong growth in client
balances and new client mandates. Equity trading results also
included fair value gains of CHF 188 million on Credit Suisse
debt compared to fair value gains of CHF 62 million in 3Q07.
QoQ: Down 93% from CHF 2,255 million to CHF 165 million
The decrease was due to the significant losses in convertibles
and long/short and event and risk arbitrage strategies and
weaker performance in the cash business, partially offset by
fair value gains of CHF 188 million on Credit Suisse debt
compared with fair value losses of CHF 50 million in 2Q08.
Other
YoY: Up from CHF (306) million to CHF (204) million
The increase was primarily due to lower net valuation reductions
of CHF 124 million on our leveraged finance bridge commit-
ments, partially offset by lower gains from private equity-related
investments not managed as part of Asset Management.
QoQ: From CHF 340 million to CHF (204) million
The decrease was primarily due to net valuation reductions on
our leveraged finance bridge commitments of CHF 124 million
compared to net valuation gains of CHF 308 million in 2Q08.
Provision for credit losses
YoY: Up from CHF 20 million to CHF 119 million
The increase was driven primarily by additional provisions relating
to a guarantee provided in a prior year to a third-party bank.
QoQ: Up from CHF 50 million to CHF 119 million
The increase was driven primarily by additional provisions relating
to a guarantee provided in a prior year to a third-party bank.
Operating expenses
Compensation and benefits
YoY: Up 78% from CHF 839 million to CHF 1,492 million
A nominal performance-related compensation accrual was
recorded in 3Q08. The increase primarily reflected the very
low performance-related compensation in 3Q07 when the
credit crisis began, following a record first half.
QoQ: Down 39% from CHF 2,462 million to CHF 1,492 million
The decrease was due to lower performance-related compensa-
tion reflecting the negative results.
Results by division
Investment Banking
39
General and administrative expenses
YoY: Down 13% from CHF 864 million to CHF 751 million
The decrease reflected a decline in expense provisions due to
a release from our reserve for certain private litigation matters
of CHF 73 million (refer to note 23 – Litigation in V – Con-
densed consolidated financial statements – unaudited). In
addition, travel and entertainment declined due to lower firm-
wide travel, and professional fees declined due to lower fees
paid to recruiting firms.
QoQ: Up 15% from CHF 652 million to CHF 751 million
The increase primarily reflected a lower release in expense pro-
visions due to the net litigation credit of CHF 134 million in
2Q08, which included a release from our reserve for certain pri-
vate litigation matters partially offset by the charge related to the
Parmalat settlement.
Personnel
Headcount increased by 800, primarily driven by an increase in
our shared services functions, in order to maintain appropriate
staffing levels, and seasonal recruitment in fixed income, equity
and investment banking. We continue to rebalance our busi-
ness by shifting resources to focus on areas we have identified
as growth opportunities.

40
Asset ManagementWe recorded a loss before taxes of CHF 58 million, including private equity and other investment-relatedlosses of CHF 109 million and net valuation reductions from securities purchased from our money marketfunds of CHF 36 million. The gross margin before these net valuation reductions and losses was stable. Wecontinued to demonstrate positive momentum in our leading alternative investment business with successfulcapital raising activities during the quarter, despite challenging conditions.
Results
in / end of % change in / end of % change
3Q08 2Q08 3Q07 QoQ YoY 9M08 9M07 YoY
Statements of income (CHF million)
Net revenues 1 453 739 594 (39) (24) 1,255 2,223 (44)
Provision for credit losses 0 0 0 – – 0 0 –
Compensation and benefits 294 336 2 287 (13) 2 934 2 897 4
General and administrative expenses 146 160 167 (9) (13) 457 424 8
Commission expenses 71 76 95 (7) (25) 223 301 (26)
Total other operating expenses 217 236 262 (8) (17) 680 725 (6)
Total operating expenses 511 572 549 (11) (7) 1,614 1,622 0
Income/(loss) before taxes (58) 167 45 – – (359) 601 –
Statement of income metrics (%)
Compensation/revenue ratio 64.9 45.5 48.3 – – 74.4 40.4 –
Non-compensation/revenue ratio 47.9 31.9 44.1 – – 54.2 32.6 –
Cost/income ratio 112.8 77.4 92.4 – – 128.6 73.0 –
Pre-tax income margin (12.8) 22.6 7.6 – – (28.6) 27.0 –
Utilized economic capital and return
Average utilized economic capital (CHF million) 2,628 2,294 2,226 15 18 2,460 2,140 15
Pre-tax return on average utilized economic capital (%) 3 (7.0) 30.9 10.5 – – (17.7) 40.0 –
Balance sheet statistics (CHF million)
Total assets 24,210 24,834 32,457 (3) (25) 24,210 32,457 (25)
Goodwill 2,412 2,116 2,332 14 3 2,412 2,332 3
Number of employees (full-time equivalents)
Number of employees 3,600 3,700 3,400 (3) 6 3,600 3,400 6
1 Includes valuation gains/(reductions) of CHF (36) million, CHF 79 million, CHF (146) million, CHF (523) million and CHF (146) million in 3Q08, 2Q08, 3Q07, 9M08 and 9M07,
respectively, from securities purchased from our money market funds. 2 Includes severance costs of CHF 23 million in 2Q08. 3 Calculated using a return excluding interest costs for
allocated goodwill.
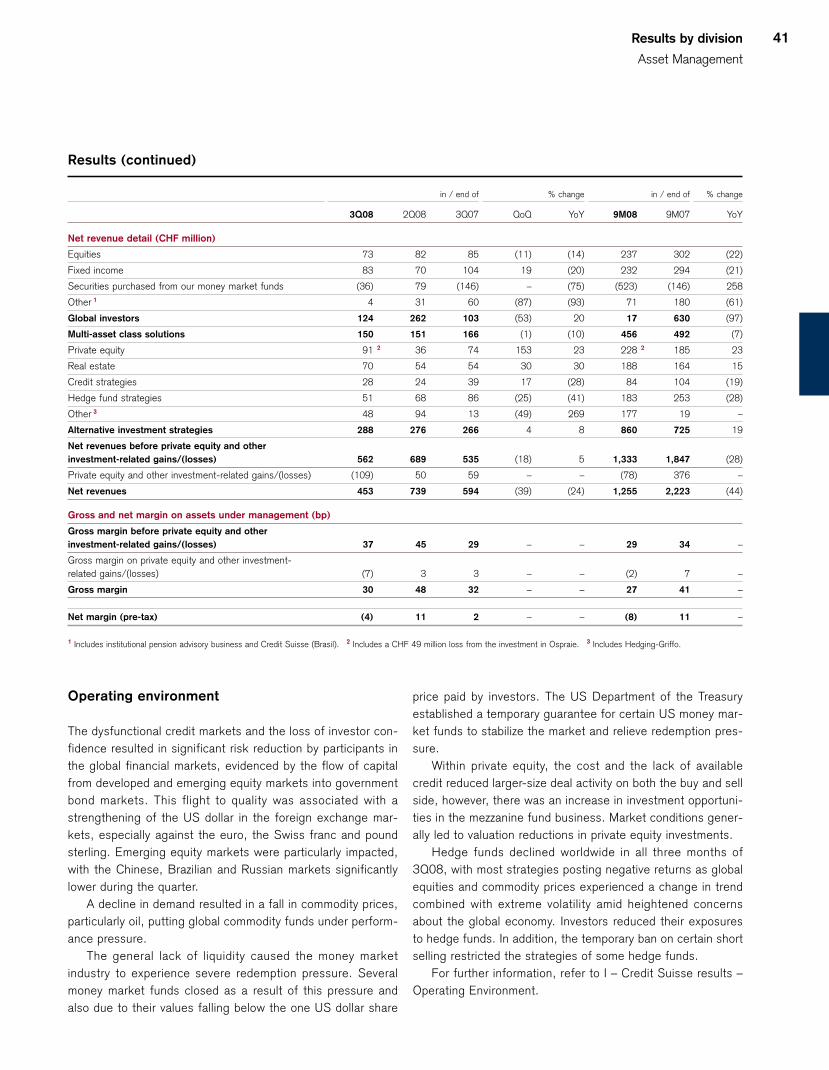
Results by division
Asset Management
41
Operating environment
The dysfunctional credit markets and the loss of investor con-
fidence resulted in significant risk reduction by participants in
the global financial markets, evidenced by the flow of capital
from developed and emerging equity markets into government
bond markets. This flight to quality was associated with a
strengthening of the US dollar in the foreign exchange mar-
kets, especially against the euro, the Swiss franc and pound
sterling. Emerging equity markets were particularly impacted,
with the Chinese, Brazilian and Russian markets significantly
lower during the quarter.
A decline in demand resulted in a fall in commodity prices,
particularly oil, putting global commodity funds under perform-
ance pressure.
The general lack of liquidity caused the money market
industry to experience severe redemption pressure. Several
money market funds closed as a result of this pressure and
also due to their values falling below the one US dollar share
price paid by investors. The US Department of the Treasury
established a temporary guarantee for certain US money mar-
ket funds to stabilize the market and relieve redemption pres-
sure.
Within private equity, the cost and the lack of available
credit reduced larger-size deal activity on both the buy and sell
side, however, there was an increase in investment opportuni-
ties in the mezzanine fund business. Market conditions gener-
ally led to valuation reductions in private equity investments.
Hedge funds declined worldwide in all three months of
3Q08, with most strategies posting negative returns as global
equities and commodity prices experienced a change in trend
combined with extreme volatility amid heightened concerns
about the global economy. Investors reduced their exposures
to hedge funds. In addition, the temporary ban on certain short
selling restricted the strategies of some hedge funds.
For further information, refer to I – Credit Suisse results –
Operating Environment.
Results (continued)
in / end of % change in / end of % change
3Q08 2Q08 3Q07 QoQ YoY 9M08 9M07 YoY
Net revenue detail (CHF million)
Equities 73 82 85 (11) (14) 237 302 (22)
Fixed income 83 70 104 19 (20) 232 294 (21)
Securities purchased from our money market funds (36) 79 (146) – (75) (523) (146) 258
Other 1 4 31 60 (87) (93) 71 180 (61)
Global investors 124 262 103 (53) 20 17 630 (97)
Multi-asset class solutions 150 151 166 (1) (10) 456 492 (7)
Private equity 91 2 36 74 153 23 228 2 185 23
Real estate 70 54 54 30 30 188 164 15
Credit strategies 28 24 39 17 (28) 84 104 (19)
Hedge fund strategies 51 68 86 (25) (41) 183 253 (28)
Other 3 48 94 13 (49) 269 177 19 –
Alternative investment strategies 288 276 266 4 8 860 725 19
Net revenues before private equity and other
investment-related gains/(losses) 562 689 535 (18) 5 1,333 1,847 (28)
Private equity and other investment-related gains/(losses) (109) 50 59 – – (78) 376 –
Net revenues 453 739 594 (39) (24) 1,255 2,223 (44)
Gross and net margin on assets under management (bp)
Gross margin before private equity and other
investment-related gains/(losses) 37 45 29 – – 29 34 –
Gross margin on private equity and other investment-
related gains/(losses) (7) 3 3 – – (2) 7 –
Gross margin 30 48 32 – – 27 41 –
Net margin (pre-tax) (4) 11 2 – – (8) 11 –
1 Includes institutional pension advisory business and Credit Suisse (Brasil). 2 Includes a CHF 49 million loss from the investment in Ospraie. 3 Includes Hedging-Griffo.
42
Results summary
In 3Q08, the loss before taxes was CHF 58 million compared
to income before taxes of CHF 45 million in 3Q07, reflecting
private equity and other investment-related losses of CHF 109
million and net valuation reductions from securities purchased
from our money market funds of CHF 36 million. We contin-
ued to substantially manage down our exposure to securities
purchased from our money market funds.
Net revenues were CHF 453 million, down CHF 141 mil-
lion, or 24%, compared to 3Q07. Net revenues before securi-
ties purchased from our money market funds and private
equity and other investment-related losses were CHF 598 mil-
lion, down CHF 83 million, or 12%, from 3Q07, primarily
reflecting a significant decline in average assets under man-
agement in global investors and multi-asset class solutions,
partly offset by lower allocated costs and modest revenue
growth in alternative investment strategies. The alternative
investment results reflected CHF 49 million in losses from our
investment in Ospraie, a private equity management company,
which mostly offset the positive effects from growing asset-
based fees. Asset management and administrative fees were
higher for alternative investments across most strategies. Pri-
vate equity and other investment-related losses were CHF
109 million compared to a gain of CHF 59 million in 3Q07.
Total operating expenses were CHF 511 million, down
CHF 38 million, or 7%, compared to 3Q07. Compensation
and benefits were stable. General and administrative expenses
decreased CHF 21 million, or 13%, mostly due to lower pro-
fessional fees.
Assets under management were CHF 577.8 billion as of
the end of 3Q08, down CHF 27.2 bill ion, or 4.5%, from
2Q08, primarily reflecting adverse market movements and net
asset outflows, offset in part by positive foreign exchange-
related movements. Compared to 3Q07, assets under man-
agement were down CHF 136.3 billion, or 19.1%, primarily
reflecting net asset outflows and adverse market and foreign
exchange-related movements. Net asset outflows of CHF
16.5 billion in 3Q08 primarily reflected net outflows of CHF
8.6 billion in fixed income, CHF 5.1 billion in multi-asset class
solutions, CHF 2.3 billion in money market assets and CHF
1.7 billion in equities, partly offset by inflows of CHF 2.2 bil-
lion in alternative investments.
In September, a money market fund advised by us was
under redemption pressure related to the deteriorating money
and credit markets. In order to provide liquidity, we invested
USD 2.2 billion (CHF 2.5 billion) in units issued by the fund.
This fund is an SEC-registered 2a-7 fund invested in commer-
cial paper and other short-term securities rated at least
A1/P1.
Compared to 2Q08, income before taxes decreased CHF
225 million, primarily reflecting the private equity and other
investment-related losses in 3Q08 compared to gains of CHF
50 million in 2Q08, semi-annual performance-based fees
recorded in 2Q08 and net valuation reductions on securities
purchased from our money market funds compared to gains of
CHF 79 million in 2Q08. This was partly offset by lower allo-
cated costs. Total operating expenses were down CHF 61 mil-
lion, or 11%, primarily due to lower compensation and bene-
fits.
Securities purchased from our money market
funds
In the second half of 2007, we repositioned our money market
funds by purchasing securities from these funds with the
intent to eliminate structured investment vehicle (SIV), ABS,
CDO and US subprime exposure. The securities transactions
were executed in order to address liquidity concerns caused by
the US market’s challenging conditions. We had no legal obli-
gation to purchase these securities. Net valuation reductions
on these securities were CHF 36 million in 3Q08, including
gains on hedges.
As of the end of 3Q08, the fair value of our balance sheet
exposure from these purchased securities was CHF 1.0 bil-
lion, down CHF 504 million, or 33%, from 2Q08, mainly due
to the restructuring of a large SIV position. The majority of our
exposure is mortgage-backed, and CHF 53 million is US sub-
prime compared to CHF 165 million as of the end of 2Q08.
Of the CHF 1.0 billion balance sheet exposure, CHF 680
million were securities issued by SIVs, of which the largest
single position is CHF 598 million. ABS exposures were CHF
202 million, with the two largest positions totaling CHF 169
million. Corporate securities, most of which are floating rate
notes, totaled CHF 136 million.
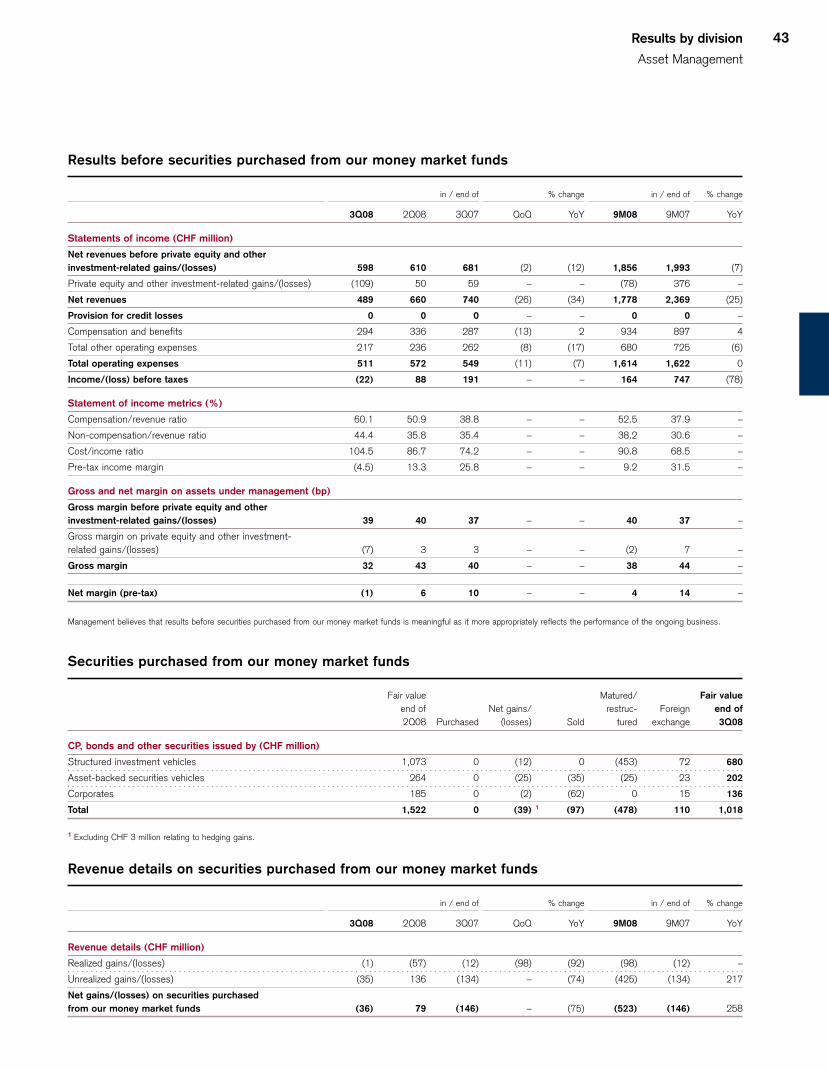
Results by division
Asset Management
43
Revenue details on securities purchased from our money market funds
in / end of % change in / end of % change
3Q08 2Q08 3Q07 QoQ YoY 9M08 9M07 YoY
Revenue details (CHF million)
Realized gains/(losses) (1) (57) (12) (98) (92) (98) (12) –
Unrealized gains/(losses) (35) 136 (134) – (74) (425) (134) 217
Net gains/(losses) on securities purchased
from our money market funds (36) 79 (146) – (75) (523) (146) 258
Securities purchased from our money market funds
Fair value Matured/ Fair value
end of Net gains/ restruc- Foreign end of
2Q08 Purchased (losses) Sold tured exchange 3Q08
CP, bonds and other securities issued by (CHF million)
Structured investment vehicles 1,073 0 (12) 0 (453) 72 680
Asset-backed securities vehicles 264 0 (25) (35) (25) 23 202
Corporates 185 0 (2) (62) 0 15 136
Total 1,522 0 (39) 1 (97) (478) 110 1,018
1 Excluding CHF 3 million relating to hedging gains.
Results before securities purchased from our money market funds
in / end of % change in / end of % change
3Q08 2Q08 3Q07 QoQ YoY 9M08 9M07 YoY
Statements of income (CHF million)
Net revenues before private equity and other
investment-related gains/(losses) 598 610 681 (2) (12) 1,856 1,993 (7)
Private equity and other investment-related gains/(losses) (109) 50 59 – – (78) 376 –
Net revenues 489 660 740 (26) (34) 1,778 2,369 (25)
Provision for credit losses 0 0 0 – – 0 0 –
Compensation and benefits 294 336 287 (13) 2 934 897 4
Total other operating expenses 217 236 262 (8) (17) 680 725 (6)
Total operating expenses 511 572 549 (11) (7) 1,614 1,622 0
Income/(loss) before taxes (22) 88 191 – – 164 747 (78)
Statement of income metrics (%)
Compensation/revenue ratio 60.1 50.9 38.8 – – 52.5 37.9 –
Non-compensation/revenue ratio 44.4 35.8 35.4 – – 38.2 30.6 –
Cost/income ratio 104.5 86.7 74.2 – – 90.8 68.5 –
Pre-tax income margin (4.5) 13.3 25.8 – – 9.2 31.5 –
Gross and net margin on assets under management (bp)
Gross margin before private equity and other
investment-related gains/(losses) 39 40 37 – – 40 37 –
Gross margin on private equity and other investment-
related gains/(losses) (7) 3 3 – – (2) 7 –
Gross margin 32 43 40 – – 38 44 –
Net margin (pre-tax) (1) 6 10 – – 4 14 –
Management believes that results before securities purchased from our money market funds is meaningful as it more appropriately reflects the performance of the ongoing business.
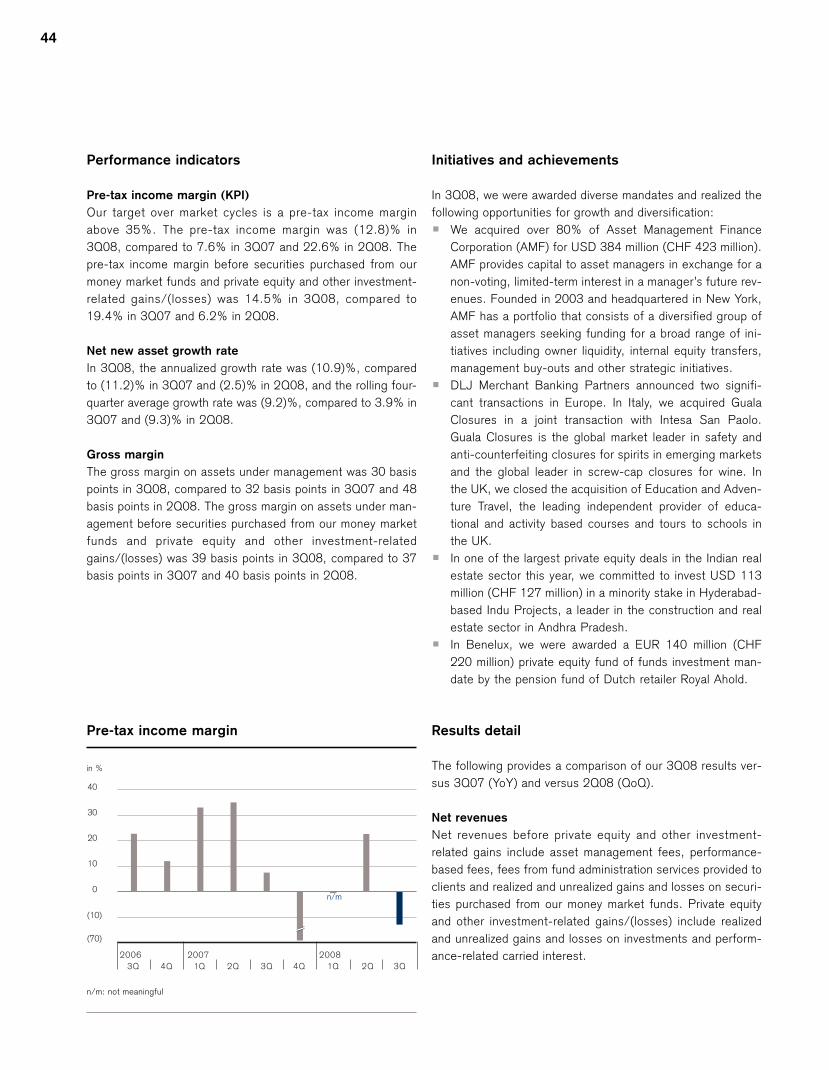
44
Performance indicators
Pre-tax income margin (KPI)
Our target over market cycles is a pre-tax income margin
above 35%. The pre-tax income margin was (12.8)% in
3Q08, compared to 7.6% in 3Q07 and 22.6% in 2Q08. The
pre-tax income margin before securities purchased from our
money market funds and private equity and other investment-
related gains/(losses) was 14.5% in 3Q08, compared to
19.4% in 3Q07 and 6.2% in 2Q08.
Net new asset growth rate
In 3Q08, the annualized growth rate was (10.9)%, compared
to (11.2)% in 3Q07 and (2.5)% in 2Q08, and the rolling four-
quarter average growth rate was (9.2)%, compared to 3.9% in
3Q07 and (9.3)% in 2Q08.
Gross margin
The gross margin on assets under management was 30 basis
points in 3Q08, compared to 32 basis points in 3Q07 and 48
basis points in 2Q08. The gross margin on assets under man-
agement before securities purchased from our money market
funds and private equity and other investment-related
gains/(losses) was 39 basis points in 3Q08, compared to 37
basis points in 3Q07 and 40 basis points in 2Q08.
Initiatives and achievements
In 3Q08, we were awarded diverse mandates and realized the
following opportunities for growth and diversification:
p We acquired over 80% of Asset Management Finance
Corporation (AMF) for USD 384 million (CHF 423 million).
AMF provides capital to asset managers in exchange for a
non-voting, limited-term interest in a manager’s future rev-
enues. Founded in 2003 and headquartered in New York,
AMF has a portfolio that consists of a diversified group of
asset managers seeking funding for a broad range of ini-
tiatives including owner liquidity, internal equity transfers,
management buy-outs and other strategic initiatives.
p DLJ Merchant Banking Partners announced two signifi-
cant transactions in Europe. In Italy, we acquired Guala
Closures in a joint transaction with Intesa San Paolo.
Guala Closures is the global market leader in safety and
anti-counterfeiting closures for spirits in emerging markets
and the global leader in screw-cap closures for wine. In
the UK, we closed the acquisition of Education and Adven-
ture Travel, the leading independent provider of educa-
tional and activity based courses and tours to schools in
the UK.
p In one of the largest private equity deals in the Indian real
estate sector this year, we committed to invest USD 113
million (CHF 127 million) in a minority stake in Hyderabad-
based Indu Projects, a leader in the construction and real
estate sector in Andhra Pradesh.
p In Benelux, we were awarded a EUR 140 million (CHF
220 million) private equity fund of funds investment man-
date by the pension fund of Dutch retailer Royal Ahold.
Results detail
The following provides a comparison of our 3Q08 results ver-
sus 3Q07 (YoY) and versus 2Q08 (QoQ).
Net revenues
Net revenues before private equity and other investment-
related gains include asset management fees, performance-
based fees, fees from fund administration services provided to
clients and realized and unrealized gains and losses on securi-
ties purchased from our money market funds. Private equity
and other investment-related gains/(losses) include realized
and unrealized gains and losses on investments and perform-
ance-related carried interest.2006 2007 2008
-20
0
10
20
30
40
in %
2Q 3Q 4Q 2Q 3Q1Q3Q 4Q 1Q
n/m
(70)
(10)
Pre-tax income margin
n/m: not meaningful

Results by division
Asset Management
45
Assets under management – Asset Management
in / end of % change in / end of % change
3Q08 2Q08 3Q07 QoQ YoY 9M08 9M07 YoY
Assets under management (CHF billion)
Equities 27.7 33.7 43.8 (17.8) (36.8) 27.7 43.8 (36.8)
Fixed income 145.7 155.7 210.9 (6.4) (30.9) 145.7 210.9 (30.9)
Other 1 81.6 84.1 112.3 (3.0) (27.3) 81.6 112.3 (27.3)
Global investors 255.0 273.5 367.0 (6.8) (30.5) 255.0 367.0 (30.5)
Multi-asset class solutions 152.7 163.9 186.0 (6.8) (17.9) 152.7 186.0 (17.9)
Private equity 41.1 32.5 30.1 26.5 36.5 41.1 30.1 36.5
Real estate 38.0 37.4 33.9 1.6 12.1 38.0 33.9 12.1
Credit strategies 16.9 19.9 28.3 (15.1) (40.3) 16.9 28.3 (40.3)
Hedge fund strategies 60.8 63.9 64.5 (4.9) (5.7) 60.8 64.5 (5.7)
Other 2 13.3 13.9 4.3 (4.3) 209.3 13.3 4.3 209.3
Alternative investment strategies 170.1 167.6 161.1 1.5 5.6 170.1 161.1 5.6
Assets under management 577.8 605.0 714.1 (4.5) (19.1) 577.8 714.1 (19.1)
of which discretionary assets 508.0 534.6 610.9 (5.0) (16.8) 508.0 610.9 (16.8)
of which advisory assets 69.8 70.4 103.2 (0.9) (32.4) 69.8 103.2 (32.4)
Assets under management by currency (CHF billion)
USD 169.3 167.0 211.3 1.4 (19.9) 169.3 211.3 (19.9)
EUR 93.3 101.6 107.5 (8.2) (13.2) 93.3 107.5 (13.2)
CHF 252.5 260.0 306.3 (2.9) (17.6) 252.5 306.3 (17.6)
Other 62.7 76.4 89.0 (17.9) (29.6) 62.7 89.0 (29.6)
Assets under management 577.8 605.0 714.1 (4.5) (19.1) 577.8 714.1 (19.1)
Growth in assets under management (CHF billion)
Net new assets (16.5) (3.8) (20.9) – – (40.5) 28.5 –
Market movements (21.7) 3.8 (7.0) – – (51.9) 17.2 –
Currency 12.7 11.2 (6.7) – – (13.1) 0.3 –
Other (1.7) (6.6) (0.9) – – (8.0) (1.8) 3 –
Total other effects (10.7) 8.4 (14.6) – – (73.0) 15.7 –
Growth in assets under management (27.2) 4.6 (35.5) – – (113.5) 44.2 –
Growth in assets under management (annualized) (%)
Net new assets (10.9) (2.5) (11.2) – – (7.8) 5.7 –
Total other effects (7.1) 5.6 (7.8) – – (14.1) 3.1 3 –
Growth in assets under management (18.0) 3.1 (19.0) – – (21.9) 8.8 –
Growth in assets under management (rolling four-quarter average) (%)
Net new assets (9.2) (9.3) 3.9 – – – – –
Total other effects (9.9) (10.0) 4.4 – – – – –
Growth in assets under management (rolling
four-quarter average) (19.1) (19.3) 8.3 – – – – –
Private equity investments (CHF billion)
Private equity investments 4.7 4.1 3.0 14.6 56.7 4.7 3.0 56.7
The classification of assets is based upon the classification of the fund manager.1 Includes institutional pension advisory business and Credit Suisse (Brasil). 2 Includes Hedging-Griffo. 3 Includes outflows as a result of the sale of the insurance business.
46
Global investors
YoY: Up 20% from CHF 103 million to CHF 124 million
The increase was primarily due to net valuation reductions of
CHF 36 million in 3Q08, compared to CHF 146 million in
3Q07, on securities purchased from our money market funds.
Excluding securities purchased from our money market funds,
revenues declined, primarily due to lower fees from our Lux-
embourg-based funds, reflecting weak performance, and
lower fixed income and equities revenues reflecting lower
average assets under management.
QoQ: Down 53% from CHF 262 million to CHF 124 million
The decrease was mainly due to the net valuation reductions
of CHF 36 million on securities purchased from our money
market funds in 3Q08 compared to valuation gains of CHF 79
million in 2Q08. Excluding securities purchased from our
money market funds, revenues declined, primarily due to the
lower fees from our Luxembourg-based funds and lower equity
revenues reflecting lower average assets under management.
This was partially offset by increased fixed income revenues,
reflecting lower allocated costs.
Multi-asset class solutions
YoY: Down 10% from CHF 166 million to CHF 150 million
The decrease was mainly due to lower fees as a result of
lower average assets under management, mainly from tradi-
tional mandates and funds, partly offset by higher fees from
our alternative and derivative mandates and funds.
QoQ: Down 1% from CHF 151 million to CHF 150 million
The decrease reflected lower revenues from traditional man-
dates and funds, mostly offset by increases in total return
solutions.
Alternative investment strategies
YoY: Up 8% from CHF 266 million to CHF 288 million
The increase primarily reflected lower allocated costs and
higher asset management and administrative fees across most
strategies, mostly offset by CHF 49 million in losses from our
investment in the Ospraie management company, which was
adversely impacted by the closing of one of its major funds,
and lower results in our hedge funds strategies.
QoQ: Up 4% from CHF 276 million to CHF 288 million
The increase was primarily due to significantly lower allocated
costs and higher asset management and administrative fees
across most strategies, mostly offset by the absence of semi-
annual performance-based fees, primarily from Hedging-
Griffo, and the Ospraie loss.
Private equity and other investment-related gains
YoY: From CHF 59 million to CHF (109) million
The decrease was primarily due to the adverse effects of the
credit crisis on valuations and exit strategies. Included in this
were unrealized losses on China-related public company
investments, credit and real estate funds and public energy-
related investments.
QoQ: From CHF 50 million to CHF (109) million
The decrease was primarily due to unrealized losses on credit
funds, public energy and emerging market-related investments
and real estate funds.
Operating expenses
Compensation and benefits
YoY: Up 2% from CHF 287 million to CHF 294 million
Compensation and benefits were stable.
QoQ: Down 13% from CHF 336 million to CHF 294 million
The decrease was due to lower performance-related compen-
sation and severance costs.
General and administrative expenses
YoY: Down 13% from CHF 167 million to CHF 146 million
The decrease was primarily due to lower professional fees, as
most general and administrative expenses were stable.
QoQ: Down 9% from CHF 160 million to CHF 146 million
The decrease was primarily due to lower professional fees and
lower costs from Hedging-Griffo, offset in part by higher pro-
visions for litigation, reflecting a release of provisions in 2Q08.
Personnel
Headcount was up 200 from 3Q07, which did not include
Hedging-Griffo. Since 3Q07, we have continued to hire
investment talent and build product development and distribu-
tion capabilities, particularly in alternative investment strate-
gies. Headcount compared to 2Q08 was down 100 due to
headcount reductions in line with our strategy.
III48 Results
50 Assets under Management
Overview of Resultsand Assets underManagement
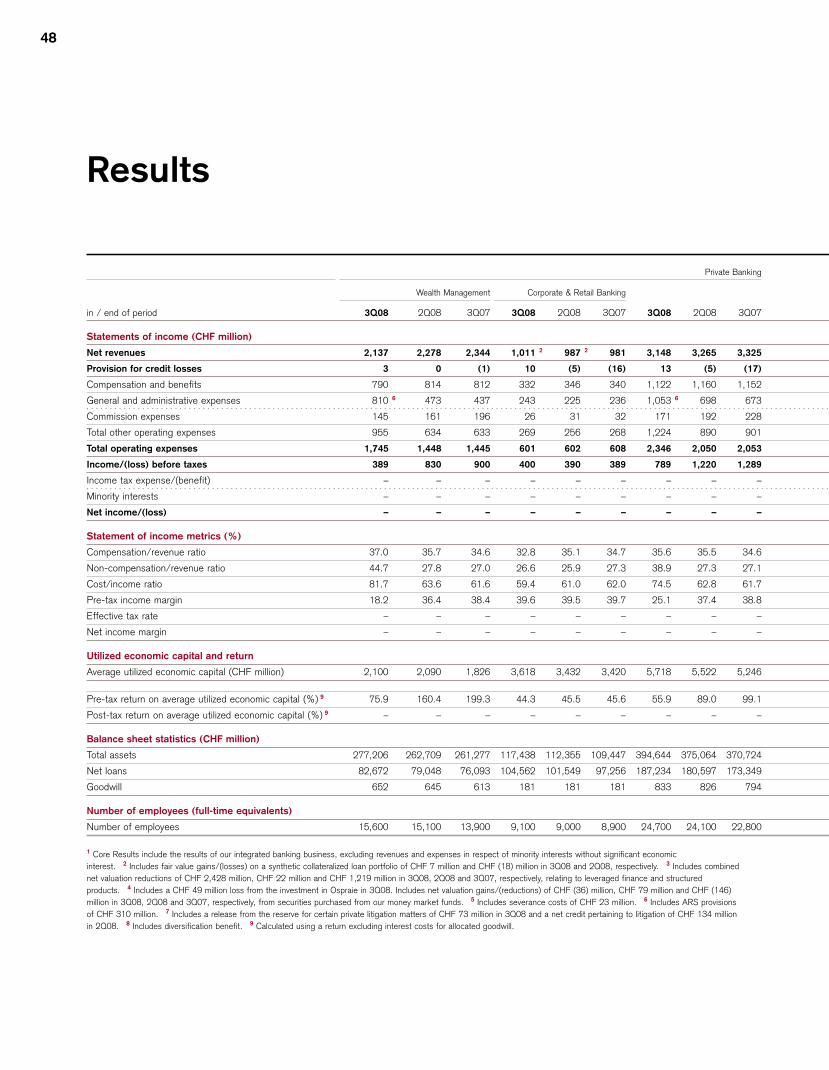
48
Private Banking
Wealth Management Corporate & Retail Banking
in / end of period 3Q08 2Q08 3Q07 3Q08 2Q08 3Q07 3Q08 2Q08 3Q07
Statements of income (CHF million)
Net revenues 2,137 2,278 2,344 1,011 2 987 2 981 3,148 3,265 3,325
Provision for credit losses 3 0 (1) 10 (5) (16) 13 (5) (17)
Compensation and benefits 790 814 812 332 346 340 1,122 1,160 1,152
General and administrative expenses 810 6 473 437 243 225 236 1,053 6 698 673
Commission expenses 145 161 196 26 31 32 171 192 228
Total other operating expenses 955 634 633 269 256 268 1,224 890 901
Total operating expenses 1,745 1,448 1,445 601 602 608 2,346 2,050 2,053
Income/(loss) before taxes 389 830 900 400 390 389 789 1,220 1,289
Income tax expense/(benefit) – – – – – – – – –
Minority interests – – – – – – – – –
Net income/(loss) – – – – – – – – –
Statement of income metrics (%)
Compensation/revenue ratio 37.0 35.7 34.6 32.8 35.1 34.7 35.6 35.5 34.6
Non-compensation/revenue ratio 44.7 27.8 27.0 26.6 25.9 27.3 38.9 27.3 27.1
Cost/income ratio 81.7 63.6 61.6 59.4 61.0 62.0 74.5 62.8 61.7
Pre-tax income margin 18.2 36.4 38.4 39.6 39.5 39.7 25.1 37.4 38.8
Effective tax rate – – – – – – – – –
Net income margin – – – – – – – – –
Utilized economic capital and return
Average utilized economic capital (CHF million) 2,100 2,090 1,826 3,618 3,432 3,420 5,718 5,522 5,246
Pre-tax return on average utilized economic capital (%) 9 75.9 160.4 199.3 44.3 45.5 45.6 55.9 89.0 99.1
Post-tax return on average utilized economic capital (%) 9 – – – – – – – – –
Balance sheet statistics (CHF million)
Total assets 277,206 262,709 261,277 117,438 112,355 109,447 394,644 375,064 370,724
Net loans 82,672 79,048 76,093 104,562 101,549 97,256 187,234 180,597 173,349
Goodwill 652 645 613 181 181 181 833 826 794
Number of employees (full-time equivalents)
Number of employees 15,600 15,100 13,900 9,100 9,000 8,900 24,700 24,100 22,800
1 Core Results include the results of our integrated banking business, excluding revenues and expenses in respect of minority interests without significant economic
interest. 2 Includes fair value gains/(losses) on a synthetic collateralized loan portfolio of CHF 7 million and CHF (18) million in 3Q08 and 2Q08, respectively. 3 Includes combined
net valuation reductions of CHF 2,428 million, CHF 22 million and CHF 1,219 million in 3Q08, 2Q08 and 3Q07, respectively, relating to leveraged finance and structured
products. 4 Includes a CHF 49 million loss from the investment in Ospraie in 3Q08. Includes net valuation gains/(reductions) of CHF (36) million, CHF 79 million and CHF (146)
million in 3Q08, 2Q08 and 3Q07, respectively, from securities purchased from our money market funds. 5 Includes severance costs of CHF 23 million. 6 Includes ARS provisions
of CHF 310 million. 7 Includes a release from the reserve for certain private litigation matters of CHF 73 million in 3Q08 and a net credit pertaining to litigation of CHF 134 million
in 2Q08. 8 Includes diversification benefit. 9 Calculated using a return excluding interest costs for allocated goodwill.
Results
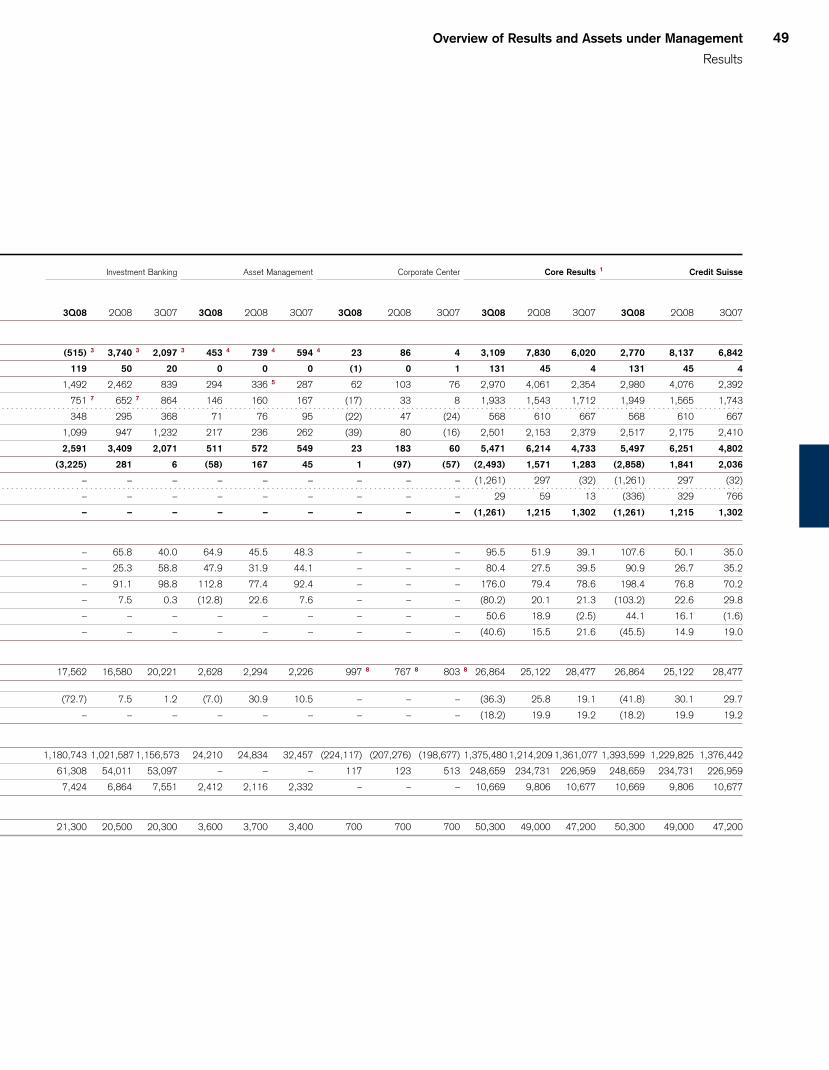
Overview of Results and Assets under Management
Results
49
Investment Banking Asset Management Corporate Center Core Results 1 Credit Suisse
3Q08 2Q08 3Q07 3Q08 2Q08 3Q07 3Q08 2Q08 3Q07 3Q08 2Q08 3Q07 3Q08 2Q08 3Q07
(515) 3 3,740 3 2,097 3 453 4 739 4 594 4 23 86 4 3,109 7,830 6,020 2,770 8,137 6,842
119 50 20 0 0 0 (1) 0 1 131 45 4 131 45 4
1,492 2,462 839 294 336 5 287 62 103 76 2,970 4,061 2,354 2,980 4,076 2,392
751 7 652 7 864 146 160 167 (17) 33 8 1,933 1,543 1,712 1,949 1,565 1,743
348 295 368 71 76 95 (22) 47 (24) 568 610 667 568 610 667
1,099 947 1,232 217 236 262 (39) 80 (16) 2,501 2,153 2,379 2,517 2,175 2,410
2,591 3,409 2,071 511 572 549 23 183 60 5,471 6,214 4,733 5,497 6,251 4,802
(3,225) 281 6 (58) 167 45 1 (97) (57) (2,493) 1,571 1,283 (2,858) 1,841 2,036
– – – – – – – – – (1,261) 297 (32) (1,261) 297 (32)
– – – – – – – – – 29 59 13 (336) 329 766
– – – – – – – – – (1,261) 1,215 1,302 (1,261) 1,215 1,302
– 65.8 40.0 64.9 45.5 48.3 – – – 95.5 51.9 39.1 107.6 50.1 35.0
– 25.3 58.8 47.9 31.9 44.1 – – – 80.4 27.5 39.5 90.9 26.7 35.2
– 91.1 98.8 112.8 77.4 92.4 – – – 176.0 79.4 78.6 198.4 76.8 70.2
– 7.5 0.3 (12.8) 22.6 7.6 – – – (80.2) 20.1 21.3 (103.2) 22.6 29.8
– – – – – – – – – 50.6 18.9 (2.5) 44.1 16.1 (1.6)
– – – – – – – – – (40.6) 15.5 21.6 (45.5) 14.9 19.0
17,562 16,580 20,221 2,628 2,294 2,226 997 8 767 8 803 8 26,864 25,122 28,477 26,864 25,122 28,477
(72.7) 7.5 1.2 (7.0) 30.9 10.5 – – – (36.3) 25.8 19.1 (41.8) 30.1 29.7
– – – – – – – – – (18.2) 19.9 19.2 (18.2) 19.9 19.2
1,180,743 1,021,587 1,156,573 24,210 24,834 32,457 (224,117) (207,276) (198,677) 1,375,480 1,214,209 1,361,077 1,393,599 1,229,825 1,376,442
61,308 54,011 53,097 – – – 117 123 513 248,659 234,731 226,959 248,659 234,731 226,959
7,424 6,864 7,551 2,412 2,116 2,332 – – – 10,669 9,806 10,677 10,669 9,806 10,677
21,300 20,500 20,300 3,600 3,700 3,400 700 700 700 50,300 49,000 47,200 50,300 49,000 47,200
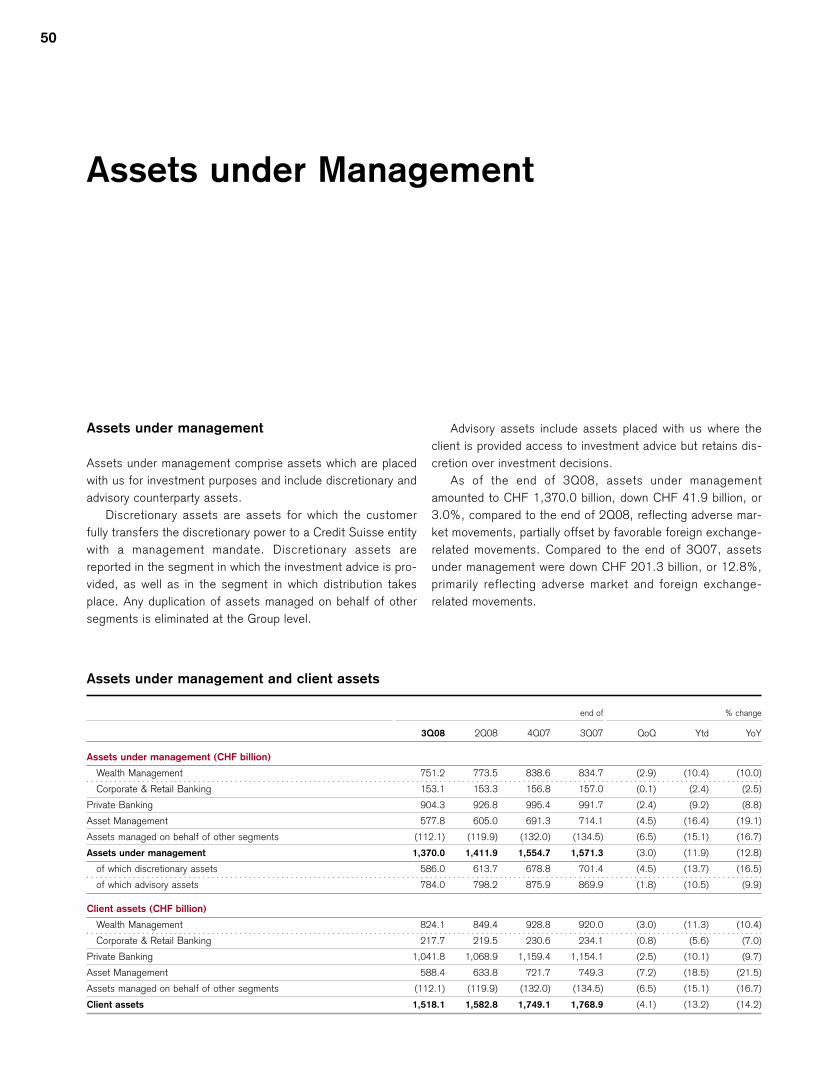
50
Assets under Management
Assets under management and client assets
end of % change
3Q08 2Q08 4Q07 3Q07 QoQ Ytd YoY
Assets under management (CHF billion)
Wealth Management 751.2 773.5 838.6 834.7 (2.9) (10.4) (10.0)
Corporate & Retail Banking 153.1 153.3 156.8 157.0 (0.1) (2.4) (2.5)
Private Banking 904.3 926.8 995.4 991.7 (2.4) (9.2) (8.8)
Asset Management 577.8 605.0 691.3 714.1 (4.5) (16.4) (19.1)
Assets managed on behalf of other segments (112.1) (119.9) (132.0) (134.5) (6.5) (15.1) (16.7)
Assets under management 1,370.0 1,411.9 1,554.7 1,571.3 (3.0) (11.9) (12.8)
of which discretionary assets 586.0 613.7 678.8 701.4 (4.5) (13.7) (16.5)
of which advisory assets 784.0 798.2 875.9 869.9 (1.8) (10.5) (9.9)
Client assets (CHF billion)
Wealth Management 824.1 849.4 928.8 920.0 (3.0) (11.3) (10.4)
Corporate & Retail Banking 217.7 219.5 230.6 234.1 (0.8) (5.6) (7.0)
Private Banking 1,041.8 1,068.9 1,159.4 1,154.1 (2.5) (10.1) (9.7)
Asset Management 588.4 633.8 721.7 749.3 (7.2) (18.5) (21.5)
Assets managed on behalf of other segments (112.1) (119.9) (132.0) (134.5) (6.5) (15.1) (16.7)
Client assets 1,518.1 1,582.8 1,749.1 1,768.9 (4.1) (13.2) (14.2)
Assets under management
Assets under management comprise assets which are placed
with us for investment purposes and include discretionary and
advisory counterparty assets.
Discretionary assets are assets for which the customer
fully transfers the discretionary power to a Credit Suisse entity
with a management mandate. Discretionary assets are
reported in the segment in which the investment advice is pro-
vided, as well as in the segment in which distribution takes
place. Any duplication of assets managed on behalf of other
segments is eliminated at the Group level.
Advisory assets include assets placed with us where the
client is provided access to investment advice but retains dis-
cretion over investment decisions.
As of the end of 3Q08, assets under management
amounted to CHF 1,370.0 billion, down CHF 41.9 billion, or
3.0%, compared to the end of 2Q08, reflecting adverse mar-
ket movements, partially offset by favorable foreign exchange-
related movements. Compared to the end of 3Q07, assets
under management were down CHF 201.3 billion, or 12.8%,
primarily reflecting adverse market and foreign exchange-
related movements.
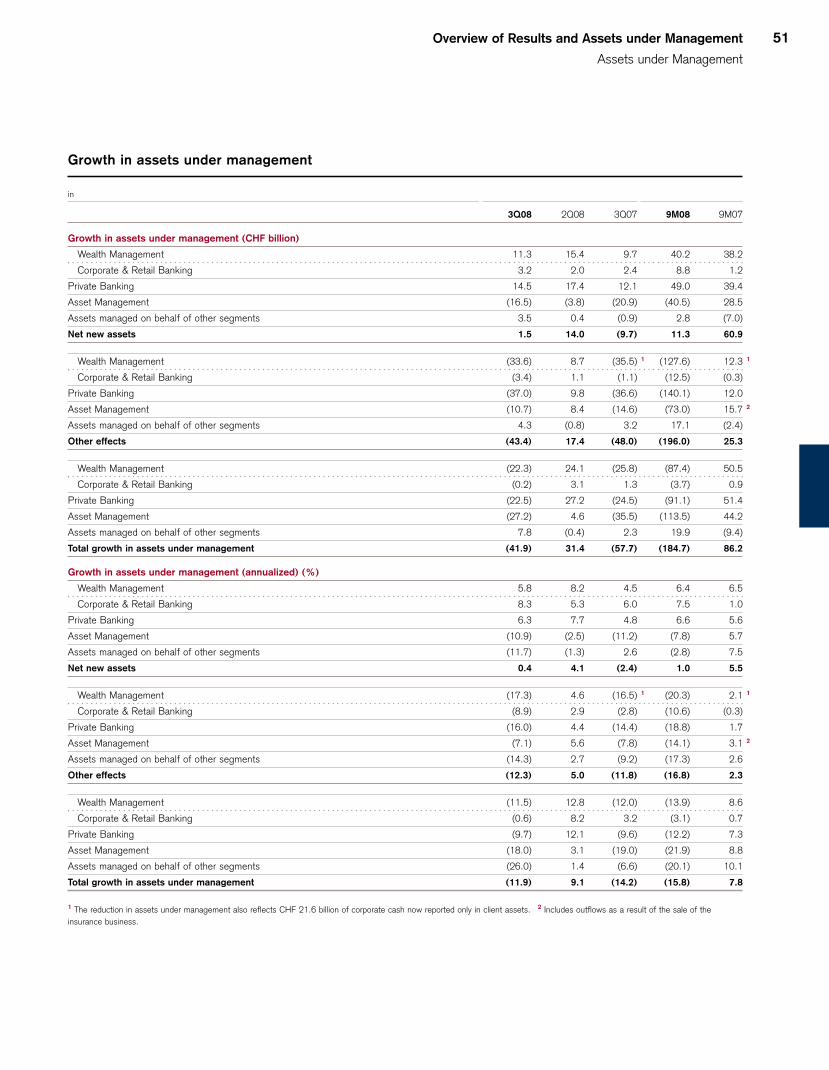
Overview of Results and Assets under Management
Assets under Management
51
Growth in assets under management
in
3Q08 2Q08 3Q07 9M08 9M07
Growth in assets under management (CHF billion)
Wealth Management 11.3 15.4 9.7 40.2 38.2
Corporate & Retail Banking 3.2 2.0 2.4 8.8 1.2
Private Banking 14.5 17.4 12.1 49.0 39.4
Asset Management (16.5) (3.8) (20.9) (40.5) 28.5
Assets managed on behalf of other segments 3.5 0.4 (0.9) 2.8 (7.0)
Net new assets 1.5 14.0 (9.7) 11.3 60.9
Wealth Management (33.6) 8.7 (35.5) 1 (127.6) 12.3 1
Corporate & Retail Banking (3.4) 1.1 (1.1) (12.5) (0.3)
Private Banking (37.0) 9.8 (36.6) (140.1) 12.0
Asset Management (10.7) 8.4 (14.6) (73.0) 15.7 2
Assets managed on behalf of other segments 4.3 (0.8) 3.2 17.1 (2.4)
Other effects (43.4) 17.4 (48.0) (196.0) 25.3
Wealth Management (22.3) 24.1 (25.8) (87.4) 50.5
Corporate & Retail Banking (0.2) 3.1 1.3 (3.7) 0.9
Private Banking (22.5) 27.2 (24.5) (91.1) 51.4
Asset Management (27.2) 4.6 (35.5) (113.5) 44.2
Assets managed on behalf of other segments 7.8 (0.4) 2.3 19.9 (9.4)
Total growth in assets under management (41.9) 31.4 (57.7) (184.7) 86.2
Growth in assets under management (annualized) (%)
Wealth Management 5.8 8.2 4.5 6.4 6.5
Corporate & Retail Banking 8.3 5.3 6.0 7.5 1.0
Private Banking 6.3 7.7 4.8 6.6 5.6
Asset Management (10.9) (2.5) (11.2) (7.8) 5.7
Assets managed on behalf of other segments (11.7) (1.3) 2.6 (2.8) 7.5
Net new assets 0.4 4.1 (2.4) 1.0 5.5
Wealth Management (17.3) 4.6 (16.5) 1 (20.3) 2.1 1
Corporate & Retail Banking (8.9) 2.9 (2.8) (10.6) (0.3)
Private Banking (16.0) 4.4 (14.4) (18.8) 1.7
Asset Management (7.1) 5.6 (7.8) (14.1) 3.1 2
Assets managed on behalf of other segments (14.3) 2.7 (9.2) (17.3) 2.6
Other effects (12.3) 5.0 (11.8) (16.8) 2.3
Wealth Management (11.5) 12.8 (12.0) (13.9) 8.6
Corporate & Retail Banking (0.6) 8.2 3.2 (3.1) 0.7
Private Banking (9.7) 12.1 (9.6) (12.2) 7.3
Asset Management (18.0) 3.1 (19.0) (21.9) 8.8
Assets managed on behalf of other segments (26.0) 1.4 (6.6) (20.1) 10.1
Total growth in assets under management (11.9) 9.1 (14.2) (15.8) 7.8
1 The reduction in assets under management also reflects CHF 21.6 billion of corporate cash now reported only in client assets. 2 Includes outflows as a result of the sale of the
insurance business.
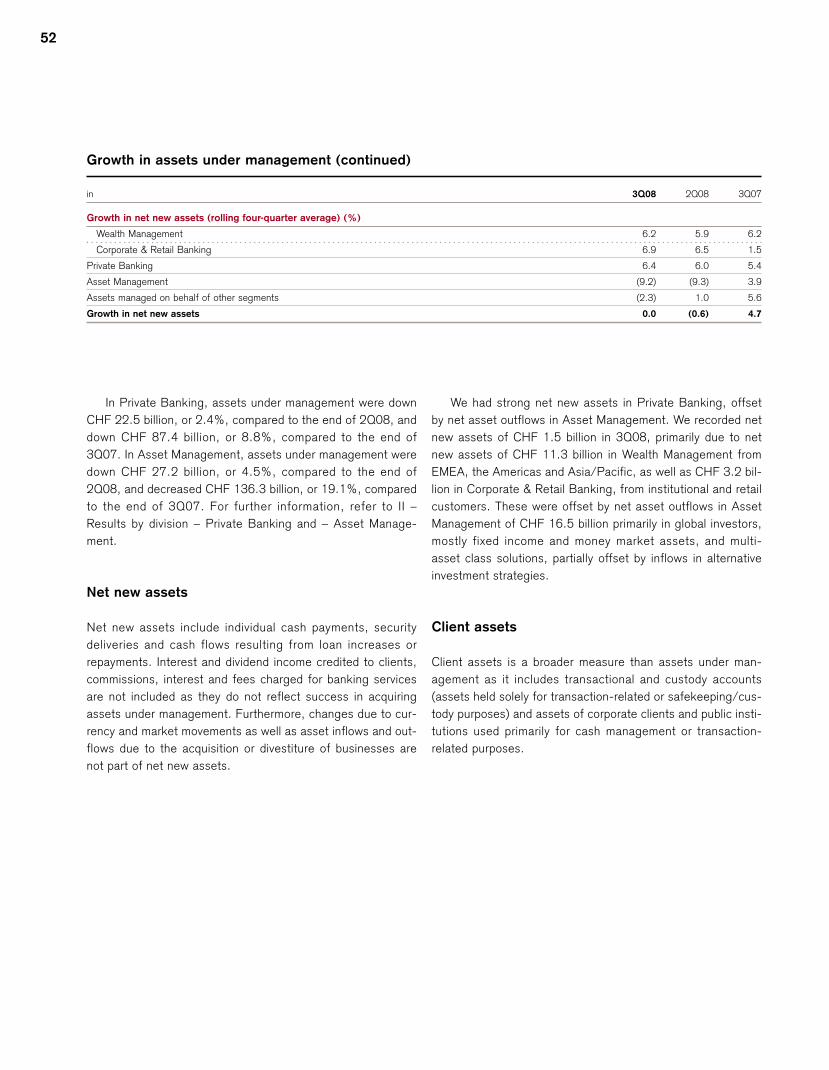
52
In Private Banking, assets under management were down
CHF 22.5 billion, or 2.4%, compared to the end of 2Q08, and
down CHF 87.4 billion, or 8.8%, compared to the end of
3Q07. In Asset Management, assets under management were
down CHF 27.2 billion, or 4.5%, compared to the end of
2Q08, and decreased CHF 136.3 billion, or 19.1%, compared
to the end of 3Q07. For further information, refer to II –
Results by division – Private Banking and – Asset Manage-
ment.
Net new assets
Net new assets include individual cash payments, security
deliveries and cash flows resulting from loan increases or
repayments. Interest and dividend income credited to clients,
commissions, interest and fees charged for banking services
are not included as they do not reflect success in acquiring
assets under management. Furthermore, changes due to cur-
rency and market movements as well as asset inflows and out-
flows due to the acquisition or divestiture of businesses are
not part of net new assets.
We had strong net new assets in Private Banking, offset
by net asset outflows in Asset Management. We recorded net
new assets of CHF 1.5 billion in 3Q08, primarily due to net
new assets of CHF 11.3 billion in Wealth Management from
EMEA, the Americas and Asia/Pacific, as well as CHF 3.2 bil-
lion in Corporate & Retail Banking, from institutional and retail
customers. These were offset by net asset outflows in Asset
Management of CHF 16.5 billion primarily in global investors,
mostly fixed income and money market assets, and multi-
asset class solutions, partially offset by inflows in alternative
investment strategies.
Client assets
Client assets is a broader measure than assets under man-
agement as it includes transactional and custody accounts
(assets held solely for transaction-related or safekeeping/cus-
tody purposes) and assets of corporate clients and public insti-
tutions used primarily for cash management or transaction-
related purposes.
Growth in assets under management (continued)
in 3Q08 2Q08 3Q07
Growth in net new assets (rolling four-quarter average) (%)
Wealth Management 6.2 5.9 6.2
Corporate & Retail Banking 6.9 6.5 1.5
Private Banking 6.4 6.0 5.4
Asset Management (9.2) (9.3) 3.9
Assets managed on behalf of other segments (2.3) 1.0 5.6
Growth in net new assets 0.0 (0.6) 4.7
IV54 Treasury management
60 Risk management
Treasury and Riskmanagement
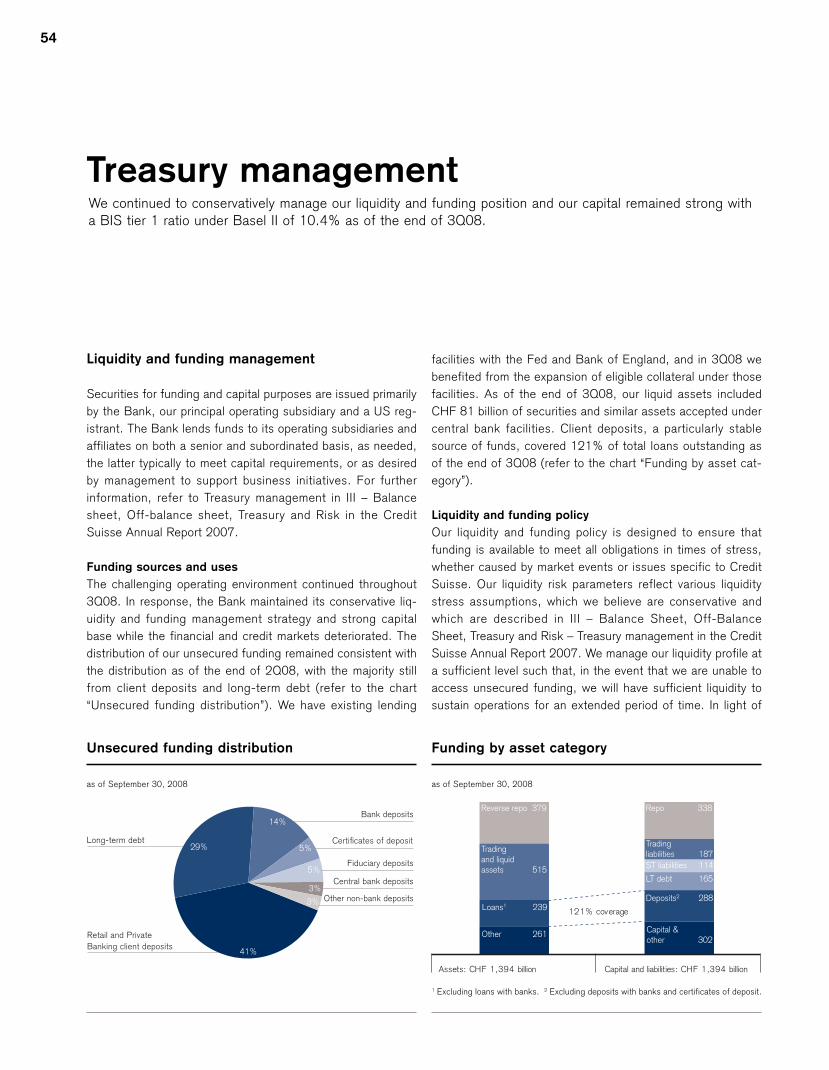
Treasury managementWe continued to conservatively manage our liquidity and funding position and our capital remained strong witha BIS tier 1 ratio under Basel II of 10.4% as of the end of 3Q08.
Liquidity and funding management
Securities for funding and capital purposes are issued primarily
by the Bank, our principal operating subsidiary and a US reg-
istrant. The Bank lends funds to its operating subsidiaries and
affiliates on both a senior and subordinated basis, as needed,
the latter typically to meet capital requirements, or as desired
by management to support business initiatives. For further
information, refer to Treasury management in III – Balance
sheet, Off-balance sheet, Treasury and Risk in the Credit
Suisse Annual Report 2007.
Funding sources and uses
The challenging operating environment continued throughout
3Q08. In response, the Bank maintained its conservative liq-
uidity and funding management strategy and strong capital
base while the financial and credit markets deteriorated. The
distribution of our unsecured funding remained consistent with
the distribution as of the end of 2Q08, with the majority still
from client deposits and long-term debt (refer to the chart
“Unsecured funding distribution”). We have existing lending
facilities with the Fed and Bank of England, and in 3Q08 we
benefited from the expansion of eligible collateral under those
facilities. As of the end of 3Q08, our liquid assets included
CHF 81 billion of securities and similar assets accepted under
central bank facilities. Client deposits, a particularly stable
source of funds, covered 121% of total loans outstanding as
of the end of 3Q08 (refer to the chart “Funding by asset cat-
egory”).
Liquidity and funding policy
Our liquidity and funding policy is designed to ensure that
funding is available to meet all obligations in times of stress,
whether caused by market events or issues specific to Credit
Suisse. Our liquidity risk parameters reflect various liquidity
stress assumptions, which we believe are conservative and
which are described in III – Balance Sheet, Off-Balance
Sheet, Treasury and Risk – Treasury management in the Credit
Suisse Annual Report 2007. We manage our liquidity profile at
a sufficient level such that, in the event that we are unable to
access unsecured funding, we will have sufficient liquidity to
sustain operations for an extended period of time. In light of
54
Long-term debt Certificates of deposit
Bank deposits
Fiduciary deposits
Central bank deposits
Other non-bank deposits
Retail and PrivateBanking client deposits
29% 5%
14%
5%
3%
3%
41%
Unsecured funding distribution
as of September 30, 2008
Assets: CHF 1,394 billion Capital and liabilities: CHF 1,394 billion
121% coverage
Other 261 Capital & other 302
Loans1 239Deposits2 288
Trading liabilities 187
Repo 338
LT debt 165
ST liabilities 114
Reverse repo 379
Trading and liquid assets 515
Funding by asset category
as of September 30, 2008
1 Excluding loans with banks. 2 Excluding deposits with banks and certificates of deposit.
Treasury and Risk management
Treasury management
55
the continued deterioration in the credit markets, we took
measures to further widen our funding sources by implement-
ing enhanced credit facilities with central banks, such as the
Primary Dealer Credit Facility with the Fed. These facilities
have been tested and serve as a secondary source of liquidity
if needed.
Debt issuances and redemptions
Our primary sources of liquidity are through consolidated enti-
ties, and funding through non-consolidated special purpose
entities and asset securitization activity is immaterial. Our cap-
ital markets debt issuance includes issues of senior and subor-
dinated debt in US registered offerings and medium-term note
programs, euro market medium-term note programs and a
samurai shelf registration statement in Japan. Substantially all
of our unsecured senior debt is issued without financial
covenants that could trigger an increase of our cost of financ-
ing or accelerate the maturity of the debt, including adverse
changes in our credit ratings, cash flows, results of operations
or financial ratios.
In 3Q08, the Bank issued CHF 10.8 billion of senior debt,
including EUR 3.5 billion of senior debt in August, which was
subsequently reopened for another EUR 150 million. Senior
debt of CHF 1.7 billion matured and we redeemed CHF 40
million of subordinated debt. We did not issue long-term sen-
ior debt in the second half of 3Q08, as the deterioration in
credit and financial markets intensified. The Bank’s 2008
funding plan for long-term debt has been largely completed,
and we raised a total of CHF 29 billion in the first nine months
of 2008.
Capital management
Our capital position remained strong. Our consolidated BIS tier
1 ratio under Basel II was 10.4% as of the end of 3Q08, com-
pared to 10.2% as of the end of 2Q08. Our economic capital
coverage ratio was down ten percentage points from 140% in
2Q08 to 130% in 3Q08, due to increased utilized economic
capital.
Shareholders’ equity
Our shareholders’ equity increased from CHF 36.8 billion as
of the end of 2Q08 to CHF 39.0 billion as of the end of
3Q08, primarily due to the positive foreign exchange-related
movements reflected in other comprehensive income, the
issuance of CHF 0.4 billion of shares in the acquisition of AMF
and the effect of share-based compensation, partly offset by
the loss in 3Q08.
At the AGM on May 4, 2007, the shareholders approved a
share buyback program of up to CHF 8 billion, of which CHF
4.1 billion, or 52%, were repurchased as of the end of 3Q08.
During 3Q08, no common shares were repurchased. In light of
the current market environment, we cancelled this buyback
program in October.
Regulatory capital
The Basel Committee on Banking Supervision introduced sig-
nificant changes to the international capital adequacy stan-
dards known as Basel II. These changes affect both risk-
weighted assets and eligible capital, and the new standard is
effective for us from January 1, 2008.
Credit Suisse has received approval from the SFBC to use
the advanced internal ratings-based approach (A-IRB) for
measuring credit risk and the advanced measurement
approach (AMA) for measuring operational risk. Under the A-
IRB for measuring credit risk, risk weights are determined by
using internal risk parameters for probability of default, loss
given default and transactional maturity. The exposure at
default is either derived from balance sheet values or by using
models.
Under Basel II, operational risk is included in risk-weighted
assets. Under the AMA for measuring operational risk, we
have identified key scenarios that describe major operational
risks relevant for us using an event model.
Eligible capital (tier 1 and tier 2 capital) under Basel II is
more affected by changes in deductions to shareholders’
equity than under Basel I. Under Basel II, intangible assets
(except software) are deducted and a broader scope of secu-
ritization risk exposures and expected losses in excess of eligi-
ble provisions are deducted (50% from tier 1 capital and 50%
from tier 2 capital).
For further information, refer to Treasury management in III
– Balance sheet, Off-balance sheet, Treasury and Risk in the
Credit Suisse Annual Report 2007.
In view of the current situation in the financial markets and
the Swiss banking sector, the SFBC and the Swiss National
Bank proposed regulations on minimum capital and leverage
requirements for the large, multi-national Swiss banks. On
October 16, 2008, we reached an agreement with the SFBC
regarding future capital targets and leverage requirements,
which will be phased in through January 1, 2013.
Consistent with the agreed requirements, we raised
approximately CHF 10 billion of tier 1 capital from a small
group of investors through the sale of treasury shares and the
issuance of mandatory convertible bonds and non-dilutive
hybrid tier 1 securities, increasing our tier 1 ratio as of Sep-
tember 30, 2008, on a pro-forma basis, to approximately
13.7%.
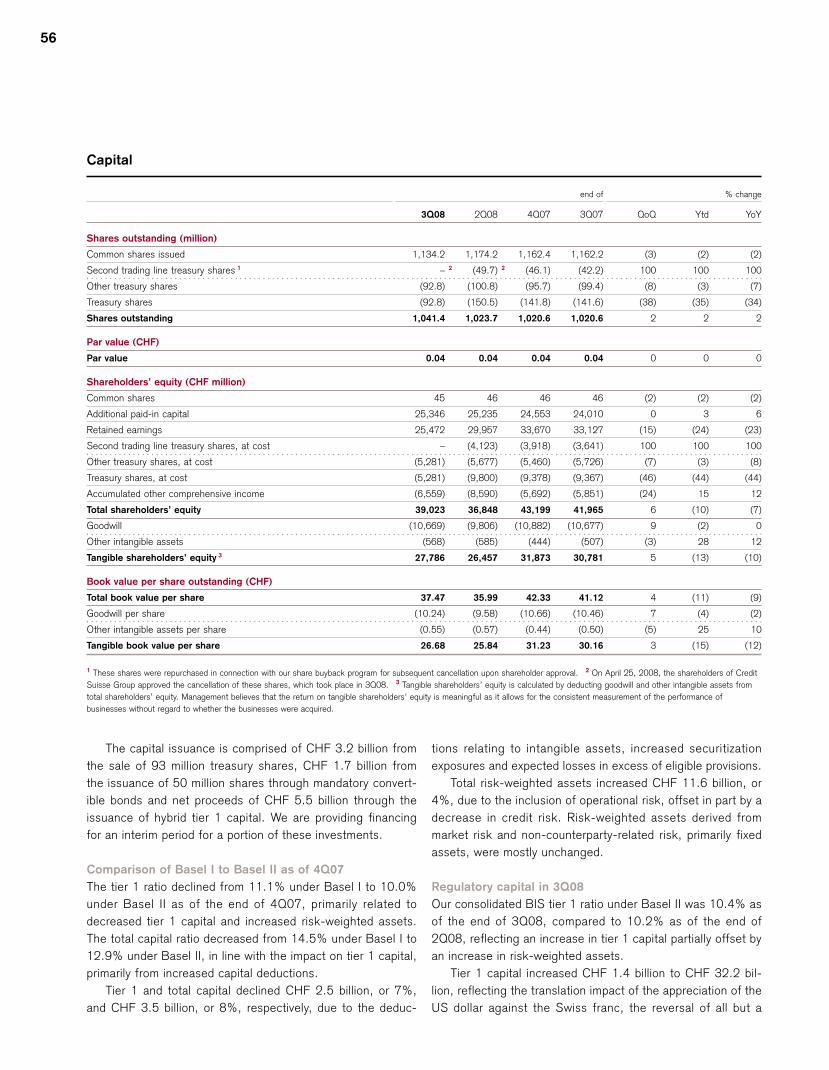
56
Capital
end of % change
3Q08 2Q08 4Q07 3Q07 QoQ Ytd YoY
Shares outstanding (million)
Common shares issued 1,134.2 1,174.2 1,162.4 1,162.2 (3) (2) (2)
Second trading line treasury shares 1 – 2 (49.7) 2 (46.1) (42.2) 100 100 100
Other treasury shares (92.8) (100.8) (95.7) (99.4) (8) (3) (7)
Treasury shares (92.8) (150.5) (141.8) (141.6) (38) (35) (34)
Shares outstanding 1,041.4 1,023.7 1,020.6 1,020.6 2 2 2
Par value (CHF)
Par value 0.04 0.04 0.04 0.04 0 0 0
Shareholders’ equity (CHF million)
Common shares 45 46 46 46 (2) (2) (2)
Additional paid-in capital 25,346 25,235 24,553 24,010 0 3 6
Retained earnings 25,472 29,957 33,670 33,127 (15) (24) (23)
Second trading line treasury shares, at cost – (4,123) (3,918) (3,641) 100 100 100
Other treasury shares, at cost (5,281) (5,677) (5,460) (5,726) (7) (3) (8)
Treasury shares, at cost (5,281) (9,800) (9,378) (9,367) (46) (44) (44)
Accumulated other comprehensive income (6,559) (8,590) (5,692) (5,851) (24) 15 12
Total shareholders’ equity 39,023 36,848 43,199 41,965 6 (10) (7)
Goodwill (10,669) (9,806) (10,882) (10,677) 9 (2) 0
Other intangible assets (568) (585) (444) (507) (3) 28 12
Tangible shareholders’ equity 3 27,786 26,457 31,873 30,781 5 (13) (10)
Book value per share outstanding (CHF)
Total book value per share 37.47 35.99 42.33 41.12 4 (11) (9)
Goodwill per share (10.24) (9.58) (10.66) (10.46) 7 (4) (2)
Other intangible assets per share (0.55) (0.57) (0.44) (0.50) (5) 25 10
Tangible book value per share 26.68 25.84 31.23 30.16 3 (15) (12)
1 These shares were repurchased in connection with our share buyback program for subsequent cancellation upon shareholder approval. 2 On April 25, 2008, the shareholders of Credit
Suisse Group approved the cancellation of these shares, which took place in 3Q08. 3 Tangible shareholders’ equity is calculated by deducting goodwill and other intangible assets from
total shareholders’ equity. Management believes that the return on tangible shareholders’ equity is meaningful as it allows for the consistent measurement of the performance of
businesses without regard to whether the businesses were acquired.
The capital issuance is comprised of CHF 3.2 billion from
the sale of 93 million treasury shares, CHF 1.7 billion from
the issuance of 50 million shares through mandatory convert-
ible bonds and net proceeds of CHF 5.5 billion through the
issuance of hybrid tier 1 capital. We are providing financing
for an interim period for a portion of these investments.
Comparison of Basel I to Basel II as of 4Q07
The tier 1 ratio declined from 11.1% under Basel I to 10.0%
under Basel II as of the end of 4Q07, primarily related to
decreased tier 1 capital and increased risk-weighted assets.
The total capital ratio decreased from 14.5% under Basel I to
12.9% under Basel II, in line with the impact on tier 1 capital,
primarily from increased capital deductions.
Tier 1 and total capital declined CHF 2.5 billion, or 7%,
and CHF 3.5 billion, or 8%, respectively, due to the deduc-
tions relating to intangible assets, increased securitization
exposures and expected losses in excess of eligible provisions.
Total risk-weighted assets increased CHF 11.6 billion, or
4%, due to the inclusion of operational risk, offset in part by a
decrease in credit risk. Risk-weighted assets derived from
market risk and non-counterparty-related risk, primarily fixed
assets, were mostly unchanged.
Regulatory capital in 3Q08
Our consolidated BIS tier 1 ratio under Basel II was 10.4% as
of the end of 3Q08, compared to 10.2% as of the end of
2Q08, reflecting an increase in tier 1 capital partially offset by
an increase in risk-weighted assets.
Tier 1 capital increased CHF 1.4 billion to CHF 32.2 bil-
lion, reflecting the translation impact of the appreciation of the
US dollar against the Swiss franc, the reversal of all but a
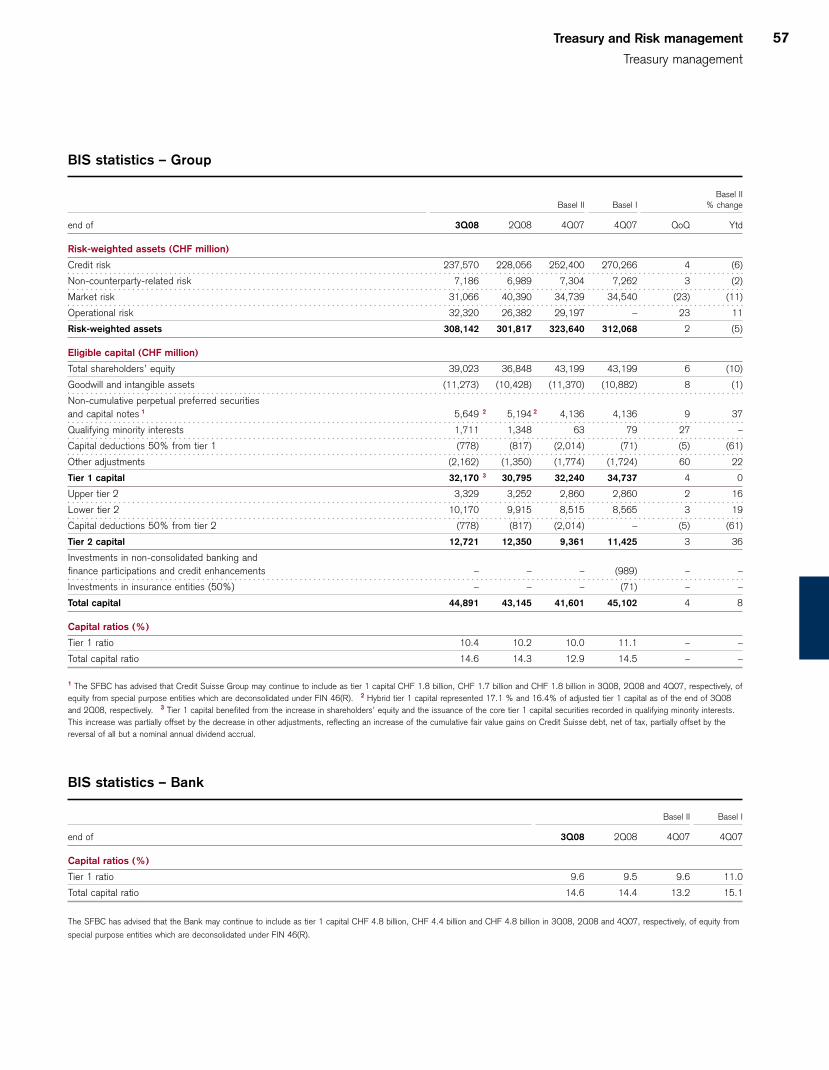
Treasury and Risk management
Treasury management
57
BIS statistics – Group
Basel IIBasel II Basel I % change
end of 3Q08 2Q08 4Q07 4Q07 QoQ Ytd
Risk-weighted assets (CHF million)
Credit risk 237,570 228,056 252,400 270,266 4 (6)
Non-counterparty-related risk 7,186 6,989 7,304 7,262 3 (2)
Market risk 31,066 40,390 34,739 34,540 (23) (11)
Operational risk 32,320 26,382 29,197 – 23 11
Risk-weighted assets 308,142 301,817 323,640 312,068 2 (5)
Eligible capital (CHF million)
Total shareholders’ equity 39,023 36,848 43,199 43,199 6 (10)
Goodwill and intangible assets (11,273) (10,428) (11,370) (10,882) 8 (1)
Non-cumulative perpetual preferred securities
and capital notes 1 5,649 2 5,194 2 4,136 4,136 9 37
Qualifying minority interests 1,711 1,348 63 79 27 –
Capital deductions 50% from tier 1 (778) (817) (2,014) (71) (5) (61)
Other adjustments (2,162) (1,350) (1,774) (1,724) 60 22
Tier 1 capital 32,170 3 30,795 32,240 34,737 4 0
Upper tier 2 3,329 3,252 2,860 2,860 2 16
Lower tier 2 10,170 9,915 8,515 8,565 3 19
Capital deductions 50% from tier 2 (778) (817) (2,014) – (5) (61)
Tier 2 capital 12,721 12,350 9,361 11,425 3 36
Investments in non-consolidated banking and
finance participations and credit enhancements – – – (989) – –
Investments in insurance entities (50%) – – – (71) – –
Total capital 44,891 43,145 41,601 45,102 4 8
Capital ratios (%)
Tier 1 ratio 10.4 10.2 10.0 11.1 – –
Total capital ratio 14.6 14.3 12.9 14.5 – –
1 The SFBC has advised that Credit Suisse Group may continue to include as tier 1 capital CHF 1.8 billion, CHF 1.7 billion and CHF 1.8 billion in 3Q08, 2Q08 and 4Q07, respectively, of
equity from special purpose entities which are deconsolidated under FIN 46(R). 2 Hybrid tier 1 capital represented 17.1 % and 16.4% of adjusted tier 1 capital as of the end of 3Q08
and 2Q08, respectively. 3 Tier 1 capital benefited from the increase in shareholders’ equity and the issuance of the core tier 1 capital securities recorded in qualifying minority interests.
This increase was partially offset by the decrease in other adjustments, reflecting an increase of the cumulative fair value gains on Credit Suisse debt, net of tax, partially offset by the
reversal of all but a nominal annual dividend accrual.
BIS statistics – Bank
Basel II Basel I
end of 3Q08 2Q08 4Q07 4Q07
Capital ratios (%)
Tier 1 ratio 9.6 9.5 9.6 11.0
Total capital ratio 14.6 14.4 13.2 15.1
The SFBC has advised that the Bank may continue to include as tier 1 capital CHF 4.8 billion, CHF 4.4 billion and CHF 4.8 billion in 3Q08, 2Q08 and 4Q07, respectively, of equity from
special purpose entities which are deconsolidated under FIN 46(R).
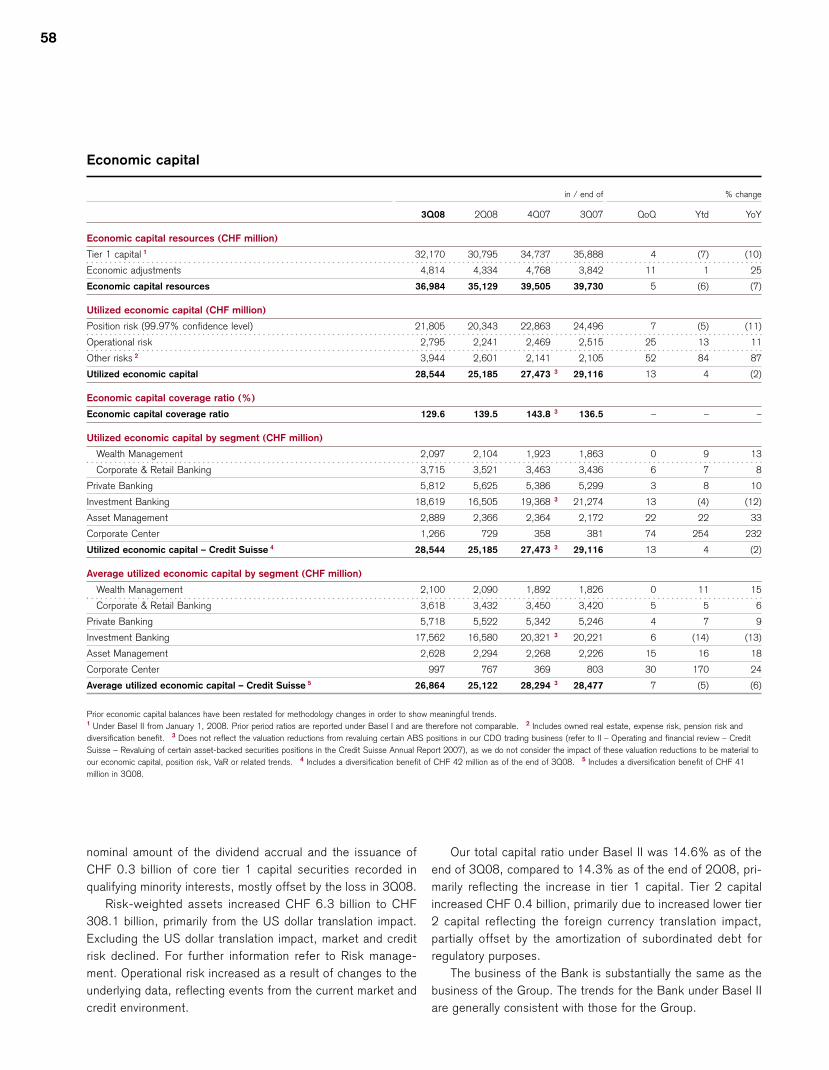
58
Economic capital
in / end of % change
3Q08 2Q08 4Q07 3Q07 QoQ Ytd YoY
Economic capital resources (CHF million)
Tier 1 capital 1 32,170 30,795 34,737 35,888 4 (7) (10)
Economic adjustments 4,814 4,334 4,768 3,842 11 1 25
Economic capital resources 36,984 35,129 39,505 39,730 5 (6) (7)
Utilized economic capital (CHF million)
Position risk (99.97% confidence level) 21,805 20,343 22,863 24,496 7 (5) (11)
Operational risk 2,795 2,241 2,469 2,515 25 13 11
Other risks 2 3,944 2,601 2,141 2,105 52 84 87
Utilized economic capital 28,544 25,185 27,473 3 29,116 13 4 (2)
Economic capital coverage ratio (%)
Economic capital coverage ratio 129.6 139.5 143.8 3 136.5 – – –
Utilized economic capital by segment (CHF million)
Wealth Management 2,097 2,104 1,923 1,863 0 9 13
Corporate & Retail Banking 3,715 3,521 3,463 3,436 6 7 8
Private Banking 5,812 5,625 5,386 5,299 3 8 10
Investment Banking 18,619 16,505 19,368 3 21,274 13 (4) (12)
Asset Management 2,889 2,366 2,364 2,172 22 22 33
Corporate Center 1,266 729 358 381 74 254 232
Utilized economic capital – Credit Suisse 4 28,544 25,185 27,473 3 29,116 13 4 (2)
Average utilized economic capital by segment (CHF million)
Wealth Management 2,100 2,090 1,892 1,826 0 11 15
Corporate & Retail Banking 3,618 3,432 3,450 3,420 5 5 6
Private Banking 5,718 5,522 5,342 5,246 4 7 9
Investment Banking 17,562 16,580 20,321 3 20,221 6 (14) (13)
Asset Management 2,628 2,294 2,268 2,226 15 16 18
Corporate Center 997 767 369 803 30 170 24
Average utilized economic capital – Credit Suisse 5 26,864 25,122 28,294 3 28,477 7 (5) (6)
Prior economic capital balances have been restated for methodology changes in order to show meaningful trends.1 Under Basel II from January 1, 2008. Prior period ratios are reported under Basel I and are therefore not comparable. 2 Includes owned real estate, expense risk, pension risk and
diversification benefit. 3 Does not reflect the valuation reductions from revaluing certain ABS positions in our CDO trading business (refer to II – Operating and financial review – Credit
Suisse – Revaluing of certain asset-backed securities positions in the Credit Suisse Annual Report 2007), as we do not consider the impact of these valuation reductions to be material to
our economic capital, position risk, VaR or related trends. 4 Includes a diversification benefit of CHF 42 million as of the end of 3Q08. 5 Includes a diversification benefit of CHF 41
million in 3Q08.
nominal amount of the dividend accrual and the issuance of
CHF 0.3 billion of core tier 1 capital securities recorded in
qualifying minority interests, mostly offset by the loss in 3Q08.
Risk-weighted assets increased CHF 6.3 billion to CHF
308.1 billion, primarily from the US dollar translation impact.
Excluding the US dollar translation impact, market and credit
risk declined. For further information refer to Risk manage-
ment. Operational risk increased as a result of changes to the
underlying data, reflecting events from the current market and
credit environment.
Our total capital ratio under Basel II was 14.6% as of the
end of 3Q08, compared to 14.3% as of the end of 2Q08, pri-
marily reflecting the increase in tier 1 capital. Tier 2 capital
increased CHF 0.4 billion, primarily due to increased lower tier
2 capital reflecting the foreign currency translation impact,
partially offset by the amortization of subordinated debt for
regulatory purposes.
The business of the Bank is substantially the same as the
business of the Group. The trends for the Bank under Basel II
are generally consistent with those for the Group.
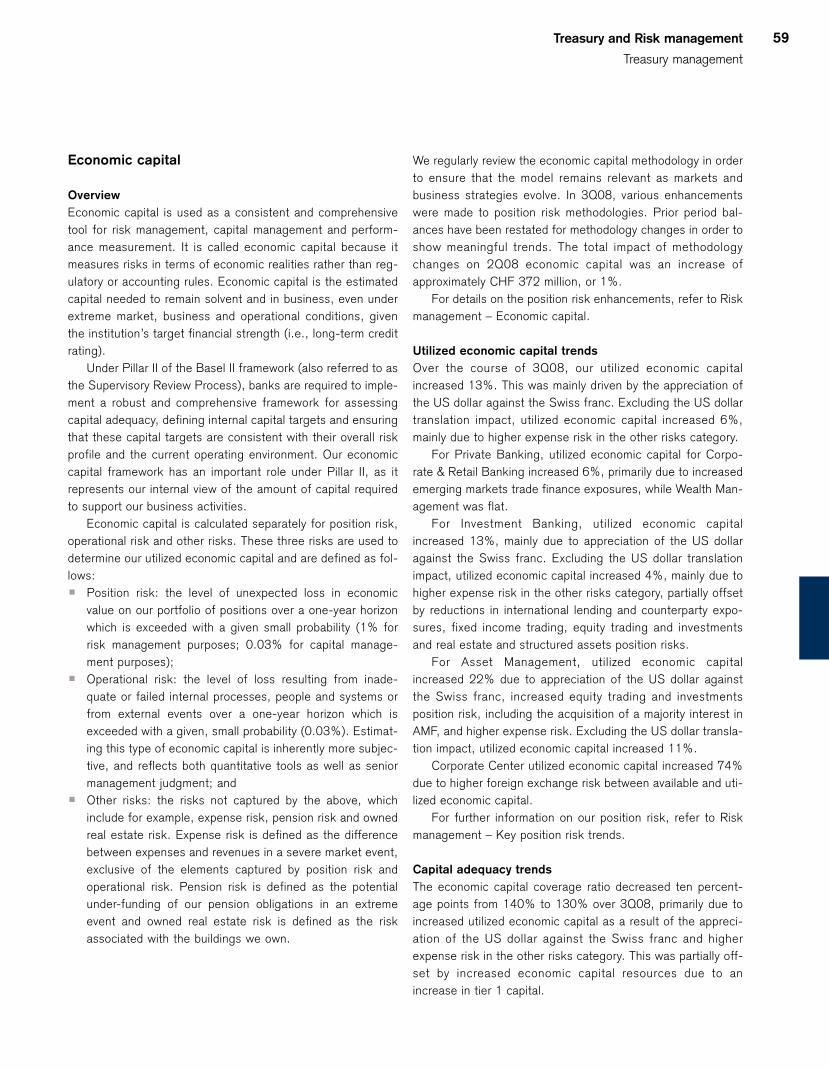
Treasury and Risk management
Treasury management
59
Economic capital
Overview
Economic capital is used as a consistent and comprehensive
tool for risk management, capital management and perform-
ance measurement. It is called economic capital because it
measures risks in terms of economic realities rather than reg-
ulatory or accounting rules. Economic capital is the estimated
capital needed to remain solvent and in business, even under
extreme market, business and operational conditions, given
the institution’s target financial strength (i.e., long-term credit
rating).
Under Pillar II of the Basel II framework (also referred to as
the Supervisory Review Process), banks are required to imple-
ment a robust and comprehensive framework for assessing
capital adequacy, defining internal capital targets and ensuring
that these capital targets are consistent with their overall risk
profile and the current operating environment. Our economic
capital framework has an important role under Pillar II, as it
represents our internal view of the amount of capital required
to support our business activities.
Economic capital is calculated separately for position risk,
operational risk and other risks. These three risks are used to
determine our utilized economic capital and are defined as fol-
lows:
p Position risk: the level of unexpected loss in economic
value on our portfolio of positions over a one-year horizon
which is exceeded with a given small probability (1% for
risk management purposes; 0.03% for capital manage-
ment purposes);
p Operational risk: the level of loss resulting from inade-
quate or failed internal processes, people and systems or
from external events over a one-year horizon which is
exceeded with a given, small probability (0.03%). Estimat-
ing this type of economic capital is inherently more subjec-
tive, and reflects both quantitative tools as well as senior
management judgment; and
p Other risks: the risks not captured by the above, which
include for example, expense risk, pension risk and owned
real estate risk. Expense risk is defined as the difference
between expenses and revenues in a severe market event,
exclusive of the elements captured by position risk and
operational risk. Pension risk is defined as the potential
under-funding of our pension obligations in an extreme
event and owned real estate risk is defined as the risk
associated with the buildings we own.
We regularly review the economic capital methodology in order
to ensure that the model remains relevant as markets and
business strategies evolve. In 3Q08, various enhancements
were made to position risk methodologies. Prior period bal-
ances have been restated for methodology changes in order to
show meaningful trends. The total impact of methodology
changes on 2Q08 economic capital was an increase of
approximately CHF 372 million, or 1%.
For details on the position risk enhancements, refer to Risk
management – Economic capital.
Utilized economic capital trends
Over the course of 3Q08, our utilized economic capital
increased 13%. This was mainly driven by the appreciation of
the US dollar against the Swiss franc. Excluding the US dollar
translation impact, utilized economic capital increased 6%,
mainly due to higher expense risk in the other risks category.
For Private Banking, utilized economic capital for Corpo-
rate & Retail Banking increased 6%, primarily due to increased
emerging markets trade finance exposures, while Wealth Man-
agement was flat.
For Investment Banking, utilized economic capital
increased 13%, mainly due to appreciation of the US dollar
against the Swiss franc. Excluding the US dollar translation
impact, utilized economic capital increased 4%, mainly due to
higher expense risk in the other risks category, partially offset
by reductions in international lending and counterparty expo-
sures, fixed income trading, equity trading and investments
and real estate and structured assets position risks.
For Asset Management, utilized economic capital
increased 22% due to appreciation of the US dollar against
the Swiss franc, increased equity trading and investments
position risk, including the acquisition of a majority interest in
AMF, and higher expense risk. Excluding the US dollar transla-
tion impact, utilized economic capital increased 11%.
Corporate Center utilized economic capital increased 74%
due to higher foreign exchange risk between available and uti-
lized economic capital.
For further information on our position risk, refer to Risk
management – Key position risk trends.
Capital adequacy trends
The economic capital coverage ratio decreased ten percent-
age points from 140% to 130% over 3Q08, primarily due to
increased utilized economic capital as a result of the appreci-
ation of the US dollar against the Swiss franc and higher
expense risk in the other risks category. This was partially off-
set by increased economic capital resources due to an
increase in tier 1 capital.
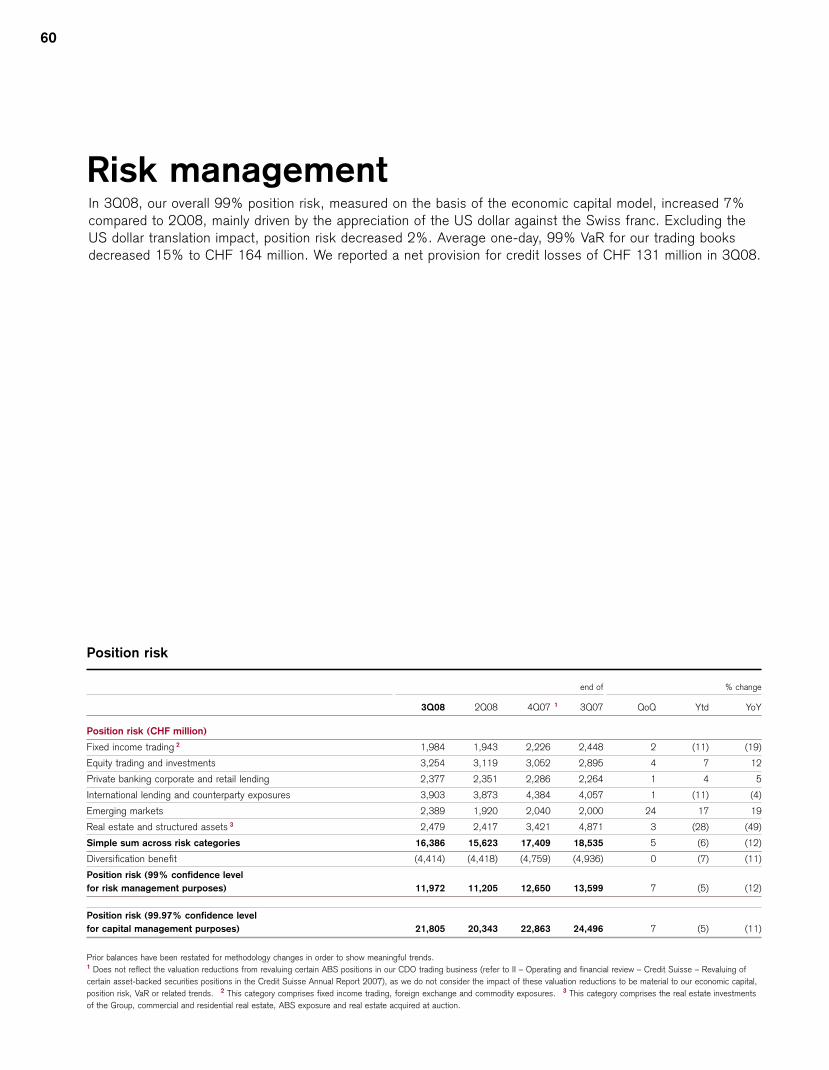
60
Risk management In 3Q08, our overall 99% position risk, measured on the basis of the economic capital model, increased 7%compared to 2Q08, mainly driven by the appreciation of the US dollar against the Swiss franc. Excluding theUS dollar translation impact, position risk decreased 2%. Average one-day, 99% VaR for our trading booksdecreased 15% to CHF 164 million. We reported a net provision for credit losses of CHF 131 million in 3Q08.
Position risk
end of % change
3Q08 2Q08 4Q07 1 3Q07 QoQ Ytd YoY
Position risk (CHF million)
Fixed income trading 2 1,984 1,943 2,226 2,448 2 (11) (19)
Equity trading and investments 3,254 3,119 3,052 2,895 4 7 12
Private banking corporate and retail lending 2,377 2,351 2,286 2,264 1 4 5
International lending and counterparty exposures 3,903 3,873 4,384 4,057 1 (11) (4)
Emerging markets 2,389 1,920 2,040 2,000 24 17 19
Real estate and structured assets 3 2,479 2,417 3,421 4,871 3 (28) (49)
Simple sum across risk categories 16,386 15,623 17,409 18,535 5 (6) (12)
Diversification benefit (4,414) (4,418) (4,759) (4,936) 0 (7) (11)
Position risk (99% confidence level
for risk management purposes) 11,972 11,205 12,650 13,599 7 (5) (12)
Position risk (99.97% confidence level
for capital management purposes) 21,805 20,343 22,863 24,496 7 (5) (11)
Prior balances have been restated for methodology changes in order to show meaningful trends.1 Does not reflect the valuation reductions from revaluing certain ABS positions in our CDO trading business (refer to II – Operating and financial review – Credit Suisse – Revaluing of
certain asset-backed securities positions in the Credit Suisse Annual Report 2007), as we do not consider the impact of these valuation reductions to be material to our economic capital,
position risk, VaR or related trends. 2 This category comprises fixed income trading, foreign exchange and commodity exposures. 3 This category comprises the real estate investments
of the Group, commercial and residential real estate, ABS exposure and real estate acquired at auction.
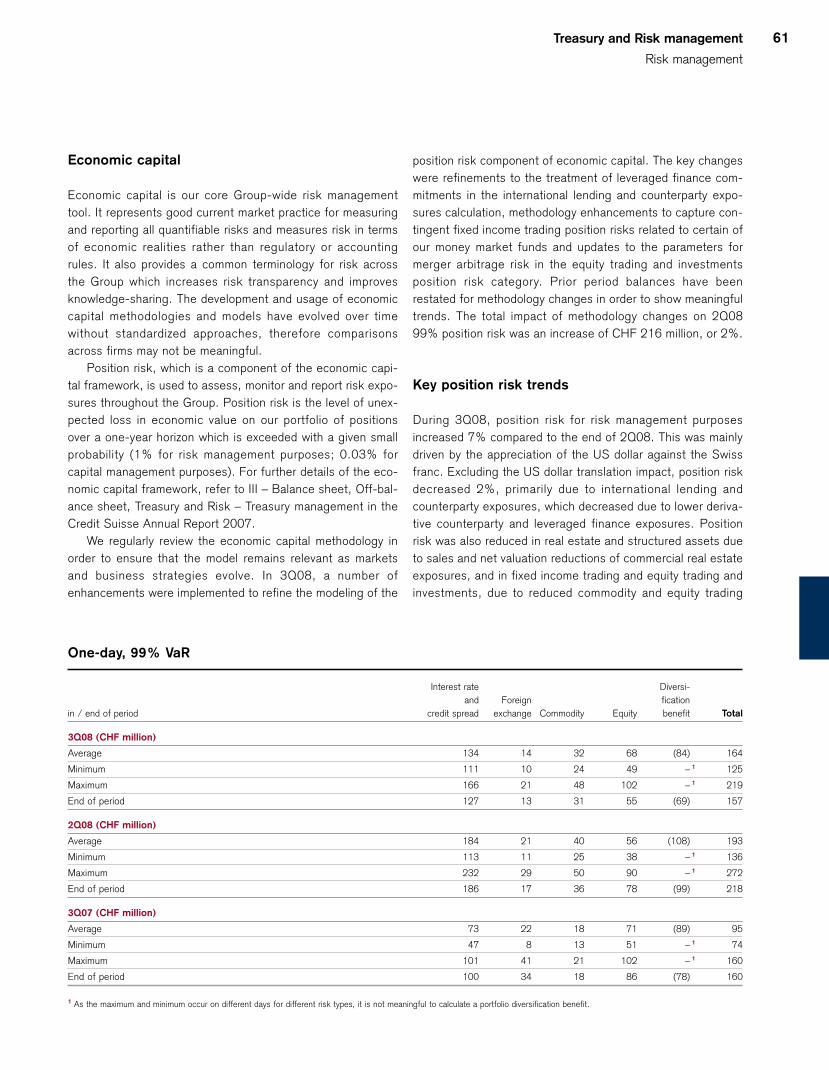
Treasury and Risk management
Risk management
61
Economic capital
Economic capital is our core Group-wide risk management
tool. It represents good current market practice for measuring
and reporting all quantifiable risks and measures risk in terms
of economic realities rather than regulatory or accounting
rules. It also provides a common terminology for risk across
the Group which increases risk transparency and improves
knowledge-sharing. The development and usage of economic
capital methodologies and models have evolved over time
without standardized approaches, therefore comparisons
across firms may not be meaningful.
Position risk, which is a component of the economic capi-
tal framework, is used to assess, monitor and report risk expo-
sures throughout the Group. Position risk is the level of unex-
pected loss in economic value on our portfolio of positions
over a one-year horizon which is exceeded with a given small
probability (1% for risk management purposes; 0.03% for
capital management purposes). For further details of the eco-
nomic capital framework, refer to III – Balance sheet, Off-bal-
ance sheet, Treasury and Risk – Treasury management in the
Credit Suisse Annual Report 2007.
We regularly review the economic capital methodology in
order to ensure that the model remains relevant as markets
and business strategies evolve. In 3Q08, a number of
enhancements were implemented to refine the modeling of the
position risk component of economic capital. The key changes
were refinements to the treatment of leveraged finance com-
mitments in the international lending and counterparty expo-
sures calculation, methodology enhancements to capture con-
tingent fixed income trading position risks related to certain of
our money market funds and updates to the parameters for
merger arbitrage risk in the equity trading and investments
position risk category. Prior period balances have been
restated for methodology changes in order to show meaningful
trends. The total impact of methodology changes on 2Q08
99% position risk was an increase of CHF 216 million, or 2%.
Key position risk trends
During 3Q08, position risk for risk management purposes
increased 7% compared to the end of 2Q08. This was mainly
driven by the appreciation of the US dollar against the Swiss
franc. Excluding the US dollar translation impact, position risk
decreased 2%, primarily due to international lending and
counterparty exposures, which decreased due to lower deriva-
tive counterparty and leveraged finance exposures. Position
risk was also reduced in real estate and structured assets due
to sales and net valuation reductions of commercial real estate
exposures, and in fixed income trading and equity trading and
investments, due to reduced commodity and equity trading
One-day, 99% VaR
Interest rate Diversi-
and Foreign fication
in / end of period credit spread exchange Commodity Equity benefit Total
3Q08 (CHF million)
Average 134 14 32 68 (84) 164
Minimum 111 10 24 49 – 1 125
Maximum 166 21 48 102 – 1 219
End of period 127 13 31 55 (69) 157
2Q08 (CHF million)
Average 184 21 40 56 (108) 193
Minimum 113 11 25 38 – 1 136
Maximum 232 29 50 90 – 1 272
End of period 186 17 36 78 (99) 218
3Q07 (CHF million)
Average 73 22 18 71 (89) 95
Minimum 47 8 13 51 – 1 74
Maximum 101 41 21 102 – 1 160
End of period 100 34 18 86 (78) 160
1 As the maximum and minimum occur on different days for different risk types, it is not meaningful to calculate a portfolio diversification benefit.

62
exposures, respectively. Emerging markets position risk
increased primarily in Latin America.
Compared to the end of 3Q07, position risk for risk man-
agement purposes decreased 12%, primarily driven by reduc-
tions in real estate and structured assets, fixed income trading
and the depreciation of the US dollar against the Swiss franc.
Excluding the US dollar translation impact, position risk
decreased 9%. Real estate and structured assets decreased
due to significantly reduced commercial real estate, residential
real estate and asset-backed exposures. Fixed income trading
exposures decreased due to reduced credit spread and for-
eign exchange exposures, partially offset by increased interest
rate exposures. Position risk increased in equity trading and
investments due to private equity exposures and the acquisi-
tion of a majority interest in AMF. Emerging markets position
risk increased primarily in Latin America and Asia, and private
banking corporate and retail lending increased due to an
increase in residential mortgage exposures and loans collater-
alized by securities.
As part of our overall risk management, we hold a portfolio
of hedges. Hedges are impacted by market movements similar
to other trading securities, and may result in gains or losses
CHF m
3Q07 3Q084Q071) 1Q08 2Q08
0
45
90
135
180
225
270
< (100) (100)–(75) (75)–(50) (50)–(25) (25)–0 0–25 25–50 50–75 75–100 100–125 125–150 >150
Days
CHF m
0
5
10
15
Daily VaR
One-day VaR (99%)
1) Does not reflect the valuation reductions from revaluing certain ABS positions in our CDO trading business (refer to II – Operating and financial review – Credit Suisse - Revaluingof certain asset-backed securities positions in the Credit Suisse Annual Report 2007), as we do not consider the impact of these valuation reductions to be material to our economiccapital, position risk, VaR or related trends.
Actual daily trading revenues
p in 3Q08 p in 2Q08 p in 3Q07 Excludes Clariden Leu and Neue Aargauer Bank
Treasury and Risk management
Risk management
63
which offset losses or gains on the portfolio they were
designed to hedge. Due to the varying nature and structure of
hedges, these gains or losses may not perfectly offset the
losses or gains on the portfolio.
Market risk
We primarily assume trading risks through the trading activities
in Investment Banking. The other divisions also engage in
trading activities, but to a much lesser extent. Trading risks
are measured using VaR along with a number of other risk
measurement tools. VaR is the potential loss in fair value of
trading positions due to adverse market movements over a
defined time horizon and for a specified confidence level. VaR
relies on historical data and is considered a useful tool for esti-
mating potential loss in normal markets in which there are no
abrupt changes in market conditions. Other tools are more
appropriate for modeling the impact from severe market condi-
tions.
In order to show the aggregate market risk in our trading
books, the table entitled “Daily VaR” shows the trading-related
market risk on a consolidated basis. It shows ten-day VaR
scaled to a one-day holding period and is based on a 99%
confidence level. This means there is a 1-in-100 chance of
incurring a daily mark-to-market trading loss at least as large
as the reported VaR.
Our average one-day, 99% VaR during 3Q08 was CHF
164 million compared to CHF 193 million during 2Q08. The
decrease compared to 2Q08 was primarily due to reduced
exposures across most risk categories, with the main driver
being lower interest rate and credit spread risk from commer-
cial mortgages. Period-end VaR decreased significantly during
3Q08 to CHF 157 million compared to CHF 218 million as of
the end of 2Q08, also reflecting a decrease in equity trading
exposures. Compared to 3Q07, average one-day, 99% VaR
increased significantly, primarily due to increased volatility in
the underlying data used to calculate VaR. Compared to
3Q07, end of period VaR was flat, as reduced exposures were
offset by increased volatility in the underlying data used to cal-
culate VaR.
Various techniques are used to assess the accuracy of the
VaR model, including backtesting. In line with industry prac-
tice, we present backtesting using actual daily trading rev-
enues. Actual daily trading revenues are compared with VaR
calculated using a one-day holding period. A backtesting
exception occurs when the trading revenues loss exceeds the
daily VaR estimate. We had four backtesting exceptions during
3Q08, due to the volatile market conditions. The histogram
entitled “Actual daily trading revenues” reflects the distribution
of actual daily trading revenues during 3Q08, 2Q08 and
3Q07. The width of this distribution provides another indica-
tion of the day-to-day risk in our trading activities.
We assume non-trading interest rate risks through interest
rate-sensitive positions originated by Private Banking and risk-
transferred to Global Treasury, money market and funding
activities by Global Treasury and the deployment of our consol-
idated equity as well as other activities, including market-mak-
ing and trading activities involving banking book positions at
the divisions. Savings accounts and many other retail banking
products have no contractual maturity date or direct market-
linked interest rate and are risk-transferred from Private Bank-
ing to Global Treasury on a pooled basis using replicating port-
folios (approximating the re-pricing behavior of the underlying
product). Global Treasury, as well as other desks running inter-
est rate risk positions, actively manage their position within
approved limits.
The impact of a one basis point parallel increase of the
yield curves on the fair value of interest rate-sensitive non-
trading book positions would have amounted to a valuation
decrease of CHF 3.2 million as of the end of 3Q08, compared
to CHF 3.3 million as of the end of 2Q08, with the change
mainly due to a decrease in the long bond interest rate expo-
sure in the divisional banking books, partly offset by the appre-
ciation of the US dollar against the Swiss franc.
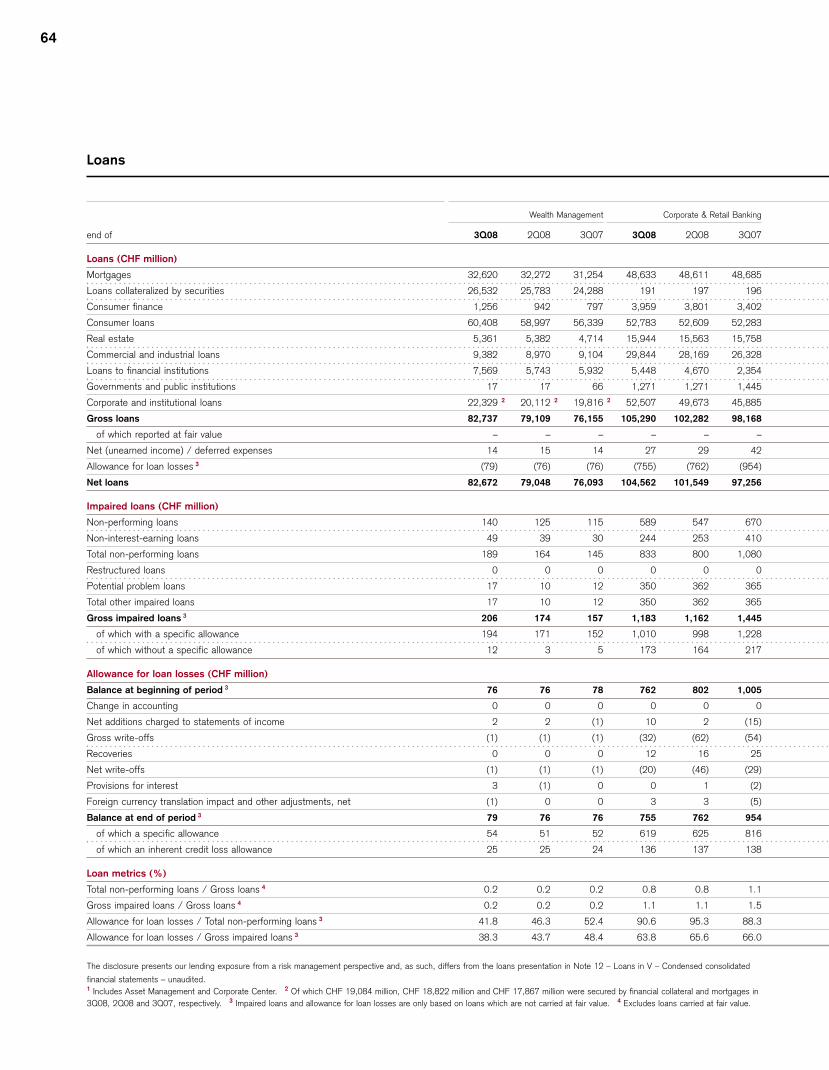
64
Loans
Wealth Management Corporate & Retail Banking
end of 3Q08 2Q08 3Q07 3Q08 2Q08 3Q07
Loans (CHF million)
Mortgages 32,620 32,272 31,254 48,633 48,611 48,685
Loans collateralized by securities 26,532 25,783 24,288 191 197 196
Consumer finance 1,256 942 797 3,959 3,801 3,402
Consumer loans 60,408 58,997 56,339 52,783 52,609 52,283
Real estate 5,361 5,382 4,714 15,944 15,563 15,758
Commercial and industrial loans 9,382 8,970 9,104 29,844 28,169 26,328
Loans to financial institutions 7,569 5,743 5,932 5,448 4,670 2,354
Governments and public institutions 17 17 66 1,271 1,271 1,445
Corporate and institutional loans 22,329 2 20,112 2 19,816 2 52,507 49,673 45,885
Gross loans 82,737 79,109 76,155 105,290 102,282 98,168
of which reported at fair value – – – – – –
Net (unearned income) / deferred expenses 14 15 14 27 29 42
Allowance for loan losses 3 (79) (76) (76) (755) (762) (954)
Net loans 82,672 79,048 76,093 104,562 101,549 97,256
Impaired loans (CHF million)
Non-performing loans 140 125 115 589 547 670
Non-interest-earning loans 49 39 30 244 253 410
Total non-performing loans 189 164 145 833 800 1,080
Restructured loans 0 0 0 0 0 0
Potential problem loans 17 10 12 350 362 365
Total other impaired loans 17 10 12 350 362 365
Gross impaired loans 3 206 174 157 1,183 1,162 1,445
of which with a specific allowance 194 171 152 1,010 998 1,228
of which without a specific allowance 12 3 5 173 164 217
Allowance for loan losses (CHF million)
Balance at beginning of period 3 76 76 78 762 802 1,005
Change in accounting 0 0 0 0 0 0
Net additions charged to statements of income 2 2 (1) 10 2 (15)
Gross write-offs (1) (1) (1) (32) (62) (54)
Recoveries 0 0 0 12 16 25
Net write-offs (1) (1) (1) (20) (46) (29)
Provisions for interest 3 (1) 0 0 1 (2)
Foreign currency translation impact and other adjustments, net (1) 0 0 3 3 (5)
Balance at end of period 3 79 76 76 755 762 954
of which a specific allowance 54 51 52 619 625 816
of which an inherent credit loss allowance 25 25 24 136 137 138
Loan metrics (%)
Total non-performing loans / Gross loans 4 0.2 0.2 0.2 0.8 0.8 1.1
Gross impaired loans / Gross loans 4 0.2 0.2 0.2 1.1 1.1 1.5
Allowance for loan losses / Total non-performing loans 3 41.8 46.3 52.4 90.6 95.3 88.3
Allowance for loan losses / Gross impaired loans 3 38.3 43.7 48.4 63.8 65.6 66.0
The disclosure presents our lending exposure from a risk management perspective and, as such, differs from the loans presentation in Note 12 – Loans in V – Condensed consolidated
financial statements – unaudited.1 Includes Asset Management and Corporate Center. 2 Of which CHF 19,084 million, CHF 18,822 million and CHF 17,867 million were secured by financial collateral and mortgages in
3Q08, 2Q08 and 3Q07, respectively. 3 Impaired loans and allowance for loan losses are only based on loans which are not carried at fair value. 4 Excludes loans carried at fair value.
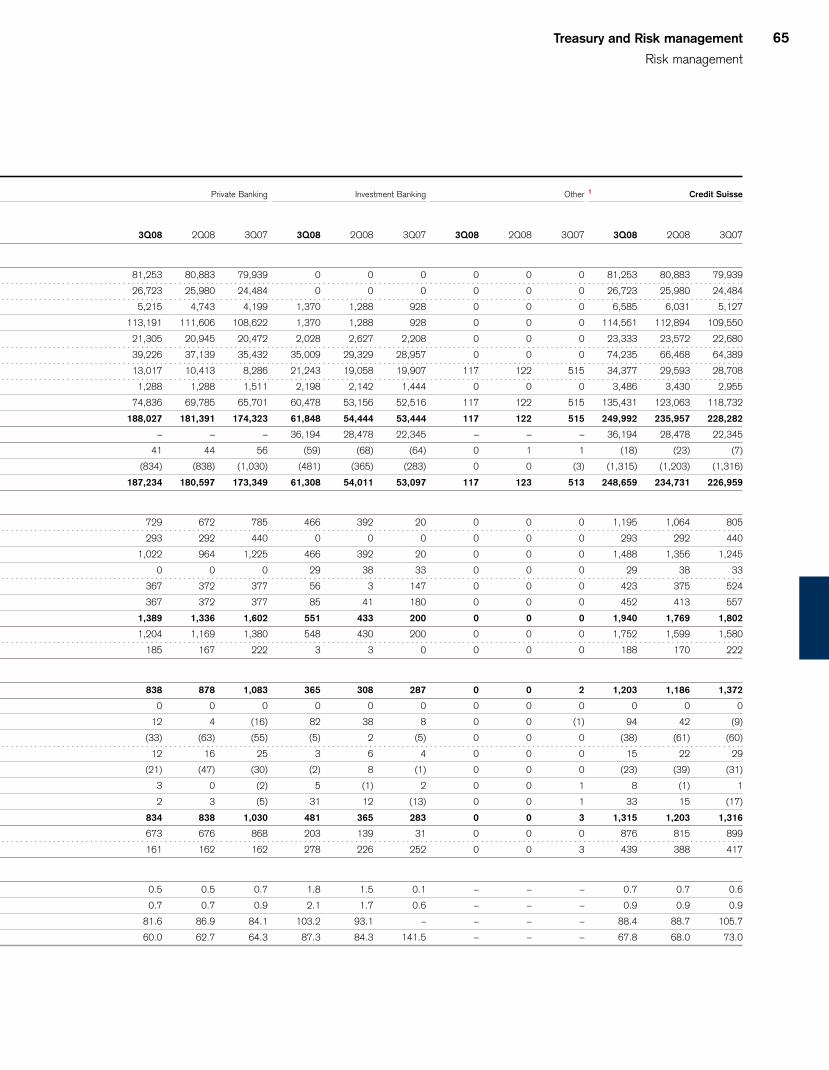
Treasury and Risk management
Risk management
65
Private Banking Investment Banking Other 1 Credit Suisse
3Q08 2Q08 3Q07 3Q08 2Q08 3Q07 3Q08 2Q08 3Q07 3Q08 2Q08 3Q07
81,253 80,883 79,939 0 0 0 0 0 0 81,253 80,883 79,939
26,723 25,980 24,484 0 0 0 0 0 0 26,723 25,980 24,484
5,215 4,743 4,199 1,370 1,288 928 0 0 0 6,585 6,031 5,127
113,191 111,606 108,622 1,370 1,288 928 0 0 0 114,561 112,894 109,550
21,305 20,945 20,472 2,028 2,627 2,208 0 0 0 23,333 23,572 22,680
39,226 37,139 35,432 35,009 29,329 28,957 0 0 0 74,235 66,468 64,389
13,017 10,413 8,286 21,243 19,058 19,907 117 122 515 34,377 29,593 28,708
1,288 1,288 1,511 2,198 2,142 1,444 0 0 0 3,486 3,430 2,955
74,836 69,785 65,701 60,478 53,156 52,516 117 122 515 135,431 123,063 118,732
188,027 181,391 174,323 61,848 54,444 53,444 117 122 515 249,992 235,957 228,282
– – – 36,194 28,478 22,345 – – – 36,194 28,478 22,345
41 44 56 (59) (68) (64) 0 1 1 (18) (23) (7)
(834) (838) (1,030) (481) (365) (283) 0 0 (3) (1,315) (1,203) (1,316)
187,234 180,597 173,349 61,308 54,011 53,097 117 123 513 248,659 234,731 226,959
729 672 785 466 392 20 0 0 0 1,195 1,064 805
293 292 440 0 0 0 0 0 0 293 292 440
1,022 964 1,225 466 392 20 0 0 0 1,488 1,356 1,245
0 0 0 29 38 33 0 0 0 29 38 33
367 372 377 56 3 147 0 0 0 423 375 524
367 372 377 85 41 180 0 0 0 452 413 557
1,389 1,336 1,602 551 433 200 0 0 0 1,940 1,769 1,802
1,204 1,169 1,380 548 430 200 0 0 0 1,752 1,599 1,580
185 167 222 3 3 0 0 0 0 188 170 222
838 878 1,083 365 308 287 0 0 2 1,203 1,186 1,372
0 0 0 0 0 0 0 0 0 0 0 0
12 4 (16) 82 38 8 0 0 (1) 94 42 (9)
(33) (63) (55) (5) 2 (5) 0 0 0 (38) (61) (60)
12 16 25 3 6 4 0 0 0 15 22 29
(21) (47) (30) (2) 8 (1) 0 0 0 (23) (39) (31)
3 0 (2) 5 (1) 2 0 0 1 8 (1) 1
2 3 (5) 31 12 (13) 0 0 1 33 15 (17)
834 838 1,030 481 365 283 0 0 3 1,315 1,203 1,316
673 676 868 203 139 31 0 0 0 876 815 899
161 162 162 278 226 252 0 0 3 439 388 417
0.5 0.5 0.7 1.8 1.5 0.1 – – – 0.7 0.7 0.6
0.7 0.7 0.9 2.1 1.7 0.6 – – – 0.9 0.9 0.9
81.6 86.9 84.1 103.2 93.1 – – – – 88.4 88.7 105.7
60.0 62.7 64.3 87.3 84.3 141.5 – – – 67.8 68.0 73.0

66
Credit risk
We have credit risk in our lending-related and trading busi-
nesses, the majority of which is in Investment Banking and
Private Banking.
Loan exposure
Compared to the end of 2Q08, gross loans increased 6% to
CHF 250.0 billion as of the end of 3Q08. In Private Banking,
gross loans increased 4% to CHF 188.0 billion, primarily due
to growth in commercial and industrial loans and loans to
financial institutions. Gross loans in Investment Banking
increased 14% to CHF 61.8 billion, primarily due to the appre-
ciation of the US dollar against the Swiss franc.
As of the end of 3Q08, gross impaired loans were CHF
1.9 billion, an increase of 10% from the end of 2Q08, with an
increase of CHF 53 million in Private Banking and an increase
of CHF 118 million in Investment Banking. In Private Banking,
coverage of gross impaired loans by valuation allowances
decreased by 3 percentage points to 60%. In Investment
Banking, the coverage of gross impaired loans by valuation
allowances is of limited relevance, as a large portion of the
loan portfolio is carried at fair value rather than held for invest-
ment, which is accounted for on an accrual basis.
We recorded a net provision for credit losses of CHF 131
million in 3Q08 compared to CHF 45 million in 2Q08. The
provision in 3Q08 was primarily due to a further provision on a
guarantee provided in a prior year to a third-party bank in
Investment Banking and the increase in impaired loans.
Compared to 3Q07, gross loans increased CHF 21.7 bil-
lion, or 10%, reflecting growth in both Investment Banking
and Private Banking. Gross loans in Private Banking increased
8% to CHF 188.0 billion across most businesses. In Invest-
ment Banking, gross loans increased 16% to CHF 61.9 bil-
lion, due to increases in commercial and industrial loans, loans
to financial institutions and loans to governments and public
institutions. Gross impaired loans increased 8%, driven by an
increase in non-performing loans in Investment Banking, par-
tially offset by reductions of non-interest-earning loans in Pri-
vate Banking and potential problem loans in Investment Bank-
ing.

V69 Report of the Independent
Registered Public Accounting Firm
71 Condensed consolidated financial
statements – unaudited
77 Notes to the condensed
consolidated financial statements –
unaudited (refer to the following page for a detailed list)
Condensedconsolidated financial statements –unaudited
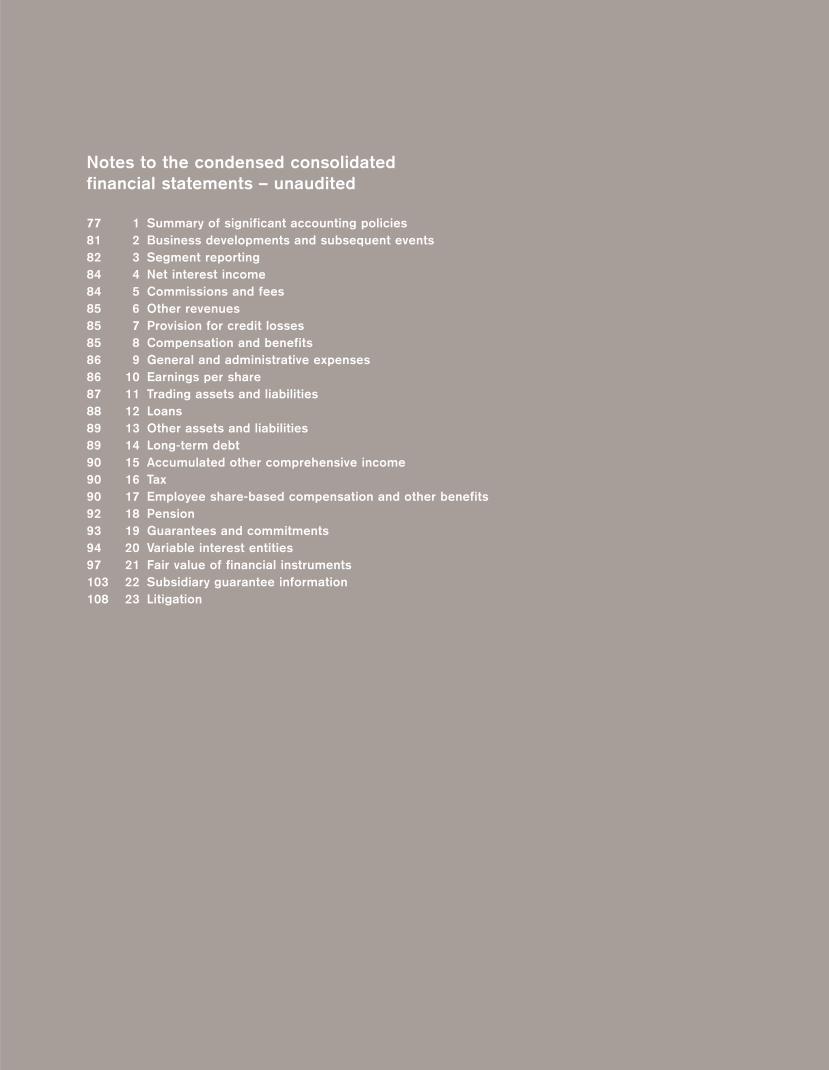
Notes to the condensed consolidated
financial statements – unaudited
77 1 Summary of significant accounting policies
81 2 Business developments and subsequent events
82 3 Segment reporting
84 4 Net interest income
84 5 Commissions and fees
85 6 Other revenues
85 7 Provision for credit losses
85 8 Compensation and benefits
86 9 General and administrative expenses
86 10 Earnings per share
87 11 Trading assets and liabilities
88 12 Loans
89 13 Other assets and liabilities
89 14 Long-term debt
90 15 Accumulated other comprehensive income
90 16 Tax
90 17 Employee share-based compensation and other benefits
92 18 Pension
93 19 Guarantees and commitments
94 20 Variable interest entities
97 21 Fair value of financial instruments
103 22 Subsidiary guarantee information
108 23 Litigation
Condensed consolidated financial statements – unaudited 69

70
[THIS PAGE INTENTIONALLY LEFT BLANK]
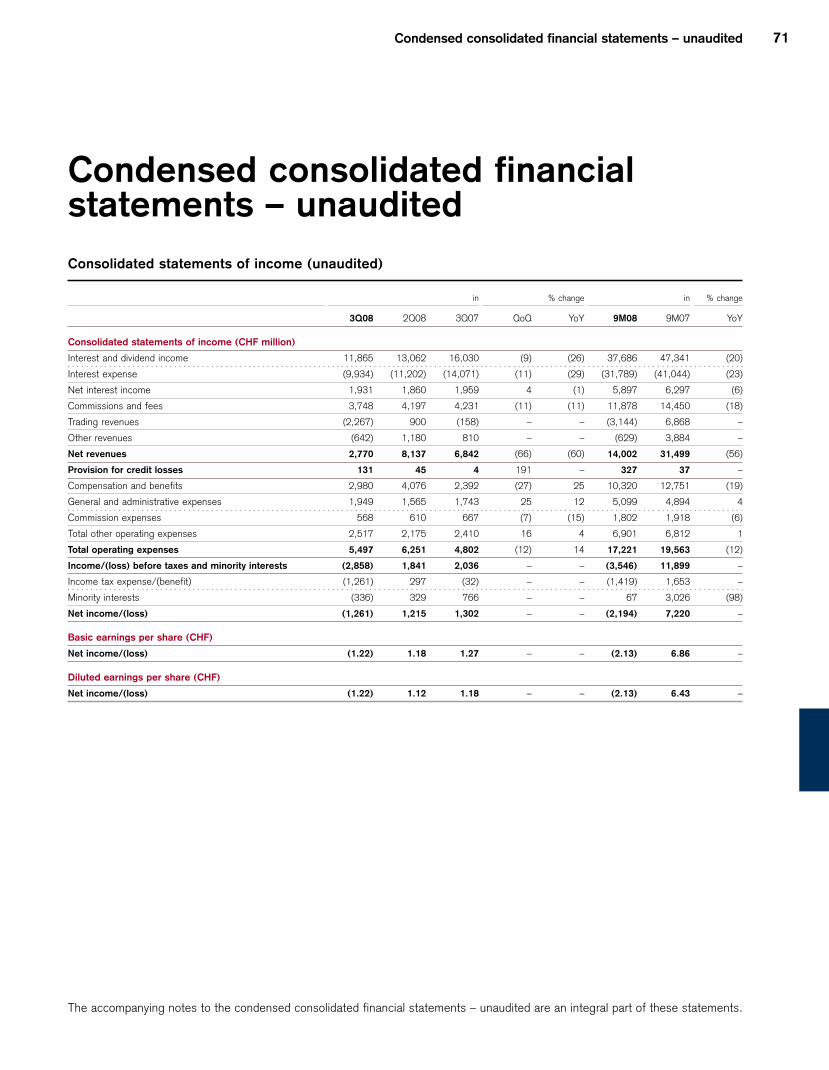
Condensed consolidated financial statements – unaudited 71
The accompanying notes to the condensed consolidated financial statements – unaudited are an integral part of these statements.
Condensed consolidated financialstatements – unaudited
Consolidated statements of income (unaudited)
in % change in % change
3Q08 2Q08 3Q07 QoQ YoY 9M08 9M07 YoY
Consolidated statements of income (CHF million)
Interest and dividend income 11,865 13,062 16,030 (9) (26) 37,686 47,341 (20)
Interest expense (9,934) (11,202) (14,071) (11) (29) (31,789) (41,044) (23)
Net interest income 1,931 1,860 1,959 4 (1) 5,897 6,297 (6)
Commissions and fees 3,748 4,197 4,231 (11) (11) 11,878 14,450 (18)
Trading revenues (2,267) 900 (158) – – (3,144) 6,868 –
Other revenues (642) 1,180 810 – – (629) 3,884 –
Net revenues 2,770 8,137 6,842 (66) (60) 14,002 31,499 (56)
Provision for credit losses 131 45 4 191 – 327 37 –
Compensation and benefits 2,980 4,076 2,392 (27) 25 10,320 12,751 (19)
General and administrative expenses 1,949 1,565 1,743 25 12 5,099 4,894 4
Commission expenses 568 610 667 (7) (15) 1,802 1,918 (6)
Total other operating expenses 2,517 2,175 2,410 16 4 6,901 6,812 1
Total operating expenses 5,497 6,251 4,802 (12) 14 17,221 19,563 (12)
Income/(loss) before taxes and minority interests (2,858) 1,841 2,036 – – (3,546) 11,899 –
Income tax expense/(benefit) (1,261) 297 (32) – – (1,419) 1,653 –
Minority interests (336) 329 766 – – 67 3,026 (98)
Net income/(loss) (1,261) 1,215 1,302 – – (2,194) 7,220 –
Basic earnings per share (CHF)
Net income/(loss) (1.22) 1.18 1.27 – – (2.13) 6.86 –
Diluted earnings per share (CHF)
Net income/(loss) (1.22) 1.12 1.18 – – (2.13) 6.43 –
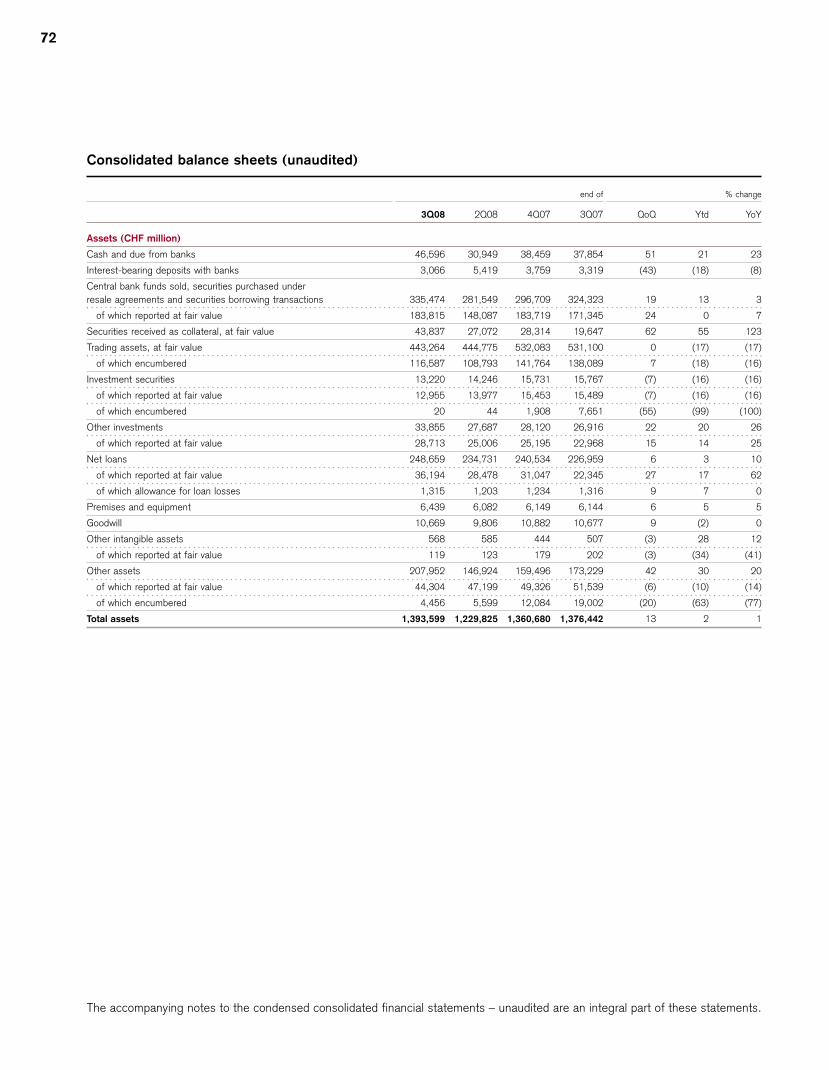
72
Consolidated balance sheets (unaudited)
end of % change
3Q08 2Q08 4Q07 3Q07 QoQ Ytd YoY
Assets (CHF million)
Cash and due from banks 46,596 30,949 38,459 37,854 51 21 23
Interest-bearing deposits with banks 3,066 5,419 3,759 3,319 (43) (18) (8)
Central bank funds sold, securities purchased under
resale agreements and securities borrowing transactions 335,474 281,549 296,709 324,323 19 13 3
of which reported at fair value 183,815 148,087 183,719 171,345 24 0 7
Securities received as collateral, at fair value 43,837 27,072 28,314 19,647 62 55 123
Trading assets, at fair value 443,264 444,775 532,083 531,100 0 (17) (17)
of which encumbered 116,587 108,793 141,764 138,089 7 (18) (16)
Investment securities 13,220 14,246 15,731 15,767 (7) (16) (16)
of which reported at fair value 12,955 13,977 15,453 15,489 (7) (16) (16)
of which encumbered 20 44 1,908 7,651 (55) (99) (100)
Other investments 33,855 27,687 28,120 26,916 22 20 26
of which reported at fair value 28,713 25,006 25,195 22,968 15 14 25
Net loans 248,659 234,731 240,534 226,959 6 3 10
of which reported at fair value 36,194 28,478 31,047 22,345 27 17 62
of which allowance for loan losses 1,315 1,203 1,234 1,316 9 7 0
Premises and equipment 6,439 6,082 6,149 6,144 6 5 5
Goodwill 10,669 9,806 10,882 10,677 9 (2) 0
Other intangible assets 568 585 444 507 (3) 28 12
of which reported at fair value 119 123 179 202 (3) (34) (41)
Other assets 207,952 146,924 159,496 173,229 42 30 20
of which reported at fair value 44,304 47,199 49,326 51,539 (6) (10) (14)
of which encumbered 4,456 5,599 12,084 19,002 (20) (63) (77)
Total assets 1,393,599 1,229,825 1,360,680 1,376,442 13 2 1
The accompanying notes to the condensed consolidated financial statements – unaudited are an integral part of these statements.
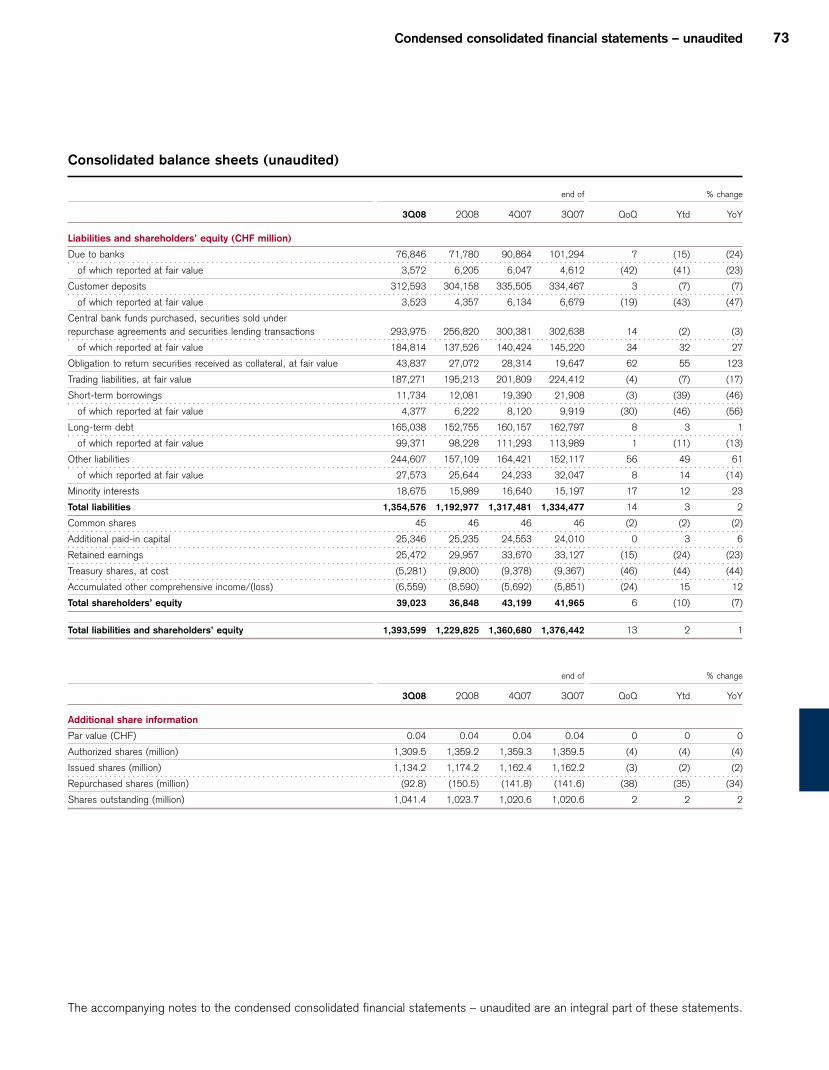
Condensed consolidated financial statements – unaudited 73
Consolidated balance sheets (unaudited)
end of % change
3Q08 2Q08 4Q07 3Q07 QoQ Ytd YoY
Liabilities and shareholders’ equity (CHF million)
Due to banks 76,846 71,780 90,864 101,294 7 (15) (24)
of which reported at fair value 3,572 6,205 6,047 4,612 (42) (41) (23)
Customer deposits 312,593 304,158 335,505 334,467 3 (7) (7)
of which reported at fair value 3,523 4,357 6,134 6,679 (19) (43) (47)
Central bank funds purchased, securities sold under
repurchase agreements and securities lending transactions 293,975 256,820 300,381 302,638 14 (2) (3)
of which reported at fair value 184,814 137,526 140,424 145,220 34 32 27
Obligation to return securities received as collateral, at fair value 43,837 27,072 28,314 19,647 62 55 123
Trading liabilities, at fair value 187,271 195,213 201,809 224,412 (4) (7) (17)
Short-term borrowings 11,734 12,081 19,390 21,908 (3) (39) (46)
of which reported at fair value 4,377 6,222 8,120 9,919 (30) (46) (56)
Long-term debt 165,038 152,755 160,157 162,797 8 3 1
of which reported at fair value 99,371 98,228 111,293 113,989 1 (11) (13)
Other liabilities 244,607 157,109 164,421 152,117 56 49 61
of which reported at fair value 27,573 25,644 24,233 32,047 8 14 (14)
Minority interests 18,675 15,989 16,640 15,197 17 12 23
Total liabilities 1,354,576 1,192,977 1,317,481 1,334,477 14 3 2
Common shares 45 46 46 46 (2) (2) (2)
Additional paid-in capital 25,346 25,235 24,553 24,010 0 3 6
Retained earnings 25,472 29,957 33,670 33,127 (15) (24) (23)
Treasury shares, at cost (5,281) (9,800) (9,378) (9,367) (46) (44) (44)
Accumulated other comprehensive income/(loss) (6,559) (8,590) (5,692) (5,851) (24) 15 12
Total shareholders’ equity 39,023 36,848 43,199 41,965 6 (10) (7)
Total liabilities and shareholders’ equity 1,393,599 1,229,825 1,360,680 1,376,442 13 2 1
end of % change
3Q08 2Q08 4Q07 3Q07 QoQ Ytd YoY
Additional share information
Par value (CHF) 0.04 0.04 0.04 0.04 0 0 0
Authorized shares (million) 1,309.5 1,359.2 1,359.3 1,359.5 (4) (4) (4)
Issued shares (million) 1,134.2 1,174.2 1,162.4 1,162.2 (3) (2) (2)
Repurchased shares (million) (92.8) (150.5) (141.8) (141.6) (38) (35) (34)
Shares outstanding (million) 1,041.4 1,023.7 1,020.6 1,020.6 2 2 2
The accompanying notes to the condensed consolidated financial statements – unaudited are an integral part of these statements.

74
Consolidated statements of changes in shareholders’ equity (unaudited)
Accumu-
lated
other
compre- Total Number of
Additional Treasury hensive share- common
Common paid-in Retained shares, income/ holders’ shares
shares capital earnings at cost (loss) equity outstanding
9M08 (CHF million)
Balance at beginning of period 46 24,553 33,670 (9,378) (5,692) 43,199 1,020,627,855 1
Net income/(loss) – – (2,194) – – (2,194) –
Other comprehensive income/(loss), net of tax – – – – (867) (867) –
Issuance of common shares 1 1,115 – – – 1,116 21,426,758
Cancellation of repurchased shares (2) (884) (3,237) 4,123 – 0 –
Issuance of treasury shares – (43) – 19,048 – 19,005 361,550,704
Repurchase of treasury shares – – – (19,274) – (19,274) (365,507,344) 2
Share-based compensation, net of tax – 751 – 200 – 951 3,305,078
Derivatives indexed to own shares 3 – (146) – – – (146) –
Cash dividends paid – – (2,767) – – (2,767) –
Balance at end of period 45 25,346 25,472 (5,281) (6,559) 39,023 1,041,403,051 4
9M07 (CHF million)
Balance at beginning of period 607 24,817 32,306 (9,111) (5,033) 43,586 1,062,467,061
Net income – – 7,220 – – 7,220 –
Cumulative effect of accounting changes, net of tax – – (829) – 10 (819) –
Other comprehensive income/(loss), net of tax – – – – (828) (828) –
Issuance of common shares 1 50 – – – 51 1,165,955
Cancellation of repurchased shares (27) (945) (3,087) 4,059 – 0 –
Issuance of treasury shares – 8 – 28,238 – 28,246 329,897,136
Repurchase of treasury shares – – – (33,778) – (33,778) (394,118,177)
Share-based compensation, net of tax – 307 – 1,225 – 1,532 21,190,639
Derivatives indexed to own shares – (263) – – – (263) –
Repayment out of share capital (535) 36 – – – (499) –
Cash dividends paid – – (2,483) – – (2,483) –
Balance at end of period 46 24,010 33,127 (9,367) (5,851) 41,965 1,020,602,614
1 At par value CHF 0.04 each, fully paid, net of 141,834,285 treasury shares. In addition to the treasury shares, a maximum of 196,835,440 unissued shares (conditional and authorized
capital) were available for issuance without further approval of the shareholders. 2 Includes 3,595,000 shares repurchased in connection with Credit Suisse Group’s share buyback
programs. 3 The Group has purchased certain call options on its own shares to economically hedge all or a portion of the leverage element of the Incentive Share Units granted to the
employees during 9M08. In accordance with EITF 00-19, these call options are designated as equity instruments and, as such, are initially recognized in shareholders’ equity at their fair
values and not subsequently remeasured. 4 At par value CHF 0.04 each, fully paid, net of 92,785,847 treasury shares. 49,700,000 treasury shares which were approved for
cancellation at the Annual General Meeting on April 25, 2008, were cancelled in 3Q08. In addition to the treasury shares, a maximum of 175,337,882 unissued shares (conditional and
authorized capital) were available for issuance without further approval of the shareholders.
The accompanying notes to the condensed consolidated financial statements – unaudited are an integral part of these statements.
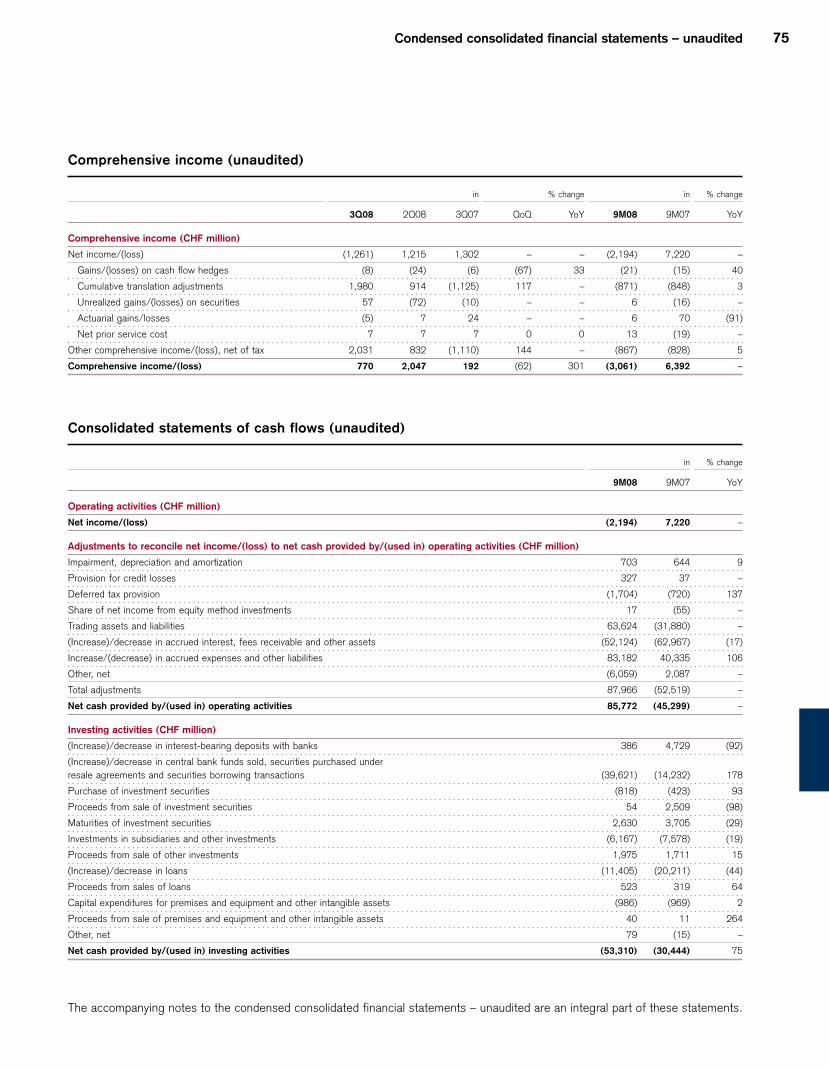
Condensed consolidated financial statements – unaudited 75
Comprehensive income (unaudited)
in % change in % change
3Q08 2Q08 3Q07 QoQ YoY 9M08 9M07 YoY
Comprehensive income (CHF million)
Net income/(loss) (1,261) 1,215 1,302 – – (2,194) 7,220 –
Gains/(losses) on cash flow hedges (8) (24) (6) (67) 33 (21) (15) 40
Cumulative translation adjustments 1,980 914 (1,125) 117 – (871) (848) 3
Unrealized gains/(losses) on securities 57 (72) (10) – – 6 (16) –
Actuarial gains/losses (5) 7 24 – – 6 70 (91)
Net prior service cost 7 7 7 0 0 13 (19) –
Other comprehensive income/(loss), net of tax 2,031 832 (1,110) 144 – (867) (828) 5
Comprehensive income/(loss) 770 2,047 192 (62) 301 (3,061) 6,392 –
Consolidated statements of cash flows (unaudited)
in % change
9M08 9M07 YoY
Operating activities (CHF million)
Net income/(loss) (2,194) 7,220 –
Adjustments to reconcile net income/(loss) to net cash provided by/(used in) operating activities (CHF million)
Impairment, depreciation and amortization 703 644 9
Provision for credit losses 327 37 –
Deferred tax provision (1,704) (720) 137
Share of net income from equity method investments 17 (55) –
Trading assets and liabilities 63,624 (31,880) –
(Increase)/decrease in accrued interest, fees receivable and other assets (52,124) (62,967) (17)
Increase/(decrease) in accrued expenses and other liabilities 83,182 40,335 106
Other, net (6,059) 2,087 –
Total adjustments 87,966 (52,519) –
Net cash provided by/(used in) operating activities 85,772 (45,299) –
Investing activities (CHF million)
(Increase)/decrease in interest-bearing deposits with banks 386 4,729 (92)
(Increase)/decrease in central bank funds sold, securities purchased under
resale agreements and securities borrowing transactions (39,621) (14,232) 178
Purchase of investment securities (818) (423) 93
Proceeds from sale of investment securities 54 2,509 (98)
Maturities of investment securities 2,630 3,705 (29)
Investments in subsidiaries and other investments (6,167) (7,578) (19)
Proceeds from sale of other investments 1,975 1,711 15
(Increase)/decrease in loans (11,405) (20,211) (44)
Proceeds from sales of loans 523 319 64
Capital expenditures for premises and equipment and other intangible assets (986) (969) 2
Proceeds from sale of premises and equipment and other intangible assets 40 11 264
Other, net 79 (15) –
Net cash provided by/(used in) investing activities (53,310) (30,444) 75
The accompanying notes to the condensed consolidated financial statements – unaudited are an integral part of these statements.
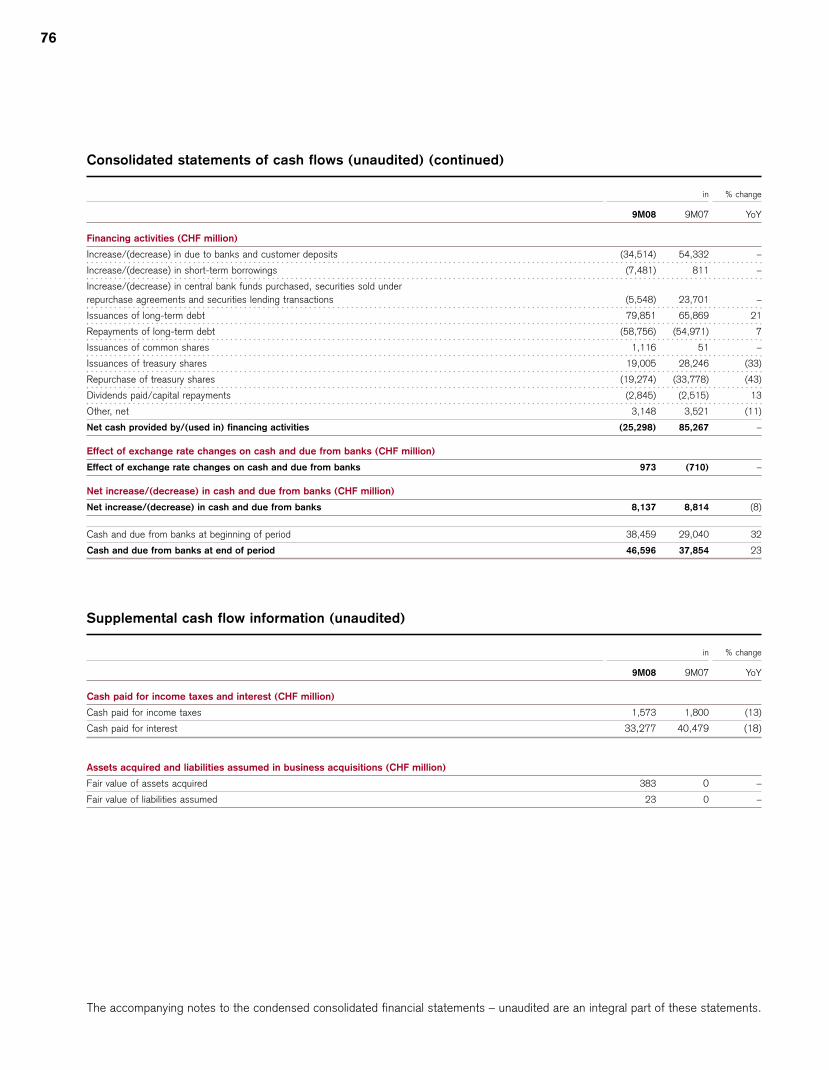
76
Consolidated statements of cash flows (unaudited) (continued)
in % change
9M08 9M07 YoY
Financing activities (CHF million)
Increase/(decrease) in due to banks and customer deposits (34,514) 54,332 –
Increase/(decrease) in short-term borrowings (7,481) 811 –
Increase/(decrease) in central bank funds purchased, securities sold under
repurchase agreements and securities lending transactions (5,548) 23,701 –
Issuances of long-term debt 79,851 65,869 21
Repayments of long-term debt (58,756) (54,971) 7
Issuances of common shares 1,116 51 –
Issuances of treasury shares 19,005 28,246 (33)
Repurchase of treasury shares (19,274) (33,778) (43)
Dividends paid/capital repayments (2,845) (2,515) 13
Other, net 3,148 3,521 (11)
Net cash provided by/(used in) financing activities (25,298) 85,267 –
Effect of exchange rate changes on cash and due from banks (CHF million)
Effect of exchange rate changes on cash and due from banks 973 (710) –
Net increase/(decrease) in cash and due from banks (CHF million)
Net increase/(decrease) in cash and due from banks 8,137 8,814 (8)
Cash and due from banks at beginning of period 38,459 29,040 32
Cash and due from banks at end of period 46,596 37,854 23
Supplemental cash flow information (unaudited)
in % change
9M08 9M07 YoY
Cash paid for income taxes and interest (CHF million)
Cash paid for income taxes 1,573 1,800 (13)
Cash paid for interest 33,277 40,479 (18)
Assets acquired and liabilities assumed in business acquisitions (CHF million)
Fair value of assets acquired 383 0 –
Fair value of liabilities assumed 23 0 –
The accompanying notes to the condensed consolidated financial statements – unaudited are an integral part of these statements.
Condensed consolidated financial statements – unaudited 77
Notes to the condensed consolidated financial statements – unaudited
Note 1 Summary of significant accounting policies
Basis of presentation
The accompanying unaudited condensed consolidated finan-
cial statements of Credit Suisse Group AG (the Group) are
prepared in accordance with accounting principles generally
accepted in the United States of America (US GAAP) and are
stated in Swiss francs (CHF). These condensed consolidated
financial statements should be read in conjunction with the US
GAAP consolidated financial statements and notes thereto for
the year ended December 31, 2007, included in the Credit
Suisse Annual Report 2007. For a description of the Group’s
significant accounting policies, refer to Note 1 – Summary of
significant accounting policies in V – Consolidated financial
statements – Credit Suisse Group in the Credit Suisse Annual
Report 2007.
Certain financial information, which is normally included in
annual consolidated financial statements prepared in accor-
dance with US GAAP but not required for interim reporting
purposes, has been condensed or omitted. Certain reclassifi-
cations have been made to the prior period’s consolidated
financial statements to conform to the current period’s presen-
tation. These condensed consolidated financial statements
reflect, in the opinion of management, all adjustments that are
necessary for a fair presentation of the condensed consoli-
dated financial statements for the periods presented. The
presentation of period over period change, the 2Q08 consoli-
dated statements of income and consolidated balance sheet
and the 3Q07 consolidated balance sheet have been added
for convenience of the reader and are not a required presenta-
tion under US GAAP. The results of operations for interim peri-
ods are not indicative of results for the entire year.
In preparing these condensed consolidated financial state-
ments, management is required to make estimates and
assumptions, which affect the reported amounts of assets and
liabilities and disclosure of contingent assets and liabilities as
of the date of the condensed consolidated balance sheets and
the reported amounts of revenues and expenses during the
reporting period. Actual results could differ from those esti-
mates.
Recently adopted accounting standards
The following provides the most relevant recently adopted
accounting standards. For a complete description of recently
adopted accounting standards, refer to Note 2 – Recently
issued accounting standards in V – Consolidated financial
statements – Credit Suisse Group in the Credit Suisse Annual
Report 2007.
FSP FAS 157-3
In October 2008, the Financial Accounting Standards Board
(FASB) issued FASB Staff Position (FSP) No. FAS 157-3,
“Determining the Fair Value of a Financial Asset When the
Market for That Asset Is Not Active” (FSP FAS 157-3). FSP
FAS 157-3 clarifies the application of Statement of Financial
Accounting Standards (SFAS) No. 157, “Fair Value Measure-
ments” (SFAS 157) in a market that is not active and provides
an example to illustrate key considerations in determining the
fair value of a financial asset when the market for that financial
asset is not active.
FSP FAS 157-3 is effective upon issuance, including prior
periods for which financial statements have not been issued.
The adoption of FSP FAS 157-3 did not have a material
impact on the Group’s financial condition, results of operations
or cash flows.
SAB 110
In December 2007, the United States (US) Securities and
Exchange Commission (SEC) issued Staff Accounting Bulletin
(SAB) No. 110, “Share-Based Payment” (SAB 110). SAB
110 expresses the view of the staff regarding the use of a
simplified method, as discussed in SAB No. 107, “Share-
Based Payment” (SAB 107), in developing an estimate of the
expected term of ‘plain vanilla’ share options in accordance
with SFAS No. 123 (revised 2004), “Share Based Payment.”
When SAB 107 was issued, the staff indicated that it would
not expect a company to use the simplified method for share
option grants after December 31, 2007. As the staff now
understands that detailed information about employee exercise
behavior may not be widely available by December 31, 2007,
the staff will continue to accept, under certain circumstances,
the use of the simplified method beyond December 31, 2007.

78
The Group adopted SAB 110 on January 1, 2008. The
adoption of SAB 110 did not have a material impact on the
Group’s financial condition, results of operations or cash flows.
SAB 109
In November 2007, the SEC issued SAB No. 109, “Written
Loan Commitments Recorded at Fair Value Through Earnings”
(SAB 109). SAB 109 provides guidance that the expected net
future cash flows related to the associated servicing of the
loan should be included in the measurement of all written loan
commitments that are accounted at fair value through earn-
ings.
SAB 109 retains the view that internally-developed intangi-
ble assets should not be recorded as part of the fair value of a
derivative loan commitment and broadens this view to all writ-
ten loan commitments that are accounted for at fair value
through earnings.
The Group adopted SAB 109 on January 1, 2008. The
adoption of SAB 109 did not have a material impact on the
Group’s financial condition, results of operations or cash flows.
EITF 06-11
In June 2007, the FASB ratified Emerging Issues Task Force
(EITF) Issue No. 06-11, “Accounting for Income Tax Benefits
of Dividends on Share-Based Payment Awards” (EITF 06-11).
EITF 06-11 addresses share-based payment arrangements
where employees receive dividends on awards during the vest-
ing period. EITF 06-11 confirmed that a realized income tax
benefit from dividends or dividend equivalents that are charged
to retained earnings and are paid to employees for equity clas-
sified non-vested equity shares, non-vested equity share units
and outstanding equity share options should be recognized as
an increase to additional paid-in capital. The amount recog-
nized in additional paid-in capital for the realized income tax
benefit from dividends in those awards should be included in
the pool of excess tax benefits available to absorb tax defi-
ciencies on share-based payment awards.
EITF 06-11 is effective prospectively to income tax bene-
fits that result from dividends on equity classified employee
share-based payment awards that are declared in fiscal years
beginning after December 15, 2007. Early application was
permitted for the income tax benefits of dividends on equity-
classified share-based payment awards that are declared in
periods for which financial statements have not yet been
issued. The Group early adopted EITF 06-11 for the account-
ing period ended December 31, 2007 and recognized CHF 13
million of tax benefits in respect of tax on dividend equivalent
payments.
FSP FIN 39-1
In April 2007, the FASB issued FSP No. FASB Interpretation
(FIN) 39-1, “Amendment of FASB Interpretation No. 39” (FSP
FIN 39-1). FSP FIN 39-1 permits a reporting entity that is a
party to a master netting agreement to offset fair value
amounts recognized for the right to reclaim cash collateral or
the obligation to return cash collateral against fair value
amounts recognized for derivative instruments that have been
offset under the same master netting agreement. FSP FIN
39-1 is required to be applied retrospectively for all financial
statements presented unless it is impracticable to do so. As
part of the Group’s implementation procedures for adopting
FSP FIN 39-1, it was determined that adopting FSP FIN 39-
1 retrospectively is impracticable as it would require undue
time and effort. Based on this, the Group adopted the provi-
sions of FSP FIN 39-1 on a prospective basis. For further
information on the impact of offsetting cash collateral against
derivative instruments, refer to Note 11 – Trading assets and
liabilities.
SFAS 159
In February 2007, the FASB issued SFAS No. 159, “The Fair
Value Option for Financial Assets and Financial Liabilities –
Including an amendment of FASB Statement No. 115” (SFAS
159). SFAS 159 creates an alternative measurement treat-
ment for certain financial assets and financial liabilities that
permits fair value to be used for initial and subsequent meas-
urement with changes in fair value recognized in earnings. The
availability of this alternative measurement treatment is
referred to as the fair value option. The statement also pro-
vides for additional financial statement presentation and dis-
closures relating to the alternative measurement treatment.
The Group adopted the provisions of SFAS 159 on January 1,
2007. As a result of adoption and election of certain existing
instruments under the fair value option, the Group reported a
decrease in opening retained earnings of CHF 1,003 million,
net of tax. For further information on fair values, refer to Note
21 – Fair value of financial instruments.
SFAS 157
In September 2006, the FASB issued SFAS 157. SFAS 157
establishes a single authoritative definition of fair value, sets
out a framework for measuring fair value, and requires addi-
tional disclosures for instruments carried at fair value. The
statement applies only to fair value measurements which are
already required or permitted by other accounting standards. It
eliminates the EITF Issue No. 02-3 “Issues Involved in
Accounting for Derivative Contracts Held for Trading Purposes
and Contracts Involved in Energy Trading and Risk Manage-
ment Activities” (EITF 02-3) guidance which prohibits the
Condensed consolidated financial statements – unaudited 79
recognition of gains or losses at the inception of derivative
transactions whose fair value is estimated based upon unob-
servable market data. SFAS 157 also eliminates the use of
blockage factors on instruments that are quoted in active mar-
kets by brokers, dealers and investment companies that have
been applying the applicable American Institute of Certified
Public Accountants (AICPA) Audit and Accounting Guides.
SFAS 157 also requires the Group to consider its own credit
spreads when measuring the fair value of liabilities. The Group
adopted the provisions of SFAS 157 on January 1, 2007. As
a result of this adoption, the Group reported an increase in
opening retained earnings of CHF 187 million, net of tax. For
further information on fair values, refer to Note 21 – Fair value
of financial instruments.
SFAS 158
In September 2006, the FASB issued SFAS No. 158,
“Employers’ Accounting for Defined Benefit Pension and
Other Postretirement Plans – an amendment of FASB State-
ments No. 87, 88, 106 and 132(R)” (SFAS 158). SFAS 158
requires an employer to:
(i) recognize in the statement of financial condition the
funded status of a defined benefit plan on a prospective
basis;
(ii) recognize as a component of other comprehensive
income, net of tax, the actuarial gains or losses and prior
service costs or credits that arise during the period but are
not recognized as components of net periodic benefit cost
pursuant to SFAS No. 87, “Employers’ Accounting for
Pensions” (SFAS 87) or No. 106, “Employers’ Accounting
for Postretirement Benefits Other than Pensions” (SFAS
106). Amounts recognized in accumulated other compre-
hensive income (AOCI), including gains or losses, prior
service costs or credits and transition assets or obligations
remaining from the initial application of SFAS 87 and
SFAS 106, are to be adjusted as they are subsequently
recognized as a component of net periodic benefit cost;
(iii) measure the defined benefit plan assets and obligations as
of the date of the employer’s fiscal year-end statement of
financial condition; and
(iv) disclose in the notes to the financial statements additional
information about certain effects on net periodic benefit
cost for the next fiscal year that arise from delayed recog-
nition of the gains or losses, prior service costs or credits
and transition asset or obligation.
SFAS 158 recognition provisions associated with the funded
status of a defined benefit plan was effective as of the end of
the fiscal year ending after December 15, 2006. The provision
to measure plan assets and benefit obligations as of the date
of the employer’s fiscal year-end statement of financial condi-
tion is effective for fiscal years ending after December 15,
2008, with early adoption permitted.
The cumulative effect of the Group adopting the recogni-
tion provisions of SFAS 158 as of December 31, 2006, was
an after-tax decrease in AOCI and consolidated net assets of
CHF 1.8 billion. The Group did not early adopt the measure-
ment date provisions and is evaluating the impact of those pro-
visions for adoption in 2008.
FIN 48
In July 2006, the FASB issued FIN No. 48, “Accounting for
Uncertainty in Income Taxes – an interpretation of FASB
Statement No. 109” (FIN 48). FIN 48 addresses the account-
ing for uncertainty in income tax positions by prescribing a
consistent recognition threshold and measurement attribute
for income tax positions taken or expected to be taken in an
income tax return. FIN 48 also provides guidance on derecog-
nition, classification, interest and penalties, accounting in
interim periods, disclosure and transition.
FIN 48 requires a two-step process in evaluating income
tax positions. In the first step, an enterprise determines
whether it is more likely than not that an income tax position
will be sustained upon examination, including resolution of any
related appeals or litigation processes, based on the technical
merits of the position. Income tax positions meeting the more-
likely-than-not recognition threshold are then measured to
determine the amount of benefit eligible for recognition in the
financial statements. Each income tax position is measured at
the largest amount of benefit that is more likely than not to be
realized upon ultimate settlement.
The provisions of FIN 48 are effective for fiscal years
beginning after December 15, 2006. The adoption of FIN 48
as of January 1, 2007, resulted in a decrease in beginning
retained earnings of CHF 13 million. For further information on
uncertainty in income tax positions, refer to Note 16 – Tax.
Standards to be adopted in future periods
SFAS 141(R)
In December 2007, the FASB issued SFAS No. 141 (Revised
2007), “Business Combinations” (SFAS 141(R)). SFAS
141(R) requires an acquiring entity to recognize all assets
acquired, liabilities assumed and any noncontrolling interest in
the acquiree at the acquisition date, at their fair values as of
that date.
SFAS 141(R) also requires substantial new disclosures
and will change the accounting treatment for the recognition
of acquisition costs, restructuring costs and in-process
80
research and development as well as the recognition and sub-
sequent measurement of acquired contingent liabilities.
The guidance in SFAS 141(R) is effective on a prospective
basis for business combinations in which the acquisition date
is on or after the first annual reporting period beginning on or
after December 15, 2008 with the exception for income taxes.
The new accounting treatment for income taxes is applicable
to business combinations consummated prior to the effective
date of SFAS 141(R). The Group is currently evaluating the
impact of adopting SFAS 141(R).
SFAS 160
In December 2007, the FASB issued SFAS No. 160, “Non-
controlling Interests in Consolidated Financial Statements – an
amendment of ARB No. 51” (SFAS 160). SFAS 160 amends
Accounting Research Bulletin (ARB) No. 51 to establish
accounting and reporting standards for a noncontrolling inter-
est in a subsidiary and for deconsolidation of a subsidiary.
SFAS 160 requires the recognition of a noncontrolling
interest as equity in the consolidated financial statements and
separate from the parent’s equity. In addition, net income
attributable to the noncontrolling interest must be included in
consolidated net income on the face of the income statement.
SFAS 160 clarifies that changes in a parent’s ownership inter-
est in a subsidiary that do not result in deconsolidation are
equity transactions if the parent retains its controlling financial
interest. SFAS 160 has additional disclosure requirements
that clearly identify and distinguish between the interests of
the parent and the interests of the noncontrolling owners.
SFAS 160 is effective for fiscal years, and interim periods
within those fiscal years, beginning on or after December 15,
2008. The Group is currently evaluating the impact of adopt-
ing SFAS 160.
FSP FAS 140-3
In February 2008, the FASB issued FSP No. FAS 140-3,
“Accounting for Transfers of Financial Assets and Repurchase
Financing Transactions” (FSP FAS 140-3). FSP FAS 140-3
applies to a repurchasing financing, which is a repurchase
agreement that relates to a previously transferred financial
asset between the same counterparties that is entered into
contemporaneously with, or in contemplation of, the initial
transfer. FSP FAS 140-3 states that a transferor and trans-
feree shall not separately account for a transfer of a financial
asset and a related repurchase financing unless the two trans-
actions have a valid and distinct business or economic purpose
for being entered into separately and the repurchase financing
does not result in the initial transferor regaining control over
the financial asset. FSP FAS 140-3 establishes a presumption
that an initial transfer and a repurchase financing are linked
unless certain criteria are met. If the criteria are not met, the
initial transfer is not accounted for as a sale by the transferor
and the repurchase financing is accounted for as a forward
contract.
FSP FAS 140-3 is effective for prospective transactions
entered into in fiscal years and interim periods within those fis-
cal years, beginning after November 15, 2008. Earlier appli-
cation is not permitted. The Group is currently evaluating the
impact of adopting FSP FAS 140-3.
SFAS 161
In March 2008, the FASB issued SFAS No. 161, “Disclosures
about Derivative Instruments and Hedging Activities – an
amendment of FASB Statement No. 133” (SFAS 161). SFAS
161 amends and expands the disclosure requirements of
SFAS No. 133, “Accounting for Derivative Instruments and
Hedging Activities” (SFAS 133), with the intent to provide
users of financial statements with an enhanced understanding
of: i) how and why an entity uses derivative instruments; ii)
how derivative instruments and related hedge items are
accounted for under SFAS 133 and its related interpretations;
and iii) how derivative instruments and related hedged items
affect an entity’s financial position, financial performance and
cash flows.
SFAS 161 requires qualitative disclosures about objectives
and strategies for using derivatives, quantitative disclosures
about fair value amounts of gains and losses on derivative
instruments and credit-risk-related contingent features in
derivative agreements.
SFAS 161 is effective for financial statements issued for
fiscal years, and interim periods within those fiscal years,
beginning after November 15, 2008. The statement encour-
ages but does not require disclosures for earlier periods pre-
sented for comparative purposes at initial adoption. In years
after initial adoption, SFAS 161 requires comparative disclo-
sures only for periods subsequent to initial adoption. SFAS
161 is a disclosure standard and as such will not impact the
Group’s financial position, results of operations or cash flows.
FSP EITF 03-6-1
In June 2008, the FASB issued FSP No. EITF 03-6-1,
“Determining Whether Instruments Granted in Share-Based
Payment Transactions Are Participating Securities” (FSP EITF
03-6-1). This FSP provides guidance that certain instruments
granted in share-based payment transactions are participating
securities prior to vesting and, therefore, need to be included
in computing earnings per share under the two class method
described in SFAS No. 128, “Earnings Per Share.”
FSP EITF 03-6-1 is effective for financial statements
issued in the fiscal years beginning after December 15, 2008,
Condensed consolidated financial statements – unaudited 81
and interim periods within those years. All prior-period earn-
ings per share data presented shall be adjusted retrospectively
to conform with the provisions of FSP EITF 03-6-1. Early
application is not permitted. The Group is currently evaluating
the impact of adopting the provisions of FSP EITF 03-6-1.
EITF 07-5
In June 2008, the FASB ratified EITF Issue No. 07-5, “Deter-
mining Whether an Instrument (or Embedded Feature) Is
Indexed to an Entity’s Own Stock” (EITF 07-5). EITF 07-5
requires an entity to evaluate whether an equity-linked finan-
cial instrument is indexed to its own stock using a two step
approach. The first step requires entities to evaluate the
instrument’s contingent exercise provisions, if any. The sec-
ond step requires entities to evaluate the instrument’s settle-
ment provisions.
EITF 07-5 is effective for financial statements issued for
fiscal years beginning after December 15, 2008, and interim
periods within those fiscal years. Earlier application is permit-
ted by entities that have previously adopted an alternative
accounting policy. The Group is currently evaluating the impact
of adopting EITF 07-5.
FSP FAS 133-1 and FIN 45-4
In September 2008, the FASB issued FSP No. FAS 133-1
and FIN 45-4, “Disclosures about Credit Derivatives and Cer-
tain Guarantees: An Amendment of FASB Statement No. 133
and FASB Interpretation No. 45; and Clarification of the
Effective Date of FASB Statement No. 161” (FSP FAS 133-1
and FIN 45-4). FSP FAS 133-1 and FIN 45-4 applies to
credit derivatives within the scope of SFAS 133, hybrid instru-
ments that have embedded credit derivatives, and guarantees
within the scope of FIN No. 45, “Guarantor’s Accounting and
Disclosure Requirements for Guarantees, Including Indirect
Guarantees of Indebtedness of Others” (FIN 45).
FSP FAS 133-1 and FIN 45-4 amends SFAS 133 to
require sellers of credit derivatives to disclose information
about credit derivatives and hybrid instruments that have
embedded credit derivatives. These disclosures include the
nature and term of the credit derivative, the maximum potential
of future payments the seller could be required to make under
the credit derivative, the fair value of the credit derivative and
the nature of any recourse provisions that would enable the
seller to recover from third parties any amounts paid under the
credit derivative.
FSP FAS 133-1 and FIN 45-4 also amends FIN 45 to
require disclosure of the status of the payment and perform-
ance risk of the guarantee.
FSP FAS 133-1 and FIN 45-4 is effective for reporting
periods ending after November 15, 2008. FSP FAS 133-1
and FIN 45-4 is a disclosure standard and as such will not
impact the Group’s financial position, results of operations or
cash flows.
Note 2 Business developments and subsequent events
Acquisitions and divestitures
In 3Q08, the Group acquired over 80% of Asset Management
Finance Corporation (AMF) for USD 384 million (CHF 423
million) of newly issued Credit Suisse Group shares. AMF pro-
vides capital to asset managers in exchange for a passive,
non-voting, limited term interest in a manager’s future rev-
enues.
There were no significant divestitures in 3Q08.
Subsequent events
On October 16, 2008, the Group announced that it had
reached an agreement with the SFBC regarding capital tar-
gets and leverage requirements. Consistent with the agreed
requirements, the Group also announced that it had raised
approximately CHF 10 billion of tier 1 capital from a small
group of investors through the sale of treasury shares, by issu-
ing new shares through mandatory convertible bonds and by
issuing non-dilutive hybrid tier 1 capital.
82
Note 3 Segment reporting
Overview
The Group is a global financial services company domiciled in
Switzerland. The Group’s business consists of three seg-
ments: Private Banking, Investment Banking and Asset Man-
agement. The three segments are complemented by Shared
Services, which provides support in the areas of finance, oper-
ations, including human resources, legal and compliance, risk
management and information technology.
The segment information reflects the Group’s reportable
segments as follows:
p Private Banking offers comprehensive advice and a broad
range of wealth management solutions, including pension
planning, life insurance products, tax planning and wealth
and inheritance advice, which are tailored to the needs of
high-net-worth individuals worldwide. In Switzerland, it
supplies banking products and services to high-net-worth,
corporate and retail clients.
p Investment Banking offers investment banking and securi-
ties products and services to corporate, institutional and
government clients around the world. Its products and
services include debt and equity underwriting, sales and
trading, mergers and acquisitions advice, divestitures, cor-
porate sales, restructuring and investment research.
p Asset Management offers integrated investment solutions
and services to institutions, governments and private
clients globally. It provides access to the full range of
investment classes, ranging from equity and fixed income
products and multi-asset class solutions to alternative
investments such as private equity, real estate and hedge
funds.
Corporate Center includes parent company operations such as
Group financing, expenses for projects sponsored by the
Group and certain expenses that have not been allocated to
the segments. In addition, Corporate Center includes consoli-
dation and elimination adjustments required to eliminate inter-
company revenues and expenses.
Minority interest-related revenues and expenses resulting
from the consolidation of certain private equity funds and other
entities in which the Group does not have a significant eco-
nomic interest in such revenues and expenses are reported as
minorities without significant economic interest. The consoli-
dation of these entities does not affect net income as the
amounts recorded in net revenues and total operating
expenses are offset by corresponding amounts reported as
minority interests. In addition, our tax expense is not affected
by these revenues and expenses.
Revenue sharing and cost allocation
Responsibility for each product is allocated to a segment,
which records all related revenues and expenses. Revenue-
sharing and service level agreements govern the compensation
received by one segment for generating revenue or providing
services on behalf of another. These agreements are negoti-
ated periodically by the relevant segments on a product-by-
product basis.
The aim of revenue-sharing and cost allocation agree-
ments is to reflect the pricing structure of unrelated third-party
transactions.
Corporate services and business support in finance, oper-
ations, including human resources, legal and compliance, risk
management and information technology are provided by the
Shared Services area. Shared Services costs are allocated to
the segments and Corporate Center based on their require-
ments and other relevant measures.
Funding
Credit Suisse centrally manages its funding activities. New
securities for funding and capital purposes are issued primarily
by the Bank. The Bank lends funds to its operating sub-
sidiaries and affiliates on both a senior and subordinated basis,
as needed, the latter typically to meet capital requirements, or
as desired by management to capitalize on opportunities. Cap-
ital is distributed to the segments considering factors such as
regulatory capital requirements, utilized economic capital and
the historic and future potential return on capital. Transfer
pricing, using market rates, is used to record interest income
and expense in each of the segments for this capital and fund-
ing. Included in this allocation are gains and losses recorded
on the fair value of Credit Suisse own debt.
Taxes
The Group’s segments are managed and reported on a pre-tax
basis.
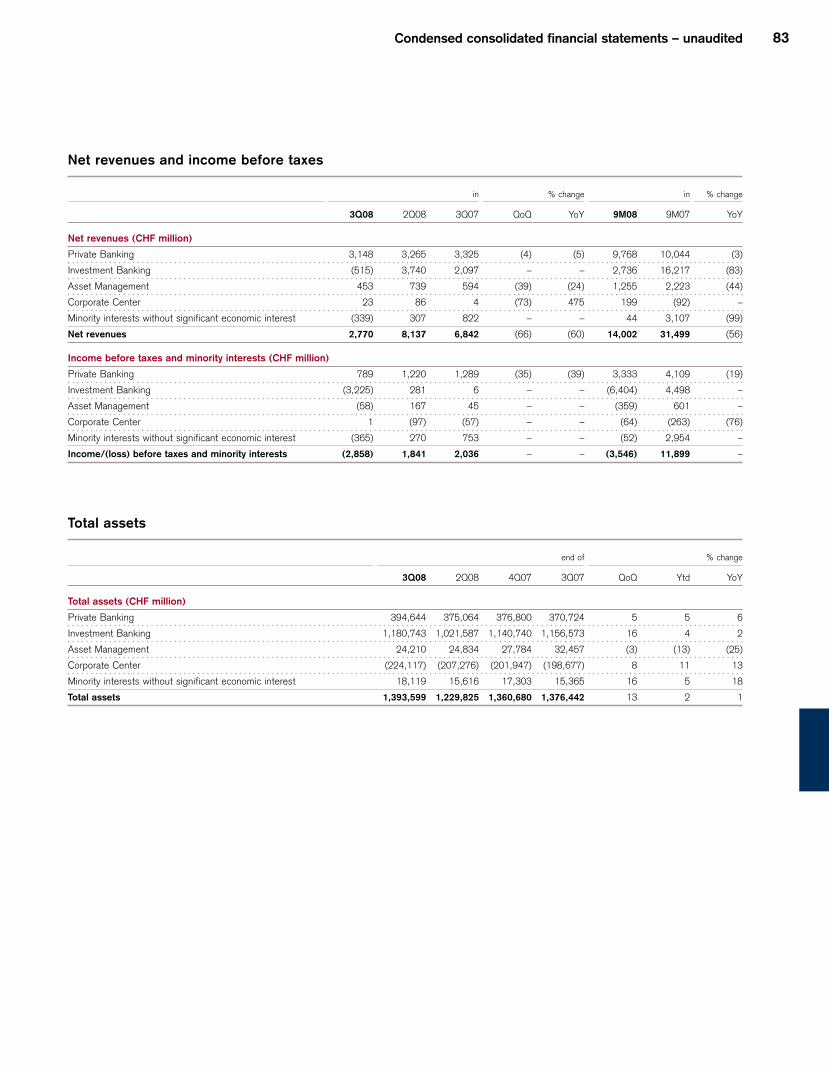
Condensed consolidated financial statements – unaudited 83
Net revenues and income before taxes
in % change in % change
3Q08 2Q08 3Q07 QoQ YoY 9M08 9M07 YoY
Net revenues (CHF million)
Private Banking 3,148 3,265 3,325 (4) (5) 9,768 10,044 (3)
Investment Banking (515) 3,740 2,097 – – 2,736 16,217 (83)
Asset Management 453 739 594 (39) (24) 1,255 2,223 (44)
Corporate Center 23 86 4 (73) 475 199 (92) –
Minority interests without significant economic interest (339) 307 822 – – 44 3,107 (99)
Net revenues 2,770 8,137 6,842 (66) (60) 14,002 31,499 (56)
Income before taxes and minority interests (CHF million)
Private Banking 789 1,220 1,289 (35) (39) 3,333 4,109 (19)
Investment Banking (3,225) 281 6 – – (6,404) 4,498 –
Asset Management (58) 167 45 – – (359) 601 –
Corporate Center 1 (97) (57) – – (64) (263) (76)
Minority interests without significant economic interest (365) 270 753 – – (52) 2,954 –
Income/(loss) before taxes and minority interests (2,858) 1,841 2,036 – – (3,546) 11,899 –
Total assets
end of % change
3Q08 2Q08 4Q07 3Q07 QoQ Ytd YoY
Total assets (CHF million)
Private Banking 394,644 375,064 376,800 370,724 5 5 6
Investment Banking 1,180,743 1,021,587 1,140,740 1,156,573 16 4 2
Asset Management 24,210 24,834 27,784 32,457 (3) (13) (25)
Corporate Center (224,117) (207,276) (201,947) (198,677) 8 11 13
Minority interests without significant economic interest 18,119 15,616 17,303 15,365 16 5 18
Total assets 1,393,599 1,229,825 1,360,680 1,376,442 13 2 1

84
Note 4 Net interest income
in % change in % change
3Q08 2Q08 3Q07 QoQ YoY 9M08 9M07 YoY
Net interest income (CHF million)
Loans 2,209 2,165 2,321 2 (5) 6,737 6,499 4
Investment securities 168 163 187 3 (10) 497 563 (12)
Trading assets 4,355 5,560 5,657 (22) (23) 14,516 17,597 (18)
Central bank funds sold, securities purchased under
resale agreements and securities borrowing transactions 3,611 3,371 5,860 7 (38) 10,905 17,105 (36)
Other 1,522 1,803 2,005 (16) (24) 5,031 5,577 (10)
Interest and dividend income 11,865 13,062 16,030 (9) (26) 37,686 47,341 (20)
Deposits (2,343) (2,477) (4,215) (5) (44) (8,073) (12,087) (33)
Short-term borrowings (99) (128) (256) (23) (61) (397) (760) (48)
Trading liabilities (1,894) (3,579) (2,069) (47) (8) (7,051) (6,856) 3
Central bank funds purchased, securities sold under
repurchase agreements and securities lending transactions (3,525) (3,249) (5,524) 8 (36) (10,686) (15,791) (32)
Long-term debt (1,340) (1,180) (1,192) 14 12 (3,523) (3,639) (3)
Other (733) (589) (815) 24 (10) (2,059) (1,911) 8
Interest expense (9,934) (11,202) (14,071) (11) (29) (31,789) (41,044) (23)
Net interest income 1,931 1,860 1,959 4 (1) 5,897 6,297 (6)
Note 5 Commissions and fees
in % change in % change
3Q08 2Q08 3Q07 QoQ YoY 9M08 9M07 YoY
Commissions and fees (CHF million)
Lending business 213 255 394 (16) (46) 694 1,702 (59)
Investment and portfolio management 1,444 1,543 1,549 (6) (7) 4,447 4,504 (1)
Other securities business 53 55 62 (4) (15) 163 179 (9)
Fiduciary 1,497 1,598 1,611 (6) (7) 4,610 4,683 (2)
Underwriting 190 471 104 (60) 83 852 1,436 (41)
Brokerage 1,227 1,222 1,441 0 (15) 3,807 4,357 (13)
Underwriting and brokerage 1,417 1,693 1,545 (16) (8) 4,659 5,793 (20)
Other customer services 621 651 681 (5) (9) 1,915 2,272 (16)
Commissions and fees 3,748 4,197 4,231 (11) (11) 11,878 14,450 (18)
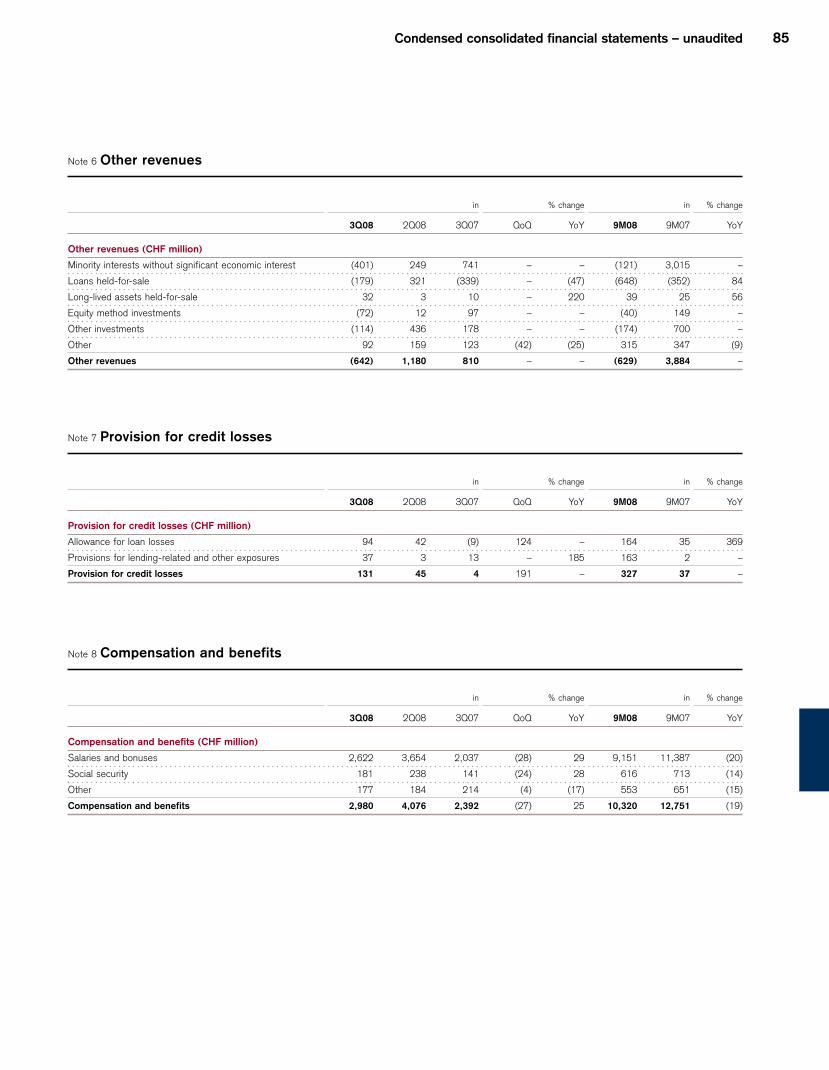
Condensed consolidated financial statements – unaudited 85
Note 6 Other revenues
in % change in % change
3Q08 2Q08 3Q07 QoQ YoY 9M08 9M07 YoY
Other revenues (CHF million)
Minority interests without significant economic interest (401) 249 741 – – (121) 3,015 –
Loans held-for-sale (179) 321 (339) – (47) (648) (352) 84
Long-lived assets held-for-sale 32 3 10 – 220 39 25 56
Equity method investments (72) 12 97 – – (40) 149 –
Other investments (114) 436 178 – – (174) 700 –
Other 92 159 123 (42) (25) 315 347 (9)
Other revenues (642) 1,180 810 – – (629) 3,884 –
Note 7 Provision for credit losses
in % change in % change
3Q08 2Q08 3Q07 QoQ YoY 9M08 9M07 YoY
Provision for credit losses (CHF million)
Allowance for loan losses 94 42 (9) 124 – 164 35 369
Provisions for lending-related and other exposures 37 3 13 – 185 163 2 –
Provision for credit losses 131 45 4 191 – 327 37 –
Note 8 Compensation and benefits
in % change in % change
3Q08 2Q08 3Q07 QoQ YoY 9M08 9M07 YoY
Compensation and benefits (CHF million)
Salaries and bonuses 2,622 3,654 2,037 (28) 29 9,151 11,387 (20)
Social security 181 238 141 (24) 28 616 713 (14)
Other 177 184 214 (4) (17) 553 651 (15)
Compensation and benefits 2,980 4,076 2,392 (27) 25 10,320 12,751 (19)
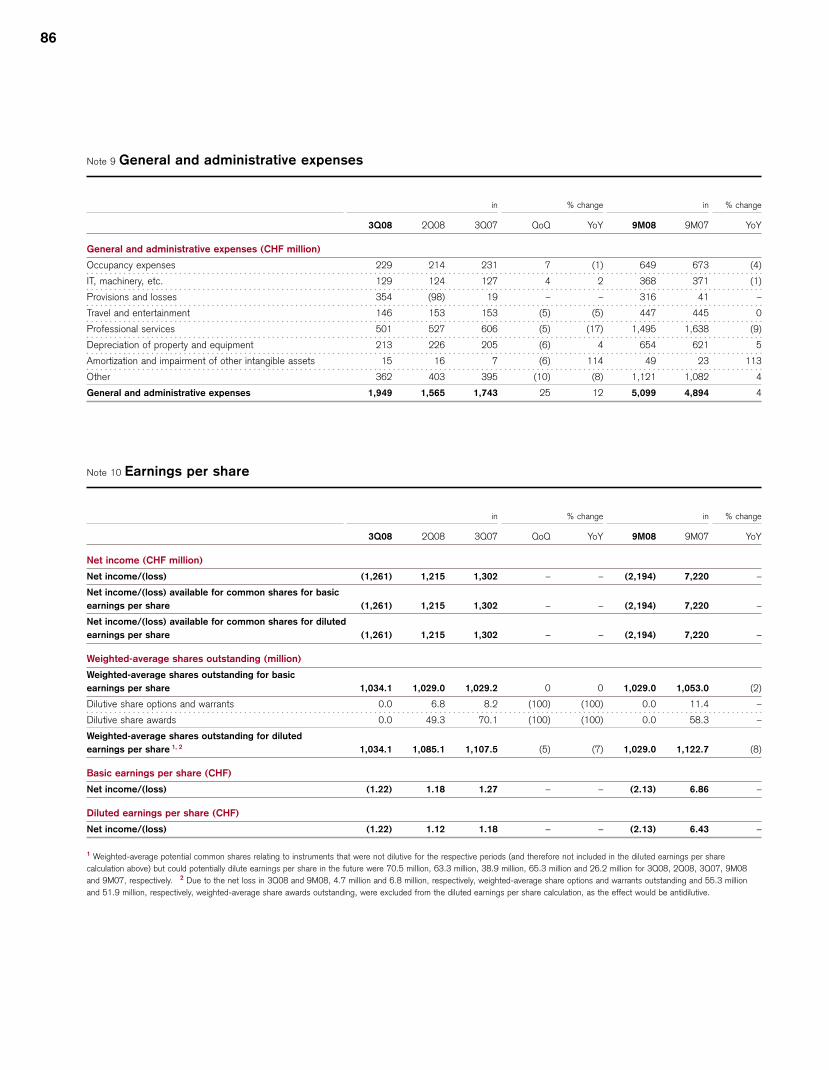
86
Note 9 General and administrative expenses
in % change in % change
3Q08 2Q08 3Q07 QoQ YoY 9M08 9M07 YoY
General and administrative expenses (CHF million)
Occupancy expenses 229 214 231 7 (1) 649 673 (4)
IT, machinery, etc. 129 124 127 4 2 368 371 (1)
Provisions and losses 354 (98) 19 – – 316 41 –
Travel and entertainment 146 153 153 (5) (5) 447 445 0
Professional services 501 527 606 (5) (17) 1,495 1,638 (9)
Depreciation of property and equipment 213 226 205 (6) 4 654 621 5
Amortization and impairment of other intangible assets 15 16 7 (6) 114 49 23 113
Other 362 403 395 (10) (8) 1,121 1,082 4
General and administrative expenses 1,949 1,565 1,743 25 12 5,099 4,894 4
Note 10 Earnings per share
in % change in % change
3Q08 2Q08 3Q07 QoQ YoY 9M08 9M07 YoY
Net income (CHF million)
Net income/(loss) (1,261) 1,215 1,302 – – (2,194) 7,220 –
Net income/(loss) available for common shares for basic
earnings per share (1,261) 1,215 1,302 – – (2,194) 7,220 –
Net income/(loss) available for common shares for diluted
earnings per share (1,261) 1,215 1,302 – – (2,194) 7,220 –
Weighted-average shares outstanding (million)
Weighted-average shares outstanding for basic
earnings per share 1,034.1 1,029.0 1,029.2 0 0 1,029.0 1,053.0 (2)
Dilutive share options and warrants 0.0 6.8 8.2 (100) (100) 0.0 11.4 –
Dilutive share awards 0.0 49.3 70.1 (100) (100) 0.0 58.3 –
Weighted-average shares outstanding for diluted
earnings per share 1, 2 1,034.1 1,085.1 1,107.5 (5) (7) 1,029.0 1,122.7 (8)
Basic earnings per share (CHF)
Net income/(loss) (1.22) 1.18 1.27 – – (2.13) 6.86 –
Diluted earnings per share (CHF)
Net income/(loss) (1.22) 1.12 1.18 – – (2.13) 6.43 –
1 Weighted-average potential common shares relating to instruments that were not dilutive for the respective periods (and therefore not included in the diluted earnings per share
calculation above) but could potentially dilute earnings per share in the future were 70.5 million, 63.3 million, 38.9 million, 65.3 million and 26.2 million for 3Q08, 2Q08, 3Q07, 9M08
and 9M07, respectively. 2 Due to the net loss in 3Q08 and 9M08, 4.7 million and 6.8 million, respectively, weighted-average share options and warrants outstanding and 55.3 million
and 51.9 million, respectively, weighted-average share awards outstanding, were excluded from the diluted earnings per share calculation, as the effect would be antidilutive.
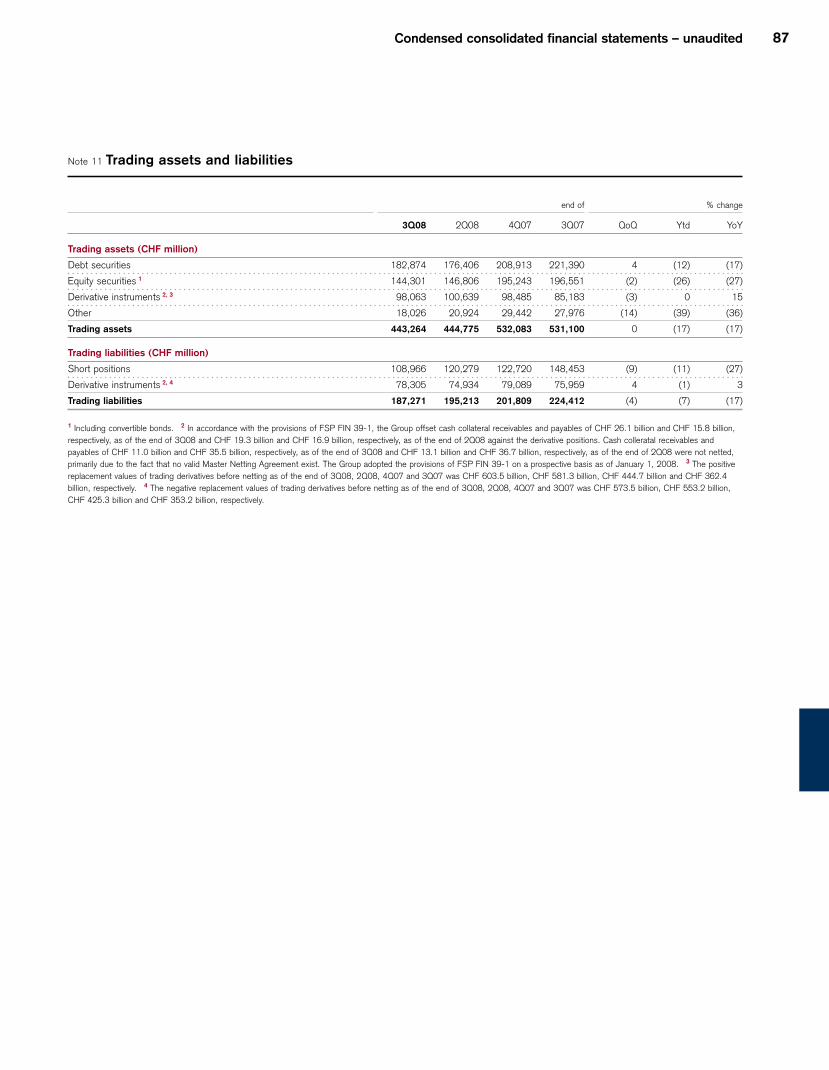
Condensed consolidated financial statements – unaudited 87
Note 11 Trading assets and liabilities
end of % change
3Q08 2Q08 4Q07 3Q07 QoQ Ytd YoY
Trading assets (CHF million)
Debt securities 182,874 176,406 208,913 221,390 4 (12) (17)
Equity securities 1 144,301 146,806 195,243 196,551 (2) (26) (27)
Derivative instruments 2, 3 98,063 100,639 98,485 85,183 (3) 0 15
Other 18,026 20,924 29,442 27,976 (14) (39) (36)
Trading assets 443,264 444,775 532,083 531,100 0 (17) (17)
Trading liabilities (CHF million)
Short positions 108,966 120,279 122,720 148,453 (9) (11) (27)
Derivative instruments 2, 4 78,305 74,934 79,089 75,959 4 (1) 3
Trading liabilities 187,271 195,213 201,809 224,412 (4) (7) (17)
1 Including convertible bonds. 2 In accordance with the provisions of FSP FIN 39-1, the Group offset cash collateral receivables and payables of CHF 26.1 billion and CHF 15.8 billion,
respectively, as of the end of 3Q08 and CHF 19.3 billion and CHF 16.9 billion, respectively, as of the end of 2Q08 against the derivative positions. Cash colleratal receivables and
payables of CHF 11.0 billion and CHF 35.5 billion, respectively, as of the end of 3Q08 and CHF 13.1 billion and CHF 36.7 billion, respectively, as of the end of 2Q08 were not netted,
primarily due to the fact that no valid Master Netting Agreement exist. The Group adopted the provisions of FSP FIN 39-1 on a prospective basis as of January 1, 2008. 3 The positive
replacement values of trading derivatives before netting as of the end of 3Q08, 2Q08, 4Q07 and 3Q07 was CHF 603.5 billion, CHF 581.3 billion, CHF 444.7 billion and CHF 362.4
billion, respectively. 4 The negative replacement values of trading derivatives before netting as of the end of 3Q08, 2Q08, 4Q07 and 3Q07 was CHF 573.5 billion, CHF 553.2 billion,
CHF 425.3 billion and CHF 353.2 billion, respectively.
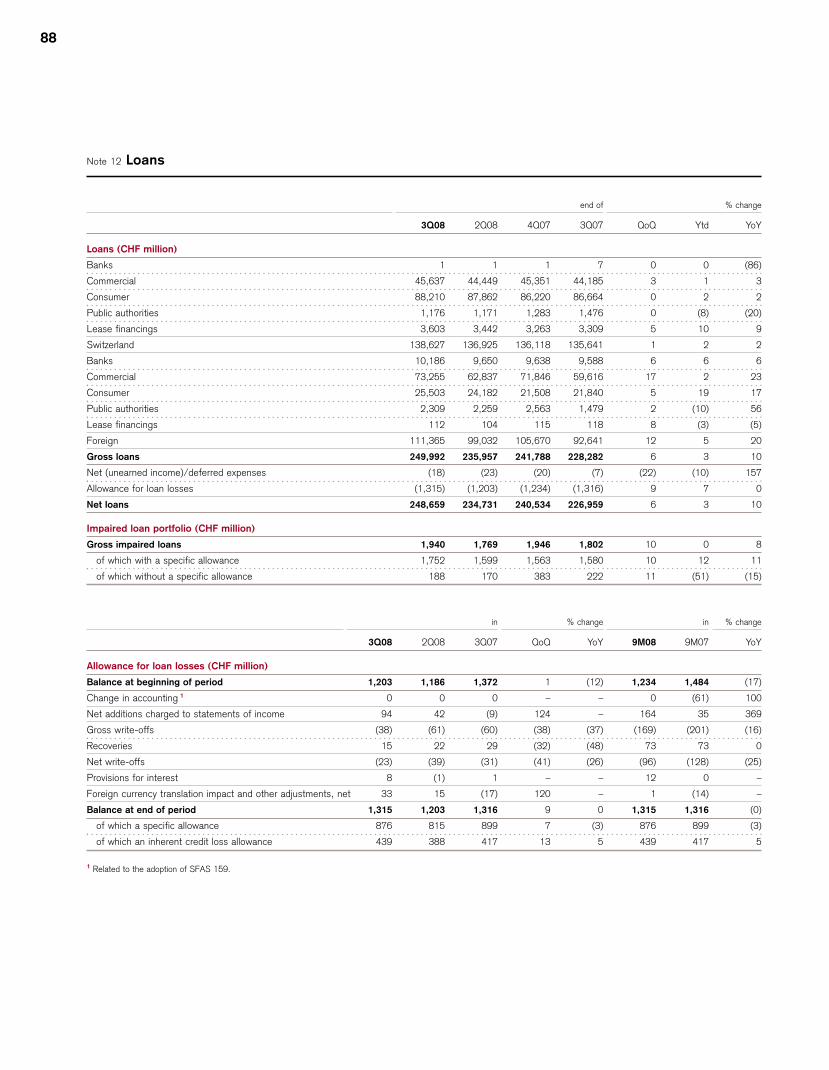
88
Note 12 Loans
end of % change
3Q08 2Q08 4Q07 3Q07 QoQ Ytd YoY
Loans (CHF million)
Banks 1 1 1 7 0 0 (86)
Commercial 45,637 44,449 45,351 44,185 3 1 3
Consumer 88,210 87,862 86,220 86,664 0 2 2
Public authorities 1,176 1,171 1,283 1,476 0 (8) (20)
Lease financings 3,603 3,442 3,263 3,309 5 10 9
Switzerland 138,627 136,925 136,118 135,641 1 2 2
Banks 10,186 9,650 9,638 9,588 6 6 6
Commercial 73,255 62,837 71,846 59,616 17 2 23
Consumer 25,503 24,182 21,508 21,840 5 19 17
Public authorities 2,309 2,259 2,563 1,479 2 (10) 56
Lease financings 112 104 115 118 8 (3) (5)
Foreign 111,365 99,032 105,670 92,641 12 5 20
Gross loans 249,992 235,957 241,788 228,282 6 3 10
Net (unearned income)/deferred expenses (18) (23) (20) (7) (22) (10) 157
Allowance for loan losses (1,315) (1,203) (1,234) (1,316) 9 7 0
Net loans 248,659 234,731 240,534 226,959 6 3 10
Impaired loan portfolio (CHF million)
Gross impaired loans 1,940 1,769 1,946 1,802 10 0 8
of which with a specific allowance 1,752 1,599 1,563 1,580 10 12 11
of which without a specific allowance 188 170 383 222 11 (51) (15)
in % change in % change
3Q08 2Q08 3Q07 QoQ YoY 9M08 9M07 YoY
Allowance for loan losses (CHF million)
Balance at beginning of period 1,203 1,186 1,372 1 (12) 1,234 1,484 (17)
Change in accounting 1 0 0 0 – – 0 (61) 100
Net additions charged to statements of income 94 42 (9) 124 – 164 35 369
Gross write-offs (38) (61) (60) (38) (37) (169) (201) (16)
Recoveries 15 22 29 (32) (48) 73 73 0
Net write-offs (23) (39) (31) (41) (26) (96) (128) (25)
Provisions for interest 8 (1) 1 – – 12 0 –
Foreign currency translation impact and other adjustments, net 33 15 (17) 120 – 1 (14) –
Balance at end of period 1,315 1,203 1,316 9 0 1,315 1,316 (0)
of which a specific allowance 876 815 899 7 (3) 876 899 (3)
of which an inherent credit loss allowance 439 388 417 13 5 439 417 5
1 Related to the adoption of SFAS 159.
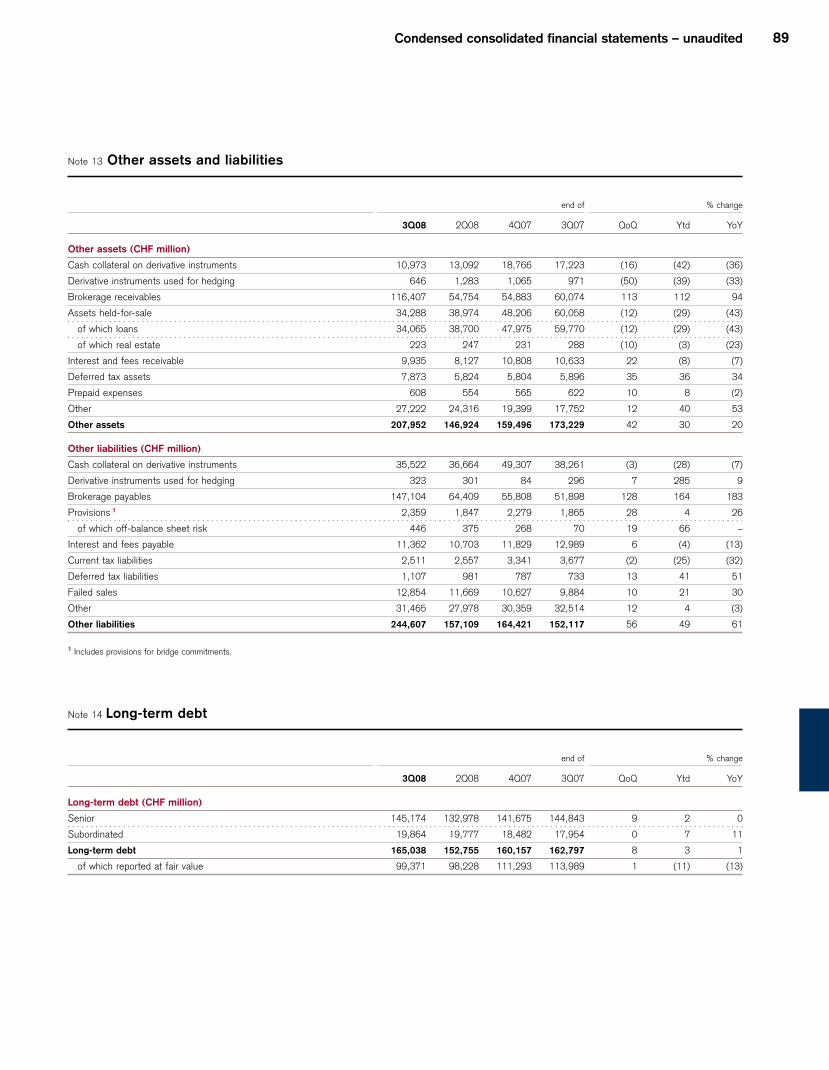
Condensed consolidated financial statements – unaudited 89
Note 13 Other assets and liabilities
end of % change
3Q08 2Q08 4Q07 3Q07 QoQ Ytd YoY
Other assets (CHF million)
Cash collateral on derivative instruments 10,973 13,092 18,766 17,223 (16) (42) (36)
Derivative instruments used for hedging 646 1,283 1,065 971 (50) (39) (33)
Brokerage receivables 116,407 54,754 54,883 60,074 113 112 94
Assets held-for-sale 34,288 38,974 48,206 60,058 (12) (29) (43)
of which loans 34,065 38,700 47,975 59,770 (12) (29) (43)
of which real estate 223 247 231 288 (10) (3) (23)
Interest and fees receivable 9,935 8,127 10,808 10,633 22 (8) (7)
Deferred tax assets 7,873 5,824 5,804 5,896 35 36 34
Prepaid expenses 608 554 565 622 10 8 (2)
Other 27,222 24,316 19,399 17,752 12 40 53
Other assets 207,952 146,924 159,496 173,229 42 30 20
Other liabilities (CHF million)
Cash collateral on derivative instruments 35,522 36,664 49,307 38,261 (3) (28) (7)
Derivative instruments used for hedging 323 301 84 296 7 285 9
Brokerage payables 147,104 64,409 55,808 51,898 128 164 183
Provisions 1 2,359 1,847 2,279 1,865 28 4 26
of which off-balance sheet risk 446 375 268 70 19 66 –
Interest and fees payable 11,362 10,703 11,829 12,989 6 (4) (13)
Current tax liabilities 2,511 2,557 3,341 3,677 (2) (25) (32)
Deferred tax liabilities 1,107 981 787 733 13 41 51
Failed sales 12,854 11,669 10,627 9,884 10 21 30
Other 31,465 27,978 30,359 32,514 12 4 (3)
Other liabilities 244,607 157,109 164,421 152,117 56 49 61
1 Includes provisions for bridge commitments.
Note 14 Long-term debt
end of % change
3Q08 2Q08 4Q07 3Q07 QoQ Ytd YoY
Long-term debt (CHF million)
Senior 145,174 132,978 141,675 144,843 9 2 0
Subordinated 19,864 19,777 18,482 17,954 0 7 11
Long-term debt 165,038 152,755 160,157 162,797 8 3 1
of which reported at fair value 99,371 98,228 111,293 113,989 1 (11) (13)
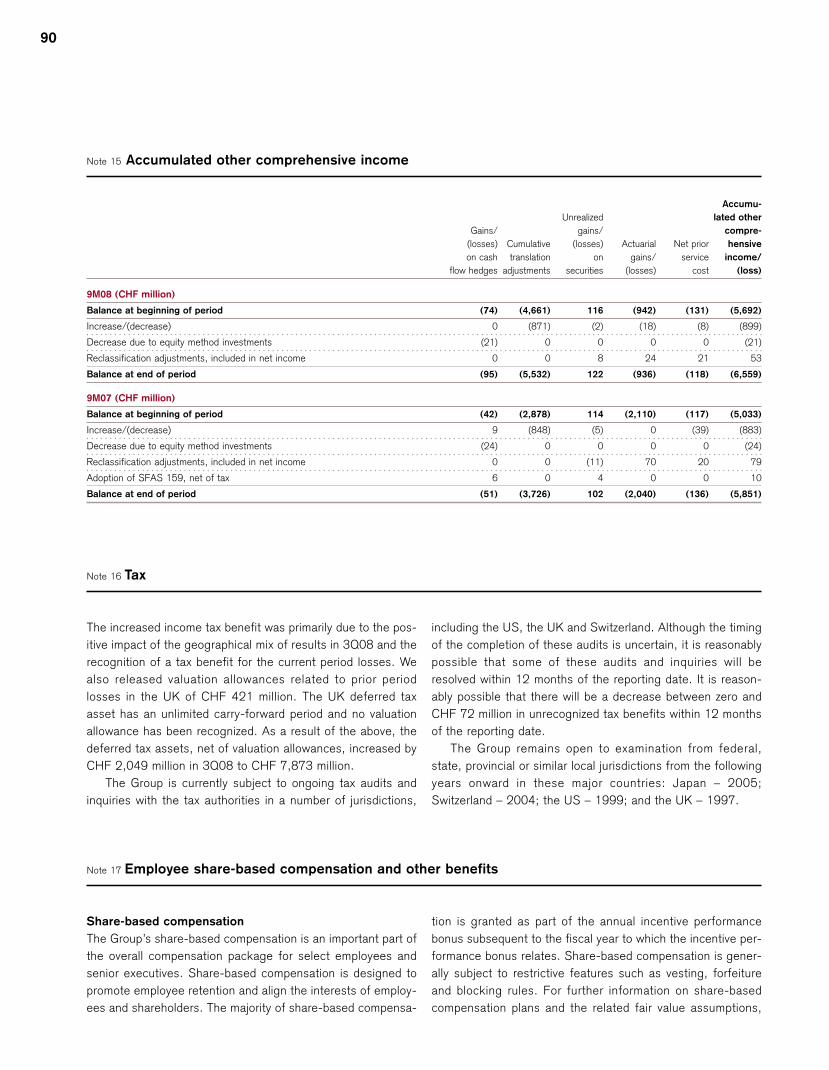
90
Note 15 Accumulated other comprehensive income
Accumu-
Unrealized lated other
Gains/ gains/ compre-
(losses) Cumulative (losses) Actuarial Net prior hensive
on cash translation on gains/ service income/
flow hedges adjustments securities (losses) cost (loss)
9M08 (CHF million)
Balance at beginning of period (74) (4,661) 116 (942) (131) (5,692)
Increase/(decrease) 0 (871) (2) (18) (8) (899)
Decrease due to equity method investments (21) 0 0 0 0 (21)
Reclassification adjustments, included in net income 0 0 8 24 21 53
Balance at end of period (95) (5,532) 122 (936) (118) (6,559)
9M07 (CHF million)
Balance at beginning of period (42) (2,878) 114 (2,110) (117) (5,033)
Increase/(decrease) 9 (848) (5) 0 (39) (883)
Decrease due to equity method investments (24) 0 0 0 0 (24)
Reclassification adjustments, included in net income 0 0 (11) 70 20 79
Adoption of SFAS 159, net of tax 6 0 4 0 0 10
Balance at end of period (51) (3,726) 102 (2,040) (136) (5,851)
Note 16 Tax
The increased income tax benefit was primarily due to the pos-
itive impact of the geographical mix of results in 3Q08 and the
recognition of a tax benefit for the current period losses. We
also released valuation allowances related to prior period
losses in the UK of CHF 421 million. The UK deferred tax
asset has an unlimited carry-forward period and no valuation
allowance has been recognized. As a result of the above, the
deferred tax assets, net of valuation allowances, increased by
CHF 2,049 million in 3Q08 to CHF 7,873 million.
The Group is currently subject to ongoing tax audits and
inquiries with the tax authorities in a number of jurisdictions,
including the US, the UK and Switzerland. Although the timing
of the completion of these audits is uncertain, it is reasonably
possible that some of these audits and inquiries will be
resolved within 12 months of the reporting date. It is reason-
ably possible that there will be a decrease between zero and
CHF 72 million in unrecognized tax benefits within 12 months
of the reporting date.
The Group remains open to examination from federal,
state, provincial or similar local jurisdictions from the following
years onward in these major countries: Japan – 2005;
Switzerland – 2004; the US – 1999; and the UK – 1997.
Note 17 Employee share-based compensation and other benefits
Share-based compensation
The Group’s share-based compensation is an important part of
the overall compensation package for select employees and
senior executives. Share-based compensation is designed to
promote employee retention and align the interests of employ-
ees and shareholders. The majority of share-based compensa-
tion is granted as part of the annual incentive performance
bonus subsequent to the fiscal year to which the incentive per-
formance bonus relates. Share-based compensation is gener-
ally subject to restrictive features such as vesting, forfeiture
and blocking rules. For further information on share-based
compensation plans and the related fair value assumptions,

Condensed consolidated financial statements – unaudited 91
refer to Note 27 – Employee share-based compensation and
other benefits in V – Consolidated financial statements –
Credit Suisse Group in the Credit Suisse Annual Report 2007.
Compensation expense
Compensation expense in any year includes a variable com-
pensation expense for that year’s discretionary cash perform-
ance bonus and fixed expenses for share-based awards
granted in prior years. Recognition in the consolidated state-
ments of income of expense relating to awards granted in prior
years is dependent primarily upon the vesting period, which is
determined by the plan, retirement eligibility of employees,
moratorium periods and certain other terms.
Total compensation expense for share-based compensa-
tion recognized in the consolidated statements of income in
compensation and benefits was CHF 2,404 million and CHF
2,041 million in 9M08 and 9M07, respectively. As of Septem-
ber 30, 2008, the total estimated unrecognized compensation
expense related to non-vested share-based compensation of
CHF 2,999 million will be recognized over the remaining
weighted-average requisite service period of 1.3 years.
The Group generally repurchases its own shares in the
open market to satisfy these obligations but can also issue
new shares out of available conditional capital. In the first nine
months of 2008, the Group delivered approximately 16.3 mil-
lion shares to employees.
Incentive Share Unit
In January 2007, as part of the 2006 remuneration process,
the Group aligned its share-based compensation plans and
introduced Incentive Share Units (ISU). Previously granted
awards will continue to settle under their original terms and
are not affected by the ISU. An ISU is a unit that is similar to
shares, but offers additional upside depending on the develop-
ment of the Credit Suisse Group share price. For each ISU
granted, the employee will receive at least one Credit Suisse
Group share. In addition, the leverage component can deliver
additional upside, which will be determined by the monthly
average Credit Suisse Group share price over the three-year
period following the grant. Each ISU will vest at a rate of one-
third of a share per year over three years, with the potential
additional shares vesting on the third anniversary of the grant
date, depending on the development of the leverage compo-
nent.
The compensation expense recognized in 9M08 related to
ISUs was CHF 1,745 million. The estimated unrecognized
compensation expense related to ISUs as of September 30,
2008 was CHF 2,534 million and will be recognized over the
term of the award, subject to early retirement rules.
Incentive Share Unit activities
in 9M08 ISU
Number of awards (million)
Balance at beginning of period 25.4
Granted 47.0
Settled (9.5)
Forfeited (1.3)
Balance at end of period 61.6
of which vested 0.9
of which unvested 60.7
Performance Incentive Plan
As part of its annual incentive performance bonus process for
2004 and 2005, the Group granted Performance Incentive
Plan (PIP) units during 2005 (PIP I) and 2006 (PIP II),
respectively. PIP units are long-term retention incentive
awards requiring continued employment with the Group, sub-
ject to restrictive covenants and cancellation provisions, and
vest evenly over a five-year period. Each PIP unit will settle for
a specified number of Credit Suisse Group registered shares
subsequent to the fifth anniversary of the grant date based on
the achievement of: i) earnings performance as compared to
predefined targets; and ii) share price performance compared
to predefined targets and share price performance relative to
peers.
The compensation expense recognized in 9M08 related to
PIP I and PIP II was CHF 189 million. The estimated unrecog-
nized compensation expense related to PIP I and PIP II as of
September 30, 2008 was CHF 106 million. None of the PIP
units were deliverable as of September 30, 2008.
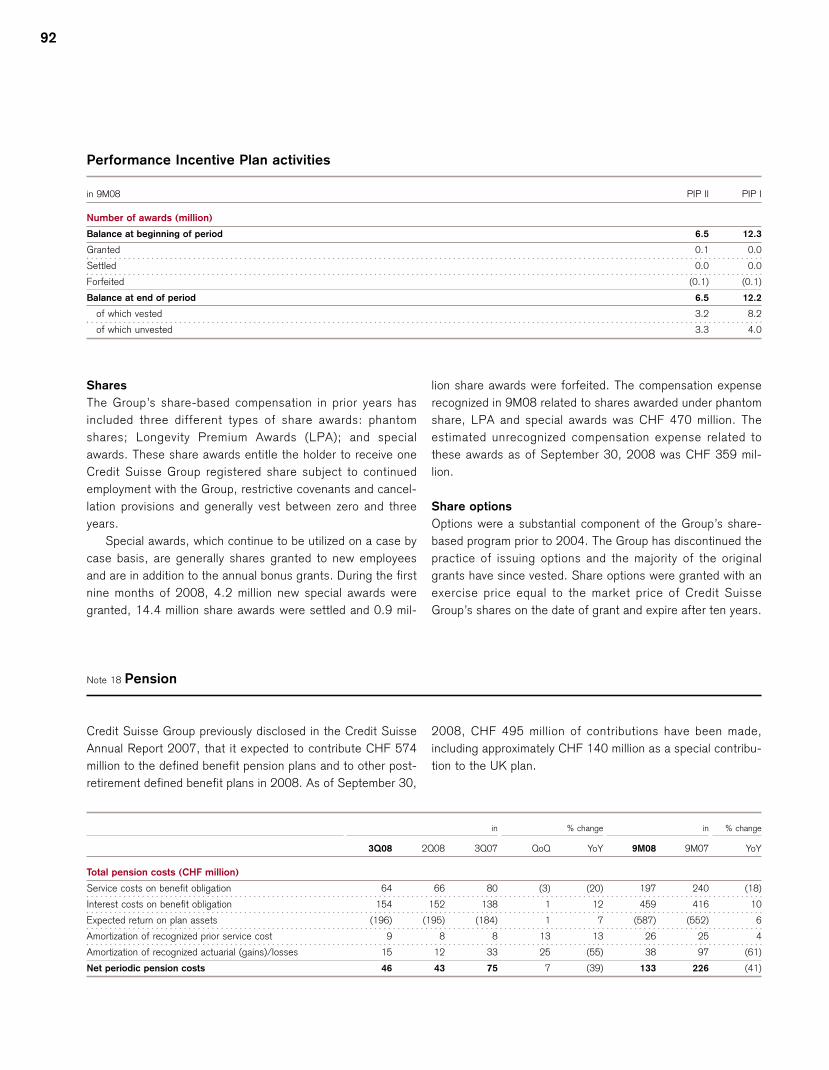
92
Performance Incentive Plan activities
in 9M08 PIP II PIP I
Number of awards (million)
Balance at beginning of period 6.5 12.3
Granted 0.1 0.0
Settled 0.0 0.0
Forfeited (0.1) (0.1)
Balance at end of period 6.5 12.2
of which vested 3.2 8.2
of which unvested 3.3 4.0
Shares
The Group’s share-based compensation in prior years has
included three different types of share awards: phantom
shares; Longevity Premium Awards (LPA); and special
awards. These share awards entitle the holder to receive one
Credit Suisse Group registered share subject to continued
employment with the Group, restrictive covenants and cancel-
lation provisions and generally vest between zero and three
years.
Special awards, which continue to be utilized on a case by
case basis, are generally shares granted to new employees
and are in addition to the annual bonus grants. During the first
nine months of 2008, 4.2 million new special awards were
granted, 14.4 million share awards were settled and 0.9 mil-
lion share awards were forfeited. The compensation expense
recognized in 9M08 related to shares awarded under phantom
share, LPA and special awards was CHF 470 million. The
estimated unrecognized compensation expense related to
these awards as of September 30, 2008 was CHF 359 mil-
lion.
Share options
Options were a substantial component of the Group’s share-
based program prior to 2004. The Group has discontinued the
practice of issuing options and the majority of the original
grants have since vested. Share options were granted with an
exercise price equal to the market price of Credit Suisse
Group’s shares on the date of grant and expire after ten years.
Note 18 Pension
Credit Suisse Group previously disclosed in the Credit Suisse
Annual Report 2007, that it expected to contribute CHF 574
million to the defined benefit pension plans and to other post-
retirement defined benefit plans in 2008. As of September 30,
2008, CHF 495 million of contributions have been made,
including approximately CHF 140 million as a special contribu-
tion to the UK plan.
in % change in % change
3Q08 2Q08 3Q07 QoQ YoY 9M08 9M07 YoY
Total pension costs (CHF million)
Service costs on benefit obligation 64 66 80 (3) (20) 197 240 (18)
Interest costs on benefit obligation 154 152 138 1 12 459 416 10
Expected return on plan assets (196) (195) (184) 1 7 (587) (552) 6
Amortization of recognized prior service cost 9 8 8 13 13 26 25 4
Amortization of recognized actuarial (gains)/losses 15 12 33 25 (55) 38 97 (61)
Net periodic pension costs 46 43 75 7 (39) 133 226 (41)
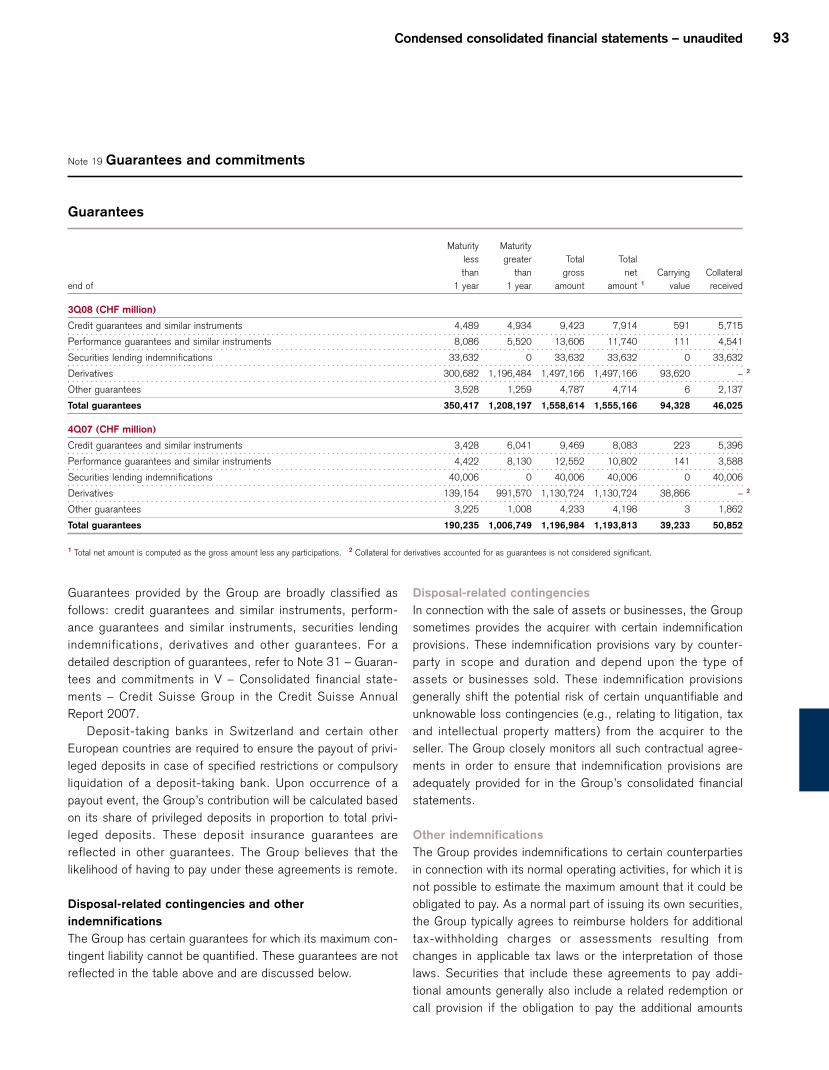
Condensed consolidated financial statements – unaudited 93
Note 19 Guarantees and commitments
Guarantees
Maturity Maturity
less greater Total Total
than than gross net Carrying Collateral
end of 1 year 1 year amount amount 1 value received
3Q08 (CHF million)
Credit guarantees and similar instruments 4,489 4,934 9,423 7,914 591 5,715
Performance guarantees and similar instruments 8,086 5,520 13,606 11,740 111 4,541
Securities lending indemnifications 33,632 0 33,632 33,632 0 33,632
Derivatives 300,682 1,196,484 1,497,166 1,497,166 93,620 – 2
Other guarantees 3,528 1,259 4,787 4,714 6 2,137
Total guarantees 350,417 1,208,197 1,558,614 1,555,166 94,328 46,025
4Q07 (CHF million)
Credit guarantees and similar instruments 3,428 6,041 9,469 8,083 223 5,396
Performance guarantees and similar instruments 4,422 8,130 12,552 10,802 141 3,588
Securities lending indemnifications 40,006 0 40,006 40,006 0 40,006
Derivatives 139,154 991,570 1,130,724 1,130,724 38,866 – 2
Other guarantees 3,225 1,008 4,233 4,198 3 1,862
Total guarantees 190,235 1,006,749 1,196,984 1,193,813 39,233 50,852
1 Total net amount is computed as the gross amount less any participations. 2 Collateral for derivatives accounted for as guarantees is not considered significant.
Guarantees provided by the Group are broadly classified as
follows: credit guarantees and similar instruments, perform-
ance guarantees and similar instruments, securities lending
indemnifications, derivatives and other guarantees. For a
detailed description of guarantees, refer to Note 31 – Guaran-
tees and commitments in V – Consolidated financial state-
ments – Credit Suisse Group in the Credit Suisse Annual
Report 2007.
Deposit-taking banks in Switzerland and certain other
European countries are required to ensure the payout of privi-
leged deposits in case of specified restrictions or compulsory
liquidation of a deposit-taking bank. Upon occurrence of a
payout event, the Group’s contribution will be calculated based
on its share of privileged deposits in proportion to total privi-
leged deposits. These deposit insurance guarantees are
reflected in other guarantees. The Group believes that the
likelihood of having to pay under these agreements is remote.
Disposal-related contingencies and other
indemnifications
The Group has certain guarantees for which its maximum con-
tingent liability cannot be quantified. These guarantees are not
reflected in the table above and are discussed below.
Disposal-related contingencies
In connection with the sale of assets or businesses, the Group
sometimes provides the acquirer with certain indemnification
provisions. These indemnification provisions vary by counter-
party in scope and duration and depend upon the type of
assets or businesses sold. These indemnification provisions
generally shift the potential risk of certain unquantifiable and
unknowable loss contingencies (e.g., relating to litigation, tax
and intellectual property matters) from the acquirer to the
seller. The Group closely monitors all such contractual agree-
ments in order to ensure that indemnification provisions are
adequately provided for in the Group’s consolidated financial
statements.
Other indemnifications
The Group provides indemnifications to certain counterparties
in connection with its normal operating activities, for which it is
not possible to estimate the maximum amount that it could be
obligated to pay. As a normal part of issuing its own securities,
the Group typically agrees to reimburse holders for additional
tax-withholding charges or assessments resulting from
changes in applicable tax laws or the interpretation of those
laws. Securities that include these agreements to pay addi-
tional amounts generally also include a related redemption or
call provision if the obligation to pay the additional amounts
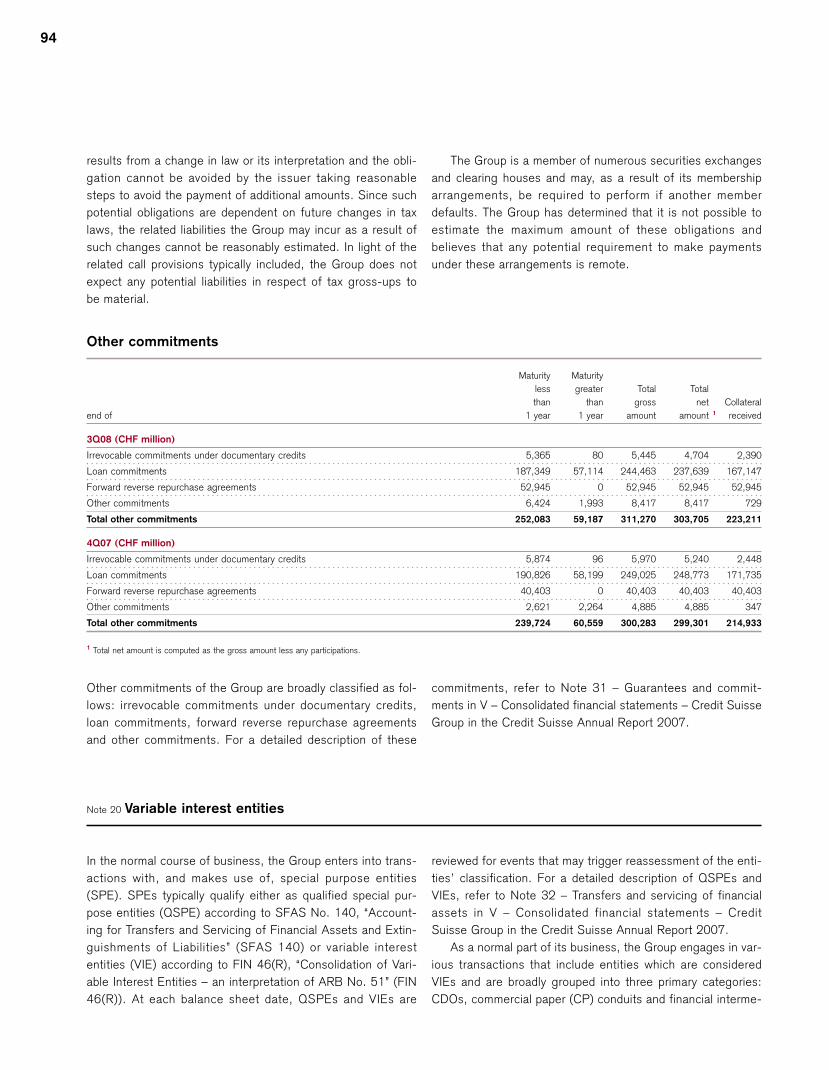
94
results from a change in law or its interpretation and the obli-
gation cannot be avoided by the issuer taking reasonable
steps to avoid the payment of additional amounts. Since such
potential obligations are dependent on future changes in tax
laws, the related liabilities the Group may incur as a result of
such changes cannot be reasonably estimated. In light of the
related call provisions typically included, the Group does not
expect any potential liabilities in respect of tax gross-ups to
be material.
The Group is a member of numerous securities exchanges
and clearing houses and may, as a result of its membership
arrangements, be required to perform if another member
defaults. The Group has determined that it is not possible to
estimate the maximum amount of these obligations and
believes that any potential requirement to make payments
under these arrangements is remote.
Other commitments
Maturity Maturity
less greater Total Total
than than gross net Collateral
end of 1 year 1 year amount amount 1 received
3Q08 (CHF million)
Irrevocable commitments under documentary credits 5,365 80 5,445 4,704 2,390
Loan commitments 187,349 57,114 244,463 237,639 167,147
Forward reverse repurchase agreements 52,945 0 52,945 52,945 52,945
Other commitments 6,424 1,993 8,417 8,417 729
Total other commitments 252,083 59,187 311,270 303,705 223,211
4Q07 (CHF million)
Irrevocable commitments under documentary credits 5,874 96 5,970 5,240 2,448
Loan commitments 190,826 58,199 249,025 248,773 171,735
Forward reverse repurchase agreements 40,403 0 40,403 40,403 40,403
Other commitments 2,621 2,264 4,885 4,885 347
Total other commitments 239,724 60,559 300,283 299,301 214,933
1 Total net amount is computed as the gross amount less any participations.
Other commitments of the Group are broadly classified as fol-
lows: irrevocable commitments under documentary credits,
loan commitments, forward reverse repurchase agreements
and other commitments. For a detailed description of these
commitments, refer to Note 31 – Guarantees and commit-
ments in V – Consolidated financial statements – Credit Suisse
Group in the Credit Suisse Annual Report 2007.
Note 20 Variable interest entities
In the normal course of business, the Group enters into trans-
actions with, and makes use of, special purpose entities
(SPE). SPEs typically qualify either as qualified special pur-
pose entities (QSPE) according to SFAS No. 140, “Account-
ing for Transfers and Servicing of Financial Assets and Extin-
guishments of Liabilities” (SFAS 140) or variable interest
entities (VIE) according to FIN 46(R), “Consolidation of Vari-
able Interest Entities – an interpretation of ARB No. 51” (FIN
46(R)). At each balance sheet date, QSPEs and VIEs are
reviewed for events that may trigger reassessment of the enti-
ties’ classification. For a detailed description of QSPEs and
VIEs, refer to Note 32 – Transfers and servicing of financial
assets in V – Consolidated financial statements – Credit
Suisse Group in the Credit Suisse Annual Report 2007.
As a normal part of its business, the Group engages in var-
ious transactions that include entities which are considered
VIEs and are broadly grouped into three primary categories:
CDOs, commercial paper (CP) conduits and financial interme-
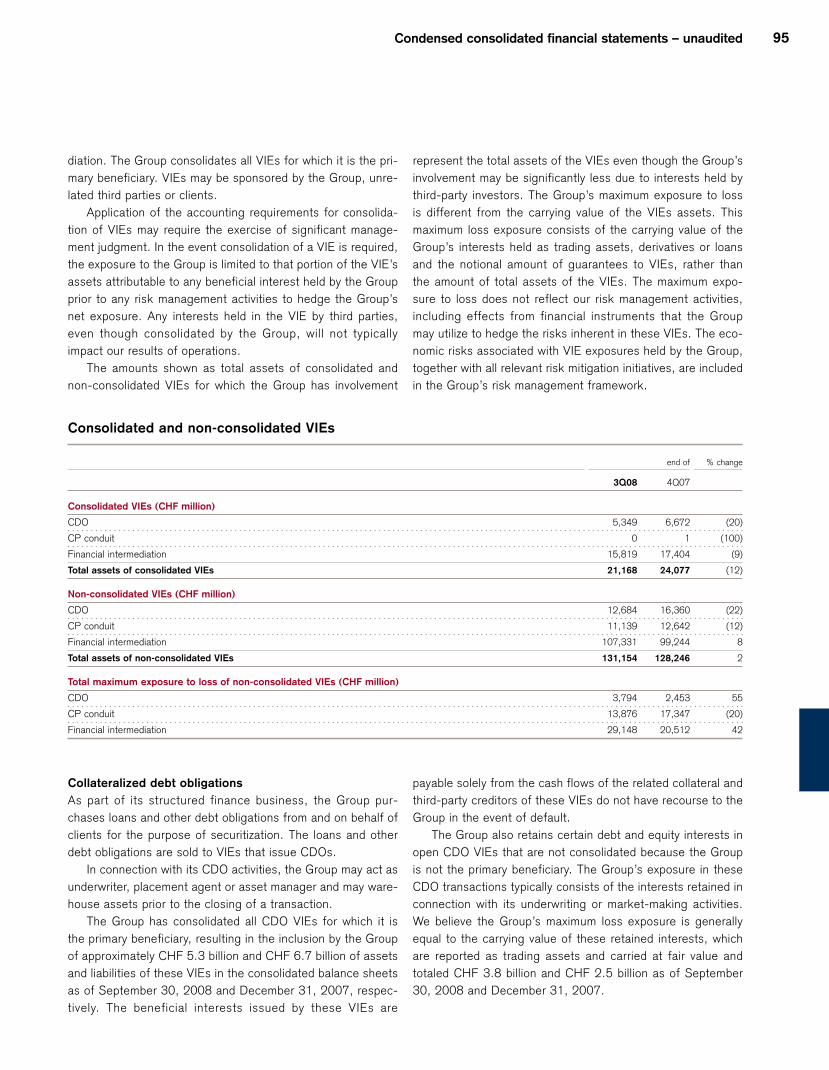
Condensed consolidated financial statements – unaudited 95
diation. The Group consolidates all VIEs for which it is the pri-
mary beneficiary. VIEs may be sponsored by the Group, unre-
lated third parties or clients.
Application of the accounting requirements for consolida-
tion of VIEs may require the exercise of significant manage-
ment judgment. In the event consolidation of a VIE is required,
the exposure to the Group is limited to that portion of the VIE’s
assets attributable to any beneficial interest held by the Group
prior to any risk management activities to hedge the Group’s
net exposure. Any interests held in the VIE by third parties,
even though consolidated by the Group, will not typically
impact our results of operations.
The amounts shown as total assets of consolidated and
non-consolidated VIEs for which the Group has involvement
represent the total assets of the VIEs even though the Group’s
involvement may be significantly less due to interests held by
third-party investors. The Group’s maximum exposure to loss
is different from the carrying value of the VIEs assets. This
maximum loss exposure consists of the carrying value of the
Group’s interests held as trading assets, derivatives or loans
and the notional amount of guarantees to VIEs, rather than
the amount of total assets of the VIEs. The maximum expo-
sure to loss does not reflect our risk management activities,
including effects from financial instruments that the Group
may utilize to hedge the risks inherent in these VIEs. The eco-
nomic risks associated with VIE exposures held by the Group,
together with all relevant risk mitigation initiatives, are included
in the Group’s risk management framework.
Consolidated and non-consolidated VIEs
end of % change
3Q08 4Q07
Consolidated VIEs (CHF million)
CDO 5,349 6,672 (20)
CP conduit 0 1 (100)
Financial intermediation 15,819 17,404 (9)
Total assets of consolidated VIEs 21,168 24,077 (12)
Non-consolidated VIEs (CHF million)
CDO 12,684 16,360 (22)
CP conduit 11,139 12,642 (12)
Financial intermediation 107,331 99,244 8
Total assets of non-consolidated VIEs 131,154 128,246 2
Total maximum exposure to loss of non-consolidated VIEs (CHF million)
CDO 3,794 2,453 55
CP conduit 13,876 17,347 (20)
Financial intermediation 29,148 20,512 42
Collateralized debt obligations
As part of its structured finance business, the Group pur-
chases loans and other debt obligations from and on behalf of
clients for the purpose of securitization. The loans and other
debt obligations are sold to VIEs that issue CDOs.
In connection with its CDO activities, the Group may act as
underwriter, placement agent or asset manager and may ware-
house assets prior to the closing of a transaction.
The Group has consolidated all CDO VIEs for which it is
the primary beneficiary, resulting in the inclusion by the Group
of approximately CHF 5.3 billion and CHF 6.7 billion of assets
and liabilities of these VIEs in the consolidated balance sheets
as of September 30, 2008 and December 31, 2007, respec-
tively. The beneficial interests issued by these VIEs are
payable solely from the cash flows of the related collateral and
third-party creditors of these VIEs do not have recourse to the
Group in the event of default.
The Group also retains certain debt and equity interests in
open CDO VIEs that are not consolidated because the Group
is not the primary beneficiary. The Group’s exposure in these
CDO transactions typically consists of the interests retained in
connection with its underwriting or market-making activities.
We believe the Group’s maximum loss exposure is generally
equal to the carrying value of these retained interests, which
are reported as trading assets and carried at fair value and
totaled CHF 3.8 billion and CHF 2.5 billion as of September
30, 2008 and December 31, 2007.
96
The Group’s maximum exposure to loss does not include
any effects from financial instruments used to hedge the risks
of the VIEs. The economic risks associated with CDO VIE
exposures held by the Group, together with all relevant risk
mitigation initiatives, are included in the Group’s risk manage-
ment framework.
Commercial paper conduits
The Group continues to act as the administrator and provider
of liquidity and credit enhancement facilities for one CP con-
duit, Alpine Securitization Corp., a client-focused multi-seller
conduit vehicle (Alpine). The Group does not have any owner-
ship interest in Alpine.
The overall average maturity of the conduit’s outstanding
CP was approximately 12 days as of September 30, 2008.
Alpine’s commercial paper has the highest short-term ratings
from the major independent external rating agencies. The
majority of Alpine’s assets are highly rated loans or receivables
in the consumer sector and money markets, including auto
loans or leases, credit card receivables and student loans.
Those assets had a weighted average rating of AA, based on
the lowest of each asset’s external or internal rating, and a
weighted average maturity of 1.65 years as of September 30,
2008. The Group’s commitment to this CP conduit consists of
obligations under liquidity agreements and a program-wide
credit enhancement agreement.
As of September 30, 2008, the Group’s maximum loss
exposure to this non-consolidated CP conduit was CHF 13.9
billion, which consisted of CHF 11.0 billion of funded assets
and the CP conduit’s commitments to purchase CHF 2.9 bil-
lion of additional assets. As of December 31, 2007, the
Group’s maximum loss exposure was CHF 17.4 billion.
The Group believes that the likelihood of incurring a loss
equal to this maximum exposure is remote because the assets
held by the CP conduit, after giving effect to related asset-
specific credit enhancement primarily provided by the clients,
are classified as investment grade. If Alpine’s assets were
consolidated as of September 30, 2008, we estimate that the
valuation reductions of these assets would not have been
material to our results of operations. The Group’s economic
risks associated with the CP conduit are included in the
Group’s risk management framework including counterparty,
economic capital and scenario analysis.
Financial intermediation
The Group has significant involvement with VIEs in its role as a
financial intermediary on behalf of clients. The Group has con-
solidated all VIEs related to financial intermediation for which it
is the primary beneficiary, resulting in the inclusion by the
Group of approximately CHF 15.8 billion and CHF 17.4 billion
of assets and liabilities of these VIEs in the consolidated bal-
ance sheets as of September 30, 2008 and December 31,
2007, respectively. Approximately 58% of the total assets
relate to investment structures which the Group sponsors,
manages and distributes.
The Group’s maximum loss exposure to non-consolidated
VIEs related to financial intermediation activities was CHF
29.1 billion and CHF 20.5 billion as of September 30, 2008
and December 31, 2007, respectively. This exposure consists
of the carrying value of the Group’s interests held as trading
assets, derivatives or loans and the notional amount of guar-
antees to VIEs, not the total assets of the VIEs. The Group
considers the likelihood of incurring a loss equal to the maxi-
mum exposure to be remote because of the Group’s risk miti-
gation efforts, including hedging strategies, collateral arrange-
ments and the risk of loss that is retained by investors. The
Group’s economic risks associated with consolidated and non-
consolidated VIE exposures arising from financial intermedia-
tion, together with all relevant risk mitigation initiatives, are
included in the Group’s risk management framework.
Financial intermediation is broadly grouped into the follow-
ing categories: lending arrangements, certain securitizations
and investment structures.
The Group’s lending arrangements are not consolidated by
the Group as the clients are the sponsors of the VIEs and are
deemed the primary beneficiaries. These structures are estab-
lished to purchase, lease or otherwise finance and manage
clients’ assets. The maximum exposure to loss is equivalent to
the carrying value of the Group’s loan exposure, which is sub-
ject to the same credit risk management procedures as loans
issued directly to clients. The Group considers the likelihood of
incurring a loss equal to the maximum exposure to be remote
because of the Group’s risk mitigation efforts which includes
over-collateralization and effective monitoring to ensure that a
sufficient loan-to-value ratio is maintained.
The Group acts as underwriter and market maker, liquidity
provider, derivative counterparty or provider of credit enhance-
ments to VIEs related to certain securitization transactions. In
addition, the Group has exposure to third-party securitization
VIEs as a result of the securities purchased from our money
market funds in the second half of 2007 and the first quarter
of 2008. The Group’s maximum loss exposure is generally
equal to the carrying value of the retained interests and deriv-
ative positions, if any, plus the exposure arising from any credit
enhancements provided by us. The Group’s maximum expo-
sure to loss does not include any effects from financial instru-
ments used to hedge the risks of the VIEs.
The Group may have various relationships with investment
structures which the Group sponsors, manages and distrib-
utes, including in the form of structurer, investment advisor,
Condensed consolidated financial statements – unaudited 97
investment manager, administrator, custodian, underwriter,
placement agent, market maker or as prime broker. The max-
imum exposure to loss consists of the fair value of instruments
issued by such structures, which are held by the Group as a
result of underwriting or market-making activities, the fair
value of any derivative exposure resulting from prime broker-
age activities and our exposure resulting from principal protec-
tion and redemptions features. The investors typically retain
the risk of loss on such transactions but the Group may pro-
vide principal protection on the securities to limit the investors’
exposure to downside risk. In addition, certain structures are
designed to include redemption mechanisms which allow
investors to redeem their participating interests in the respec-
tive VIEs within the agreed redemption periods. The Group’s
maximum exposure to loss does not include any effects from
financial instruments used to hedge the risk of the VIEs.
Note 21 Fair value of financial instruments
The fair value of the majority of the Group’s financial instru-
ments is based on quoted prices in active markets or observ-
able inputs. These instruments include government and
agency securities, commercial paper, most investment-grade
corporate debt, most high-yield debt securities, exchange-
traded and certain over-the-counter (OTC) derivative instru-
ments and certain listed equity securities.
In addition, the Group holds financial instruments for which
no prices are available and which have little or no observable
inputs. For these instruments, the determination of fair value
requires subjective assessment and varying degrees of judg-
ment depending on liquidity, concentration, pricing assump-
tions and the risks affecting the specific instrument. In such
circumstances, valuation is determined based on manage-
ment’s own assumptions about the assumptions that market
participants would use in pricing the asset or liability (including
assumptions about risk). These instruments include certain
high-yield debt securities, distressed debt securities, certain
OTC derivatives, certain CDOs, certain asset-backed and
mortgage-backed securities, non-traded equity securities, pri-
vate equity and other long-term investments.
The Group has availed itself of the simplification in
accounting offered under the fair value option, primarily in the
Investment Banking and Asset Management segments. This
has been accomplished generally by electing the fair value
option, both at initial adoption and for subsequent transac-
tions, on items impacted by the hedge accounting require-
ments of SFAS 133. That is, for instruments for which there
was an inability to achieve hedge accounting and for which we
are economically hedged, we have elected the fair value
option. Likewise, where we manage an activity on a fair value
basis but previously have been unable to achieve fair value
accounting, we have utilized the fair value option to align our
risk management reporting to our financial accounting.
Fair value hierarchy
The levels of the fair value hierarchy are defined as follows in
SFAS 157:
p Level 1: Quoted prices (unadjusted) in active markets for
identical assets or liabilities that the Group has the ability
to access. This level of the fair value hierarchy provides
the most reliable evidence of fair value and is used to
measure fair value whenever available.
p Level 2: Inputs other than quoted prices included within
level 1 that are observable for the asset or liability, either
directly or indirectly. These inputs include: (i) quoted prices
for similar assets or liabilities in active markets; (ii) quoted
prices for identical or similar assets or liabilities in markets
that are not active, that is, markets in which there are few
transactions for the asset or liability, the prices are not
current or price quotations vary substantially either over
time or among market makers, or in which little informa-
tion is publicly available; (iii) inputs other than quoted
prices that are observable for the asset or liability; or (iv)
inputs that are derived principally from or corroborated by
observable market data by correlation or other means.
p Level 3: Inputs that are unobservable for the asset or lia-
bility. These inputs reflect the Group’s own assumptions
about the assumptions that market participants would use
in pricing the asset or liability (including assumptions about
risk). These inputs are developed based on the best infor-
mation available in the circumstances, which include the
Group’s own data. The Group’s own data used to develop
unobservable inputs is adjusted if information indicates
that market participants would use different assumptions.
For further information on the fair value of financial instru-
ments and an overview of the Group’s valuation techniques
applied to financial instruments, refer to Note 33 – Financial
instruments in V – Consolidated financial instruments – Credit
Suisse Group in the Credit Suisse Group Annual Report 2007.

98
Assets and liabilities measured at fair value on a recurring basis
Quoted
prices in
active
markets for Significant Significant
identical other unobserv- Total
assets or observable able Impact at
liabilities inputs inputs of fair
end of 3Q08 (level1) (level 2) (level 3) netting 1 value
Assets (CHF million)
Central bank funds sold, securities purchased under
resale agreements and securities borrowing transactions 0 183,815 0 0 183,815
Securities received as collateral 41,036 2,801 0 0 43,837
Trading assets 205,720 684,431 58,577 (505,464) 443,264
Investment securities 12,107 848 0 0 12,955
Other investments 607 7,248 20,858 0 28,713
Loans 0 19,988 16,206 0 36,194
Other intangible assets 0 0 119 0 119
Other assets 5,074 21,246 18,173 (189) 44,304
Total assets at fair value 264,544 920,377 113,933 (505,653) 793,201
Liabilities (CHF million)
Due to banks 0 3,552 20 0 3,572
Customer deposits 0 3,523 0 0 3,523
Central bank funds purchased, securities sold under
repurchase agreements and securities lending transactions 0 184,814 0 0 184,814
Obligations to return securities received as collateral 41,036 2,801 0 0 43,837
Trading liabilities 99,532 562,182 20,800 (495,243) 187,271
Short-term borrowings 0 3,829 548 0 4,377
Long-term debt 0 69,623 29,748 0 99,371
Other liabilities 0 26,051 1,598 (76) 27,573
Total liabilities at fair value 140,568 856,375 52,714 (495,319) 554,338
Net assets/liabilities at fair value 123,976 64,002 61,219 (10,334) 2 238,863
1 Derivative contracts are reported on a gross basis by level. The impact of netting represents an adjustment related to counterparty netting. 2 In accordance with the provisions of FSP
FIN 39-1, the Group offset cash collateral receivables and payables of CHF 26.1 billion and CHF 15.8 billion, respectively, as of the end of 9M08 against the derivative positions. The
Group adopted the provisions of FSP FIN 39-1 on a prospective basis as of January 1, 2008.
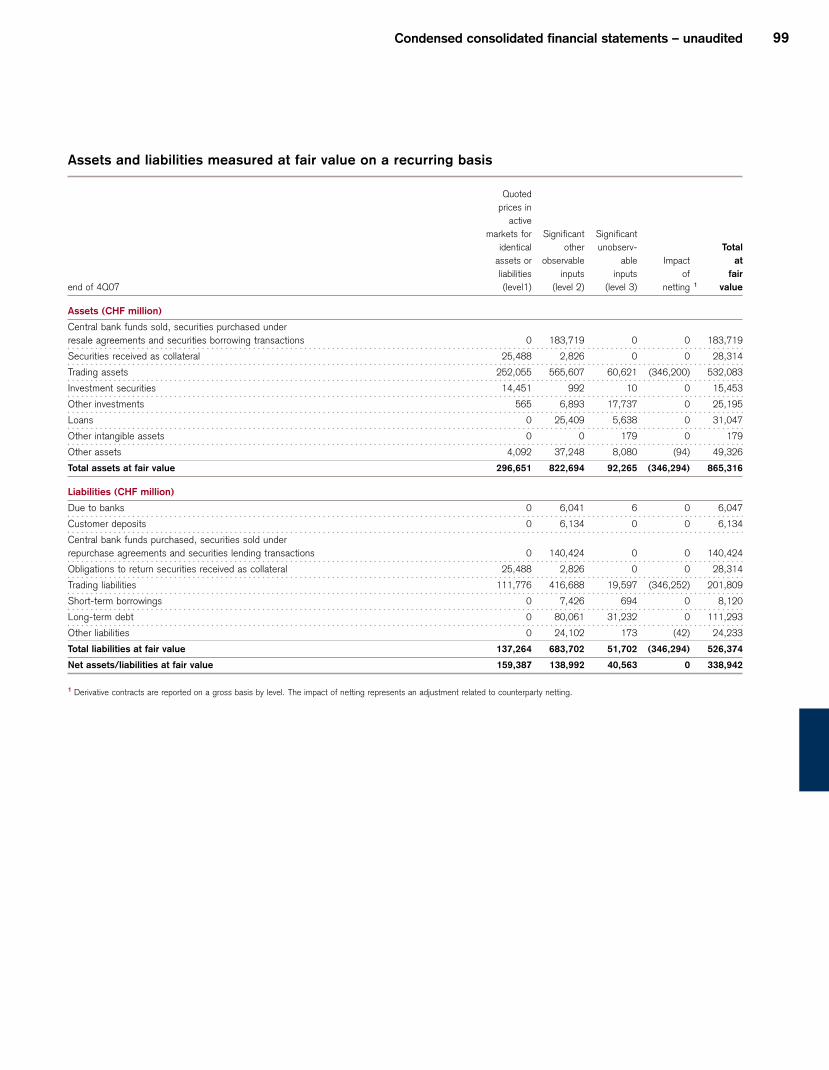
Condensed consolidated financial statements – unaudited 99
Assets and liabilities measured at fair value on a recurring basis
Quoted
prices in
active
markets for Significant Significant
identical other unobserv- Total
assets or observable able Impact at
liabilities inputs inputs of fair
end of 4Q07 (level1) (level 2) (level 3) netting 1 value
Assets (CHF million)
Central bank funds sold, securities purchased under
resale agreements and securities borrowing transactions 0 183,719 0 0 183,719
Securities received as collateral 25,488 2,826 0 0 28,314
Trading assets 252,055 565,607 60,621 (346,200) 532,083
Investment securities 14,451 992 10 0 15,453
Other investments 565 6,893 17,737 0 25,195
Loans 0 25,409 5,638 0 31,047
Other intangible assets 0 0 179 0 179
Other assets 4,092 37,248 8,080 (94) 49,326
Total assets at fair value 296,651 822,694 92,265 (346,294) 865,316
Liabilities (CHF million)
Due to banks 0 6,041 6 0 6,047
Customer deposits 0 6,134 0 0 6,134
Central bank funds purchased, securities sold under
repurchase agreements and securities lending transactions 0 140,424 0 0 140,424
Obligations to return securities received as collateral 25,488 2,826 0 0 28,314
Trading liabilities 111,776 416,688 19,597 (346,252) 201,809
Short-term borrowings 0 7,426 694 0 8,120
Long-term debt 0 80,061 31,232 0 111,293
Other liabilities 0 24,102 173 (42) 24,233
Total liabilities at fair value 137,264 683,702 51,702 (346,294) 526,374
Net assets/liabilities at fair value 159,387 138,992 40,563 0 338,942
1 Derivative contracts are reported on a gross basis by level. The impact of netting represents an adjustment related to counterparty netting.
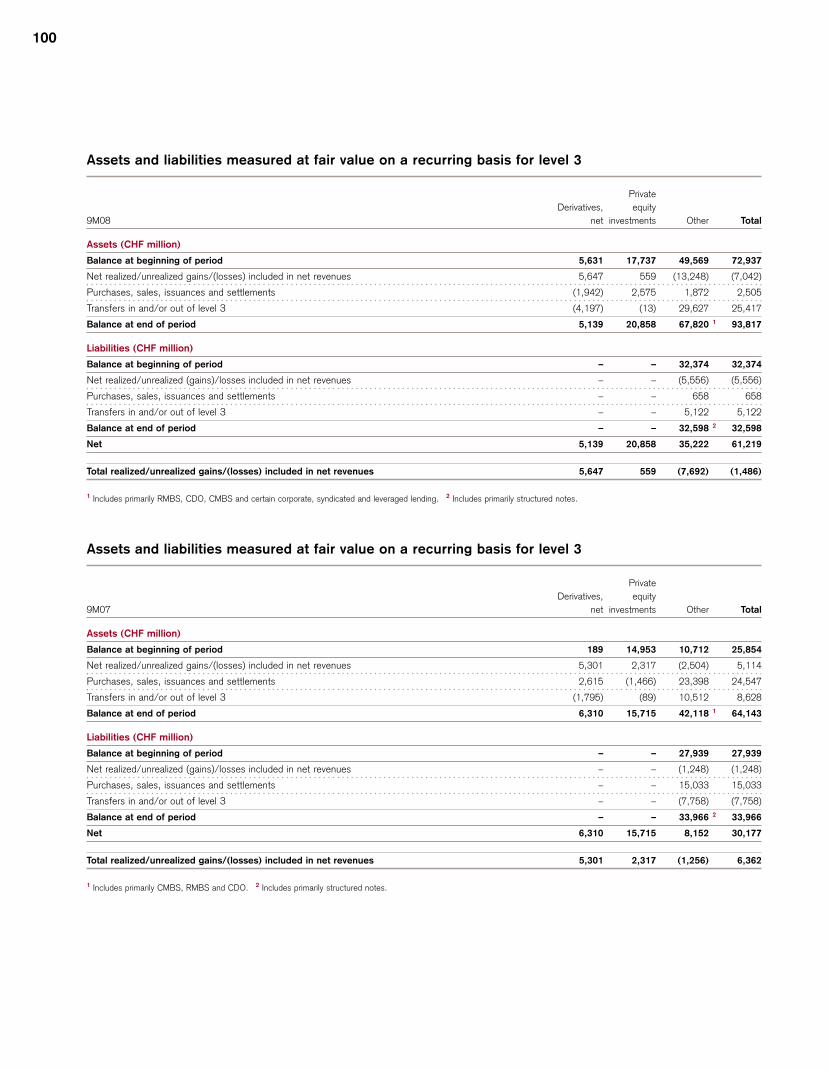
100
Assets and liabilities measured at fair value on a recurring basis for level 3
Private
Derivatives, equity
9M08 net investments Other Total
Assets (CHF million)
Balance at beginning of period 5,631 17,737 49,569 72,937
Net realized/unrealized gains/(losses) included in net revenues 5,647 559 (13,248) (7,042)
Purchases, sales, issuances and settlements (1,942) 2,575 1,872 2,505
Transfers in and/or out of level 3 (4,197) (13) 29,627 25,417
Balance at end of period 5,139 20,858 67,820 1 93,817
Liabilities (CHF million)
Balance at beginning of period – – 32,374 32,374
Net realized/unrealized (gains)/losses included in net revenues – – (5,556) (5,556)
Purchases, sales, issuances and settlements – – 658 658
Transfers in and/or out of level 3 – – 5,122 5,122
Balance at end of period – – 32,598 2 32,598
Net 5,139 20,858 35,222 61,219
Total realized/unrealized gains/(losses) included in net revenues 5,647 559 (7,692) (1,486)
1 Includes primarily RMBS, CDO, CMBS and certain corporate, syndicated and leveraged lending. 2 Includes primarily structured notes.
Assets and liabilities measured at fair value on a recurring basis for level 3
Private
Derivatives, equity
9M07 net investments Other Total
Assets (CHF million)
Balance at beginning of period 189 14,953 10,712 25,854
Net realized/unrealized gains/(losses) included in net revenues 5,301 2,317 (2,504) 5,114
Purchases, sales, issuances and settlements 2,615 (1,466) 23,398 24,547
Transfers in and/or out of level 3 (1,795) (89) 10,512 8,628
Balance at end of period 6,310 15,715 42,118 1 64,143
Liabilities (CHF million)
Balance at beginning of period – – 27,939 27,939
Net realized/unrealized (gains)/losses included in net revenues – – (1,248) (1,248)
Purchases, sales, issuances and settlements – – 15,033 15,033
Transfers in and/or out of level 3 – – (7,758) (7,758)
Balance at end of period – – 33,966 2 33,966
Net 6,310 15,715 8,152 30,177
Total realized/unrealized gains/(losses) included in net revenues 5,301 2,317 (1,256) 6,362
1 Includes primarily CMBS, RMBS and CDO. 2 Includes primarily structured notes.
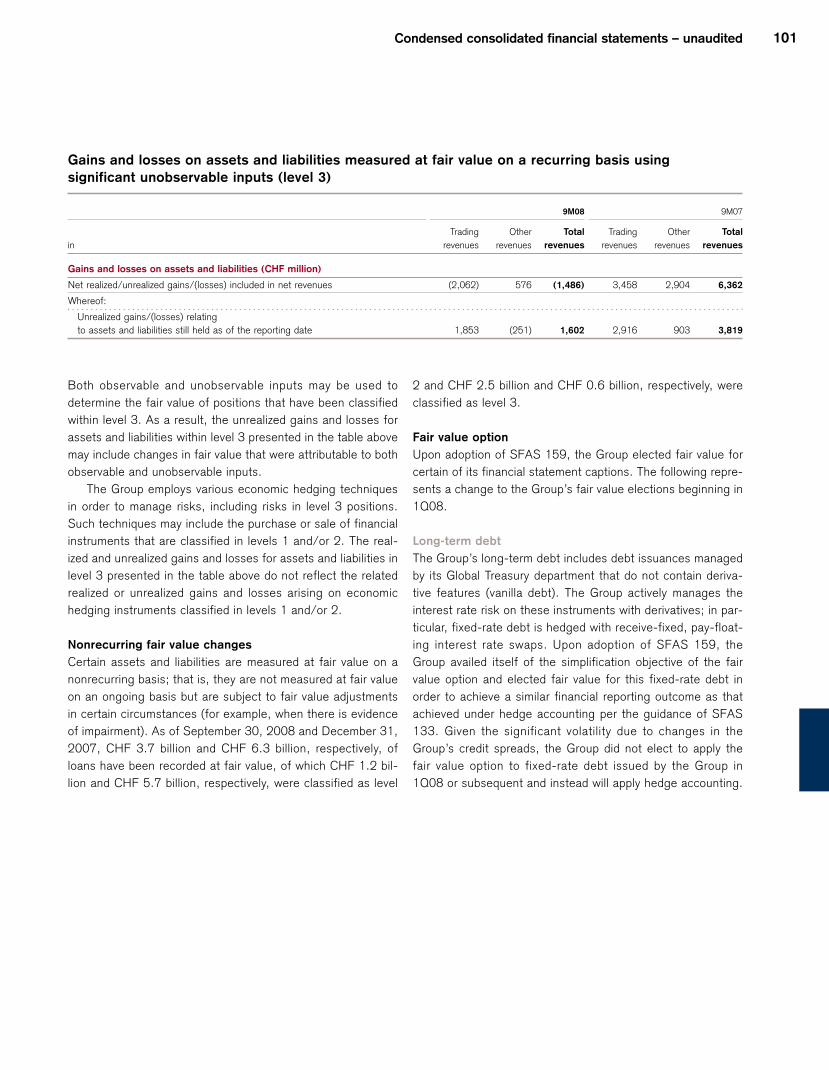
Condensed consolidated financial statements – unaudited 101
Gains and losses on assets and liabilities measured at fair value on a recurring basis using
significant unobservable inputs (level 3)
9M08 9M07
Trading Other Total Trading Other Total
in revenues revenues revenues revenues revenues revenues
Gains and losses on assets and liabilities (CHF million)
Net realized/unrealized gains/(losses) included in net revenues (2,062) 576 (1,486) 3,458 2,904 6,362
Whereof:
Unrealized gains/(losses) relating
to assets and liabilities still held as of the reporting date 1,853 (251) 1,602 2,916 903 3,819
Both observable and unobservable inputs may be used to
determine the fair value of positions that have been classified
within level 3. As a result, the unrealized gains and losses for
assets and liabilities within level 3 presented in the table above
may include changes in fair value that were attributable to both
observable and unobservable inputs.
The Group employs various economic hedging techniques
in order to manage risks, including risks in level 3 positions.
Such techniques may include the purchase or sale of financial
instruments that are classified in levels 1 and/or 2. The real-
ized and unrealized gains and losses for assets and liabilities in
level 3 presented in the table above do not reflect the related
realized or unrealized gains and losses arising on economic
hedging instruments classified in levels 1 and/or 2.
Nonrecurring fair value changes
Certain assets and liabilities are measured at fair value on a
nonrecurring basis; that is, they are not measured at fair value
on an ongoing basis but are subject to fair value adjustments
in certain circumstances (for example, when there is evidence
of impairment). As of September 30, 2008 and December 31,
2007, CHF 3.7 billion and CHF 6.3 billion, respectively, of
loans have been recorded at fair value, of which CHF 1.2 bil-
lion and CHF 5.7 billion, respectively, were classified as level
2 and CHF 2.5 billion and CHF 0.6 billion, respectively, were
classified as level 3.
Fair value option
Upon adoption of SFAS 159, the Group elected fair value for
certain of its financial statement captions. The following repre-
sents a change to the Group’s fair value elections beginning in
1Q08.
Long-term debt
The Group’s long-term debt includes debt issuances managed
by its Global Treasury department that do not contain deriva-
tive features (vanilla debt). The Group actively manages the
interest rate risk on these instruments with derivatives; in par-
ticular, fixed-rate debt is hedged with receive-fixed, pay-float-
ing interest rate swaps. Upon adoption of SFAS 159, the
Group availed itself of the simplification objective of the fair
value option and elected fair value for this fixed-rate debt in
order to achieve a similar financial reporting outcome as that
achieved under hedge accounting per the guidance of SFAS
133. Given the significant volatility due to changes in the
Group’s credit spreads, the Group did not elect to apply the
fair value option to fixed-rate debt issued by the Group in
1Q08 or subsequent and instead will apply hedge accounting.

102
Difference between the aggregate fair value and the aggregate unpaid principal balances of loans
and financial instruments
3Q08 4Q07
Aggregate Aggregate Aggregate Aggregate
fair unpaid fair unpaid
end of value principal Difference value principal Difference
Loans (CHF million)
Non-performing loans (90 days or more past due) 216 302 (86) 0 0 0
Non-accrual loans 592 1,048 (456) 232 459 (227)
Financial instruments (CHF million)
Central bank funds sold, securities purchased under
resale agreements and securities borrowing transactions 183,815 183,363 452 183,719 183,303 416
Loans 36,194 37,949 (1,755) 31,047 31,517 (470)
Other assets 29,063 34,827 (5,764) 33,936 35,420 (1,484)
Due to banks and customer deposits (1,515) (1,556) 41 (5,902) (5,895) (7)
Central bank funds purchased, securities sold under
repurchase agreements and securities lending transactions (184,814) (184,813) (1) (140,424) (140,436) 12
Short-term borrowings (4,377) (4,900) 523 (8,120) (8,409) 289
Long-term debt (99,371) (113,761) 14,390 (111,293) (111,595) 302
Other liabilities (4,994) (5,058) 64 (3,648) (3,646) (2)
Gains and losses on financial instruments
9M08 9M07
Net Net
gains/ gains/
in (losses) (losses)
Financial instruments (CHF million)
Central bank funds sold, securities purchased under
resale agreements and securities borrowing transactions 8,750 1 11,044 1
Trading loans 9 2 155 1
of which related to credit risk 0 13
Other investments (227) 3 125 2
Loans (994) 2 984 1
of which related to credit risk (1,322) (215)
Other assets (4,186) 2 909 1
of which related to credit risk (5,810) (511)
Due to banks and customer deposits (57) 1 (194) 1
of which related to credit risk 28 9
Central bank funds purchased, securities sold under
repurchase agreements and securities lending transactions (7,262) 1 (9,100) 1
Short-term borrowings 161 2 (89) 1
Long-term debt 9,486 2 (3,971) 2
of which related to credit risk 2,938 663
Other liabilities (1,292) 2 (668) 2
of which related to credit risk (1,075) (668)
1 Primarily recognized in net interest income. 2 Primarily recognized in trading revenues. 3 Primarily recognized in other revenues.
Condensed consolidated financial statements – unaudited 103
Note 22 Subsidiary guarantee information
On March 26, 2007, the Group and the Bank issued full,
unconditional and several guarantees of Credit Suisse (USA),
Inc.’s outstanding US SEC-registered debt securities. In
accordance with the guarantees, if Credit Suisse (USA), Inc.
fails to make any timely payment under the agreements gov-
erning such debt securities, the holders of the debt securities
may demand payment from either the Group or the Bank,
without first proceeding against Credit Suisse (USA), Inc. The
guarantee from the Group is subordinated to senior liabilities.
Credit Suisse (USA), Inc. is an indirect, wholly owned sub-
sidiary of the Group.
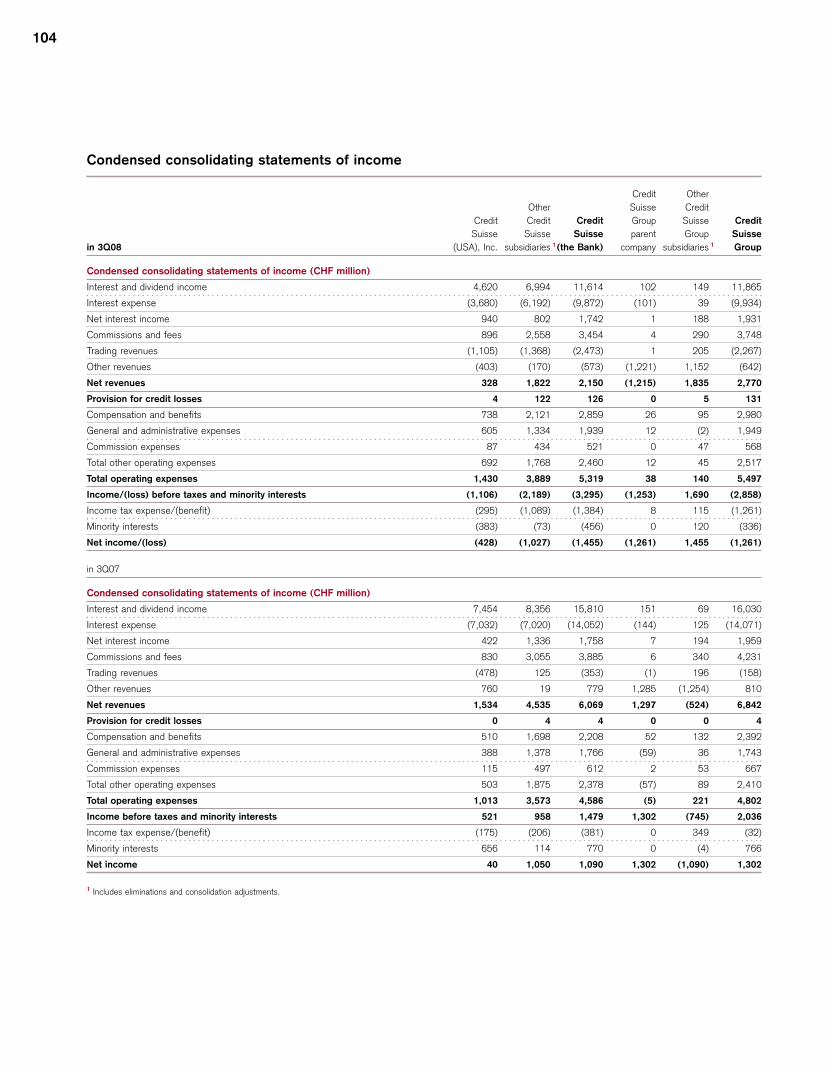
104
Condensed consolidating statements of income
Credit Other
Other Suisse Credit
Credit Credit Credit Group Suisse Credit
Suisse Suisse Suisse parent Group Suisse
in 3Q08 (USA), Inc. subsidiaries 1(the Bank) company subsidiaries 1 Group
Condensed consolidating statements of income (CHF million)
Interest and dividend income 4,620 6,994 11,614 102 149 11,865
Interest expense (3,680) (6,192) (9,872) (101) 39 (9,934)
Net interest income 940 802 1,742 1 188 1,931
Commissions and fees 896 2,558 3,454 4 290 3,748
Trading revenues (1,105) (1,368) (2,473) 1 205 (2,267)
Other revenues (403) (170) (573) (1,221) 1,152 (642)
Net revenues 328 1,822 2,150 (1,215) 1,835 2,770
Provision for credit losses 4 122 126 0 5 131
Compensation and benefits 738 2,121 2,859 26 95 2,980
General and administrative expenses 605 1,334 1,939 12 (2) 1,949
Commission expenses 87 434 521 0 47 568
Total other operating expenses 692 1,768 2,460 12 45 2,517
Total operating expenses 1,430 3,889 5,319 38 140 5,497
Income/(loss) before taxes and minority interests (1,106) (2,189) (3,295) (1,253) 1,690 (2,858)
Income tax expense/(benefit) (295) (1,089) (1,384) 8 115 (1,261)
Minority interests (383) (73) (456) 0 120 (336)
Net income/(loss) (428) (1,027) (1,455) (1,261) 1,455 (1,261)
in 3Q07
Condensed consolidating statements of income (CHF million)
Interest and dividend income 7,454 8,356 15,810 151 69 16,030
Interest expense (7,032) (7,020) (14,052) (144) 125 (14,071)
Net interest income 422 1,336 1,758 7 194 1,959
Commissions and fees 830 3,055 3,885 6 340 4,231
Trading revenues (478) 125 (353) (1) 196 (158)
Other revenues 760 19 779 1,285 (1,254) 810
Net revenues 1,534 4,535 6,069 1,297 (524) 6,842
Provision for credit losses 0 4 4 0 0 4
Compensation and benefits 510 1,698 2,208 52 132 2,392
General and administrative expenses 388 1,378 1,766 (59) 36 1,743
Commission expenses 115 497 612 2 53 667
Total other operating expenses 503 1,875 2,378 (57) 89 2,410
Total operating expenses 1,013 3,573 4,586 (5) 221 4,802
Income before taxes and minority interests 521 958 1,479 1,302 (745) 2,036
Income tax expense/(benefit) (175) (206) (381) 0 349 (32)
Minority interests 656 114 770 0 (4) 766
Net income 40 1,050 1,090 1,302 (1,090) 1,302
1 Includes eliminations and consolidation adjustments.
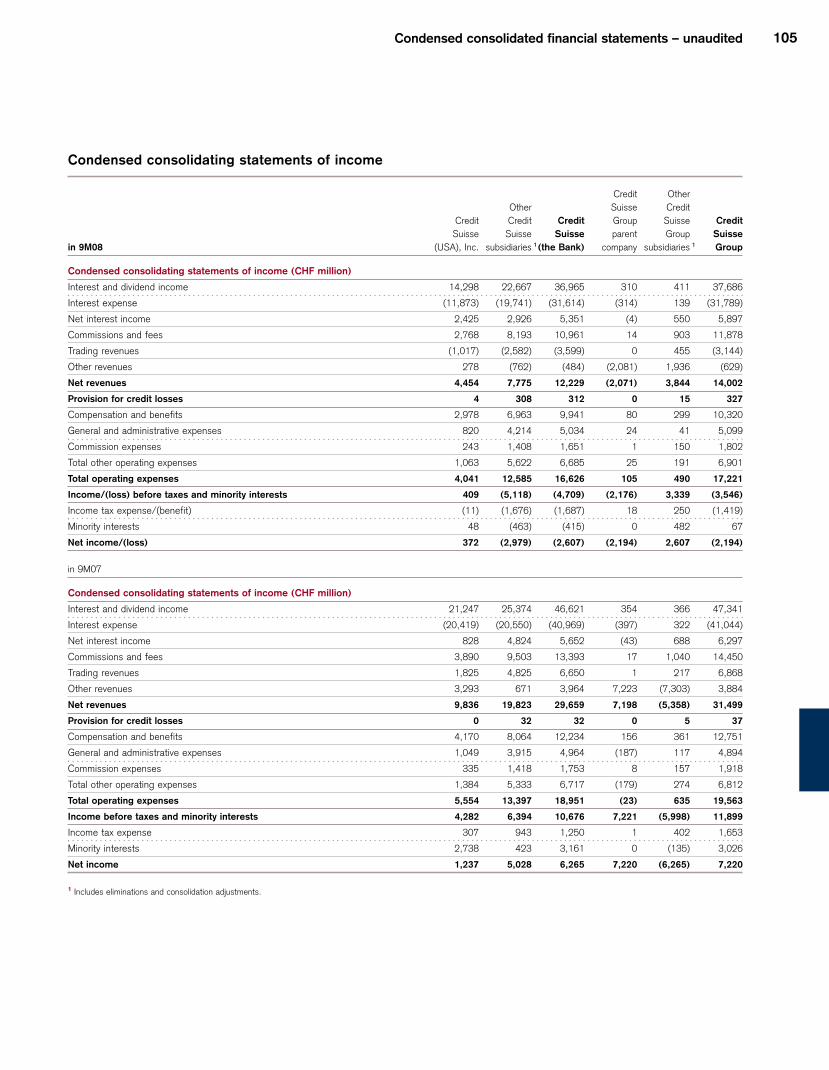
Condensed consolidated financial statements – unaudited 105
Condensed consolidating statements of income
Credit Other
Other Suisse Credit
Credit Credit Credit Group Suisse Credit
Suisse Suisse Suisse parent Group Suisse
in 9M08 (USA), Inc. subsidiaries 1(the Bank) company subsidiaries 1 Group
Condensed consolidating statements of income (CHF million)
Interest and dividend income 14,298 22,667 36,965 310 411 37,686
Interest expense (11,873) (19,741) (31,614) (314) 139 (31,789)
Net interest income 2,425 2,926 5,351 (4) 550 5,897
Commissions and fees 2,768 8,193 10,961 14 903 11,878
Trading revenues (1,017) (2,582) (3,599) 0 455 (3,144)
Other revenues 278 (762) (484) (2,081) 1,936 (629)
Net revenues 4,454 7,775 12,229 (2,071) 3,844 14,002
Provision for credit losses 4 308 312 0 15 327
Compensation and benefits 2,978 6,963 9,941 80 299 10,320
General and administrative expenses 820 4,214 5,034 24 41 5,099
Commission expenses 243 1,408 1,651 1 150 1,802
Total other operating expenses 1,063 5,622 6,685 25 191 6,901
Total operating expenses 4,041 12,585 16,626 105 490 17,221
Income/(loss) before taxes and minority interests 409 (5,118) (4,709) (2,176) 3,339 (3,546)
Income tax expense/(benefit) (11) (1,676) (1,687) 18 250 (1,419)
Minority interests 48 (463) (415) 0 482 67
Net income/(loss) 372 (2,979) (2,607) (2,194) 2,607 (2,194)
in 9M07
Condensed consolidating statements of income (CHF million)
Interest and dividend income 21,247 25,374 46,621 354 366 47,341
Interest expense (20,419) (20,550) (40,969) (397) 322 (41,044)
Net interest income 828 4,824 5,652 (43) 688 6,297
Commissions and fees 3,890 9,503 13,393 17 1,040 14,450
Trading revenues 1,825 4,825 6,650 1 217 6,868
Other revenues 3,293 671 3,964 7,223 (7,303) 3,884
Net revenues 9,836 19,823 29,659 7,198 (5,358) 31,499
Provision for credit losses 0 32 32 0 5 37
Compensation and benefits 4,170 8,064 12,234 156 361 12,751
General and administrative expenses 1,049 3,915 4,964 (187) 117 4,894
Commission expenses 335 1,418 1,753 8 157 1,918
Total other operating expenses 1,384 5,333 6,717 (179) 274 6,812
Total operating expenses 5,554 13,397 18,951 (23) 635 19,563
Income before taxes and minority interests 4,282 6,394 10,676 7,221 (5,998) 11,899
Income tax expense 307 943 1,250 1 402 1,653
Minority interests 2,738 423 3,161 0 (135) 3,026
Net income 1,237 5,028 6,265 7,220 (6,265) 7,220
1 Includes eliminations and consolidation adjustments.
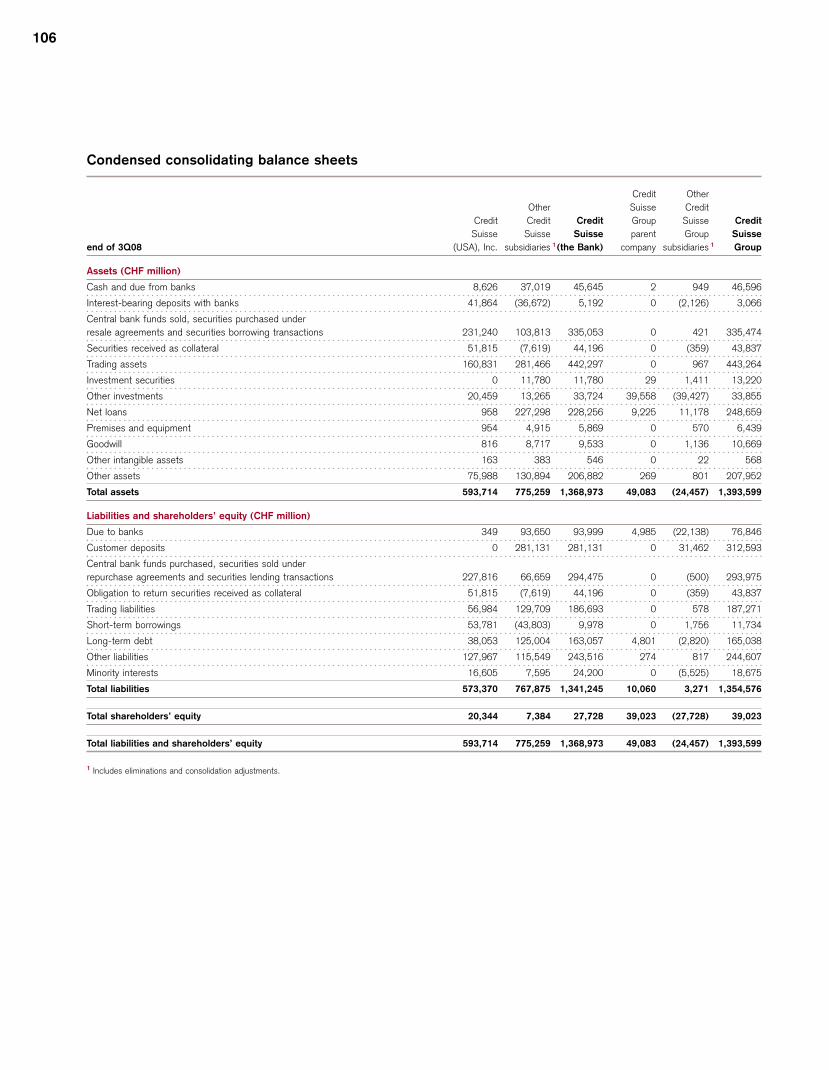
106
Condensed consolidating balance sheets
Credit Other
Other Suisse Credit
Credit Credit Credit Group Suisse Credit
Suisse Suisse Suisse parent Group Suisse
end of 3Q08 (USA), Inc. subsidiaries 1(the Bank) company subsidiaries 1 Group
Assets (CHF million)
Cash and due from banks 8,626 37,019 45,645 2 949 46,596
Interest-bearing deposits with banks 41,864 (36,672) 5,192 0 (2,126) 3,066
Central bank funds sold, securities purchased under
resale agreements and securities borrowing transactions 231,240 103,813 335,053 0 421 335,474
Securities received as collateral 51,815 (7,619) 44,196 0 (359) 43,837
Trading assets 160,831 281,466 442,297 0 967 443,264
Investment securities 0 11,780 11,780 29 1,411 13,220
Other investments 20,459 13,265 33,724 39,558 (39,427) 33,855
Net loans 958 227,298 228,256 9,225 11,178 248,659
Premises and equipment 954 4,915 5,869 0 570 6,439
Goodwill 816 8,717 9,533 0 1,136 10,669
Other intangible assets 163 383 546 0 22 568
Other assets 75,988 130,894 206,882 269 801 207,952
Total assets 593,714 775,259 1,368,973 49,083 (24,457) 1,393,599
Liabilities and shareholders’ equity (CHF million)
Due to banks 349 93,650 93,999 4,985 (22,138) 76,846
Customer deposits 0 281,131 281,131 0 31,462 312,593
Central bank funds purchased, securities sold under
repurchase agreements and securities lending transactions 227,816 66,659 294,475 0 (500) 293,975
Obligation to return securities received as collateral 51,815 (7,619) 44,196 0 (359) 43,837
Trading liabilities 56,984 129,709 186,693 0 578 187,271
Short-term borrowings 53,781 (43,803) 9,978 0 1,756 11,734
Long-term debt 38,053 125,004 163,057 4,801 (2,820) 165,038
Other liabilities 127,967 115,549 243,516 274 817 244,607
Minority interests 16,605 7,595 24,200 0 (5,525) 18,675
Total liabilities 573,370 767,875 1,341,245 10,060 3,271 1,354,576
Total shareholders’ equity 20,344 7,384 27,728 39,023 (27,728) 39,023
Total liabilities and shareholders’ equity 593,714 775,259 1,368,973 49,083 (24,457) 1,393,599
1 Includes eliminations and consolidation adjustments.
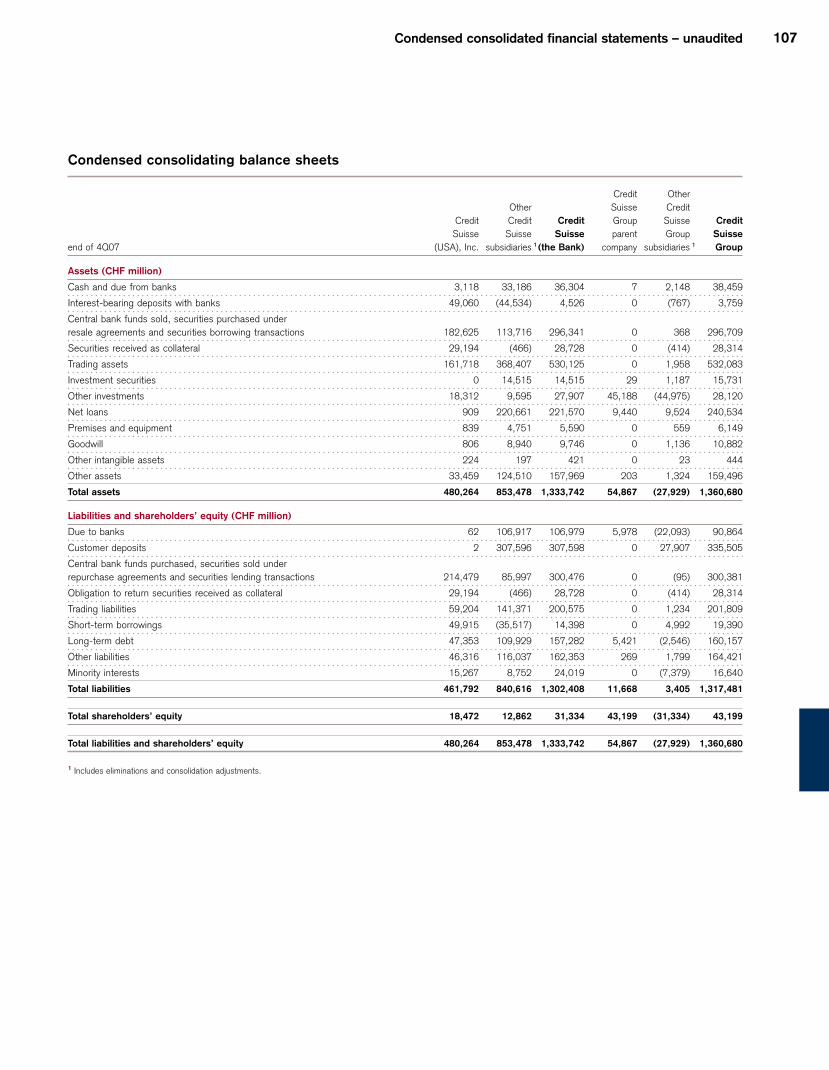
Condensed consolidated financial statements – unaudited 107
Condensed consolidating balance sheets
Credit Other
Other Suisse Credit
Credit Credit Credit Group Suisse Credit
Suisse Suisse Suisse parent Group Suisse
end of 4Q07 (USA), Inc. subsidiaries 1(the Bank) company subsidiaries 1 Group
Assets (CHF million)
Cash and due from banks 3,118 33,186 36,304 7 2,148 38,459
Interest-bearing deposits with banks 49,060 (44,534) 4,526 0 (767) 3,759
Central bank funds sold, securities purchased under
resale agreements and securities borrowing transactions 182,625 113,716 296,341 0 368 296,709
Securities received as collateral 29,194 (466) 28,728 0 (414) 28,314
Trading assets 161,718 368,407 530,125 0 1,958 532,083
Investment securities 0 14,515 14,515 29 1,187 15,731
Other investments 18,312 9,595 27,907 45,188 (44,975) 28,120
Net loans 909 220,661 221,570 9,440 9,524 240,534
Premises and equipment 839 4,751 5,590 0 559 6,149
Goodwill 806 8,940 9,746 0 1,136 10,882
Other intangible assets 224 197 421 0 23 444
Other assets 33,459 124,510 157,969 203 1,324 159,496
Total assets 480,264 853,478 1,333,742 54,867 (27,929) 1,360,680
Liabilities and shareholders’ equity (CHF million)
Due to banks 62 106,917 106,979 5,978 (22,093) 90,864
Customer deposits 2 307,596 307,598 0 27,907 335,505
Central bank funds purchased, securities sold under
repurchase agreements and securities lending transactions 214,479 85,997 300,476 0 (95) 300,381
Obligation to return securities received as collateral 29,194 (466) 28,728 0 (414) 28,314
Trading liabilities 59,204 141,371 200,575 0 1,234 201,809
Short-term borrowings 49,915 (35,517) 14,398 0 4,992 19,390
Long-term debt 47,353 109,929 157,282 5,421 (2,546) 160,157
Other liabilities 46,316 116,037 162,353 269 1,799 164,421
Minority interests 15,267 8,752 24,019 0 (7,379) 16,640
Total liabilities 461,792 840,616 1,302,408 11,668 3,405 1,317,481
Total shareholders’ equity 18,472 12,862 31,334 43,199 (31,334) 43,199
Total liabilities and shareholders’ equity 480,264 853,478 1,333,742 54,867 (27,929) 1,360,680
1 Includes eliminations and consolidation adjustments.

108
Note 23 Litigation
In accordance with SFAS No. 5, “Accounting for Contingen-
cies”, the Group has litigation reserves for private litigation
involving Enron, certain IPO allocation practices, research
analyst independence and other related litigation of CHF 0.5
billion (USD 0.4 billion) as of September 30, 2008, after
deductions for settlements. In the third quarter of 2008, the
Group released CHF 73 million of the reserve for these private
litigation matters due to recent developments.
The Group is involved in a number of other judicial, regula-
tory and arbitration proceedings concerning matters arising in
connection with the conduct of its businesses. Some of these
actions have been brought on behalf of various classes of
claimants and seek damages of material and/or indeterminate
amounts. The Group believes, based on currently available
information and advice of counsel, that the results of such pro-
ceedings, in the aggregate, will not have a material adverse
effect on its financial condition but might be material to oper-
ating results for any particular period, depending, in part, upon
the operating results for such period. In respect of each of the
matters described above, each of which consists of a number
of claims, it is the Group’s belief that the reasonably possible
losses relating to such claims in excess of its provisions are
either not material or not estimable.
It is inherently difficult to predict the outcome of many of
these matters. In presenting the condensed consolidated
financial statements, management makes estimates regarding
the outcome of these matters, records a reserve and takes a
charge to income when losses with respect to such matters
are probable and can be reasonably estimated. Estimates, by
their nature, are based on judgment and currently available
information and involve a variety of factors, including, but not
limited to, the type and nature of the litigation, claim or pro-
ceeding, the progress of the matter, the advice of legal coun-
sel, the Group’s defenses and its experience in similar cases
or proceedings, as well as its assessment of matters, including
settlements, involving other defendants in similar or related
cases or proceedings.
Further charges or releases of litigation reserves may be
necessary in the future as developments in such litigation,
claims or proceedings warrant.
VI110 Investor informationInvestor information
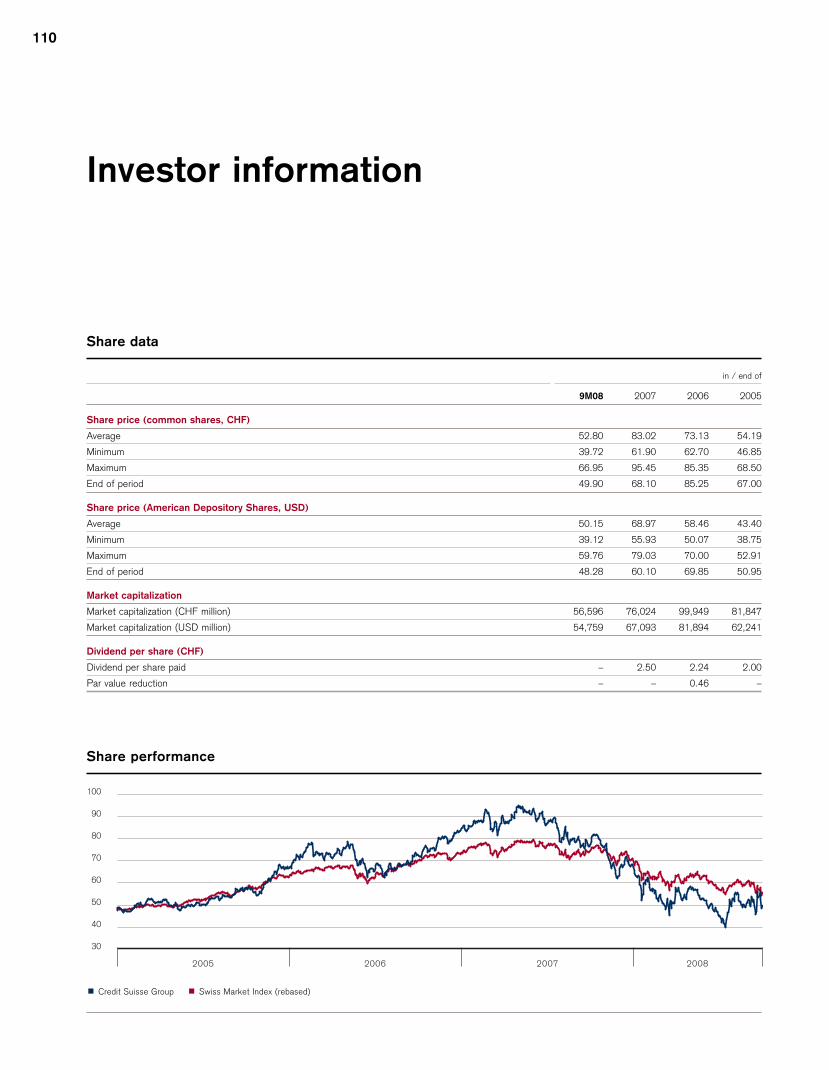
110
Share data
in / end of
9M08 2007 2006 2005
Share price (common shares, CHF)
Average 52.80 83.02 73.13 54.19
Minimum 39.72 61.90 62.70 46.85
Maximum 66.95 95.45 85.35 68.50
End of period 49.90 68.10 85.25 67.00
Share price (American Depository Shares, USD)
Average 50.15 68.97 58.46 43.40
Minimum 39.12 55.93 50.07 38.75
Maximum 59.76 79.03 70.00 52.91
End of period 48.28 60.10 69.85 50.95
Market capitalization
Market capitalization (CHF million) 56,596 76,024 99,949 81,847
Market capitalization (USD million) 54,759 67,093 81,894 62,241
Dividend per share (CHF)
Dividend per share paid – 2.50 2.24 2.00
Par value reduction – – 0.46 –
Investor information
2005 2006 2007 2008
30
40
50
60
70
80
90
100
Share performance
p Credit Suisse Group p Swiss Market Index (rebased)
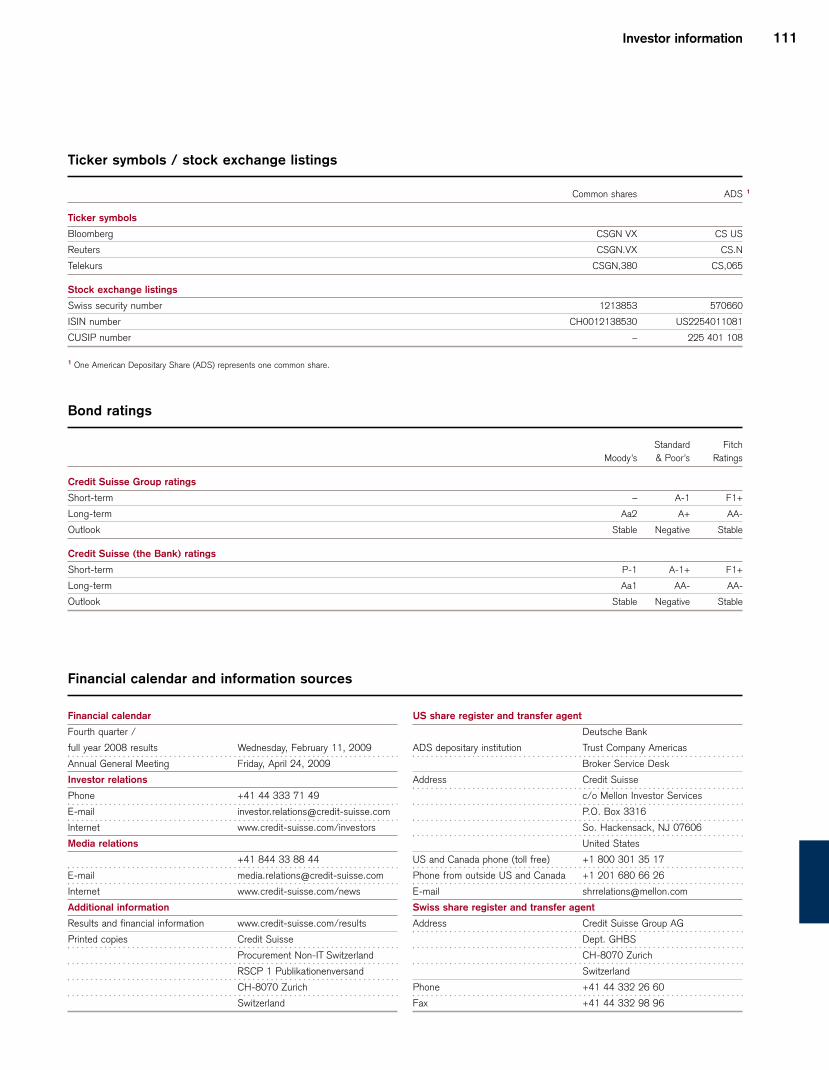
Investor information 111
Ticker symbols / stock exchange listings
Common shares ADS 1
Ticker symbols
Bloomberg CSGN VX CS US
Reuters CSGN.VX CS.N
Telekurs CSGN,380 CS,065
Stock exchange listings
Swiss security number 1213853 570660
ISIN number CH0012138530 US2254011081
CUSIP number – 225 401 108
1 One American Depositary Share (ADS) represents one common share.
Bond ratings
Standard Fitch
Moody’s & Poor’s Ratings
Credit Suisse Group ratings
Short-term – A-1 F1+
Long-term Aa2 A+ AA-
Outlook Stable Negative Stable
Credit Suisse (the Bank) ratings
Short-term P-1 A-1+ F1+
Long-term Aa1 AA- AA-
Outlook Stable Negative Stable
Financial calendar and information sources
Financial calendar
Fourth quarter /
full year 2008 results Wednesday, February 11, 2009
Annual General Meeting Friday, April 24, 2009
Investor relations
Phone +41 44 333 71 49
E-mail [email protected]
Internet www.credit-suisse.com/investors
Media relations
+41 844 33 88 44
E-mail [email protected]
Internet www.credit-suisse.com/news
Additional information
Results and financial information www.credit-suisse.com/results
Printed copies Credit Suisse
Procurement Non-IT Switzerland
RSCP 1 Publikationenversand
CH-8070 Zurich
Switzerland
US share register and transfer agent
Deutsche Bank
ADS depositary institution Trust Company Americas
Broker Service Desk
Address Credit Suisse
c/o Mellon Investor Services
P.O. Box 3316
So. Hackensack, NJ 07606
United States
US and Canada phone (toll free) +1 800 301 35 17
Phone from outside US and Canada +1 201 680 66 26
E-mail [email protected]
Swiss share register and transfer agent
Address Credit Suisse Group AG
Dept. GHBS
CH-8070 Zurich
Switzerland
Phone +41 44 332 26 60
Fax +41 44 332 98 96

112
Cautionary statement regarding forward-looking information
This report contains statements that constitute forward-looking state-
ments within the meaning of the Private Securities Litigation Reform
Act. In addition, in the future we, and others on our behalf, may make
statements that constitute forward-looking statements. Such forward-
looking statements may include, without limitation, statements relating
to the following:
p our plans, objectives or goals;
p our future economic performance or prospects;
p the potential effect on our future performance of certain contingencies;
and
p assumptions underlying any such statements.
Words such as “believes,” “anticipates,” “expects,” “intends” and “plans”
and similar expressions are intended to identify forward-looking state-
ments but are not the exclusive means of identifying such statements.
We do not intend to update these forward-looking statements except as
may be required by applicable securities laws.
By their very nature, forward-looking statements involve inherent risks
and uncertainties, both general and specific, and risks exist that predictions,
forecasts, projections and other outcomes described or implied in forward-
looking statements will not be achieved. We caution you that a number of
important factors could cause results to differ materially from the plans,
objectives, expectations, estimates and intentions expressed in such for-
ward-looking statements. These factors include:
p the ability to maintain sufficient liquidity and access capital markets;
p market and interest rate fluctuations;
p the strength of the global economy in general and the strength of the
economies of the countries in which we conduct our operations, in partic-
ular the risk of a continued US or global economic downturn in 2008 and
beyond;
p the direct and indirect impacts of continuing deterioration of subprime
and other real estate markets;
p further adverse rating actions by credit rating agencies in respect of
structured credit products or other credit-related exposures or of mono-
line insurers;
p the ability of counterparties to meet their obligations to us;
p the effects of, and changes in, fiscal, monetary, trade and tax policies,
and currency fluctuations;
p political and social developments, including war, civil unrest or terrorist
activity;
p the possibility of foreign exchange controls, expropriation, nationalization
or confiscation of assets in countries in which we conduct our operations;
p operational factors such as systems failure, human error, or the failure to
implement procedures properly;
p actions taken by regulators with respect to our business and practices in
one or more of the countries in which we conduct our operations;
p the effects of changes in laws, regulations or accounting policies or prac-
tices;
p competition in geographic and business areas in which we conduct our
operations;
p the ability to retain and recruit qualified personnel;
p the ability to maintain our reputation and promote our brand;
p the ability to increase market share and control expenses;
p technological changes;
p the timely development and acceptance of our new products and services
and the perceived overall value of these products and services by users;
p acquisitions, including the ability to integrate acquired businesses suc-
cessfully, and divestitures, including the ability to sell non-core assets;
p the adverse resolution of litigation and other contingencies; and
p our success at managing the risks involved in the foregoing.
We caution you that the foregoing list of important factors is not exclu-
sive. When evaluating forward-looking statements, you should carefully
consider the foregoing factors and other uncertainties and events, as
well as the information set forth in our Form 20-F Item 3 – Key Infor-
mation – Risk Factors.
Foreign currency translation rates
in / end of % change
3Q08 2Q08 4Q07 3Q07 QoQ Ytd YoY
Average rate
1 USD / 1 CHF 1.07 1.02 1.15 1.20 5 (7) (11)
1 EUR / 1 CHF 1.61 1.60 1.66 1.65 1 (3) (2)
1 GBP / 1 CHF 2.03 2.03 2.34 2.43 0 (13) (16)
100 JPY / 1 CHF 1.00 0.99 1.01 1.02 1 (1) (2)
Closing rate
1 USD / 1 CHF 1.12 1.02 1.13 1.17 10 (1) (4)
1 EUR / 1 CHF 1.57 1.60 1.66 1.66 (2) (5) (5)
1 GBP / 1 CHF 2.00 2.03 2.25 2.38 (1) (11) (16)
100 JPY / 1 CHF 1.06 0.96 1.00 1.02 10 6 4
Design: www.arnold.inhaltundform.com
Production: Management Digital Data AG, Zurich
Printer: NZZ Fretz AG, Zurich
For a detailed presentation of Credit Suisse Group’s financial statements2007, its company structure, risk management, corporate governance andan in-depth review of its operating and financial results, please refer to theAnnual Report 2007. For a summary of our performance during the business year and a close look at innovation through examples from variousareas of the bank, refer to our Business Review 2007. For information on how the Bank assumes its responsibilities when conducting its businessactivities, including its commitments toward the environment and variousstakeholders within society, refer to the Corporate Citizenship Report 2007.
New Perspectives
Annual Report
2007
New Perspectives
Business Review
2007
New Perspectives
Corporate CitizenshipReport
2007
CREDIT SUISSE GROUP AG
Paradeplatz 8
8070 Zurich
Switzerland
Phone +41 44 212 16 16
www.credit-suisse.com 55
20
14
4 E
nglis
h