credit-suisse corrected financial
TRANSCRIPT
2003Q4 FINANCIAL REPORTAND FULL-YEAR CORRECTED
Cautionary statement regarding forward-looking informationThis Report contains statements that constitute forward-looking statements. In addition, in the future we, and others on our behalf, may make statements that constituteforward-looking statements. Such forward-looking statements may include, without limitation, statements relating to our plans, objectives or goals; our future economicperformance or prospects; the potential effect on our future performance of certain contingencies; and assumptions underlying any such statements.
Words such as "believes," "anticipates," "expects," "intends" and "plans" and similar expressions are intended to identify forward-looking statements but are not theexclusive means of identifying such statements. We do not intend to update these forward-looking statements except as may be required by applicable laws.
By their very nature, forward-looking statements involve inherent risks and uncertainties, both general and specific, and risks exist that predictions, forecasts,projections and other outcomes described or implied in forward-looking statements will not be achieved. We caution you that a number of important factors could causeresults to differ materially from the plans, objectives, expectations, estimates and intentions expressed in such forward-looking statements. These factors include (i)market and interest rate fluctuations; (ii) the strength of the global economy in general and the strength of the economies of the countries in which we conduct ouroperations in particular; (iii) the ability of counterparties to meet their obligations to us; (iv) the effects of, and changes in, fiscal, monetary, trade and tax policies, andcurrency fluctuations; (v) political and social developments, including war, civil unrest or terrorist activity; (vi) the possibility of foreign exchange controls, expropriation,nationalization or confiscation of assets in countries in which we conduct our operations; (vii) the ability to maintain sufficient liquidity and access capital markets; (viii)operational factors such as systems failure, human error, or the failure to properly implement procedures; (ix) actions taken by regulators with respect to our business andpractices in one or more of the countries in which we conduct our operations; (x) the effects of changes in laws, regulations or accounting policies or practices; (xi)competition in geographic and business areas in which we conduct our operations; (xii) the ability to retain and recruit qualified personnel; (xiii) the ability to maintain ourreputation and promote our brands; (xiv) the ability to increase market share and control expenses; (xv) technological changes; (xvi) the timely development andacceptance of our new products and services and the perceived overall value of these products and services by users; (xvii) acquisitions, including the ability to integratesuccessfully acquired businesses; (xviii) the adverse resolution of litigation and other contingencies; and (xix) our success at managing the risks involved in the foregoing.
We caution you that the foregoing list of important factors is not exclusive; when evaluating forward-looking statements, you should carefully consider the foregoingfactors and other uncertainties and events, as well as the risks identified in our most recently filed Form 20-F and reports on Form 6-K furnished to the US Securitiesand Exchange Commission.
Cautionary statement regarding non-GAAP financial informationThis Report contains non-GAAP financial information. A reconciliation of such non-GAAP financial information to the most directly comparable measures under generallyaccepted accounting principles is contained in this report and is posted on our website at www.credit-suisse.com/sec.html.
2 Credit Suisse Group financial highlights Q4/2003 4 Credit Suisse Group 7 Risk management 10 Credit Suisse Financial Services 19 Credit Suisse First Boston 28 Reconciliation of operating results to Swiss GAAP 33 Consolidated results Credit Suisse Group 33 Consolidated income statement 34 Consolidated balance sheet 41 Information for investors
www.credit-suisse.com 1
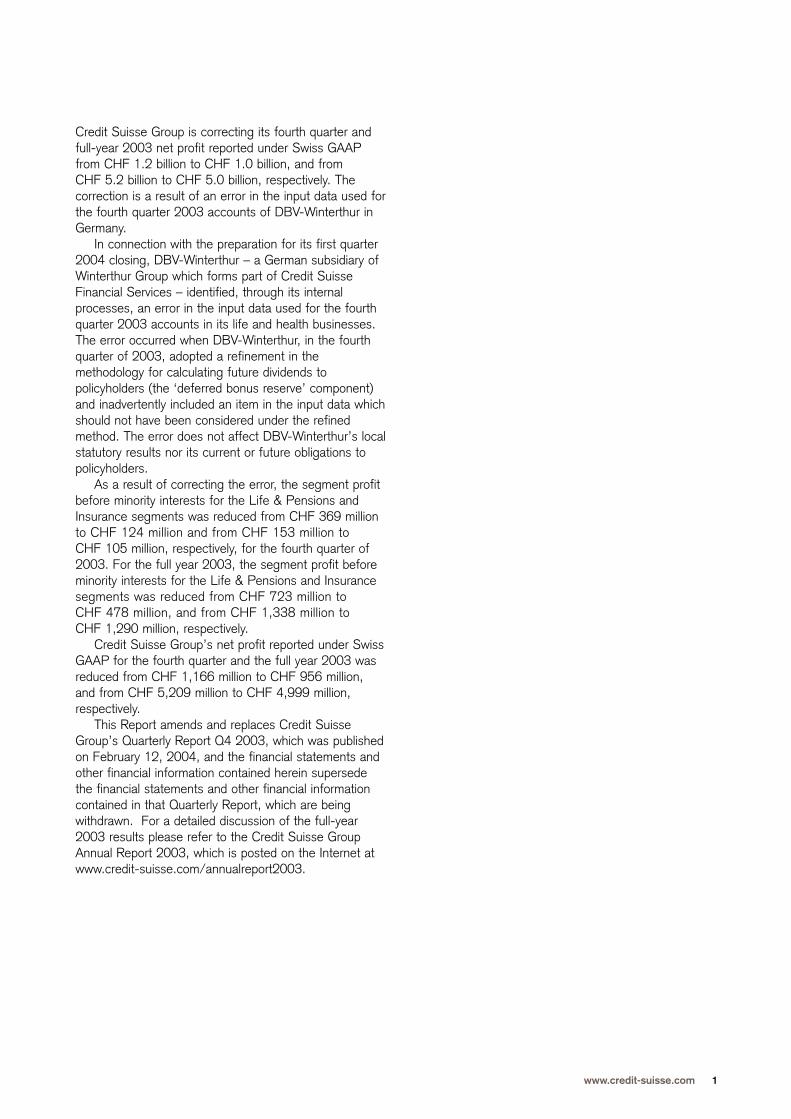
Credit Suisse Group is correcting its fourth quarter andfull-year 2003 net profit reported under Swiss GAAPfrom CHF 1.2 billion to CHF 1.0 billion, and from CHF 5.2 billion to CHF 5.0 billion, respectively. Thecorrection is a result of an error in the input data used forthe fourth quarter 2003 accounts of DBV-Winterthur inGermany.
In connection with the preparation for its first quarter2004 closing, DBV-Winterthur – a German subsidiary ofWinterthur Group which forms part of Credit SuisseFinancial Services – identified, through its internalprocesses, an error in the input data used for the fourthquarter 2003 accounts in its life and health businesses.The error occurred when DBV-Winterthur, in the fourthquarter of 2003, adopted a refinement in themethodology for calculating future dividends topolicyholders (the ‘deferred bonus reserve’ component)and inadvertently included an item in the input data whichshould not have been considered under the refinedmethod. The error does not affect DBV-Winterthur’s localstatutory results nor its current or future obligations topolicyholders.
As a result of correcting the error, the segment profitbefore minority interests for the Life & Pensions andInsurance segments was reduced from CHF 369 millionto CHF 124 million and from CHF 153 million to CHF 105 million, respectively, for the fourth quarter of2003. For the full year 2003, the segment profit beforeminority interests for the Life & Pensions and Insurancesegments was reduced from CHF 723 million to CHF 478 million, and from CHF 1,338 million to CHF 1,290 million, respectively.
Credit Suisse Group’s net profit reported under SwissGAAP for the fourth quarter and the full year 2003 wasreduced from CHF 1,166 million to CHF 956 million,and from CHF 5,209 million to CHF 4,999 million,respectively.
This Report amends and replaces Credit SuisseGroup’s Quarterly Report Q4 2003, which was publishedon February 12, 2004, and the financial statements andother financial information contained herein supersedethe financial statements and other financial informationcontained in that Quarterly Report, which are beingwithdrawn. For a detailed discussion of the full-year2003 results please refer to the Credit Suisse GroupAnnual Report 2003, which is posted on the Internet atwww.credit-suisse.com/annualreport2003.

CREDIT SUISSE GROUP F INANCIAL HIGHLIGHTS Q4/2003
2
For complete consolidated financial statements and notes please refer to the Credit Suisse Group Annual Report 2003, which is posted on the Internet at www.credit-suisse.com/annualreport2003.
Change Change Changein % from in % from in % from12 months
in CHF bn 4Q2003 3Q2003 4Q2002 3Q2003 4Q2002 2003 2002 2002
Net new assets 2.9 4.0 (6.3) (28) – 4.8 (1.4) –
1) Ratio is based on a tier 1 capital of CHF 12.1 bn (30.09.03: CHF 12.1 bn; 31.12.02: CHF 10.6 bn), of which non-cumulative perpetual preferred securities is CHF1.0 bn (30.09.03: CHF 1.0 bn; 31.12.02: CHF 1.0 bn). 2) Ratio is based on a tier 1 capital of CHF 22.3 bn (30.09.03: CHF 21.9 bn; 31.12.02: CHF 17.6 bn), ofwhich non-cumulative perpetual preferred securities is CHF 2.2 bn (30.09.03: CHF 2.2 bn; 31.12.02: CHF 2.2 bn).
Net new assets
Change Change Changein % from in % from in % from12 months
in CHF m 4Q2003 3Q2003 4Q2002 3Q2003 4Q2002 2003 2002 2002
Operating income 5,218 6,531 6,395 (20) (18) 26,322 28,038 (6)Gross operating profit 795 2,144 1,284 (63) (38) 7,421 4,509 65Net profit/(loss) 956 2,045 (950) (53) – 4,999 (3,309) –
Change Changein % from in % from
in CHF m 31.12.03 30.09.03 31.12.02 30.09.03 31.12.02
Total assets 962,164 994,555 955,656 (3) 1Shareholders’ equity 34,692 34,873 31,394 (1) 11Minority interests in shareholders’ equity 2,956 2,971 2,878 (1) 3
Change Changein % from in % from
in CHF m 31.12.03 30.09.03 31.12.02 30.09.03 31.12.02
BIS risk-weighted assets 190,761 197,412 196,486 (3) (3)BIS tier 1 capital 22,287 21,901 17,613 2 27
of which non-cumulative perpetual preferred securities 2,169 2,184 2,162 (1) 0BIS total capital 33,207 32,010 28,311 4 17
Capital data
in % 31.12.03 30.09.03 31.12.02
BIS tier 1 ratio Credit Suisse 8.2 7.6 7.4Credit Suisse First Boston 1) 13.6 12.2 10.3Credit Suisse Group 2) 11.7 11.1 9.0
BIS total capital ratio Credit Suisse Group 17.4 16.2 14.4
Capital ratios
Change Changein % from in % from
in CHF bn 31.12.03 30.09.03 31.12.02 30.09.03 31.12.02
Advisory assets under management 609.6 615.1 577.9 (1) 5Discretionary assets under management 589.8 584.1 582.1 1 1Total assets under management 1,199.4 1,199.2 1,160.0 0 3Client assets 1,343.3 1,299.4 1,757.9 3 (24)
Assets under management/client assets
Change Change Changein % from in % from in % from12 months
in % 4Q2003 3Q2003 4Q2002 3Q2003 4Q2002 2003 2002 2002
Return on equity 12.0 26.3 (13.0) (54) – 16.6 (10.0) –
Return on equity
Consolidated balance sheet
Consolidated income statement
3
For complete consolidated financial statements and notes please refer to the Credit Suisse Group Annual Report 2003, which is posted on the Internet at www.credit-suisse.com/annualreport2003.
Change Changein % from in % from
31.12.03 30.09.03 31.12.02 30.09.03 31.12.02
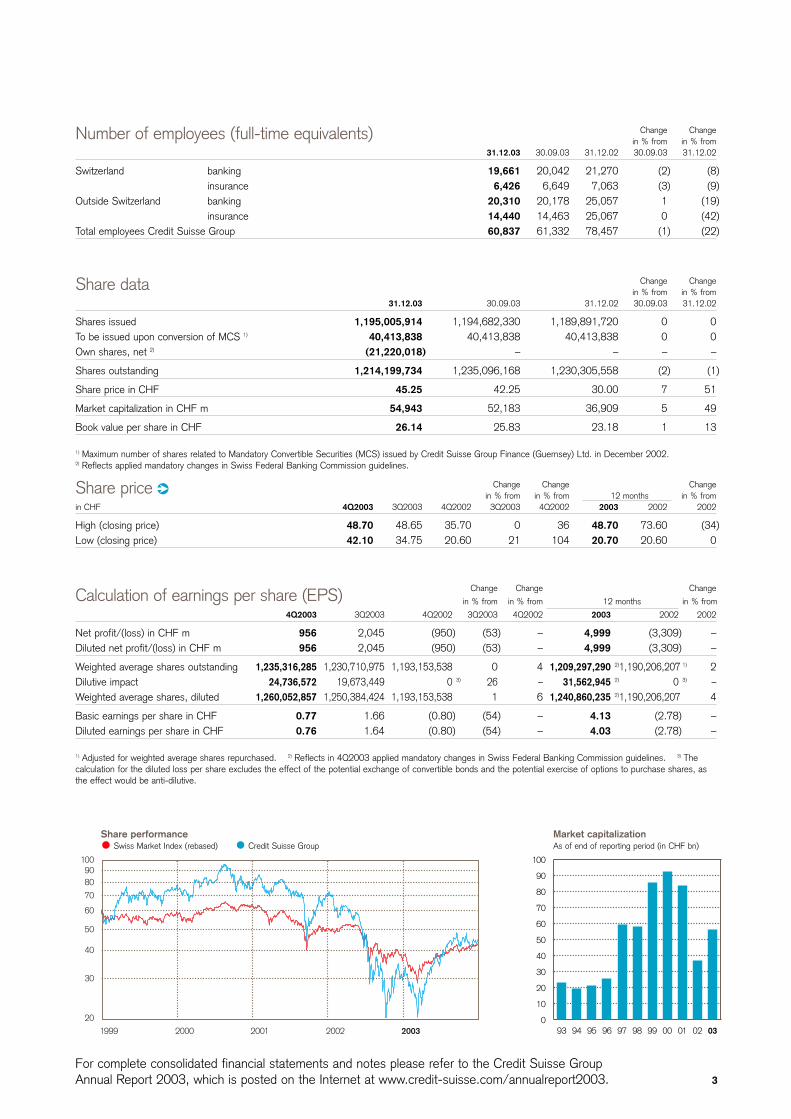
Shares issued 1,195,005,914 1,194,682,330 1,189,891,720 0 0To be issued upon conversion of MCS 1) 40,413,838 40,413,838 40,413,838 0 0Own shares, net 2) (21,220,018) – – – –
Shares outstanding 1,214,199,734 1,235,096,168 1,230,305,558 (2) (1)
Share price in CHF 45.25 42.25 30.00 7 51
Market capitalization in CHF m 54,943 52,183 36,909 5 49
Book value per share in CHF 26.14 25.83 23.18 1 13
1) Maximum number of shares related to Mandatory Convertible Securities (MCS) issued by Credit Suisse Group Finance (Guernsey) Ltd. in December 2002.2) Reflects applied mandatory changes in Swiss Federal Banking Commission guidelines.
Share data
Change Change Changein % from in % from in % from12 months
in CHF 4Q2003 3Q2003 4Q2002 3Q2003 4Q2002 2003 2002 2002
High (closing price) 48.70 48.65 35.70 0 36 48.70 73.60 (34)Low (closing price) 42.10 34.75 20.60 21 104 20.70 20.60 0
Share price ¤
Change Changein % from in % from
31.12.03 30.09.03 31.12.02 30.09.03 31.12.02
Switzerland banking 19,661 20,042 21,270 (2) (8)insurance 6,426 6,649 7,063 (3) (9)
Outside Switzerland banking 20,310 20,178 25,057 1 (19)insurance 14,440 14,463 25,067 0 (42)
Total employees Credit Suisse Group 60,837 61,332 78,457 (1) (22)
Number of employees (full-time equivalents)
1009080
70
60
50
40
30
20
1999 2000 2001 2002 2003
Share performanceSwiss Market Index (rebased) Credit Suisse Group
Change Change Change
in % from in % from in % from12 months
4Q2003 3Q2003 4Q2002 3Q2003 4Q2002 2003 2002 2002
Net profit/(loss) in CHF m 956 2,045 (950) (53) – 4,999 (3,309) –Diluted net profit/(loss) in CHF m 956 2,045 (950) (53) – 4,999 (3,309) –
Weighted average shares outstanding 1,235,316,285 1,230,710,975 1,193,153,538 0 4 1,209,297,290 2)1,190,206,207 1) 2Dilutive impact 24,736,572 19,673,449 0 3) 26 – 31,562,945 2) 0 3) –Weighted average shares, diluted 1,260,052,857 1,250,384,424 1,193,153,538 1 6 1,240,860,235 2)1,190,206,207 4
Basic earnings per share in CHF 0.77 1.66 (0.80) (54) – 4.13 (2.78) –Diluted earnings per share in CHF 0.76 1.64 (0.80) (54) – 4.03 (2.78) –
1) Adjusted for weighted average shares repurchased. 2) Reflects in 4Q2003 applied mandatory changes in Swiss Federal Banking Commission guidelines. 3) Thecalculation for the diluted loss per share excludes the effect of the potential exchange of convertible bonds and the potential exercise of options to purchase shares, asthe effect would be anti-dilutive.
Calculation of earnings per share (EPS)
Market capitalizationAs of end of reporting period (in CHF bn)
100
90
80
70
60
50
40
30
20
10
093 94 95 96 97 98 99 00 01 02 03
4
CREDIT SUISSE GROUP
For a detailed discussion of the full-year 2003 results please refer to the Credit Suisse Group Annual Report2003, which is posted on the Internet at www.credit-suisse.com/annualreport2003.
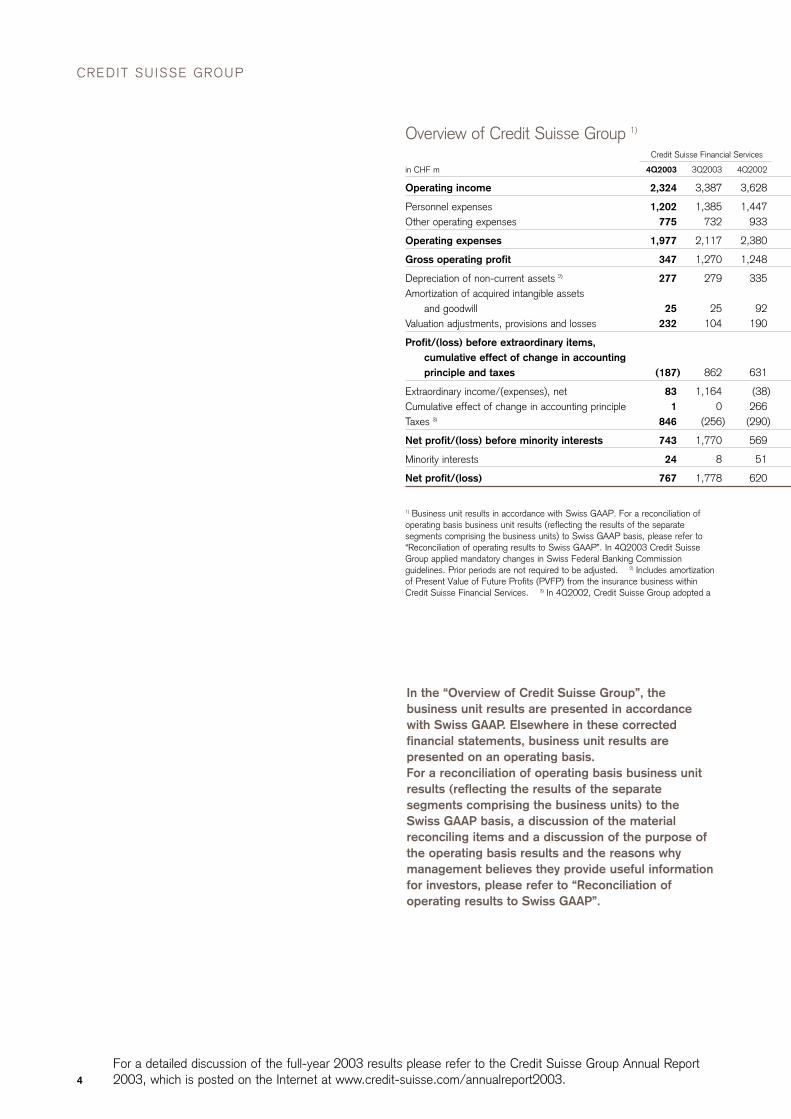
Credit Suisse Financial Services
in CHF m 4Q2003 3Q2003 4Q2002
Operating income 2,324 3,387 3,628
Personnel expenses 1,202 1,385 1,447Other operating expenses 775 732 933
Operating expenses 1,977 2,117 2,380
Gross operating profit 347 1,270 1,248
Depreciation of non-current assets 2) 277 279 335Amortization of acquired intangible assets
and goodwill 25 25 92Valuation adjustments, provisions and losses 232 104 190
Profit/(loss) before extraordinary items,cumulative effect of change in accounting principle and taxes (187) 862 631
Extraordinary income/(expenses), net 83 1,164 (38)Cumulative effect of change in accounting principle 1 0 266Taxes 3) 846 (256) (290)
Net profit/(loss) before minority interests 743 1,770 569
Minority interests 24 8 51
Net profit/(loss) 767 1,778 620
Overview of Credit Suisse Group 1)
1) Business unit results in accordance with Swiss GAAP. For a reconciliation ofoperating basis business unit results (reflecting the results of the separatesegments comprising the business units) to Swiss GAAP basis, please refer to“Reconciliation of operating results to Swiss GAAP”. In 4Q2003 Credit SuisseGroup applied mandatory changes in Swiss Federal Banking Commissionguidelines. Prior periods are not required to be adjusted. 2) Includes amortizationof Present Value of Future Profits (PVFP) from the insurance business withinCredit Suisse Financial Services. 3) In 4Q2002, Credit Suisse Group adopted a
In the “Overview of Credit Suisse Group”, thebusiness unit results are presented in accordancewith Swiss GAAP. Elsewhere in these correctedfinancial statements, business unit results arepresented on an operating basis.For a reconciliation of operating basis business unitresults (reflecting the results of the separatesegments comprising the business units) to theSwiss GAAP basis, a discussion of the materialreconciling items and a discussion of the purpose ofthe operating basis results and the reasons whymanagement believes they provide useful informationfor investors, please refer to “Reconciliation ofoperating results to Swiss GAAP”.

5
For a detailed discussion of the full-year 2003 results please refer to the Credit Suisse Group Annual Report2003, which is posted on the Internet at www.credit-suisse.com/annualreport2003.
Credit Suisse First Boston Corporate Center Credit Suisse Group
4Q2003 3Q2003 4Q2002 4Q2003 3Q2003 4Q2002 4Q2003 3Q2003 4Q2002
2,953 3,113 3,082 (59) 31 (315) 5,218 6,531 6,395
1,785 1,681 1,933 55 59 84 3,042 3,125 3,464612 594 858 (6) (64) (144) 1,381 1,262 1,647
2,397 2,275 2,791 49 (5) (60) 4,423 4,387 5,111
556 838 291 (108) 36 (255) 795 2,144 1,284
162 125 155 82 67 144 521 471 634
472 211 308 (3) 2 3 494 238 40348 111 1,977 2 0 257 282 215 2,424
(126) 391 (2,149) (189) (33) (659) (502) 1,220 (2,177)
166 2 220 43 2 187 292 1,168 369318 0 254 0 0 0 319 0 520(49) (65) 467 63 4 141 860 (317) 318
309 328 (1,208) (83) (27) (331) 969 2,071 (970)
(19) (20) (19) (18) (14) (12) (13) (26) 20
290 308 (1,227) (101) (41) (343) 956 2,045 (950)
change in accounting principle relating to the recognition of deferred tax assets on net operating losses.The retroactive application of this change in accounting principle would have resulted in taxes for 4Q2002for Credit Suisse Financial Services of CHF –607 m, for Credit Suisse First Boston of CHF 269 m, and forCredit Suisse Group of CHF –197 m.
Credit CreditSuisse Suisse Cor-
Financial First porate Total4Q2003, in CHF m Services Boston Center changes
Operating income 6 (199) (106) (299)Personnel expenses 0 0 8 8Valuation adjustments, provisions and losses 0 197 0 197Cumulative effect of change in accounting principle 1 318 0 319Taxes (2) (7) 5 (4)Net profit/(loss) 5 (85) (109) (189)
Impact on income statement from mandatory Swiss GAAP changes
6
CREDIT SUISSE GROUP
For a detailed discussion of the full-year 2003 results please refer to the Credit Suisse Group Annual Report2003, which is posted on the Internet at www.credit-suisse.com/annualreport2003.
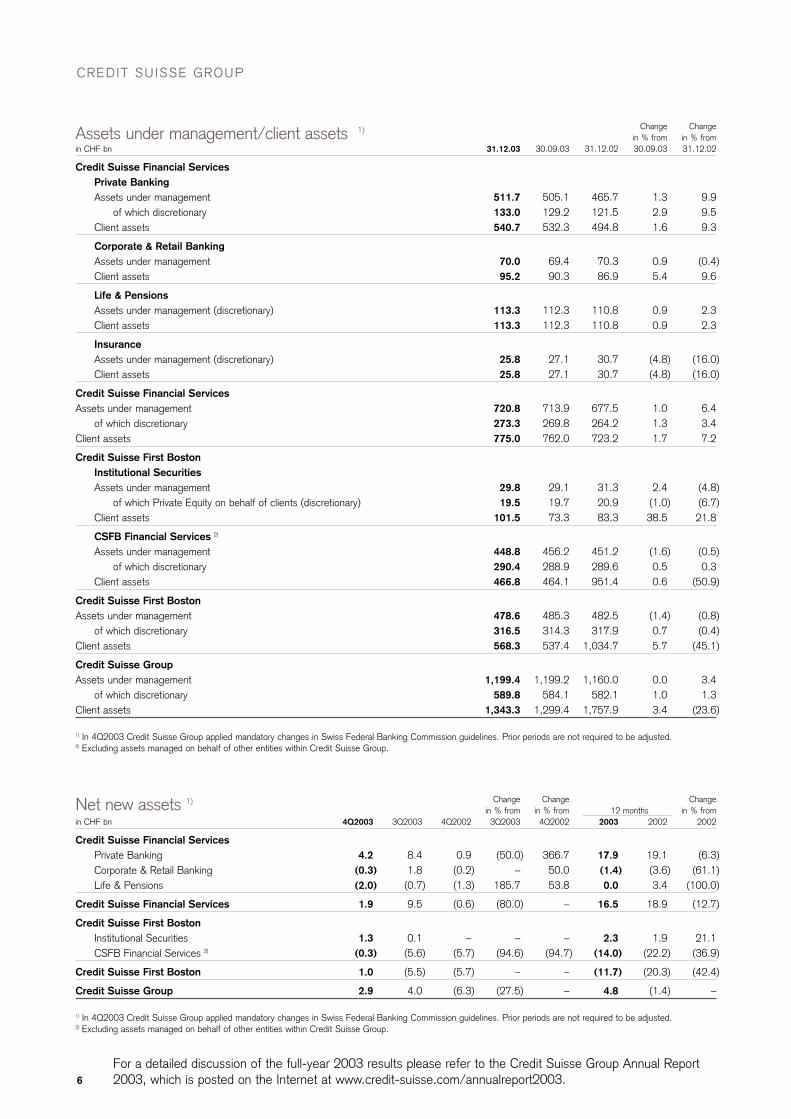
Change Changein % from in % from
in CHF bn 31.12.03 30.09.03 31.12.02 30.09.03 31.12.02
Credit Suisse Financial ServicesPrivate BankingAssets under management 511.7 505.1 465.7 1.3 9.9
of which discretionary 133.0 129.2 121.5 2.9 9.5Client assets 540.7 532.3 494.8 1.6 9.3
Corporate & Retail BankingAssets under management 70.0 69.4 70.3 0.9 (0.4)Client assets 95.2 90.3 86.9 5.4 9.6
Life & PensionsAssets under management (discretionary) 113.3 112.3 110.8 0.9 2.3Client assets 113.3 112.3 110.8 0.9 2.3
InsuranceAssets under management (discretionary) 25.8 27.1 30.7 (4.8) (16.0)Client assets 25.8 27.1 30.7 (4.8) (16.0)
Credit Suisse Financial ServicesAssets under management 720.8 713.9 677.5 1.0 6.4
of which discretionary 273.3 269.8 264.2 1.3 3.4Client assets 775.0 762.0 723.2 1.7 7.2
Credit Suisse First BostonInstitutional SecuritiesAssets under management 29.8 29.1 31.3 2.4 (4.8)
of which Private Equity on behalf of clients (discretionary) 19.5 19.7 20.9 (1.0) (6.7)Client assets 101.5 73.3 83.3 38.5 21.8
CSFB Financial Services 2)
Assets under management 448.8 456.2 451.2 (1.6) (0.5)of which discretionary 290.4 288.9 289.6 0.5 0.3
Client assets 466.8 464.1 951.4 0.6 (50.9)
Credit Suisse First BostonAssets under management 478.6 485.3 482.5 (1.4) (0.8)
of which discretionary 316.5 314.3 317.9 0.7 (0.4)Client assets 568.3 537.4 1,034.7 5.7 (45.1)
Credit Suisse GroupAssets under management 1,199.4 1,199.2 1,160.0 0.0 3.4
of which discretionary 589.8 584.1 582.1 1.0 1.3Client assets 1,343.3 1,299.4 1,757.9 3.4 (23.6)
1) In 4Q2003 Credit Suisse Group applied mandatory changes in Swiss Federal Banking Commission guidelines. Prior periods are not required to be adjusted.2) Excluding assets managed on behalf of other entities within Credit Suisse Group.
Assets under management/client assets 1)
Change Change Changein % from in % from in % from12 months
in CHF bn 4Q2003 3Q2003 4Q2002 3Q2003 4Q2002 2003 2002 2002
Credit Suisse Financial ServicesPrivate Banking 4.2 8.4 0.9 (50.0) 366.7 17.9 19.1 (6.3)Corporate & Retail Banking (0.3) 1.8 (0.2) – 50.0 (1.4) (3.6) (61.1)Life & Pensions (2.0) (0.7) (1.3) 185.7 53.8 0.0 3.4 (100.0)
Credit Suisse Financial Services 1.9 9.5 (0.6) (80.0) – 16.5 18.9 (12.7)
Credit Suisse First BostonInstitutional Securities 1.3 0.1 – – – 2.3 1.9 21.1CSFB Financial Services 2) (0.3) (5.6) (5.7) (94.6) (94.7) (14.0) (22.2) (36.9)
Credit Suisse First Boston 1.0 (5.5) (5.7) – – (11.7) (20.3) (42.4)
Credit Suisse Group 2.9 4.0 (6.3) (27.5) – 4.8 (1.4) –
1) In 4Q2003 Credit Suisse Group applied mandatory changes in Swiss Federal Banking Commission guidelines. Prior periods are not required to be adjusted.2) Excluding assets managed on behalf of other entities within Credit Suisse Group.
Net new assets 1)
7
For a detailed discussion of the full-year 2003 results please refer to the Credit Suisse Group Annual Report2003, which is posted on the Internet at www.credit-suisse.com/annualreport2003.
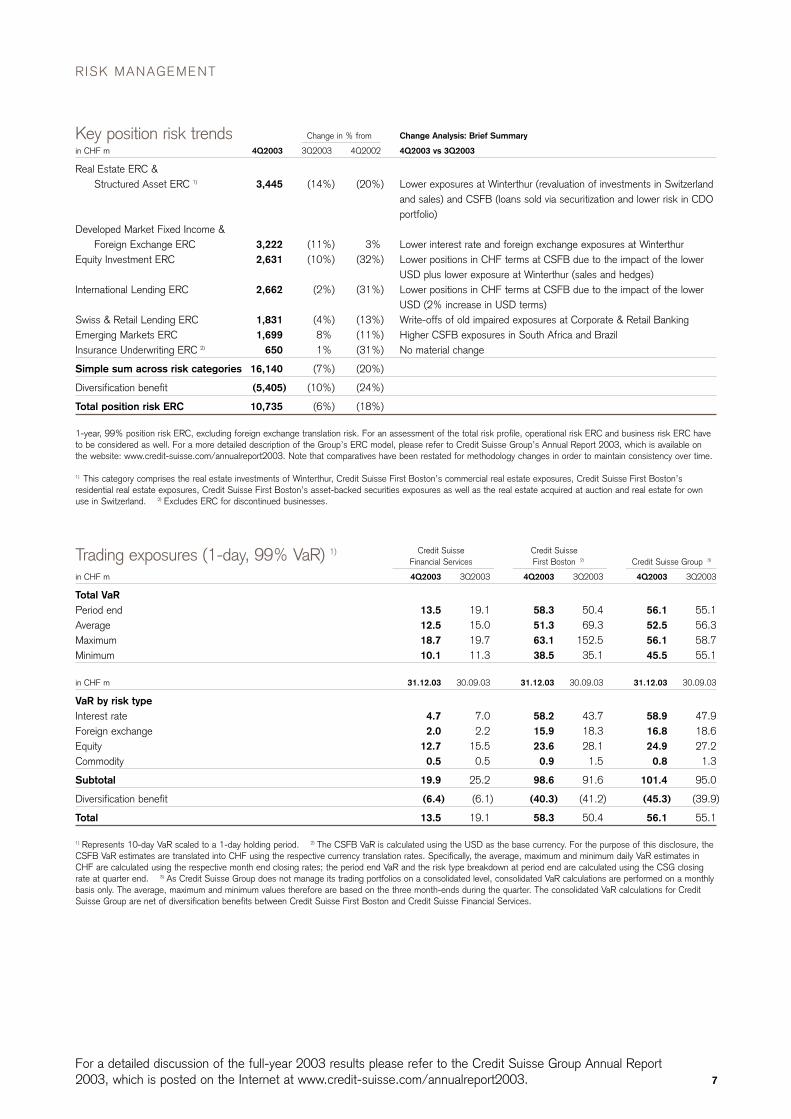
Credit Suisse Credit Suisse Financial Services First Boston 2) Credit Suisse Group 3)
in CHF m 4Q2003 3Q2003 4Q2003 3Q2003 4Q2003 3Q2003
Total VaRPeriod end 13.5 19.1 58.3 50.4 56.1 55.1Average 12.5 15.0 51.3 69.3 52.5 56.3Maximum 18.7 19.7 63.1 152.5 56.1 58.7Minimum 10.1 11.3 38.5 35.1 45.5 55.1
in CHF m 31.12.03 30.09.03 31.12.03 30.09.03 31.12.03 30.09.03
VaR by risk typeInterest rate 4.7 7.0 58.2 43.7 58.9 47.9Foreign exchange 2.0 2.2 15.9 18.3 16.8 18.6Equity 12.7 15.5 23.6 28.1 24.9 27.2Commodity 0.5 0.5 0.9 1.5 0.8 1.3
Subtotal 19.9 25.2 98.6 91.6 101.4 95.0
Diversification benefit (6.4) (6.1) (40.3) (41.2) (45.3) (39.9)
Total 13.5 19.1 58.3 50.4 56.1 55.1
1) Represents 10-day VaR scaled to a 1-day holding period. 2) The CSFB VaR is calculated using the USD as the base currency. For the purpose of this disclosure, theCSFB VaR estimates are translated into CHF using the respective currency translation rates. Specifically, the average, maximum and minimum daily VaR estimates inCHF are calculated using the respective month end closing rates; the period end VaR and the risk type breakdown at period end are calculated using the CSG closingrate at quarter end. 3) As Credit Suisse Group does not manage its trading portfolios on a consolidated level, consolidated VaR calculations are performed on a monthlybasis only. The average, maximum and minimum values therefore are based on the three month-ends during the quarter. The consolidated VaR calculations for CreditSuisse Group are net of diversification benefits between Credit Suisse First Boston and Credit Suisse Financial Services.
Trading exposures (1-day, 99% VaR) 1)
R ISK MANAGEMENT
Change Analysis: Brief SummaryChange in % from
in CHF m 4Q2003 3Q2003 4Q2002 4Q2003 vs 3Q2003
Real Estate ERC & Structured Asset ERC 1) 3,445 (14%) (20%) Lower exposures at Winterthur (revaluation of investments in Switzerland
and sales) and CSFB (loans sold via securitization and lower risk in CDOportfolio)
Developed Market Fixed Income & Foreign Exchange ERC 3,222 (11%) 3% Lower interest rate and foreign exchange exposures at Winterthur
Equity Investment ERC 2,631 (10%) (32%) Lower positions in CHF terms at CSFB due to the impact of the lowerUSD plus lower exposure at Winterthur (sales and hedges)
International Lending ERC 2,662 (2%) (31%) Lower positions in CHF terms at CSFB due to the impact of the lowerUSD (2% increase in USD terms)
Swiss & Retail Lending ERC 1,831 (4%) (13%) Write-offs of old impaired exposures at Corporate & Retail BankingEmerging Markets ERC 1,699 8% (11%) Higher CSFB exposures in South Africa and BrazilInsurance Underwriting ERC 2) 650 1% (31%) No material change
Simple sum across risk categories 16,140 (7%) (20%)
Diversification benefit (5,405) (10%) (24%)
Total position risk ERC 10,735 (6%) (18%)
1-year, 99% position risk ERC, excluding foreign exchange translation risk. For an assessment of the total risk profile, operational risk ERC and business risk ERC haveto be considered as well. For a more detailed description of the Group’s ERC model, please refer to Credit Suisse Group’s Annual Report 2003, which is available onthe website: www.credit-suisse.com/annualreport2003. Note that comparatives have been restated for methodology changes in order to maintain consistency over time.
1) This category comprises the real estate investments of Winterthur, Credit Suisse First Boston’s commercial real estate exposures, Credit Suisse First Boston’sresidential real estate exposures, Credit Suisse First Boston’s asset-backed securities exposures as well as the real estate acquired at auction and real estate for ownuse in Switzerland. 2) Excludes ERC for discontinued businesses.
Key position risk trends
RISK MANAGEMENT
8
For a detailed discussion of the full-year 2003 results please refer to the Credit Suisse Group Annual Report2003, which is posted on the Internet at www.credit-suisse.com/annualreport2003.
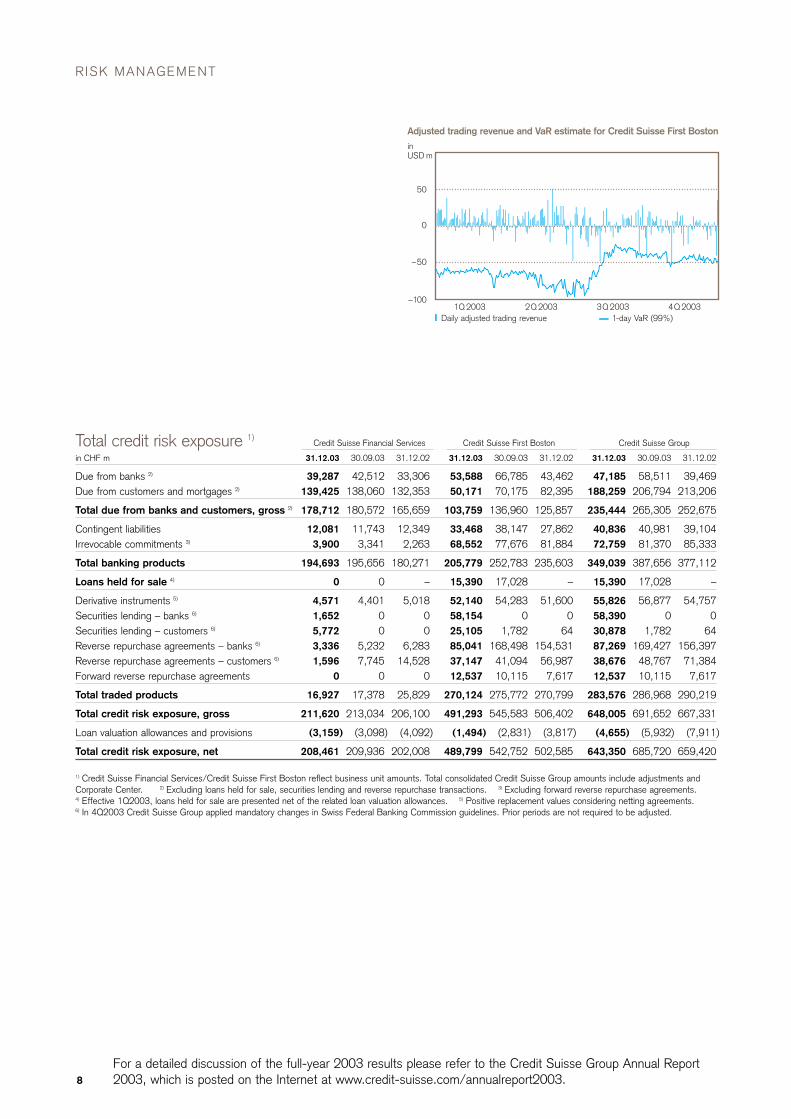
1Q 2003 2Q 2003 3Q 2003 4Q 2003Daily adjusted trading revenue 1-day VaR (99%)
inUSD m
50
0
–50
–100
Adjusted trading revenue and VaR estimate for Credit Suisse First Boston
Credit Suisse Financial Services Credit Suisse First Boston Credit Suisse Group
in CHF m 31.12.03 30.09.03 31.12.02 31.12.03 30.09.03 31.12.02 31.12.03 30.09.03 31.12.02
Due from banks 2) 39,287 42,512 33,306 53,588 66,785 43,462 47,185 58,511 39,469Due from customers and mortgages 2) 139,425 138,060 132,353 50,171 70,175 82,395 188,259 206,794 213,206
Total due from banks and customers, gross 2) 178,712 180,572 165,659 103,759 136,960 125,857 235,444 265,305 252,675
Contingent liabilities 12,081 11,743 12,349 33,468 38,147 27,862 40,836 40,981 39,104Irrevocable commitments 3) 3,900 3,341 2,263 68,552 77,676 81,884 72,759 81,370 85,333
Total banking products 194,693 195,656 180,271 205,779 252,783 235,603 349,039 387,656 377,112
Loans held for sale 4) 0 0 – 15,390 17,028 – 15,390 17,028 –
Derivative instruments 5) 4,571 4,401 5,018 52,140 54,283 51,600 55,826 56,877 54,757Securities lending – banks 6) 1,652 0 0 58,154 0 0 58,390 0 0Securities lending – customers 6) 5,772 0 0 25,105 1,782 64 30,878 1,782 64Reverse repurchase agreements – banks 6) 3,336 5,232 6,283 85,041 168,498 154,531 87,269 169,427 156,397Reverse repurchase agreements – customers 6) 1,596 7,745 14,528 37,147 41,094 56,987 38,676 48,767 71,384Forward reverse repurchase agreements 0 0 0 12,537 10,115 7,617 12,537 10,115 7,617
Total traded products 16,927 17,378 25,829 270,124 275,772 270,799 283,576 286,968 290,219
Total credit risk exposure, gross 211,620 213,034 206,100 491,293 545,583 506,402 648,005 691,652 667,331
Loan valuation allowances and provisions (3,159) (3,098) (4,092) (1,494) (2,831) (3,817) (4,655) (5,932) (7,911)
Total credit risk exposure, net 208,461 209,936 202,008 489,799 542,752 502,585 643,350 685,720 659,420
1) Credit Suisse Financial Services/Credit Suisse First Boston reflect business unit amounts. Total consolidated Credit Suisse Group amounts include adjustments andCorporate Center. 2) Excluding loans held for sale, securities lending and reverse repurchase transactions. 3) Excluding forward reverse repurchase agreements.4) Effective 1Q2003, loans held for sale are presented net of the related loan valuation allowances. 5) Positive replacement values considering netting agreements.6) In 4Q2003 Credit Suisse Group applied mandatory changes in Swiss Federal Banking Commission guidelines. Prior periods are not required to be adjusted.
Total credit risk exposure 1)

9
For a detailed discussion of the full-year 2003 results please refer to the Credit Suisse Group Annual Report2003, which is posted on the Internet at www.credit-suisse.com/annualreport2003.
Credit Suisse Financial Services Credit Suisse First Boston Credit Suisse Group
in CHF m 4Q2003 3Q2003 4Q2002 4Q2003 3Q2003 4Q2002 4Q2003 3Q2003 4Q2002
At beginning of period 3,061 3,446 4,001 2,727 2,928 3,376 5,790 6,373 7,377
Additions 426 213 475 371 141 825 805 353 1,323Releases (202) (133) (106) (407) (105) (44) (613) (238) (151)
Net additions charged to income statement 224 80 369 (36) 36 781 192 115 1,172
Gross write-offs (194) (438) (313) (1,207) (239) (334) (1,400) (676) (647)Recoveries 8 8 10 1 12 21 9 21 31
Net write-offs (186) (430) (303) (1,206) (227) (313) (1,391) (655) (616)
Balances acquired/(sold) 2 0 0 (5) 0 0 (3) 0 0Provisions for interest 5 1 17 53 31 9 58 31 26Foreign currency translation impact and other 17 (36) (31) (142) (41) (206) (130) (74) (256)
At end of period 3,123 3,061 4,053 1,391 2,727 3,647 4,516 5,790 7,703
Roll forward of loan valuation allowance 1)
Credit Suisse Financial Services Credit Suisse First Boston Credit Suisse Group
in CHF m 31.12.03 30.09.03 31.12.02 31.12.03 30.09.03 31.12.02 31.12.03 30.09.03 31.12.02
Non-performing loans 1,917 2,291 3,004 996 1,679 3,351 2,913 3,970 6,355Non-interest earning loans 1,517 1,577 2,108 246 437 217 1,763 2,015 2,325
Total non-performing loans 3,434 3,868 5,112 1,242 2,116 3,568 4,676 5,985 8,680
Restructured loans 24 22 52 256 327 229 280 349 281Potential problem loans 1,641 1,448 1,723 361 730 1,685 2,001 2,178 3,408
Total other impaired loans 1,665 1,470 1,775 617 1,057 1,914 2,281 2,527 3,689
Total impaired loans 5,099 5,338 6,887 1,859 3,173 5,482 6,957 8,512 12,369
Total due from banks and customers, gross 178,712 180,572 165,659 103,759 136,960 125,857 235,444 265,305 252,675
Valuation allowance 3,123 3,061 4,053 1,391 2,727 3,647 4,516 5,790 7,703of which on principal 2,556 2,454 3,201 1,184 2,466 3,416 3,742 4,921 6,617of which on interest 567 607 852 207 261 231 774 869 1,086
Total due from banks and customers, net 175,589 177,511 161,606 102,368 134,233 122,210 230,928 259,515 244,972
Provisions for contingent liabilities and irrevocable commitments 36 37 39 103 104 170 139 142 208
Total valuation allowances and provisions 3,159 3,098 4,092 1,494 2,831 3,817 4,655 5,932 7,911
RatiosValuation allowances as % of
total non-performing loans 90.9% 79.1% 79.3% 112.0% 128.9% 102.2% 96.6% 96.7% 88.7%Valuation allowances as % of
total impaired loans 61.2% 57.3% 58.9% 74.8% 85.9% 66.5% 64.9% 68.0% 62.3%
Total loan portfolio exposure and allowances and provisions for credit risk 1)
Credit Suisse Financial Services Credit Suisse First Boston Credit Suisse Group
in CHF m 4Q2003 3Q2003 4Q2002 4Q2003 3Q2003 4Q2002 4Q2003 3Q2003 4Q2002
Net additions to loan valuation allowances 224 80 369 (36) 36 781 192 115 1,172Net additions to provisions for contingent liabilities
and irrevocable commitments 2) (4) 6 24 6 (26) 221 0 (19) 244
Total net credit-related valuation allowances and provisions charged to income statement 220 86 393 (30) 10 1,002 192 96 1,416
1) Credit Suisse Financial Services/Credit Suisse First Boston reflect business unit amounts. Total consolidated Credit Suisse Group amounts include adjustments andCorporate Center. 2) For 2003, net additions for valuation allowances against debt securities are no longer included in net additions to provisions for contingentliabilities and irrevocable commitments.
Net credit-related valuation allowances and provisions 1)
CREDIT SUISSE F INANCIAL SERVICES
10
For a detailed discussion of the full-year 2003 results please refer to the Credit Suisse Group Annual Report2003, which is posted on the Internet at www.credit-suisse.com/annualreport2003.
Change Change Changein % from in % from in % from12 months
in CHF m 4Q2003 3Q2003 4Q2002 3Q2003 4Q2002 2003 2002 2002
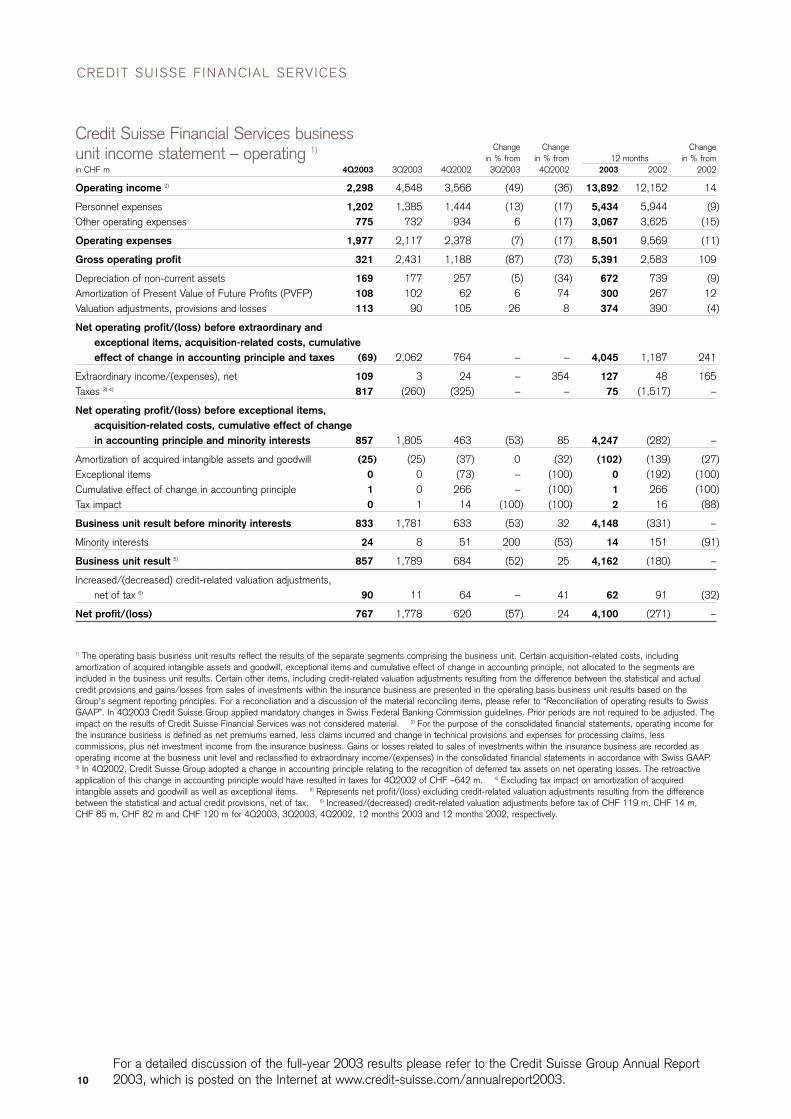
Operating income 2) 2,298 4,548 3,566 (49) (36) 13,892 12,152 14
Personnel expenses 1,202 1,385 1,444 (13) (17) 5,434 5,944 (9)Other operating expenses 775 732 934 6 (17) 3,067 3,625 (15)
Operating expenses 1,977 2,117 2,378 (7) (17) 8,501 9,569 (11)
Gross operating profit 321 2,431 1,188 (87) (73) 5,391 2,583 109
Depreciation of non-current assets 169 177 257 (5) (34) 672 739 (9)Amortization of Present Value of Future Profits (PVFP) 108 102 62 6 74 300 267 12Valuation adjustments, provisions and losses 113 90 105 26 8 374 390 (4)
Net operating profit/(loss) before extraordinary andexceptional items, acquisition-related costs, cumulativeeffect of change in accounting principle and taxes (69) 2,062 764 – – 4,045 1,187 241
Extraordinary income/(expenses), net 109 3 24 – 354 127 48 165Taxes 3) 4) 817 (260) (325) – – 75 (1,517) –
Net operating profit/(loss) before exceptional items, acquisition-related costs, cumulative effect of change in accounting principle and minority interests 857 1,805 463 (53) 85 4,247 (282) –
Amortization of acquired intangible assets and goodwill (25) (25) (37) 0 (32) (102) (139) (27)Exceptional items 0 0 (73) – (100) 0 (192) (100)Cumulative effect of change in accounting principle 1 0 266 – (100) 1 266 (100)Tax impact 0 1 14 (100) (100) 2 16 (88)
Business unit result before minority interests 833 1,781 633 (53) 32 4,148 (331) –
Minority interests 24 8 51 200 (53) 14 151 (91)
Business unit result 5) 857 1,789 684 (52) 25 4,162 (180) –
Increased/(decreased) credit-related valuation adjustments, net of tax 6) 90 11 64 – 41 62 91 (32)
Net profit/(loss) 767 1,778 620 (57) 24 4,100 (271) –
1) The operating basis business unit results reflect the results of the separate segments comprising the business unit. Certain acquisition-related costs, includingamortization of acquired intangible assets and goodwill, exceptional items and cumulative effect of change in accounting principle, not allocated to the segments areincluded in the business unit results. Certain other items, including credit-related valuation adjustments resulting from the difference between the statistical and actualcredit provisions and gains/losses from sales of investments within the insurance business are presented in the operating basis business unit results based on theGroup’s segment reporting principles. For a reconciliation and a discussion of the material reconciling items, please refer to “Reconciliation of operating results to SwissGAAP”. In 4Q2003 Credit Suisse Group applied mandatory changes in Swiss Federal Banking Commission guidelines. Prior periods are not required to be adjusted. Theimpact on the results of Credit Suisse Financial Services was not considered material. 2) For the purpose of the consolidated financial statements, operating income forthe insurance business is defined as net premiums earned, less claims incurred and change in technical provisions and expenses for processing claims, lesscommissions, plus net investment income from the insurance business. Gains or losses related to sales of investments within the insurance business are recorded asoperating income at the business unit level and reclassified to extraordinary income/(expenses) in the consolidated financial statements in accordance with Swiss GAAP.3) In 4Q2002, Credit Suisse Group adopted a change in accounting principle relating to the recognition of deferred tax assets on net operating losses. The retroactiveapplication of this change in accounting principle would have resulted in taxes for 4Q2002 of CHF –642 m. 4) Excluding tax impact on amortization of acquiredintangible assets and goodwill as well as exceptional items. 5) Represents net profit/(loss) excluding credit-related valuation adjustments resulting from the differencebetween the statistical and actual credit provisions, net of tax. 6) Increased/(decreased) credit-related valuation adjustments before tax of CHF 119 m, CHF 14 m,CHF 85 m, CHF 82 m and CHF 120 m for 4Q2003, 3Q2003, 4Q2002, 12 months 2003 and 12 months 2002, respectively.
Credit Suisse Financial Services business unit income statement – operating 1)
11
For a detailed discussion of the full-year 2003 results please refer to the Credit Suisse Group Annual Report2003, which is posted on the Internet at www.credit-suisse.com/annualreport2003.
12 months4Q2003 3Q2003 4Q2002 2003 2002
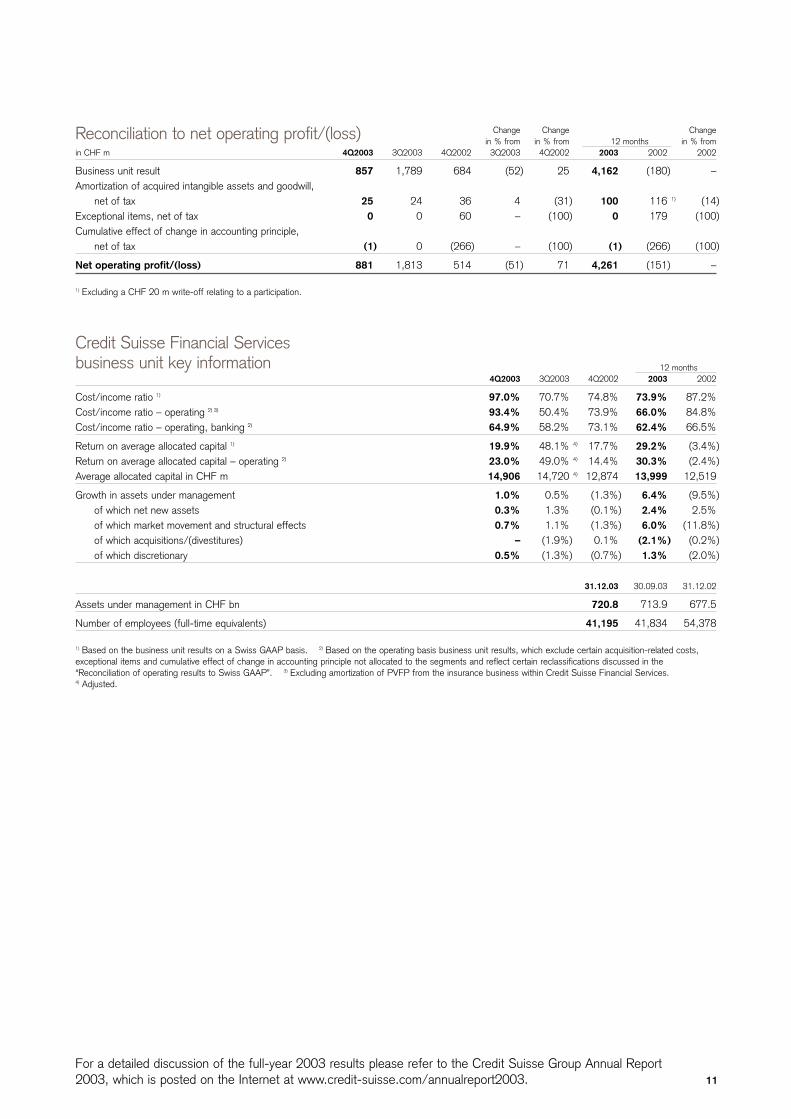
Cost/income ratio 1) 97.0% 70.7% 74.8% 73.9% 87.2%Cost/income ratio – operating 2) 3) 93.4% 50.4% 73.9% 66.0% 84.8%Cost/income ratio – operating, banking 2) 64.9% 58.2% 73.1% 62.4% 66.5%
Return on average allocated capital 1) 19.9% 48.1% 4) 17.7% 29.2% (3.4%)Return on average allocated capital – operating 2) 23.0% 49.0% 4) 14.4% 30.3% (2.4%)Average allocated capital in CHF m 14,906 14,720 4) 12,874 13,999 12,519
Growth in assets under management 1.0% 0.5% (1.3%) 6.4% (9.5%)of which net new assets 0.3% 1.3% (0.1%) 2.4% 2.5%of which market movement and structural effects 0.7% 1.1% (1.3%) 6.0% (11.8%)of which acquisitions/(divestitures) – (1.9%) 0.1% (2.1%) (0.2%)of which discretionary 0.5% (1.3%) (0.7%) 1.3% (2.0%)
31.12.03 30.09.03 31.12.02
Assets under management in CHF bn 720.8 713.9 677.5
Number of employees (full-time equivalents) 41,195 41,834 54,378
1) Based on the business unit results on a Swiss GAAP basis. 2) Based on the operating basis business unit results, which exclude certain acquisition-related costs,exceptional items and cumulative effect of change in accounting principle not allocated to the segments and reflect certain reclassifications discussed in the“Reconciliation of operating results to Swiss GAAP”. 3) Excluding amortization of PVFP from the insurance business within Credit Suisse Financial Services.4) Adjusted.
Credit Suisse Financial Servicesbusiness unit key information
Change Change Changein % from in % from in % from12 months
in CHF m 4Q2003 3Q2003 4Q2002 3Q2003 4Q2002 2003 2002 2002
Business unit result 857 1,789 684 (52) 25 4,162 (180) –Amortization of acquired intangible assets and goodwill,
net of tax 25 24 36 4 (31) 100 116 1) (14)Exceptional items, net of tax 0 0 60 – (100) 0 179 (100)Cumulative effect of change in accounting principle,
net of tax (1) 0 (266) – (100) (1) (266) (100)
Net operating profit/(loss) 881 1,813 514 (51) 71 4,261 (151) –
1) Excluding a CHF 20 m write-off relating to a participation.
Reconciliation to net operating profit/(loss)

CREDIT SUISSE F INANCIAL SERVICES
12
For a detailed discussion of the full-year 2003 results please refer to the Credit Suisse Group Annual Report2003, which is posted on the Internet at www.credit-suisse.com/annualreport2003.
CreditCorporate Suisse
Private & Retail Life & Financial4Q2003, in CHF m Banking Banking Pensions Insurance Services
Operating income 2) 1,432 785 (283) 364 2,298
Personnel expenses 512 303 167 220 1,202Other operating expenses 310 213 125 127 775
Operating expenses 822 516 292 347 1,977
Gross operating profit 610 269 (575) 17 321
Depreciation of non-current assets 68 32 35 34 169Amortization of Present Value of Future Profits (PVFP) – – 106 2 108Valuation adjustments, provisions and losses 21 92 – – 113
Net operating profit/(loss) before extraordinary items, acquisition-related costs, cumulative effect of change in accounting principle and taxes 521 145 (716) (19) (69)
Extraordinary income/(expenses), net 108 1 0 0 109Taxes 3) (121) (26) 840 124 817
Net operating profit before acquisition-related costs, cumulative effect of change in accounting principle and minority interests 508 120 124 105 857
Amortization of acquired intangible assets and goodwill (25)Cumulative effect of change in accounting principle 1Tax impact 0
Business unit result before minority interests 833
Minority interests 24
Business unit result 4) 857
Other data:Average allocated capital 5) 3,093 4,965 6,848 14,906
1) The operating basis business unit results reflect the results of the separate segments comprising the business unit. Certain acquisition-related costs, includingamortization of acquired intangible assets and goodwill, and cumulative effect of change in accounting principle not allocated to the segments are included in thebusiness unit results. Certain other items, including credit-related valuation adjustments resulting from the difference between the statistical and actual credit provisionsand gains/losses from sales of investments within the insurance business, are presented in the operating basis business unit results based on the Group’s segmentreporting principles. For a reconciliation and a discussion of the material reconciling items, please refer to “Reconciliation of operating results to Swiss GAAP”. In4Q2003 Credit Suisse Group applied mandatory changes in Swiss Federal Banking Commission guidelines. Prior periods are not required to be adjusted. The impact onthe results of Credit Suisse Financial Services was not considered material. 2) Operating income for the insurance business is defined as net premiums earned, lessclaims incurred and change in technical provisions and expenses for processing claims, less commissions, plus net investment income from the insurance business.Gains or losses related to sales of investments within the insurance business are recorded as operating income at the business unit level and reclassified to extraordinaryincome/(expenses) in the consolidated financial statements in accordance with Swiss GAAP. 3) Excluding tax impact on amortization of acquired intangible assets andgoodwill. 4) Represents net profit excluding credit-related valuation adjustments resulting from the difference between the statistical and actual credit provisions.5) Amount relating to Life & Pensions and Insurance segments represents the average shareholders’ equity of “Winterthur” Swiss Insurance Company.
Overview of business unitCredit Suisse Financial Services – operating 1)
13
For a detailed discussion of the full-year 2003 results please refer to the Credit Suisse Group Annual Report2003, which is posted on the Internet at www.credit-suisse.com/annualreport2003.
Change Change Changein % from in % from in % from12 months
in CHF m 4Q2003 3Q2003 4Q2002 3Q2003 4Q2002 2003 2002 2002
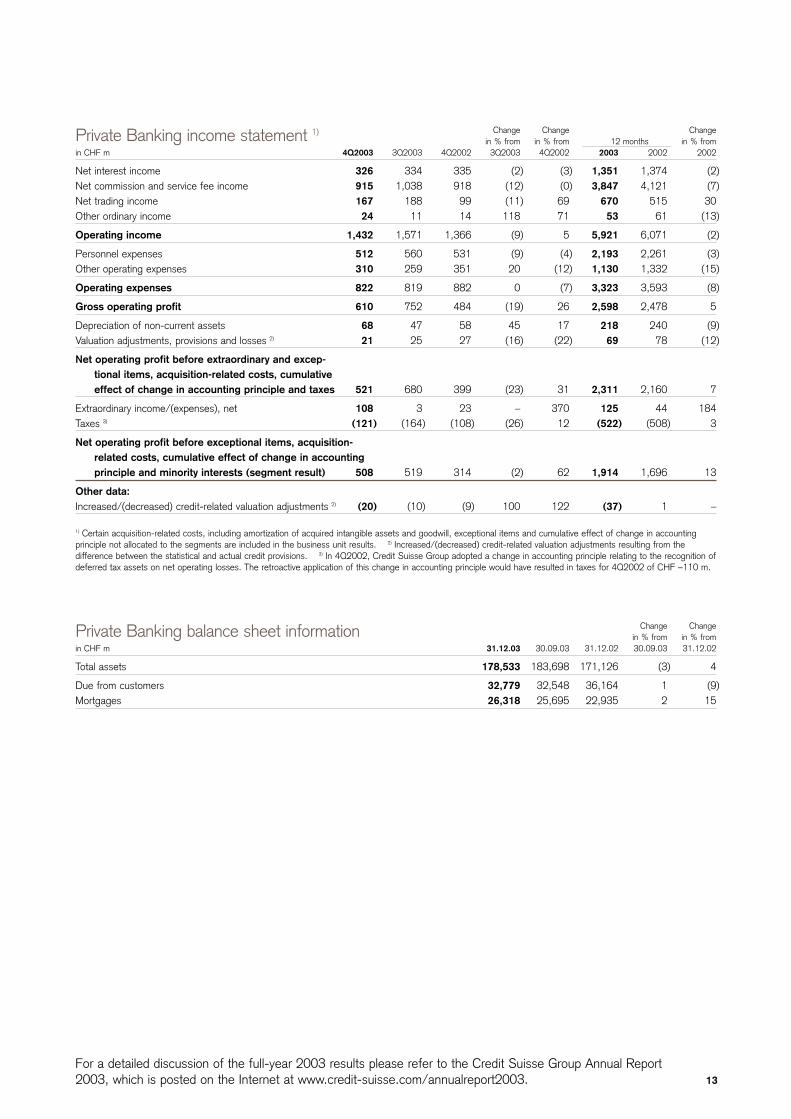
Net interest income 326 334 335 (2) (3) 1,351 1,374 (2)Net commission and service fee income 915 1,038 918 (12) (0) 3,847 4,121 (7)Net trading income 167 188 99 (11) 69 670 515 30Other ordinary income 24 11 14 118 71 53 61 (13)
Operating income 1,432 1,571 1,366 (9) 5 5,921 6,071 (2)
Personnel expenses 512 560 531 (9) (4) 2,193 2,261 (3)Other operating expenses 310 259 351 20 (12) 1,130 1,332 (15)
Operating expenses 822 819 882 0 (7) 3,323 3,593 (8)
Gross operating profit 610 752 484 (19) 26 2,598 2,478 5
Depreciation of non-current assets 68 47 58 45 17 218 240 (9)Valuation adjustments, provisions and losses 2) 21 25 27 (16) (22) 69 78 (12)
Net operating profit before extraordinary and excep-tional items, acquisition-related costs, cumulative effect of change in accounting principle and taxes 521 680 399 (23) 31 2,311 2,160 7
Extraordinary income/(expenses), net 108 3 23 – 370 125 44 184Taxes 3) (121) (164) (108) (26) 12 (522) (508) 3
Net operating profit before exceptional items, acquisition-related costs, cumulative effect of change in accounting principle and minority interests (segment result) 508 519 314 (2) 62 1,914 1,696 13
Other data:Increased/(decreased) credit-related valuation adjustments 2) (20) (10) (9) 100 122 (37) 1 –
1) Certain acquisition-related costs, including amortization of acquired intangible assets and goodwill, exceptional items and cumulative effect of change in accountingprinciple not allocated to the segments are included in the business unit results. 2) Increased/(decreased) credit-related valuation adjustments resulting from thedifference between the statistical and actual credit provisions. 3) In 4Q2002, Credit Suisse Group adopted a change in accounting principle relating to the recognition ofdeferred tax assets on net operating losses. The retroactive application of this change in accounting principle would have resulted in taxes for 4Q2002 of CHF –110 m.
Private Banking income statement 1)
Change Changein % from in % from
in CHF m 31.12.03 30.09.03 31.12.02 30.09.03 31.12.02
Total assets 178,533 183,698 171,126 (3) 4
Due from customers 32,779 32,548 36,164 1 (9)Mortgages 26,318 25,695 22,935 2 15
Private Banking balance sheet information
CREDIT SUISSE F INANCIAL SERVICES
14
For a detailed discussion of the full-year 2003 results please refer to the Credit Suisse Group Annual Report2003, which is posted on the Internet at www.credit-suisse.com/annualreport2003.
12 months4Q2003 3Q2003 4Q2002 2003 2002
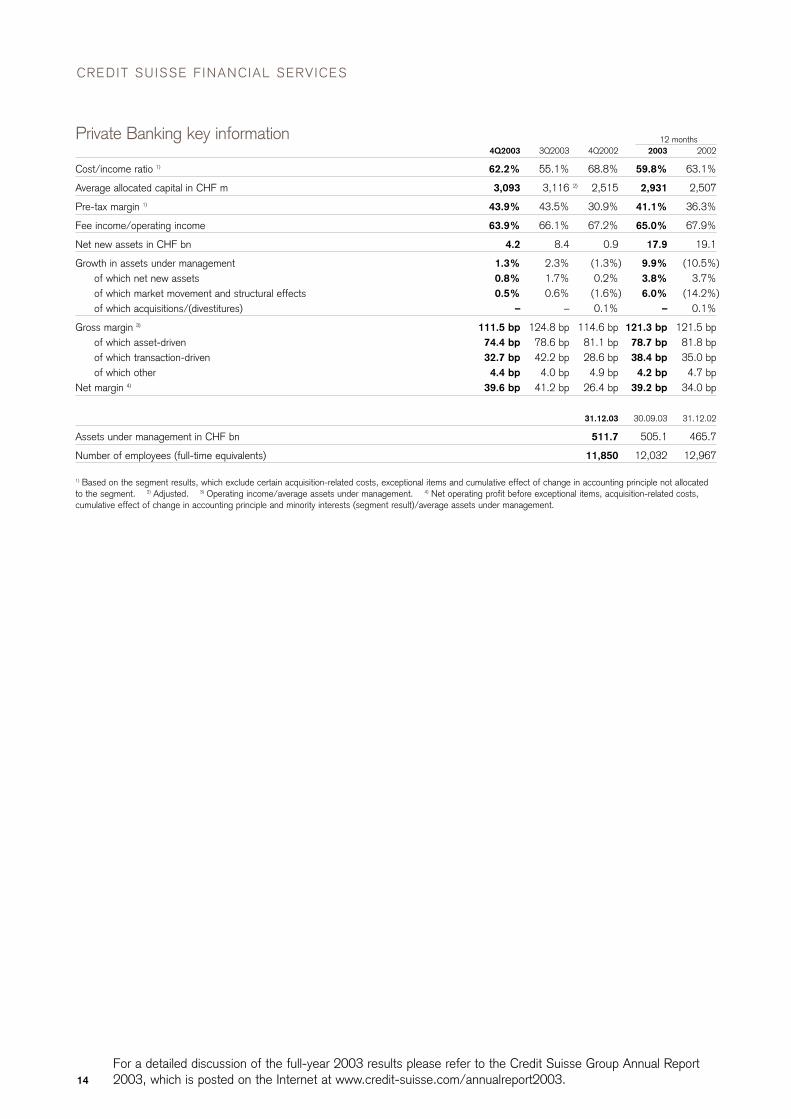
Cost/income ratio 1) 62.2% 55.1% 68.8% 59.8% 63.1%
Average allocated capital in CHF m 3,093 3,116 2) 2,515 2,931 2,507
Pre-tax margin 1) 43.9% 43.5% 30.9% 41.1% 36.3%
Fee income/operating income 63.9% 66.1% 67.2% 65.0% 67.9%
Net new assets in CHF bn 4.2 8.4 0.9 17.9 19.1
Growth in assets under management 1.3% 2.3% (1.3%) 9.9% (10.5%)of which net new assets 0.8% 1.7% 0.2% 3.8% 3.7%of which market movement and structural effects 0.5% 0.6% (1.6%) 6.0% (14.2%)of which acquisitions/(divestitures) – – 0.1% – 0.1%
Gross margin 3) 111.5 bp 124.8 bp 114.6 bp 121.3 bp 121.5 bpof which asset-driven 74.4 bp 78.6 bp 81.1 bp 78.7 bp 81.8 bpof which transaction-driven 32.7 bp 42.2 bp 28.6 bp 38.4 bp 35.0 bpof which other 4.4 bp 4.0 bp 4.9 bp 4.2 bp 4.7 bp
Net margin 4) 39.6 bp 41.2 bp 26.4 bp 39.2 bp 34.0 bp
31.12.03 30.09.03 31.12.02
Assets under management in CHF bn 511.7 505.1 465.7
Number of employees (full-time equivalents) 11,850 12,032 12,967
1) Based on the segment results, which exclude certain acquisition-related costs, exceptional items and cumulative effect of change in accounting principle not allocatedto the segment. 2) Adjusted. 3) Operating income/average assets under management. 4) Net operating profit before exceptional items, acquisition-related costs,cumulative effect of change in accounting principle and minority interests (segment result)/average assets under management.
Private Banking key information
15
For a detailed discussion of the full-year 2003 results please refer to the Credit Suisse Group Annual Report2003, which is posted on the Internet at www.credit-suisse.com/annualreport2003.
Change Change Changein % from in % from in % from12 months
in CHF m 4Q2003 3Q2003 4Q2002 3Q2003 4Q2002 2003 2002 2002
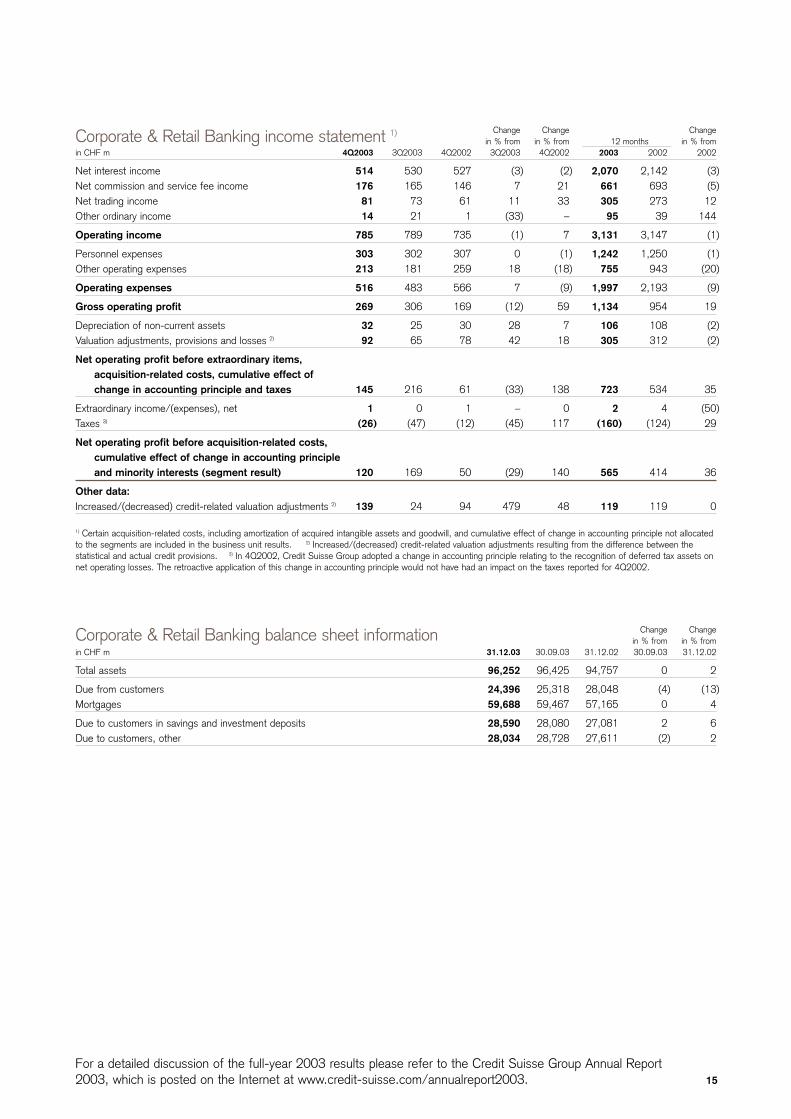
Net interest income 514 530 527 (3) (2) 2,070 2,142 (3)Net commission and service fee income 176 165 146 7 21 661 693 (5)Net trading income 81 73 61 11 33 305 273 12Other ordinary income 14 21 1 (33) – 95 39 144
Operating income 785 789 735 (1) 7 3,131 3,147 (1)
Personnel expenses 303 302 307 0 (1) 1,242 1,250 (1)Other operating expenses 213 181 259 18 (18) 755 943 (20)
Operating expenses 516 483 566 7 (9) 1,997 2,193 (9)
Gross operating profit 269 306 169 (12) 59 1,134 954 19
Depreciation of non-current assets 32 25 30 28 7 106 108 (2)Valuation adjustments, provisions and losses 2) 92 65 78 42 18 305 312 (2)
Net operating profit before extraordinary items, acquisition-related costs, cumulative effect of change in accounting principle and taxes 145 216 61 (33) 138 723 534 35
Extraordinary income/(expenses), net 1 0 1 – 0 2 4 (50)Taxes 3) (26) (47) (12) (45) 117 (160) (124) 29
Net operating profit before acquisition-related costs, cumulative effect of change in accounting principle and minority interests (segment result) 120 169 50 (29) 140 565 414 36
Other data:Increased/(decreased) credit-related valuation adjustments 2) 139 24 94 479 48 119 119 0
1) Certain acquisition-related costs, including amortization of acquired intangible assets and goodwill, and cumulative effect of change in accounting principle not allocatedto the segments are included in the business unit results. 2) Increased/(decreased) credit-related valuation adjustments resulting from the difference between thestatistical and actual credit provisions. 3) In 4Q2002, Credit Suisse Group adopted a change in accounting principle relating to the recognition of deferred tax assets onnet operating losses. The retroactive application of this change in accounting principle would not have had an impact on the taxes reported for 4Q2002.
Corporate & Retail Banking income statement 1)
Change Changein % from in % from
in CHF m 31.12.03 30.09.03 31.12.02 30.09.03 31.12.02
Total assets 96,252 96,425 94,757 0 2
Due from customers 24,396 25,318 28,048 (4) (13)Mortgages 59,688 59,467 57,165 0 4
Due to customers in savings and investment deposits 28,590 28,080 27,081 2 6Due to customers, other 28,034 28,728 27,611 (2) 2
Corporate & Retail Banking balance sheet information

CREDIT SUISSE F INANCIAL SERVICES
16
For a detailed discussion of the full-year 2003 results please refer to the Credit Suisse Group Annual Report2003, which is posted on the Internet at www.credit-suisse.com/annualreport2003.
12 months4Q2003 3Q2003 4Q2002 2003 2002
Cost/income ratio 1) 69.8% 64.4% 81.1% 67.2% 73.1%
Return on average allocated capital 1) 9.7% 13.6% 2) 4.1% 11.6% 8.2%Average allocated capital in CHF m 4,965 4,954 2) 4,877 4,880 5,036
Pre-tax margin 1) 18.6% 27.4% 8.4% 23.2% 17.1%
Personnel expenses/operating income 38.6% 38.3% 41.8% 39.7% 39.7%
Net interest margin 210 bp 215 bp 217 bp 212 bp 215 bp
Loan growth (0.8%) (0.9%) (1.6%) (1.3%) (1.0%)
Net new assets in CHF bn (0.3) 1.8 (0.2) (1.4) (3.6)
31.12.03 30.09.03 31.12.02
Deposit/loan ratio 67.3% 67.0% 64.2%
Assets under management in CHF bn 70.0 69.4 70.3
Number of employees (full-time equivalents) 8,479 8,690 9,281
Number of branches 214 220 223
1) Based on the segment results, which exclude certain acquisition-related costs and cumulative effect of change in accounting principle not allocated to the segment.2) Adjusted.
Corporate & Retail Banking key information

17
For a detailed discussion of the full-year 2003 results please refer to the Credit Suisse Group Annual Report2003, which is posted on the Internet at www.credit-suisse.com/annualreport2003.
Change Change Changein % from in % from in % from12 months
in CHF m 4Q2003 3Q2003 4Q2002 3Q2003 4Q2002 2003 2002 2002
Gross premiums written 3,996 3,312 4,218 21 (5) 17,273 19,019 (9)Reinsurance ceded (18) (33) (14) (45) 29 (87) (40) 118
Net premiums written 3,978 3,279 4,204 21 (5) 17,186 18,979 (9)
Change in provision for unearned premiums 7 2 29 250 (76) (1) (4) (75)
Net premiums earned 3,985 3,281 4,233 21 (6) 17,185 18,975 (9)
Death and other benefits incurred (5,482) (3,791) (5,373) 45 2 (16,243) (14,692) 11Change in provision for future policyholder benefits
(technical) 1,240 243 1,116 410 11 (2,486) (5,750) (57)Change in provision for future policyholder benefits
(separate account) 2) (578) (435) 80 33 – (1,718) 1,730 –Dividends to policyholders incurred (1,266) (169) 738 – – (1,661) 1,758 –Policy acquisition costs (including change in DAC/PVFP) (309) (305) (160) 1 93 (854) (716) 19Administration costs (257) (263) (409) (2) (37) (1,119) (1,463) (24)Investment income general account 1,530 1,304 333 17 359 5,351 1,438 272Investment income separate account 2) 578 435 (80) 33 – 1,718 (1,730) –Interest received and paid (56) (28) (39) 100 44 (117) (92) 27Interest on bonuses credited to policyholders (37) (32) (41) 16 (10) (155) (146) 6Other income/(expenses), net (64) (90) (24) (29) 167 (142) 74 –
Net operating profit/(loss) before cumulative effect of change in accounting principle and taxes (716) 150 374 – – (241) (614) (61)
Taxes 3) 840 (24) (281) – – 719 (786) –
Net operating profit/(loss) before cumulative effect of change in accounting principle and minority interests (segment result) 124 126 93 (2) 33 478 (1,400) –
1) The presentation of segment results differs from the presentation of the Group’s consolidated results as it reflects the way the insurance business is managed, which isin line with peers in the insurance industry. Certain acquisition-related costs, including amortization of acquired intangible assets and goodwill, and cumulative effect ofchange in accounting principle not allocated to the segments are included in the business unit results. 2) This represents the market impact for separate account (orunit-linked) business, where the investment risk is borne by the policyholder. 3) In 4Q2002, Credit Suisse Group adopted a change in accounting principle relating tothe recognition of deferred tax assets on net operating losses. The retroactive application of this change in accounting principle would have resulted in taxes for 4Q2002of CHF –540 m.
Life & Pensions income statement 1)
12 months4Q2003 3Q2003 4Q2002 2003 2002
Expense ratio 1) 14.2% 17.1% 13.5% 11.4% 11.5%
Growth in gross premiums written (5.3%) (27.1%) (13.9%) (9.2%) 9.2%
Return on invested assets (excluding separate account business)Current income 4.4% 4.0% 3.6% 4.1% 3.9%Realized gains/losses and other income/expenses 1.6% 1.0% (2.5%) 1.1% (2.5%)Total return on invested assets 2) 6.0% 5.0% 1.2% 5.2% 1.4%
Net new assets in CHF bn 3) (2.0) (0.7) (1.3) 0.0 3.4
Total sales in CHF m 4) 5,035 3,883 5,283 20,454 22,790
31.12.03 30.09.03 31.12.02
Assets under management in CHF bn 5) 113.3 112.3 110.8
Technical provisions in CHF m 107,929 107,437 105,939
Number of employees (full-time equivalents) 7,193 7,392 7,815
1) Operating expenses (i.e. policy acquisition costs and administration costs)/gross premiums written. 2) Total return on invested assets includes depreciation on realestate and investment expenses as well as investment income and realized gains and losses. 3) Based on change in technical provisions for traditional business,adjusted for technical interests, net inflow of separate account business and change in off-balance sheet business such as funds. 4) Includes gross premiums writtenand off-balance sheet sales. 5) Based on savings-related provisions for policyholders plus off-balance sheet assets.
Life & Pensions key information

CREDIT SUISSE F INANCIAL SERVICES
18
For a detailed discussion of the full-year 2003 results please refer to the Credit Suisse Group Annual Report2003, which is posted on the Internet at www.credit-suisse.com/annualreport2003.
Change Change Changein % from in % from in % from12 months
in CHF m 4Q2003 3Q2003 4Q2002 3Q2003 4Q2002 2003 2002 2002
Gross premiums written 1,955 3,385 3,846 (42) (49) 16,212 18,391 (12)Reinsurance ceded (40) (236) (299) (83) (87) (939) (1,150) (18)
Net premiums written 1,915 3,149 3,547 (39) (46) 15,273 17,241 (11)
Change in provision for unearned premiums and in provision for future policy benefits (health) 779 663 485 17 61 (703) (1,538) (54)
Net premiums earned 2,694 3,812 4,032 (29) (33) 14,570 15,703 (7)
Claims and annuities incurred, net (1,957) (2,918) (3,034) (33) (35) (10,646) (11,749) (9)Dividends to policyholders incurred, net (282) (95) 109 197 – (499) 106 –Policy acquisition costs (including change in DAC/PVFP) (415) (582) (647) (29) (36) (2,433) (2,529) (4)Administration costs (278) (450) (481) (38) (42) (1,633) (1,959) (17)
Underwriting result, net (238) (233) (21) 2 – (641) (428) 50
Net investment income 288 348 59 (17) 388 1,240 (10) –Interest received and paid (54) (28) (39) 93 38 (156) (106) 47Other income/(expenses), net (15) 929 (69) – (78) 809 (349) –
Net operating profit/(loss) before cumulative effect of change in accounting principle and taxes (19) 1,016 (70) – (73) 1,252 (893) –
Taxes 2) 124 (25) 76 – 63 38 (99) –
Net operating profit/(loss) before cumulative effect of change in accounting principle and minority interests (segment result) 105 991 6 (89) – 1,290 (992) –
1) The presentation of segment results differs from the presentation of the Group’s consolidated results as it reflects the way the insurance business is managed, which isin line with peers in the insurance industry. Certain acquisition-related costs, including amortization of acquired intangible assets and goodwill, and cumulative effect ofchange in accounting principle not allocated to the segments are included in the business unit results. 2) In 4Q2002, Credit Suisse Group adopted a change inaccounting principle relating to the recognition of deferred tax assets on net operating losses. The retroactive application of this change in accounting principle wouldhave resulted in taxes for 4Q2002 of CHF 20 m.
Insurance income statement 1)
12 months4Q2003 3Q2003 4Q2002 2003 2002
Combined ratio (excluding dividends to policyholders) 98.3% 103.6% 103.2% 101.0% 103.4%
Claims ratio 1) 72.6% 76.5% 75.2% 73.1% 74.8%
Expense ratio 2) 25.7% 27.1% 28.0% 27.9% 28.6%
Return on invested assets Current income 3.9% 3.8% 3.9% 3.9% 4.2%Realized gains/losses and other income/expenses 0.1% 0.1% (3.4%) (0.1%) (4.3%)Total return on invested assets 3) 3.9% 3.9% 0.5% 3.8% (0.1%)
31.12.03 30.09.03 31.12.02
Assets under management in CHF bn 25.8 27.1 30.7
Technical provisions in CHF m 22,196 22,764 28,745
Number of employees (full-time equivalents) 13,673 13,720 24,315
1) Claims and annuities incurred, net/net premiums earned. 2) Operating expenses (i.e. policy acquisition costs and administration costs)/net premiums earned. 3) Totalreturn on invested assets includes depreciation on real estate and investment expenses as well as investment income and realized gains and losses.
Insurance key information
19
For a detailed discussion of the full-year 2003 results please refer to the Credit Suisse Group Annual Report2003, which is posted on the Internet at www.credit-suisse.com/annualreport2003.
CREDIT SUISSE F IRST BOSTON
Change Change Changein % from in % from in % from12 months
in USD m 4Q2003 3Q2003 4Q2002 3Q2003 4Q2002 2003 2002 2002
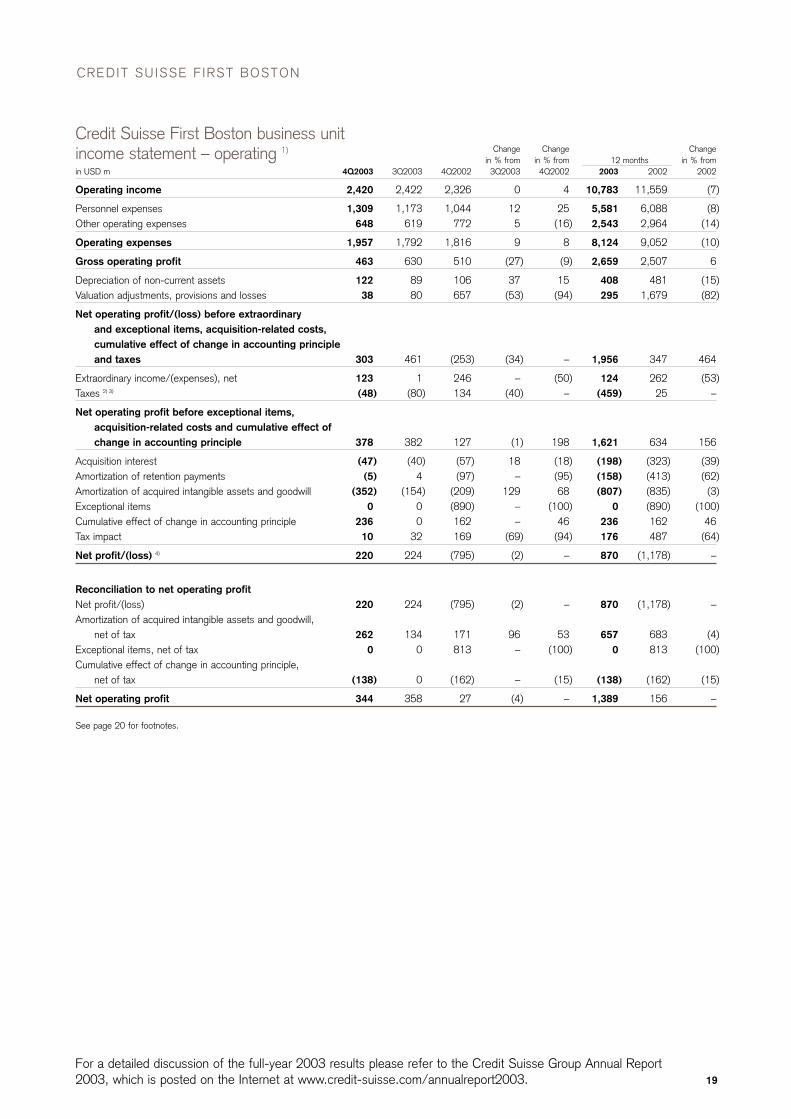
Operating income 2,420 2,422 2,326 0 4 10,783 11,559 (7)
Personnel expenses 1,309 1,173 1,044 12 25 5,581 6,088 (8)Other operating expenses 648 619 772 5 (16) 2,543 2,964 (14)
Operating expenses 1,957 1,792 1,816 9 8 8,124 9,052 (10)
Gross operating profit 463 630 510 (27) (9) 2,659 2,507 6
Depreciation of non-current assets 122 89 106 37 15 408 481 (15)Valuation adjustments, provisions and losses 38 80 657 (53) (94) 295 1,679 (82)
Net operating profit/(loss) before extraordinary and exceptional items, acquisition-related costs, cumulative effect of change in accounting principle and taxes 303 461 (253) (34) – 1,956 347 464
Extraordinary income/(expenses), net 123 1 246 – (50) 124 262 (53)Taxes 2) 3) (48) (80) 134 (40) – (459) 25 –
Net operating profit before exceptional items, acquisition-related costs and cumulative effect of change in accounting principle 378 382 127 (1) 198 1,621 634 156
Acquisition interest (47) (40) (57) 18 (18) (198) (323) (39)Amortization of retention payments (5) 4 (97) – (95) (158) (413) (62)Amortization of acquired intangible assets and goodwill (352) (154) (209) 129 68 (807) (835) (3)Exceptional items 0 0 (890) – (100) 0 (890) (100)Cumulative effect of change in accounting principle 236 0 162 – 46 236 162 46Tax impact 10 32 169 (69) (94) 176 487 (64)
Net profit/(loss) 4) 220 224 (795) (2) – 870 (1,178) –
Reconciliation to net operating profitNet profit/(loss) 220 224 (795) (2) – 870 (1,178) –Amortization of acquired intangible assets and goodwill,
net of tax 262 134 171 96 53 657 683 (4)Exceptional items, net of tax 0 0 813 – (100) 0 813 (100)Cumulative effect of change in accounting principle,
net of tax (138) 0 (162) – (15) (138) (162) (15)
Net operating profit 344 358 27 (4) – 1,389 156 –
See page 20 for footnotes.
Credit Suisse First Boston business unit income statement – operating 1)
CREDIT SUISSE F IRST BOSTON
20
For a detailed discussion of the full-year 2003 results please refer to the Credit Suisse Group Annual Report2003, which is posted on the Internet at www.credit-suisse.com/annualreport2003.
Change Change Changein % from in % from in % from12 months
in CHF m 4Q2003 3Q2003 4Q2002 3Q2003 4Q2002 2003 2002 2002
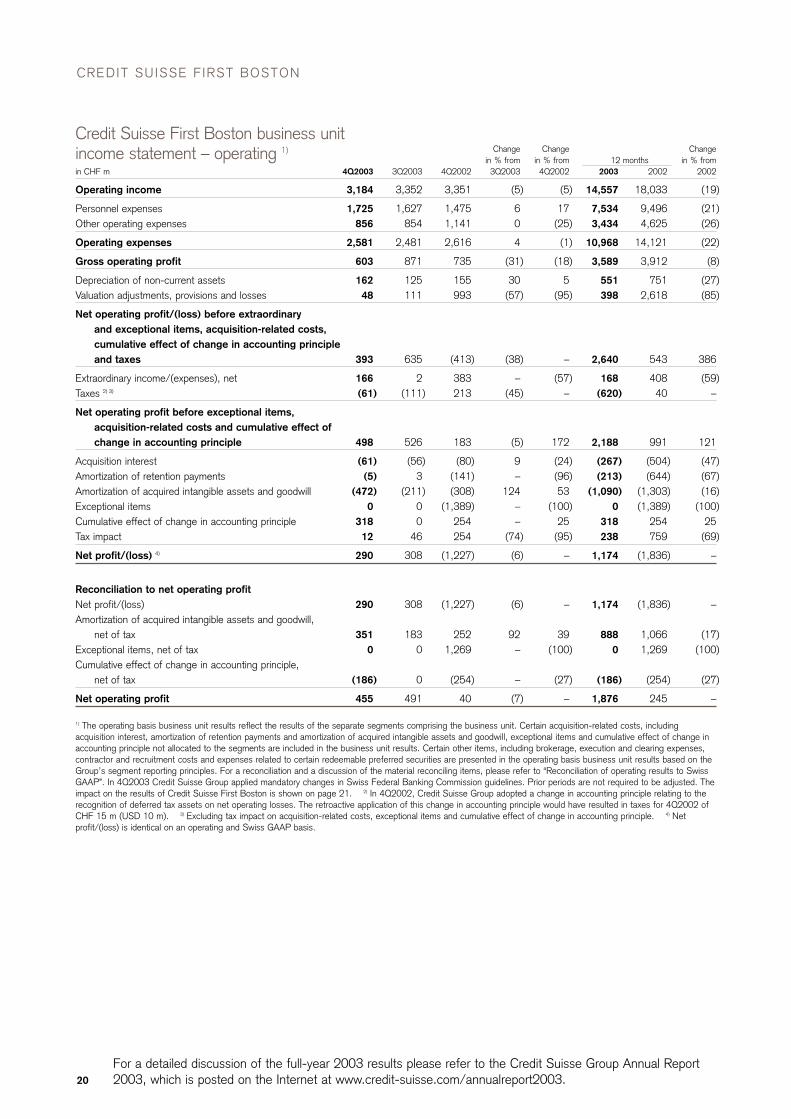
Operating income 3,184 3,352 3,351 (5) (5) 14,557 18,033 (19)
Personnel expenses 1,725 1,627 1,475 6 17 7,534 9,496 (21)Other operating expenses 856 854 1,141 0 (25) 3,434 4,625 (26)
Operating expenses 2,581 2,481 2,616 4 (1) 10,968 14,121 (22)
Gross operating profit 603 871 735 (31) (18) 3,589 3,912 (8)
Depreciation of non-current assets 162 125 155 30 5 551 751 (27)Valuation adjustments, provisions and losses 48 111 993 (57) (95) 398 2,618 (85)
Net operating profit/(loss) before extraordinary and exceptional items, acquisition-related costs, cumulative effect of change in accounting principle and taxes 393 635 (413) (38) – 2,640 543 386
Extraordinary income/(expenses), net 166 2 383 – (57) 168 408 (59)Taxes 2) 3) (61) (111) 213 (45) – (620) 40 –
Net operating profit before exceptional items, acquisition-related costs and cumulative effect of change in accounting principle 498 526 183 (5) 172 2,188 991 121
Acquisition interest (61) (56) (80) 9 (24) (267) (504) (47)Amortization of retention payments (5) 3 (141) – (96) (213) (644) (67)Amortization of acquired intangible assets and goodwill (472) (211) (308) 124 53 (1,090) (1,303) (16)Exceptional items 0 0 (1,389) – (100) 0 (1,389) (100)Cumulative effect of change in accounting principle 318 0 254 – 25 318 254 25Tax impact 12 46 254 (74) (95) 238 759 (69)
Net profit/(loss) 4) 290 308 (1,227) (6) – 1,174 (1,836) –
Reconciliation to net operating profitNet profit/(loss) 290 308 (1,227) (6) – 1,174 (1,836) –Amortization of acquired intangible assets and goodwill,
net of tax 351 183 252 92 39 888 1,066 (17)Exceptional items, net of tax 0 0 1,269 – (100) 0 1,269 (100)Cumulative effect of change in accounting principle,
net of tax (186) 0 (254) – (27) (186) (254) (27)
Net operating profit 455 491 40 (7) – 1,876 245 –
1) The operating basis business unit results reflect the results of the separate segments comprising the business unit. Certain acquisition-related costs, includingacquisition interest, amortization of retention payments and amortization of acquired intangible assets and goodwill, exceptional items and cumulative effect of change inaccounting principle not allocated to the segments are included in the business unit results. Certain other items, including brokerage, execution and clearing expenses,contractor and recruitment costs and expenses related to certain redeemable preferred securities are presented in the operating basis business unit results based on theGroup’s segment reporting principles. For a reconciliation and a discussion of the material reconciling items, please refer to “Reconciliation of operating results to SwissGAAP”. In 4Q2003 Credit Suisse Group applied mandatory changes in Swiss Federal Banking Commission guidelines. Prior periods are not required to be adjusted. Theimpact on the results of Credit Suisse First Boston is shown on page 21. 2) In 4Q2002, Credit Suisse Group adopted a change in accounting principle relating to therecognition of deferred tax assets on net operating losses. The retroactive application of this change in accounting principle would have resulted in taxes for 4Q2002 ofCHF 15 m (USD 10 m). 3) Excluding tax impact on acquisition-related costs, exceptional items and cumulative effect of change in accounting principle. 4) Netprofit/(loss) is identical on an operating and Swiss GAAP basis.
Credit Suisse First Boston business unit income statement – operating 1)

21
For a detailed discussion of the full-year 2003 results please refer to the Credit Suisse Group Annual Report2003, which is posted on the Internet at www.credit-suisse.com/annualreport2003.
12 monthsbased on CHF amounts 4Q2003 3Q2003 4Q2002 2003 2002
Cost/income ratio 1) 86.7% 77.1% 95.6% 80.6% 88.9%Cost/income ratio – operating 2) 86.1% 77.7% 82.7% 79.1% 82.5%
Return on average allocated capital 1) 11.5% 11.3% (35.1%) 10.6% (12.3%)Return on average allocated capital – operating 2) 16.9% 16.9% 1.2% 15.9% 1.7%Average allocated capital in CHF m 10,743 11,615 13,763 11,829 14,299
Pre-tax margin 1) 12.1% 12.6% (54.3%) 12.0% (15.3%)Pre-tax margin – operating 2) 15.5% 17.4% (7.5%) 16.0% (1.1%)
Personnel expenses/operating income 1) 60.4% 54.0% 62.7% 58.5% 64.2%Personnel expenses/operating income – operating 2) 54.2% 48.5% 44.0% 51.8% 52.7%
31.12.03 30.09.03 31.12.02
Number of employees (full-time equivalents) 18,341 18,195 22,801
1) Based on the business unit results on a Swiss GAAP basis. 2) Based on the operating basis business unit results, which exclude certain acquisition-related costs,exceptional items and cumulative effect of change in accounting principle not allocated to the segments and reflect certain other reclassifications discussed in the“Reconciliation of operating results to Swiss GAAP”.
Credit Suisse First Bostonbusiness unit key information
in USD m in CHF m
Operating Accounting Operating Operating Accounting Operating4Q2003 basis – old changes basis basis – old changes basis
Operating income 2,567 (147) 2,420 3,383 (199) 3,184of which Institutional Securities 2,260 (147) 2,113 2,975 (199) 2,776
of which Fixed Income 828 153 981 1,083 206 1,289of which Equity 623 0 623 820 0 820of which Investment Banking 717 0 717 951 0 951of which Other 92 (300) (208) 121 (405) (284)
of which CSFB Financial Services 307 0 307 408 0 408
Valuation adjustments, provisions and losses (108) 146 38 (149) 197 48Cumulative effect of change in accounting principles 0 236 236 0 318 318Taxes (32) (6) (38) (42) (7) (49)Net profit/(loss) 283 (63) 220 375 (85) 290
Net operating profit/(loss) 545 (201) 344 726 (271) 455
Impact on income statement from mandatory Swiss GAAP changes
CREDIT SUISSE F IRST BOSTON
22
For a detailed discussion of the full-year 2003 results please refer to the Credit Suisse Group Annual Report2003, which is posted on the Internet at www.credit-suisse.com/annualreport2003.
in USD m in CHF m
CSFB CSFBInstitutional Financial Credit Suisse Institutional Financial Credit Suisse
4Q2003 Securities Services First Boston Securities Services First Boston
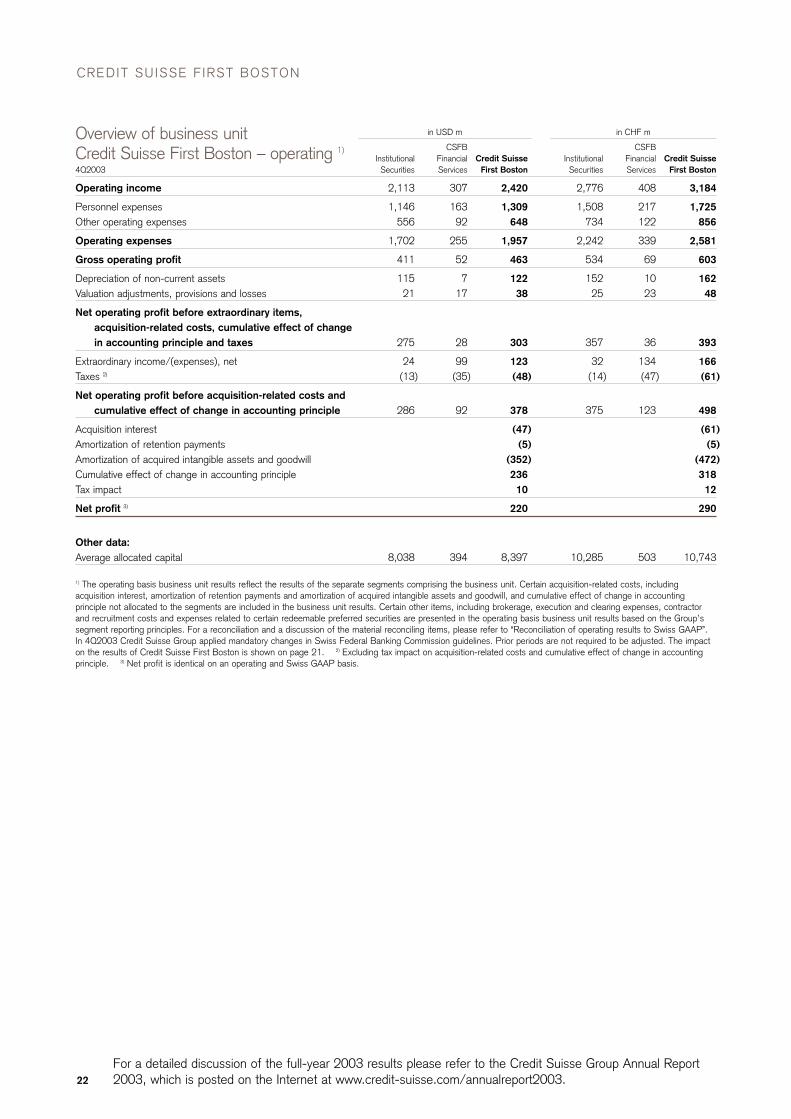
Operating income 2,113 307 2,420 2,776 408 3,184
Personnel expenses 1,146 163 1,309 1,508 217 1,725Other operating expenses 556 92 648 734 122 856
Operating expenses 1,702 255 1,957 2,242 339 2,581
Gross operating profit 411 52 463 534 69 603
Depreciation of non-current assets 115 7 122 152 10 162Valuation adjustments, provisions and losses 21 17 38 25 23 48
Net operating profit before extraordinary items, acquisition-related costs, cumulative effect of change in accounting principle and taxes 275 28 303 357 36 393
Extraordinary income/(expenses), net 24 99 123 32 134 166Taxes 2) (13) (35) (48) (14) (47) (61)
Net operating profit before acquisition-related costs and cumulative effect of change in accounting principle 286 92 378 375 123 498
Acquisition interest (47) (61)Amortization of retention payments (5) (5)Amortization of acquired intangible assets and goodwill (352) (472)Cumulative effect of change in accounting principle 236 318Tax impact 10 12
Net profit 3) 220 290
Other data:Average allocated capital 8,038 394 8,397 10,285 503 10,743
1) The operating basis business unit results reflect the results of the separate segments comprising the business unit. Certain acquisition-related costs, includingacquisition interest, amortization of retention payments and amortization of acquired intangible assets and goodwill, and cumulative effect of change in accountingprinciple not allocated to the segments are included in the business unit results. Certain other items, including brokerage, execution and clearing expenses, contractorand recruitment costs and expenses related to certain redeemable preferred securities are presented in the operating basis business unit results based on the Group’ssegment reporting principles. For a reconciliation and a discussion of the material reconciling items, please refer to “Reconciliation of operating results to Swiss GAAP”.In 4Q2003 Credit Suisse Group applied mandatory changes in Swiss Federal Banking Commission guidelines. Prior periods are not required to be adjusted. The impacton the results of Credit Suisse First Boston is shown on page 21. 2) Excluding tax impact on acquisition-related costs and cumulative effect of change in accountingprinciple. 3) Net profit is identical on an operating and Swiss GAAP basis.
Overview of business unit Credit Suisse First Boston – operating 1)
23
For a detailed discussion of the full-year 2003 results please refer to the Credit Suisse Group Annual Report2003, which is posted on the Internet at www.credit-suisse.com/annualreport2003.
Change Change Changein % from in % from in % from12 months
in USD m 4Q2003 3Q2003 4Q2002 3Q2003 4Q2002 2003 2002 2002
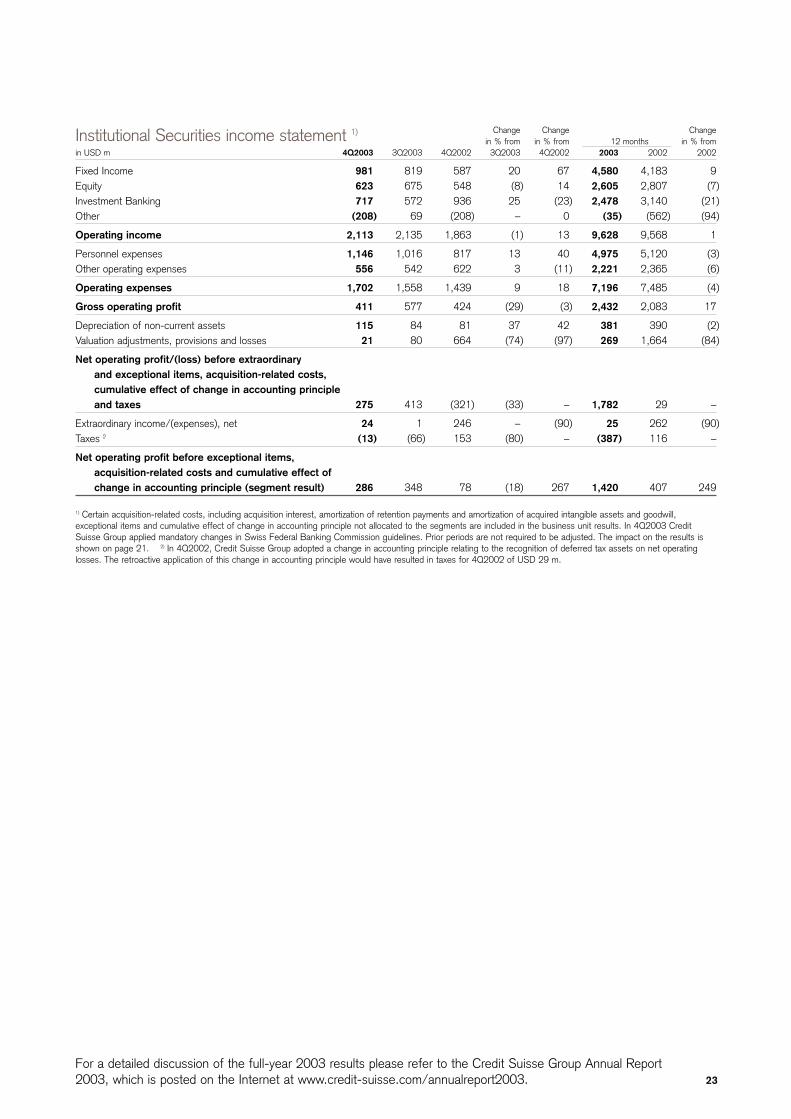
Fixed Income 981 819 587 20 67 4,580 4,183 9Equity 623 675 548 (8) 14 2,605 2,807 (7)Investment Banking 717 572 936 25 (23) 2,478 3,140 (21)Other (208) 69 (208) – 0 (35) (562) (94)
Operating income 2,113 2,135 1,863 (1) 13 9,628 9,568 1
Personnel expenses 1,146 1,016 817 13 40 4,975 5,120 (3)Other operating expenses 556 542 622 3 (11) 2,221 2,365 (6)
Operating expenses 1,702 1,558 1,439 9 18 7,196 7,485 (4)
Gross operating profit 411 577 424 (29) (3) 2,432 2,083 17
Depreciation of non-current assets 115 84 81 37 42 381 390 (2)Valuation adjustments, provisions and losses 21 80 664 (74) (97) 269 1,664 (84)
Net operating profit/(loss) before extraordinary and exceptional items, acquisition-related costs, cumulative effect of change in accounting principle and taxes 275 413 (321) (33) – 1,782 29 –
Extraordinary income/(expenses), net 24 1 246 – (90) 25 262 (90)Taxes 2 (13) (66) 153 (80) – (387) 116 –
Net operating profit before exceptional items, acquisition-related costs and cumulative effect of change in accounting principle (segment result) 286 348 78 (18) 267 1,420 407 249
1) Certain acquisition-related costs, including acquisition interest, amortization of retention payments and amortization of acquired intangible assets and goodwill,exceptional items and cumulative effect of change in accounting principle not allocated to the segments are included in the business unit results. In 4Q2003 CreditSuisse Group applied mandatory changes in Swiss Federal Banking Commission guidelines. Prior periods are not required to be adjusted. The impact on the results isshown on page 21. 2) In 4Q2002, Credit Suisse Group adopted a change in accounting principle relating to the recognition of deferred tax assets on net operatinglosses. The retroactive application of this change in accounting principle would have resulted in taxes for 4Q2002 of USD 29 m.
Institutional Securities income statement 1)

CREDIT SUISSE F IRST BOSTON
24
For a detailed discussion of the full-year 2003 results please refer to the Credit Suisse Group Annual Report2003, which is posted on the Internet at www.credit-suisse.com/annualreport2003.
Change Change Changein % from in % from in % from12 months
in CHF m 4Q2003 3Q2003 4Q2002 3Q2003 4Q2002 2003 2002 2002
Fixed Income 1,289 1,141 807 13 60 6,183 6,525 (5)Equity 820 931 787 (12) 4 3,516 4,379 (20)Investment Banking 951 790 1,394 20 (32) 3,346 4,899 (32)Other (284) 95 (312) – (9) (48) (876) (95)
Operating income 2,776 2,957 2,676 (6) 4 12,997 14,927 (13)
Personnel expenses 1,508 1,411 1,145 7 32 6,715 7,987 (16)Other operating expenses 734 748 919 (2) (20) 2,999 3,690 (19)
Operating expenses 2,242 2,159 2,064 4 9 9,714 11,677 (17)
Gross operating profit 534 798 612 (33) (13) 3,283 3,250 1
Depreciation of non-current assets 152 117 117 30 30 514 609 (16)Valuation adjustments, provisions and losses 25 111 1,006 (77) (98) 363 2,595 (86)
Net operating profit/(loss) before extraordinary and exceptional items, acquisition-related costs, cumulative effect of change in accounting principle and taxes 357 570 (511) (37) – 2,406 46 –
Extraordinary income/(expenses), net 32 2 383 – (92) 34 408 (92)Taxes 2) (14) (92) 240 (85) – (523) 182 –
Net operating profit before exceptional items, acquisition-related costs and cumulative effect of change in accounting principle (segment result) 375 480 112 (22) 235 1,917 636 201
1) Certain acquisition-related costs, including acquisition interest, amortization of retention payments and amortization of acquired intangible assets and goodwill,exceptional items and cumulative effect of change in accounting principle not allocated to the segments are included in the business unit results. In 4Q2003 CreditSuisse Group applied mandatory changes in Swiss Federal Banking Commission guidelines. Prior periods are not required to be adjusted. The impact on the results isshown on page 21. 2) In 4Q2002, Credit Suisse Group adopted a change in accounting principle relating to the recognition of deferred tax assets on net operatinglosses. The retroactive application of this change in accounting principle would have resulted in taxes for 4Q2002 of CHF 42 m.
Institutional Securities income statement 1)
in CHF m 31.12.03 30.09.03 31.12.02
Total assets 588,783 625,767 573,628
Total assets in USD m 476,477 473,027 412,623
Due from banks 194,817 233,811 193,944of which securities lending and reverse repurchase agreements 143,196 168,498 152,221
Due from customers 113,823 111,211 114,191of which securities lending and reverse repurchase agreements 62,252 42,876 56,851
Mortgages 12,234 14,599 14,825Securities and precious metals trading portfolios 186,130 179,442 157,320
Due to banks 292,550 313,915 281,510of which securities borrowing and repurchase agreements 104,855 113,590 112,733
Due to customers, other 111,844 115,317 109,980of which securities borrowing and repurchase agreements 71,843 60,544 66,864
Institutional Securities balance sheet information
25
For a detailed discussion of the full-year 2003 results please refer to the Credit Suisse Group Annual Report2003, which is posted on the Internet at www.credit-suisse.com/annualreport2003.
USD m CHF m
4Q2003 3Q2003 4Q2002 4Q2003 3Q2003 4Q2002
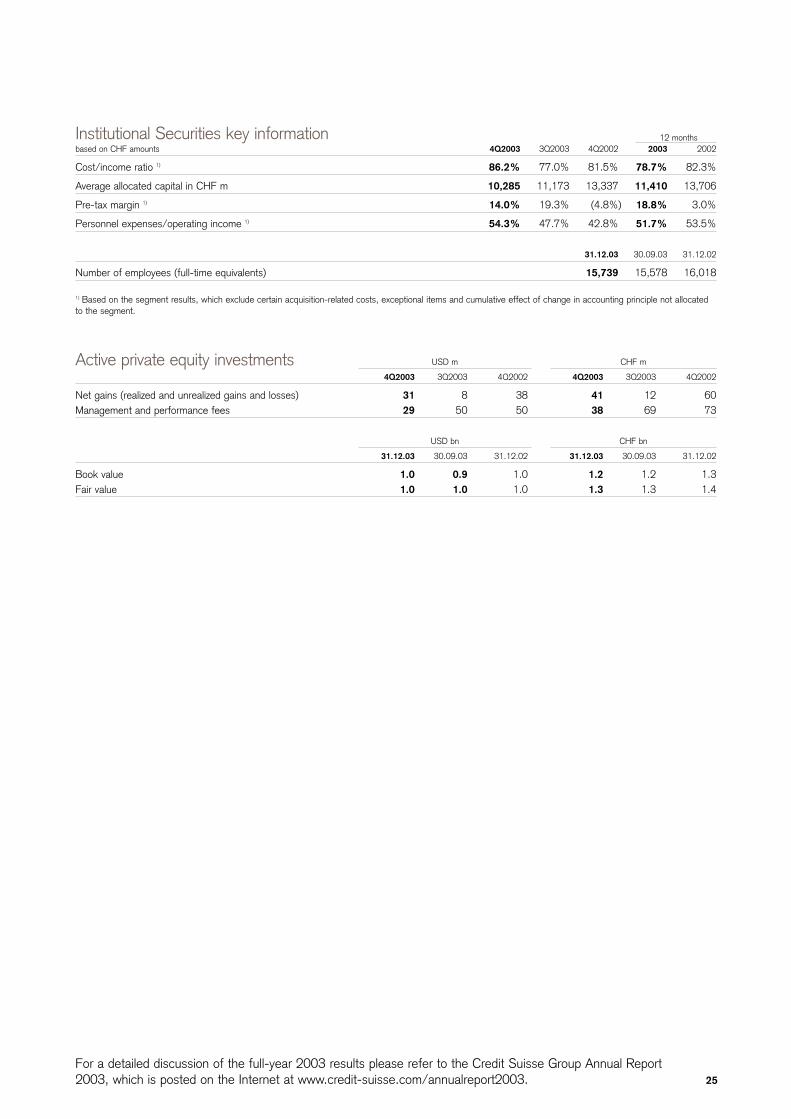
Net gains (realized and unrealized gains and losses) 31 8 38 41 12 60Management and performance fees 29 50 50 38 69 73
USD bn CHF bn
31.12.03 30.09.03 31.12.02 31.12.03 30.09.03 31.12.02
Book value 1.0 0.9 1.0 1.2 1.2 1.3Fair value 1.0 1.0 1.0 1.3 1.3 1.4
Active private equity investments
12 monthsbased on CHF amounts 4Q2003 3Q2003 4Q2002 2003 2002
Cost/income ratio 1) 86.2% 77.0% 81.5% 78.7% 82.3%
Average allocated capital in CHF m 10,285 11,173 13,337 11,410 13,706
Pre-tax margin 1) 14.0% 19.3% (4.8%) 18.8% 3.0%
Personnel expenses/operating income 1) 54.3% 47.7% 42.8% 51.7% 53.5%
31.12.03 30.09.03 31.12.02
Number of employees (full-time equivalents) 15,739 15,578 16,018
1) Based on the segment results, which exclude certain acquisition-related costs, exceptional items and cumulative effect of change in accounting principle not allocatedto the segment.
Institutional Securities key information

CREDIT SUISSE F IRST BOSTON
26
For a detailed discussion of the full-year 2003 results please refer to the Credit Suisse Group Annual Report2003, which is posted on the Internet at www.credit-suisse.com/annualreport2003.
Change Change Changein % from in % from in % from12 months
in USD m 4Q2003 3Q2003 4Q2002 3Q2003 4Q2002 2003 2002 2002
Net interest income 10 9 43 11 (77) 39 203 (81)Net commission and service fee income 264 245 407 8 (35) 976 1,650 (41)Net trading income 33 17 19 94 74 104 107 (3)Other ordinary income 0 16 (6) (100) (100) 36 31 16
Operating income 307 287 463 7 (34) 1,155 1,991 (42)
Personnel expenses 163 157 227 4 (28) 606 968 (37)Other operating expenses 92 77 150 19 (39) 322 599 (46)
Operating expenses 255 234 377 9 (32) 928 1,567 (41)
Gross operating profit 52 53 86 (2) (40) 227 424 (46)
Depreciation of non-current assets 7 5 25 40 (72) 27 91 (70)Valuation adjustments, provisions and losses 17 0 (7) – – 26 15 73
Net operating profit before extraordinaryand exceptional items, acquisition-related costs,cumulative effect of change in accounting principleand taxes 28 48 68 (42) (59) 174 318 (45)
Extraordinary income/(expenses), net 99 0 0 – – 99 0 –Taxes 2) (35) (14) (19) 150 84 (72) (91) (21)
Net operating profit before exceptional items, acquisition-related costs and cumulative effect of change in accounting principle (segment result) 92 34 49 171 88 201 227 (11)
1) Certain acquisition-related costs, including acquisition interest, amortization of retention payments and amortization of acquired intangible assets and goodwill,exceptional items and cumulative effect of change in accounting principle not allocated to the segments are included in the business unit results. In 4Q2003 CreditSuisse Group applied mandatory changes in Swiss Federal Banking Commission guidelines. Prior periods are not required to be adjusted. The impact on the results isshown on page 21. 2) In 4Q2002, Credit Suisse Group adopted a change in accounting principle relating to the recognition of deferred tax assets on net operatinglosses. The retroactive application of this change in accounting principle would have resulted in taxes for 4Q2002 of USD –19 m.
CSFB Financial Services income statement 1)
Change Change Changein % from in % from in % from12 months
in CHF m 4Q2003 3Q2003 4Q2002 3Q2003 4Q2002 2003 2002 2002
Net interest income 14 13 62 8 (77) 54 317 (83)Net commission and service fee income 350 337 599 4 (42) 1,318 2,575 (49)Net trading income 44 24 25 83 76 140 166 (16)Other ordinary income 0 21 (11) (100) (100) 48 48 0
Operating income 408 395 675 3 (40) 1,560 3,106 (50)
Personnel expenses 217 216 330 0 (34) 819 1,509 (46)Other operating expenses 122 106 222 15 (45) 435 935 (53)
Operating expenses 339 322 552 5 (39) 1,254 2,444 (49)
Gross operating profit 69 73 123 (5) (44) 306 662 (54)
Depreciation of non-current assets 10 8 38 25 (74) 37 142 (74)Valuation adjustments, provisions and losses 23 0 (13) – – 35 23 52
Net operating profit before extraordinaryand exceptional items, acquisition-related costs,cumulative effect of change in accounting principleand taxes 36 65 98 (45) (63) 234 497 (53)
Extraordinary income/(expenses), net 134 0 0 – – 134 0 –Taxes 2) (47) (19) (27) 147 74 (97) (142) (32)
Net operating profit before exceptional items, acquisition-related costs and cumulative effect of change in accounting principle (segment result) 123 46 71 167 73 271 355 (24)
1) Certain acquisition-related costs, including acquisition interest, amortization of retention payments and amortization of acquired intangible assets and goodwill,exceptional items and cumulative effect of change in accounting principle not allocated to the segments are included in the business unit results. In 4Q2003 CreditSuisse Group applied mandatory changes in Swiss Federal Banking Commission guidelines. Prior periods are not required to be adjusted. The impact on the results isshown on page 21. 2) In 4Q2002, Credit Suisse Group adopted a change in accounting principle relating to the recognition of deferred tax assets on net operatinglosses. The retroactive application of this change in accounting principle would have resulted in taxes for 4Q2002 of CHF –27 m.
CSFB Financial Services income statement 1)
27
For a detailed discussion of the full-year 2003 results please refer to the Credit Suisse Group Annual Report2003, which is posted on the Internet at www.credit-suisse.com/annualreport2003.
12 monthsbased on CHF amounts 4Q2003 3Q2003 4Q2002 2003 2002
Cost/income ratio 1) 85.5% 83.5% 87.4% 82.8% 83.3%
Average allocated capital in CHF m 503 495 701 529 939
Pre-tax margin 1) 41.7% 16.5% 14.5% 23.6% 16.0%
Personnel expenses/operating income 1) 53.2% 54.7% 48.9% 52.5% 48.6%
Net new assets Credit Suisse Asset Management in CHF bn (discretionary) 2) (2.4) (5.5) (8.6) (14.8) (31.3)Net new assets Private Client Services in CHF bn 0.8 (1.5) 2.7 (0.9) 8.0
Growth in assets under management 2) (5.6%) (1.5%) (2.8%) (5.8%) (24.2%)
Growth in discretionary assets under management – Credit Suisse Asset Management 2) (0.5%) (1.2%) (4.6%) (0.2%) (23.5%)of which net new assets 2) (0.9%) (1.9%) (3.0%) (5.3%) (8.6%)of which market movement and structural effects 0.4% 0.7% (1.6%) 5.1% (14.9%)
Growth in net new assets Private Client Services 1.2% (2.3%) 3.9% (1.3%) 8.6%
31.12.03 30.09.03 31.12.02
Assets under management in CHF bn 2) 454.1 481.2 482.2of which Credit Suisse Asset Management 2) 392.9 413.7 412.8of which Private Client Services 61.2 65.1 67.5
Discretionary assets under management in CHF bn 2) 295.7 295.9 297.0of which Credit Suisse Asset Management 2) 278.1 279.5 278.7
of which mutual funds distributed 110.0 112.6 106.5of which Private Client Services 17.6 16.4 18.3
Advisory assets under management in CHF bn 2) 158.4 185.3 185.2
Number of employees (full-time equivalents) 2,602 2,617 6,783
1) Based on the segment results, which exclude certain acquisition-related costs, exceptional items and cumulative effect of change in accounting principle not allocatedto the segment. 2) Credit Suisse Asset Management figures for assets under management and net new assets include assets managed on behalf of other entitieswithin Credit Suisse Group. This differs from the presentation in the overview of Credit Suisse Group, where such assets are eliminated.
CSFB Financial Services key information
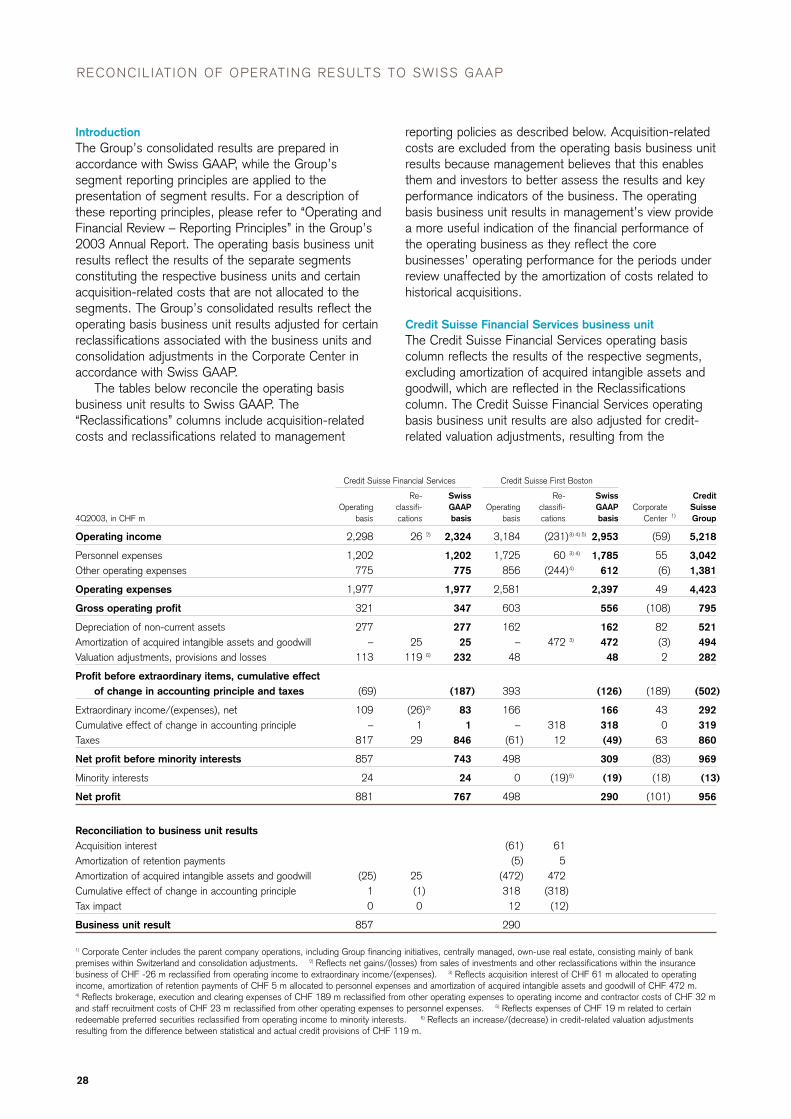
28
RECONCIL IAT ION OF OPERATING RESULTS TO SWISS GAAP
IntroductionThe Group’s consolidated results are prepared inaccordance with Swiss GAAP, while the Group’ssegment reporting principles are applied to thepresentation of segment results. For a description ofthese reporting principles, please refer to “Operating andFinancial Review – Reporting Principles” in the Group’s2003 Annual Report. The operating basis business unitresults reflect the results of the separate segmentsconstituting the respective business units and certainacquisition-related costs that are not allocated to thesegments. The Group’s consolidated results reflect theoperating basis business unit results adjusted for certainreclassifications associated with the business units andconsolidation adjustments in the Corporate Center inaccordance with Swiss GAAP.
The tables below reconcile the operating basisbusiness unit results to Swiss GAAP. The“Reclassifications” columns include acquisition-relatedcosts and reclassifications related to management
reporting policies as described below. Acquisition-relatedcosts are excluded from the operating basis business unitresults because management believes that this enablesthem and investors to better assess the results and keyperformance indicators of the business. The operatingbasis business unit results in management’s view providea more useful indication of the financial performance ofthe operating business as they reflect the corebusinesses’ operating performance for the periods underreview unaffected by the amortization of costs related tohistorical acquisitions.
Credit Suisse Financial Services business unitThe Credit Suisse Financial Services operating basiscolumn reflects the results of the respective segments,excluding amortization of acquired intangible assets andgoodwill, which are reflected in the Reclassificationscolumn. The Credit Suisse Financial Services operatingbasis business unit results are also adjusted for credit-related valuation adjustments, resulting from the
Credit Suisse Financial Services Credit Suisse First Boston
Re- Swiss Re- Swiss Credit Operating classifi- GAAP Operating classifi- GAAP Corporate Suisse
4Q2003, in CHF m basis cations basis basis cations basis Center 1) Group
Operating income 2,298 26 2) 2,324 3,184 (231)3) 4) 5) 2,953 (59) 5,218
Personnel expenses 1,202 1,202 1,725 60 3) 4) 1,785 55 3,042Other operating expenses 775 775 856 (244)4) 612 (6) 1,381
Operating expenses 1,977 1,977 2,581 2,397 49 4,423
Gross operating profit 321 347 603 556 (108) 795
Depreciation of non-current assets 277 277 162 162 82 521Amortization of acquired intangible assets and goodwill – 25 25 – 472 3) 472 (3) 494Valuation adjustments, provisions and losses 113 119 6) 232 48 48 2 282
Profit before extraordinary items, cumulative effect of change in accounting principle and taxes (69) (187) 393 (126) (189) (502)
Extraordinary income/(expenses), net 109 (26)2) 83 166 166 43 292Cumulative effect of change in accounting principle – 1 1 – 318 318 0 319Taxes 817 29 846 (61) 12 (49) 63 860
Net profit before minority interests 857 743 498 309 (83) 969
Minority interests 24 24 0 (19)5) (19) (18) (13)
Net profit 881 767 498 290 (101) 956
Reconciliation to business unit resultsAcquisition interest (61) 61Amortization of retention payments (5) 5Amortization of acquired intangible assets and goodwill (25) 25 (472) 472Cumulative effect of change in accounting principle 1 (1) 318 (318)Tax impact 0 0 12 (12)
Business unit result 857 290
1) Corporate Center includes the parent company operations, including Group financing initiatives, centrally managed, own-use real estate, consisting mainly of bankpremises within Switzerland and consolidation adjustments. 2) Reflects net gains/(losses) from sales of investments and other reclassifications within the insurancebusiness of CHF -26 m reclassified from operating income to extraordinary income/(expenses). 3) Reflects acquisition interest of CHF 61 m allocated to operatingincome, amortization of retention payments of CHF 5 m allocated to personnel expenses and amortization of acquired intangible assets and goodwill of CHF 472 m.4) Reflects brokerage, execution and clearing expenses of CHF 189 m reclassified from other operating expenses to operating income and contractor costs of CHF 32 mand staff recruitment costs of CHF 23 m reclassified from other operating expenses to personnel expenses. 5) Reflects expenses of CHF 19 m related to certainredeemable preferred securities reclassified from operating income to minority interests. 6) Reflects an increase/(decrease) in credit-related valuation adjustmentsresulting from the difference between statistical and actual credit provisions of CHF 119 m.
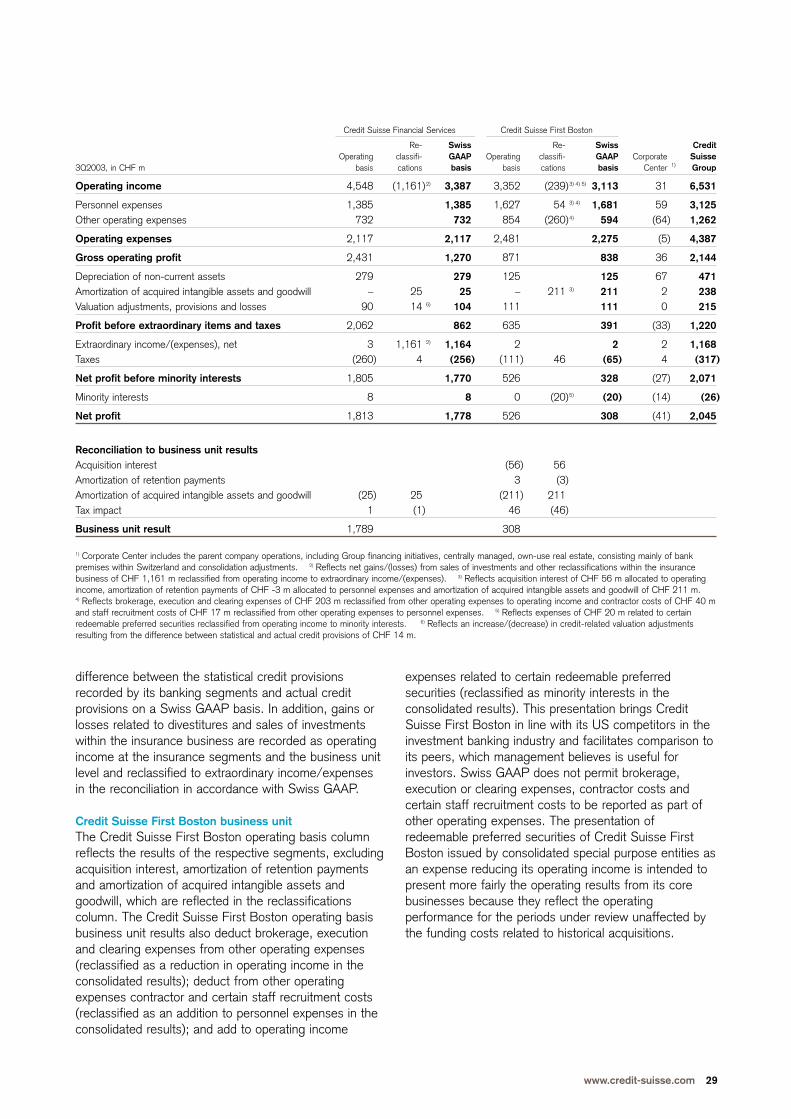
www.credit-suisse.com 29
Credit Suisse Financial Services Credit Suisse First Boston
Re- Swiss Re- Swiss Credit Operating classifi- GAAP Operating classifi- GAAP Corporate Suisse
3Q2003, in CHF m basis cations basis basis cations basis Center 1) Group
Operating income 4,548 (1,161)2) 3,387 3,352 (239)3) 4) 5) 3,113 31 6,531
Personnel expenses 1,385 1,385 1,627 54 3) 4) 1,681 59 3,125Other operating expenses 732 732 854 (260)4) 594 (64) 1,262
Operating expenses 2,117 2,117 2,481 2,275 (5) 4,387
Gross operating profit 2,431 1,270 871 838 36 2,144
Depreciation of non-current assets 279 279 125 125 67 471Amortization of acquired intangible assets and goodwill – 25 25 – 211 3) 211 2 238Valuation adjustments, provisions and losses 90 14 6) 104 111 111 0 215
Profit before extraordinary items and taxes 2,062 862 635 391 (33) 1,220
Extraordinary income/(expenses), net 3 1,161 2) 1,164 2 2 2 1,168Taxes (260) 4 (256) (111) 46 (65) 4 (317)
Net profit before minority interests 1,805 1,770 526 328 (27) 2,071
Minority interests 8 8 0 (20)5) (20) (14) (26)
Net profit 1,813 1,778 526 308 (41) 2,045
Reconciliation to business unit resultsAcquisition interest (56) 56Amortization of retention payments 3 (3)Amortization of acquired intangible assets and goodwill (25) 25 (211) 211Tax impact 1 (1) 46 (46)
Business unit result 1,789 308
1) Corporate Center includes the parent company operations, including Group financing initiatives, centrally managed, own-use real estate, consisting mainly of bankpremises within Switzerland and consolidation adjustments. 2) Reflects net gains/(losses) from sales of investments and other reclassifications within the insurancebusiness of CHF 1,161 m reclassified from operating income to extraordinary income/(expenses). 3) Reflects acquisition interest of CHF 56 m allocated to operatingincome, amortization of retention payments of CHF -3 m allocated to personnel expenses and amortization of acquired intangible assets and goodwill of CHF 211 m.4) Reflects brokerage, execution and clearing expenses of CHF 203 m reclassified from other operating expenses to operating income and contractor costs of CHF 40 mand staff recruitment costs of CHF 17 m reclassified from other operating expenses to personnel expenses. 5) Reflects expenses of CHF 20 m related to certainredeemable preferred securities reclassified from operating income to minority interests. 6) Reflects an increase/(decrease) in credit-related valuation adjustmentsresulting from the difference between statistical and actual credit provisions of CHF 14 m.
difference between the statistical credit provisionsrecorded by its banking segments and actual creditprovisions on a Swiss GAAP basis. In addition, gains orlosses related to divestitures and sales of investmentswithin the insurance business are recorded as operatingincome at the insurance segments and the business unitlevel and reclassified to extraordinary income/expensesin the reconciliation in accordance with Swiss GAAP.
Credit Suisse First Boston business unitThe Credit Suisse First Boston operating basis columnreflects the results of the respective segments, excludingacquisition interest, amortization of retention paymentsand amortization of acquired intangible assets andgoodwill, which are reflected in the reclassificationscolumn. The Credit Suisse First Boston operating basisbusiness unit results also deduct brokerage, executionand clearing expenses from other operating expenses(reclassified as a reduction in operating income in theconsolidated results); deduct from other operatingexpenses contractor and certain staff recruitment costs(reclassified as an addition to personnel expenses in theconsolidated results); and add to operating income
expenses related to certain redeemable preferredsecurities (reclassified as minority interests in theconsolidated results). This presentation brings CreditSuisse First Boston in line with its US competitors in theinvestment banking industry and facilitates comparison toits peers, which management believes is useful forinvestors. Swiss GAAP does not permit brokerage,execution or clearing expenses, contractor costs andcertain staff recruitment costs to be reported as part ofother operating expenses. The presentation ofredeemable preferred securities of Credit Suisse FirstBoston issued by consolidated special purpose entities asan expense reducing its operating income is intended topresent more fairly the operating results from its corebusinesses because they reflect the operatingperformance for the periods under review unaffected bythe funding costs related to historical acquisitions.
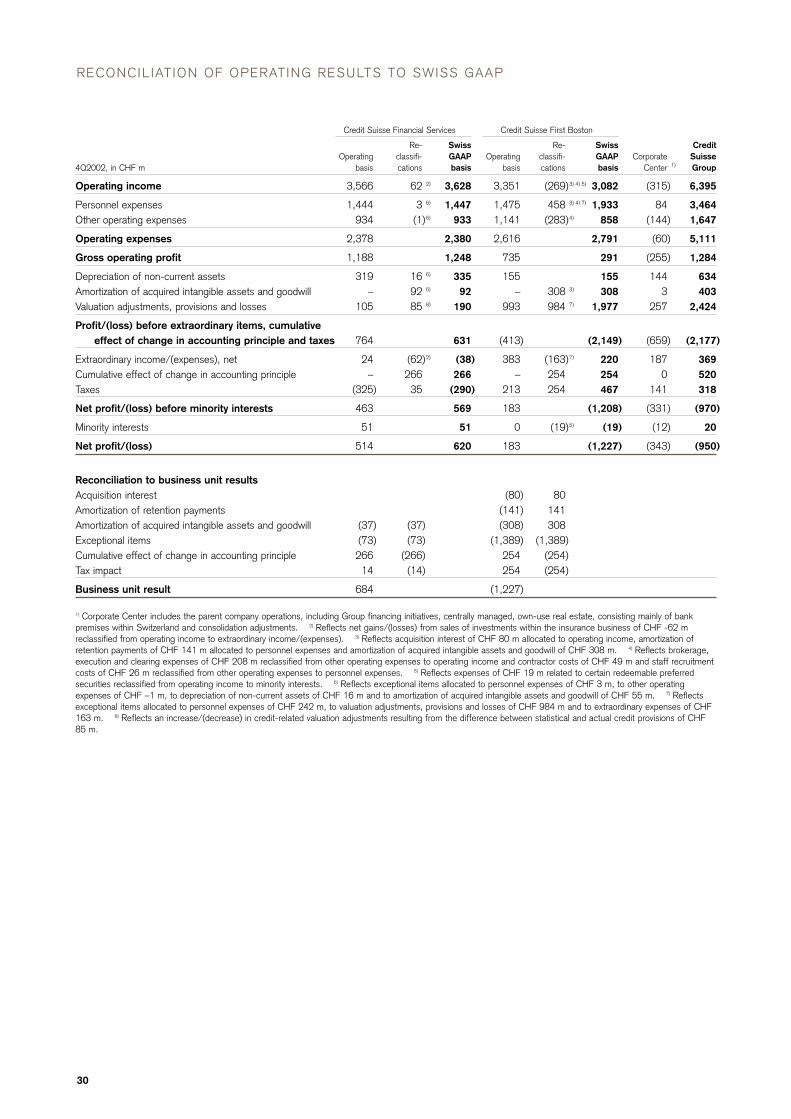
30
RECONCIL IAT ION OF OPERATING RESULTS TO SWISS GAAP
Credit Suisse Financial Services Credit Suisse First Boston
Re- Swiss Re- Swiss Credit Operating classifi- GAAP Operating classifi- GAAP Corporate Suisse
4Q2002, in CHF m basis cations basis basis cations basis Center 1) Group
Operating income 3,566 62 2) 3,628 3,351 (269)3) 4) 5) 3,082 (315) 6,395
Personnel expenses 1,444 3 6) 1,447 1,475 458 3) 4) 7) 1,933 84 3,464Other operating expenses 934 (1)6) 933 1,141 (283)4) 858 (144) 1,647
Operating expenses 2,378 2,380 2,616 2,791 (60) 5,111
Gross operating profit 1,188 1,248 735 291 (255) 1,284
Depreciation of non-current assets 319 16 6) 335 155 155 144 634Amortization of acquired intangible assets and goodwill – 92 6) 92 – 308 3) 308 3 403Valuation adjustments, provisions and losses 105 85 8) 190 993 984 7) 1,977 257 2,424
Profit/(loss) before extraordinary items, cumulativeeffect of change in accounting principle and taxes 764 631 (413) (2,149) (659) (2,177)
Extraordinary income/(expenses), net 24 (62)2) (38) 383 (163)7) 220 187 369Cumulative effect of change in accounting principle – 266 266 – 254 254 0 520Taxes (325) 35 (290) 213 254 467 141 318
Net profit/(loss) before minority interests 463 569 183 (1,208) (331) (970)
Minority interests 51 51 0 (19)5) (19) (12) 20
Net profit/(loss) 514 620 183 (1,227) (343) (950)
Reconciliation to business unit resultsAcquisition interest (80) 80Amortization of retention payments (141) 141Amortization of acquired intangible assets and goodwill (37) (37) (308) 308Exceptional items (73) (73) (1,389) (1,389)Cumulative effect of change in accounting principle 266 (266) 254 (254)Tax impact 14 (14) 254 (254)
Business unit result 684 (1,227)
1) Corporate Center includes the parent company operations, including Group financing initiatives, centrally managed, own-use real estate, consisting mainly of bankpremises within Switzerland and consolidation adjustments. 2) Reflects net gains/(losses) from sales of investments within the insurance business of CHF -62 mreclassified from operating income to extraordinary income/(expenses). 3) Reflects acquisition interest of CHF 80 m allocated to operating income, amortization ofretention payments of CHF 141 m allocated to personnel expenses and amortization of acquired intangible assets and goodwill of CHF 308 m. 4) Reflects brokerage,execution and clearing expenses of CHF 208 m reclassified from other operating expenses to operating income and contractor costs of CHF 49 m and staff recruitmentcosts of CHF 26 m reclassified from other operating expenses to personnel expenses. 5) Reflects expenses of CHF 19 m related to certain redeemable preferredsecurities reclassified from operating income to minority interests. 6) Reflects exceptional items allocated to personnel expenses of CHF 3 m, to other operatingexpenses of CHF –1 m, to depreciation of non-current assets of CHF 16 m and to amortization of acquired intangible assets and goodwill of CHF 55 m. 7) Reflectsexceptional items allocated to personnel expenses of CHF 242 m, to valuation adjustments, provisions and losses of CHF 984 m and to extraordinary expenses of CHF163 m. 8) Reflects an increase/(decrease) in credit-related valuation adjustments resulting from the difference between statistical and actual credit provisions of CHF85 m.
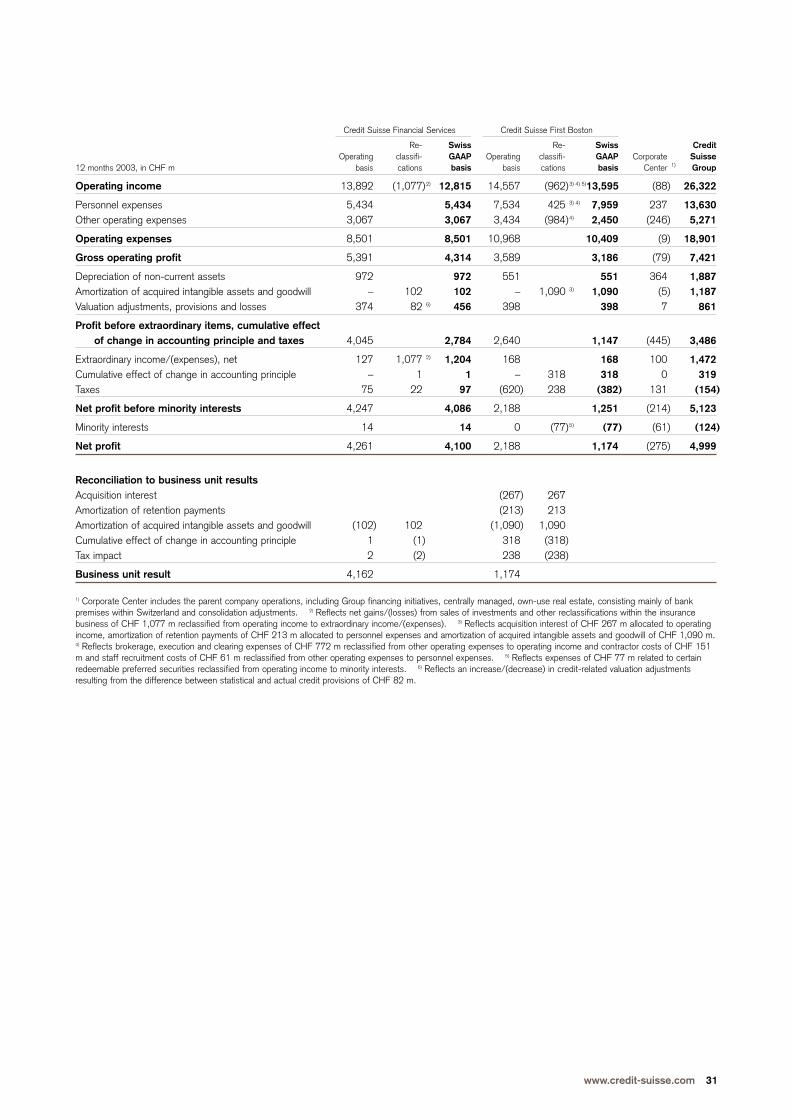
www.credit-suisse.com 31
Credit Suisse Financial Services Credit Suisse First Boston
Re- Swiss Re- Swiss Credit Operating classifi- GAAP Operating classifi- GAAP Corporate Suisse
12 months 2003, in CHF m basis cations basis basis cations basis Center 1) Group
Operating income 13,892 (1,077)2) 12,815 14,557 (962)3) 4) 5)13,595 (88) 26,322
Personnel expenses 5,434 5,434 7,534 425 3) 4) 7,959 237 13,630Other operating expenses 3,067 3,067 3,434 (984)4) 2,450 (246) 5,271
Operating expenses 8,501 8,501 10,968 10,409 (9) 18,901
Gross operating profit 5,391 4,314 3,589 3,186 (79) 7,421
Depreciation of non-current assets 972 972 551 551 364 1,887Amortization of acquired intangible assets and goodwill – 102 102 – 1,090 3) 1,090 (5) 1,187Valuation adjustments, provisions and losses 374 82 6) 456 398 398 7 861
Profit before extraordinary items, cumulative effect of change in accounting principle and taxes 4,045 2,784 2,640 1,147 (445) 3,486
Extraordinary income/(expenses), net 127 1,077 2) 1,204 168 168 100 1,472Cumulative effect of change in accounting principle – 1 1 – 318 318 0 319Taxes 75 22 97 (620) 238 (382) 131 (154)
Net profit before minority interests 4,247 4,086 2,188 1,251 (214) 5,123
Minority interests 14 14 0 (77)5) (77) (61) (124)
Net profit 4,261 4,100 2,188 1,174 (275) 4,999
Reconciliation to business unit resultsAcquisition interest (267) 267Amortization of retention payments (213) 213Amortization of acquired intangible assets and goodwill (102) 102 (1,090) 1,090Cumulative effect of change in accounting principle 1 (1) 318 (318)Tax impact 2 (2) 238 (238)
Business unit result 4,162 1,174
1) Corporate Center includes the parent company operations, including Group financing initiatives, centrally managed, own-use real estate, consisting mainly of bankpremises within Switzerland and consolidation adjustments. 2) Reflects net gains/(losses) from sales of investments and other reclassifications within the insurancebusiness of CHF 1,077 m reclassified from operating income to extraordinary income/(expenses). 3) Reflects acquisition interest of CHF 267 m allocated to operatingincome, amortization of retention payments of CHF 213 m allocated to personnel expenses and amortization of acquired intangible assets and goodwill of CHF 1,090 m.4) Reflects brokerage, execution and clearing expenses of CHF 772 m reclassified from other operating expenses to operating income and contractor costs of CHF 151m and staff recruitment costs of CHF 61 m reclassified from other operating expenses to personnel expenses. 5) Reflects expenses of CHF 77 m related to certainredeemable preferred securities reclassified from operating income to minority interests. 6) Reflects an increase/(decrease) in credit-related valuation adjustmentsresulting from the difference between statistical and actual credit provisions of CHF 82 m.
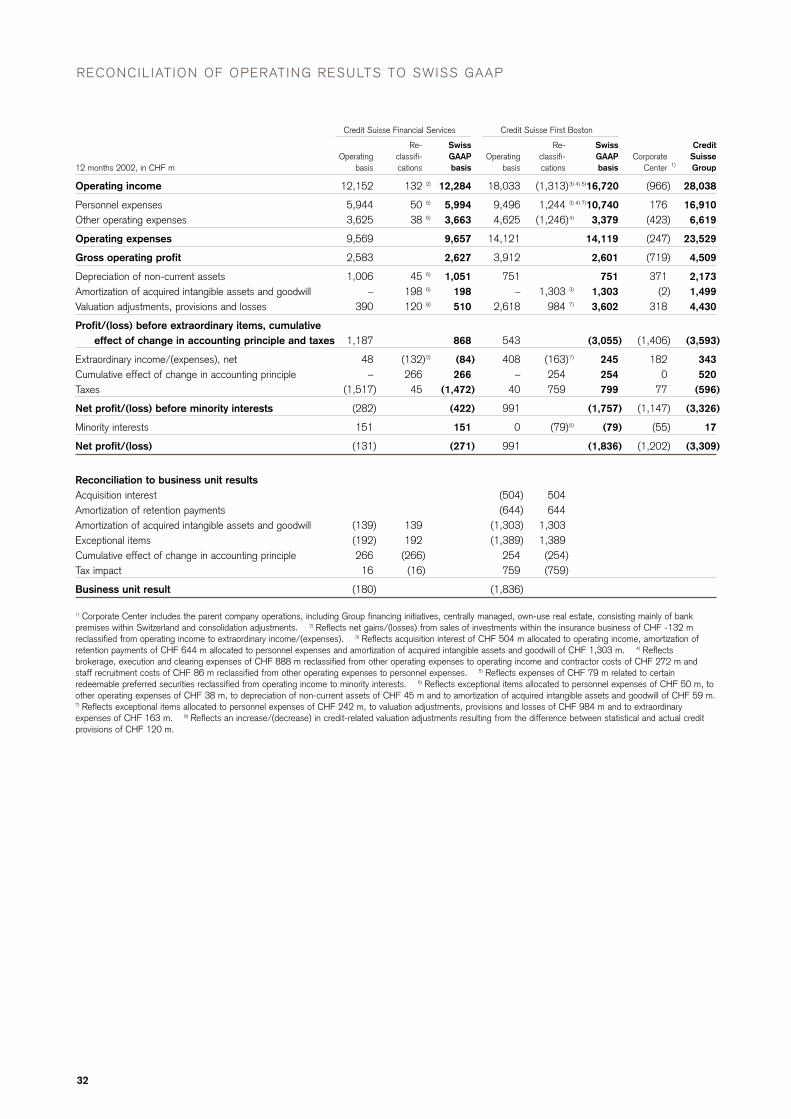
32
RECONCIL IAT ION OF OPERATING RESULTS TO SWISS GAAP
Credit Suisse Financial Services Credit Suisse First Boston
Re- Swiss Re- Swiss Credit Operating classifi- GAAP Operating classifi- GAAP Corporate Suisse
12 months 2002, in CHF m basis cations basis basis cations basis Center 1) Group
Operating income 12,152 132 2) 12,284 18,033 (1,313)3) 4) 5)16,720 (966) 28,038
Personnel expenses 5,944 50 6) 5,994 9,496 1,244 3) 4) 7)10,740 176 16,910Other operating expenses 3,625 38 6) 3,663 4,625 (1,246)4) 3,379 (423) 6,619
Operating expenses 9,569 9,657 14,121 14,119 (247) 23,529
Gross operating profit 2,583 2,627 3,912 2,601 (719) 4,509
Depreciation of non-current assets 1,006 45 6) 1,051 751 751 371 2,173Amortization of acquired intangible assets and goodwill – 198 6) 198 – 1,303 3) 1,303 (2) 1,499Valuation adjustments, provisions and losses 390 120 8) 510 2,618 984 7) 3,602 318 4,430
Profit/(loss) before extraordinary items, cumulativeeffect of change in accounting principle and taxes 1,187 868 543 (3,055) (1,406) (3,593)
Extraordinary income/(expenses), net 48 (132)2) (84) 408 (163)7) 245 182 343Cumulative effect of change in accounting principle – 266 266 – 254 254 0 520Taxes (1,517) 45 (1,472) 40 759 799 77 (596)
Net profit/(loss) before minority interests (282) (422) 991 (1,757) (1,147) (3,326)
Minority interests 151 151 0 (79)5) (79) (55) 17
Net profit/(loss) (131) (271) 991 (1,836) (1,202) (3,309)
Reconciliation to business unit resultsAcquisition interest (504) 504Amortization of retention payments (644) 644Amortization of acquired intangible assets and goodwill (139) 139 (1,303) 1,303Exceptional items (192) 192 (1,389) 1,389Cumulative effect of change in accounting principle 266 (266) 254 (254)Tax impact 16 (16) 759 (759)
Business unit result (180) (1,836)
1) Corporate Center includes the parent company operations, including Group financing initiatives, centrally managed, own-use real estate, consisting mainly of bankpremises within Switzerland and consolidation adjustments. 2) Reflects net gains/(losses) from sales of investments within the insurance business of CHF -132 mreclassified from operating income to extraordinary income/(expenses). 3) Reflects acquisition interest of CHF 504 m allocated to operating income, amortization ofretention payments of CHF 644 m allocated to personnel expenses and amortization of acquired intangible assets and goodwill of CHF 1,303 m. 4) Reflectsbrokerage, execution and clearing expenses of CHF 888 m reclassified from other operating expenses to operating income and contractor costs of CHF 272 m andstaff recruitment costs of CHF 86 m reclassified from other operating expenses to personnel expenses. 5) Reflects expenses of CHF 79 m related to certainredeemable preferred securities reclassified from operating income to minority interests. 6) Reflects exceptional items allocated to personnel expenses of CHF 50 m, toother operating expenses of CHF 38 m, to depreciation of non-current assets of CHF 45 m and to amortization of acquired intangible assets and goodwill of CHF 59 m.7) Reflects exceptional items allocated to personnel expenses of CHF 242 m, to valuation adjustments, provisions and losses of CHF 984 m and to extraordinaryexpenses of CHF 163 m. 8) Reflects an increase/(decrease) in credit-related valuation adjustments resulting from the difference between statistical and actual creditprovisions of CHF 120 m.
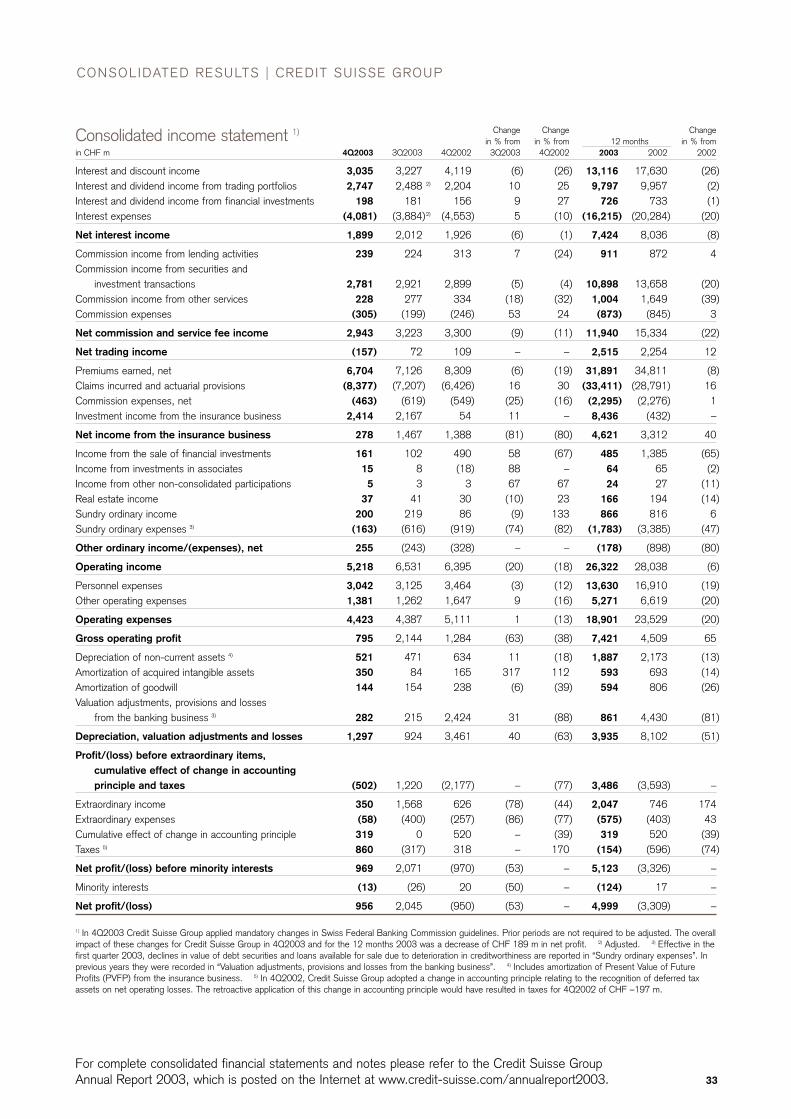
33
For complete consolidated financial statements and notes please refer to the Credit Suisse Group Annual Report 2003, which is posted on the Internet at www.credit-suisse.com/annualreport2003.
Change Change Changein % from in % from in % from12 months
in CHF m 4Q2003 3Q2003 4Q2002 3Q2003 4Q2002 2003 2002 2002
Interest and discount income 3,035 3,227 4,119 (6) (26) 13,116 17,630 (26)Interest and dividend income from trading portfolios 2,747 2,488 2) 2,204 10 25 9,797 9,957 (2)Interest and dividend income from financial investments 198 181 156 9 27 726 733 (1)Interest expenses (4,081) (3,884)2) (4,553) 5 (10) (16,215) (20,284) (20)
Net interest income 1,899 2,012 1,926 (6) (1) 7,424 8,036 (8)
Commission income from lending activities 239 224 313 7 (24) 911 872 4Commission income from securities and
investment transactions 2,781 2,921 2,899 (5) (4) 10,898 13,658 (20)Commission income from other services 228 277 334 (18) (32) 1,004 1,649 (39)Commission expenses (305) (199) (246) 53 24 (873) (845) 3
Net commission and service fee income 2,943 3,223 3,300 (9) (11) 11,940 15,334 (22)
Net trading income (157) 72 109 – – 2,515 2,254 12
Premiums earned, net 6,704 7,126 8,309 (6) (19) 31,891 34,811 (8)Claims incurred and actuarial provisions (8,377) (7,207) (6,426) 16 30 (33,411) (28,791) 16Commission expenses, net (463) (619) (549) (25) (16) (2,295) (2,276) 1Investment income from the insurance business 2,414 2,167 54 11 – 8,436 (432) –
Net income from the insurance business 278 1,467 1,388 (81) (80) 4,621 3,312 40
Income from the sale of financial investments 161 102 490 58 (67) 485 1,385 (65)Income from investments in associates 15 8 (18) 88 – 64 65 (2)Income from other non-consolidated participations 5 3 3 67 67 24 27 (11)Real estate income 37 41 30 (10) 23 166 194 (14)Sundry ordinary income 200 219 86 (9) 133 866 816 6Sundry ordinary expenses 3) (163) (616) (919) (74) (82) (1,783) (3,385) (47)
Other ordinary income/(expenses), net 255 (243) (328) – – (178) (898) (80)
Operating income 5,218 6,531 6,395 (20) (18) 26,322 28,038 (6)
Personnel expenses 3,042 3,125 3,464 (3) (12) 13,630 16,910 (19)Other operating expenses 1,381 1,262 1,647 9 (16) 5,271 6,619 (20)
Operating expenses 4,423 4,387 5,111 1 (13) 18,901 23,529 (20)
Gross operating profit 795 2,144 1,284 (63) (38) 7,421 4,509 65
Depreciation of non-current assets 4) 521 471 634 11 (18) 1,887 2,173 (13)Amortization of acquired intangible assets 350 84 165 317 112 593 693 (14)Amortization of goodwill 144 154 238 (6) (39) 594 806 (26)Valuation adjustments, provisions and losses
from the banking business 3) 282 215 2,424 31 (88) 861 4,430 (81)
Depreciation, valuation adjustments and losses 1,297 924 3,461 40 (63) 3,935 8,102 (51)
Profit/(loss) before extraordinary items, cumulative effect of change in accounting principle and taxes (502) 1,220 (2,177) – (77) 3,486 (3,593) –
Extraordinary income 350 1,568 626 (78) (44) 2,047 746 174Extraordinary expenses (58) (400) (257) (86) (77) (575) (403) 43Cumulative effect of change in accounting principle 319 0 520 – (39) 319 520 (39)Taxes 5) 860 (317) 318 – 170 (154) (596) (74)
Net profit/(loss) before minority interests 969 2,071 (970) (53) – 5,123 (3,326) –
Minority interests (13) (26) 20 (50) – (124) 17 –
Net profit/(loss) 956 2,045 (950) (53) – 4,999 (3,309) –
1) In 4Q2003 Credit Suisse Group applied mandatory changes in Swiss Federal Banking Commission guidelines. Prior periods are not required to be adjusted. The overallimpact of these changes for Credit Suisse Group in 4Q2003 and for the 12 months 2003 was a decrease of CHF 189 m in net profit. 2) Adjusted. 3) Effective in thefirst quarter 2003, declines in value of debt securities and loans available for sale due to deterioration in creditworthiness are reported in “Sundry ordinary expenses”. Inprevious years they were recorded in “Valuation adjustments, provisions and losses from the banking business”. 4) Includes amortization of Present Value of FutureProfits (PVFP) from the insurance business. 5) In 4Q2002, Credit Suisse Group adopted a change in accounting principle relating to the recognition of deferred taxassets on net operating losses. The retroactive application of this change in accounting principle would have resulted in taxes for 4Q2002 of CHF –197 m.
Consolidated income statement 1)
CONSOLIDATED RESULTS | CREDIT SUISSE GROUP

CONSOLIDATED RESULTS | CREDIT SUISSE GROUP
34
For complete consolidated financial statements and notes please refer to the Credit Suisse Group Annual Report 2003, which is posted on the Internet at www.credit-suisse.com/annualreport2003.
Changein % from
in CHF m 31.12.03 31.12.02 31.12.02
AssetsCash and other liquid assets 3,026 2,551 19Money market papers 16,355 25,125 (35)Due from banks 192,833 195,778 (2)Receivables from the insurance business 9,725 12,290 (21)Due from customers 170,486 182,143 (6)Mortgages 98,214 94,896 3Securities and precious metals trading portfolios 200,057 173,133 16Financial investments from the banking business 42,141 33,394 26Investments from the insurance business 129,395 128,450 1Non-consolidated participations 1,406 1,792 (22)Tangible fixed assets 6,922 8,152 (15)Intangible assets 13,467 18,359 (27)Accrued income and prepaid expenses 12,582 13,882 (9)Other assets 65,555 65,711 (0)
Total assets 962,164 955,656 1
Subordinated assets 7,561 5,846 1) 29Receivables due from non-consolidated participations 604 728 (17)
Liabilities and shareholders’ equityMoney market papers issued 27,700 22,178 25Due to banks 296,487 287,884 3Payables from the insurance business 10,939 10,218 7Due to customers in savings and investment deposits 43,747 39,739 10Due to customers, other 252,555 258,244 (2)Medium-term notes (cash bonds) 1,803 2,599 (31)Bonds and mortgage-backed bonds 79,080 81,839 (3)Accrued expenses and deferred income 17,018 17,463 (3)Other liabilities 59,058 56,070 5Valuation adjustments and provisions 7,243 11,557 (37)Technical provisions for the insurance business 131,842 136,471 (3)
Total liabilities 927,472 924,262 0
Reserve for general banking risks 1,739 1,739 0Share capital 1,195 1,190 0Capital reserve 20,824 20,710 1Revaluation reserves for the insurance business 885 1,504 (41)Reserve for own shares – 1,950 (100)Own shares, net (498) – –Retained earnings 2,592 4,732 (45)Minority interests 2,956 2,878 3Net profit/(loss) 4,999 (3,309) –
Total shareholders’ equity 34,692 31,394 11
Total liabilities and shareholders’ equity 962,164 955,656 1
Subordinated liabilities 19,018 21,070 1) (10)Liabilities due to non-consolidated participations 1,186 1,164 2
1) Adjusted.
Consolidated balance sheet
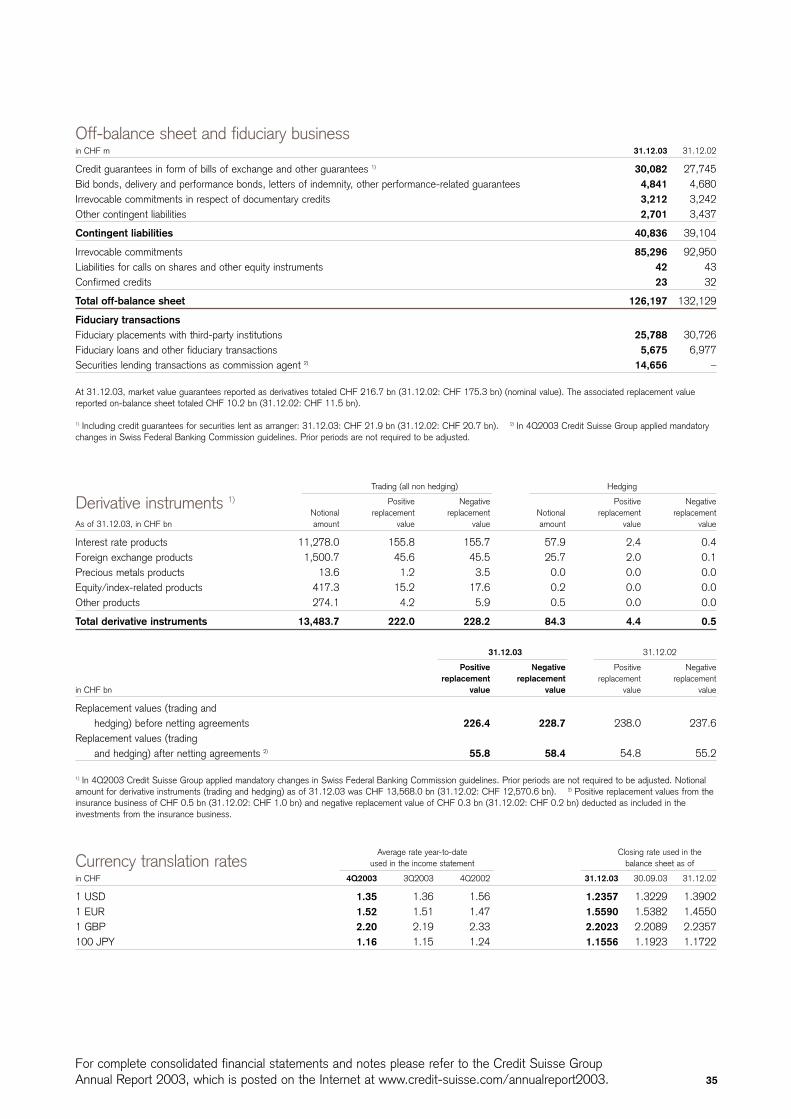
35
For complete consolidated financial statements and notes please refer to the Credit Suisse Group Annual Report 2003, which is posted on the Internet at www.credit-suisse.com/annualreport2003.
in CHF m 31.12.03 31.12.02
Credit guarantees in form of bills of exchange and other guarantees 1) 30,082 27,745Bid bonds, delivery and performance bonds, letters of indemnity, other performance-related guarantees 4,841 4,680Irrevocable commitments in respect of documentary credits 3,212 3,242Other contingent liabilities 2,701 3,437
Contingent liabilities 40,836 39,104
Irrevocable commitments 85,296 92,950Liabilities for calls on shares and other equity instruments 42 43Confirmed credits 23 32
Total off-balance sheet 126,197 132,129
Fiduciary transactionsFiduciary placements with third-party institutions 25,788 30,726Fiduciary loans and other fiduciary transactions 5,675 6,977Securities lending transactions as commission agent 2) 14,656 –
At 31.12.03, market value guarantees reported as derivatives totaled CHF 216.7 bn (31.12.02: CHF 175.3 bn) (nominal value). The associated replacement valuereported on-balance sheet totaled CHF 10.2 bn (31.12.02: CHF 11.5 bn).
1) Including credit guarantees for securities lent as arranger: 31.12.03: CHF 21.9 bn (31.12.02: CHF 20.7 bn). 2) In 4Q2003 Credit Suisse Group applied mandatorychanges in Swiss Federal Banking Commission guidelines. Prior periods are not required to be adjusted.
Off-balance sheet and fiduciary business
Trading (all non hedging) Hedging
Positive Negative Positive NegativeNotional replacement replacement Notional replacement replacement
As of 31.12.03, in CHF bn amount value value amount value value
Interest rate products 11,278.0 155.8 155.7 57.9 2.4 0.4Foreign exchange products 1,500.7 45.6 45.5 25.7 2.0 0.1Precious metals products 13.6 1.2 3.5 0.0 0.0 0.0Equity/index-related products 417.3 15.2 17.6 0.2 0.0 0.0Other products 274.1 4.2 5.9 0.5 0.0 0.0
Total derivative instruments 13,483.7 222.0 228.2 84.3 4.4 0.5
31.12.03 31.12.02
Positive Negative Positive Negativereplacement replacement replacement replacement
in CHF bn value value value value
Replacement values (trading and hedging) before netting agreements 226.4 228.7 238.0 237.6
Replacement values (trading and hedging) after netting agreements 2) 55.8 58.4 54.8 55.2
1) In 4Q2003 Credit Suisse Group applied mandatory changes in Swiss Federal Banking Commission guidelines. Prior periods are not required to be adjusted. Notionalamount for derivative instruments (trading and hedging) as of 31.12.03 was CHF 13,568.0 bn (31.12.02: CHF 12,570.6 bn). 2) Positive replacement values from theinsurance business of CHF 0.5 bn (31.12.02: CHF 1.0 bn) and negative replacement value of CHF 0.3 bn (31.12.02: CHF 0.2 bn) deducted as included in theinvestments from the insurance business.
Derivative instruments 1)
Average rate year-to-date Closing rate used in theused in the income statement balance sheet as of
in CHF 4Q2003 3Q2003 4Q2002 31.12.03 30.09.03 31.12.02
1 USD 1.35 1.36 1.56 1.2357 1.3229 1.39021 EUR 1.52 1.51 1.47 1.5590 1.5382 1.45501 GBP 2.20 2.19 2.33 2.2023 2.2089 2.2357100 JPY 1.16 1.15 1.24 1.1556 1.1923 1.1722
Currency translation rates
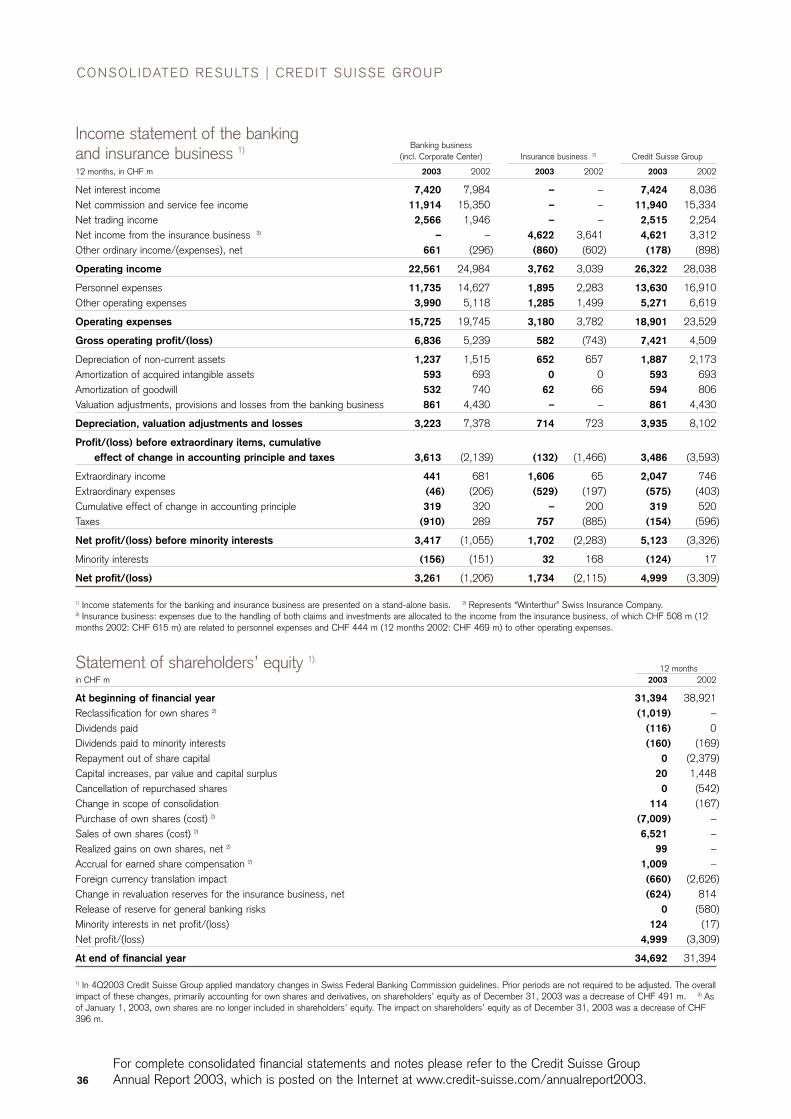
CONSOLIDATED RESULTS | CREDIT SUISSE GROUP
36
For complete consolidated financial statements and notes please refer to the Credit Suisse Group Annual Report 2003, which is posted on the Internet at www.credit-suisse.com/annualreport2003.
Banking business(incl. Corporate Center) Insurance business 2) Credit Suisse Group
12 months, in CHF m 2003 2002 2003 2002 2003 2002
Net interest income 7,420 7,984 – – 7,424 8,036Net commission and service fee income 11,914 15,350 – – 11,940 15,334Net trading income 2,566 1,946 – – 2,515 2,254Net income from the insurance business 3) – – 4,622 3,641 4,621 3,312Other ordinary income/(expenses), net 661 (296) (860) (602) (178) (898)
Operating income 22,561 24,984 3,762 3,039 26,322 28,038
Personnel expenses 11,735 14,627 1,895 2,283 13,630 16,910Other operating expenses 3,990 5,118 1,285 1,499 5,271 6,619
Operating expenses 15,725 19,745 3,180 3,782 18,901 23,529
Gross operating profit/(loss) 6,836 5,239 582 (743) 7,421 4,509
Depreciation of non-current assets 1,237 1,515 652 657 1,887 2,173Amortization of acquired intangible assets 593 693 0 0 593 693Amortization of goodwill 532 740 62 66 594 806Valuation adjustments, provisions and losses from the banking business 861 4,430 – – 861 4,430
Depreciation, valuation adjustments and losses 3,223 7,378 714 723 3,935 8,102
Profit/(loss) before extraordinary items, cumulative effect of change in accounting principle and taxes 3,613 (2,139) (132) (1,466) 3,486 (3,593)
Extraordinary income 441 681 1,606 65 2,047 746Extraordinary expenses (46) (206) (529) (197) (575) (403)Cumulative effect of change in accounting principle 319 320 – 200 319 520Taxes (910) 289 757 (885) (154) (596)
Net profit/(loss) before minority interests 3,417 (1,055) 1,702 (2,283) 5,123 (3,326)
Minority interests (156) (151) 32 168 (124) 17
Net profit/(loss) 3,261 (1,206) 1,734 (2,115) 4,999 (3,309)
1) Income statements for the banking and insurance business are presented on a stand-alone basis. 2) Represents “Winterthur” Swiss Insurance Company.3) Insurance business: expenses due to the handling of both claims and investments are allocated to the income from the insurance business, of which CHF 508 m (12months 2002: CHF 615 m) are related to personnel expenses and CHF 444 m (12 months 2002: CHF 469 m) to other operating expenses.
Income statement of the banking and insurance business 1)
12 monthsin CHF m 2003 2002
At beginning of financial year 31,394 38,921Reclassification for own shares 2) (1,019) –Dividends paid (116) 0Dividends paid to minority interests (160) (169)Repayment out of share capital 0 (2,379)Capital increases, par value and capital surplus 20 1,448Cancellation of repurchased shares 0 (542)Change in scope of consolidation 114 (167)Purchase of own shares (cost) 2) (7,009) –Sales of own shares (cost) 2) 6,521 –Realized gains on own shares, net 2) 99 –Accrual for earned share compensation 2) 1,009 –Foreign currency translation impact (660) (2,626)Change in revaluation reserves for the insurance business, net (624) 814Release of reserve for general banking risks 0 (580)Minority interests in net profit/(loss) 124 (17)Net profit/(loss) 4,999 (3,309)
At end of financial year 34,692 31,394
1) In 4Q2003 Credit Suisse Group applied mandatory changes in Swiss Federal Banking Commission guidelines. Prior periods are not required to be adjusted. The overallimpact of these changes, primarily accounting for own shares and derivatives, on shareholders’ equity as of December 31, 2003 was a decrease of CHF 491 m. 2) Asof January 1, 2003, own shares are no longer included in shareholders’ equity. The impact on shareholders’ equity as of December 31, 2003 was a decrease of CHF396 m.
Statement of shareholders’ equity 1)
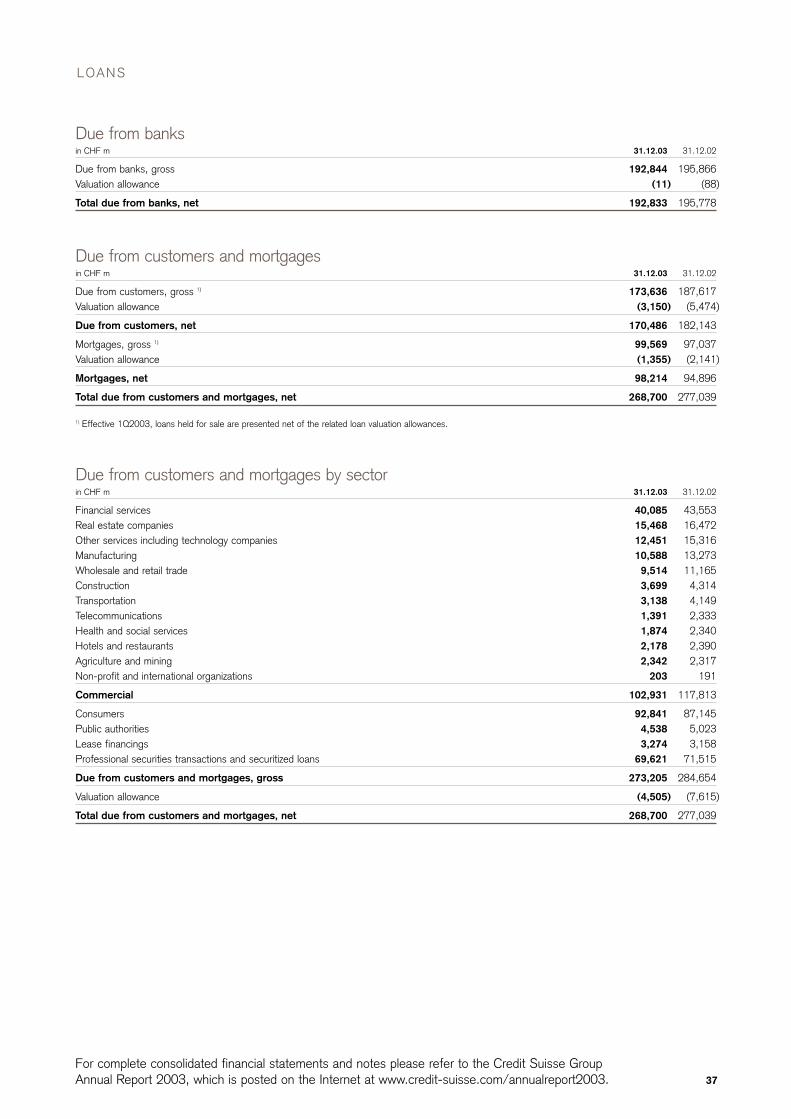
37
For complete consolidated financial statements and notes please refer to the Credit Suisse Group Annual Report 2003, which is posted on the Internet at www.credit-suisse.com/annualreport2003.
in CHF m 31.12.03 31.12.02
Due from banks, gross 192,844 195,866Valuation allowance (11) (88)
Total due from banks, net 192,833 195,778
Due from banks
in CHF m 31.12.03 31.12.02
Due from customers, gross 1) 173,636 187,617Valuation allowance (3,150) (5,474)
Due from customers, net 170,486 182,143
Mortgages, gross 1) 99,569 97,037Valuation allowance (1,355) (2,141)
Mortgages, net 98,214 94,896
Total due from customers and mortgages, net 268,700 277,039
1) Effective 1Q2003, loans held for sale are presented net of the related loan valuation allowances.
Due from customers and mortgages
in CHF m 31.12.03 31.12.02
Financial services 40,085 43,553Real estate companies 15,468 16,472Other services including technology companies 12,451 15,316Manufacturing 10,588 13,273Wholesale and retail trade 9,514 11,165Construction 3,699 4,314Transportation 3,138 4,149Telecommunications 1,391 2,333Health and social services 1,874 2,340Hotels and restaurants 2,178 2,390Agriculture and mining 2,342 2,317Non-profit and international organizations 203 191
Commercial 102,931 117,813
Consumers 92,841 87,145Public authorities 4,538 5,023Lease financings 3,274 3,158Professional securities transactions and securitized loans 69,621 71,515
Due from customers and mortgages, gross 273,205 284,654
Valuation allowance (4,505) (7,615)
Total due from customers and mortgages, net 268,700 277,039
Due from customers and mortgages by sector
LOANS
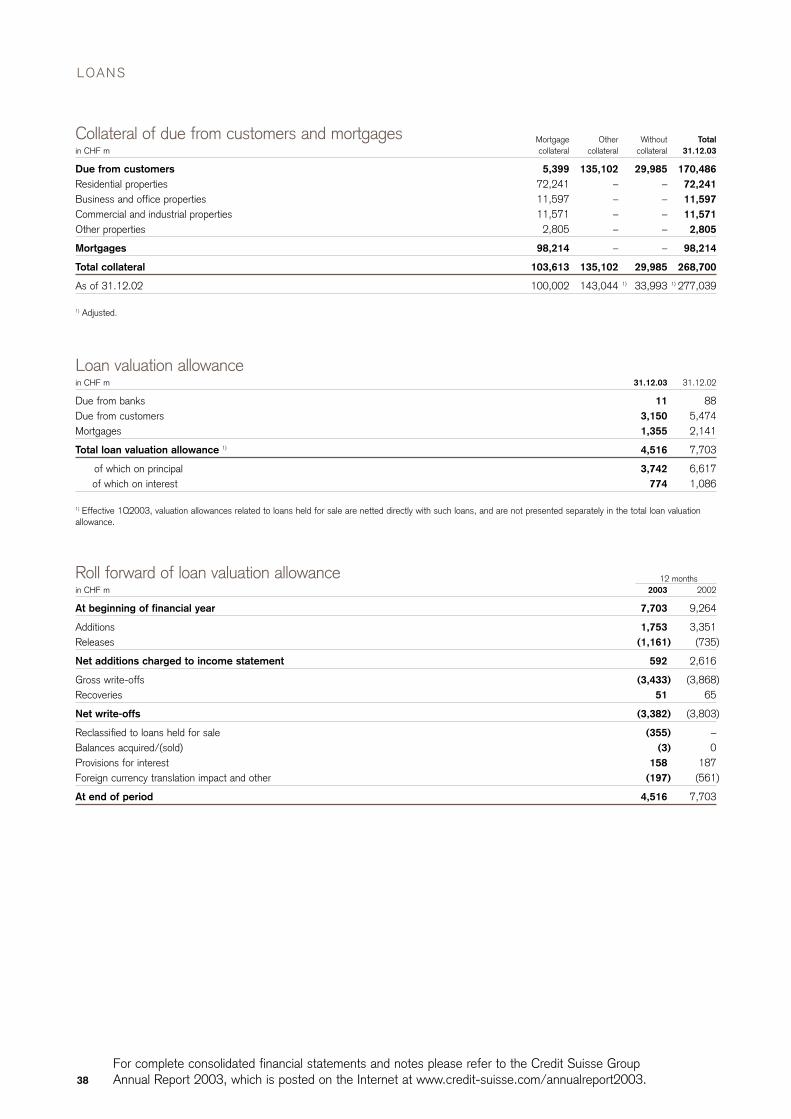
38
For complete consolidated financial statements and notes please refer to the Credit Suisse Group Annual Report 2003, which is posted on the Internet at www.credit-suisse.com/annualreport2003.
in CHF m 31.12.03 31.12.02
Due from banks 11 88Due from customers 3,150 5,474Mortgages 1,355 2,141
Total loan valuation allowance 1) 4,516 7,703
of which on principal 3,742 6,617of which on interest 774 1,086
1) Effective 1Q2003, valuation allowances related to loans held for sale are netted directly with such loans, and are not presented separately in the total loan valuationallowance.
Loan valuation allowance
12 monthsin CHF m 2003 2002
At beginning of financial year 7,703 9,264
Additions 1,753 3,351Releases (1,161) (735)
Net additions charged to income statement 592 2,616
Gross write-offs (3,433) (3,868)Recoveries 51 65
Net write-offs (3,382) (3,803)
Reclassified to loans held for sale (355) –Balances acquired/(sold) (3) 0Provisions for interest 158 187Foreign currency translation impact and other (197) (561)
At end of period 4,516 7,703
Roll forward of loan valuation allowance
Mortgage Other Without Totalin CHF m collateral collateral collateral 31.12.03
Due from customers 5,399 135,102 29,985 170,486Residential properties 72,241 – – 72,241Business and office properties 11,597 – – 11,597Commercial and industrial properties 11,571 – – 11,571Other properties 2,805 – – 2,805
Mortgages 98,214 – – 98,214
Total collateral 103,613 135,102 29,985 268,700
As of 31.12.02 100,002 143,044 1) 33,993 1) 277,039
1) Adjusted.
Collateral of due from customers and mortgages
LOANS
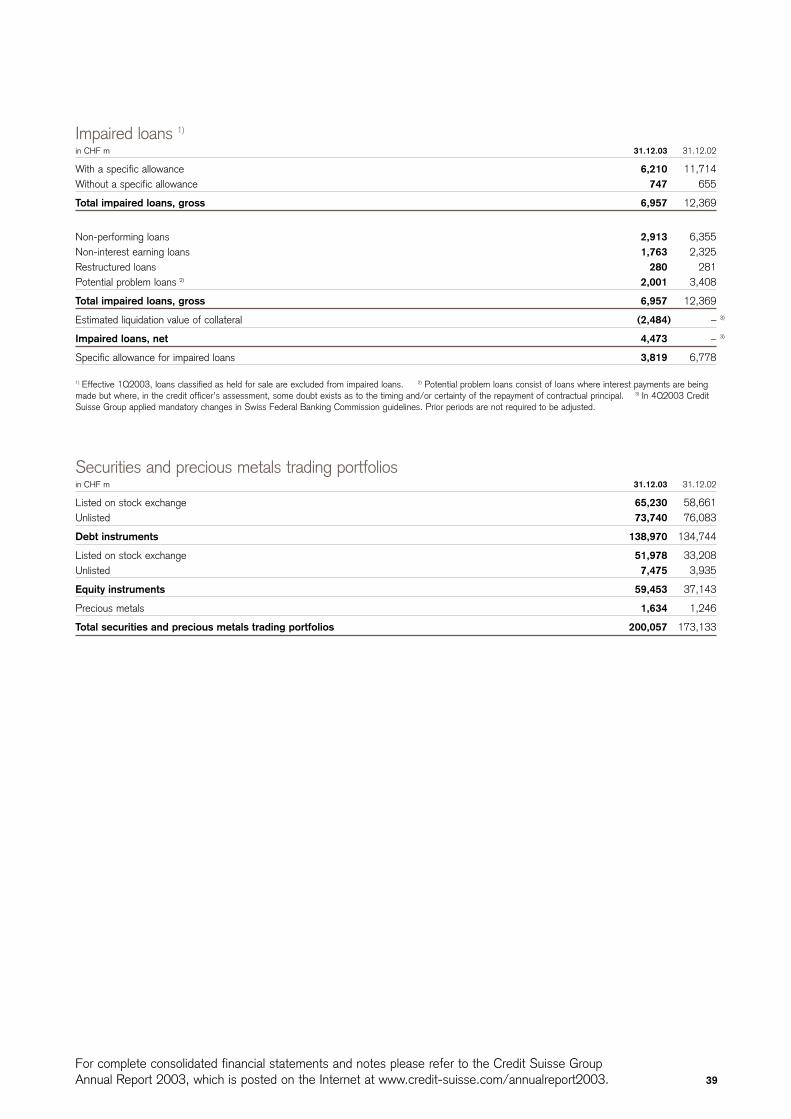
39
For complete consolidated financial statements and notes please refer to the Credit Suisse Group Annual Report 2003, which is posted on the Internet at www.credit-suisse.com/annualreport2003.
in CHF m 31.12.03 31.12.02
With a specific allowance 6,210 11,714Without a specific allowance 747 655
Total impaired loans, gross 6,957 12,369
Non-performing loans 2,913 6,355Non-interest earning loans 1,763 2,325Restructured loans 280 281Potential problem loans 2) 2,001 3,408
Total impaired loans, gross 6,957 12,369
Estimated liquidation value of collateral (2,484) – 3)
Impaired loans, net 4,473 – 3)
Specific allowance for impaired loans 3,819 6,778
1) Effective 1Q2003, loans classified as held for sale are excluded from impaired loans. 2) Potential problem loans consist of loans where interest payments are beingmade but where, in the credit officer’s assessment, some doubt exists as to the timing and/or certainty of the repayment of contractual principal. 3) In 4Q2003 CreditSuisse Group applied mandatory changes in Swiss Federal Banking Commission guidelines. Prior periods are not required to be adjusted.
Impaired loans 1)
in CHF m 31.12.03 31.12.02
Listed on stock exchange 65,230 58,661Unlisted 73,740 76,083
Debt instruments 138,970 134,744
Listed on stock exchange 51,978 33,208Unlisted 7,475 3,935
Equity instruments 59,453 37,143
Precious metals 1,634 1,246
Total securities and precious metals trading portfolios 200,057 173,133
Securities and precious metals trading portfolios
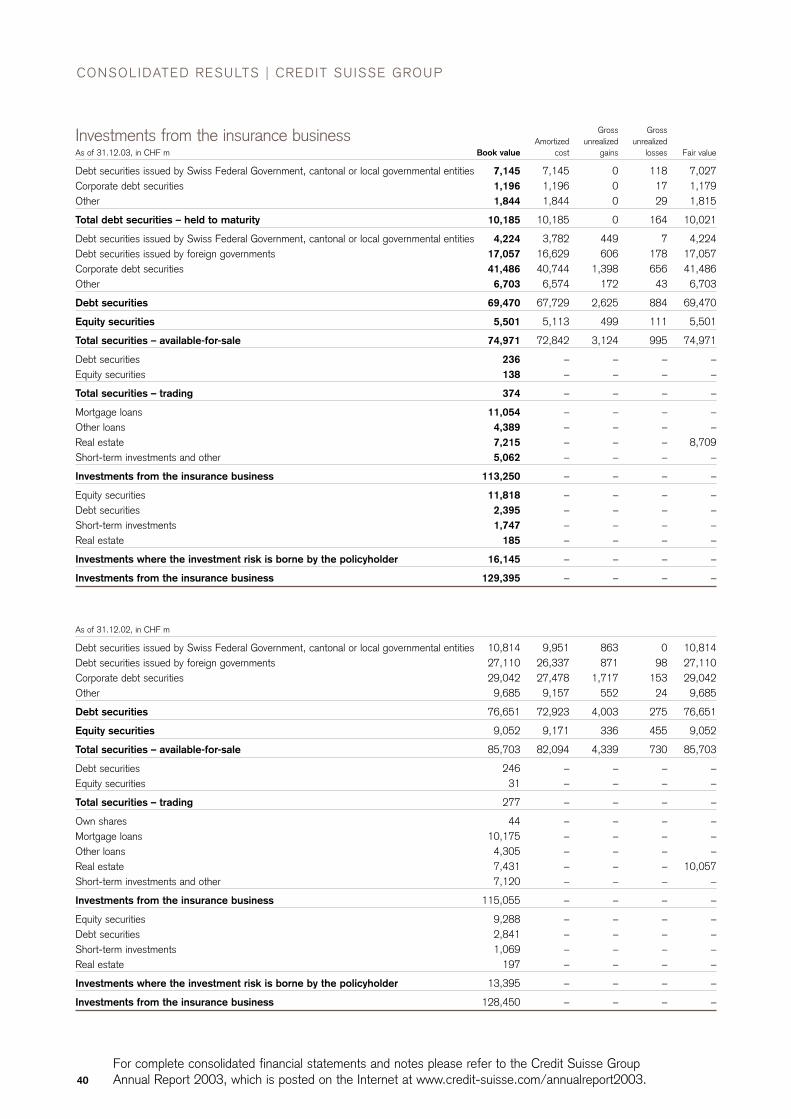
40
For complete consolidated financial statements and notes please refer to the Credit Suisse Group Annual Report 2003, which is posted on the Internet at www.credit-suisse.com/annualreport2003.
CONSOLIDATED RESULTS | CREDIT SUISSE GROUP
Gross GrossAmortized unrealized unrealized
As of 31.12.03, in CHF m Book value cost gains losses Fair value
Debt securities issued by Swiss Federal Government, cantonal or local governmental entities 7,145 7,145 0 118 7,027Corporate debt securities 1,196 1,196 0 17 1,179Other 1,844 1,844 0 29 1,815
Total debt securities – held to maturity 10,185 10,185 0 164 10,021
Debt securities issued by Swiss Federal Government, cantonal or local governmental entities 4,224 3,782 449 7 4,224Debt securities issued by foreign governments 17,057 16,629 606 178 17,057Corporate debt securities 41,486 40,744 1,398 656 41,486Other 6,703 6,574 172 43 6,703
Debt securities 69,470 67,729 2,625 884 69,470
Equity securities 5,501 5,113 499 111 5,501
Total securities – available-for-sale 74,971 72,842 3,124 995 74,971
Debt securities 236 – – – –Equity securities 138 – – – –
Total securities – trading 374 – – – –
Mortgage loans 11,054 – – – –Other loans 4,389 – – – –Real estate 7,215 – – – 8,709Short-term investments and other 5,062 – – – –
Investments from the insurance business 113,250 – – – –
Equity securities 11,818 – – – –Debt securities 2,395 – – – –Short-term investments 1,747 – – – –Real estate 185 – – – –
Investments where the investment risk is borne by the policyholder 16,145 – – – –
Investments from the insurance business 129,395 – – – –
Investments from the insurance business
As of 31.12.02, in CHF m
Debt securities issued by Swiss Federal Government, cantonal or local governmental entities 10,814 9,951 863 0 10,814Debt securities issued by foreign governments 27,110 26,337 871 98 27,110Corporate debt securities 29,042 27,478 1,717 153 29,042Other 9,685 9,157 552 24 9,685
Debt securities 76,651 72,923 4,003 275 76,651
Equity securities 9,052 9,171 336 455 9,052
Total securities – available-for-sale 85,703 82,094 4,339 730 85,703
Debt securities 246 – – – –Equity securities 31 – – – –
Total securities – trading 277 – – – –
Own shares 44 – – – –Mortgage loans 10,175 – – – –Other loans 4,305 – – – –Real estate 7,431 – – – 10,057Short-term investments and other 7,120 – – – –
Investments from the insurance business 115,055 – – – –
Equity securities 9,288 – – – –Debt securities 2,841 – – – –Short-term investments 1,069 – – – –Real estate 197 – – – –
Investments where the investment risk is borne by the policyholder 13,395 – – – –
Investments from the insurance business 128,450 – – – –
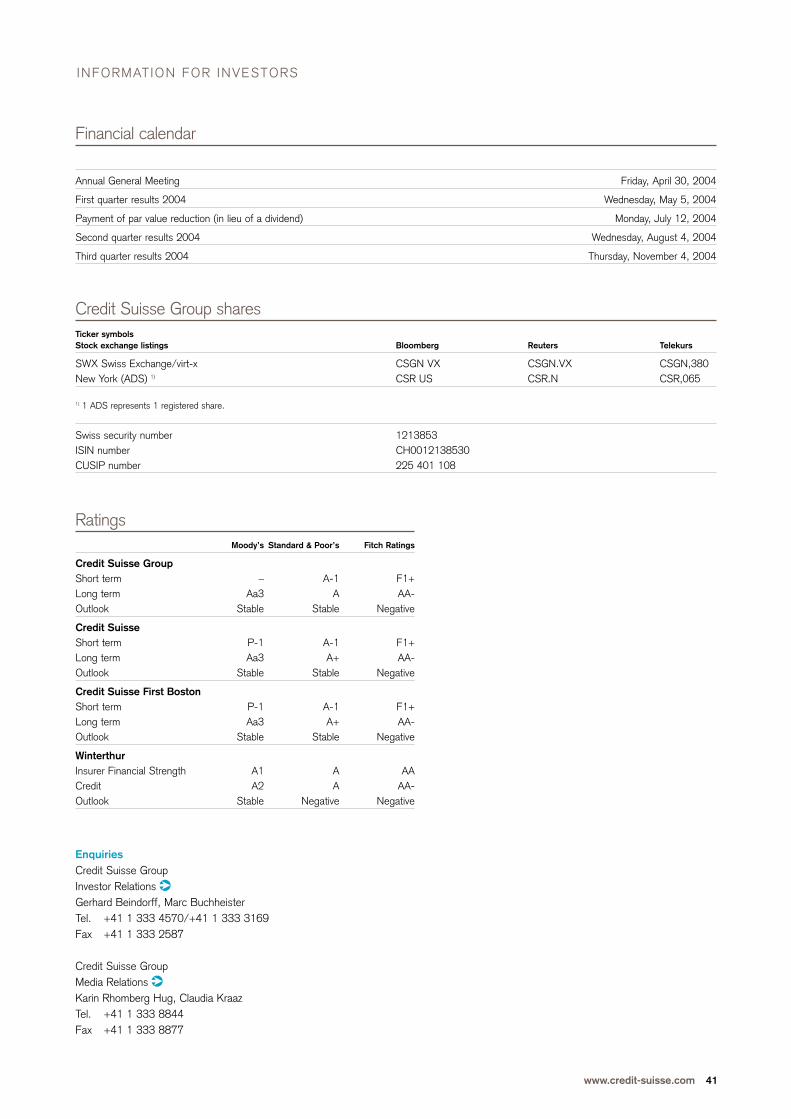
www.credit-suisse.com 41
INFORMATION FOR INVESTORS
Credit Suisse Group shares Ticker symbolsStock exchange listings Bloomberg Reuters Telekurs
SWX Swiss Exchange/virt-x CSGN VX CSGN.VX CSGN,380New York (ADS) 1) CSR US CSR.N CSR,065
1) 1 ADS represents 1 registered share.
Swiss security number 1213853ISIN number CH0012138530CUSIP number 225 401 108
Financial calendar
Annual General Meeting Friday, April 30, 2004
First quarter results 2004 Wednesday, May 5, 2004
Payment of par value reduction (in lieu of a dividend) Monday, July 12, 2004
Second quarter results 2004 Wednesday, August 4, 2004
Third quarter results 2004 Thursday, November 4, 2004
RatingsMoody’s Standard & Poor’s Fitch Ratings
Credit Suisse GroupShort term – A-1 F1+Long term Aa3 A AA-Outlook Stable Stable Negative
Credit SuisseShort term P-1 A-1 F1+Long term Aa3 A+ AA-Outlook Stable Stable Negative
Credit Suisse First BostonShort term P-1 A-1 F1+Long term Aa3 A+ AA-Outlook Stable Stable Negative
WinterthurInsurer Financial Strength A1 A AACredit A2 A AA-Outlook Stable Negative Negative
EnquiriesCredit Suisse GroupInvestor Relations ¤Gerhard Beindorff, Marc BuchheisterTel. +41 1 333 4570/+41 1 333 3169Fax +41 1 333 2587
Credit Suisse GroupMedia Relations ¤Karin Rhomberg Hug, Claudia KraazTel. +41 1 333 8844 Fax +41 1 333 8877

Credit Suisse GroupParadeplatz 8P.O. Box 18070 ZurichSwitzerlandTel. +41 1 212 1616Fax +41 1 333 2587www.credit-suisse.com