credit suisse - fourth quarter and full year 2020 results
TRANSCRIPT

Analyst and Investor Call
Thomas Gottstein, Chief Executive Officer
David Mathers, Chief Financial Officer
February 18, 2021
Credit SuisseFourth Quarter and Full Year 2020 Results

Disclaimer (1/2)
2February 18, 2021
Credit Suisse has not finalized its 2020 Annual Report and Credit Suisse's independent registered public accounting firm has not completed its audit of the consolidated financial statements for the period. Accordingly, the financial information contained in this presentation is subject to completion of year-end procedures, which may result in changes to that information.
This material does not purport to contain all of the information that you may wish to consider. This material is not to be relied upon as such or used in substitution for the exercise of independent judgment.
Cautionary statement regarding forward-looking statements
This presentation contains forward-looking statements that involve inherent risks and uncertainties, and we might not be able to achieve the predictions, forecasts, projections and other outcomes we describe or imply in forward-looking statements. A number of important factors could cause results to differ materially from the plans, targets, goals, expectations, estimates and intentions we express in these forward-looking statements, including those we identify in "Risk factors” in our Annual Report on Form 20-F for the fiscal year ended December 31, 2019, in “Credit Suisse – Risk factor” in our 1Q20 Financial Report published on May 7, 2020 and in the “Cautionary statement regarding forward-looking information" in our 4Q20 Earnings Release published on February 18, 2021 and filed with the US Securities and Exchange Commission, and in other public filings and press releases. We do not intend to update these forward-looking statements.
In particular, the terms “Estimate”, “Illustrative”, “Ambition”, “Objective”, “Outlook” and “Goal” are not intended to be viewed as targets or projections, nor are they considered to be Key Performance Indicators. All such estimates, illustrations, ambitions, objectives, outlooks and goals are subject to a large number of inherent risks, assumptions and uncertainties, many of which are completely outside of our control. These risks, assumptions and uncertainties include, but are not limited to, general market conditions, market volatility, interest rate volatility and levels, global and regional economic conditions, challenges and uncertainties resulting from the COVID-19 pandemic, political uncertainty, changes in tax policies, regulatory changes, changes in levels of client activity as a result of any of the foregoing and other factors. Accordingly, this information should not be relied on for any purpose. We do not intend to update these estimates, illustrations, ambitions, objectives, outlooks or goals.
We may not achieve the benefits of our strategic initiatives
We may not achieve all of the expected benefits of our strategic initiatives. Factors beyond our control, including but not limited to the market and economic conditions (including macroeconomic and other challenges and uncertainties, for example, resulting from the COVID-19 pandemic), changes in laws, rules or regulations and other challenges discussed in our public filings, could limit our ability to achieve some or all of the expected benefits of these initiatives.
Estimates and assumptions
In preparing this presentation, management has made estimates and assumptions that affect the numbers presented. Actual results may differ. Annualized numbers do not take into account variations in operating results, seasonality and other factors and may not be indicative of actual, full-year results. Figures throughout this presentation may also be subject to rounding adjustments. All opinions and views constitute judgments as of the date of writing without regard to the date on which the reader may receive or access the information. This information is subject to change at any time without notice and we do not intend to update this information.
Restatement
As of 3Q20, financial information reflects the new divisional reporting structure and management responsibilities announced on July 30, 2020 and updates to certain calculations and allocations. Prior periods have been restated to conform to the current presentation. In light of the restructuring announced on July 30, 2020 and several significant items impacting results in prior periods, we intend to focus on adjusted numbers, excluding significant items in our discussion of results until the restructuring is completed.

Disclaimer (2/2)
3February 18, 2021
Cautionary statements relating to interim financial information
This presentation contains certain unaudited interim financial information for the first quarter of 2021. This information has been derived from management accounts, is preliminary in nature, does not reflect the complete results of the first quarter of 2021 and is subject to change, including as a result of any normal quarterly adjustments in relation to the financial statements for the first quarter of 2021. This information has not been subject to any review by our independent registered public accounting firm. There can be no assurance that the final results for these periods will not differ from these preliminary results, and any such differences could be material. Quarterly financial results for the first quarter of 2021 will be included in our 1Q21 Financial Report. These interim results of operations are not necessarily indicative of the results to be achieved for the remainder of the full first quarter of 2021.
Statement regarding non-GAAP financial measures
This presentation contains non-GAAP financial measures, including results excluding certain items included in our reported results as well as return on regulatory capital and return on tangible equity and tangible book value per share (which are both based on tangible shareholders’ equity). Further details and information needed to reconcile such non-GAAP financial measures to the most directly comparable measures under US GAAP can be found in this presentation in the Appendix, which is available on our website at www.credit-suisse.com.
Our estimates, ambitions, objectives and targets often include metrics that are non-GAAP financial measures and are unaudited. A reconciliation of the estimates, ambitions, objectives and targets to the nearest GAAP measures is unavailable without unreasonable efforts. Results excluding certain items included in our reported results do not include items such as goodwill impairment, major litigation provisions, real estate gains, impacts from foreign exchange and other revenue and expense items included in our reported results, all of which are unavailable on a prospective basis. Return on tangible equity is based on tangible shareholders’ equity, a non-GAAP financial measure also known as tangible book value, which is calculated by deducting goodwill and other intangible assets from total shareholders’ equity as presented in our balance sheet, both of which are unavailable on a prospective basis. Return on regulatory capital (a non-GAAP financial measure) is calculated using income / (loss) after tax and assumes a tax rate of 25% and capital allocated based on the average of 10% of RWA and 3.5% of leverage exposure; the essential components of this calculation are unavailable on a prospective basis. Such estimates, ambitions, objectives and targets are calculated in a manner that is consistent with the accounting policies applied by us in preparing our financial statements.
Statement regarding capital, liquidity and leverage
Credit Suisse is subject to the Basel III framework, as implemented in Switzerland, as well as Swiss legislation and regulations for systemically important banks (Swiss Requirements), which include capital, liquidity, leverage and large exposure requirements and rules for emergency plans designed to maintain systemically relevant functions in the event of threatened insolvency. Credit Suisse has adopted the Bank for International Settlements (BIS) leverage ratio framework, as issued by the Basel Committee on Banking Supervision (BCBS) and implemented in Switzerland by the Swiss Financial Market Supervisory Authority FINMA.
References to phase-in and look-through included herein refer to Basel III capital requirements and Swiss Requirements. Phase-in reflects that, for the years 2014-2018, there was a five-year (20% per annum) phase-in of goodwill, other intangible assets and other capital deductions (e.g., certain deferred tax assets) and a phase-out of an adjustment for the accounting treatment of pension plans. For the years 2013-2022, there is a phase-out of certain capital instruments. Look-through assumes the full phase-in of goodwill and other intangible assets and other regulatory adjustments and the phase-out of certain capital instruments.
Unless otherwise noted, leverage exposure is based on the BIS leverage ratio framework and consists of period-end balance sheet assets and prescribed regulatory adjustments. The tier 1 leverage ratio and CET1 leverage ratio are calculated as BIS tier 1 capital and CET1 capital, respectively, divided by period-end leverage exposure. Swiss leverage ratios are measured on the same period-end basis as the leverage exposure for the BIS leverage ratio. Unless otherwise noted, for periods in 2020, leverage exposure excludes cash held at central banks, after adjusting for the dividend paid in 2020.
Sources
Certain material in this presentation has been prepared by Credit Suisse on the basis of publicly available information, internally developed data and other third-party sources believed to be reliable. Credit Suisse has not sought to independently verify information obtained from public and third-party sources and makes no representations or warranties as to accuracy, completeness or reliability of such information.

Key highlights
4February 18, 2021
Note: Results excluding items included in our reported results are non-GAAP financial measures. For further details and reconciliation information, see Appendix 1 Relating to net income attributable to shareholders 2 Full savings expected from 2022 onwards; allow for reinvestment in full, subject to market and economic conditions 3 Post dividends, share buybacks and potential impact from RWA methodology changes 4 Including CHF 716 mn of dividends and CHF 325 mn of buybacks 5 Subject to market and economic conditions
Strong underlying financial
performance in 2020
4Q20 reported pre-tax income of CHF (88) mn and net income of CHF (353) mn1, including major
litigation provisions of CHF 757 mn and an impairment relating to York of CHF 414 mn
Full year 2020 reported pre-tax income of CHF 3.5 bn; net income of CHF 2.7 bn1
Adjusted pre-tax income excluding significant items in 2020 of CHF 4.4 bn, up 6% YoY despite
CHF 1.1 bn of provision for credit losses and significant FX headwinds
Investments to accelerate
our growth
Targeting growth investments of CHF 0.3 – 0.6 bn in 2021 across Wealth Management and the IB,
including investments in technology and SRI
Invest most of marginal capital generated3 in Wealth Management to deploy into lending
Strong capital position and
disciplined capital
distribution
CET1 ratio of 12.9% at year-end 2020; total capital distribution of ~CHF 1 bn in 20204
Proposal to increase 2020 dividend by 5.4% vs. 2019
Expected total capital distribution of at least CHF 1.8 bn in 20215
Executed four key strategic
initiatives to support our
growth agenda
Created one global Investment Bank
Launched SRI – Sustainability, Research & Investment Solutions
Swiss Universal Bank: Integration of Neue Aargauer Bank and launch of CSX
Combined Risk and Compliance functions
Expect to generate gross savings of
~CHF 400-450 mn p.a.2

Despite a challenging macroeconomic and operating environment in 2020…
5February 18, 2021
1 IMF WEO (October 2020) 2 Developing and Emerging Asia 3 Bloomberg, as of February 16, 2021 4 1-year forward rates at various points in time in respective currencies
90
100
110
120
130
2017 2018 2019 2020E 2021E 2022E
2APAC
60
70
80
90
100
110
120
130
Dec-19 Feb-20 Apr-20 Jun-20 Aug-20 Oct-20 Dec-20
0.85
0.90
0.95
1.00
1.05
Dec-19 Feb-20 Apr-20 Jun-20 Aug-20 Oct-20 Dec-20
(1.0)
-
1.0
2.0
3.0
4.0
3M 6M 1Y 2Y 3Y 4Y 5Y
Uneven economic recovery post-COVID…Real GDP - 2017 rebased to 1001
…and rates likely to remain lower-for-longer1 year forward interest rate3,4, in %
…albeit equity markets have recoveredMSCI World3, 2019 rebased to 100
Swiss Franc significantly appreciated in 2020…USD/CHF development3

-
40
80
120
160
200
…which notably impacted the banking sector…
6February 18, 2021
Source: Bloomberg, as of February 16, 20211 KBW Banks Index members 2 Stoxx Europe 600 Banks Index members
1
2
240
260
280
300
-
1%
2%
3%
4%
5%
6%
7%
1
2
1
2
2012 2014 2016 2018 2020E 2022E 2012 2014 2016 2018 2020E 2022E
2012 2014 2016 2018 2020E 2022E
1
2
MSCI
World
1H19 2H19 1H20 2H2040
60
80
100
120
140
COVID economic impact has led to elevated credit losses…Provision for credit loss as % of average gross loans
...while lower rates have weighed on net interest incomeNet interest income, in EUR & USD bn
...have also weighed on bank share prices Indexed at beginning of 2019
Restrictions on bank dividends…Dividend yield

7February 18, 2021
…Credit Suisse recorded a strong growth in pre-provision profit, as we enter our growth phase
5.2
2.4
0.9
3.0
4.4 4.55.5
2014 2015 2016 2017 2018 2019 2020 2021
Ambition
2022
Ambition
2023
Ambition
Restructuring
phase
Platform for growth
phase
Growth
phase
Group adjusted pre-provision profit excl. significant items; in CHF bn
Leverage exposurein CHF trn
1.1 0.93(21)%
CET1 capitalin CHF bn
28.6 35.4+24%
IB as % of Group
(Allocated capital4)~60%5 32%~(28) pp.
Note: Results excluding items included in our reported results are non-GAAP financial measures. For further details and reconciliation information, see Appendix ‡ RoTE is a non-GAAP financial measure, see Appendix 1 At constant average 2019 FX rates 2 Reported Return on Tangible Equity in a normalized environment; subject to market and economic conditions 3 Group leverage exposure without the temporary exclusion of cash held at central banks 4 Based on the average of 10% of RWA and 3.5% of leverage exposure from Group total (Group leverage exposure without the temporary exclusion of cash held at central banks) 5 IB includes GM, IBCM, APAC Markets and SRU ex-WM related RWAs and LE before restatement
+22%
+30% at FXC1
RoTE‡ ambition
10-12%2

8February 18, 2021
Our 2020 structural initiatives are supporting our growth agenda
Created one global
Investment Bank
Integration of NAB
into SUB on track,
launched CSX
Launched SRI –
Sustainability,
Research & Investment
Solutions
Combined Risk and
Compliance functions
1 Full savings expected from 2022 onwards; allow for reinvestment in full, subject to market and economic conditions
Expect gross savings of
~CHF 400-450 mn p.a.1
for investments to
accelerate our growth

Global investment banking1 revenues rebounded in 2020…
9February 18, 2021
Global investment banking1 revenuesin USD bn
1 Includes net revenues from the Investment Bank, APAC advisory and underwriting as well as M&A, DCM and ECM revenues in SUB C&IC 2 Includes capital markets revenues and advisory and other fees in IB, APAC and SUB 3 Includes Other revenues of USD 77 mn 4 Includes Other revenues of USD (303) mn 5 Dealogic as of December 31, 2020 based on volumes 6 Dealogic as of December 31, 2020 based on fees 7 Dealogic as of December 31, 2020 based on fees (2020 vs. 2019) 8 Third Party competitive analysis as of 9M20 9 Return on Assets (2020 vs. 2019); Leverage based on period average 10 Bloomberg as of December 31, 2020 11 Thomson Reuters as of December 31, 2020
3.44.3
2.3
2.6
2.8
3.7
2019 2020
Fixed IncomeSales & Trading
EquitySales & Trading
Capital Markets & Advisory2
8.63
+26%
+12%
+31%
+19%
2020 vs. 2019
10.24 #1Global IPOs5
#1Sponsors Lev Fin6
Capital Markets &
Advisory Top 6Announced
M&A5
+60 bpsShare of wallet7
Top 6Cash Equities8
+6 bpsPrime Services
RoA9
Equity Sales& Trading
#1Structured
Credit10
#1Asset
Finance11
Fixed Income Sales
& Trading
Momentum in market leading franchises
31%GTS net revenue growth YoY
GTS

…our capital markets and advisory franchise gained momentum and outperformed peers…
10February 18, 2021
3%
10%
23%
25%
28%
32%
32%
37% 4.0
Fees3
USD bn
6.2
7.7
6.1
4.7
8.5
2.3
3.3
1
IPO
rank3,4
5
2
4
3
6
12
13
Top 8 Global Investment Banks:
Capital markets and advisory fees growth2020 – YoY1,2
1 Includes Bank of America, Barclays, Citibank, Deutsche Bank, Goldman Sachs, JP Morgan and Morgan Stanley 2 Dealogic as of December 31, 2020; based on fees (for the years 2020 and 2019) 3 Dealogic as of December 31, 2020 (for the year 2020) 4 Based on deal value
3.7%
3.2%
3.8%4.1%
4.3%
3.5%
5.6%
3.9%
All products M&A ECM DCM
2019
2020
Credit Suisse’s capital markets and advisory
share of wallet2

…positioning our integrated Investment Bank division to deliver sustainable returns
Building on a diversified Investment Bank
with reduced earnings volatility
…to deliver our medium-term RoRC† ambitionFocused execution…
Note: Results excluding items included in our reported results are non-GAAP financial measures. For further details and reconciliation information, see Appendix † RoRC is a non-GAAP financial measure, see Appendix
February 18, 2021 11
8%
13%
2019 2020 Medium-term
ambition
10-15%
adjusted adjusted
1,104
1,882
2019 2020
70%
Adjusted PTIin USD mn
RoRC†
Business mix well positioned for
post-COVID market environment
Delivering institutional-style solutions
to Wealth Management through GTS
Continued investing in our market-leading
businesses to deliver an RoRC† of 10-15%

12February 18, 2021
SRI progress and momentum since launch in July
1 2020 vs. 2019; according to Credit Suisse ESG framework
Enablement
& execution
Strategy enabled by governance bodies and committees at the BoD, ExB and divisional management levels
Engaged in meaningful dialogue with NGOs, investors, analysts and key rating agencies
Global Head of Reputational, Sustainability and Climate Risk appointed in CRCO
New private markets opportunities in co-development with BlackRock specifically aligned to CS Supertrends
Delivering
Sustainable
Solutions
Enabling Client
Transitions
Leadership on
Standard Setting
Driving our own
Transition
Adapting
our Culture
Significant YoY increase in ESG Thematic and Impact Investments1
Client Energy Transition Frameworks rolled out for oil & gas, coal mining, and fossil-based power generation; over 1,300 staff trained
Upgraded to A- rating
Upgraded to A rating
Recent recognition & engagement
Signatory to Stakeholder
Capitalism Metrics
Established SRI to deliver sustainable insights and solutions to our private, corporate and institutional clients
Developed comprehensive ESG strategy, including commitments to propel our ambition to be a leader in sustainability
Integrated Securities Research to deliver thematic research across public and private markets
Focused on growth of recurring revenues in WM through integration of investment product platforms aligned with the business divisions
Strategy Executed 37 Green, Social and Sustainability Bond transactions in 2020 totaling USD 19 bn,
an increase of 42% YoY
Partnering for Racial Justice in Business (WEF)
Selected highlights
WEF
CDP
MSCI
13February 18, 2021
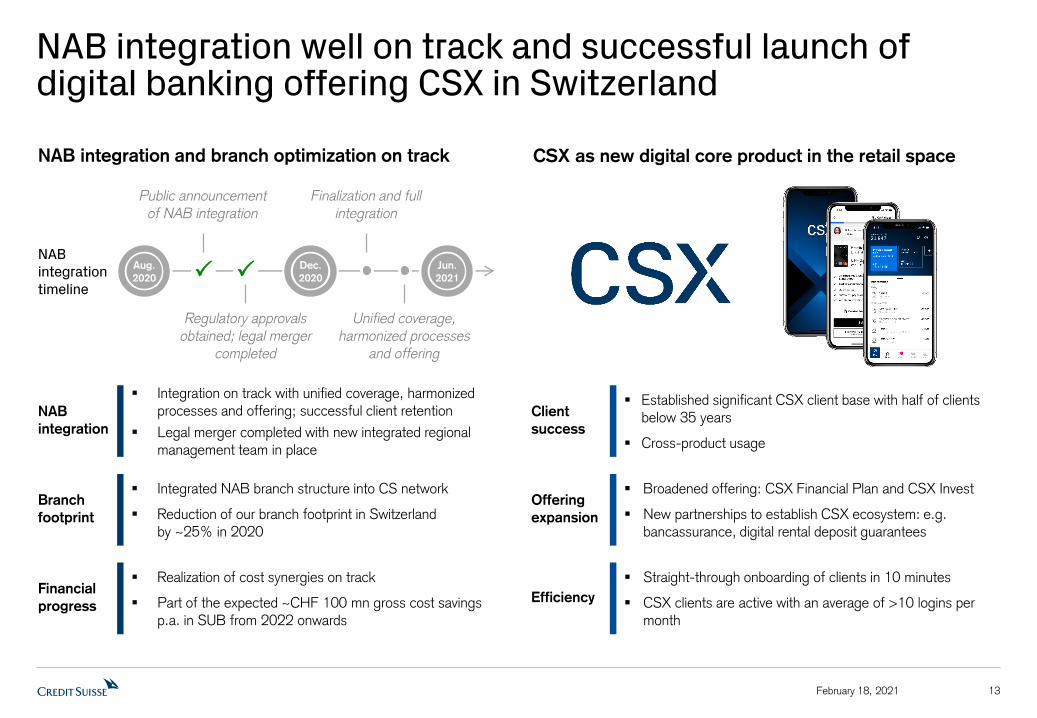
NAB integration well on track and successful launch of digital banking offering CSX in Switzerland
NAB integration and branch optimization on track
Regulatory approvals obtained; legal merger
completed
Public announcement of NAB integration
Finalization and full integration
Unified coverage, harmonized processes
and offering
Aug.
2020
Dec.
2020
Jun.
2021
CSX as new digital core product in the retail space
Established significant CSX client base with half of clients below 35 years
Cross-product usage
Client
success
Broadened offering: CSX Financial Plan and CSX Invest
New partnerships to establish CSX ecosystem: e.g. bancassurance, digital rental deposit guarantees
Offering
expansion
Straight-through onboarding of clients in 10 minutes
CSX clients are active with an average of >10 logins per month
Efficiency
NAB integration timeline
Integration on track with unified coverage, harmonized processes and offering; successful client retention
Legal merger completed with new integrated regional management team in place
NAB
integration
Integrated NAB branch structure into CS network
Reduction of our branch footprint in Switzerland by ~25% in 2020
Branch
footprint
Realization of cost synergies on track
Part of the expected ~CHF 100 mn gross cost savings p.a. in SUB from 2022 onwards
Financial
progress

14February 18, 2021
Sustained and strengthened risk and compliance oversight, navigating through a volatile environment
Risk
management
through
the cycle
Successfully navigated the COVID-19 pandemic during 2020, managing its impact across risk types
The crisis proved the effectiveness of our risk appetite frameworks and hedging strategy, supporting earnings stability
Ensured consistent, tight lending standards, supporting risk-controlled lending growth with an objective to maintain rigorous credit standards, consistent with our <10 bps provision for credit losses ratio through the cycle1
Integration
of risk and
compliance
Implementation of joint Risk and Compliance organization (CRCO), driving efficiencies and effectiveness of control
Enables more consistent execution and delivery of our control framework across Risk and Compliance
Driving simpler and scalable technology shared by Risk and Compliance, delivering solutions to deploy rapid cross-risk and cross-bank modelling and reporting
Holistic
client risk
management
Further improvement of risk oversight across risk types and compliance
Established new global and divisional client risk committees embedding relevant risk types and compliance disciplines for a holistic client view
Addressed legacy compliance topics with ongoing remediation efforts, leveraging new tools, data and technology
1 For the periods 2010-2020. Provision for credit losses related to loans held at amortized cost as % of average gross loans held at amortized cost

15February 18, 2021
Wealth Management offers significant growth opportunity; APAC continues to be the fastest growing region
As per December 15, 2020 Investor Update presentation

16February 18, 2021
Our AuM have grown to over CHF 1.5 trn or over USD 1.7 trn…
1 2015 converted from CHF to USD at USD/CHF exchange rate of 0.9892; 2020 converted from CHF to USD at USD/CHF exchange rate of 0.8807 2 Includes SUB C&IC, IWM AM and adjustment for assets managed by Asset Management within International Wealth Management for the other businesses; for 2015 also includes SRU
637
903
590
814
2015 2020
Assets under Management Groupin CHF bn
CAGR
7%
Assets under Management Groupin USD bn1
630795
584
143
(85)
240
717
2015 Marketmovements
& other effects
FX NNA 2020
Wealth
Management
Institutional
(AM, C&IC)2
1,214
1,512
CAGR
4%
CAGR 5%
1,227
1,717
Wealth
Management
Institutional
(AM, C&IC)2

17February 18, 2021
…with substantial growth in client business volume across our WM franchises, notably in APAC
318328
352 345
377 381
SUB PC
Client Business Volume (CBV) in CHF bn
2020201820162015 2017 2019
207237
304 290331
402
APAC
Client Business Volume (CBV) in USD bn1
2020201820162015 2017 2019
445458
529489
545
588
IWM PB
Client Business Volume (CBV) in USD bn1
2020201820162015 2017 2019
Assets under Management
190 192 208 198 218 209 152 163 201 202 227 251293 316 376 363 382 415
Custody Assets2 20 26 33 33 43 54 19 35 60 44 57 107111 98 101 74 107 114
Net loans 108 110 111 113 116 118 35 39 43 43 47 4441 44 52 52 55 59
1 Where CHF is converted to USD, a USD/CHF year-end spot exchange rate has been applied 2 Includes assets under custody and commercial assets 3 Excluding estimated cumulative FX impact based on management data, estimates and assumptions
4%
CAGR
Mid-single digit Mid- to high-single digit Double digitCBV growth
ambition3
6%
CAGR
14%
CAGR

Our House View continued to add substantial value for our clients during the pandemic
18February 18, 2021
900
1,000
1,100
1,200
1,300
1,400
1,500
1,600
1,700
Jan-19 Apr-19 Jul-19 Oct-19 Jan-20 Apr-20 Jul-20 Oct-20 Jan-21
CS Investment Committee decisions since January 2019MSCI AC World Total Return Index in local currency1
Started the year overweight equities
13 Feb: Went to neutral equities
10 Apr: Went back to overweight equities
10 Jul: Went back to neutral equities
11 Sep: Went
overweight equities
8 Jan: Went neutral equities
25 Mar: Went
overweight equities
25 Jun: Went neutral equities
12 Nov: Went
overweight equities
On a long-term basis2, Discretionary Mandates outperformed 67% of clients in a non-discretionary strategy portfolio
Innovation and integration of ESG considerations e.g. launched Climate Focus mandate in November 2020
Enhanced diversification benefits from the addition of private equity in Platinum Solutions (Mandates)3
Thematic Supertrends framework dynamically driving positive performance
Credit Suisse Supertrends
Anxious
societiesInfrastructure Millennials
Silver
economyTechnology
Climate
change
1 Bloomberg as of February 16, 2021 2 Performance of discretionary mandates vs. non-discretionary client portfolios (December 31, 2017 to December 31, 2020) of PB clients in SUB, IWM and APAC that are booked in Switzerland 3 High-touch, bespoke investment management services for investable assets starting at CHF 20 mn

19February 18, 2021
We are committed to accelerating growth across all three Wealth Management divisions…
Our unique “Bank for
Entrepreneurs” model is a differentiator
Invest most of marginal capital
generated1 into Wealth Management
Sustainable investment solutions
to be at the core of our offering
Build on our successful
collaboration with the Investment Bank and Asset Management
Our business model is geared to
deliver operating leverage
Our core principles… …to capture medium-term growth opportunities across Wealth Management
1 Post dividends, share buybacks and potential impact from RWA methodology changes 2 SUB PC 3 IWM PB 4 Excluding estimated cumulative FX impact based on management data, estimates and assumptions 5 Alternative fund solutions from SRI - Investment Solutions & Products to wealth management clients 6 Dealogic for the year 2020
Grow client
business volume4
Attract NNA4
Extend lending4
Strengthen
collaboration
Deepen mandate
penetration
Extend collaboration with GTS
Build on leading Advisory position in SUB / APAC6
and drive mid-market opportunity in IWM
Grow
Private Markets
Leverage data analytics, enhance digital product capabilities and build on recently launched CSX offering
Accelerate digital
transformation
Drive mandate penetration from 28% to ~33%
with a focus on sustainable solutions
SUB2
Mid-single
digit
Low-single
digit
1-3%
IWM3
Mid- to high-
single digit
High-single
digit
4-6%
APAC
Double
digit
Double
digit
6-8%
Increase Alternatives and PE feeder funds distribution5
to CHF 5-7 bn p.a.
Maintain rigorous credit standards, historic <10 bps PCL ratio

20February 18, 2021
…aiming for Wealth Management-related PTI of CHF 5.0-5.5 bn in 2023
Note: Results excluding items included in our reported results are non-GAAP financial measures. For further details and reconciliation information, see Appendix † RoRC is a non-GAAP financial measure, see Appendix 1 Post dividends, share buybacks and potential impact from RWA methodology changes
18%adj. excl. significant items
20-25%
Wealth Management-related metrics
PTIin CHF bn
RoRC†
2023
ambition
2020adj. excl. significant items
Invest most of marginal capital generated1 into Wealth
Management to deploy into lending
Deepen our onshore footprint in fast-growth markets,
notably China, other parts of APAC and Middle East
Continue to drive GTS, Investment Bank and Asset
Management collaboration with Wealth Management
Expect normalized credit provisions in 2021 (but with a
wide range of possible outcomes) and beyond
Expect normalized Asset Management profitability0.8
1.2
1.9
3.8
SUB
IWM
APAC
~10%CAGR
5.0-5.5

2020
Dividend
Share buybacks
in 2021
We expect to distribute at least CHF 1.8 bn in 2021, up from ~CHF 1 bn in 2020
21
1 Dividend distribution including dividend equivalents for share awards 2 Reflecting a dividend per share increase of 5.4% vs. 2019; subject to Board of Directors and AGM approval; final amount is subject to share count at ex-dividend date 3 The Board of Directors has approved share buybacks for 2021 of up to CHF 1.5 bn with at least CHF 1.0 bn expected for the full year; resumed share repurchases on January 12, 2021. CHF 112 mn of shares repurchased as of February 16, 2021 4 Subject to market and economic conditions
February 18, 2021
Total capital distribution in 2020 in CHF
358 mn
358 mn
2019
Dividend
Share buybacks
in 2020
716 mn
325 mn
~766 mn2
3
2nd half
1st half
At least 1.0 bn andup to 1.5 bn approved
Expected total capital distribution in 20214 in CHF
Total of ~CHF 1 bn paid
to shareholders in 2020
Total of at least CHF 1.8 bnpayable to shareholders in 2021,
including proposed dividend of CHF 0.2926 per share
1 1

Detailed Financials
22February 18, 2021

Results Overview
23
Note: Adjusted results and results excluding significant items are non-GAAP financial measures. For further details and reconciliation information, see Appendix. 4Q20 reported results include a gain related to the equity investment revaluation of SIX and Allfunds, and a York impairment. 2Q20 reported results include a gain related to the equity investment revaluation of Pfandbriefbank. 1Q20 reported results include a gain related to the transfer of the InvestLab fund platform to Allfunds Group. 4Q19 reported results include a gain related to the equity investment revaluation of SIX. 3Q19 reported results include a gain related to the transfer of the InvestLabfund platform to Allfunds Group ‡ RoTE is a non-GAAP financial measure, see Appendix 1 Includes SUB, IWM and APAC
February 18, 2021
Credit Suisse Group in CHF mn unless otherwise specified
4Q20 3Q20 4Q19 Δ 4Q19 2020 2019 Δ 2019
Net revenues 5,221 5,198 6,190 (16)% 22,389 22,484 -
o/w Wealth Management-related1 3,129 3,164 4,120 (24)% 13,607 14,750 (8)%
o/w Investment Bank in USD mn 2,337 2,245 1,977 18% 9,718 8,216 18%
Provision for credit losses 138 94 146 1,096 324
o/w CECL-related 32 (55) - 412 -
Total operating expenses 5,171 4,301 4,830 7% 17,826 17,440 2%
Pre-tax income / (loss) (88) 803 1,214 n/m 3,467 4,720 (27)%
Income tax expense 262 258 361 801 1,295
Effective tax rate n/m 32% 30% 23% 27%
Net income / (loss) attributable to
shareholders(353) 546 852 n/m 2,669 3,419 (22)%
Return on tangible equity‡ (3.5)% 5.4% 8.6% 6.6% 8.7%
Diluted earnings per share in CHF (0.15) 0.22 0.33 n/m 1.06 1.32 (20)%
Adjusted and excluding significant itemsin CHF mn
Net revenues 5,335 5,198 5,548 (4)% 22,101 21,410 3%
o/w Wealth Management-related1 3,243 3,164 3,484 (7)% 13,319 13,657 (2)%
Pre-tax income 861 1,087 955 (10)% 4,375 4,143 6%

24February 18, 2021
We achieved strong growth in underlying pre-tax income
Group pre-tax income in CHF mn
Reported
Note: Results excluding items included in our reported results are non-GAAP financial measures. For further details and reconciliation information, see Appendix
4,720
3,467
2019 2020
(27)%
4,1434,375
2019 2020
+6%
Adjusted and excluding significant itemsReported pre-tax income includes
in CHF mn 2019 2020
InvestLab/Allfunds gains 327 395
SIX revaluation gain 498 158
Pfandbriefbank gain - 134
York impairment - (414)
Real estate & business
sales gains249 15
Restructuring & real estate
disposal expenses(108) (208)
Major litigation provisions (389) (988)
Total adjustments and
significant items577 (908)

25February 18, 2021
CET1 ratio at 12.9%, reflecting strong recovery from the market dislocation seen in 1H20
12.7%
12.1%
12.5%
13.0%12.9%
4Q19 1Q20 2Q20 3Q20 4Q20
275Risk-weighted assets in CHF bn290
CET1 ratio in % Key messages
CET1 ratio at 12.9%, up ~20 bps vs. 4Q19
RWA reduction in the quarter and YTD primarily reflects continued depreciation of the USD vs. CHF
Completed the phase-in of certain Basel III reforms with total impact of CHF 11 bn in 2020 (mostly from SA-CCR)
Intend to maintain a CET1 ratio of at least 12.5% for at least the first half of 20211
Capital distribution
Paid 2019 dividend of CHF 0.2776 per share
We recommend a CHF 0.2926 dividend per share for 2020 and continue to accrue for at least 5% dividend growth p.a.
Resumed share repurchases under our 2021 share buyback program on January 12, 2021. CHF 112 mn of shares repurchased YTD2
295Risk-weighted assets excl. FX impact in 2020 in CHF bn290
1 Subject to market and economic conditions 2 As of February 16, 2021

26February 18, 2021
CET1 leverage ratio at 4.4%1; Tier 1 leverage ratio increased to 6.4%1
1 In 3Q20 and 4Q20 leverage exposure excludes CHF 110 bn and CHF 111 bn, respectively, of central bank reserves, after adjusting for the dividend paid in 2020, as permitted by FINMA 2 Calculated using a three-month average, which is calculated on a daily basis
Key messages
CET1 leverage ratio at 4.4%1
Tier 1 leverage ratio of 6.4%1 improved by 10 bps compared to 3Q20, partially driven by USD 1.5 bn
additional tier 1 issuance in December 2020
Leverage exposure decrease primarily driven by FX,
mainly from the depreciation of the USD vs. CHF
Liquidity Coverage Ratio (LCR) of 190%2 stable vs. 3Q20, reflecting conservative approach to liquidity management during the COVID-19 pandemic
Leverage exposure1 in CHF bn
6.4%Tier 1 leverage ratio (excl. CB reserves)6.3%
5.6%Tier 1 leverage ratio (incl. CB reserves)5.6%
11
Leverage exposure (incl. CB reserves) in CHF bn934
3Q20 FX impact HQLA Net usage 4Q20
(18)
824
800
(7)
SUB, IWM, APAC +6Corp. Ctr. (5)IB (8)
1
911
4.4%CET1 leverage ratio (excl. CB reserves)4.5%
3.9%CET1 leverage ratio (incl. CB reserves)4.0%
11

27February 18, 2021
TBVPS broadly flat at CHF 15.80 vs. end-2019;net income generation offset by adverse FX impacts
‡ Tangible book value per share (TBVPS) is a non-GAAP financial measure, see Appendix 1 Reflects impact from share buybacks under the 2020 share buyback program and the payment of the 2019 dividend 2 Reflects net impact of settlements of share-based compensation awards and quarterly share plan accruals 3 Reflects impact on tangible shareholders’ equity from own credit movements via other comprehensive income and tax expenses related to own credit movements 4 Includes the impact from amortization of accumulated losses in other comprehensive income related to pension plan re-measurements and the cumulative effect of accounting changes
15.88
16.94 1.10
(0.23)
0.19
1.81
(1.73)
(1.27)
0.05
4Q19 Net income
attr. to
shareholders
Capital
distribution
Share based
comp.
Illustrative
4Q20,
before own credit
movements
and FX
1Q20 2Q20-4Q20 FX Other 4Q20
3
1
CHF 2.7 bn
generated
4
15.80
2
(0.49) in
4Q20
Own credit
movements
0.08 net increase from
own credit movements
during 2020
Tangible book value per share (TBVPS)‡
in CHF
Key messages
TBVPS‡ at the end of 2020 broadly
unchanged vs. end of 2019:
— Net income attributable to shareholders contributing CHF 1.10
— Impact from widening credit spreads during 1Q20 mostly reversed during
the last three quarters of 2020
— Adverse FX impacts of CHF (1.27), resulting from the strengthening of the Swiss franc, mainly against the
US dollar

28February 18, 2021
Update on progress of our restructuring program
2020 Remainder of
restructuring
program
Total expected
restructuring
expenses
Expected
gross savings
in 2021
Expected
gross savings
from 2022
onwards
157
~300-350
~400-450 Incurred CHF 157 mn of restructuring
expenses during 2020, out of an expected total of ~CHF 300-350 mn over the duration of the program
Restructuring expenses in 2020 primarily
taken in IWM, IB and SUB, mainly related to redundancy expenses
Restructuring program expected to be
completed by the end of 2Q21
Anticipate to generate ~CHF 400-450 mn of
gross savings from 2022 onwards
Allow for reinvestment in full of gross savings, subject to market and economic conditions
Restructuring expensesin CHF mn
~250-300
~150-200

29February 18, 2021
2H20 allowance build from credit provisioning offset by net write-offs and FX impact
1,151
2,001
1,052
1,992
972
72
435
(84) (2)
949
(23) (241)(90)
930
429
255
ACL as of
Jan 1, 2020
Provision for
credit losses
Net write-offs FX
& Other
ACL as of
1H20
Provision for
credit losses
Net write-offs FX
& Other
ACL as of
end-2020
Allowance for credit losses (ACL)1
in CHF mn
1 Includes the allowance for credit losses on financial assets held at amortized cost and provisions for off-balance sheet credit exposures 2 Impact of CECL adoption on January 1, 2020 excluding impact from fair value election 3 Includes FX translation impact and other adjustment items of CHF (27) mn, including CECL impact of CHF (5) mn, and provision for interest of CHF 25 mn 4 Includes FX translation impact and other adjustment items of CHF (102) mn, including CECL impact of CHF (48) mn, and provision for interest of CHF 12 mn
1
1,223
Non-specific
provisions
Specificprovisions
CECL adoption impact2
End-4Q19
Provision for credit losses – Specific provisions
Provision for credit losses – CECL
864
1,902
1
Non-specific
provisions
Specificprovisions
2,001
232
1 3 4
1H20 2H20

30February 18, 2021
Expect more normal credit provisions in 2021, but with a wide range of possible outcomes
324412
684
2019 2020 2021E
CECL 2010-2020
Average: 280
Provision for credit lossesin CHF mn
Specific
provisions
1,096
Continued elevated
specific provisions1
Lower CECL
charges1
Note: Estimates and assumptions are based on currently available information and beliefs, expectations and opinions of management and include all known facts and decisions as of February 17, 2021. Actual results may differ 1 Subject to market and economic conditions 2 Provision for credit losses related to loans held at amortized cost as % of average gross loans held at amortized cost 3 For periods prior to 2019, non-restated numbers have been used. WM-related reflects the sum of SUB, IWM and APAC for the periods 2014 to 2020 and reflects Private Banking & Wealth Management for the periods 2010 to 2013
Provision for credit
losses ratio2
in bps
o/w WM-related3 8 21
10 30
Avg.
2010-2020
7
9

31February 18, 2021
Credit Suisse’s comparative wholesale reserves
Source: Company filings Note: Ratios based on local currency 1 Includes specific and portfolio based allowances for credit losses as % of gross loans for wholesale businesses. CS includes the Investment Bank. Peers include Bank of America, Citigroup and JP Morgan. Bank of America includes Commercial, Citigroup includes Corporate, JP Morgan includes Wholesale
Wholesale – Allowance for credit losses as % of loans1 (excluding fair value and held-for-sale loans)
0.8%1.0%
0.7%
1.0%
1.2% 1.2%
0.8%0.9%
2.2%
1.6%
1.7% 1.7%
2.0%
1.8%1.8%
1.7%
1.9%
1.8%
1.4%1.3%
CS
4Q19
1Q20
2Q20
3Q20
4Q20

Transaction-based revenues significantly benefitted from elevated volatility in 1H20
Successful expansion of the GTS
collaboration with the WM franchise through 2020, increasing WM-related revenues in collaboration with GTS4 by
34% vs. 2019
32
WM expected to benefit from sequential stability in recurring income1; continued high levels of transaction activity
Note: Subject to market and economic conditions; Wealth Management-related includes SUB, IWM and APAC 1 Recurring income includes net interest income and recurring commissions & fees 2 Excluding estimated FX impact since end-3Q20 3 At current FX rates 4 Includes institutional-style solutions for Wealth Management clients
February 18, 2021
Net interest income Wealth Management-related, in CHF mn
1,394 1,3521,251 1,213 1,203
4Q19 1Q20 2Q20 3Q20 4Q20
1,059 1,013942 974 998
4Q19 1Q20 2Q20 3Q20 4Q20
Recurring commissions & fees Wealth Management-related, in CHF mn
1,023
1,235 1,173
1,0031,092
4Q19 1Q20 2Q20 3Q20 4Q20
Transaction-based revenuesWealth Management-related, in CHF mn
Net interest income stabilizing sequentially in 4Q20, with increasing lending activity2
offsetting rates pressure
Anticipate increase in net interest income from 2Q21 onwards, benefitting from planned increased lending in Wealth
Management3
Recurring commissions & fees increased in 2H20 after recovery of AuM from 3Q20 onwards
AuM 2020 exit rate above 4Q19 at record level of CHF 1.5 trn
Expect to benefit from growing AuM base
going into 2021
Pre-COVID Pre-COVID Pre-COVID

Swiss Universal BankSolid full year pre-provision profit growth driven by transactional revenues
33February 18, 2021
PC
Key metrics
in CHF bn 4Q20 3Q20 4Q19 2020 2019
Net margin in bps 38 46 41 45 43
Net new assets (2.1) 2.0 (0.5) (5.9) 3.4
Client Business Volume 381 373 377 381 377
Mandate penetration 37% 36% 34% 37% 34%
Net loans 176 174 171 176 171
Risk-weighted assets 81 82 80 81 80
Leverage exposure 296 295 285 296 285
Key messages
Reported 2020 PTI of CHF 2.1 bn includes significant items of CHF 294 mn (vs. CHF 404 mn in 2019), litigation provisions of CHF 45 mn and restructuring expenses of CHF 44 mn
2020 adjusted PTI excluding significant items of CHF 1.9 bn with strong ongoing cost discipline as well as higher brokerage and GTS revenues, leading to a cost/income ratio of 59%, down 2 pp.
Higher provision for credit losses driven by CHF 75 mn from the application of CECL and a single case in C&IC in 3Q20; pre-provision profit increased by 4%
Stabilization of net interest income vs. 3Q20 and continuous assessment of deposit pricing in light of the sustained negative interest rate environment
Increased mandate penetration by 3 pp. to 37%
Private Clients
4Q20 net revenues decreased 4% as increased client activity was more than offset by lower deposit income, primarily from the negative interest rate environment and lower recurring revenues, primarily from our investment in Swisscard
Net asset outflows in 4Q20 of CHF 2.1 bn were mainly driven by a small number of individual cases in the UHNW client segment and by the usual seasonal slowdown in the fourth quarter
Corporate & Institutional Clients
4Q20 net revenues down 9%, driven by decreased deposit income primarily from lower USD interest rates, offsetting higher brokerage revenues
NNA in 4Q20 of CHF 3.8 bn driven by continued contribution from our pension business
Note: Unless otherwise stated, all financial numbers presented and discussed are adjusted and exclude significant items. Results excluding items included in our reported results are non-GAAP financial measures. For further details and reconciliation information, see Appendix. All percentage changes and comparative descriptions refer to year on year measurements unless otherwise specified † RoRC is a non-GAAP financial measure, see Appendix
Adjusted key financials excl. significant items
in CHF mn 4Q20 3Q20 4Q19 2020 2019
Net revenues 1,243 1,294 1,322 5,306 5,278
Provision for credit losses 66 52 43 270 109
o/w CECL-related 15 (36) - 75 -
Total operating expenses 790 771 822 3,149 3,208
Pre-tax income 387 471 457 1,887 1,961
Reported pre-tax income 487 430 867 2,104 2,573
Cost/income ratio 64% 60% 62% 59% 61%
Return on regulatory capital† 13% 15% 14% 15% 15%

Swiss Universal BankLast 3 fourth quarters – Adjusted results excluding significant items
34February 18, 2021
1,330 1,322 1,243
Net revenues in CHF mn
4Q204Q194Q18
508 457
387
Pre-tax income in CHF mn
60% 62% 64%
Return on regulatory capital†
854966 1,001
Client Business Volume in CHF bn
50
41 38
SUB PC net margin in bps
Note: Unless otherwise stated, all financial numbers presented and discussed are adjusted and exclude significant items. Results excluding items included in our reported results are non-GAAP financial measures. For further details and reconciliation information, see Appendix † RoRC is a non-GAAP financial measure, see Appendix
16%14% 13%
4Q204Q194Q18 4Q204Q194Q18
4Q204Q194Q184Q204Q194Q18 4Q204Q194Q18
Cost/income ratio
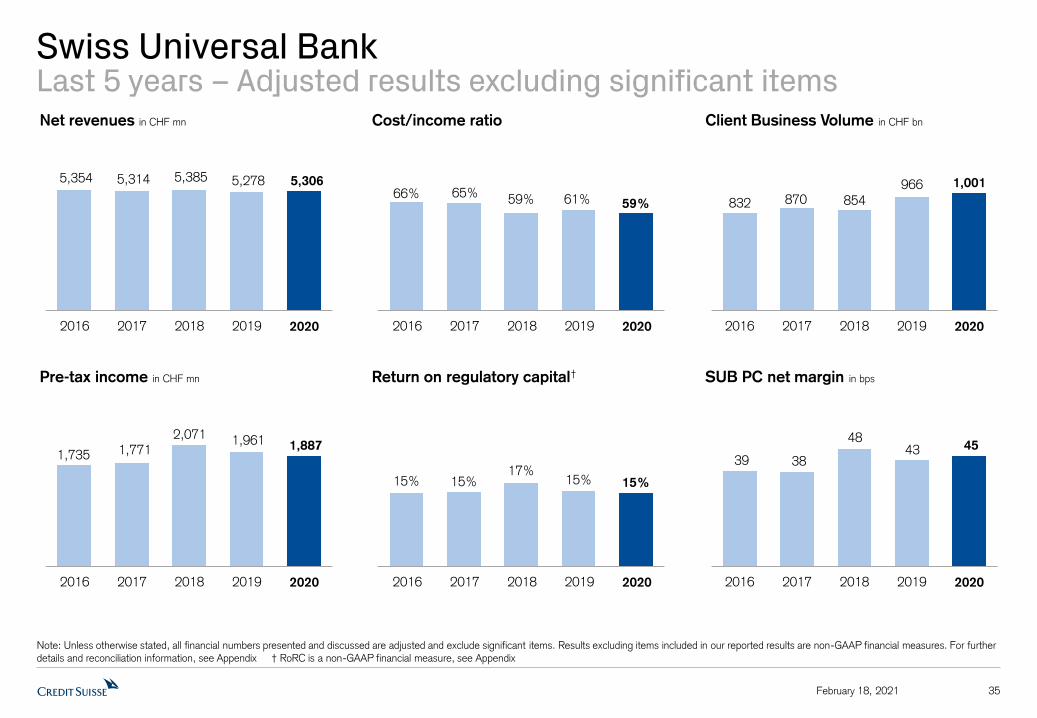
Swiss Universal BankLast 5 years – Adjusted results excluding significant items
35February 18, 2021
5,354 5,314 5,385 5,278 5,306
Net revenues in CHF mn
202020192018
1,735 1,771 2,071 1,961 1,887
Pre-tax income in CHF mn
66% 65% 59% 61% 59%
Return on regulatory capital†
832 870 854966 1,001
Client Business Volume in CHF bn
39 38
48 43 45
SUB PC net margin in bps
Note: Unless otherwise stated, all financial numbers presented and discussed are adjusted and exclude significant items. Results excluding items included in our reported results are non-GAAP financial measures. For further details and reconciliation information, see Appendix † RoRC is a non-GAAP financial measure, see Appendix
15% 15%17%
15% 15%
Cost/income ratio
20172016 20202019201820172016 20202019201820172016
20202019201820172016 20202019201820172016 20202019201820172016
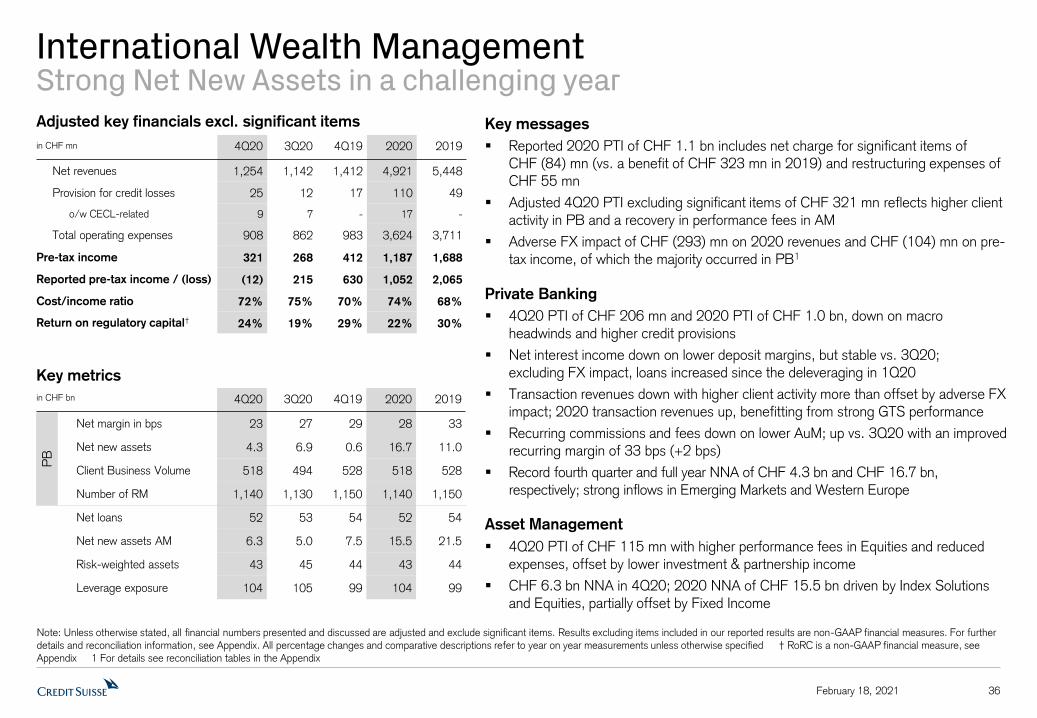
International Wealth ManagementStrong Net New Assets in a challenging year
36February 18, 2021
Key messages
Reported 2020 PTI of CHF 1.1 bn includes net charge for significant items of CHF (84) mn (vs. a benefit of CHF 323 mn in 2019) and restructuring expenses of CHF 55 mn
Adjusted 4Q20 PTI excluding significant items of CHF 321 mn reflects higher client activity in PB and a recovery in performance fees in AM
Adverse FX impact of CHF (293) mn on 2020 revenues and CHF (104) mn on pre-tax income, of which the majority occurred in PB1
Private Banking
4Q20 PTI of CHF 206 mn and 2020 PTI of CHF 1.0 bn, down on macro headwinds and higher credit provisions
Net interest income down on lower deposit margins, but stable vs. 3Q20;excluding FX impact, loans increased since the deleveraging in 1Q20
Transaction revenues down with higher client activity more than offset by adverse FX impact; 2020 transaction revenues up, benefitting from strong GTS performance
Recurring commissions and fees down on lower AuM; up vs. 3Q20 with an improved recurring margin of 33 bps (+2 bps)
Record fourth quarter and full year NNA of CHF 4.3 bn and CHF 16.7 bn, respectively; strong inflows in Emerging Markets and Western Europe
Asset Management
4Q20 PTI of CHF 115 mn with higher performance fees in Equities and reduced expenses, offset by lower investment & partnership income
CHF 6.3 bn NNA in 4Q20; 2020 NNA of CHF 15.5 bn driven by Index Solutions and Equities, partially offset by Fixed Income
Key metrics
in CHF bn 4Q20 3Q20 4Q19 2020 2019
Net margin in bps 23 27 29 28 33
Net new assets 4.3 6.9 0.6 16.7 11.0
Client Business Volume 518 494 528 518 528
Number of RM 1,140 1,130 1,150 1,140 1,150
Net loans 52 53 54 52 54
Net new assets AM 6.3 5.0 7.5 15.5 21.5
Risk-weighted assets 43 45 44 43 44
Leverage exposure 104 105 99 104 99
Adjusted key financials excl. significant items
in CHF mn 4Q20 3Q20 4Q19 2020 2019
Net revenues 1,254 1,142 1,412 4,921 5,448
Provision for credit losses 25 12 17 110 49
o/w CECL-related 9 7 - 17 -
Total operating expenses 908 862 983 3,624 3,711
Pre-tax income 321 268 412 1,187 1,688
Reported pre-tax income / (loss) (12) 215 630 1,052 2,065
Cost/income ratio 72% 75% 70% 74% 68%
Return on regulatory capital† 24% 19% 29% 22% 30%
PB
Note: Unless otherwise stated, all financial numbers presented and discussed are adjusted and exclude significant items. Results excluding items included in our reported results are non-GAAP financial measures. For further details and reconciliation information, see Appendix. All percentage changes and comparative descriptions refer to year on year measurements unless otherwise specified † RoRC is a non-GAAP financial measure, see Appendix 1 For details see reconciliation tables in the Appendix

International Wealth ManagementLast 3 fourth quarters – Adjusted results excluding significant items
37February 18, 2021
Note: Unless otherwise stated, all financial numbers presented and discussed are adjusted and exclude significant items. Results excluding items included in our reported results are non-GAAP financial measures. For further details and reconciliation information, see Appendix † RoRC is a non-GAAP financial measure, see Appendix 1 Before elimination of assets managed by Asset Management on behalf of IWM PB clients
1,343 1,412 1,254
Net revenues in CHF mn
429 412 321
Pre-tax income in CHF mn
67% 70% 72%
Cost/income ratio
Return on regulatory capital†
871966 958
Client Business Volume1 in CHF bn
31 29
23
IWM PB net margin in bps
33%29%
24%
4Q204Q194Q18 4Q204Q194Q18 4Q204Q194Q18
4Q204Q194Q184Q204Q194Q18 4Q204Q194Q18

International Wealth ManagementLast 5 years – Adjusted results excluding significant items
38February 18, 2021
4,667 5,083 5,263 5,448
4,921
Net revenues in CHF mn
202020192018
1,077
1,428
1,715 1,688
1,187
Pre-tax income in CHF mn
76% 71%67% 68% 74%
Return on regulatory capital†
790
902 871966 958
Client Business Volume1 in CHF bn
26 30
35 33 28
IWM PB net margin in bps
Note: Unless otherwise stated, all financial numbers presented and discussed are adjusted and exclude significant items. Results excluding items included in our reported results are non-GAAP financial measures. For further details and reconciliation information, see Appendix † RoRC is a non-GAAP financial measure, see Appendix 1 Before elimination of assets managed by Asset Management on behalf of IWM PB clients
Cost/income ratio
20172016 20202019201820172016 20202019201820172016
20202019201820172016 20202019201820172016 20202019201820172016
21%
27%
32%30%
22%

Asia PacificStrong RoRC† reflecting increase in market and client activity
39February 18, 2021
Note: Unless otherwise stated, all financial numbers presented and discussed are adjusted and exclude significant items. Results excluding items included in our reported results are non-GAAP financial measures. For further details and reconciliation information, see Appendix. All percentage changes and comparative descriptions refer to year on year measurements unless otherwise specified † RoRC is a non-GAAP financial measure, see Appendix 1 Dealogic for the year 2020 (APAC excl. Japan and China onshore among International banks)
Full year 2020
Net revenues increased by 5%, or 12% in constant 2019 FX terms, with transaction-based revenues benefitting from strong GTS performance, private client activity and increased IBCM share of wallet (for the fifth consecutive year1), partially offset by lower financing revenues
Reported PTI of CHF 828 mn includes significant items of CHF 63 mn (vs. CHF 98 mn in 2019)
Adjusted PTI excluding significant items of CHF 769 mn includes credit provisions of CHF 236 mn (vs. CHF 55 mn in 2019); cost/income ratio down 3 pp. to 67%
Fourth quarter 2020
Net revenues largely stable despite an adverse FX impact of CHF 57 mn
PTI stable includes adverse FX impacts of CHF 14 mn; RoRC† at 23%, up 5 pp.
Net interest income declined 27% mainly reflecting negative impact from low interest rates and lower lending volumes from client deleveraging in 1H20
Recurring commissions & fees down 5% due to unfavorable FX movements; QoQ improvement primarily from higher fund and mandate volumes
Transaction-based revenues up 28% reflecting higher financing revenues, including MtM gains, higher origination fees from equity-related activity and strong private client activity
Expenses increased in local currency terms reflecting higher compensation expenses and investments in China offset by a beneficial FX impact
Continued client re-leveraging in 4Q20; excluding adverse FX impact, net loans grew in the quarter
RWA and leverage exposure declined 17% and 8% YoY, respectively, also benefitting from FX movements
Key metrics
in CHF bn 4Q20 3Q20 4Q19 2020 2019
Net margin in bps 36 33 37 36 38
Net new assets (1.1) 2.2 0.7 8.6 8.7
Client Business Volume 354 333 321 354 321
Number of RM 600 600 600 600 600
Net loans 39 38 46 39 46
Risk-weighted assets 27 27 32 27 32
Leverage exposure 74 74 81 74 81
Adjusted key financials excl. significant items
in CHF mn 4Q20 3Q20 4Q19 2020 2019
Net interest income 241 257 330 1,071 1,118
Recurring commissions & fees 89 85 94 348 378
Transaction-based 415 386 325 1,670 1,433
Other revenues 1 - 1 3 2
Net revenues 746 728 750 3,092 2,931
Provision for credit losses 6 45 14 236 55
o/w CECL-related 3 9 - 33 -
Total operating expenses 539 504 535 2,087 2,052
Pre-tax income 201 179 201 769 824
Reported pre-tax income 237 177 201 828 922
Cost/income ratio 72% 69% 71% 67% 70%
Return on regulatory capital† 23% 20% 18% 20% 19%

Asia PacificLast 3 fourth quarters – Adjusted results excluding significant items
40February 18, 2021
Note: Unless otherwise stated, all financial numbers presented and discussed are adjusted and exclude significant items. Results excluding items included in our reported results are non-GAAP financial measures. For further details and reconciliation information, see Appendix † RoRC is a non-GAAP financial measure, see Appendix
584
750 746
Net revenues in CHF mn
106
201 201
Pre-tax income in CHF mn
80%71% 72%
Return on regulatory capital†
286321
354
Client Business Volume in CHF bn
21
37 36
APAC net margin in bps
11%
18%
23%
Cost/income ratio
4Q204Q194Q18 4Q204Q194Q18 4Q204Q194Q18
4Q204Q194Q184Q204Q194Q18 4Q204Q194Q18

Asia PacificLast 5 years – Adjusted results excluding significant items
41February 18, 2021
2,658 2,814 2,759 2,931 3,092
Net revenues in CHF mn
202020192018
607
759 748 824
769
Pre-tax income in CHF mn
76% 72% 72% 70% 67%
Return on regulatory capital†
242
298 286321
354
Client Business Volume in CHF bn
38 42
37 38 36
APAC net margin in bps
Note: Unless otherwise stated, all financial numbers presented and discussed are adjusted and exclude significant items. Results excluding items included in our reported results are non-GAAP financial measures. For further details and reconciliation information, see Appendix † RoRC is a non-GAAP financial measure, see Appendix
18%
22%19% 19% 20%
Cost/income ratio
20172016 20202019201820172016 20202019201820172016
20202019201820172016 20202019201820172016 20202019201820172016

Investment BankStrong revenue momentum driving higher profitability and returns
42February 18, 2021
Full year 2020
Revenues up 18% reflecting growth across all products with accelerating momentum in Capital Markets, particularly in 2H20
Reported PTI of USD 1.8 bn, includes USD 52 mn of restructuring expenses
Adjusted PTI of USD 1.9 bn, up 70% and higher adjusted RoRC† of 13% highlighting strength of diversified and de-risked franchise
Fourth quarter 2020
Net revenues up 19% at USD 2,337 mn
Adjusted PTI of USD 357 mn, up 268%, generating significantly improved adjusted RoRC† of 10%; results reflect market share gains and constructive market conditions
Outperformance in Capital markets, up 90%, with ECM revenues up 217% and higher debt issuance activity; higher advisory revenues reflecting increased M&A completions
Stable fixed income sales and trading revenues vs. strong 4Q19 results reflecting continued strength in our Credit franchise
Higher equity sales and trading revenues, up 5%, with strength in cash equities and equity derivatives
GTS revenues stable YoY following a strong 3Q20 performance as lower macro results offset increased cross-divisional collaboration
Operating expenses increased 7% mainly due to higher compensation and UK bank levy costs
Leverage exposure decreased QoQ due to reduced margin requirements and settlement fails; RWA decreased QoQ driven by business reductions and lower credit risk
Note: Unless otherwise stated, all financial numbers presented and discussed are adjusted. Results excluding items included in our reported results are non-GAAP financial measures. For further details and reconciliationinformation, see Appendix. All percentage changes and comparative descriptions refer to year on year measurements unless otherwise specified † RoRC is a non-GAAP financial measure, see Appendix 1 Includes DCM and ECM 2 Other revenues include treasury funding costs and changes in the carrying value of certain investments
Key metrics
in USD bn 4Q20 3Q20 4Q19 2020 2019
Risk-weighted assets 88 90 85 88 85
Leverage exposure 363 365 343 363 343
Adjusted key financials
in USD mn 4Q20 3Q20 4Q19 2020 2019
Fixed income S&T 788 921 789 4,266 3,374
Equity S&T 555 588 529 2,571 2,291
Capital markets1 843 708 443 2,539 1,873
Advisory and other fees 199 117 172 645 601
Other2 (48) (89) 37 (303) 70
Net revenues 2,337 2,245 1,970 9,718 8,209
Provision for credit losses 42 (16) 69 489 105
o/w CECL-related 3 (37) - 289 -
Total operating expenses 1,938 1,797 1,804 7,347 7,000
Pre-tax income 357 464 97 1,882 1,104
Reported pre-tax income 318 405 57 1,760 1,033
Cost/income ratio 83% 80% 92% 76% 85%
Return on regulatory capital† 10% 13% 3% 13% 8%

Investment BankLast 3 fourth quarters – Adjusted results
43February 18, 2021
Fixed income Sales & Trading in USD mn
Capital markets1 in USD mn
Equity Sales & Trading in USD mn
Advisory and other fees in USD mn
Pre-tax income in USD mn
Return on regulatory capital†
466
789 788
375 443
843
479529 555
5197
357
1%3%
10%
281
172199
Note: Unless otherwise stated, all financial numbers presented and discussed are adjusted. Results excluding items included in our reported results are non-GAAP financial measures. For further details and reconciliationinformation, see Appendix † RoRC is a non-GAAP financial measure, see Appendix 1 Includes DCM and ECM
4Q204Q194Q18 4Q204Q194Q18 4Q204Q194Q18
4Q204Q194Q184Q204Q194Q18 4Q204Q194Q18

Investment BankLast 5 years – Adjusted results
44February 18, 2021
Fixed income Sales & Trading in USD mn
Capital markets1 in USD mn
Equity Sales & Trading in USD mn
Advisory and other fees in USD mn
Pre-tax income in USD mn
Return on regulatory capital†
2,806 3,0002,701
3,374
4,266
2,186
2,6122,304
1,873
2,539
2,673
2,260 2,195 2,2912,571
854
1,2971,222 1,104
1,882
6%
9%8%
8%
13%
800 777
956
601 645
Note: For details on calculations see under ‘Notes’ in the Appendix. All financial numbers presented and discussed are adjusted, unless otherwise stated. Results excluding items included in our reported results are non-GAAP financial measures. For further details and reconciliation information, see Appendix † RoRC is a non-GAAP financial measure, see Appendix 1 Includes DCM and ECM
20202019201820172016 20202019201820172016 20202019201820172016
20202019201820172016 20202019201820172016 20202019201820172016

CEO Summary
45February 18, 2021
46February 18, 2021
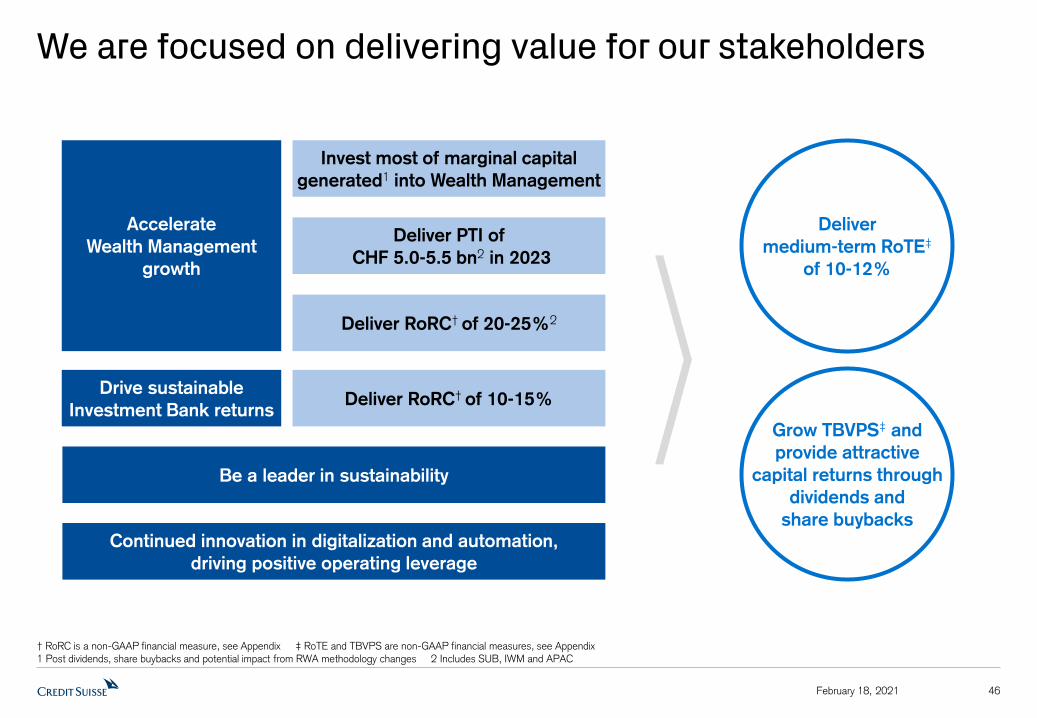
We are focused on delivering value for our stakeholders
Continued innovation in digitalization and automation,
driving positive operating leverage
Deliver RoRC† of 20-25%2
Deliver PTI of
CHF 5.0-5.5 bn2 in 2023
Accelerate
Wealth Management
growth
Deliver RoRC† of 10-15% Drive sustainable
Investment Bank returns
Be a leader in sustainability
Invest most of marginal capital
generated1 into Wealth Management
Grow TBVPS‡ and
provide attractive
capital returns through
dividends and
share buybacks
Deliver
medium-term RoTE‡
of 10-12%
† RoRC is a non-GAAP financial measure, see Appendix ‡ RoTE and TBVPS are non-GAAP financial measures, see Appendix 1 Post dividends, share buybacks and potential impact from RWA methodology changes 2 Includes SUB, IWM and APAC

Appendix
47February 18, 2021

Swiss Universal BankPrivate Clients and Corporate & Institutional Clients
48February 18, 2021
Note: Unless otherwise stated, all financial numbers presented and discussed are adjusted and exclude significant items. Results excluding items included in our reported results are non-GAAP financial measures. For further details and reconciliation information, see Appendix
C&IC Adjusted key financials excl. significant items
in CHF mn 4Q20 3Q20 4Q19 2020 2019
Net interest income 255 258 282 1,069 1,125
Recurring commissions & fees 159 168 173 665 663
Transaction-based 148 175 167 755 732
Other revenues (7) (7) (15) (42) (58)
Net revenues 555 594 607 2,447 2,462
Provision for credit losses 49 47 32 208 63
o/w CECL-related 6 (30) - 55 -
Total operating expenses 316 312 340 1,274 1,358
Pre-tax income 190 235 235 965 1,041
Reported pre-tax income 230 230 393 1,024 1,291
Cost/income ratio 57% 53% 56% 52% 55%
Key metrics
in CHF bn 4Q20 3Q20 4Q19 2020 2019
Net margin in bps 38 46 41 45 43
Net new assets (2.1) 2.0 (0.5) (5.9) 3.4
Mandate penetration 37% 36% 34% 37% 34%
Client Business Volume 381 373 377 381 377
Number of RM 1,290 1,310 1,280 1,290 1,280
Key metrics
in CHF bn 4Q20 3Q20 4Q19 2020 2019
Net new assets 3.8 3.5 2.5 13.7 45.3
Client Business Volume 620 592 589 620 589
Number of RM 480 480 510 480 510
Private Clients Adjusted key financials excl. significant items
in CHF mn 4Q20 3Q20 4Q19 2020 2019
Net interest income 403 396 414 1,614 1,580
Recurring commissions & fees 193 199 212 775 826
Transaction-based 96 106 90 480 412
Other revenues (4) (1) (1) (10) (2)
Net revenues 688 700 715 2,859 2,816
Provision for credit losses 17 5 11 62 46
o/w CECL-related 9 (6) - 20 -
Total operating expenses 474 459 482 1,875 1,850
Pre-tax income 197 236 222 922 920
Reported pre-tax income 257 200 474 1,080 1,282
Cost/income ratio 69% 66% 67% 66% 66%

International Wealth ManagementPrivate Banking and Asset Management
49February 18, 2021
Note: Unless otherwise stated, all financial numbers presented and discussed are adjusted and exclude significant items. Results excluding items included in our reported results are non-GAAP financial measures. For further details and reconciliation information, see Appendix
Private Banking Adjusted key financials excl. significant items
in CHF mn 4Q20 3Q20 4Q19 2020 2019
Net interest income 304 302 368 1,265 1,419
Recurring commissions & fees 297 272 319 1,136 1,205
Transaction- and perf.-based 261 259 270 1,221 1,186
Other revenues - 3 5 (2) 3
Net revenues 862 836 962 3,620 3,813
Provision for credit losses 31 8 17 110 48
o/w CECL-related 14 2 - 17 -
Total operating expenses 625 592 674 2,515 2,560
Pre-tax income 206 236 271 995 1,205
Reported pre-tax income 293 197 491 1,091 1,586
Cost/income ratio 73% 71% 70% 69% 67%
Key metrics
in CHF bn 4Q20 3Q20 4Q19 2020 2019
Net margin in bps 23 27 29 28 33
Net new assets 4.3 6.9 0.6 16.7 11.0
Client Business Volume 518 494 528 518 528
Mandate penetration 34% 34% 34% 34% 34%
Net loans 52 53 54 52 54
Number of RM 1,140 1,130 1,150 1,140 1,150
AM Adjusted key financials excl. significant items
in CHF mn 4Q20 3Q20 4Q19 2020 2019
Management fees 269 261 280 1,050 1,112
Performance & placement revenues 115 40 92 170 244
Investment & partnership income 8 5 78 81 279
Net revenues 392 306 450 1,301 1,635
Provision for credit losses (6) 4 - - 1
o/w CECL-related (5) 5 - - -
Total operating expenses 283 270 309 1,109 1,151
Pre-tax income 115 32 141 192 483
Reported pre-tax income /(loss) (305) 18 139 (39) 479
Cost/income ratio 72% 88% 69% 85% 70%
Key metrics
in CHF bn 4Q20 3Q20 4Q19 2020 2019
Net new assets 6.3 5.0 7.5 15.5 21.5
Assets under management 440 439 438 440 438

Wealth Management businessesNNA generation
50
0.6
3.7
1.8
6.9
4.3
(0.5)(1.6)
2.0
(2.1)
IWM PB NNA in CHF bn
NNA growth (annualized)
5%
SUB PC NNA in CHF bn
NNA growth (annualized)
(4)%
4Q204Q20
8%1% 2%4%4%(1)% (3)%(8)%
3Q204Q19 1Q20 2Q20 3Q204Q19 1Q20 2Q20
(4.2)
February 18, 2021
0.7
3.0
4.5
2.2
(1.1)
NNA growth (annualized)
(2)%
APAC NNA in CHF bn
4Q20
4%1% 9%5%
3Q204Q19 1Q20 2Q20

137152 155
135 135104
114 107 96 97
37 36 3833 36
51February 18, 2021
Wealth Management businessesNet and gross margins
Note: For details on calculations see under ‘Notes’ at the end of this Appendix. Unless otherwise stated, all financial numbers presented and discussed are adjusted and exclude significant items. Results excluding items included in our reported results are non-GAAP financial measures. For further details and reconciliation information, see Appendix
347204
236236
836700
Average AuM in CHF bn
Adjusted pre-tax income excl. significant items in CHF mn
Adjusted net revenues excl. significant items in CHF mn
9051,017 862962
224329 206271
338358 356371
702769 688715
210279 197222
200211 206217
2937
27 2723
IWM PB Adj. net margin excl. sign. items in bps
Adj. gross margin excl. sign. items in bps
4Q203Q201Q204Q19 2Q20
4Q203Q201Q204Q19 2Q20
132146 140 138 134
4153
42 4638
SUB PC Adj. net margin excl. sign. items in bps
Adj. gross margin excl. sign. items in bps
4Q203Q201Q204Q19 2Q20
4Q203Q201Q204Q19 2Q20
179
728808810 746750
196193 201201
216208214 222219
APAC Adj. net margin excl. sign. items in bps
Adj. gross margin excl. sign. items in bps
4Q203Q201Q204Q19 2Q20
4Q203Q201Q204Q19 2Q20

52February 18, 2021
Wealth Management businessesClient Business Volume (CBV)
377354
368 373 381
SUB PC
Client Business Volume (CBV) in CHF bn
4Q202Q204Q19 1Q20 3Q20
CBV growth QoQ (annualized), excluding estimated cumulative FX impact1
8% (22)% 16% 7% 10%
321286
318 333 354
APAC
Client Business Volume (CBV) in CHF bn
528
449478
494518
IWM PB
Client Business Volume (CBV) in CHF bn
4Q202Q204Q19 1Q20 3Q20 4Q202Q204Q19 1Q20 3Q20
Assets under Management in CHF bn
218 195 202 205 209
Custody Assets2 in CHF bn
43 42 48 50 54
Net loans in CHF bn
116 117 118 118 118
370 328 345 352 365
104 71 82 89 100
54 50 51 53 52
220 197 216 219 221
55 47 63 76 94
46 42 40 38 39
7% (46)% 29% 17% 26% 18% (34)% 44% 27% 38%
1 Based on management data, estimates and assumptions 2 Includes assets under custody and commercial assets

53
Corporate Center
Note: Unless otherwise stated, all financial numbers presented and discussed are adjusted. Results excluding items included in our reported results are non-GAAP financial measures. For further details and reconciliationinformation, see Appendix 1 ‘Other revenues’ primarily include required elimination adjustments associated with trading in own shares, treasury commissions charged to divisions, the cost of certain hedging transactions executed in connection with the Group's RWAs and valuation hedging impacts from long-dated legacy deferred compensation and retirement programs mainly relating to former employees 2 Excludes CHF 111 bn of central bank reserves, after adjusting for the dividend paid in 2020, as permitted by FINMA 3 Excludes CHF 110 bn of central bank reserves, after adjusting for the dividend paid in 2Q20 and the planned dividend payment in 4Q20 as permitted by FINMA
ARU within Corp. Ctr. Adjusted key financials
in CHF mn unless otherwise specified 4Q20 3Q20 4Q19 2020 2019
Net revenues (50) (33) (40) (178) (142)
Provision for credit losses - (2) 4 (4) 5
Total operating expenses 50 37 48 163 234
Pre-tax income / (loss) (100) (68) (92) (337) (381)
Risk-weighted assets in USD bn 10 10 11 10 11
RWA excl. operational risk in USD bn 9 10 9 9 9
Leverage exposure in USD bn 21 21 21 21 21
Corporate Center Key metrics
in CHF bn 4Q20 3Q20 4Q19 2020 2019
Total assets 111 118 106 111 106
Risk-weighted assets 46 49 52 46 52
Leverage exposure 72 153 113 72 113
Corporate Center Adjusted key financials
in CHF mn 4Q20 3Q20 4Q19 2020 2019
Treasury results (32) (53) 92 (356) (501)
o/w Structured Notes Volatility 22 31 14 (234) (460)
Asset Resolution Unit (50) (33) (40) (178) (142)
Other1 65 73 72 218 218
Net revenues (17) (13) 124 (316) (401)
Provision for credit losses 3 (1) 5 9 7
Compensation and benefits 140 136 174 352 489
G&A expenses 196 88 134 477 460
Commission expenses 17 19 20 81 68
Total other operating expenses 213 107 154 558 528
Total operating expenses 353 243 328 910 1,017
Pre-tax income / (loss) (373) (255) (209) (1,235) (1,425)
Reported pre-tax income / (loss) (1,090) (389) (539) (2,172) (1,866)
February 18, 2021

International Wealth Management in USD1
54February 18, 2021
Key metrics
in USD bn 4Q20 3Q20 4Q19 2020 2019
Net margin in bps 23 27 29 28 33
Net new assets 4.7 7.5 0.5 18.0 11.0
Client Business Volume 588 536 545 588 545
Number of RM 1,140 1,130 1,150 1,140 1,150
Net loans 59 57 55 59 55
Net new assets AM 7.1 5.4 7.5 17.0 21.7
Risk-weighted assets 49 49 45 49 45
Leverage exposure 118 114 102 118 102
Note: Unless otherwise stated, all financial numbers presented and discussed are adjusted and exclude significant items. Results excluding items included in our reported results are non-GAAP financial measures. For further details and reconciliation information, see Appendix † RoRC is a non-GAAP financial measure, see Appendix 1 Based on CHF figures converted into USD at weighted average exchange rates for P&L, and spot rates for AuM, client business volume, net loans, RWA and leverage exposure
Adjusted key financials excl. significant items
in USD mn 4Q20 3Q20 4Q19 2020 2019
Net revenues 1,394 1,252 1,435 5,268 5,487
Provision for credit losses 28 13 17 117 49
o/w CECL-related 11 8 - 20 -
Total operating expenses 1,009 946 999 3,881 3,736
Pre-tax income 357 293 419 1,270 1,702
Reported pre-tax income (7) 236 643 1,109 2,086
Cost/income ratio 72% 76% 70% 74% 68%
Return on regulatory capital† 24% 20% 29% 22% 30%
PB

International Wealth Management in USD1
Private Banking and Asset Management
55February 18, 2021
Private Banking Adjusted key financials excl. significant items
in USD mn 4Q20 3Q20 4Q19 2020 2019
Net interest income 338 331 373 1,354 1,429
Recurring commissions & fees 330 298 325 1,217 1,213
Transaction- and perf.-based 289 284 275 1,301 1,194
Other revenues - 4 4 (2) 3
Net revenues 957 916 977 3,869 3,839
Provision for credit losses 34 9 17 117 48
o/w CECL-related 16 3 - 20 -
Total operating expenses 695 649 685 2,692 2,577
Pre-tax income 228 258 275 1,060 1,214
Reported pre-tax income 328 216 501 1,167 1,602
Cost/income ratio 73% 71% 70% 70% 67%
Key metrics
in USD bn 4Q20 3Q20 4Q19 2020 2019
Net margin in bps 23 27 29 28 33
Net new assets 4.7 7.5 0.5 18.0 11.0
Client Business Volume 588 536 545 588 545
Mandate penetration 34% 34% 34% 34% 34%
Net loans 59 57 55 59 55
Number of RM 1,140 1,130 1,150 1,140 1,150
AM Adjusted key financials excl. significant items
in USD mn 4Q20 3Q20 4Q19 2020 2019
Management fees 299 287 284 1,126 1,120
Performance & placement revenues 122 44 94 182 247
Investment & partnership income 16 5 80 91 281
Net revenues 437 336 458 1,399 1,648
Provision for credit losses (6) 4 - - 1
o/w CECL-related (5) 5 - - -
Total operating expenses 314 297 314 1,189 1,159
Pre-tax income 129 35 144 210 488
Reported pre-tax income (335) 20 142 (58) 484
Cost/income ratio 72% 88% 69% 85% 70%
Key metrics
in USD bn 4Q20 3Q20 4Q19 2020 2019
Net new assets 7.1 5.4 7.5 17.0 21.7
Assets under management 500 476 452 500 452
Note: Unless otherwise stated, all financial numbers presented and discussed are adjusted and exclude significant items. Results excluding items included in our reported results are non-GAAP financial measures. For further details and reconciliation information, see Appendix 1 Based on CHF figures converted into USD at weighted average exchange rates for P&L, and spot rates for AuM, client business volume and net loans

Asia Pacific in USD1
56February 18, 2021
Key metrics
in USD bn 4Q20 3Q20 4Q19 2020 2019
Net margin in bps 36 33 37 36 38
Net new assets (1.3) 2.3 0.6 8.9 8.7
Client Business Volume 402 361 331 402 331
Number of RM 600 600 600 600 600
Net loans 44 42 47 44 47
Risk-weighted assets 30 29 33 30 33
Leverage exposure 84 80 84 84 84
Adjusted key financials excl. significant items
in USD mn 4Q20 3Q20 4Q19 2020 2019
Net interest income 269 281 335 1,145 1,126
Recurring commissions & fees 99 93 96 373 381
Transaction-based 460 425 331 1,788 1,444
Other revenues - 1 2 3 3
Net revenues 828 800 764 3,309 2,954
Provision for credit losses 7 49 13 248 55
o/w CECL-related 3 10 - 35 -
Total operating expenses 599 554 544 2,237 2,065
Pre-tax income 222 197 207 824 834
Reported pre-tax income 264 194 207 889 932
Cost/income ratio 72% 69% 71% 68% 70%
Return on regulatory capital† 23% 20% 18% 20% 19%
Note: Unless otherwise stated, all financial numbers presented and discussed are adjusted and exclude significant items. Results excluding items included in our reported results are non-GAAP financial measures. For further details and reconciliation information, see Appendix † RoRC is a non-GAAP financial measure, see Appendix 1 Based on CHF figures converted into USD at weighted average exchange rates for P&L, and spot rates for AuM, client business volume, net loans, RWA and leverage exposure

57February 18, 2021
We achieved strong growth in underlying pre-tax income
Group pre-tax income in CHF mn
4,143
4,662
2019 2020
+13%
Adjusted & excluding significant items & at FXC1Reported
Note: Results excluding items included in our reported results are non-GAAP financial measures. For further details and reconciliation information, see Appendix1 At constant average 2019 FX rates
4,720
3,467
2019 2020
(27)%
4,1434,375
2019 2020
+6%
Adjusted & excluding significant items

58February 18, 2021
Reinvigorated positive operating leverage
Note: Results excluding items included in our reported results are non-GAAP financial measures. For further details and reconciliation information, see Appendix. Growth percentages are calculated on the non-rounded results found in the Appendix 1 At constant average 2016 FX rates, calculated by converting the CHF amount of net revenues and operating expenses for 2020 back to the original currency on a monthly basis at the respective spot FX rate. The respective amounts are then converted back to CHF applying the average 2016 FX rate from the period against which the FX impact is measured. Average FX rates apply a straight line average of monthly FX rates for major currencies
Pre-provision profit
Operating expenses
Net revenues
2017 2018 2019 2020
17.9
16.4
16.916.6
20.9 20.8
21.4
22.1
3.0 4.4 4.5 5.5
Group adjusted results excl. significant items; in CHF bn 2020 vs.
2016CAGR
(3)%
+3%
0.9
2016
19.1
20.0
2020 vs. 2016 CAGR
(at FXC1)
(2)%
+4%

59February 18, 2021
Our loan book is highly collateralized with a majorityoriginated in Switzerland
60%40%87%
13%
CHF 294 bn1
Group gross loans
87% of Group loans are collateralized
SUB accounts for 60% of Group gross
loans; Switzerland has historically had a
low credit loss experience compared to
other regions2
Average provision for credit losses ratio3
2010-2020 of <10 bps for Credit
Suisse Group and its Wealth
Management-related businesses
1 Group gross loans per 4Q20 2 Source: Bloomberg, company filings. Based on provision for credit losses over average loan ratio of banks in Switzerland, the U.S., the UK and Europe (2006 to 9M20 average). Banks in Switzerland include Banque Cantonale Vaudoise (only full year and half year data), Credit Suisse, UBS; banks in the U.S. include Bank of America, Citigroup, JP Morgan, Wells Fargo; banks in the UK include Barclays, Lloyds, RBS; banks in Europe include ABN Amro (starting from 2009), BBVA, BNP Paribas, Commerzbank, Crédit Agricole, Deutsche Bank, Erste Group, ING Group, Intesa Sanpaolo, KBC, Nordea, Santander, Société Générale, Unicredit 3 Provision for credit losses related to loans held at amortized cost as % of average gross loans held at amortized cost
SUB share of Group gross loans
CHF 294 bn1
SUBOther
divisions
Collateralized
Uncollateralized

4.7
IG 4.1
IG
7.1
4Q19 1Q20 2Q20 3Q20 4Q20
60February 18, 2021
Oil & Gas / Leveraged Finance exposures
4Q19 1Q20 2Q20 3Q20 4Q20
Oil & Gas exposure1
in USD bn
Leveraged Finance exposure2
in USD bn
(5)%
(12)%
1 Oil & Gas net lending exposure in Corporate Bank 2 Represents non-Investment Grade underwriting exposure
9.5
7.37.7
2.9Non-IG
4.8IG
3.0
7.5
3.4Non-IG 3.1
Non-IG
4.1IG
6.9
3.8IG
6.2
3.0Non-IG
8.4
2.9Non-IG
7.5

65%
21%
7%7%
41%
29%
12%
17%
63%23%
8%6%
61February 18, 2021
Currency mix & Group capital metrics
Currency mix capital metric3
A 10% strengthening / weakening of the USD (vs. CHF)
would have a (1.8) bps / +2.0 bps impact on the
BIS CET1 ratio
Bas
el I
II R
isk-w
eig
hte
d a
ssets
Sw
iss
leve
rage e
xposu
re
CHF
EUR
Other
USD
US
D
CE
T1
cap
ital
4
Credit Suisse Group results
Applying a +/- 10% movement on the average FX rates for 2020, the sensitivities are:
USD/CHF impact on 2020 pre-tax income by CHF +354 / (354) mn
EUR/CHF impact on 2020 pre-tax income by CHF +153 / (153) mn
Sensitivity analysis on Group results2
2020
in CHF mn
Contribution
Swiss Universal Bank
International Wealth Management
Asia Pacific
Investment Bank
Group results CHF USD EUR GBP Other
Net revenues 22,389 26% 49% 10% 3% 12%
Total expenses1 18,922 31% 40% 4% 9% 16%
Net revenues 5,615 78% 15% 4% 1% 2%
Total expenses1 3,511 83% 11% 2% 2% 2%
Net revenues 4,837 26% 48% 17% 2% 7%
Total expenses1 3,785 44% 27% 9% 8% 12%
Net revenues 3,155 4% 67% 4% 1% 24%
Total expenses1 2,327 12% 27% -% 1% 60%
Net revenues 9,098 1% 65% 13% 5% 16%
Total expenses1 7,443 4% 58% 5% 17% 16%
1 Total expenses include provisions for credit losses 2 Sensitivity analysis based on weighted average exchange rates of USD/CHF of 0.95 and EUR/CHF of 1.07 for the 2020 results 3 Data based on December 2020 month-end currency mix 4 Reflects actual capital positions in consolidated Group legal entities (net assets) including net asset hedges less applicable Basel III regulatory adjustments (e.g. goodwill)

62
Reconciliation of adjustment items (1/10)
Results excluding items included in our reported results are non-GAAP financial measures. During the implementation of our strategy, we will measure the progress achieved by our underlying business performance. Management believes that such results provide a useful presentation of our operating results for purposes of assessing our Group and divisional performance consistently over time, on a basis that excludes items that management does not consider representative of our underlying performance. Provided below is a reconciliation to the most directly comparable US GAAP measures.
February 18, 2021
Group in CHF mn SUB in CHF mn
4Q20 3Q20 4Q19 4Q18 2020 2019 2018 2017 2016 2015 2014 4Q20 3Q20 4Q19 4Q18 2020 2019 2018 2017 2016
Net revenues reported 5,221 5,198 6,190 4,801 22,389 22,484 20,920 20,900 20,323 23,797 26,242 1,393 1,294 1,734 1,336 5,615 5,905 5,443 5,314 5,720
FVoD - - - - - - - - - (298) (543) - - - - - - - - -
Real estate (gains)/losses (15) - (146) (12) (15) (251) (28) - (424) (95) (414) (15) - (106) (6) (15) (223) (21) - (366)
(Gains)/losses on business sales - - 2 (3) - 2 (71) 13 58 (34) (101) - - - - - - (37) - -
Net revenues adjusted 5,206 5,198 6,046 4,786 22,374 22,235 20,821 20,913 19,957 23,370 25,184 1,378 1,294 1,628 1,330 5,600 5,682 5,385 5,314 5,354
o/w related to InvestLab transfer - - - - 268 327 - - - - - - - - - 25 98 - - -
o/w related to Allfunds Group revaluation 127 - - - 127 - - - - - - 38 - - - 38 - - - -
o/w related to SIX revaluation 158 - 498 - 158 498 - - - - - 97 - 306 - 97 306 - - -
o/w Pfandbriefbank gain - - - - 134 - - - - - - - - - - 134 - - - -
o/w York impairment (414) - - - (414) - - - - - - - - - - - - - - -
Net revenues adj. excl. significant items 5,335 5,198 5,548 4,786 22,101 21,410 20,821 20,913 19,957 23,370 25,184 1,243 1,294 1,322 1,330 5,306 5,278 5,385 5,314 5,354
Provision for credit losses 138 94 146 59 1,096 324 245 210 252 324 186 66 52 43 26 270 109 127 75 79
Total operating expenses reported 5,171 4,301 4,830 4,147 17,826 17,440 17,303 18,897 22,337 25,895 22,429 840 812 824 852 3,241 3,223 3,325 3,576 3,619
Goodwill impairment - - - - - - - - - (3,797) - - - - - - - - - -
Restructuring expenses (50) (107) - (136) (157) - (626) (455) (540) (355) - (3) (41) - (21) (44) - (101) (59) (60)
Major litigation provisions (757) (152) (326) (82) (988) (389) (244) (493) (2,707) (820) (2,436) (44) - - (35) (45) (3) (37) (49) (19)
Expenses related to real estate disposals (28) (25) (57) - (51) (108) - - - - - (3) - (2) - (3) (12) - - -
Expenses related to business sales - - - (48) - - (51) (8) - - - - - - - - - - - -
Total operating expenses adjusted 4,336 4,017 4,447 3,881 16,630 16,943 16,382 17,941 19,090 20,923 19,993 790 771 822 796 3,149 3,208 3,187 3,468 3,540
Pre-tax income/(loss) reported (88) 803 1,214 595 3,467 4,720 3,372 1,793 (2,266) (2,422) 3,627 487 430 867 458 2,104 2,573 1,991 1,663 2,022
Total adjustments and significant items 949 284 (259) 251 908 (577) 822 969 2,881 4,545 1,378 (100) 41 (410) 50 (217) (612) 80 108 (287)
Pre-tax income/(loss) adj. excl. significant items 861 1,087 955 846 4,375 4,143 4,194 2,762 615 2,123 5,005 387 471 457 508 1,887 1,961 2,071 1,771 1,735
Pre-provision profit/(loss) adj. excl. significant items 999 1,181 1,101 905 5,471 4,467 4,439 2,972 867 2,447 5,191 453 523 500 534 2,157 2,070 2,198 1,846 1,814

63
Reconciliation of adjustment items (2/10)
Results excluding items included in our reported results are non-GAAP financial measures. During the implementation of our strategy, we will measure the progress achieved by our underlying business performance. Management believes that such results provide a useful presentation of our operating results for purposes of assessing our Group and divisional performance consistently over time, on a basis that excludes items that management does not consider representative of our underlying performance. Provided below is a reconciliation to the most directly comparable US GAAP measures.
February 18, 2021
SUB PC in CHF mn SUB C&IC in CHF mn
4Q20 3Q20 2Q20 1Q20 4Q19 4Q18 2020 2019 2018 2017 2016 4Q20 3Q20 4Q19 4Q18 2020 2019 2018 2017 2016
Net revenues reported 750 700 836 769 968 716 3,055 3,186 2,903 2,826 3,199 643 594 766 620 2,560 2,719 2,540 2,488 2,521
Real estate (gains)/losses (15) - - - (104) (6) (15) (221) (21) - (366) - - (2) - - (2) - - -
(Gains)/losses on business sales - - - - - - - - (19) - - - - - - - - (18) - -
Net revenues adjusted 735 700 836 769 864 710 3,040 2,965 2,863 2,826 2,833 643 594 764 620 2,560 2,717 2,522 2,488 2,521
o/w related to InvestLab transfer - - - - - - - - - - - - - - - 25 98 - - -
o/w related to Allfunds Group revaluation - - - - - - - - - - - 38 - - - 38 - - - -
o/w related to SIX revaluation 47 - - - 149 - 47 149 - - - 50 - 157 - 50 157 - - -
o/w Pfandbriefbank gain - - 134 - - - 134 - - - - - - - - - - - - -
o/w York impairment - - - - - - - - - - - - - - - - - - - -
Net revenues adj. excl. significant items 688 700 702 769 715 710 2,859 2,816 2,863 2,826 2,833 555 594 607 620 2,447 2,462 2,522 2,488 2,521
Provision for credit losses 17 5 28 12 11 (4) 62 46 30 42 39 49 47 32 30 208 63 97 33 40
Total operating expenses reported 476 495 464 478 483 468 1,913 1,858 1,906 2,066 2,104 364 317 341 384 1,328 1,365 1,419 1,510 1,515
Restructuring expenses 1 (36) - - - (10) (35) - (66) (53) (51) (4) (5) - (11) (9) - (35) (6) (9)
Major litigation provisions - - - - - - - - - (6) - (44) - - (35) (45) (3) (37) (43) (19)
Expenses related to real estate disposals (3) - - - (1) - (3) (8) - - - - - (1) - - (4) - - -
Expenses related to business sales - - - - - - - - - - - - - - - - - - - -
Total operating expenses adjusted 474 459 464 478 482 458 1,875 1,850 1,840 2,007 2,053 316 312 340 338 1,274 1,358 1,347 1,461 1,487
Pre-tax income/(loss) reported 257 200 344 279 474 252 1,080 1,282 967 718 1,056 230 230 393 206 1,024 1,291 1,024 945 966
Total adjustments and significant items (60) 36 (134) - (252) 4 (158) (362) 26 59 (315) (40) 5 (158) 46 (59) (250) 54 49 28
Pre-tax income/(loss) adj. excl. significant items 197 236 210 279 222 256 922 920 993 777 741 190 235 235 252 965 1,041 1,078 994 994
Pre-provision profit/(loss) adj. excl. significant items 214 241 238 291 233 252 984 966 1,023 819 780 239 282 267 282 1,173 1,104 1,175 1,027 1,034
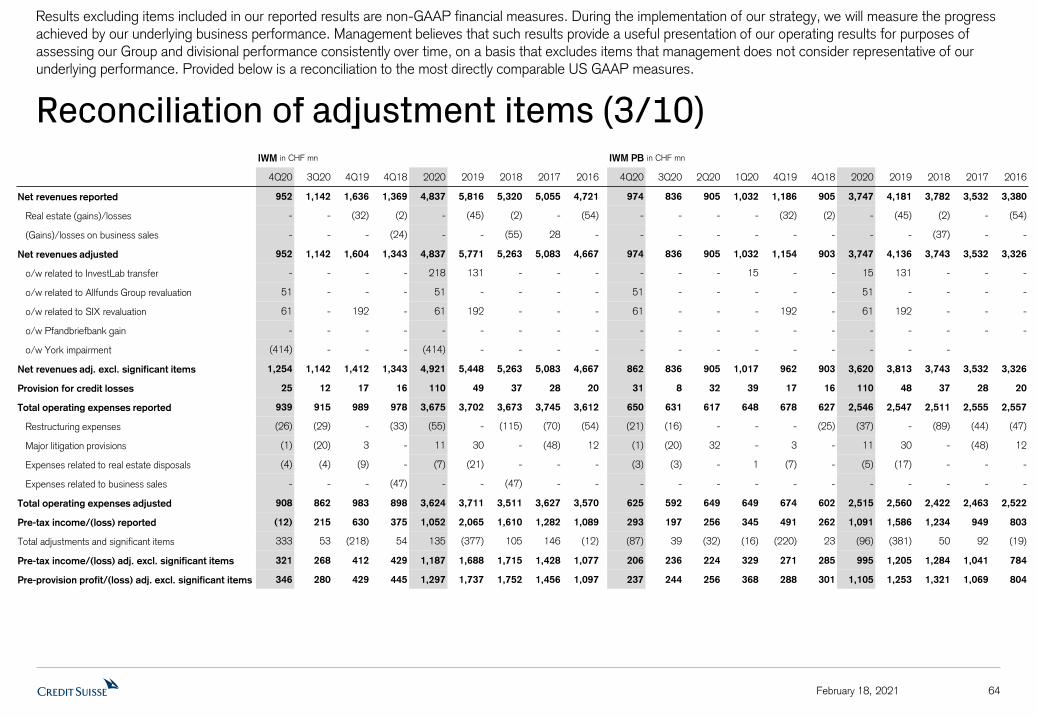
64
Reconciliation of adjustment items (3/10)
Results excluding items included in our reported results are non-GAAP financial measures. During the implementation of our strategy, we will measure the progress achieved by our underlying business performance. Management believes that such results provide a useful presentation of our operating results for purposes of assessing our Group and divisional performance consistently over time, on a basis that excludes items that management does not consider representative of our underlying performance. Provided below is a reconciliation to the most directly comparable US GAAP measures.
February 18, 2021
IWM in CHF mn IWM PB in CHF mn
4Q20 3Q20 4Q19 4Q18 2020 2019 2018 2017 2016 4Q20 3Q20 2Q20 1Q20 4Q19 4Q18 2020 2019 2018 2017 2016
Net revenues reported 952 1,142 1,636 1,369 4,837 5,816 5,320 5,055 4,721 974 836 905 1,032 1,186 905 3,747 4,181 3,782 3,532 3,380
Real estate (gains)/losses - - (32) (2) - (45) (2) - (54) - - - - (32) (2) - (45) (2) - (54)
(Gains)/losses on business sales - - - (24) - - (55) 28 - - - - - - - - - (37) - -
Net revenues adjusted 952 1,142 1,604 1,343 4,837 5,771 5,263 5,083 4,667 974 836 905 1,032 1,154 903 3,747 4,136 3,743 3,532 3,326
o/w related to InvestLab transfer - - - - 218 131 - - - - - - 15 - - 15 131 - - -
o/w related to Allfunds Group revaluation 51 - - - 51 - - - - 51 - - - - - 51 - - - -
o/w related to SIX revaluation 61 - 192 - 61 192 - - - 61 - - - 192 - 61 192 - - -
o/w Pfandbriefbank gain - - - - - - - - - - - - - - - - - - - -
o/w York impairment (414) - - - (414) - - - - - - - - - - - - -
Net revenues adj. excl. significant items 1,254 1,142 1,412 1,343 4,921 5,448 5,263 5,083 4,667 862 836 905 1,017 962 903 3,620 3,813 3,743 3,532 3,326
Provision for credit losses 25 12 17 16 110 49 37 28 20 31 8 32 39 17 16 110 48 37 28 20
Total operating expenses reported 939 915 989 978 3,675 3,702 3,673 3,745 3,612 650 631 617 648 678 627 2,546 2,547 2,511 2,555 2,557
Restructuring expenses (26) (29) - (33) (55) - (115) (70) (54) (21) (16) - - - (25) (37) - (89) (44) (47)
Major litigation provisions (1) (20) 3 - 11 30 - (48) 12 (1) (20) 32 - 3 - 11 30 - (48) 12
Expenses related to real estate disposals (4) (4) (9) - (7) (21) - - - (3) (3) - 1 (7) - (5) (17) - - -
Expenses related to business sales - - - (47) - - (47) - - - - - - - - - - - - -
Total operating expenses adjusted 908 862 983 898 3,624 3,711 3,511 3,627 3,570 625 592 649 649 674 602 2,515 2,560 2,422 2,463 2,522
Pre-tax income/(loss) reported (12) 215 630 375 1,052 2,065 1,610 1,282 1,089 293 197 256 345 491 262 1,091 1,586 1,234 949 803
Total adjustments and significant items 333 53 (218) 54 135 (377) 105 146 (12) (87) 39 (32) (16) (220) 23 (96) (381) 50 92 (19)
Pre-tax income/(loss) adj. excl. significant items 321 268 412 429 1,187 1,688 1,715 1,428 1,077 206 236 224 329 271 285 995 1,205 1,284 1,041 784
Pre-provision profit/(loss) adj. excl. significant items 346 280 429 445 1,297 1,737 1,752 1,456 1,097 237 244 256 368 288 301 1,105 1,253 1,321 1,069 804

65
Reconciliation of adjustment items (4/10)
Results excluding items included in our reported results are non-GAAP financial measures. During the implementation of our strategy, we will measure the progress achieved by our underlying business performance. Management believes that such results provide a useful presentation of our operating results for purposes of assessing our Group and divisional performance consistently over time, on a basis that excludes items that management does not consider representative of our underlying performance. Provided below is a reconciliation to the most directly comparable US GAAP measures.
February 18, 2021
IWM AM in CHF mn APAC in CHF mn
4Q20 3Q20 4Q19 4Q18 2020 2019 2018 2017 2016 4Q20 3Q20 2Q20 1Q20 4Q19 4Q18 2020 2019 2018 2017 2016
Net revenues reported (22) 306 450 464 1,090 1,635 1,538 1,523 1,341 784 728 808 835 750 584 3,155 3,029 2,759 2,814 2,658
Real estate (gains)/losses - - - - - - - - - - - - - - - - - - - -
(Gains)/losses on business sales - - - (24) - - (18) 28 - - - - - - - - - - - -
Net revenues adjusted (22) 306 450 440 1,090 1,635 1,520 1,551 1,341 784 728 808 835 750 584 3,155 3,029 2,759 2,814 2,658
o/w related to InvestLab transfer - - - - 203 - - - - - - - 25 - - 25 98 - - -
o/w related to Allfunds Group revaluation - - - - - - - - - 38 - - - - - 38 - - - -
o/w related to SIX revaluation - - - - - - - - - - - - - - - - - - - -
o/w Pfandbriefbank gain - - - - - - - - - - - - - - - - - - - -
o/w York impairment (414) - - - (414) - - - - - - - - - - - - -
Net revenues adj. excl. significant items 392 306 450 440 1,301 1,635 1,520 1,551 1,341 746 728 808 810 750 584 3,092 2,931 2,759 2,814 2,658
Provision for credit losses (6) 4 - - - 1 - - - 6 45 86 99 14 9 236 55 28 16 27
Total operating expenses reported 289 284 311 351 1,129 1,155 1,162 1,190 1,055 541 506 526 518 535 482 2,091 2,052 2,099 2,064 2,041
Restructuring expenses (5) (13) - (8) (18) - (26) (26) (7) (2) (2) - - - (12) (4) - (37) (25) (17)
Major litigation provisions - - - - - - - - - - - - - - (1) - - (79) - -
Expenses related to real estate disposals (1) (1) (2) - (2) (4) - - - - - - - - - - - - - -
Expenses related to business sales - - - (47) - - (47) - - - - - - - - - - - - -
Total operating expenses adjusted 283 270 309 296 1,109 1,151 1,089 1,164 1,048 539 504 526 518 535 469 2,087 2,052 1,983 2,039 2,024
Pre-tax income/(loss) reported (305) 18 139 113 (39) 479 376 333 286 237 177 196 218 201 93 828 922 632 734 590
Total adjustments and significant items 420 14 2 31 231 4 55 54 7 (36) 2 - (25) - 13 (59) (98) 116 25 17
Pre-tax income/(loss) adj. excl. significant items 115 32 141 144 192 483 431 387 293 201 179 196 193 201 106 769 824 748 759 607
Pre-provision profit/(loss) adj. excl. significant items 109 36 141 144 192 484 431 387 293 207 224 282 292 215 115 1,005 879 776 775 634

66
Reconciliation of adjustment items (5/10)
Results excluding items included in our reported results are non-GAAP financial measures. During the implementation of our strategy, we will measure the progress achieved by our underlying business performance. Management believes that such results provide a useful presentation of our operating results for purposes of assessing our Group and divisional performance consistently over time, on a basis that excludes items that management does not consider representative of our underlying performance. Provided below is a reconciliation to the most directly comparable US GAAP measures.
February 18, 2021
IB in USD mn CC in CHF mn
4Q20 3Q20 4Q19 4Q18 2020 2019 2018 2017 2016 4Q20 3Q20 4Q19 4Q18 2020 2019 2018 2017 2016
Net revenues reported 2,337 2,245 1,977 1,606 9,718 8,216 8,215 8,688 8,572 (17) (13) 123 84 (316) (427) 102 87 75
Real estate (gains)/losses - - (7) - - (7) - - - - - (1) (4) - 24 (4) - -
(Gains)/losses on business sales - - - - - - - - - - - 2 21 - 2 21 23 52
Net revenues adjusted 2,337 2,245 1,970 1,606 9,718 8,209 8,215 8,688 8,572 (17) (13) 124 101 (316) (401) 119 110 127
o/w related to InvestLab transfer - - - - - - - - - - - - - - - - - -
o/w related to Allfunds Group revaluation - - - - - - - - - - - - - - - - - -
o/w related to SIX revaluation - - - - - - - - - - - - - - - - - -
o/w Pfandbriefbank gain - - - - - - - - - - - - - - - - - -
o/w York impairment - - - - - - - - - - - - - - - - - -
Net revenues adj. excl. significant items 2,337 2,245 1,970 1,606 9,718 8,209 8,215 8,688 8,572 (17) (13) 124 101 (316) (401) 119 110 127
Provision for credit losses 42 (16) 69 8 489 105 52 61 15 3 (1) 5 1 9 7 1 - -
Total operating expenses reported 1,977 1,856 1,851 1,650 7,469 7,078 7,313 7,573 7,998 1,070 377 657 65 1,847 1,432 399 868 817
Restructuring expenses (16) (36) - (101) (52) - (360) (235) (288) (5) (2) - (1) (7) - 1 (14) (6)
Major litigation provisions - - - (2) (25) - (12) - (7) (712) (132) (329) (1) (930) (416) (1) (127) -
Expenses related to real estate disposals (23) (23) (47) - (45) (78) - - - - - - - - 1 - - -
Expenses related to business sales - - - - - - - (8) - - - - - - - - - -
Total operating expenses adjusted 1,938 1,797 1,804 1,547 7,347 7,000 6,941 7,330 7,703 353 243 328 63 910 1,017 399 727 811
Pre-tax income/(loss) reported 318 405 57 (52) 1,760 1,033 850 1,054 559 (1,090) (389) (539) 18 (2,172) (1,866) (298) (781) (742)
Total adjustments and significant items 39 59 40 103 122 71 372 243 295 717 134 330 19 937 441 17 164 58
Pre-tax income/(loss) adj. excl. significant items 357 464 97 51 1,882 1,104 1,222 1,297 854 (373) (255) (209) 37 (1,235) (1,425) (281) (617) (684)
Pre-provision profit/(loss) adj. excl. significant items 399 448 166 59 2,371 1,209 1,274 1,358 869

67
Reconciliation of adjustment items (6/10)
Results excluding items included in our reported results are non-GAAP financial measures. During the implementation of our strategy, we will measure the progress achieved by our underlying business performance. Management believes that such results provide a useful presentation of our operating results for purposes of assessing our Group and divisional performance consistently over time, on a basis that excludes items that management does not consider representative of our underlying performance. Provided below is a reconciliation to the most directly comparable US GAAP measures.
February 18, 2021
WM1 in CHF mn WM-related2 in CHF mn
4Q20 3Q20 4Q19 4Q18 2020 2019 2018 2017 2016 4Q20 3Q20 4Q19 4Q18 2020 2019 2018 2017 2016
Net revenues reported 2,508 2,264 2,904 2,205 9,957 10,396 9,444 9,172 9,237 3,129 3,164 4,120 3,289 13,607 14,750 13,522 13,183 13,099
Real estate (gains)/losses (15) - (136) (8) (15) (266) (23) - (420) (15) - (138) (8) (15) (268) (23) - (420)
(Gains)/losses on business sales - - - - - - (56) - - - - - (24) - - (92) 28 -
Net revenues adjusted 2,493 2,264 2,768 2,197 9,942 10,130 9,365 9,172 8,817 3,114 3,164 3,982 3,257 13,592 14,482 13,407 13,211 12,679
o/w related to InvestLab transfer - - - - 40 229 - - - - - - - 268 327 - - -
o/w related to Allfunds Group revaluation 89 - - - 89 - - - - 127 - - - 127 - - - -
o/w related to SIX revaluation 108 - 341 - 108 341 - - - 158 - 498 - 158 498 - - -
o/w Pfandbriefbank gain - - - - 134 - - - - - - - - 134 - - - -
o/w York impairment - - - - - - - - - (414) - - - (414)
Net revenues adj. excl. significant items 2,296 2,264 2,427 2,197 9,571 9,560 9,365 9,172 8,817 3,243 3,164 3,484 3,257 13,319 13,657 13,407 13,211 12,679
Provision for credit losses 54 58 42 21 408 149 95 86 86 97 109 74 51 616 213 192 119 126
Total operating expenses reported 1,667 1,632 1,696 1,577 6,550 6,457 6,516 6,685 6,702 2,320 2,233 2,348 2,312 9,007 8,977 9,097 9,385 9,272
Restructuring expenses (22) (54) - (47) (76) - (192) (122) (115) (31) (72) - (66) (103) - (253) (154) (131)
Major litigation provisions (1) (20) 3 (1) 11 30 (79) (54) 12 (45) (20) 3 (36) (34) 27 (116) (97) (7)
Expenses related to real estate disposals (6) (3) (8) - (8) (25) - - - (7) (4) (11) - (10) (33) - - -
Expenses related to business sales - - - - - - - - - - - - (47) - - (47) - -
Total operating expenses adjusted 1,638 1,555 1,691 1,529 6,477 6,462 6,245 6,509 6,599 2,237 2,137 2,340 2,163 8,860 8,971 8,681 9,134 9,134
Pre-tax income/(loss) reported 787 574 1,166 607 2,999 3,790 2,833 2,401 2,449 712 822 1,698 926 3,984 5,560 4,233 3,679 3,701
Total adjustments and significant items (183) 77 (472) 40 (313) (841) 192 176 (317) 197 96 (628) 117 (141) (1,087) 301 279 (282)
Pre-tax income/(loss) adj. excl. significant items 604 651 694 647 2,686 2,949 3,025 2,577 2,132 909 918 1,070 1,043 3,843 4,473 4,534 3,958 3,419
Pre-provision profit/(loss) adj. excl. significant items 658 709 736 668 3,094 3,098 3,120 2,663 2,218 1,006 1,027 1,144 1,094 4,459 4,686 4,726 4,077 3,545
1 SUB PC, IWM PB and APAC 2 SUB, IWM and APAC

68
Reconciliation of adjustment items (7/10)
Results excluding items included in our reported results are non-GAAP financial measures. During the implementation of our strategy, we will measure the progress achieved by our underlying business performance. Management believes that such results provide a useful presentation of our operating results for purposes of assessing our Group and divisional performance consistently over time, on a basis that excludes items that management does not consider representative of our underlying performance. Provided below is a reconciliation to the most directly comparable US GAAP measures.
February 18, 2021
4Q20 adjusted financials excl. significant items in CHF mn SUB SUB PC SUB C&IC IWM IWM PB IWM AM APAC IB CC Group
Net interest income 658 403 255 304 304 - 241 - - -
Recurring commissions & fees 352 193 159 557 297 260 89 - - -
Transaction-based 244 96 148 433 261 172 415 - - -
Other revenues (11) (4) (7) (40) - (40) 1 - - -
Net revenues adj. excl. significant items 1,243 688 555 1,254 862 392 746 2,109 (17) 5,335
Provision for credit losses 66 17 49 25 31 (6) 6 38 3 138
Total operating expenses adjusted 790 474 316 908 625 283 539 1,746 353 4,336
Pre-tax income/(loss) adj. excl. significant items 387 197 190 321 206 115 201 325 (373) 861
FX impacts in CHF mn
Net interest income (5) - (5) (19) (19) - (18) - - -
Recurring commissions & fees (5) (3) (2) (39) (29) (10) (7) - - -
Transaction-based (8) (3) (5) (43) (30) (13) (32) - - -
Other revenues 1 1 - 5 - 5 - - - -
Net revenues adj. excl. significant items (17) (5) (12) (96) (78) (18) (57) (203) 5 (368)
Provision for credit losses - - - (2) (2) - - (3) - (5)
Total operating expenses adjusted (12) (5) (7) (54) (43) (11) (43) (139) (7) (255)
Pre-tax income/(loss) adj. excl. significant items (5) - (5) (40) (33) (7) (14) (61) 12 (108)
4Q20 adjusted financials excl. significant items at FXC1 in CHF mn
Net interest income 663 403 260 323 323 - 259 - - -
Recurring commissions & fees 357 196 161 596 326 270 96 - - -
Transaction-based 252 99 153 476 291 185 447 - - -
Other revenues (12) (5) (7) (45) - (45) 1 - - -
Net revenues adj. excl. significant items 1,260 693 567 1,350 940 410 803 2,312 (22) 5,703
Provision for credit losses 66 17 49 27 33 (6) 6 41 3 143
Total operating expenses adjusted 802 479 323 962 668 294 582 1,885 360 4,591
Pre-tax income/(loss) adj. excl. significant items 392 197 195 361 239 122 215 386 (385) 969
1 At constant average 4Q19 FX rates

69
Reconciliation of adjustment items (8/10)
Results excluding items included in our reported results are non-GAAP financial measures. During the implementation of our strategy, we will measure the progress achieved by our underlying business performance. Management believes that such results provide a useful presentation of our operating results for purposes of assessing our Group and divisional performance consistently over time, on a basis that excludes items that management does not consider representative of our underlying performance. Provided below is a reconciliation to the most directly comparable US GAAP measures.
February 18, 2021
2020 adjusted financials excl. significant items in CHF mn SUB SUB PC SUB C&IC IWM IWM PB IWM AM APAC IB CC Group
Net interest income 2,683 1,614 1,069 1,265 1,265 - 1,071 - - -
Recurring commissions & fees 1,440 775 665 2,139 1,136 1,003 348 - - -
Transaction-based 1,235 480 755 1,598 1,221 377 1,670 - - -
Other revenues (52) (10) (42) (81) (2) (79) 3 - - -
Net revenues adj. excl. significant items 5,306 2,859 2,447 4,921 3,620 1,301 3,092 9,098 (316) 22,101
Provision for credit losses 270 62 208 110 110 - 236 471 9 1,096
Total operating expenses adjusted 3,149 1,875 1,274 3,624 2,515 1,109 2,087 6,860 910 16,630
Pre-tax income/(loss) adj. excl. significant items 1,887 922 965 1,187 995 192 769 1,767 (1,235) 4,375
FX impacts in CHF mn
Net interest income (19) (2) (17) (62) (62) - (63) - - -
Recurring commissions & fees (17) (10) (7) (123) (92) (31) (22) - - -
Transaction-based (32) (11) (21) (117) (96) (21) (96) - - -
Other revenues - - - 9 - 9 - - - -
Net revenues adj. excl. significant items (68) (23) (45) (293) (250) (43) (181) (603) 11 (1,134)
Provision for credit losses (1) - (1) (4) (4) - (10) (18) - (33)
Total operating expenses adjusted (38) (19) (19) (185) (144) (41) (126) (447) (18) (814)
Pre-tax income/(loss) adj. excl. significant items (29) (4) (25) (104) (102) (2) (45) (138) 29 (287)
2020 adjusted financials excl. significant items at FXC1 in CHF mn
Net interest income 2,702 1,616 1,086 1,327 1,327 - 1,134 - - -
Recurring commissions & fees 1,457 785 672 2,262 1,228 1,034 370 - - -
Transaction-based 1,267 491 776 1,715 1,317 398 1,766 - - -
Other revenues (52) (10) (42) (90) (2) (88) 3 - - -
Net revenues adj. excl. significant items 5,374 2,882 2,492 5,214 3,870 1,344 3,273 9,701 (327) 23,235
Provision for credit losses 271 62 209 114 114 - 246 489 9 1,129
Total operating expenses adjusted 3,187 1,894 1,293 3,809 2,659 1,150 2,213 7,307 928 17,444
Pre-tax income/(loss) adj. excl. significant items 1,916 926 990 1,291 1,097 194 814 1,905 (1,264) 4,662
1 At constant average 2019 FX rates

70
Reconciliation of adjustment items (9/10)
Results excluding items included in our reported results are non-GAAP financial measures. During the implementation of our strategy, we will measure the progress achieved by our underlying business performance. Management believes that such results provide a useful presentation of our operating results for purposes of assessing our Group and divisional performance consistently over time, on a basis that excludes items that management does not consider representative of our underlying performance. Provided below is a reconciliation to the most directly comparable US GAAP measures.
February 18, 2021
IWM in USD mn1 IWM PB in USD mn1 IWM AM in USD mn1
4Q20 3Q20 4Q19 2020 2019 4Q20 3Q20 4Q19 2020 2019 4Q20 3Q20 4Q19 2020 2019
Net revenues reported 1,064 1,252 1,666 5,165 5,863 1,085 916 1,208 4,013 4,215 (21) 336 458 1,152 1,648
Real estate (gains)/losses - - (33) - (47) - - (33) - (47) - - - - -
(Gains)/losses on business sales - - - - - - - - - - - - - - -
Net revenues adjusted 1,064 1,252 1,633 5,165 5,816 1,085 916 1,175 4,013 4,168 (21) 336 458 1,152 1,648
o/w related to InvestLab transfer - - - 227 131 - - - 16 131 - - - 211 -
o/w related to Allfunds Group revaluation 58 - - 58 - 58 - - 58 - - - - - -
o/w related to SIX revaluation 70 - 198 70 198 70 - 198 70 198 - - - - -
o/w Pfandbriefbank gain - - - - - - - - - - - - - - -
o/w York impairment (458) - - (458) - - - - - - (458) - - (458) -
Net revenues adj. excl. significant items 1,394 1,252 1,435 5,268 5,487 957 916 977 3,869 3,839 437 336 458 1,399 1,648
Provision for credit losses 28 13 17 117 49 34 9 17 117 48 (6) 4 - - 1
Total operating expenses reported 1,043 1,003 1,006 3,939 3,728 723 691 690 2,729 2,565 320 312 316 1,210 1,163
Restructuring expenses (29) (31) - (60) - (24) (17) - (41) - (5) (14) - (19) -
Major litigation provisions (1) (22) 3 10 30 (1) (22) 3 10 30 - - - - -
Expenses related to real estate disposals (4) (4) (10) (8) (22) (3) (3) (8) (6) (18) (1) (1) (2) (2) (4)
Expenses related to business sales - - - - - - - - - - - - - - -
Total operating expenses adjusted 1,009 946 999 3,881 3,736 695 649 685 2,692 2,577 314 297 314 1,189 1,159
Pre-tax income/(loss) reported (7) 236 643 1,109 2,086 328 216 501 1,167 1,602 (335) 20 142 (58) 484
Total adjustments and significant items 364 57 (224) 161 (384) (100) 42 (226) (107) (388) 464 15 2 268 4
Pre-tax income/(loss) adj. excl. significant items 357 293 419 1,270 1,702 228 258 275 1,060 1,214 129 35 144 210 488
Pre-provision profit/(loss) adj. excl. significant items 385 306 436 1,387 1,751 262 267 292 1,177 1,262 123 39 144 210 489
1 Based on CHF figures converted into USD at weighted average exchange rates

71
Reconciliation of adjustment items (10/10)
Results excluding items included in our reported results are non-GAAP financial measures. During the implementation of our strategy, we will measure the progress achieved by our underlying business performance. Management believes that such results provide a useful presentation of our operating results for purposes of assessing our Group and divisional performance consistently over time, on a basis that excludes items that management does not consider representative of our underlying performance. Provided below is a reconciliation to the most directly comparable US GAAP measures.
February 18, 2021
APAC in USD mn1
4Q20 3Q20 4Q19 2020 2019
Net revenues reported 871 800 764 3,378 3,052
Real estate (gains)/losses - - - - -
(Gains)/losses on business sales - - - - -
Net revenues adjusted 871 800 764 3,378 3,052
o/w related to InvestLab transfer - - - 26 98
o/w related to Allfunds Group revaluation 43 - - 43 -
o/w related to SIX revaluation - - - - -
o/w Pfandbriefbank gain - - - - -
o/w York impairment - - - - -
Net revenues adj. excl. significant items 828 800 764 3,309 2,954
Provision for credit losses 7 49 13 248 55
Total operating expenses reported 600 557 544 2,241 2,065
Restructuring expenses (1) (3) - (4) -
Major litigation provisions - - - - -
Expenses related to real estate disposals - - - - -
Expenses related to business sales - - - - -
Total operating expenses adjusted 599 554 544 2,237 2,065
Pre-tax income/(loss) reported 264 194 207 889 932
Total adjustments and significant items (42) 3 - (65) (98)
Pre-tax income/(loss) adj. excl. significant items 222 197 207 824 834
Pre-provision profit/(loss) adj. excl. significant items 229 246 220 1,072 889
1 Based on CHF figures converted into USD at weighted average exchange rates

Notes
72February 18, 2021
General notes
Throughout the presentation rounding differences may occurUnless otherwise noted, all CET1 capital, CET1 ratio, Tier 1 leverage ratio, risk-weighted assets and leverage exposure figures shown in this presentation are as of the end of the respective period and, for periods prior to 2019, on a “look-through” basisGross and net margins are shown in basis pointsGross margin = net revenues annualized / average AuM; net margin = pre-tax income annualized / average AuM. Net margin excluding certain significant items, as disclosed herein, is calculated excluding those items applying the same methodologyMandate penetration reflects advisory and discretionary mandate volumes as a percentage of AuM, excluding those from the external asset manager businessUnless otherwise noted, FX impact is calculated by converting the CHF amount of net revenues, provision for credit losses and operating expenses for 2020 back to the original currency on a monthly basis at the respective spot FX rate. The respective amounts are then converted back to CHF applying the average 2019 FX rate from the period against which the FX impact is measured. Average FX rates apply a straight line average of monthly FX rates for major currenciesWealth Management businesses include SUB PC, IWM PB and APAC and related figures refer to their combined resultsWealth Management-related businesses include SUB, IWM and APAC and related figures refer to their combined resultsPre-provision profit refers to pre-tax income excluding provision for credit lossesClient Business Volume includes assets under management, custody assets and net loans
Specific notes
† Prior to 3Q20, regulatory capital was calculated as the worst of 10% of RWA and 3.5% of leverage exposure and return on regulatory capital (a non-GAAP financial measure) was calculated using income / (loss) after tax and assumed a tax rate of 30%. In 3Q20, we updated our calculation approach, following which regulatory capital is calculated as the average of 10% of RWA and 3.5% of leverage exposure and return on regulatory capital (a non-GAAP financial measure) is calculated using income / (loss) after tax and assumes a tax rate of 30% for periods prior to 2020 and 25% from 2020 onwards. For periods in 2020, for purposes of calculating Group return on regulatory capital, leverage exposure excludes cash held at central banks, after adjusting for the dividend paid in 2020. For the Investment Bank division, return on regulatory capital is based on US dollar denominated numbers. Adjusted return on regulatory capital is calculated using adjusted results, applying the same methodology to calculate return on regulatory capital.
‡ Return on tangible equity, a non-GAAP financial measure, is calculated as annualized net income attributable to shareholders divided by average tangible shareholders’ equity. Tangible shareholders’ equity, a non-GAAP financial measure, is calculated by deducting goodwill and other intangible assets from total shareholders’ equity as presented in our balance sheet. Tangible book value, a non-GAAP financial measure, is equal to tangible shareholders’ equity. Tangible book value per share, a non-GAAP financial measure, is calculated by dividing tangible shareholders' equity by total number of shares outstanding. Management believes that tangibleshareholders’ equity/tangible book value, return on tangible equity and tangible book value per share are meaningful as they are measures used and relied upon by industry analysts and investors to assess valuations and capital adequacy.
For end-4Q18, tangible shareholders’ equity excluded goodwill of CHF 4,766 mn and other intangible assets of CHF 219 mn from total shareholders’ equity of CHF 43,922 mn as presented in our balance sheet.For end-1Q19, tangible shareholders’ equity excluded goodwill of CHF 4,807 mn and other intangible assets of CHF 224 mn from total shareholders’ equity of CHF 43,825 mn as presented in our balance sheet. For end-2Q19, tangible shareholders’ equity excluded goodwill of CHF 4,731 mn and other intangible assets of CHF 216 mn from total shareholders’ equity of CHF 43,673 mn as presented in our balance sheet. For end-3Q19, tangible shareholders’ equity excluded goodwill of CHF 4,760 mn and other intangible assets of CHF 219 mn from total shareholders’ equity of CHF 45,150 mn as presented in our balance sheet.For end-4Q19, tangible shareholders’ equity excluded goodwill of CHF 4,663 mn and other intangible assets of CHF 291 mn from total shareholders’ equity of CHF 43,644 mn as presented in our balance sheet.For end-1Q20, tangible shareholders’ equity excluded goodwill of CHF 4,604 mn and other intangible assets of CHF 279 mn from total shareholders’ equity of CHF 48,675 mn as presented in our balance sheet. For end-2Q20, tangible shareholders’ equity excluded goodwill of CHF 4,676 mn and other intangible assets of CHF 273 mn from total shareholders’ equity of CHF 46,535 mn as presented in our balance sheet.For end-3Q20, tangible shareholders’ equity excluded goodwill of CHF 4,577 mn and other intangible assets of CHF 256 mn from total shareholders’ equity of CHF 45,740 mn as presented in our balance sheet. For end-4Q20, tangible shareholders’ equity excluded goodwill of CHF 4,426 mn and other intangible assets of CHF 237 mn from total shareholders’ equity of CHF 42,677 mn as presented in our balance sheet. Shares outstanding were 2,436.2 mn at end-4Q19 and 2,406.1 mn at end-4Q20.

73February 18, 2021
Abbreviations
ACL = Allowance for credit losses; Adj. = Adjusted; AGM = Annual General Meeting; AM = Asset Management; APAC = Asia Pacific; ARU = Asset Resolution Unit; attr. = attributable; AuM = Assets under Management; Avg. = Average; BAC = Bank of America; BARC = Barclays; BCBS = Basel Committee on Banking Supervision; BIS = Bank for International Settlements; BoD = Board of Directors; bps = basis points; C&IC = Corporate & Institutional Clients; CB = Central Bank; CBV = Client Business Volume; CDP = Carbon Disclosure Project; CECL = Current Expected Credit Losses; CET1 = Common Equity Tier 1; Citi = Citibank; Corp. Ctr. = Corporate Center; COVID-19 = Coronavirus disease 2019; CRCO = Chief Risk & Compliance Officer; CSX = Credit Suisse X; DB = Deutsche Bank; DCM = Debt Capital Markets; E = Estimate; e.g. = for example; ECM = Equity Capital Markets; EMEA = Europe, Middle East and Africa; ESG = Environmental, Social and Governance; ExB = Executive Board; excl. = excluding; FINMA = Swiss Financial Market Supervisory Authority; FVoD = Fair Value on own Debt; FX = Foreign Exchange; FXC = FX Constant; G&A = General and Administrative; GAAP = Generally Accepted Accounting Principles; GDP = Gross Domestic Product; GS = Goldman Sachs; GTS = Global Trading Solutions; HQLA = High Quality Liquid Assets; IB = Investment Bank; IBCM = Investment Banking Capital Markets; IG = Investment Grade; incl. = including; IPO = Initial Public Offering; IWM = International Wealth Management; JPM = JP Morgan; LCR = Liquidity Coverage Ratio; Lev Fin = Leveraged Finance; M&A = Mergers & Acquisitions; MS = Morgan Stanley; MSCI = Morgan Stanley Capital International; MtM = Mark to Market; NAB = Neue Aargauer Bank; NGO = Non-Governmental Organization; NNA = Net New Assets; o/w = of which; p.a. = per anum; PB = Private Banking; PC = Private Clients; PCL = Provision for credit losses; PE = Private Equity; pp. = percentage point; PTI = Pre-tax income; QoQ = Quarter on Quarter; RM = Relationship Manager; RoA = Return on Assets; RoRC = Return on Regulatory Capital; RoTE = Return on Tangible Equity; RWA = Risk-weighted assets; S&T = Sales and Trading; sign. = significant; SIX = Swiss Infrastructure and Exchange; SoW = Share of Wallet; SPAC = Special Purpose Acquisition Company; SRI = Sustainability, Research & Investment Solutions; SRU = Strategic Resolution Unit; SUB = Swiss Universal Bank; TBVPS = Tangible Book Value Per Share; TNFD = Taskforce on Nature-related Financial Disclosure; U/HNW = (Ultra) High Net Worth; vs. = versus; WEF = World Economic Forum; WM = Wealth Management; YoY = Year on year; YTD = Year-to-date

February 18, 2021 74