credit suisse investor day 2017 · pdf fileappendix of the ceo and cfo investor day...
TRANSCRIPT

Credit Suisse Investor Day 2017
Investment Banking and Capital Markets
James L. Amine
November 30, 2017
November 30, 2017 2
Disclaimer
This material does not purport to contain all of the information that you may wish to consider. This material is not to be relied upon as such or used in substitution for the exercise of independent judgment.
Cautionary statement regarding forward-looking statements
This presentation contains forward-looking statements that involve inherent risks and uncertainties, and we might not be able to achieve the predictions, forecasts, projections and other outcomes we describe or imply in forward-looking
statements. A number of important factors could cause results to differ materially from the plans, objectives, expectations, estimates and intentions we express in these forward-looking statements, including those we identify in "Risk
factors” in our Annual Report on Form 20-F for the fiscal year ended December 31, 2016 and in the “Cautionary statement regarding forward-looking information" in our media release relating to Investor Day, published on November 30,
2017 and filed with the US Securities and Exchange Commission, and in other public filings and press releases. We do not intend to update these forward-looking statements.
In particular, the terms “Estimate”, “Illustrative”, “Ambition”, “Objective”, “Outlook” and “Goal” are not intended to be viewed as targets or projections, nor are they considered to be Key Performance Indicators. All such estimates,
illustrations, ambitions and goals are subject to a large number of inherent risks, assumptions and uncertainties, many of which are completely outside of our control. These risks, assumptions and uncertainties include, but are not limited to,
general market conditions, market volatility, interest rate volatility and levels, global and regional economic conditions, political uncertainty, changes in tax policies, regulatory changes, changes in levels of client activity as a result of any of
the foregoing and other factors. Accordingly, this information should not be relied on for any purpose. We do not intend to update these estimates, illustrations, ambitions or goals.
We may not achieve the benefits of our strategic initiatives
We may not achieve all of the expected benefits of our strategic initiatives. Factors beyond our control, including but not limited to the market and economic conditions, changes in laws, rules or regulations and other challenges discussed in
our public filings, could limit our ability to achieve some or all of the expected benefits of these initiatives.
Estimates, assumptions and opinions
In preparing this presentation, management has made estimates and assumptions that affect the numbers presented. Actual results may differ. Annualized numbers do not take account of variations in operating results, seasonality and
other factors and may not be indicative of actual, full-year results. Figures throughout this presentation may also be subject to rounding adjustments. All opinions and views constitute judgments as of the date of writing without regard to the
date on which the reader may receive or access the information. This information is subject to change at any time without notice and we do not intend to update this information.
Statement regarding non-GAAP financial measures
This presentation also contains non-GAAP financial measures, including adjusted results. Information needed to reconcile such non-GAAP financial measures to the most directly comparable measures under US GAAP can be found in the
Appendix of the CEO and CFO Investor Day presentations, published on November 30, 2017. All Investor Day presentations are available on our website at www.credit-suisse.com.
Statement regarding capital, liquidity and leverage
As of January 1, 2013, Basel III was implemented in Switzerland along with the Swiss “Too Big to Fail” legislation and regulations thereunder (in each case, subject to certain phase-in periods). As of January 1, 2015, the Bank for
International Settlements (BIS) leverage ratio framework, as issued by the Basel Committee on Banking Supervision (BCBS), was implemented in Switzerland by FINMA. Our related disclosures are in accordance with our interpretation of
such requirements, including relevant assumptions. Changes in the interpretation of these requirements in Switzerland or in any of our assumptions or estimates could result in different numbers from those shown in this presentation. Capital
and ratio numbers for periods prior to 2013 are based on estimates, which are calculated as if the Basel III framework had been in place in Switzerland during such periods.
Unless otherwise noted, leverage exposure is based on the BIS leverage ratio framework and consists of period-end balance sheet assets and prescribed regulatory adjustments. Beginning in 2015, the Swiss leverage ratio is calculated as
Swiss total capital, divided by period-end leverage exposure. The look-through BIS tier 1 leverage ratio and CET1 leverage ratio are calculated as look-through BIS tier 1 capital and CET1 capital, respectively, divided by end-period leverage
exposure.
Sources
Certain material in this presentation has been prepared by Credit Suisse on the basis of publicly available information, internally developed data and other third-party sources believed to be reliable. Credit Suisse has not sought to
independently verify information obtained from public and third-party sources and makes no representations or warranties as to accuracy, completeness or reliability of such information.

November 30, 2017 3
Key messages
Well-positioned, global advisory and underwriting franchises
Significant connectivity with GM, APAC, SUB and IWM drives revenue for the entire Bank
− ~40% of IBCM gross revenues are shared with other divisions
Capital efficient, high-return platform
IBCM
Maintain balanced product mix and increase connectivity with other divisions
Improve operating performance in EMEA
Self-fund investment that maintains competitiveness
Continue disciplined expense management
Key priorities
Grew revenue through strategies tailored to each client segment that leverage the global platform
LTM net revenues up 18% year-on-year
Improved profitability by driving operating efficiencies
LTM adj. PTI up 470% year-on-year
Delivered returns in excess of cost of capital: target 15-20% adj. return on regulatory capital† by 2018
LTM adj. return on regulatory capital† at 16%
Progress since
last Investor Day
Note: LTM = Last Twelve Months as of 9/30/2017. Adjusted results are non-GAAP financial measures. A reference to the reconciliation to reported results is included in the Appendix † See Appendix

November 30, 2017 4
Revenue mix1 M&A revenue1,2 growth
Balanced revenue mix by growing M&A and ECM
2014 2015 2016
2014 2015 2016
ECM revenue1,2 growth
Credit Suisse
Market
Δ vs.
Market
+11 pp
Δ vs.
Market
+26 pp M&A
26%
ECM
18% Lev Fin
41%
DCM
15%
2016-
9M17 44%
Credit Suisse
Market
Source: Dealogic as of September 30, 2017. Note: Based on IBCM addressable market; includes Americas and EMEA only. Percentages may not total due to rounding 1 Based on revenues before JV transfers to other divisions, Corporate Bank and funding costs. Excludes structured products, UHNW and other IBCM revenues 2 Represents year-on-year growth, indexed to 2014
LTM (as of Sep 30, 2017)
LTM (as of Sep 30, 2017)
November 30, 2017 5
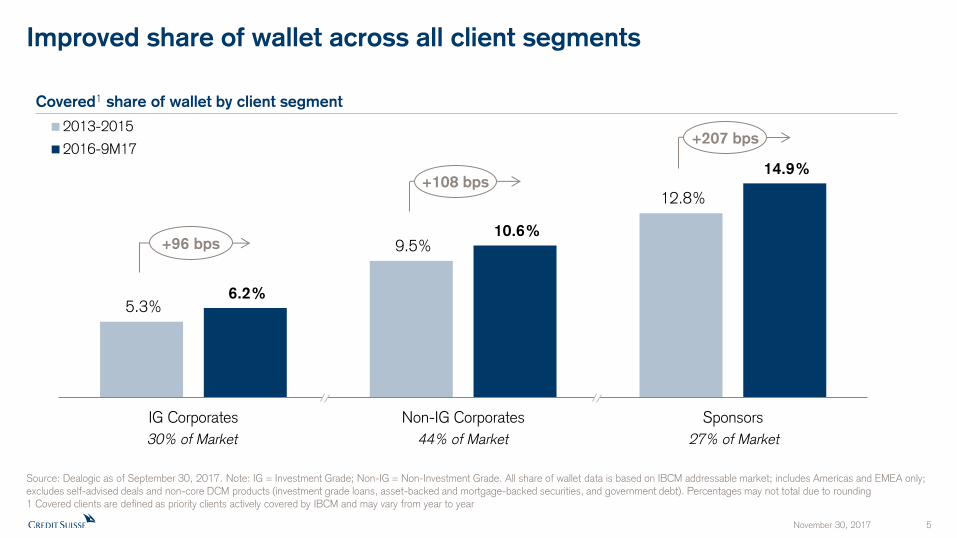
Covered1 share of wallet by client segment
Improved share of wallet across all client segments
Source: Dealogic as of September 30, 2017. Note: IG = Investment Grade; Non-IG = Non-Investment Grade. All share of wallet data is based on IBCM addressable market; includes Americas and EMEA only; excludes self-advised deals and non-core DCM products (investment grade loans, asset-backed and mortgage-backed securities, and government debt). Percentages may not total due to rounding 1 Covered clients are defined as priority clients actively covered by IBCM and may vary from year to year
5.3%
9.5%
12.8%
6.2%
10.6%
14.9%
IG Corporates Non-IG Corporates Sponsors
2013-2015
2016-9M17
30% of Market 44% of Market 27% of Market
+108 bps
+207 bps
+96 bps
November 30, 2017 6
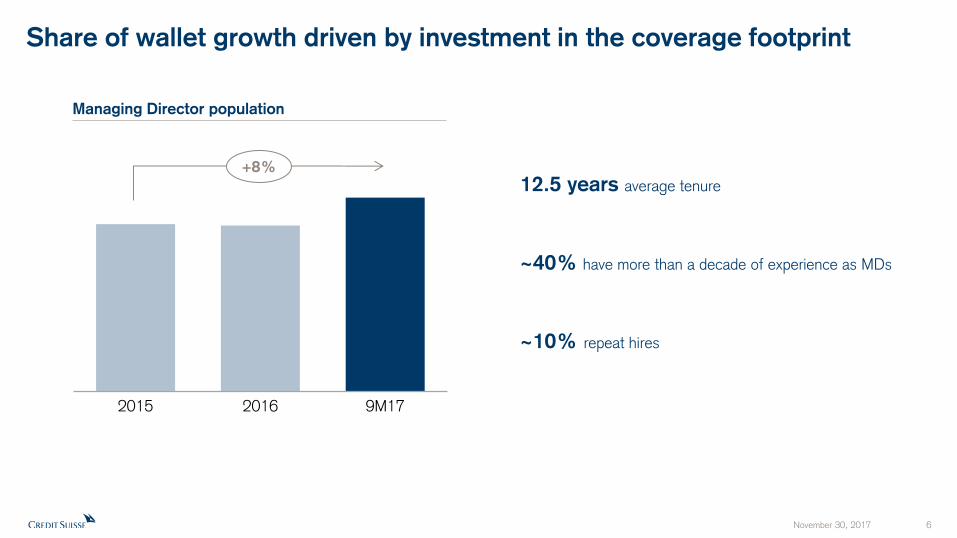
Share of wallet growth driven by investment in the coverage footprint
Managing Director population
~40% have more than a decade of experience as MDs
~10% repeat hires
12.5 years average tenure
Want to break the scale to better visualize the increase?
Changed to be more
pronounced
2015 2016 9M17
+8%

November 30, 2017 7
Revenue growth has outpaced peers since announcing strategy
Underwriting and advisory revenue growth since 2015 Investor Day
Market Growth
10%
6% 4%
3% 3% 3%
-3%
-11%
Peer 1 Peer 2 Peer 3 Peer 4 Peer 5 Peer 6 Peer 7 Peer 8
Source: Peer financial reports and filings. Underwriting and advisory revenue growth since 2015 Investor Day based on reported revenue growth for the aggregate FY16 and 9M17 period compared to the aggregate FY15 and 9M16 period. Credit Suisse based on IBCM addressable market; includes Americas and EMEA only. Peers based on global market.
0%

November 30, 2017 8
Strategy has delivered steady improvement in revenue and profitability
Net revenues and adj. direct operating expenses in USD mn Adjusted pre-tax income in USD mn
Note: Direct operating expenses defined as operating expenses excluding allocated expenses. Adjusted results are non-GAAP financial measures. A reference to the reconciliation to reported results is included in the Appendix
93
297
439
+372%
1,857
2,001
2,178
1,461 1,374 1,382
2015 2016
Net revenues
Adjusted direct
operating
expenses
+17%
-5%
LTM (as of Sep 30, 2017)
LTM (as of Sep 30, 2017)
2015 2016
LTM vs 2015

November 30, 2017 9
Revenue growth and operating leverage drive returns
Net revenues in USD mn
1,857 2,001
2,178
2015 2016
Cost/income ratio based on USD and adj. numbers
95%
84% 78%
2015 2016
Adjusted RoRC† based on USD
5%
12%
16%
2015 2016
Note: Adjusted results are non-GAAP financial measures. A reference to the reconciliation to reported results is included in the Appendix † See Appendix
+17% -17 pp +11 pp
LTM (as of Sep 30, 2017)
LTM (as of Sep 30, 2017)
LTM (as of Sep 30, 2017)

November 30, 2017 10
IBCM targets
Note: Adjusted results are non-GAAP financial measures. A reference to the reconciliation to reported results is included in the Appendix 1 2017 estimate based on currently available information and beliefs, expectations and opinions of management as of the date hereof. Actual results for 2017 may differ from any estimates † See Appendix
5%
12%
~16%
2015 2016 2017Estimate
Adjusted RoRC† in USD
2018 Target
adjusted return
on regulatory
capital†:
15 – 20%
1

Credit Suisse Investor Day 2017
Investment Banking and Capital Markets
David Hermer, Head of Equity Capital Markets
November 30, 2017 12
ECM overview
IPO activity IPO fee pool by region Credit Suisse IPO share of wallet
4.1%
5.8%
8.5%
2015 2016
Backdrop
Source: Dealogic as of September 30, 2017 Note: All market and share of wallet data are based on IBCM addressable market; includes Americas and EMEA only
Power alleys active Increasing momentum for Credit Suisse
Healthier volumes in 2017 Significantly improved breadth of issuance
220
61
42
96
88
72
116
152
110
58
105
1,110
423
209
636 621
360
508 618
537
367
571
20
07
20
08
20
09
20
10
20
11
20
12
20
13
20
14
20
15
20
16
9M
17 A
nn.
IPO volume ( in USD bn)
# of deals
+440 bps
61%
35%
4%
'15-9M17 Avg.
US/Canada
EMEA
LatAm
LTM (as of Sep 30, 2017)

November 30, 2017 13
ECM outlook
Source: FactSet as of November 16, 2017
90
100
110
120
130
Jan-1
7
Mar
-17
May
-17
Jul-
17
Sep-1
7
Nov-
17
12-month forward EPS (indexed) VIX Benchmark indices (indexed)
FTSE 100
+3%
S&P
+15%
NASDAQ
+26%
STOXX 600
+6%
98
100
102
104
106
108
110
112
Jan-1
7
Mar
-17
May
-17
Jul-
17
Sep-1
7
Nov-
17
STOXX 600
+10%
S&P
+8%
FTSE 100
+5%
NASDAQ
+11%
Average
0
10
20
30
40
50
60 Min = Avg =
Max =
9 (Nov 2017)
16 48 (Aug 2011)
Jan-1
1
Jan-1
2
Jan-1
3
Jan-1
4
Jan-1
5
Jan-1
6
Jan-1
7
2017 Avg. ~11

Credit Suisse Investor Day 2017
Investment Banking and Capital Markets
Malcolm Price, Head of Financial Sponsors

November 30, 2017 15
Financial Sponsors overview
10.2 12.8 12.2
9.2 10.0 12.7
9.3% 9.3% 9.2% 8.8%
9.8% 9.3%
2012 2013 2014 2015 2016 9M17annualized
Source: Dealogic as of September 30, 2017. Note: All market, share of wallet and rank data are based on IBCM addressable market; excludes self-advised deals and non-core DCM products (investment grade loans, asset-backed and mortgage-backed securities, and government debt) 1 Based on 2012 to September 30, 2017 2 Share of wallet is based on LTM as of September 30, 2017
#1 #3 #1 #1 #1 #1
Financial Sponsors Market in USD bn
AMER
75%
EMEA 25%
15 bn
Avg. Ann.
Fees1
Americas Financial Sponsors Market in USD bn
Credit Suisse
Rank
Credit Suisse
Share of Wallet
Americas
Sponsors
Market Fees
2

November 30, 2017 16
16.6 16.6
13.3 13.4
16.5
29% 28%
24% 25%
28%
2013 2014 2015 2016 9M17
Annualized
Sponsors % of Overall Market
29%
16%
54%
1%
Financial Sponsors outlook
Financial Sponsor opportunity in USD bn
Undrawn Private Equity commitments and unrealized portfolio
values in USD bn
Source: Dealogic as of September 30, 2017 and Preqin as of November 17, 2017 Note: All market data is based on IBCM addressable market; includes Americas and EMEA only; excludes self-advised deals and non-core DCM products (investment grade loans, asset-backed and mortgage-backed securities, and government debt) 1 Reflects undrawn private equity commitments targeted for buyouts only
634
842 748
910
1,114 1,207
1,388 1,517
1,556 1,638
1,745 1,789
373 433 476 477 423 389 360 432 446 474 562 603
2006 2007 2008 2009 2010 2011 2012 2013 2014 2015 2016 2017
PE unrealized portfolio value
Undrawn PE commitments
M&A
ECM
Lev Fin
DCM
Sponsors
Market Fees
1
Appendix
November 30, 2017 17

November 30, 2017 18
Notes (1/2)
General notes
Specific notes * Our cost savings program is measured using adjusted operating expenses at constant FX rates. “Adjusted operating expenses at constant FX rates” and “adjusted non-compensation operating expenses at constant FX rates” include adjustments as made in all our disclosures for restructuring expenses, major litigation expenses and a goodwill impairment taken in 4Q15 as well as adjustments for certain accounting changes (which had not been in place at the launch of the cost savings program), debit valuation adjustments (DVA) related volatility and for FX, applying the following main currency exchange rates for 1Q15: USD/CHF 0.9465, EUR/CHF 1.0482, GBP/CHF 1.4296, 2Q15: USD/CHF 0.9383, EUR/CHF 1.0418, GBP/CHF 1.4497, 3Q15: USD/CHF 0.9684, EUR/CHF 1.0787, GBP/CHF 1.4891, 4Q15: USD/CHF 1.0010, EUR/CHF 1.0851, GBP/CHF 1.5123, 1Q16: USD/CHF 0.9928, EUR/CHF 1.0941, GBP/CHF 1.4060, 2Q16: USD/CHF 0.9756, EUR/CHF 1.0956, GBP/CHF 1.3845, 3Q16: USD/CHF 0.9728, EUR/CHF 1.0882, GBP/CHF 1.2764, 4Q16: USD/CHF 1.0101, EUR/CHF 1.0798, GBP/CHF 1.2451, 1Q17: USD/CHF 0.9963, EUR/CHF 1.0670, GBP/CHF 1.2464, 2Q17: USD/CHF 0.9736, EUR/CHF 1.0881, GBP/CHF 1.2603, 3Q17: USD/CHF 0.9645, EUR/CHF 1.1413, GBP/CHF 1.2695. These currency exchange rates are unweighted, i.e. a straight line average of monthly rates. We apply this calculation consistently for the periods under review. Adjusted non-compensation expenses are adjusted operating expenses excluding compensation and benefits. To calculate adjusted non-compensation expenses at constant FX rates, we subtract compensation and benefits (adjusted at constant FX rates in the manner described above) from adjusted operating expenses at constant FX rates.
† Regulatory capital is calculated as the worst of 10% of RWA and 3.5% of leverage exposure. Return on regulatory capital is calculated using (adjusted) income after tax and assumes a tax rate of 30% and capital allocated based on the worst of 10% of average RWA and 3.5% of average leverage exposure. For the Markets business within the APAC division and for the Global Markets and Investment Banking & Capital Markets divisions, return on regulatory capital is based on US dollar denominated numbers. Adjusted return on regulatory capital is calculated using adjusted results, applying the same methodology to calculate return on regulatory capital.
For reconciliation of adjusted to reported results, refer to the Appendix of either the CEO or CFO Investor Day 2017 presentation. Throughout the presentation rounding differences may occur
Unless otherwise noted, all CET1 ratio, Tier 1 leverage ratio, risk-weighted assets and leverage exposure figures shown in this presentation are as of the end of the respective period and on a “look-through” basis
Gross and net margins are shown in basis points Gross margin = adj. net revenues annualized / average AuM; net margin = adj. pre-tax income annualized / average AuM
Mandates penetration reflects advisory and discretionary mandates as percentage of total AuM

November 30, 2017 19
Notes (2/2)
Abbreviations Adj. = Adjusted; AI = Artificial Intelligence; AM = Asset Management; AML = Anti-Money Laundering; APAC = Asia Pacific; AT1 = Additional Tier 1; AuM = Assets under Management; BCBS = Basel Committee on Banking Supervision; BIS = Bank for International Settlements; bps = basis points; CAGR = Compound Annual Growth Rate; CCRO = Chief Compliance and Regulatory Affairs Officer; CET1 = Common Equity Tier 1; CIC = Corporate & Institutional Clients; CIF = Customer/Client Information File; Corp. Ctr. = Corporate Center; CVA = Credit Valuation Adjustment; DCM = Debt Capital Markets; EAM = External Asset Manager; ECM = Equity Capital Markets; EM = Emerging Markets; EMEA = Europe, Middle East & Africa; EPS = Earnings Per Share; EQ = Equities; EU = European Union; FICC = Fixed Income, Currencies & Commodities; FINMA = Swiss Financial Market Supervisory Authority; FLP = Fund Linked Products; FRTB = Fundamental Review of the Trading Book; FX = Foreign Exchange; G10 = Group of Ten; GDP = Gross Domestic Product; GM = Global Markets; IBCM = Investment Banking & Capital Markets; IBD = Investment Banking Department; IC = Investment Consultant; IMF = International Monetary Fund; IP = Investor Products; IPO = Initial Public Offering; IRB = Internal Ratings Based; IT = Information Technology; ITS = International Trading Solutions; IWM = International Wealth Management; JV = Joint Venture; LSC = Large Swiss Corporates; M&A = Mergers & Acquisitions; MI = Management Information; Mkts = Markets; NNA = Net new assets; Op Risk = Operational Risk; PB = Private Banking; PC = Private Clients; PEP = Politically Exposed Person; pp = percentage points; PTI = Pre-tax income; PWMC = Private & Wealth Management Clients; RM = Relationship Manager(s); RoRC = Return on Regulatory Capital; RoTE = Return on Tangible Equity; RPA = Robotic Process Automation; RWA = Risk-weighted assets; SA-CCR = Standardized Approach to Counterparty Credit Risk; SME = Small and Medium-Sized Enterprises; SMG = Systematic Market-Making Group; SoW = Share of Wallet; SRU = Strategic Resolution Unit; SUB = Swiss Universal Bank; TBTF = Too Big To Fail; TBVS = Tangible Book Value per Share; (U)HNW(I) = (Ultra) High Net Worth (Individuals); VaR = Value-at-Risk; VIX = Volatility Index; WM = Wealth Management; WM&C = Wealth Management & Connected; YoY = Year over year; YTD = Year to Date

November 30, 2017 20