credit-suisse quarterly review q4/2001
TRANSCRIPT

5520154English
INFORMATION FOR INVESTORS
Credit Suisse Group shares Ticker symbolsStock exchange listings Bloomberg Reuters Telekurs
SWX Swiss Exchange/virt-x CSGN VX CSGZn.VX CSGN,380Frankfurt CSX GR CSGZn.DE CSX,013New York (ADS) 1) CSR US CSR.N CSR,065Tokyo 8653 JP CSGZ.T N1492,106
1) 1 ADS represents 1 registered share.
Swiss security number 1213853 ISIN number CH0012138530 German security number DE 876 800CUSIP number 225 401 108
RatingsAgencies Credit Suisse Group Credit Suisse Credi Credit Suisse First Boston Winterthur
Long term Short term Long term Short term Long term Short term
Moody’s, New York Aa3 - Aa3 P1 Aa3 P1 Aa3Standard & Poor’s, New York AA- A1+ AA A1+ AA A1+ AAFitch IBCA, New York AA- F1+ AA- F1+ AA F1+ AA-
Enquiries
CREDIT SUISSE GROUPInvestor Relations Gerhard Beindorff, Andreas PeterlikTel. +41 1 333 4570 / +41 1 333 3169Fax +41 1 333 2587
CREDIT SUISSE GROUPMedia Relations Karin Rhomberg Hug, Claudia KraazTel. +41 1 333 8844 Fax +41 1 333 8877
Copies of all Credit Suisse Group
financial publications may be ordered from:
CREDIT SUISSEKIDM 23Uetlibergstrasse 2318070 ZurichSwitzerlandFax +41 1 332 7294www.credit-suisse.com/q4results2001/order.html
Credit Suisse GroupParadeplatz 8 P.O. Box 1 8070 Zurich Switzerland
Tel. +41 1 212 1616 Fax +41 1 333 2587
www.credit-suisse.com
QUARTERLY REVIEW 2001 Q4

Trading exposures The average VaR at Credit Suisse First Boston in thefourth quarter of 2001 was USD 49.0 million, comparedwith USD 78.0 million during the third quarter of 2001.The VaR decrease was in large part due to the imple-mentation of a revised historical simulation model formortgage spread risks within the Fixed Income division.Starting this quarter, the backtesting chart shows thecomponent of trading revenue due purely to overnightprice movements and excluding fee and commissionincome. This calculation is better suited for the evalua-tion of a VaR model. As illustrated in the backtestingchart, Credit Suisse First Boston had two regulatorybacktesting exceptions in the fourth quarter of 2001; on average, a backtesting model returns two or threeexceptions per annum.
1Q2001 2Q2001 3Q2001 4Q2001
Daily adjusted trading revenue One-day VaR (99%)
in Mio USD
100
50
0
–50
–100
–150
Adjusted trading revenue and VaR estimate for Credit Suisse First Boston
RISK MANAGEMENT
CSFB trading exposures
Credit Suisse Group is a leading global financial services company headquartered in Zurich.
Credit Suisse Financial Services provides private clients and small and medium-sized companies with private
banking and financial advisory services, banking products, and pension and insurance solutions from
Winterthur. Credit Suisse First Boston, the investment bank, serves global institutional, corporate, govern-
ment and individual clients in its role as a financial intermediary. Credit Suisse Group’s registered shares
(CSGN) are listed in Zurich and London on the SWX Swiss Exchange/virt-x, Frankfurt and Tokyo, and in
the form of American Depositary Shares (CSR) in New York. The Group employs around 80,000 staff
worldwide. As of December 31, 2001, it reported assets under management of CHF 1,425.5 billion.
Asset qualityCredit quality has softened as a result of the volatile andfragile economic environment, although the share ofinvestment grade exposure was not appreciably lowerthan in previous quarters. The mix of impaired assetshas shifted: continued progress in reducing the historicimpaired asset portfolio at Credit Suisse Banking wasoffset by an increase in impaired assets at Credit SuisseFirst Boston. Vulnerable sectors continue to be moni-tored, with active management leading to addition of col-lateral, purchase of credit protection and tightening ofmaturities where justified. Provisions are created whenexposures exhibit signs of deterioration to an extent thatwould classify them as impaired.
Asset quality & provisionsAs of December 31, 2001, in CHF m
Non-performing loans (NPLs) 1)
Capital provisions against NPLs 2)
Total counterparty exposures 1)
of which lendingof which committed, but unusedof which contingent exposuresof which counterparty trading
Coverage ratio of NPLs31.12.0130.09.0131.12.00NPLs as percentage of counterparty exposures31.12.0130.09.0131.12.00
1) Includes loans and loan equivalents. / 2) Excludes total interest of CHF 1,385 m (fully provided).
Credit SuisseGroup
9,6665,728
400,371173,524113,80025,52187,526
59%56%63%
2.4%2.2%2.4%
Credit SuisseFirst Boston
3,7482,205
229,51831,368
101,7199,883
86,548
59%54%67%
1.6%1.2%0.6%
Credit SuissePrivate Banking
11674
42,69438,968
02,904
822
64%62%54%
0.2%0.3%0.3%
Credit SuisseFinancial Services
5,8023,449
128,159103,18812,08112,734
156
59%57%62%
4.5%4.8%6.5%
(99% one-day VaR)in USD m
Total VaRPeriod endAverageMaximumMinimum
in USD m
VaR by risk typeInterest rateForeign exchangeEquityCommodity
Subtotal
Diversification benefit
Total
Credit Suisse First Boston computes these VaR estimates separately for each risktype and for the whole portfolio using the historical simulation methodology.Diversification benefit reflects the net difference between the sum of the 99%percentile loss for each risk type and for the total portfolio.
1Q2001
83.882.499.469.5
31.03.01
97.615.712.72.2
128.2
) (44.4
83.8
)
2Q2001
72.373.085.366.6
30.06.01
79.817.121.21.1
119.2
) (46.9
72.3
3Q2001
85.078.095.263.1
30.09.01
107.215.223.32.5
148.2
) (63.2
85.0
4Q2001
42.749.055.542.7
31.12.01
56.711.121.72.4
92.0
(49.3
42.7
1 Editorial 2 Financial highlights Q4/2001 4 An overview of Credit Suisse Group 8 Review of business units 8 Credit Suisse Financial Services 16 Credit Suisse Private Banking 18 Credit Suisse Asset Management 20 Credit Suisse First Boston 24 Consolidated results Credit Suisse Group 24 Consolidated income statement 25 Consolidated balance sheet 26 Off-balance sheet and fiduciary business 26 Selected notes 29 Risk Management Information for investors
Cautionary Statement Regarding Forward-Looking InformationThis communication may contain projections or other forward-looking statements related to Credit Suisse Group that involve risks and uncertainties. Readers arecautioned that these statements are only projections and may differ materially from actual future results or events. Readers are referred to the documents filed by CreditSuisse Group with the SEC, specifically the most recent filing on Form 20-F, which identify important risk factors that could cause actual results to differ from thosecontained in the forward-looking statements, including, among other things, risks relating to market fluctuations and volatility, significant interest rate changes, creditexposures, cross border transactions and foreign exchange fluctuations, impaired liquidity, competition and legal liability. All forward-looking statements are based oninformation available to Credit Suisse Group on the date of its posting and Credit Suisse Group assumes no obligation to update such statements unless otherwiserequired by applicable law.
The Financial Report comprising the Group’s consolidated financial statements and the parent company financial statements as of December 31, 2001, is availablein English on the Internet.
Credit Suisse Group’s Annual Report 2001 will be available from May 6, 2002, in English and German.
This symbol is used to indicate topics on which further information is available on our website. Go to www.credit-suisse.com/q4results2001/bookmarks.html to findlinks to the relevant information. This additional information indicated is openly accessible and does not form part of the Quarterly Review. Some areas of CreditSuisse Group’s websites are only available in English.
www.credit-suisse.com 29

EDITORIAL
Lukas MühlemannChairman and Chief Executive Officer
Dear shareholders, clients and colleagues
2001 was a challenging year for the whole financial ser-vices industry, including Credit Suisse Group. Revenueswere down in every quarter. The Group reacted to thesedevelopments early in the year and started to adjust itscost base in line with the significantly altered marketenvironment. It was thus possible to reduce our operatingexpenses by 12% in the third quarter and – excludingexceptional items at Credit Suisse First Boston – by 18%in the fourth quarter.
At the same time, we successfully built our marketfranchise in all of the Group’s businesses. Our assetgathering and asset management businesses recordednet new assets of CHF 66.4 billion in 2001 comparedwith CHF 58.1 billion in 2000, corresponding to anincrease of 14%. The Group’s insurance businessesachieved double-digit premium growth. Donaldson, Lufkin& Jenrette (DLJ) was successfully integrated into CreditSuisse First Boston and their combined market positionwas maintained.
We attribute this performance to our dedication toproviding our clients with the best possible services andproducts. Our strategic decision three years ago to offermutual fund and life insurance products from externalproviders – and not only our own products – has clearlypaid off for our clients. Our decision two years ago tooffer alternative investment products also enabled manyof our clients to protect their capital despite the negativemarket conditions in 2001. Moreover, the combined product and market strength of the former DLJ, CreditSuisse First Boston and Credit Suisse Asset Manage-ment enables us to provide a full and high-quality productline for our institutional clients.
Credit Suisse Group reported a net operating profit ofCHF 4.0 billion for 2001, excluding exceptional items atCredit Suisse First Boston and the amortization ofacquired intangible assets and goodwill, net of tax.
Net profit for the year was CHF 1.6 billion. At year-end2001, total assets under management stood at CHF1,425.5 billion, up slightly from year-end 2000.
Our financial services, private banking and assetmanagement businesses proved remarkably resilient in2001 and put in a good performance given market condi-tions. Credit Suisse First Boston was strongly impactedby the negative market environment, particularly in thesecond half of the year. The strict implementation of costsaving measures led to exceptional items in the fourthquarter, but also to a much more competitive cost basewhich is expected to impact positively on the businessunit’s performance going forward.
We remain cautious in our outlook for 2002. However,the Group has considerable financial strength and a goodmarket position in all core businesses. We are confidentabout our ability to capture new business opportunities andto create added value for our clients and shareholders.The Group’s Board of Directors will propose a par valuereduction of CHF 2 per share in lieu of a dividend to the Annual General Meeting on May 31, 2002. This isunchanged versus the par value reduction for the financialyear 2000.
Lukas MühlemannMarch 2002
www.credit-suisse.com 1

CREDIT SUISSE GROUP F INANCIAL HIGHLIGHTS Q4/2001
Share data 1)
Shares issued Shares repurchased
Shares outstanding
Share price in CHF (as of March 4, 2002: CHF 61.80 )
Market capitalization in CHF m
Book value per share in CHF
Share price in CHF1)
High LowRepayment of capital (in lieu of a dividend) 5)
Calculation of earnings per share (EPS) 1)
Net profit in CHF mNet operating profit in CHF m 2)
Diluted net profit in CHF mDiluted net operating profit in CHF m 2)
Weighted average shares outstanding 3)
Dilutive impact 4)
Weighted average shares, diluted
Basic earnings per share in CHFBasic earnings per share – operating, in CHF 2)
Diluted earnings per share in CHFDiluted earnings per share – operating, in CHF 2)
1) All share-related data have been adjusted for the 4-for-1 share split effective as of August 15, 2001. / 2) Excluding amortization of acquired intangible assets and good-will, exceptional items of CHF 1,092 m in 4Q2001, as well as restructuring provisions of CHF 1,074 m in 4Q2000, all net of tax. / 3) Adjusted for weighted averageshares repurchased. / 4) From convertible bonds and outstanding options. / 5) Proposal of the Board of Directors to the Annual General Meeting on May 31, 2002.
Change from31.12.00 in %
0–
(1
(8
(9
(12
Change from2000 in %
(10(39
0
Change from2000 in %
(73(45(73(45
7598
(74(49(75(49
31.12.01
1,196,609,8117,730,000
1,188,879,811
70.80
84,173
29.92
4Q2000
87.3873.25
4Q2000
) 5901,880
) 5901,880
1,162,136,5209,691,120
1,171,827,640
) 0.511.62
) 0.501.60
)
)
)
)
))
))))
))))
30.09.01
1,196,253,5967,730,000
1,188,523,596
56.50
67,152
29.90
2001
87.0044.80 2.00
2001
1,5873,9741,5883,975
1,194,090,7889,356,766
1,203,447,554
1.333.331.323.30
4Q2001
71.3051.60
4Q2001
(830616
(830616
1,188,677,4457,213,154
1,195,890,599
(0.700.52
(0.690.52
3Q2001
75.8844.80
3Q2001
) (29921
) (29922
1,189,924,9967,860,925
1,197,785,921
) (0.250.02
) (0.250.02
31.12.00
1,201,751,9600
1,201,751,960
77.00
92,535
34.08
2000
97.1373.252.00
2000
5,7857,2185,7877,220
1,111,100,0885,874,124
1,116,974,212
5.216.505.186.46
12 months
12 months
Market capitalizationAs of end of reporting period (in CHF bn)
90
100
80
70
50
30
20
60
40
10
091 92 93 94 95 96 97 98 99 00 01
Share performanceSwiss Market Index (rebased) Credit Suisse Group
19971996 1998 1999 2000 2001 2002
1009080
70
60
50
40
30
20
Financial calendar Annual Report 2001 Monday, May 6, 2002
First quarter results 2002 Wednesday, May 15, 2002
Annual General Meeting 2002 Friday, May 31, 2002
Second quarter results 2002/distribution of par value reduction Wednesday, August 14, 2002
Third quarter results 2002 Thursday, November 14, 2002
2

Consolidated income statement in CHF m
Operating incomeGross operating profitNet operating profit 1)
Net profitCash flow
Return on equity (ROE) in %
Credit Suisse Group: Reported ROEOperating ROE 1)
Banking business: Reported ROEOperating ROE 1)
Insurance business: Reported ROEOperating ROE 1)
Return on invested capital (ROIC)
Consolidated balance sheet in CHF m
Total assetsShareholders’ equityMinority interests in shareholders’ equity
BIS data in CHF m
BIS risk-weighted assets BIS tier 1 capital
of which non-cumulative perpetual preferred securitiesBIS total capital
BIS capital ratios in %
BIS tier 1 ratio Credit SuisseCredit Suisse First Boston 2)
Credit Suisse Group 3)
BIS total capital ratio Credit Suisse Group
Assets under management/client assets in CHF bn
Advisory assets under managementDiscretionary assets under managementTotal assets under managementClient assets
Net new assets in CHF bn
Net new assets
Number of employeesSwitzerland banking
insuranceOutside Switzerland banking
insuranceTotal employees Credit Suisse Group
1) Excl. amortization of acquired intangible assets and goodwill, exceptional items of CHF 1,092 m in 4Q2001, as well as restructuring provisions of CHF 1,074 m in4Q2000, all net of tax. / 2) Ratio is based on a tier 1 capital of CHF 15.2 bn (September 30, 2001: CHF 16.8 bn; December 31, 2000: CHF 17.6 bn), of which non-cumulative perpetual preferred securities is CHF 1.1 bn (for all periods). / 3) Ratio is based on a tier 1 capital of CHF 21.2 bn (September 30, 2001: CHF 21.3 bn;December 31, 2000: CHF 27.1 bn), of which non-cumulative perpetual preferred securities is CHF 2.1 bn (for September 30, 2001 and December 31, 2000: CHF 1.1 bn).
Change from2000 in %
5(27(45(73(22
Change from2000 in %
(77(53(91(64
913
(37
Change from31.12.00 in %
4(1121
Change from31.12.00 in %
(7(2288
(20
31.12.00
7.1 13.6 11.3 18.2
Change from31.12.00 in %
0523
Change from2000 in %
14
Change from31.12.00 in %
4(7(75
(1
))))
))))
)
)
))
)
))
)
2000
37,23112,0837,2185,785
10,734
2000
17.7 21.518.223.116.216.626.5
31.12.00
987,43343,5222,571
31.12.00
239,46527,1111,102
43,565
30.09.01
7.1 12.5 9.0
14.8
31.12. 00
724.7667.3
1,392.02,065.0
2000
58.1
31.12. 00
21,4546,781
30,66621,63780,538
4Q2000
10,6323,1701,880
) 5903,309
4Q2000
) 6.119.0
) 2.5) 18.7
19.920.430.2
31.12.01
1,022,51338,9213,121
31.12.01
222,87421,1552,076
34,888
31.12.01
725.4700.1
1,425.52,131.3
4Q2000
21.9
31.12.01
22,3466,297
28,41522,64179,699
2001
39,1548,8703,9741,5878,384
2001
4.110.01.78.4
17.618.716.7
30.09.01
1,006,06237,9372,167
30.09.01
237,34721,3251,078
35,216
31.12.01
6.912.99.5
15.7
30.09.01
660.1630.3
1,290.41,928.3
2001
66.4
30.09.01
22,6946,289
30,66022,31581,958
4Q2001
8,1611,264
616(830
1,802
4Q2001
(9.36.6
(12.55.2
14.516.57.8
4Q2001
17.9
3Q2001
8,7201,490
21) (299
1,373
3Q2001
) (3.00.2
) (5.3(1.611.012.09.0
3Q2001
7.1
12 months
12 months
12 months
www.credit-suisse.com 3

AN OVERVIEW OF CREDIT SUISSE GROUP
Credit Suisse Group reported a net operating profit of CHF 616 million for the fourthquarter, compared with CHF 21 million in the previous quarter, and of CHF 4.0 billionfor full year 2001, down 45% versus 2000, excluding exceptional items at CreditSuisse First Boston and the amortization of acquired intangible assets and goodwill,after taxes. A net loss of CHF 830 million was recorded in the fourth quarter and netprofit stood at CHF 1.6 billion for the full year, down 73% versus 2000. The Group’sasset gathering businesses continued to achieve a high level of profitability and healthygrowth. Net new assets for the full year amounted to CHF 66.4 billion, representinggrowth of 4.8% for 2001. Total assets under management stood at CHF 1,425.5billion as of end-2001. The Group has made progress in reducing costs in all itsbusiness units. The Group’s Board of Directors will propose a par value reduction ofCHF 2 per share in lieu of a dividend to the Annual General Meeting on May 31, 2002.
Overview of business unit results 1)
12 months 2001in CHF m
Operating incomeOperating expenses
Gross operating profit
Depreciation of non-current assetsValuation adjustments, provisions and losses 2)
Profit before extraordinary items, taxes
Extraordinary income/(expenses), net Taxes
Net profit before minority interests
Minority interests
Net profit
Reconciliation to net operating profitAmortization of acquired intangible assets and goodwill Exceptional itemsTax impact
Net operating profit 3)
Value added 4)
Average allocated capital 5)
Return on average allocated capital 5)
Return on average allocated capital (operating) 3) 5)
Increased/(decreased) credit-related valuation adjustments 2)
1) The Group’s consolidated results are prepared in accordance with Swiss GAAP, while the Group’s segment reporting principles are applied for the presentation of thebusiness unit results. For a detailed description of the Group’s segment reporting principles, please refer to our Financial Report 2001 which is available on our websitewww.credit-suisse.com, and to the footnotes to the business unit results. This presentation of the business unit results is provided to assist in evaluating the operatingperformance of the business units, which should be considered in the context of the Group’s consolidated financial statements. / 2) Increased/decreased valuation adjust-ments taken at Group level resulting from the difference between the statistical and actual credit provisions. / 3) Excl. amortization of acquired intangible assets and good-will, as well as exceptional items, all after tax. / 4) Value Added is a measure of value creation in the period under review. It is derived from Credit Suisse Group’s ValueBased Analysis (VBA) and complements the performance metrics which are currently used, but does not replace them. The measure is aimed at enhancing management’sawareness of value creation. For this purpose, accounting figures are adjusted by adding back accounting distortions such as selected non-cash charges (e.g. amortizationof goodwill), and cost of equity is charged to the business unit as well as the consolidated accounts. / 5) For Winterthur business units within Credit Suisse FinancialServices, average invested capital is used for the calculation of return on invested capital (ROIC).
Credit SuisseGroup
) 39,154) 30,284
8,870
3,7492,592
) 2,529
) (229(486
) 1,814
) (227
) 1,587
) 1,5631,428(604
) 3,974
) 1,164
))
)
)
Adjust. incl.Corporate
Center
(628(1,081
453
397271
) (215
) (2391
) (453
) (157
) (610
(8–
) –
(618
) (747
)
CreditSuisse
FirstBoston
22,82520,902
1,923
2,2921,938
(2,307
) (1) 685
(1,623
(1
(1,624
1,3611,428
) (594
571
(883
16,913(9.6%3.4%
194
CreditSuisseAsset
Management
1,5751,138
437
1260
311
(14) (61
236
) 0
236
94–
(8
322
206
1,291––
–
CreditSuissePrivate
Banking
5,7812,707
3,074
8436
2,954
15) (631
2,338
) (20
2,318
18–
) –
2,336
2,071
3,471––
(5)
CreditSuisse
FinancialServices
9,6016,618
2,983
850347
1,786
10(480
1,316
(49
1,267
98–
(2
1,363
517
10,90612.1%12.9%
27
4

Assets under management/client assets in CHF bn
Credit Suisse Financial ServicesAssets under management
of which discretionaryClient assets
Credit Suisse Private BankingAssets under management
of which discretionaryClient assets
Credit Suisse Asset ManagementAssets under management
of which discretionaryClient assets
Credit Suisse First BostonAssets under management
of which discretionaryof which Private Equity on behalf of clients
Client assets
Credit Suisse Group Assets under management
of which discretionaryClient assets
Change from1) 31.12.00 in %
0.11.00.2
2.817.81.9
4.41.14.4
(0.714.3(8.24.4
2.44.93.2
Change from1) 2000 in %
(24.075.5
(62.3262.2
14.3
)))
)
)
)
)
)
))
)
)
31.12.00
273.8142.6289.6
456.4108.7495.6
487.2360.1487.2
174.655.931.9
792.6
1,392.0667.3
2,065.0
2000
10.418.824.44.5
58.1
30.9.01
263.9140.4278.5
438.6113.5470.9
434.4317.8434.4
153.558.627.1
744.5
1,290.4630.3
1,928.3
2001
7.933.09.2
16.3
66.4
31.12.01
274.2144.0290.3
469.1128.0505.1
508.8364.2508.8
173.463.929.3
827.1
1,425.5700.1
2,131.3
4Q2000
3.44.7
) 9.34.5
21.9
Net new assets in CHF bn
Credit Suisse Financial ServicesCredit Suisse Private BankingCredit Suisse Asset Management 2)
Credit Suisse First Boston 3)
Credit Suisse Group
1) Certain restatements have been made to conform to the current presentation. / 2) Net new discretionary assets. / 3) Measured as the balance from accounts openedminus accounts closed.
3Q2001
1.15.0
(0.71.7
7.1
4Q2001
3.37.51.95.2
17.9
12 months
2001 was a challenging year for Credit Suisse Group in view of the difficult capital markets environment,particularly in the second half. Despite the adversemarket conditions, Credit Suisse Financial Services,Credit Suisse Private Banking and Credit Suisse AssetManagement achieved good results in terms of bothprofitability and growth. Credit Suisse First Boston wasparticularly impacted by market conditions. In addition,exceptional items led to an unsatisfactory result. CreditSuisse Group reported a net operating profit of CHF 616million in the fourth quarter, excluding exceptional itemsat Credit Suisse First Boston of CHF 1.1 billion (USD646 million) and the amortization of acquired intangibleassets and goodwill, after taxes. This compares with anet operating profit of CHF 21 million in the previousquarter and CHF 1.9 billion in the fourth quarter 2000.Full year net operating profit amounted to CHF 4.0billion, down 45% on the previous year, excluding theafter-tax exceptional items at Credit Suisse First Bostonand the after-tax amortization of acquired intangibleassets and goodwill. The Group reported a net loss ofCHF 830 million for the fourth quarter 2001, versus a
net loss of CHF 299 million in the third quarter and anet profit of CHF 590 million in the corresponding periodof 2000. Net profit for the full year declined 73% toCHF 1.6 billion.
Operating earnings per share for 2001 decreased49% to CHF 3.33 versus CHF 6.50 in the previous year,and earnings per share amounted to CHF 1.33 for 2001,down 74% on 2000. Operating return on equity was10.0% compared with 21.5% in the previous year, whilereturn on equity stood at 4.1%, versus 17.7% in 2000.
Strong net new asset growthNet new assets developed strongly in the fourth quarter,contributing CHF 17.9 billion or 1.4% of assets undermanagement. The Group’s asset gathering businessesmaintained their healthy growth momentum over the fullyear, with net new assets totaling CHF 66.4 billion, repre-senting growth of 4.8%. To the total of net new assets in 2001, Credit Suisse Financial Services contributed CHF7.9 billion (CHF 3.3 billion in the fourth quarter 2001),Credit Suisse Private Banking CHF 33.0 billion (CHF 7.5billion), Credit Suisse Asset Management CHF 9.2 billion
www.credit-suisse.com 5

AN OVERVIEW OF CREDIT SUISSE GROUP
(CHF 1.9 billion) and Credit Suisse First Boston CHF 16.3billion (CHF 5.2 billion). The Group’s total assets undermanagement stood at CHF 1,425.5 billion as of December31, 2001, up 2.4% on the year-end 2000 figure of CHF1,392.0 billion.
Operating income and expensesOperating income amounted to CHF 8.2 billion for thefourth quarter, corresponding to a decline of 6% on theprevious quarter and of 23% on the corresponding periodof 2000. Fourth quarter operating expenses were down5% to CHF 6.9 billion and personnel-related expenseswere down 12%, as a result of the Group-wide implemen-tation of cost reduction initiatives. Adjusting for exceptionalitems at Credit Suisse First Boston, fourth quarter costswere down 18% compared with the third quarter. Operat-ing income increased only slightly in 2001, up 5% to CHF 39.2 billion, reflecting deteriorating market conditionsand the inclusion of DLJ for only two months of 2000.Operating expenses rose 20% to CHF 30.3 billion over theyear, due mainly to the higher cost base as a result of theacquisition of DLJ in November 2000.
Par value reductionThe Group’s Board of Directors will propose a par valuereduction of CHF 2 per share in lieu of a dividend to the Annual General Meeting on May 31, 2002. This is unchanged versus the par value reduction for thefinancial year 2000 and compares with a dividend of CHF 1.75 per share for 1999 (adjusted for the 4-for-1share split in August 2001). If approved by the AnnualGeneral Meeting, this capital reduction will be paid out on August 14, 2002.
Business unit resultsCredit Suisse Financial Services’ fourth quarter and full year results are reported under the unit’s oldstructure, applicable prior to its realignment on January1, 2002. A new reporting structure will apply for thepresentation of the business unit’s first quarter results2002.
6
Credit Suisse Financial Services reported a net operatingprofit of CHF 206 million for the fourth quarter, down 8%on the previous quarter and down 49% on the very strongfourth quarter 2000. For the year as a whole, CreditSuisse Financial Services reported a net operating profitof CHF 1.4 billion, down 24% on 2000. The businessunit’s results were impacted by a lower investment returnfrom the insurance units and higher investments in pan-European wealth management expansion at Credit SuissePersonal Finance. Excluding the Credit Suisse PersonalFinance initiative, net operating profit stood at CHF 303 million for the fourth quarter and CHF 1.7 billion for full year 2001. Total assets under managementincreased slightly to CHF 274.2 billion in 2001 thanks toCHF 7.9 billion of net new assets.
For 2001, Winterthur Insurance recorded a 28%decrease in net operating profit, to CHF 536 million,despite a lower combined ratio and a significant improve-ment in its underwriting result. This decline resulted primari-ly from lower investment income, which was down 7%compared with 2000, as well as from transaction-relatedcharges of CHF 167 million for the divestment ofWinterthur International. The underwriting result stood atCHF 1.1 billion for 2001, 9% better than in 2000. For2001, the gross premium volume stood at CHF 18.4billion, up 12% over 2000. Despite a significantly lowerinvestment return, Winterthur Life & Pensions’ net oper-ating profit for 2001 was down only 5% to CHF 578million. Gross premiums amounted to CHF 17.4 billion in2001, up 13% compared with 2000. Credit SuisseBanking reported a net operating profit of CHF 114 millionin the fourth quarter, down 25% on the third quarter 2001,resulting in particular from the depreciation of capitalizedsoftware. This also contributed to a rise in the operatingcost/income ratio to 73.4%, while personnel expensesdeclined 14% quarter-on-quarter. Net operating profit forthe full year stood at CHF 632 million, a decline of 4%versus 2000. Credit Suisse Personal Finance achievedhigher revenues in the fourth quarter. However, continuedinvestments in expansion resulted in a net operating loss ofCHF 97 million for the quarter.
Credit Suisse PrivateBanking gave a strongperformance in the fourthquarter of 2001, given thedemanding market condi-tions. Net operating profitstood at CHF 602 million,corresponding to anincrease of 17% quarter-on-quarter. For the fullyear 2001, Credit SuissePrivate Banking posted anet operating profit of CHF2.3 billion, down 11% onthe previous year’s verystrong result. In the fourth
Net operating profitcontribution by BU in 2001
CSFS
CSPB
CSAM
CSFB
51%
7% 30%
12%
Operating incomecomposition in 2001
Balance sheet business
Commission and service
fees
Trading
Insurance
23%
Operating incomecontribution by BU in 2001
CSFS
CSPB
CSAM
CSFB
17%16%
15%
4%
24%
57%
44%

quarter, the business unit reported net new assets ofCHF 7.5 billion, up 50% on the third quarter. For 2001,net new assets amounted to CHF 33.0 billion, anincrease of 76% over 2000. This corresponds to agrowth rate of 7.2%. Assets under management rose 7%to CHF 469.1 billion in the fourth quarter and were up2.8% versus end-2000.
Credit Suisse Asset Management performed well inthe fourth quarter, reporting a net operating profit of CHF139 million, compared with CHF 34 million in the weakthird quarter. Net new assets totaled CHF 1.9 billion inthe fourth quarter, reversing the negative trend in theprevious quarter. Net operating profit for the full yeardeclined 5% to CHF 322 million, and net new assets ofCHF 9.2 billion were reported for 2001. At year-end2001, discretionary assets under management stood atCHF 364.2 billion and total assets under managementincreased by 4.4% to CHF 508.8 billion.
Credit Suisse First Boston reported a net operatingloss of USD 196 million (CHF 327 million) in the fourthquarter, excluding after-tax exceptional items of USD 646million (CHF 1.1 billion) and the after-tax amortization ofacquired intangible assets and goodwill. This compareswith a net operating loss of USD 123 million (CHF 204million) in the third quarter and a net operating profit ofUSD 527 million (CHF 901 million) in the fourth quarter2000. A net loss of USD 1.0 billion (CHF 1.7 billion) wasreported in the fourth quarter, versus a net loss of USD289 million (CHF 484 million) in the previous quarter.Overall revenues were down 23% quarter-on-quarter andoperating expenses, adjusted for exceptional items,decreased 32%. For the full year 2001, Credit SuisseFirst Boston recorded a net operating profit of USD 338million (CHF 571 million), down 78% on the previousyear, excluding the exceptional items and the amortizationof acquired intangible assets and goodwill, after taxes. Anet loss of USD 961 million (CHF 1.6 billion) wasreported for the full year, versus a net profit of USD 1.4billion (CHF 2.4 billion) in 2000. The extensive restruc-turing and cost reduction program initiated in 2001 is wellunderway and is expected to provide the firm with a lowerand more flexible cost base going forward.
OutlookCredit Suisse Group remains cautious in its outlook for2002 in view of the challenging environment but is confi-
dent about its market position across all its core busi-nesses. The Group believes it is well placed to meetcurrent challenges and to capture new opportunities asglobal markets improve.
New organizational structureAs announced in July 2001, Credit Suisse Group stream-lined its organizational structure into two businessunits – Credit Suisse Financial Services and Credit SuisseFirst Boston – in order to adapt to the changed marketenvironment with the goal of optimizing client focus,adjusting capacity and increasing productivity. The align-ment is aimed at strengthening the Group’s leading posi-tion in its two main strategic areas, asset gathering andfinancial intermediation.
As of January 1, 2002, Credit Suisse FinancialServices comprises Private Banking (Switzerland and Inter-national), Corporate & Retail Banking, Life & Pensions andInsurance. The affluent sector in Switzerland and thePersonal Finance initiative have been included in PrivateBanking. The new organization introduces an improvedclient segmentation driven by client service needs andshared support and IT.
Credit Suisse First Boston now also includes theGroup’s asset management business. The business unitaims to maximize synergies between the two areas andrealize cost reductions.
The financial reporting will reflect the new structure,beginning with the presentation of the first quarter results2002.
www.credit-suisse.com 7
REVIEW OF BUSINESS UNITS CREDIT SUISSE FINANCIAL SERVICES
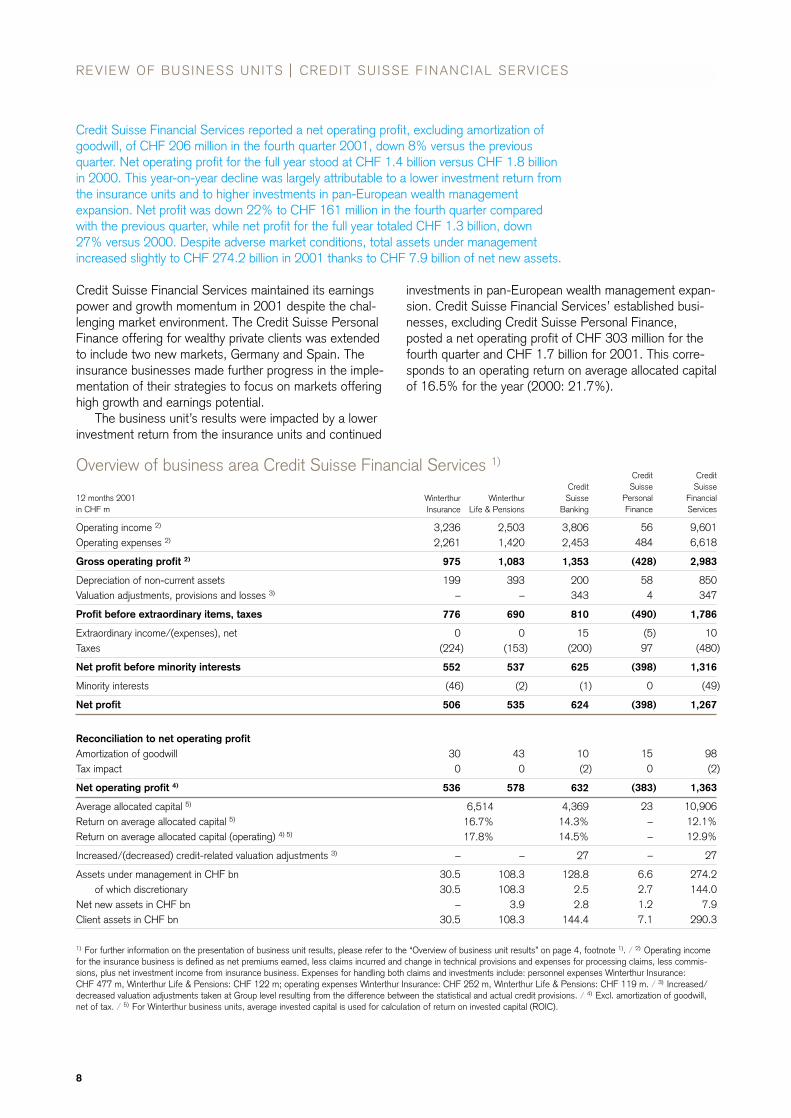
Credit Suisse Financial Services reported a net operating profit, excluding amortization ofgoodwill, of CHF 206 million in the fourth quarter 2001, down 8% versus the previousquarter. Net operating profit for the full year stood at CHF 1.4 billion versus CHF 1.8 billionin 2000. This year-on-year decline was largely attributable to a lower investment return fromthe insurance units and to higher investments in pan-European wealth managementexpansion. Net profit was down 22% to CHF 161 million in the fourth quarter comparedwith the previous quarter, while net profit for the full year totaled CHF 1.3 billion, down 27% versus 2000. Despite adverse market conditions, total assets under managementincreased slightly to CHF 274.2 billion in 2001 thanks to CHF 7.9 billion of net new assets.
Credit Suisse Financial Services maintained its earningspower and growth momentum in 2001 despite the chal-lenging market environment. The Credit Suisse PersonalFinance offering for wealthy private clients was extendedto include two new markets, Germany and Spain. Theinsurance businesses made further progress in the imple-mentation of their strategies to focus on markets offeringhigh growth and earnings potential.
The business unit’s results were impacted by a lowerinvestment return from the insurance units and continued
8
investments in pan-European wealth management expan-sion. Credit Suisse Financial Services’ established busi-nesses, excluding Credit Suisse Personal Finance,posted a net operating profit of CHF 303 million for thefourth quarter and CHF 1.7 billion for 2001. This corre-sponds to an operating return on average allocated capitalof 16.5% for the year (2000: 21.7%).
Overview of business area Credit Suisse Financial Services 1)
12 months 2001 in CHF m
Operating income 2)
Operating expenses 2)
Gross operating profit 2)
Depreciation of non-current assetsValuation adjustments, provisions and losses 3)
Profit before extraordinary items, taxes
Extraordinary income/(expenses), net Taxes
Net profit before minority interests
Minority interests
Net profit
Reconciliation to net operating profitAmortization of goodwillTax impact
Net operating profit 4)
Average allocated capital 5)
Return on average allocated capital 5)
Return on average allocated capital (operating) 4) 5)
Increased/(decreased) credit-related valuation adjustments 3)
Assets under management in CHF bn of which discretionary
Net new assets in CHF bnClient assets in CHF bn
1) For further information on the presentation of business unit results, please refer to the “Overview of business unit results” on page 4, footnote 1). / 2) Operating incomefor the insurance business is defined as net premiums earned, less claims incurred and change in technical provisions and expenses for processing claims, less commis-sions, plus net investment income from insurance business. Expenses for handling both claims and investments include: personnel expenses Winterthur Insurance: CHF 477 m, Winterthur Life & Pensions: CHF 122 m; operating expenses Winterthur Insurance: CHF 252 m, Winterthur Life & Pensions: CHF 119 m. / 3) Increased/decreased valuation adjustments taken at Group level resulting from the difference between the statistical and actual credit provisions. / 4) Excl. amortization of goodwill,net of tax. / 5) For Winterthur business units, average invested capital is used for calculation of return on invested capital (ROIC).
CreditSuisse
FinancialServices
9,6016,618
) 2,983
850347
) 1,786
) 10(480
) 1,316
(49
) 1,267
98(2
) 1,363
10,90612.1%12.9%
27
274.2144.0
7.9290.3
)
)
)
CreditSuisse
PersonalFinance
56484
(428
584
(490
(5) 97
(398
) 0
(398
15) 0
(383
23––
–
6.62.71.27.1
Credit Suisse
Banking
3,8062,453
1,353
200343
810
15) (200
625
) (1
624
10(2
632
4,36914.3%14.5%
27
128.82.52.8
144.4
WinterthurLife & Pensions
2,5031,420
1,083
393–
690
0) (153
537
) (2
535
430
578
–
108.3108.3
3.9108.3
WinterthurInsurance
3,2362,261
975
199–
776
0(224
552
(46
506
300
536
–
30.530.5
–30.5
6,51416.7%17.8%

Winterthur Insurance income statement (non-life business) 1)
in CHF m
Gross premiums writtenReinsurance ceded
Net premiums written
Change in provision for unearned premiums and in provision for future policy benefits (health)
Net premiums earned
Claims and annuities incurred, netDividends to policyholders incurred, netOperating expenses, net (incl. commissions paid)
Underwriting result, net
Net investment incomeInterest received on deposits and bank accountsInterest paidOther income/(expenses) (including foreign currency
translation impact)
Profit before taxes
Taxes
Net operating profit before minority interests
Amortization of goodwill
Net profit before minority interests
Minority interests
Net profit
Reconciliation to net operating profitAmortization of goodwill
Net operating profit 2)
1) For further information on the presentation of business unit results, please refer to the “Overview of business unit results” on page 4, footnote 1). The business unitincome statement differs from the presentation of the Group’s consolidated results as it reflects the way the insurance business is managed, which is in line withWinterthur’s peers in the insurance industry. Amortization of goodwill is excluded from “Operating expenses” and is reported separately in the income statement. /2) Excl. amortization of goodwill.
2000
16,508) (1,876
14,632
) (1,113
13,519
) (10,432) (376) (3,969
) (1,258
2,38596
) (136
) 53
1,140
) (305
835
16
819
) (90
729
16
745
Change from2000 in %
12) (16
15
) 65
11
) 10) (17) 9
) (9
(7(70
) (7
–
(29
) (27
(30
88
(33
) (49
(31
88
(28
)
)
)
)))
)
)
)
)
)
)
)
2001
18,412) (1,572
16,840
(1,833
15,007
) (11,509) (311) (4,335
) (1,148
2,21729
) (127
) (165
806
) (224
582
30
552
) (46
506
30
536
4Q2000
3,715) (422
3,293
251
3,544
) (2,741) (94) (1,033
) (324
65827
) (34
(22
305
) (73
232
4
228
(28
200
4
204
3Q2001
3,614) (317
3,297
411
3,708
) (2,817) (78) (1,033
) (220
360) 9) (25
) 22
146
(51
95
3
92
7
99
3
102
4Q2001
3,685(209
3,476
319
3,795
(2,837(50
(1,081
(173
503(4
(35
(216
75
7
82
16
66
2
68
16
84
Winterthur Insurance key information(non-life business)
Combined ratio (excl. dividends to policyholders)
Claims ratio
Expense ratio
Assets under management in CHF bn
Technical provisions in CHF m
Number of employees
2001
105.6%
76.7%
28.9%
30.09.01
29.3
26,710
21,135
3Q2001
103.8%
76.0%
27.8%
4Q2000
106.5%
77.2%
29.3%
31.12.01
30.5
27,738
21,368
4Q2001
103.3%
74.8%
28.5%
2000
106.5%
77.2%
29.3%
31.12.00
32.5
26,653
21,796
12 months
12 months
www.credit-suisse.com 9

REVIEW OF BUSINESS UNITS CREDIT SUISSE FINANCIAL SERVICES
Winterthur Life & Pensions income statement (life business) 1)
in CHF m
Gross premiums writtenReinsurance ceded
Net premiums written
Change in provision for unearned premiums
Net premiums earned
Death and other benefits incurredChange in provision for future policyholder benefitsDividends to policyholders incurredOperating expenses, net (incl. commissions paid)Net investment incomeInterest received on deposits and bank accountsInterest on bonuses credited to policyholdersOther interest paidOther income/(expenses) (including foreign currency
translation impact)
Profit before taxes
Taxes
Net operating profit before minority interests
Amortization of goodwill
Net profit before minority interests
Minority interests
Net profit
Reconciliation to net operating profitAmortization of goodwill
Net operating profit 2)
1) For further information on the presentation of business unit results, please refer to the “Overview of business unit results” on page 4, footnote 1). The business unitincome statement differs from the presentation of the Group’s consolidated results as it reflects the way the insurance business is managed, which is in line withWinterthur’s peers in the insurance industry. Amortization of goodwill is excluded from “Operating expenses” and is reported separately in the income statement. /2) Excl. amortization of goodwill.
2000
15,452) (280
15,172
) (1
15,171
) (9,734) (6,377) (1,982) (1,680
6,05188
) (116) (239
) (416
766
) (101
665
15
650
) (56
594
15
609
Change from2000 in %
13) (25
13
) –
13
) 25) (14) (86) 11
(40(2
) 16) (6
) (87
(4
) 51
(13
187
(17
) (96
(10
187
(5
)
))
))
)
)
)
)
)
)
)
)
2001
17,413) (210
17,203
) (15
17,188
) (12,167) (5,457) (287) (1,868
3,65186
) (135) (225
) (53
733
) (153
580
43
537
) (2
535
43
578
4Q2000
4,225) (77
4,148
(1
4,147
) (2,675(1,597
) (229) (470) 1,329
22) (29) (61
(180
257
(31
226
4
222
) (14
208
4
212
4Q2001
4,899(61
4,838
(5
4,833
(3,234(2,711
458(452
1,31524
(36(91
2
108
(28
80
19
61
25
86
19
105
3Q2001
3,138) (91
3,047
) 1
3,048
) (2,560) 553
(114) (463
(37625
) (27) (35
11
62
) 4
66
10
56
(6
50
10
60
Winterthur Life & Pensions key information(life business)
Expense ratio 1)
Net return on average technical provisions 2)
Net new assets in CHF bn 3)
Assets under management in CHF bn 4)
Technical provisions in CHF m
Number of employees
1) Operating expenses/net premiums earned. / 2) Net profit before minority interests/average technical provisions. / 3) Based on change in technical provisions fortraditional business, adjusted for technical interests; net inflow of unit-linked business; and change in off-balance sheet business such as funds. / 4) Based on savings-related provisions for policyholders plus off-balance sheet assets.
2001
10.9%
50 bp
3.9
30.09.01
106.0
105,402
7,469
4Q2000
11.3%
21 bp
) 0.8
31.12.01
108.3
108,326
7,570
3Q2001
15.2%
6 bp
(0.1
4Q2001
9.4%
6 bp
1.3
2000
11.1%
68 bp
2.7
31.12.00
104.7
105,522
6,562
12 months
12 months
10

Winterthur InsuranceWinterthur Insurance recorded a gross premium volumeof CHF 18.4 billion in 2001, representing healthy growthof 12% (organic growth: 11%) versus the previous year.This increase was primarily attributable to an increase inrates as well as to above-average volume growth in theUK and in most other key markets. New productslaunched in 2001, including WinProfessional and Bonus-Protection, were well received in the market.
Winterthur Insurance made significant progress in theimplementation of strategic projects aimed at focusing itsresources on markets offering high growth and earningspotential, while withdrawing from markets in which itcannot achieve adequate returns on invested capital.Acquisitions in the UK and Belgium, the divestment ofWinterthur International, as well as the announced sale ofbranches in France and a subsidiary in Austria, repre-sent milestones in the implementation of this strategy.
The positive effects of the ongoing restructuring mea-sures have already been seen in 2001. The overallexpense ratio fell by almost half a percentage pointcompared with 2000, to stand at 28.9%. This contributedto an improvement in the combined ratio, which decreasedby 0.9 percentage points versus the previous year to standat 105.6%. The claims ratio decreased 0.5 percentagepoints to 76.7% compared with the previous year. Furtherimprovements in several countries within Europe (Italy,Spain, Portugal, Switzerland) were partially offset by aweak North American performance, as workers’ compen-sation reserves were strengthened.
After the significant improvement of the combined ratioin the third quarter – by five percentage points to 103.8%– a further slight improvement was recorded in the fourthquarter (103.3%). The fourth quarter saw an improvementof 2.4 percentage points to the claims ratio versus thefourth quarter 2000 and an improvement of 0.8 percent-age points to the expense ratio. In addition to the divest-ment of Winterthur International, progress in Europe alsopositively affected the claims ratio.
The underwriting result stood at CHF 1.1 billion for2001, 9% better than in 2000. The 7% decline in invest-ment income owing to the generally weak market condi-tions, as well as transaction-related charges of CHF 167 million for the divestment of Winterthur International,resulted in a net operating profit of CHF 536 million,down 28% on the previous year (CHF 745 million).
Winterthur Life & PensionsWinterthur Life & Pensions reported strong premiumgrowth of 13% (organic growth: 10%) in 2001 to CHF17.4 billion, driven by a fourth quarter increase in premi-ums of 16% versus the same period of 2000. All coremarkets contributed to this growth through increasedsales of the existing product range and the successfullaunch of new products throughout the year. In 2001, thepremium contribution from outside Switzerland exceeded50% for the first time. Net new assets for 2001 totaledCHF 3.9 billion (CHF 2.7 billion in 2000) as a result oforganic growth in asset gathering.
Net operating profit for 2001 stood at CHF 578 million(CHF 609 million in 2000) despite a lower investmentreturn. Solid operating profits were realized in all coremarkets, with significant contributions from Switzerland,Belgium, the UK and the Netherlands. As a result of contin-ued cost management, the expense ratio decreased from11.1% to 10.9% compared with the previous year. Invest-ment income for the full year decreased CHF 2.4 billion or40% versus 2000 in view of market conditions. Of thisdecrease, one-third is related to the depreciation of unit-linked investments that did not impact net operating profitowing to a corresponding reduction in unit-linked provisions.
The capital market developments in 2001 have beena challenge for Winterthur Life & Pensions, especially asregards the employee benefit business in Switzerland,where a guaranteed investment return of 4% must beprovided to policyholders. This business, which represents25% of Winterthur Life & Pensions’ technical reserves,has been closely monitored and managed with a very low cost ratio over the last two years. Winterthur Life &Pensions is currently assessing measures to furtherimprove its profitability and to substantially increase theflexibility of the employee benefit products to compensatefor the unfavorable regulatory environment.
A sharp focus on profitable growth prompted theannounced withdrawal from the Austrian and Frenchmarkets, as well as the purchase of the largest pensionfund in the Czech Republic, VOPF. This acquisition providedWinterthur Life & Pensions with a 25% share in the Czechpensions market. The successful launch of product distribu-tion with Credit Suisse Personal Finance and Credit SuissePrivate Banking in Italy, Germany and Spain demonstratesthe tie-in with other Credit Suisse Group entities and isexpected to further strengthen market positions.
www.credit-suisse.com 11

REVIEW OF BUSINESS UNITS CREDIT SUISSE FINANCIAL SERVICES
Credit Suisse Banking income statement 1)
in CHF m
Net interest incomeNet commission and service fee incomeNet trading incomeOther ordinary income
Operating income
Personnel expensesOther operating expenses
Operating expenses
Gross operating profit
Depreciation of non-current assets Valuation adjustments, provisions and losses 2)
Profit before extraordinary items, taxes
Extraordinary income/(expenses), net Taxes 3)
Net operating profit before minority interests
Amortization of goodwill, net of tax
Net profit before minority interests
Minority interests
Net profit
Reconciliation to net operating profitAmortization of goodwillTax impact
Net operating profit 4)
Increased/(decreased) credit-related valuation adjustments 2)
1) For further information on the presentation of business unit results, please refer to the “Overview of business unit results” on page 4, footnote 1). The business unitincome statement differs from the presentation of the Group’s consolidated results in excluding amortization of goodwill from depreciation of non-current assets, andreporting these costs separately in the income statement. / 2) Increased/decreased valuation adjustments taken at Group level resulting from the difference between thestatistical and actual credit provisions. / 3) Excl. tax impact on amortization of goodwill. / 4) Excl. amortization of goodwill, net of tax.
4Q2000
61128585
) 8
989
390257
647
342
45114
183
(2) (47
134
3
131
0
131
3) 0
134
(59
Change from2000 in %
3(13(7
(40
(3
6(7
1
(9
126(39
(3
(25) (3
(4
(33
(4
) 0
(4
(17–
(4
) –
)))
)
)
)
)
)
))
)
)
)
)
)
)
2000
2,3791,159
34245
3,925
1,513917
2,430
1,495
84562
849
20) (208
661
12
649
) (1
648
12) 0
660
(151
2001
2,4561,005
31827
3,806
1,602851
2,453
1,353
190343
820
) 15) (202
633
8
625
(1
624
10(2
632
) 27
4Q2001
615221817
924
361218
579
345
99100
146
3(35
114
2
112
0
112
20
114
11
3Q2001
60924074(6
917
421192
613
304
3678
190
3) (40
153
1
152
0
152
2(1
153
21
12 months
Credit Suisse BankingCredit Suisse Banking recorded a net operating profit ofCHF 114 million in the fourth quarter, down 25% on theprevious quarter and down 15% on the correspondingperiod of the previous year. This decline is primarily attributable to the depreciation of capitalized software.Net operating profit for the full year stood at CHF 632million, a decline of 4% versus 2000. The operatingreturn on average allocated capital for 2001was 14.5%.
Despite pressure on margins, net interest income in2001 improved 3% versus the previous year as a resultof a 4.8% increase in lending volumes. Personnel ex-penses in the fourth quarter 2001 decreased by 14%versus the previous quarter. The operating cost/incomeratio rose from 64.1% in 2000 to 69.4% in 2001 owingto lower revenues from the securities and wealth man-agement businesses, as well as higher depreciation.
Net new assets amounted to CHF 1.5 billion in thefourth quarter, up 25% on the previous quarter, and stoodat CHF 2.8 billion for the full year, down 49.1% versus2000. The strategically important funds business grew 3%
12
in 2001 and thus outperformed the market by 1.8%.Credit Suisse Banking also further improved the riskstructure of its credit portfolio, as non-performing loansdropped to 4.5% of total counterparty exposure from6.5% at end-2000, and provision coverage of non-performing loans stood at 59% versus 62% at end-2000.
In the fourth quarter 2001, Credit Suisse Bankinglaunched the online portal www.credit-suisse.ch/business
for corporate clients. This new offering providesaccess to bancassurance services and products as wellas other offerings geared specifically to the needs ofbusiness clients. As a result of cooperations and partner-ships, Credit Suisse also offers access to non-financialservices via the new portal.
Credit Suisse Banking’s Direct Net offering hadapproximately 322,300 clients as of year-end 2001,representing growth of around 23% for the year.

Credit Suisse Banking balance sheet information
in CHF m
Total assets
Due from customersMortgages
Due to customers in savings and investment depositsDue to customers, other
Credit Suisse Banking key information
Cost/income ratio Cost/income ratio (operating) 1)
Return on average allocated capitalReturn on average allocated capital (operating) 1)
Average allocated capital in CHF m
Pre-tax margin Pre-tax margin (operating) 1)
Personnel expenses/operating income
Net interest margin
Loan growth
Net new assets in CHF bn
Deposit/loan ratio
Assets under management in CHF bn
Number of branches
Number of employees
1) Excl. amortization of goodwill.
2000
64.4%64.1%
14.7%15.0%
4,401
21.8%22.1%
38.5%
239 bp
3.7%
5.5
31.12.00
69.1%
130.8
235
11,438
2001
69.7%69.4%
14.3%14.5%
4,369
21.7%21.9%
42.1%
236 bp
5.0%
2.8
30.09.01
66.4%
122.6
228
12,061
4Q2000
70.3%70.0%
12.2%12.5%
4,290
18.0%18.3%
39.4%
242 bp
) 1.0%
2.1
31.12.01
68.8%
128.8
227
11,953
3Q2001
71.0%70.8%
14.0%14.1%
4,353
20.8%21.0%
45.9%
231 bp
(0.6%
1.2
4Q2001
73.6%73.4%
10.3%10.5%
4,332
15.9%16.1%
39.1%
233 bp
1.1%
1.5
30.09.01
105,725
31,15265,903
32,03832,413
31.12.01
105,599
31,74566,288
32,89534,523
31.12.00
100,653
28,94064,616
33,32231,287
12 months
www.credit-suisse.com 13

–
5034
46
24
74(32
33
29
34
285
25
200
25
34 58
REVIEW OF BUSINESS UNITS CREDIT SUISSE FINANCIAL SERVICES
Credit Suisse Personal Finance income statement 1)
in CHF m
Net interest incomeNet commission and service fee incomeNet trading incomeOther ordinary income
Operating income
Personnel expensesOther operating expenses
Operating expenses
Gross operating profit
Depreciation of non-current assets Valuation adjustments, provisions and losses
Profit before extraordinary items, taxes
Extraordinary income/(expenses), net Taxes
Net operating profit before minority interests
Amortization of goodwill
Net profit before minority interests
Minority interests
Net profit
Reconciliation to net operating profitAmortization of goodwill
Net operating profit 2)
1) For further information on the presentation of business unit results, please refer to the “Overview of business unit results” on page 4, footnote 1). The business unitincome statement differs from the presentation of the Group’s consolidated results in excluding amortization of goodwill from depreciation of non-current assets, andreporting these costs separately in the income statement. / 2) Excl. amortization of goodwill.
4Q2000
160
) 1
8
47143
190
) (182
71
) (190
045
) (145
1
) (146
0
) (146
1
) (145
Change from2000 in %
(13(20(33350
(8
7230
44
) 56
231300
) 64
–45
) 73
200
) 75
–
) 75
200
) 73
)))
)
)
2000
84562
61
113223
336
) (275
131
) (289
) 067
) (222
5
) (227
0
) (227
5
) (222
2001
73649
56
194290
484
) (428
434
) (475
(597
) (383
15
) (398
0
) (398
15
) (383
4Q2001
090
15
24
4298
140
(116
153
(134
(542
(97
8
(105
0
(105
8
(97
3Q2001
071
(5
3
6044
104
) (101
170
) (118
) 127
) (90
4
) (94
0
) (94
4
) (90
12 months
Credit Suisse Personal FinanceThe fourth quarter saw Credit Suisse Personal Financefurther expand its distribution network. It now has a pre-sence in 63 locations in Italy (35), Spain (18) andGermany (10). As of end-2001, Credit SuissePersonal Finance had around 600 financial advisors andits number of clients had risen to approximately 31,600.Credit Suisse Personal Finance reported a net operatingloss of CHF 383 million owing to continued investmentsin expansion.
Assets under management stood at CHF 6.6 billionas of end-December 2001, versus CHF 6.0 billion as ofend-September 2001. This corresponds to an increase ofCHF 0.6 billion versus end-September 2001, and growthof 13.8% versus end-December 2000 (CHF 5.8 billion).Net new assets of CHF 0.5 billion were reported for thefourth quarter and of CHF 1.2 billion for 2001. In thefourth quarter 2001, operating income stood at CHF 24 million, versus CHF 3 million in the third quarter.Operating income for the full year stood at CHF 56million, down 8% versus 2000.
The Credit Suisse Personal Finance offering waslaunched successfully in Germany and Spain in 2001,with 138 financial advisors in Germany and 123 in Spainat year-end. Its priorities for 2002 are to increase assets
14
under management and further expand its distributionnetwork in Germany and Spain. Additions to the productrange are also planned, as well as closer cooperation withthe Winterthur units regarding products and distributioncapacity.
In 2001, the Swiss online broker youtrade recorded an 11% increase in its customer base, to over28,000.

Credit Suisse Personal Finance key information
Personal FinanceGrowth in assets under management
of which net new assets of which market movement and structural effectsof which acquisition
youtradeNumber of transactions (in ’000s)
Credit Suisse Personal FinanceAverage allocated capital in CHF m
Personal FinanceAssets under management in CHF bnNumber of clientsNumber of advisors
youtradeAssets under management in CHF bnNumber of clients
Credit Suisse Personal FinanceNumber of employees
2000
40.1%51.9%
) (11.8%–
436
n/a
31.12.00
4.817,898
331
1.025,228
764
)
2001
19.5%22.6%
) (21.7%18.6%
335
23
30.09.01
5.329,240
568
0.727,520
1,013
4Q2000
1.5%7.5%
) (6.0%–
95
n/a
31.12.01
5.731,578
599
0.928,112
1,071
3Q2001
3.9%1.7%
) (15.4%17.6%
61
20
4Q2001
8.8%9.0%
(0.2%–
85
15
12 months
www.credit-suisse.com 15
REVIEW OF BUSINESS UNITS CREDIT SUISSE PRIVATE BANKING
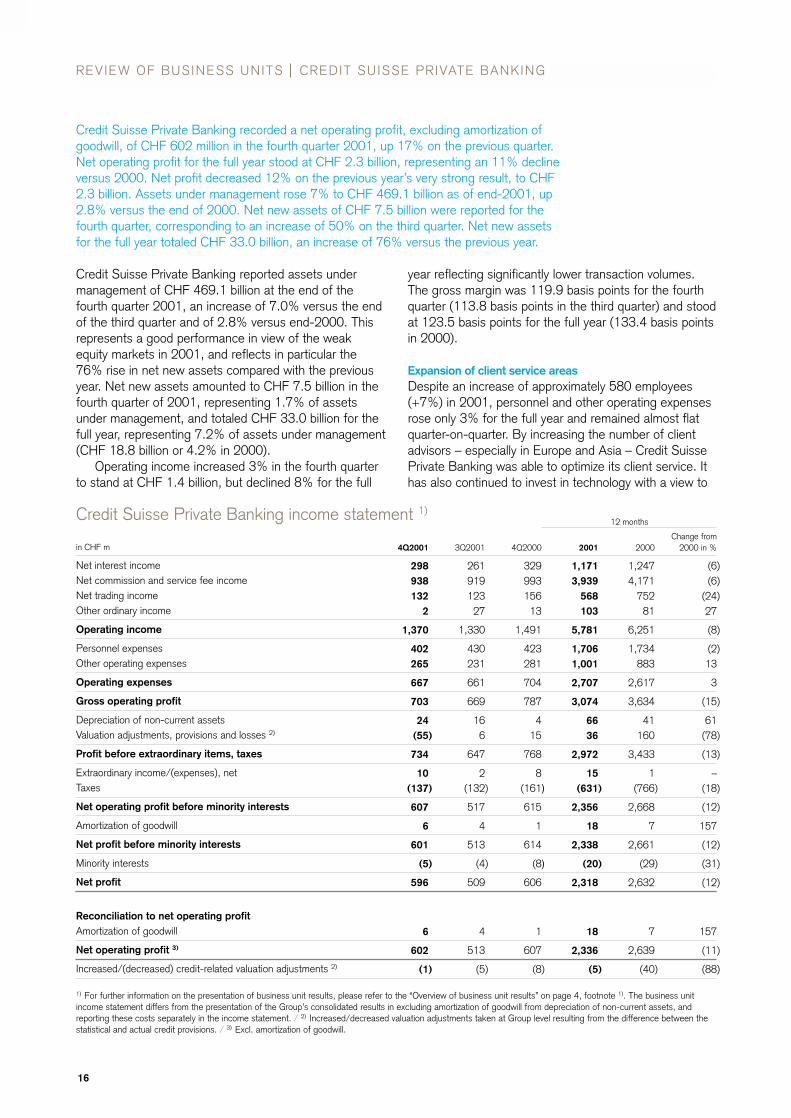
Credit Suisse Private Banking recorded a net operating profit, excluding amortization ofgoodwill, of CHF 602 million in the fourth quarter 2001, up 17% on the previous quarter.Net operating profit for the full year stood at CHF 2.3 billion, representing an 11% declineversus 2000. Net profit decreased 12% on the previous year’s very strong result, to CHF2.3 billion. Assets under management rose 7% to CHF 469.1 billion as of end-2001, up2.8% versus the end of 2000. Net new assets of CHF 7.5 billion were reported for thefourth quarter, corresponding to an increase of 50% on the third quarter. Net new assetsfor the full year totaled CHF 33.0 billion, an increase of 76% versus the previous year.
Credit Suisse Private Banking reported assets undermanagement of CHF 469.1 billion at the end of thefourth quarter 2001, an increase of 7.0% versus the endof the third quarter and of 2.8% versus end-2000. Thisrepresents a good performance in view of the weakequity markets in 2001, and reflects in particular the76% rise in net new assets compared with the previousyear. Net new assets amounted to CHF 7.5 billion in thefourth quarter of 2001, representing 1.7% of assetsunder management, and totaled CHF 33.0 billion for thefull year, representing 7.2% of assets under management(CHF 18.8 billion or 4.2% in 2000).
Operating income increased 3% in the fourth quarterto stand at CHF 1.4 billion, but declined 8% for the full
16
year reflecting significantly lower transaction volumes.The gross margin was 119.9 basis points for the fourthquarter (113.8 basis points in the third quarter) and stoodat 123.5 basis points for the full year (133.4 basis pointsin 2000).
Expansion of client service areasDespite an increase of approximately 580 employees(+7%) in 2001, personnel and other operating expensesrose only 3% for the full year and remained almost flatquarter-on-quarter. By increasing the number of clientadvisors – especially in Europe and Asia – Credit SuissePrivate Banking was able to optimize its client service. Ithas also continued to invest in technology with a view to
Credit Suisse Private Banking income statement 1)
in CHF m
Net interest incomeNet commission and service fee income Net trading incomeOther ordinary income
Operating income
Personnel expensesOther operating expenses
Operating expenses
Gross operating profit
Depreciation of non-current assets Valuation adjustments, provisions and losses 2)
Profit before extraordinary items, taxes
Extraordinary income/(expenses), net Taxes
Net operating profit before minority interests
Amortization of goodwill
Net profit before minority interests
Minority interests
Net profit
Reconciliation to net operating profitAmortization of goodwill
Net operating profit 3)
Increased/(decreased) credit-related valuation adjustments 2)
1) For further information on the presentation of business unit results, please refer to the “Overview of business unit results” on page 4, footnote 1). The business unitincome statement differs from the presentation of the Group’s consolidated results in excluding amortization of goodwill from depreciation of non-current assets, andreporting these costs separately in the income statement. / 2) Increased/decreased valuation adjustments taken at Group level resulting from the difference between thestatistical and actual credit provisions. / 3) Excl. amortization of goodwill.
4Q2000
32999315613
1,491
423281
704
787
415
768
8) (161
615
1
614
) (8
606
1
607
) (8
3Q2001
26191912327
1,330
430231
661
669
16) 6
647
2) (132
517
4
513
) (4
509
4
513
) (5
4Q2001
298938132
2
1,370
402265
667
703
24(55
734
10(137
607
6
601
(5
596
6
602
(1
Change from2000 in %
(6(6
(2427
(8
(213
3
(15
61(78
(13
–) (18
(12
157
(12
) (31
(12
157
(11
) (88
)))
)
)
)
)
)
)
)
)
)
)
)
)
2000
1,2474,171
75281
6,251
1,734883
2,617
3,634
41160
3,433
1) (766
2,668
7
2,661
) (29
2,632
7
2,639
) (40
2001
1,1713,939
568103
5,781
1,7061,001
2,707
3,074
6636
2,972
15) (631
2,356
18
2,338
) (20
2,318
18
2,336
) (5
12 months

increasing efficiency and serving clients more effectively.The net operating margin improved significantly in thefourth quarter, to stand at 53.1 basis points versus 44.2basis points in the previous quarter and 50.4 basis pointsfor the full year (2000: 56.9 basis points). The operatingcost/income ratio stood at 50.4% for the fourth quarterand 48.0% for the full year 2001.
Acclaim for innovationThe structured products offered by Credit Suisse PrivateBanking continued to attract client interest in the fourthquarter. Clients invested a total of CHF 20.1 billion in thisproduct range during 2001, of which CHF 16.9 billionwas invested in market-neutral instruments. The fourthquarter saw the successful launch of the Global ValueOpportunities Units, which invest in undervalued shares,and the Protected Investment Note EURO, a capital-protected product.
Credit Suisse Private Banking received three majorawards in the fourth quarter. It was named the bestprivate bank in Asia by the investment magazine FinanceAsia for the third consecutive year, and was judged byLafferty Group to have the best wealth managementprograms both globally and in Europe. The magazineBanking Technology awarded Credit Suisse Private Bank-
ing the prize for the best use of IT in the banking sectorin recognition of its relationship management portal
FrontNet. Credit Suisse Private Banking also strength-ened its family office services, which cater for complexclient interests. Following the acquisition of Frye-LouisCapital Management, Inc. in Chicago in September,Credit Suisse Private Banking opened a new family officebranch in London in the fourth quarter. Furthermore,December saw the launch of its Global Private BankingCentre in Singapore. This unique offering providesclients throughout the world with round-the-clock accessto a comprehensive range of online and offline financialservices.
Credit Suisse Private Banking balance sheet information
in CHF m
Total assets
Due from customersof which secured by mortgagesof which secured by other collateral
Credit Suisse Private Banking key information
Cost/income ratio Cost/income ratio (operating) 1)
Average allocated capital in CHF m
Pre-tax margin Pre-tax margin (operating) 1)
Fee income/operating income
Growth in assets under managementof which net new assetsof which market movement and structural effectsof which acquisition
Net profit before minority interests/average AuMNet operating profit before minority interests/average AuM 1)
Assets under management in CHF bn
Number of employees
1) Excl. amortization of goodwill.
31.12.00
101,153
33,7179,206
22,621
2000
42.6%42.5%
3,117
54.8%54.9%
66.7%
1.1%4.2%
) (3.1%–
56.8 bp56.9 bp
31.12.00
456.4
8,665
)
30.09.01
113,291
35,95910,20923,368
2001
48.3%48.0%
3,471
51.4%51.7%
68.1%
) 2.8%7.2%
) (5.8%1.4%
50.0 bp50.4 bp
30.09.01
438.6
9,338
31.12.01
123,379
38,55210,50926,056
4Q2000
47.6%47.5%
3,189
52.0%52.0%
66.6%
) (4.7%1.0%
) (5.7%–
52.5 bp52.6 bp
31.12.01
469.1
9,244
113 291
35 95910 209
23 3
3Q2001
51.2%50.9%
3,537
48.5%48.8%
69.1%
(10.3%1.0%
(11.3%–
43.9 bp44.2 bp
113 291
35 95910 209
23 3
4Q2001
50.9%50.4%
3,620
53.9%54.3%
68.5%
7.0%1.7%4.7%0.6%
52.6 bp53.1 bp
12 months
www.credit-suisse.com 17

REVIEW OF BUSINESS UNITS CREDIT SUISSE ASSET MANAGEMENT
Credit Suisse Asset Management reported a net operating profit, excluding the amortization of acquired intangible assets and goodwill, net of tax, of CHF 139 million for the fourth quarter 2001, up from CHF 34 million in the third quarter. For the full year 2001, net operating profit was CHF 322million, down by only 5% on the previous year despite turbulent market conditions. For the full year,net operating profit before extraordinary items, acquisition-related costs and taxes was up 8% versus2000. Net profit, after accounting for the amortization of acquired intangible assets and goodwill, netof tax, stood at CHF 236 million, corresponding to a decline of 17% versus the previous year.
Discretionary assets under management as of December31, 2001, were CHF 364.2 billion, including CHF 26.2billion in assets acquired with Sun Life of Canada AssetManagement (SLCAM) in December 2001. For the fullyear, net new assets added CHF 9.2 billion to discre-tionary assets while the market and foreign exchangeimpact over the year reduced discretionary assets undermanagement by CHF 31.3 billion. Advisory assetsincreased 13.8% to CHF 144.6 billion as of the end of2001. Total assets under management increased 4.4%
18
over the year to CHF 508.8 billion as of December 31,2001, compared with CHF 487.2 billion as of December31, 2000.
Fourth quarter operating income of CHF 441 millionwas 21% higher than in the previous quarter, while oper-ating income of CHF 1.6 billion for the full year was up1% on the previous year. The 2000 results included onlytwo months of revenue from DLJ’s Asset ManagementGroup, which was acquired in November 2000. Adjustingfor DLJ as if it had been acquired on January 1, 2000,
Credit Suisse Asset Management income statement 1)
in CHF m
Management and advisory feesNet mutual fund feesOther revenues
Operating income
Personnel expensesOther operating expenses
Operating expenses
Gross operating profit
Depreciation of non-current assets Valuation adjustments, provisions and losses
Profit before extraordinary items, acquisition-related costs, taxes
Extraordinary income/(expenses), net Taxes 2)
Net operating profit before acquisition-related costs, minority interests
Acquisition interestAmortization of retention paymentsAmortization of acquired intangible assets and goodwill, net of tax
Net profit before minority interests
Minority interests
Net profit
Reconciliation to net operating profitAmortization of acquired intangible assets and goodwillTax impact
Net operating profit 3)
1) For further information on the presentation of business unit results, please refer to the “Overview of business unit results” on page 4, footnote 1). Certain reclassificationshave been made to prior-period amounts to conform to the current presentation. The business unit income statement differs from the presentation of the Group’s consoli-dated results in a) presenting operating income by product line and b) excluding acquisition-related costs of acquisition interest, amortization of retention payments andamortization of acquired intangible assets and goodwill from operating income, personnel expenses and depreciation of non-current assets, respectively, and reportingthese costs separately in the income statement. / 2) Excluding tax impact on acquisition-related costs. / 3) Excluding amortization of acquired intangible assets and good-will, net of tax.
4Q2000
3248943
456
188133
321
135
110
124
) (1) (1
122
210
18
83
0
83
19(1
101
Change from2000 in %
(51533
1
(2(2
(2
8
10–
8
) –) 21
3
16–
65
(17
–
(17
77) 700
(5
)
))
)
)
)
)
2000
1,19532493
1,612
656481
1,137
475
290
446
) (1) (57
388
500
52
286
0
286
53) (1
338
2001
1,135374124
1,633
646472
1,118
515
320
483
) (14) (69
400
582086
236
0
236
94) (8
322
4Q2001
2919357
441
128122
250
191
90
182
0(30
152
112
19
120
0
120
27(8
139
3Q2001
2678117
365
146115
261
104
80
96
(13) (24
59
141122
12
0
12
22) 0
34
12 months

Credit Suisse Asset Management key information
Cost/income ratio 1) 2)
Cost/income ratio (operating) 1) 2) 3)
Average allocated capital in CHF m
Pre-tax margin Pre-tax margin (operating) 3)
Pre-tax margin (operating, excl. amortization of retention payments) 2) 3)
Personnel expenses/operating income 1) 2)
Growth in assets under management
Growth in discretionary assets under managementof which net new assetsof which market movement and structural effectsof which acquisition
Net profit before minority interests/average AuMNet operating profit before minority interests/average AuM 3)
Assets under management in CHF bnDiscretionary funds in CHF bn Advisory assets in CHF bn Mutual funds distributed in CHF bn
Number of employees
1) Excl. acquisition interest. / 2) Excl. amortization of retention payments. / 3) Excl. amortization of acquired intangible assets and goodwill.
2000
75.6%72.3%
1,147
21.2%24.5%24.5%
40.7%
14.7%
11.1%7.5%
) (8.1%11.7%
6.3 bp7.5 bp
31.12.00
487.2360.1127.1136.9
2,350
)
2001
76.2%70.4%
1,291
18.2%23.9%25.2%
39.6%
4.4%
1.1%2.6%
) (8.7%7.2%
4.9 bp6.7 bp
30.09.01
434.4317.8116.6119.2
2,355
4Q2000
77.0%72.8%
1,269
18.2%22.4%22.4%
41.2%
) 6.9%
) 5.0%) 2.7%) (8.7%
11.0%
7.0 bp8.6 bp
31.12.01
508.8364.2144.6132.4
2,395
3Q2001
79.7%73.7%
1,171
9.9%15.9%18.9%
40.0%
(13.7%
(14.7%(0.2%
(14.5%–
1.1 bp2.9 bp
4Q2001
64.9%58.7%
1,330
32.2%38.3%38.8%
29.0%
17.1%
14.6%0.6%5.8%8.2%
10.3 bp11.9 bp
12 months
operating income would be down approximately 9% forthe year.
Operating expenses in the fourth quarter includedCHF 27 million of charges, but were still 4% lower thanin the previous quarter. These charges related largely tothe completion of the integration of DLJ Asset Manage-ment in New York and a reorganization of Credit SuisseAsset Management in Japan. Compared to the fourthquarter of 2000, operating expenses were down 22%,reflecting cost control measures initiated in response tomarket conditions. For the full year, operating expenseswere 2% lower compared to 2000, or 11% lower ifadjusting for DLJ as if it had been acquired on January 1,2000.
Credit Suisse Asset Management enjoyed stronginvestment performance in the fourth quarter, benefitingfrom the overall improvement in the market. Last year,Credit Suisse Asset Management also made continued
progress in developing the alternative investment market,with improved investment returns in key alternativeproducts.
In December 2001, Credit Suisse Asset Managementcompleted the acquisition of SLCAM, the principal UKasset management subsidiary of global insurer Sun LifeFinancial Services of Canada, which includes formerparent-related insurance assets, third-party institutionaland retail funds and a property investment business. Theintegration of SLCAM is expected to be completed bymid-2002.
www.credit-suisse.com 19

REVIEW OF BUSINESS UNITS CREDIT SUISSE FIRST BOSTON
Credit Suisse First Boston reported a net operating loss of USD 196 million (CHF 327million) for the fourth quarter and a net operating profit of USD 338 million (CHF 571million) for the full year, excluding exceptional items of USD 646 million (CHF 1.1 billion)taken in the fourth quarter and the amortization of acquired intangible assets and good-will, after taxes. A net loss of USD 1.0 billion (CHF 1.7 billion) for the fourth quarter anda net loss of USD 961 million (CHF 1.6 billion) for the full year were recorded.
Operating income in 2001 was USD 14.0 billion (CHF 23.6 billion), up 14% compared with 2000, whichincluded two months of post-acquisition DLJ results.Fixed Income, with operating income up 95% year-on-year, drove the increase, but the industry’s 30% decreasein equity new issuances as well as its 50% decrease inmergers and acquisitions led to declining revenues in boththe Equity and Investment Banking divisions.
20
Compared with the third quarter, fourth quarteroperating income declined 23% to USD 2.5 billion(CHF 4.3 billion), primarily due to weaker fixed incomerevenues as well as losses relating to Argentina andEnron. Total pre-tax losses relating to Argentinaamounted to USD 213 million (CHF 360 million) andpre-tax losses relating to Enron amounted to USD 126 million (CHF 213 million).
Credit Suisse First Boston income statement 1)
in USD m
Fixed IncomeEquityInvestment BankingFinancial Services GroupOther
Operating income
Personnel expensesOther operating expenses
Operating expenses
Gross operating profit
Depreciation of non-current assets Valuation adjustments, provisions and losses 2)
Profit before extraordinary items, acquisition-related costs, exceptional items, taxes
Extraordinary income/(expenses), net Taxes 3) 4)
Net operating profit before acquisition-related costs, exceptional items, minorities
Acquisition interest, net of tax Amortization of retention payments, net of tax Amortization of acquired intangible assets and goodwill, net of tax Exceptional items, net of tax
Net profit before minority interests
Minority interests
Net profit
Reconciliation to net operating profitAmortization of acquired intangible assets and goodwillExceptional itemsTax impact
Net operating profit 5)
Increased/(decreased) credit-related valuation adjustments 2)
Acquisition interestAmortization of retention paymentsTax impact
)
)
)
)
4Q2000
7181,0021,453
268357
3,798
1,894797
2,691
1,107
12795
885
0) (219
666
6871
1110
) 416
0
) 416
1370
) (26
) 527
17
105109
) (75
3Q2001
1,627666596344
) 33
3,266
2,102819
2,921
345
130203
) 12
0(2
) 10
6469
1660
) (289
) 0
) (289
2050
) (39
) (123
49
97106
) (70
4Q2001
914699589364(66
2,500
1,114881
1,995
505
152477
(124
073
(51
6183
167646
(1,008
(1
(1,009
205845
(237
(196
66
95127(78
2000
2,9195,0763,681
268355
12,299
7,0832,176
9,259
3,040
386322
2,332
) 0) (629
1,703
6871
1520
) 1,412
) (2
) 1,410
1780
) (26
1,562
4
105109
) (75
2001
) 5,6873,894
) 2,7791,520
101
) 13,981
) 8,0363,280
) 11,316
2,665
543912
1,210
(1(269
940
) 296305653646
(960
(1
(961
805845
(351
338
115
456469
(324
Change in%4Q/3Q2001
(445
(16–
(23
(478
(32
46
17135
–
–) –
–
(5201–
249
–
249
0–
) 508
59
)
12 months

Credit Suisse First Boston income statement 1)
in CHF m
Fixed IncomeEquityInvestment BankingFinancial Services GroupOther
Operating income
Personnel expenses Other operating expenses
Operating expenses
Gross operating profit
Depreciation of non-current assets Valuation adjustments, provisions and losses 2)
Profit before extraordinary items, acquisition-related costs, exceptional items, taxes
Extraordinary income/(expenses), net Taxes 3) 4)
Net operating profit before acquisition-related costs, exceptional items, minorities
Acquisition interest, net of tax Amortization of retention payments, net of tax Amortization of acquired intangible assets and goodwill, net of tax Exceptional items, net of tax
Net profit before minority interests
Minority interests
Net profit
Reconciliation to net operating profitAmortization of acquired intangible assets and goodwillExceptional itemsTax impact
Net operating profit 5)
Increased/(decreased) credit-related valuation adjustments 2)
Acquisition interestAmortization of retention paymentsTax impact
1) For further information on the presentation of business unit results, please refer to the “Overview of business unit results” on page 4, footnote 1). Certain reclassificationshave been made to prior-period amounts to conform to the current presentation. The business unit income statement differs from the presentation of the Group’s consoli-dated results in a) presenting operating income by division, b) including brokerage, execution and clearing expenses as part of other operating expenses in common withUS competitors rather than netted against operating income, c) excluding acquisition-related costs of acquisition interest, amortization of retention payments and amortiza-tion of acquired intangible assets and goodwill from operating income, personnel expenses and depreciation of non-current assets, respectively, and reporting these costs separately in the income statement, d) deducting minority interests from operating income and e) excluding exceptional items from operating income, personnelexpenses, depreciation of non-current assets and valuation adjustments, provisions and losses and reporting these exceptional items separately in the income statement. /2) Increased/decreased valuation adjustments taken at Group level resulting from the difference between the statistical and actual credit provisions. Business unit CreditSuisse First Boston recorded credit provisions of CHF 656 million (USD 387 million) in 4Q2001 and of CHF 800 million (USD 473 million) for 2001 in addition to thestatistically derived provision level due to substantial deterioration in the economic environment. / 3) Excluding tax impact on acquisition-related costs and exceptionalitems. / 4) Prior to 2001, deferred tax assets for net operating loss carry-forwards were not recorded. In 2001, the accounting policy was changed to allow such deferredtax assets to be recorded in the event of sales of businesses at a taxable gain, where the realization of the deferred tax assets is certain. The impact on the financial state-ments was a tax benefit of CHF 303 million (USD 179 million). Prior-period financial statements disclosed herein would be unchanged had they been prepared under thenew policy. / 5) Excluding amortization of acquired intangible assets and goodwill as well as exceptional items, all net of tax.
)
)
)
)
4Q2000
1,2421,7552,471
447597
6,512
3,2671,358
4,625
1,887
218164
1,505
0) (373
1,132
114118186
0
) 714
1
) 715
2280
) (42
) 901
28
175181
) (124
2000
4,8748,4776,148
447593
20,539
11,8303,634
15,464
5,075
644537
3,894
) 0) (1,050
2,844
114118254
0
) 2,358
) (3
) 2,355
2960
) (42
2,609
6
175181
) (124
2001
) 9,6116,5814,6962,569
172
) 23,629
) 13,5825,543
) 19,125
4,504
9191,541
2,044
(1(455
1,588
501515
1,1031,092
(1,623
(1
(1,624
1,3611,428(594
571
194
770792
(546
Change in%4Q/3Q2001
(42819-
(21
(4510
(29
51
19138
–
–) –
–
1232–
252
–
252
2–
) 518
60
)
4Q2001
1,5921,2131,016
627(108
4,340
1,9531,513
3,466
874
261810
(197
0120
(77
107142286
1,092
(1,704
(1
(1,705
3521,428(402
(327
112
164218
(133
3Q2001
2,7341,1201,002
577) 55
5,488
3,5331,375
4,908
580
219341
) 20
0(3
) 17
106115280
0
) (484
) 0
) (484
3450
) (65
) (204
82
163178
) (120
12 months
www.credit-suisse.com 21

REVIEW OF BUSINESS UNITS CREDIT SUISSE FIRST BOSTON
Credit Suisse First Boston balance sheet information
in CHF m
Total assets
Total assets in USD m
Due from banksof which securities lending and reverse repurchase agreements
Due from customersof which securities lending and reverse repurchase agreements
MortgagesSecurities and precious metals trading portfolio
Due to banksof which securities borrowing and repurchase agreements
Due to customers, otherof which securities borrowing and repurchase agreements
Credit Suisse First Boston key information
Based on CHF amounts
Cost/income ratio 1) 2) 3)
Cost/income ratio (operating) 1) 2) 3) 4)
Return on average allocated capital Return on average allocated capital (operating) 3) 4)
Return on average allocated capital (operating, excl. amortization of retention payments, net of tax) 2) 3) 4)
Average allocated capital in CHF m
Pre-tax margin 3)
Pre-tax margin (operating) 3) 4)
Pre-tax margin (operating, excl. amortization of retention payments) 2) 3) 4)
Personnel expenses/operating income 1) 2) 3) 5)
Number of employees
1) Excl. acquisition interest. / 2) Excl. amortization of retention payments. / 3) Excl. exceptional items. / 4) Excl. amortization of acquired intangible assets and goodwill. /5) Ratio excludes expenses for contractors.
31.12.00
669,758
409,738
220,174182,923116,39848,25819,566
192,301
371,033131,741102,43137,863
2000
79.9%78.4%
19.7%21.8%
22.8%
11,968
15.8%17.2%18.1%
55.4%
31.12.00
28,122
30.09.01
681,812
421,966
218,554167,205127,34554,88020,083
189,976
362,315140,458124,98561,878
2001
90.6%84.8%
(9.6%)3.4%
6.4%
16,913
(3.7%)2.0%5.4%
55.4%
30.09.01
27,623
31.12.01
679,813
405,762
206,530166,001126,22259,80616,348
205,016
349,713140,958121,97562,136
4Q2000
77.9%74.4%
) 20.7%) 26.1%
) 29.5%
13,799
) 14.1%) 17.6%) 20.4%
48.4%
31.12.01
25,152
3Q2001
99.7%93.4%
(11.3%(4.8%
(2.1%
17,069
(12.1%(5.8%(2.6%
61.8%
4Q2001
94.0%85.9%
(41.4%)(7.9%)
(4.5%)
16,456
(21.5%)(13.3%)(8.3%)
42.5%
12 months
Results also reflect higher credit provisions of USD 339million (CHF 577 million) in the fourth quarter, excludingArgentina and Enron, due to deteriorating credit marketconditions. Aggregate credit provisions for the full yeartotaled USD 718 million (CHF 1.2 billion). Non-perform-ing loans as a percentage of counterparty exposure roseto 1.6% and provision coverage of non-performing loansincreased to 59% at the end of the fourth quartercompared with 54% at the end of the third quarter.
Operating expenses dropped 32% in the fourth quar-ter compared with the third quarter, to USD 2.0 billion(CHF 3.5 billion). This decrease was due to lowerpersonnel costs resulting from the reduction in incentivecompensation costs – in line with reduced revenues – andto the classification of discretionary compensationexpenses of USD 340 million (CHF 575 million) associ-ated with the previously announced fourth quarter head-count reduction as an exceptional item rather than as
22
personnel expenses. Per capita incentive compensationdecreased 49% in 2001 compared with 2000.
Pre-tax exceptional items recorded in the fourth quar-ter 2001 comprise USD 745 million (CHF 1.3 billion)related to previously announced cost reduction initiativesand USD 100 million (CHF 169 million) for a settlementwith the US Securities and Exchange Commission andthe National Association of Securites Dealers Regulation,Inc. (NASDR) regarding their investigations into certainIPO allocation practices.

Exceptional items
pre-tax
Personnel expenses
Guarantees and retention awards for terminated employees in 2002 and 2003
Facilities charges
Exit charges for non-core businesses
IPO allocation settlement
Total
in USD m
466
117
103
59
100
845
in CHF m
787
198
174
100
169
1,428
The Fixed Income division’s fourth quarter revenues ofUSD 914 million (CHF 1.6 billion) declined 44%compared with the third quarter. The developed marketsrates business had the steepest revenue decline afterrecord revenues in the third quarter. Revenues were alsonegatively impacted by a contraction in market opportuni-ties for the US government bond and proprietary tradingdesks due to less volatility in the fourth quarter.
Compared with the third quarter, Equity division fourthquarter revenues increased by 5% to USD 699 million(CHF 1.2 billion). Improvements in cash customer busi-nesses worldwide and in capital markets areas werepartially offset by declines from equity derivatives, in partdue to the Enron failure. The Equity division benefitedfrom some positive momentum resulting from the stimu-lus of interest rate cuts in the US and Europe and fromincreases in several major global market indices, thoughslowing economic growth continued to affect equitymarkets. According to Institutional Investor, the division’sresearch team was ranked number three globally for2001 versus seven in 2000. Additionally, the Europeanand Americas teams were ranked number two.
Fourth quarter revenues in the Financial Servicesdivision were USD 364 million (CHF 627 million), up 6%compared with the third quarter due to the improvementin the equity markets. In line with its strategy to divestbusinesses that do not fit into its core activities, CreditSuisse First Boston announced the sale of its CSFBdirectbusiness and its brokerage service subsidiaryAutranet, Inc. in the fourth quarter. The sales, whichclosed during the first quarter of 2002, producedaggregate proceeds of approximately USD 660 million(CHF 1.1 billion). The combined 2001 revenues of thoseoperations were USD 151 million (CHF 255 million)
versus operating expenses of USD 215 million (CHF 363million). Assets under management, including PrivateEquity assets held on behalf of clients, totaled USD103.5 billion (CHF 173.4 billion) as of December 31,2001, with USD 9.6 billion (CHF 16.3 billion) in net newassets in 2001.
The Investment Banking division’s fourth quarterrevenues of USD 589 million (CHF 1.0 billion) decreased1% compared with the third quarter. Increases in newissuance fees were offset by declines in fees from merg-ers and acquisitions and leveraged finance. After a slowthird quarter, the equity new issuance volume increasedduring the fourth quarter. Credit Suisse First Bostonretained its global equity new issuance ranking of numberfive while its US equity new issuance ranking improved tothird place from fifth at the end of the third quarter. Theglobal debt new issuance ranking improved by one posi-tion from the end of the third quarter to number three,and the global high yield ranking remained at numberone. Credit Suisse First Boston ranked number threeglobally in terms of capital raising for clients in 2001.
The Private Equity business recorded net realized andunrealized losses of USD 97 million (CHF 167 million) inthe fourth quarter, compared with net realized and unreal-ized losses of USD 161 million (CHF 269 million) duringthe first nine months of the year. The total pre-tax loss forthe Private Equity business amounted to USD 138 million(CHF 235 million), compared to a pre-tax loss of USD226 million (CHF 380 million) during the first nine monthsof the year. The book value of all Private Equity invest-ments stood at USD 2.2 billion (CHF 3.7 billion) and fairvalue at USD 2.3 billion (CHF 3.9 billion) as of December31, 2001.
www.credit-suisse.com 23

CONSOLIDATED RESULTS CREDIT SUISSE GROUP
Consolidated income statement1)
in CHF m
Interest and discount incomeInterest and dividend income from trading portfoliosInterest and dividend income from financial investmentsInterest expenses
Net interest income
Commission income from lending activitiesCommission income from securities and investment transactionsCommission income from other servicesCommission expenses
Net commission and service fee income
Net trading income
Premiums earned, netClaims incurred and actuarial provisionsCommission expenses, netInvestment income from the insurance business
Net income from the insurance business
Income from the sale of financial investmentsIncome from investments in associatesIncome from other non-consolidated participationsReal estate incomeSundry ordinary incomeSundry ordinary expenses
Other ordinary income/(expenses), net
Operating income
Personnel expensesOther operating expenses
Operating expenses
Gross operating profit
Depreciation of non-current assetsAmortization of acquired intangible assetsAmortization of goodwillValuation adjustments, provisions and losses from the banking business
Depreciation, valuation adjustments and losses
Profit before extraordinary items, taxes and minority interests
Extraordinary incomeExtraordinary expensesTaxes 2)
Net profit before minority interests
Minority interests
Net profit
1) Certain reclassifications have been made to prior-period amounts to conform to the current presentation. / 2) Prior to 2001, deferred tax assets for net operating losscarry-forwards were not recorded. In 2001, the accounting policy was changed to allow such deferred tax assets to be recorded in the event of sales of businesses at ataxable gain, where the realization of the deferred tax assets is certain. The impact on the financial statements was a tax benefit of CHF 303 m (USD 179 m). Prior-periodfinancial statements disclosed herein would be unchanged had they been prepared under the new policy.
Change from2000 in%
(563
(27) 6
27
94
112) 16
8
4
12) 3) (3
(31
2
12(173322
(12) 56
–
5
1826
20
(27
62405213105
110
(72
(50) (84) (64
(70
) (4
(73
)
)
))
)
)
)
)
)))
)
)
)
2000
30,1818,021
706) (33,595
5,313
71716,039
669) (829
16,596
8,791
28,690) (28,900) (2,113
8,489
6,166
1,02319918
1401,243
) (2,258
) 365
37,231
18,5036,645
25,148
12,083
1,353157246
1,265
3,021
9,062
105) (1,796) (1,349
6,022
) (237
5,785
2001
28,68713,078
514) (35,528
6,751
78016,6091,421
) (965
17,845
9,183
32,195) (29,731) (2,040
5,876
6,300
1,14616624
1711,091
) (3,523
(925
39,154
21,8908,394
30,284
8,870
2,186793770
2,592
6,341
2,529
52) (281
(486
1,814
) (227
1,587
4Q2000
9,3292,437
171) (10,383
1,554
2374,544
330) (110
5,001
1,615
7,691) (7,335) (539
2,073
1,890
631810
42337
) (519
) 572
10,632
5,1542,308
7,462
3,170
407157103425
1,092
) 2,078
54) (1,612) 139
) 659
) (69
) 590
3Q2001
7,0143,412
168) (8,599
1,995
2403,654
308) (249
3,953
1,998
6,756) (5,014) (454
16
1,304
406254
48121
) (1,134
) (530
8,720
5,2761,954
7,230
1,490
502197190653
1,542
) (52
) 7) (1
(117
) (163
(136
) (299
4Q2001
5,1273,050
133(6,705
1,605
1584,040
374(261
4,311
920
8,628(8,375
(4591,783
1,577
56590
49461
(877
(252
8,161
4,6252,272
6,897
1,264
699203224
1,289
2,415
(1,151
(7(250538
(870
40
(830
12 months
24

Consolidated balance sheet
in CHF m
AssetsCash and other liquid assetsMoney market papersDue from banksReceivables from the insurance businessDue from customersMortgagesSecurities and precious metals trading portfoliosFinancial investments from the banking businessInvestments from the insurance businessNon-consolidated participationsTangible fixed assetsIntangible assetsAccrued income and prepaid expensesOther assets
Total assets
Subordinated assetsReceivables due from non-consolidated participations
Liabilities and shareholders’ equityMoney market papers issuedDue to banksPayables from the insurance businessDue to customers in savings and investment depositsDue to customers, otherMedium-term notes (cash bonds)Bonds and mortgage-backed bondsAccrued expenses and deferred incomeOther liabilitiesValuation adjustments and provisionsTechnical provisions for the insurance business
Total liabilities
Reserve for general banking risksShare capitalCapital reserveRevaluation reserves for the insurance businessReserve for own sharesRetained earningsMinority interestsNet profit
Total shareholders’ equity
Total liabilities and shareholders’ equity
Subordinated liabilitiesLiabilites due to non-consolidated participations
1) Certain reclassifications have been made to prior-year amounts to conform to the current presentation.
Change from1) 31.12.00 in %
66
(720905
46(11
(5(21117
4
(68(64
(17(735(223(624(9(2
(135
4
0(40
1(8431216021
(73
(11
4
(441
)
)
))
))
))
)
)
)))
)
)
)
)
)
31.12.00
2,92830,127
218,5219,871
170,42892,432
198,91725,574
132,6321,8299,913
23,29916,29454,668
987,433
4,876771
23,176359,441
8,80739,233
213,5493,225
65,52428,02157,65313,107
132,175
943,911
2,3196,009
19,2824,789
6002,1672,5715,785
43,522
987,433
21,801779
30.09.01
2,27331,388
216,5439,597
184,11495,635
193,54131,902
124,6991,9599,427
22,89518,89263,197
1,006,062
2,468587
20,412354,873
8,09137,307
244,0383,078
74,57025,63757,01210,996
132,111
968,125
2,3193,589
19,436382
2,4695,1582,1672,417
37,937
1,006,062
22,064954
31.12.01
3,09232,027
203,78511,823
186,15192,655
208,37437,306
131,2911,8469,422
22,85018,09563,796
1,022,513
1,578276
19,252335,93211,86438,547
261,7523,019
81,50525,51256,49311,362
138,354
983,592
2,3193,590
19,446749
2,4695,6403,1211,587
38,921
1,022,513
20,8921,098
www.credit-suisse.com 25

CONSOLIDATED RESULTS CREDIT SUISSE GROUP
Off-balance sheet and fiduciary businessin CHF m
Credit guarantees in form of avals, guarantees and indemnity liabilitiesBid bonds, delivery and performance bonds, letters of indemnity,
other performance-related guarantees Irrevocable commitments in respect of documentary creditsOther contingent liabilities
Contingent liabilities
Irrevocable commitmentsLiabilities for calls on shares and other equity instrumentsConfirmed credits
Total off-balance sheet
Fiduciary transactions
1) Including credit guarantees of securities lent as arranger of CHF 21,148 m.
Derivative instruments
in CHF bn
Interest rate productsForeign exchange productsPrecious metals productsEquity/index-related productsOther products
Total derivative instruments
1) Including replacement values for traded derivatives (futures and traded options) subject to daily margining requirements. Total positive and negative replacement values oftraded derivatives amount to CHF 1.8 bn (December 31, 2000: CHF 2.0 bn) and CHF 0.6 bn (December 31, 2000: CHF 1.6 bn) respectively.
Selected notes
Currency translation rates
in CHF
1 USD1 EUR1 GBP
100 JPY
Securities and precious metals trading portfoliosin CHF m
Listed on stock exchangeUnlisted
Debt instruments
of which own bonds and medium-term notesListed on stock exchangeUnlisted
Equity instruments
of which own sharesPrecious metals
Total securities and precious metals trading portfolios
of which securities rediscountable or pledgeable with central banks
¨31.12.00
1) 7,013
4,8243,1425,026
20,005
126,998305150
147,458
41,974
Negative grossreplacement
1) value31.12.00
66.432.12.0
19.63.3
123.4
31.12.00
1.63461.52422.44421.4252
31.12.00
63,68465,678
129,362
83759,4548,081
67,535
7,4742,020
198,917
72,618
1)
))
)
))
)
31.12.01
29,789
5,0563,2575,484
43,586
129,86479476
174,320
41,448
Positive grossreplacement
value31.12.00
66.430.41.5
17.12.8
118.2
30.09.01
1.61581.47822.37701.3548
31.12.01
66,30891,434
157,742
1,03744,2025,123
49,325
4,4101,307
208,374
77,306
Nominal1) value
31.12.00
5,793.31,139.4
34.8473.980.4
7,521.8
31.12.01
1.67541.48242.42821.2759
Negative grossreplacement
1) value31.12.01
98.740.21.8
13.63.5
157.8
4Q2000
1.671.542.531.55
Positive grossreplacement
value31.12.01
97.039.61.3
14.13.5
155.5
3Q2001
1.681.512.421.39
Nominalvalue
31.12.01
9,120.81,936.3
29.5393.9120.7
11,601.2
4Q2001
1.691.512.431.39
Average rate year-to-date Closing rate as of
26

Income statement of the banking and insurance business 1)
in CHF m
Net interest incomeNet commission and service fee incomeNet trading incomeNet income from the insurance business 2)
Other ordinary income/(expenses), net
Operating income
Personnel expenses 2)
Other operating expenses 2)
Operating expenses
Gross operating profit
Depreciation of non-current assetsAmortization of acquired intangible assetsAmortization of goodwillValuation adjustments, provisions and losses from the banking business
Depreciation, valuation adjustments and losses
Profit before extraordinary items, taxes and minority interests
Extraordinary incomeExtraordinary expensesTaxes
Net profit before minority interests
Minority interests
Net profit
1) Income statements for the banking and insurance business are presented on a stand-alone basis. / 2) Insurance business: expenses due to the handling of both claimsand investments are allocated to the income from the insurance business, of which: CHF 599 m (2000: CHF 525 m) are related to personnel expenses and CHF 371 m(2000: CHF 355 m) to other operating expenses.
Statement of shareholders’ equityin CHF m
At beginning of financial yearRepayment out of share capital Dividends paidDividends paid to minority interestsCapital increases, par value and capital surplusCancellation of repurchased sharesChanges in scope of consolidation affecting minority interestsForeign exchange impactChange in revaluation reserves from the insurance business, netChange in reserve for general banking risks, netMinority interests in net profitNet profit
At end of financial year
))
)
31.12.00
30,683) 0) (1,931) (55
9,627) 0) 189
(703) (498
188237
5,785
43,522
31.12.01
43,522(2,392
(14(161
1,160(569(253112
(4,2980
2271,587
38,921
))
))
2001
6,68017,8669,183
–(538
33,191
19,7526,853
26,605
6,586
1,667793697
2,592
5,749
837
52(50
(108
731
(179
552
2000
5,23916,6298,791
–) 1,046
31,705
16,4995,279
21,778
9,927
1,092157215
1,265
2,729
7,198
105) (1,796) (943
4,564
) (91
4,473
2001
–––
6,352(380
5,972
2,1381,547
3,685
2,287
5190
73–
592
1,695
0) (231) (378
1,086
) (48
1,038
2000
–––
6,197) (666
5,531
2,0041,366
3,370
2,161
2610
31–
292
1,869
0) 0) (406
1,463
) (146
1,317
2001
6,75117,8459,1836,300
) (925
39,154
21,8908,394
30,284
8,870
2,186793770
2,592
6,341
2,529
52(281
) (486
1,814
) (227
1,587
2000
5 31316,5968,7916,166
) 365
37,231
18,5036,645
25,148
12,083
1,353157246
1,265
3,021
9,062
105) (1,796) (1,349
6,022
) (237
5,785
Banking business Insurance business Credit Suisse Group
www.credit-suisse.com 27
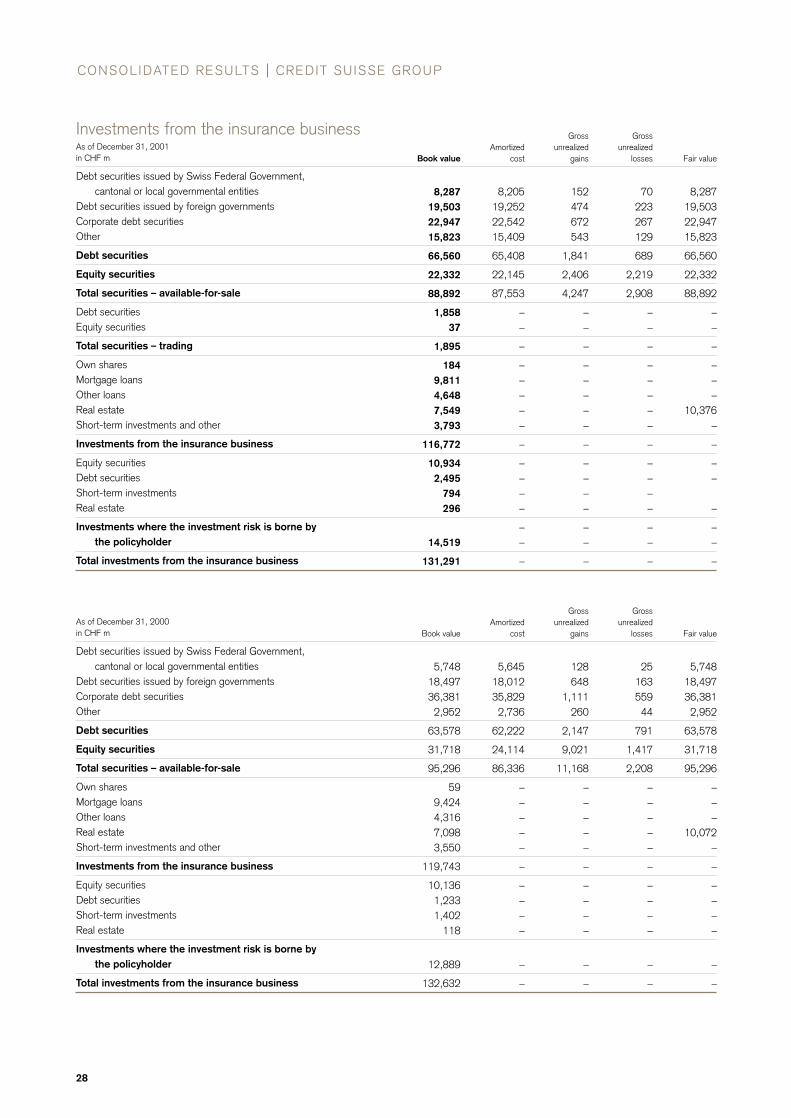
Fair ValueNew basis1)
Dec. 1999in CHF m
16,59344,193
60,786
7,04822,199
29,247
2,2097,903
10,112
CONSOLIDATED RESULTS CREDIT SUISSE GROUP
Investments from the insurance businessAs of December 31, 2001in CHF m
Debt securities issued by Swiss Federal Government, cantonal or local governmental entities
Debt securities issued by foreign governmentsCorporate debt securitiesOther
Debt securities
Equity securities
Total securities – available-for-sale
Debt securitiesEquity securities
Total securities – trading
Own sharesMortgage loansOther loansReal estateShort-term investments and other
Investments from the insurance business
Equity securitiesDebt securitiesShort-term investmentsReal estate
Investments where the investment risk is borne by the policyholder
Total investments from the insurance business
As of December 31, 2000in CHF m
Debt securities issued by Swiss Federal Government, cantonal or local governmental entities
Debt securities issued by foreign governmentsCorporate debt securitiesOther
Debt securities
Equity securities
Total securities – available-for-sale
Own sharesMortgage loansOther loansReal estateShort-term investments and other
Investments from the insurance business
Equity securitiesDebt securitiesShort-term investmentsReal estate
Investments where the investment risk is borne by the policyholder
Total investments from the insurance business
Fair value
8,28719,50322,94715,823
66,560
22,332
88,892
––
–
–––
10,376 –
–
––
–
––
–
Fair value
5,74818,49736,3812,952
63,578
31,718
95,296
–––
10,072–
–
––––
–
–
31Grossunrealized
losses
70223267129
689
2,219
2,908
––
–
–––––
–
––––
––
–
Grossunrealized
losses
2516355944
791
1,417
2,208
–––––
–
––––
–
–
Grossunrealized
gains
152474672543
1,841
2,406
4,247
––
–
–––––
–
––––
––
–
Gross unrealized
gains
128648
1,111260
2,147
9,021
11,168
–––––
–
––––
–
–
Amortized cost
8,20519,25222,54215,409
65,408
22,145
87,553
––
–
–––––
–
––––
––
–
Amortized cost
5,64518,01235,8292,736
62,222
24,114
86,336
–––––
–
––––
–
–
Book value
8,28719,50322,94715,823
66,560
22,332
88,892
1,85837
1,895
1849,8114,6487,5493,793
116,772
10,9342,495
794296
14,519
131,291
Book value
5,74818,49736,3812,952
63,578
31,718
95,296
599,4244,3167,0983,550
119,743
10,1361,2331,402
118
12,889
132,632
28
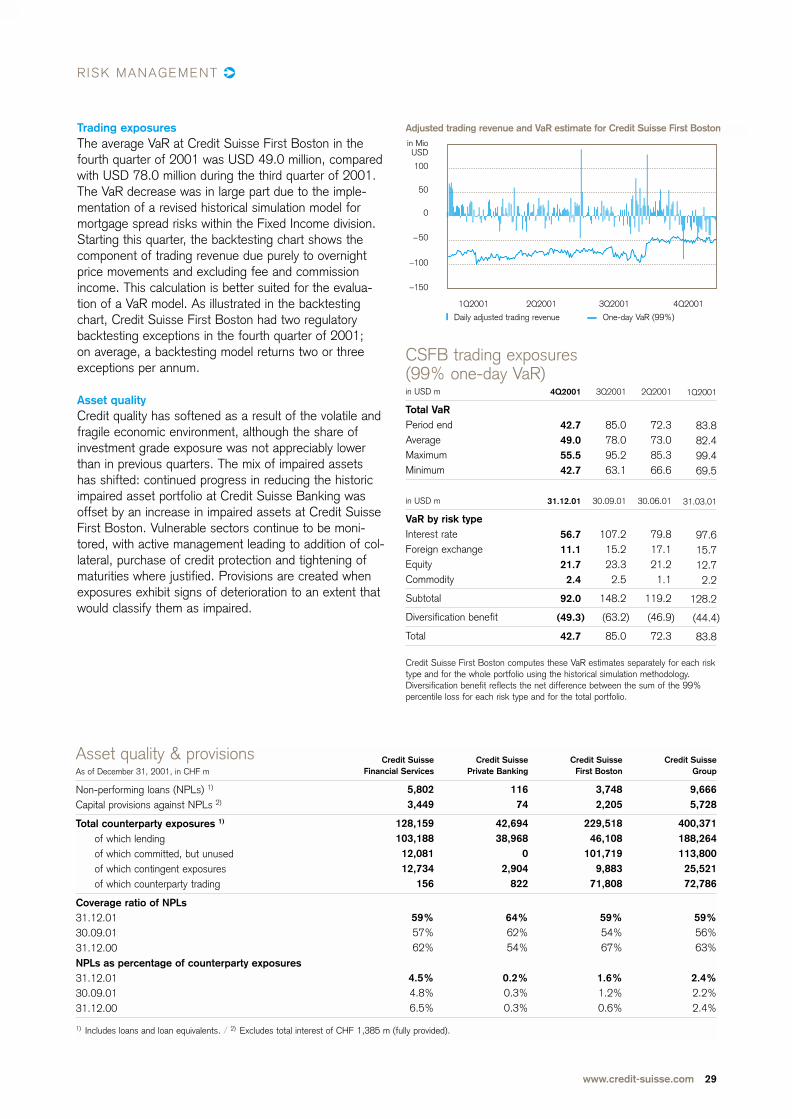
1 Editorial 2 Financial highlights Q4/2001 4 An overview of Credit Suisse Group 8 Review of business units 8 Credit Suisse Financial Services 16 Credit Suisse Private Banking 18 Credit Suisse Asset Management 20 Credit Suisse First Boston 24 Consolidated results Credit Suisse Group 24 Consolidated income statement 25 Consolidated balance sheet 26 Off-balance sheet and fiduciary business 26 Selected notes 29 Risk Management Information for investors
Cautionary Statement Regarding Forward-Looking InformationThis communication may contain projections or other forward-looking statements related to Credit Suisse Group that involve risks and uncertainties. Readers arecautioned that these statements are only projections and may differ materially from actual future results or events. Readers are referred to the documents filed by CreditSuisse Group with the SEC, specifically the most recent filing on Form 20-F, which identify important risk factors that could cause actual results to differ from thosecontained in the forward-looking statements, including, among other things, risks relating to market fluctuations and volatility, significant interest rate changes, creditexposures, cross border transactions and foreign exchange fluctuations, impaired liquidity, competition and legal liability. All forward-looking statements are based oninformation available to Credit Suisse Group on the date of its posting and Credit Suisse Group assumes no obligation to update such statements unless otherwiserequired by applicable law.
Credit Suisse Group is a leading global financial services company headquartered in Zurich.
Credit Suisse Financial Services provides private clients and small and medium-sized companies with private
banking and financial advisory services, banking products, and pension and insurance solutions from
Winterthur. Credit Suisse First Boston, the investment bank, serves global institutional, corporate, govern-
ment and individual clients in its role as a financial intermediary. Credit Suisse Group’s registered shares
(CSGN) are listed in Zurich and London on the SWX Swiss Exchange/virt-x, Frankfurt and Tokyo, and in
the form of American Depositary Shares (CSR) in New York. The Group employs around 80,000 staff
worldwide. As of December 31, 2001, it reported assets under management of CHF 1,425.5 billion.
The Financial Report comprising the Group’s consolidated financial statements and the parent company financial statements as of December 31, 2001, is availablein English on the Internet.
Credit Suisse Group’s Annual Report 2001 will be available from May 6, 2002, in English and German.
R ISK MANAGEMENT
This symbol is used to indicate topics on which further information is available on our website. Go to www.credit-suisse.com/q4results2001/bookmarks.html to findlinks to the relevant information. This additional information indicated is openly accessible and does not form part of the Quarterly Review. Some areas of CreditSuisse Group’s websites are only available in English.
Trading exposures The average VaR at Credit Suisse First Boston in thefourth quarter of 2001 was USD 49.0 million, comparedwith USD 78.0 million during the third quarter of 2001.The VaR decrease was in large part due to the imple-mentation of a revised historical simulation model formortgage spread risks within the Fixed Income division.Starting this quarter, the backtesting chart shows thecomponent of trading revenue due purely to overnightprice movements and excluding fee and commissionincome. This calculation is better suited for the evalua-tion of a VaR model. As illustrated in the backtestingchart, Credit Suisse First Boston had two regulatorybacktesting exceptions in the fourth quarter of 2001; on average, a backtesting model returns two or threeexceptions per annum.
Asset qualityCredit quality has softened as a result of the volatile andfragile economic environment, although the share ofinvestment grade exposure was not appreciably lowerthan in previous quarters. The mix of impaired assetshas shifted: continued progress in reducing the historicimpaired asset portfolio at Credit Suisse Banking wasoffset by an increase in impaired assets at Credit SuisseFirst Boston. Vulnerable sectors continue to be moni-tored, with active management leading to addition of col-lateral, purchase of credit protection and tightening ofmaturities where justified. Provisions are created whenexposures exhibit signs of deterioration to an extent thatwould classify them as impaired.
1Q2001 2Q2001 3Q2001 4Q2001
Daily adjusted trading revenue One-day VaR (99%)
in Mio USD
100
50
0
–50
–100
–150
Adjusted trading revenue and VaR estimate for Credit Suisse First Boston
CSFB trading exposures (99% one-day VaR)in USD m
Total VaRPeriod endAverageMaximumMinimum
in USD m
VaR by risk typeInterest rateForeign exchangeEquityCommodity
Subtotal
Diversification benefit
Total
Credit Suisse First Boston computes these VaR estimates separately for each risktype and for the whole portfolio using the historical simulation methodology.Diversification benefit reflects the net difference between the sum of the 99%percentile loss for each risk type and for the total portfolio.
1Q2001
83.882.499.469.5
31.03.01
97.615.712.72.2
128.2
) (44.4
83.8
)
2Q2001
72.373.085.366.6
30.06.01
79.817.121.21.1
119.2
) (46.9
72.3
3Q2001
85.078.095.263.1
30.09.01
107.215.223.32.5
148.2
) (63.2
85.0
4Q2001
42.749.055.542.7
31.12.01
56.711.121.72.4
92.0
(49.3
42.7
Asset quality & provisionsAs of December 31, 2001, in CHF m
Non-performing loans (NPLs) 1)
Capital provisions against NPLs 2)
Total counterparty exposures 1)
of which lendingof which committed, but unusedof which contingent exposuresof which counterparty trading
Coverage ratio of NPLs31.12.0130.09.0131.12.00NPLs as percentage of counterparty exposures31.12.0130.09.0131.12.00
1) Includes loans and loan equivalents. / 2) Excludes total interest of CHF 1,385 m (fully provided).
Credit SuisseGroup
9,6665,728
400,371188,264113,80025,52172,786
59%56%63%
2.4%2.2%2.4%
Credit SuisseFirst Boston
3,7482,205
229,51846,108
101,7199,883
71,808
59%54%67%
1.6%1.2%0.6%
Credit SuissePrivate Banking
11674
42,69438,968
02,904
822
64%62%54%
0.2%0.3%0.3%
Credit SuisseFinancial Services
5,8023,449
128,159103,18812,08112,734
156
59%57%62%
4.5%4.8%6.5%
www.credit-suisse.com 29
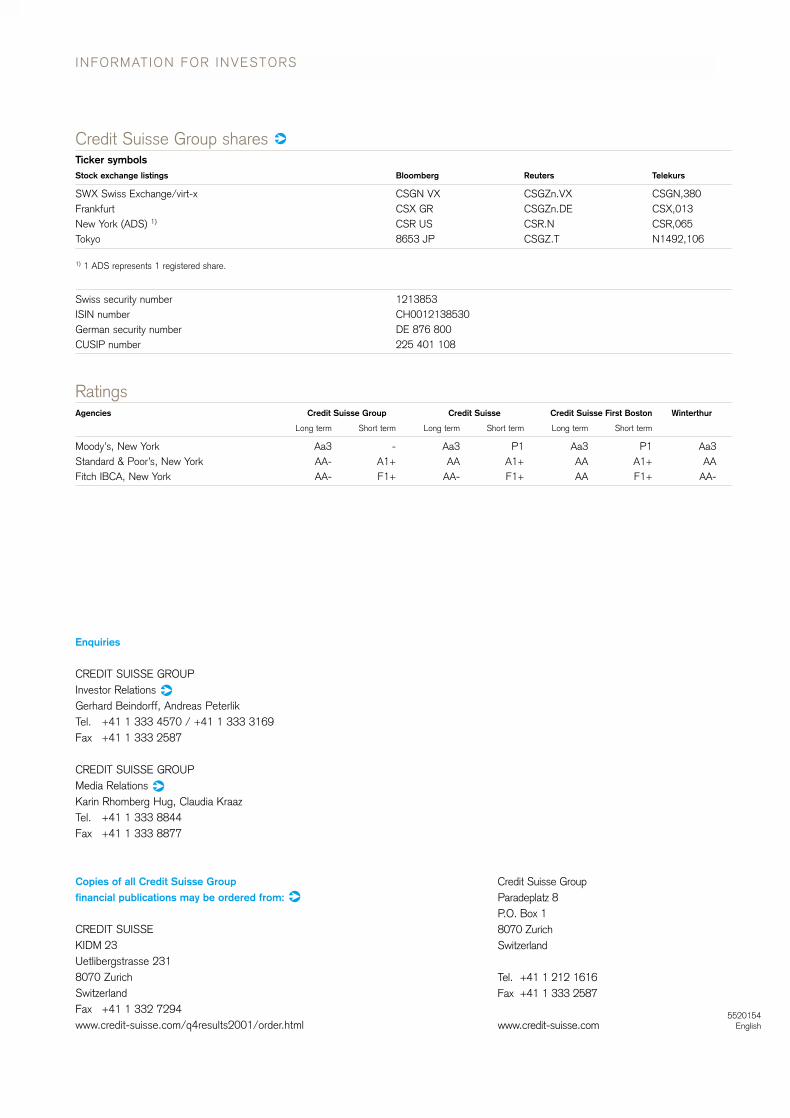
QUARTERLY REVIEW 2001 Q4
INFORMATION FOR INVESTORS
Credit Suisse Group shares Ticker symbolsStock exchange listings Bloomberg Reuters Telekurs
SWX Swiss Exchange/virt-x CSGN VX CSGZn.VX CSGN,380Frankfurt CSX GR CSGZn.DE CSX,013New York (ADS) 1) CSR US CSR.N CSR,065Tokyo 8653 JP CSGZ.T N1492,106
1) 1 ADS represents 1 registered share.
Swiss security number 1213853 ISIN number CH0012138530 German security number DE 876 800CUSIP number 225 401 108
RatingsAgencies Credit Suisse Group Credit Suisse Credi Credit Suisse First Boston Winterthur
Long term Short term Long term Short term Long term Short term
Moody’s, New York Aa3 - Aa3 P1 Aa3 P1 Aa3Standard & Poor’s, New York AA- A1+ AA A1+ AA A1+ AAFitch IBCA, New York AA- F1+ AA- F1+ AA F1+ AA-
5520154English
Enquiries
CREDIT SUISSE GROUPInvestor Relations Gerhard Beindorff, Andreas PeterlikTel. +41 1 333 4570 / +41 1 333 3169Fax +41 1 333 2587
CREDIT SUISSE GROUPMedia Relations Karin Rhomberg Hug, Claudia KraazTel. +41 1 333 8844 Fax +41 1 333 8877
Copies of all Credit Suisse Group
financial publications may be ordered from:
CREDIT SUISSEKIDM 23Uetlibergstrasse 2318070 ZurichSwitzerlandFax +41 1 332 7294www.credit-suisse.com/q4results2001/order.html
Credit Suisse GroupParadeplatz 8 P.O. Box 1 8070 Zurich Switzerland
Tel. +41 1 212 1616 Fax +41 1 333 2587
www.credit-suisse.com