cricket world cup 2015 ltd - pwc · pdf filebetween cricket world cup 2015 ltd, cricket...
TRANSCRIPT

June 2015
PwC
Page
1 Executive summary 3
2 Introduction and background 8
3 Economic impacts 12
4 Broader benefits 24
Appendices
Appendix A Economic modelling approach 30
Appendix B Australian and New Zealand results 39
Appendix C Australian results by state/territory 41
Appendix D New Zealand results by key regions 60
Report Disclaimer
This report has been prepared by PricewaterhouseCoopers Australia (PwC) at the request of CricketWorld Cup 2015 Ltd, Cricket Australia and New Zealand Cricket in our capacity as advisors in accordancewith the Terms of Reference and the Terms and Conditions contained in the Consultant Agreementbetween Cricket World Cup 2015 Ltd, Cricket Australia, New Zealand Cricket and PwC. This document isnot intended to be utilised or relied upon by any persons other than Cricket World Cup 2015 Ltd, CricketAustralia and New Zealand Cricket nor to be used for any purpose other than that articulated above.Accordingly, PwC accepts no responsibility in any way whatsoever for the use of this report by any otherpersons or for any other purpose.
The information, statements, statistics and commentary (together the ‘Information’) contained in this reporthave been prepared by PwC (and its subcontractors) from material obtained from third-party dataproviders, public sources and interviews. PwC (and its subcontractors) have not sought any independentconfirmation of the reliability, accuracy or completeness of this information. It should not be construed thatPwC (and its subcontractors) have carried out any form of audit of the information which has been reliedupon. Accordingly, whilst the statements made in this report are given in good faith, PwC accepts noresponsibility for any errors in the information provided by Cricket World Cup 2015 Ltd, Cricket Australiaand New Zealand Cricket or other parties nor the effect of any such errors on our analysis, suggestions orreport.
4
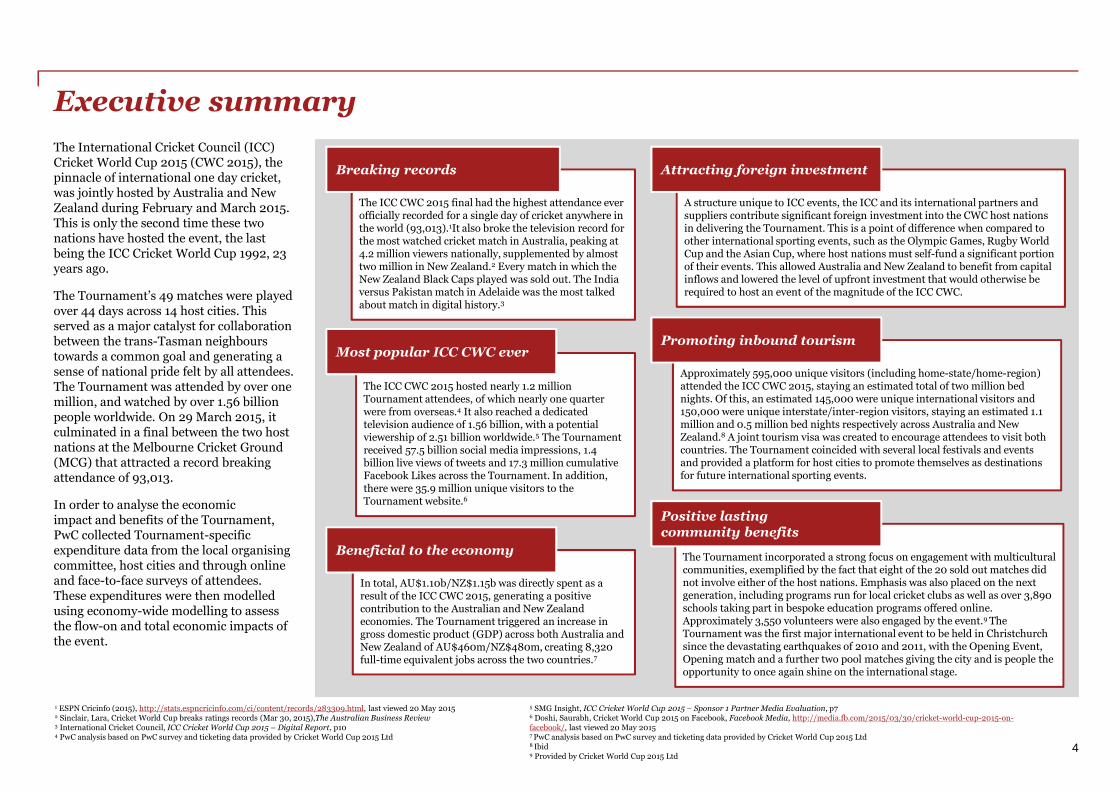
The International Cricket Council (ICC)Cricket World Cup 2015 (CWC 2015), thepinnacle of international one day cricket,was jointly hosted by Australia and NewZealand during February and March 2015.This is only the second time these twonations have hosted the event, the lastbeing the ICC Cricket World Cup 1992, 23years ago.
The Tournament’s 49 matches were playedover 44 days across 14 host cities. Thisserved as a major catalyst for collaborationbetween the trans-Tasman neighbourstowards a common goal and generating asense of national pride felt by all attendees.The Tournament was attended by over onemillion, and watched by over 1.56 billionpeople worldwide. On 29 March 2015, itculminated in a final between the two hostnations at the Melbourne Cricket Ground(MCG) that attracted a record breakingattendance of 93,013.
In order to analyse the economicimpact and benefits of the Tournament,PwC collected Tournament-specificexpenditure data from the local organisingcommittee, host cities and through onlineand face-to-face surveys of attendees.These expenditures were then modelledusing economy-wide modelling to assessthe flow-on and total economic impacts ofthe event.
Executive summary
The ICC CWC 2015 final had the highest attendance everofficially recorded for a single day of cricket anywhere inthe world (93,013).1It also broke the television record forthe most watched cricket match in Australia, peaking at4.2 million viewers nationally, supplemented by almosttwo million in New Zealand.2 Every match in which theNew Zealand Black Caps played was sold out. The Indiaversus Pakistan match in Adelaide was the most talkedabout match in digital history.3
Breaking records
The ICC CWC 2015 hosted nearly 1.2 millionTournament attendees, of which nearly one quarterwere from overseas.4 It also reached a dedicatedtelevision audience of 1.56 billion, with a potentialviewership of 2.51 billion worldwide.5 The Tournamentreceived 57.5 billion social media impressions, 1.4billion live views of tweets and 17.3 million cumulativeFacebook Likes across the Tournament. In addition,there were 35.9 million unique visitors to theTournament website.6
Most popular ICC CWC ever
A structure unique to ICC events, the ICC and its international partners andsuppliers contribute significant foreign investment into the CWC host nationsin delivering the Tournament. This is a point of difference when compared toother international sporting events, such as the Olympic Games, Rugby WorldCup and the Asian Cup, where host nations must self-fund a significant portionof their events. This allowed Australia and New Zealand to benefit from capitalinflows and lowered the level of upfront investment that would otherwise berequired to host an event of the magnitude of the ICC CWC.
Attracting foreign investment
Approximately 595,000 unique visitors (including home-state/home-region)attended the ICC CWC 2015, staying an estimated total of two million bednights. Of this, an estimated 145,000 were unique international visitors and150,000 were unique interstate/inter-region visitors, staying an estimated 1.1million and 0.5 million bed nights respectively across Australia and NewZealand.8 A joint tourism visa was created to encourage attendees to visit bothcountries. The Tournament coincided with several local festivals and eventsand provided a platform for host cities to promote themselves as destinationsfor future international sporting events.
Promoting inbound tourism
In total, AU$1.10b/NZ$1.15b was directly spent as aresult of the ICC CWC 2015, generating a positivecontribution to the Australian and New Zealandeconomies. The Tournament triggered an increase ingross domestic product (GDP) across both Australia andNew Zealand of AU$460m/NZ$480m, creating 8,320full-time equivalent jobs across the two countries.7
Beneficial to the economyThe Tournament incorporated a strong focus on engagement with multiculturalcommunities, exemplified by the fact that eight of the 20 sold out matches didnot involve either of the host nations. Emphasis was also placed on the nextgeneration, including programs run for local cricket clubs as well as over 3,890schools taking part in bespoke education programs offered online.Approximately 3,550 volunteers were also engaged by the event.9 TheTournament was the first major international event to be held in Christchurchsince the devastating earthquakes of 2010 and 2011, with the Opening Event,Opening match and a further two pool matches giving the city and is people theopportunity to once again shine on the international stage.
Positive lastingcommunity benefits
1 ESPN Cricinfo (2015), http://stats.espncricinfo.com/ci/content/records/283309.html, last viewed 20 May 20152 Sinclair, Lara, Cricket World Cup breaks ratings records (Mar 30, 2015),The Australian Business Review3 International Cricket Council, ICC Cricket World Cup 2015 – Digital Report, p104 PwC analysis based on PwC survey and ticketing data provided by Cricket World Cup 2015 Ltd
5 SMG Insight, ICC Cricket World Cup 2015 – Sponsor 1 Partner Media Evaluation, p76 Doshi, Saurabh, Cricket World Cup 2015 on Facebook, Facebook Media, http://media.fb.com/2015/03/30/cricket-world-cup-2015-on-facebook/, last viewed 20 May 20157 PwC analysis based on PwC survey and ticketing data provided by Cricket World Cup 2015 Ltd8 Ibid9 Provided by Cricket World Cup 2015 Ltd
1.2m
0.2m
1.0m
Tournament attendance
Executive summary (cont’d)
Australia and New Zealand - Visitation
5
1.56 billiontelevision audience
615k
290k
270k
Tournament attendance byresidential origin
Interstate/Inter-region
Home-state/Home-
region
International
1.2m
300k
150k
145k
Unique visitors
595k
0.4m
0.5m
1.1m
Bed nights
2.0m
Home-state/Home-
region
Interstate/Inter-region
International
International
Interstate/Inter-region
Home-state/Home-region
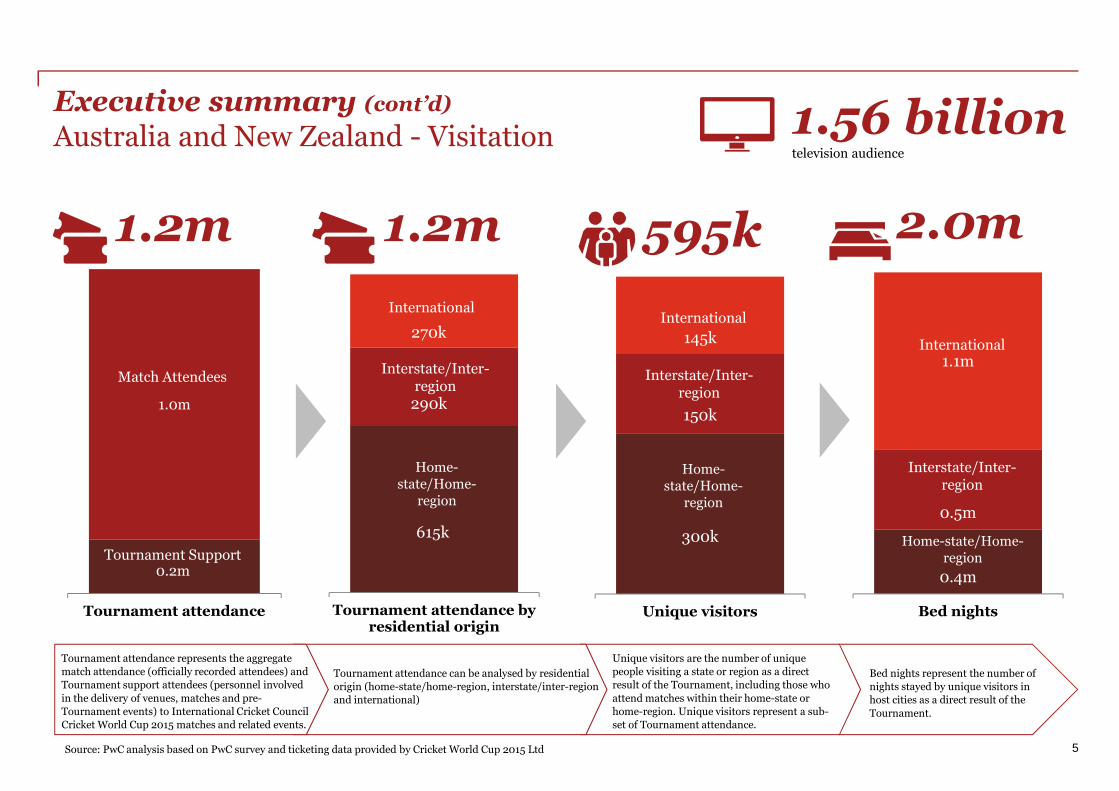
Tournament attendance represents the aggregatematch attendance (officially recorded attendees) andTournament support attendees (personnel involved
in the delivery of venues, matches and pre-Tournament events) to International Cricket CouncilCricket World Cup 2015 matches and related events.
Tournament attendance can be analysed by residentialorigin (home-state/home-region, interstate/inter-regionand international)
Unique visitors are the number of uniquepeople visiting a state or region as a directresult of the Tournament, including those who
attend matches within their home-state orhome-region. Unique visitors represent a sub-set of Tournament attendance.
Bed nights represent the number ofnights stayed by unique visitors inhost cities as a direct result of the
Tournament.
Source: PwC analysis based on PwC survey and ticketing data provided by Cricket World Cup 2015 Ltd
Tournament Support
Match Attendees
Total directexpenditure
Incrementalexpenditure
Executive summary (cont’d)
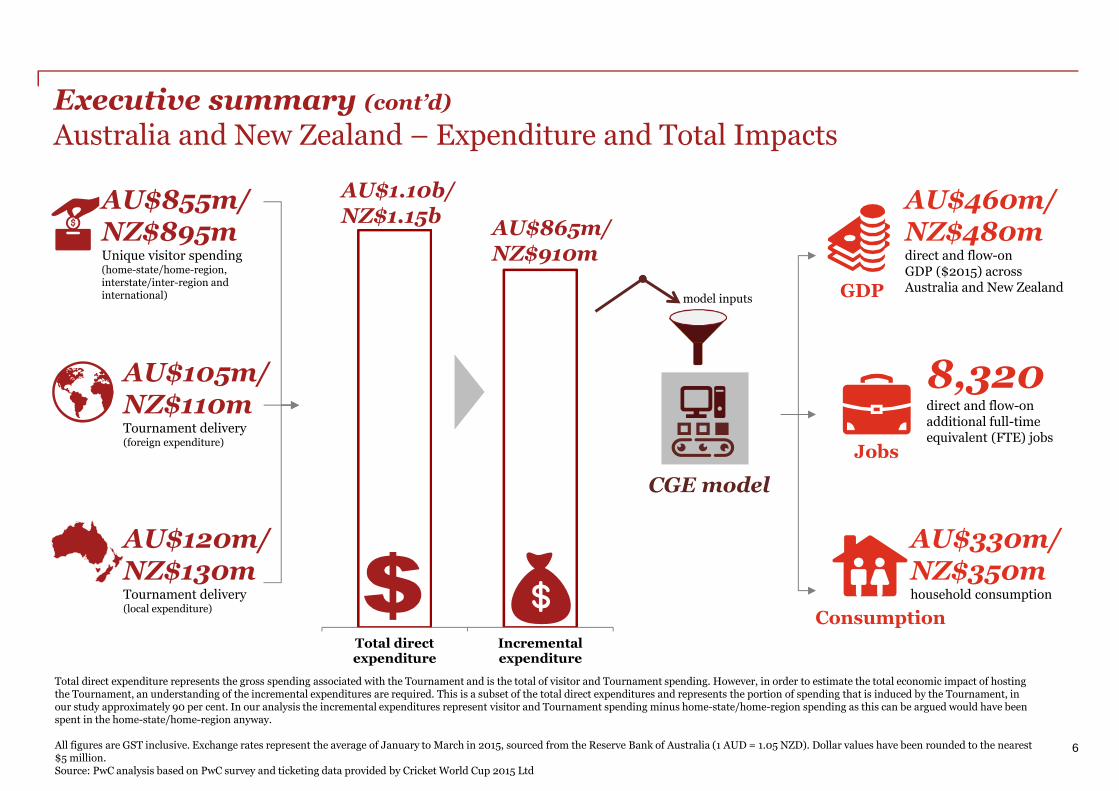
Australia and New Zealand – Expenditure and Total Impacts
6
AU$1.10b/NZ$1.15b
CGE model
AU$855m/NZ$895mUnique visitor spending(home-state/home-region,interstate/inter-region andinternational)
AU$460m/NZ$480mdirect and flow-onGDP ($2015) acrossAustralia and New Zealand
8,320direct and flow-onadditional full-timeequivalent (FTE) jobs
AU$330m/NZ$350mhousehold consumption
AU$105m/NZ$110mTournament delivery(foreign expenditure)
AU$120m/NZ$130mTournament delivery(local expenditure)
AU$865m/NZ$910m
model inputs
Total direct expenditure represents the gross spending associated with the Tournament and is the total of visitor and Tournament spending. However, in order to estimate the total economic impact of hostingthe Tournament, an understanding of the incremental expenditures are required. This is a subset of the total direct expenditures and represents the portion of spending that is induced by the Tournament, inour study approximately 90 per cent. In our analysis the incremental expenditures represent visitor and Tournament spending minus home-state/home-region spending as this can be argued would have beenspent in the home-state/home-region anyway.
All figures are GST inclusive. Exchange rates represent the average of January to March in 2015, sourced from the Reserve Bank of Australia (1 AUD = 1.05 NZD). Dollar values have been rounded to the nearest$5 million.Source: PwC analysis based on PwC survey and ticketing data provided by Cricket World Cup 2015 Ltd
GDP
Jobs
Consumption
7
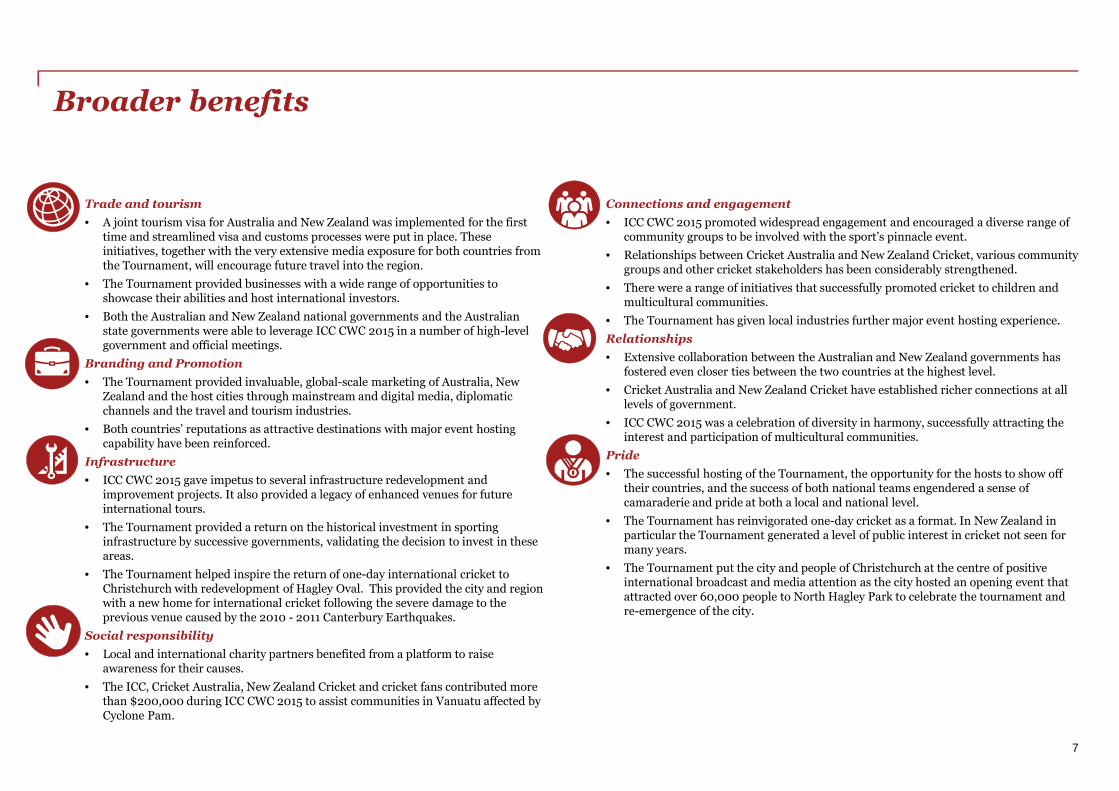
Trade and tourism
• A joint tourism visa for Australia and New Zealand was implemented for the firsttime and streamlined visa and customs processes were put in place. Theseinitiatives, together with the very extensive media exposure for both countries fromthe Tournament, will encourage future travel into the region.
• The Tournament provided businesses with a wide range of opportunities toshowcase their abilities and host international investors.
• Both the Australian and New Zealand national governments and the Australianstate governments were able to leverage ICC CWC 2015 in a number of high-levelgovernment and official meetings.
Branding and Promotion
• The Tournament provided invaluable, global-scale marketing of Australia, NewZealand and the host cities through mainstream and digital media, diplomaticchannels and the travel and tourism industries.
• Both countries’ reputations as attractive destinations with major event hostingcapability have been reinforced.
Infrastructure
• ICC CWC 2015 gave impetus to several infrastructure redevelopment andimprovement projects. It also provided a legacy of enhanced venues for futureinternational tours.
• The Tournament provided a return on the historical investment in sportinginfrastructure by successive governments, validating the decision to invest in theseareas.
• The Tournament helped inspire the return of one-day international cricket toChristchurch with redevelopment of Hagley Oval. This provided the city and regionwith a new home for international cricket following the severe damage to theprevious venue caused by the 2010 - 2011 Canterbury Earthquakes.
Social responsibility
• Local and international charity partners benefited from a platform to raiseawareness for their causes.
• The ICC, Cricket Australia, New Zealand Cricket and cricket fans contributed morethan $200,000 during ICC CWC 2015 to assist communities in Vanuatu affected byCyclone Pam.
Connections and engagement
• ICC CWC 2015 promoted widespread engagement and encouraged a diverse range ofcommunity groups to be involved with the sport’s pinnacle event.
• Relationships between Cricket Australia and New Zealand Cricket, various communitygroups and other cricket stakeholders has been considerably strengthened.
• There were a range of initiatives that successfully promoted cricket to children andmulticultural communities.
• The Tournament has given local industries further major event hosting experience.
Relationships
• Extensive collaboration between the Australian and New Zealand governments hasfostered even closer ties between the two countries at the highest level.
• Cricket Australia and New Zealand Cricket have established richer connections at alllevels of government.
• ICC CWC 2015 was a celebration of diversity in harmony, successfully attracting theinterest and participation of multicultural communities.
Pride
• The successful hosting of the Tournament, the opportunity for the hosts to show offtheir countries, and the success of both national teams engendered a sense ofcamaraderie and pride at both a local and national level.
• The Tournament has reinvigorated one-day cricket as a format. In New Zealand inparticular the Tournament generated a level of public interest in cricket not seen formany years.
• The Tournament put the city and people of Christchurch at the centre of positiveinternational broadcast and media attention as the city hosted an opening event thatattracted over 60,000 people to North Hagley Park to celebrate the tournament andre-emergence of the city.
Broader benefits
9
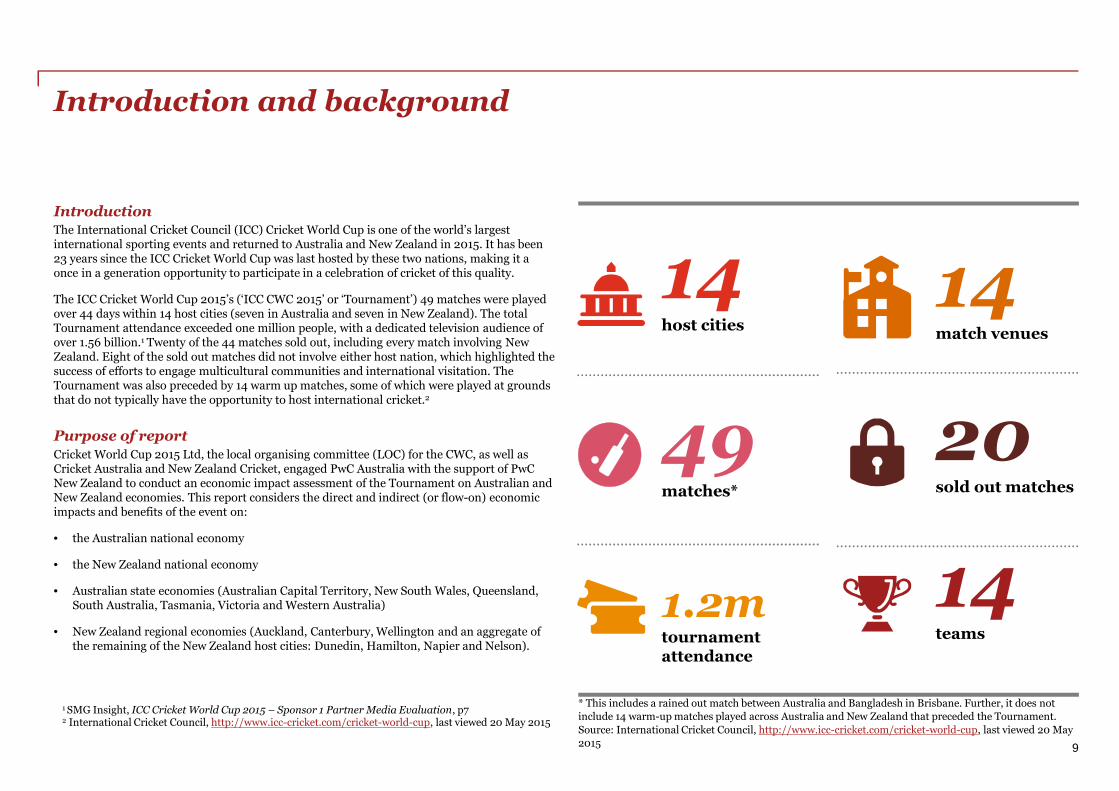
IntroductionThe International Cricket Council (ICC) Cricket World Cup is one of the world’s largestinternational sporting events and returned to Australia and New Zealand in 2015. It has been23 years since the ICC Cricket World Cup was last hosted by these two nations, making it aonce in a generation opportunity to participate in a celebration of cricket of this quality.
The ICC Cricket World Cup 2015’s (‘ICC CWC 2015’ or ‘Tournament’) 49 matches were playedover 44 days within 14 host cities (seven in Australia and seven in New Zealand). The totalTournament attendance exceeded one million people, with a dedicated television audience ofover 1.56 billion.1 Twenty of the 44 matches sold out, including every match involving NewZealand. Eight of the sold out matches did not involve either host nation, which highlighted thesuccess of efforts to engage multicultural communities and international visitation. TheTournament was also preceded by 14 warm up matches, some of which were played at groundsthat do not typically have the opportunity to host international cricket.2
Purpose of reportCricket World Cup 2015 Ltd, the local organising committee (LOC) for the CWC, as well asCricket Australia and New Zealand Cricket, engaged PwC Australia with the support of PwCNew Zealand to conduct an economic impact assessment of the Tournament on Australian andNew Zealand economies. This report considers the direct and indirect (or flow-on) economicimpacts and benefits of the event on:
• the Australian national economy
• the New Zealand national economy
• Australian state economies (Australian Capital Territory, New South Wales, Queensland,South Australia, Tasmania, Victoria and Western Australia)
• New Zealand regional economies (Auckland, Canterbury, Wellington and an aggregate ofthe remaining of the New Zealand host cities: Dunedin, Hamilton, Napier and Nelson).
Introduction and background
14host cities
49matches*
1.2mtournamentattendance
14match venues
20sold out matches
14teams
* This includes a rained out match between Australia and Bangladesh in Brisbane. Further, it does notinclude 14 warm-up matches played across Australia and New Zealand that preceded the Tournament.
Source: International Cricket Council, http://www.icc-cricket.com/cricket-world-cup, last viewed 20 May2015
1 SMG Insight, ICC Cricket World Cup 2015 – Sponsor 1 Partner Media Evaluation, p72 International Cricket Council, http://www.icc-cricket.com/cricket-world-cup, last viewed 20 May 2015
10
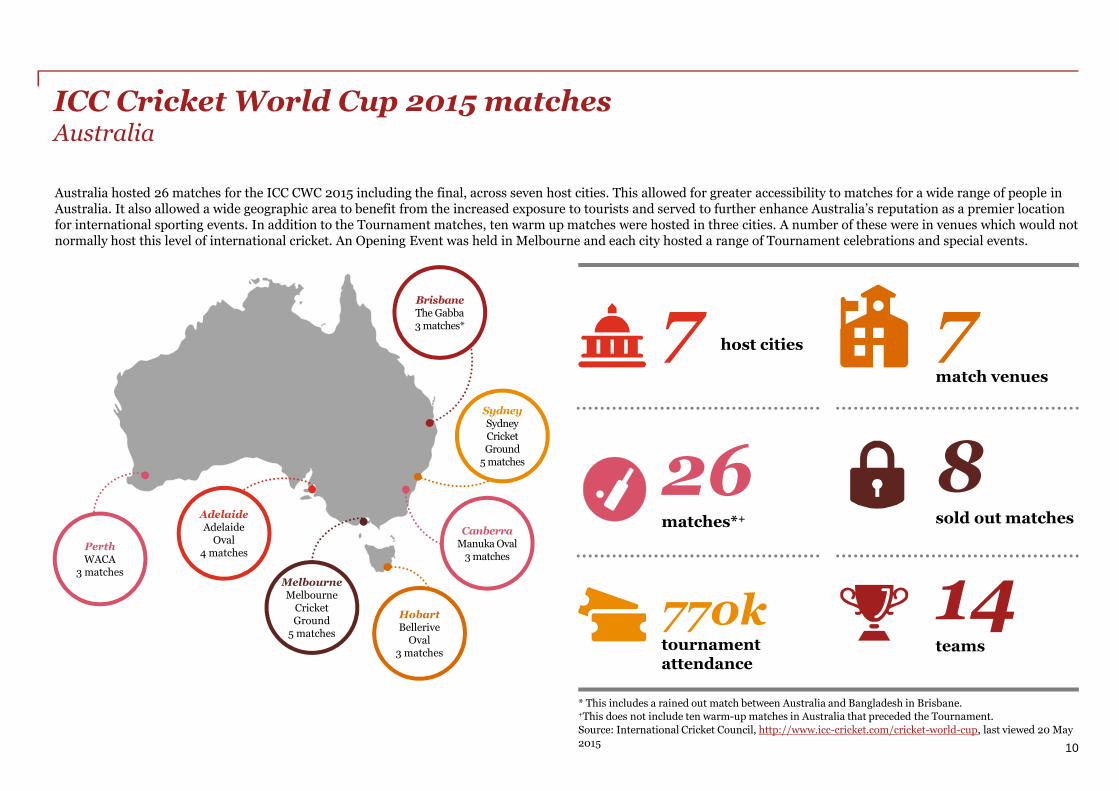
ICC Cricket World Cup 2015 matchesAustralia
BrisbaneThe Gabba3 matches*
SydneySydneyCricketGround
5 matches
CanberraManuka Oval
3 matches
HobartBellerive
Oval3 matches
MelbourneMelbourne
CricketGround
5 matches
AdelaideAdelaide
Oval4 matches
PerthWACA
3 matches
7 host cities
26matches*+
770ktournamentattendance
7match venues
8sold out matches
14teams
Australia hosted 26 matches for the ICC CWC 2015 including the final, across seven host cities. This allowed for greater accessibility to matches for a wide range of people inAustralia. It also allowed a wide geographic area to benefit from the increased exposure to tourists and served to further enhance Australia’s reputation as a premier locationfor international sporting events. In addition to the Tournament matches, ten warm up matches were hosted in three cities. A number of these were in venues which would notnormally host this level of international cricket. An Opening Event was held in Melbourne and each city hosted a range of Tournament celebrations and special events.
* This includes a rained out match between Australia and Bangladesh in Brisbane.+This does not include ten warm-up matches in Australia that preceded the Tournament.
Source: International Cricket Council, http://www.icc-cricket.com/cricket-world-cup, last viewed 20 May2015
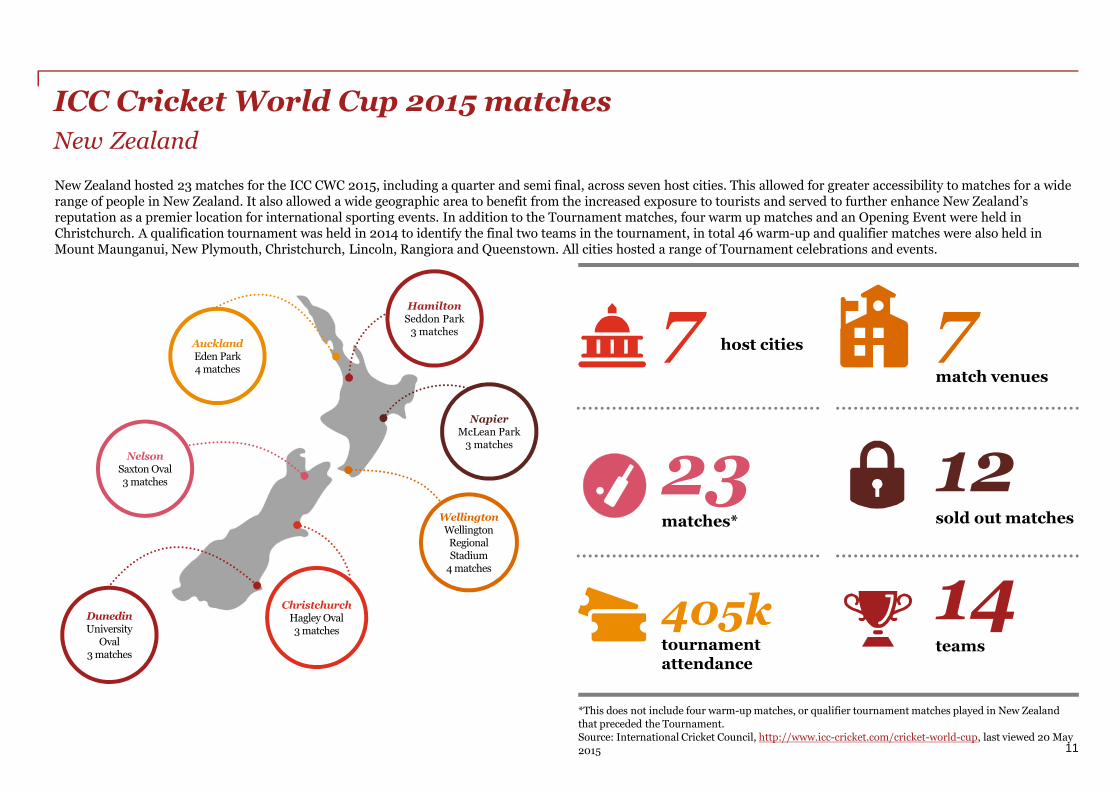
ICC Cricket World Cup 2015 matches
New Zealand
11
AucklandEden Park4 matches
HamiltonSeddon Park
3 matches
WellingtonWellingtonRegionalStadium
4 matches
NapierMcLean Park
3 matches
DunedinUniversity
Oval3 matches
ChristchurchHagley Oval3 matches
NelsonSaxton Oval3 matches
7 host cities
23matches*
405ktournamentattendance
7match venues
12sold out matches
14teams
New Zealand hosted 23 matches for the ICC CWC 2015, including a quarter and semi final, across seven host cities. This allowed for greater accessibility to matches for a widerange of people in New Zealand. It also allowed a wide geographic area to benefit from the increased exposure to tourists and served to further enhance New Zealand’sreputation as a premier location for international sporting events. In addition to the Tournament matches, four warm up matches and an Opening Event were held inChristchurch. A qualification tournament was held in 2014 to identify the final two teams in the tournament, in total 46 warm-up and qualifier matches were also held inMount Maunganui, New Plymouth, Christchurch, Lincoln, Rangiora and Queenstown. All cities hosted a range of Tournament celebrations and events.
*This does not include four warm-up matches, or qualifier tournament matches played in New Zealandthat preceded the Tournament.Source: International Cricket Council, http://www.icc-cricket.com/cricket-world-cup, last viewed 20 May
2015
13
To analyse the economic impact andbenefits of the Tournament, we collectedTournament-specific expenditure datafrom the LOC, host cities and throughonline and face-to-face surveys of matchattendees. The expenditure data wasmodelled using a globally acceptedrobust economy-wide model to assessthe flow-on and total economic impactsof the Tournament. This is a point ofdifference to other economicassessments of sports and tourismstudies that rely on projected oranticipated event related activities,which tend to over estimate flow-on andtotal economic impacts.
Our approach is described in thefollowing five steps:
Further detail on our methodology and approach can be found in Appendix A – Economic modelling approach.
The key results of the economic impacts and benefits are presented in the following pages.
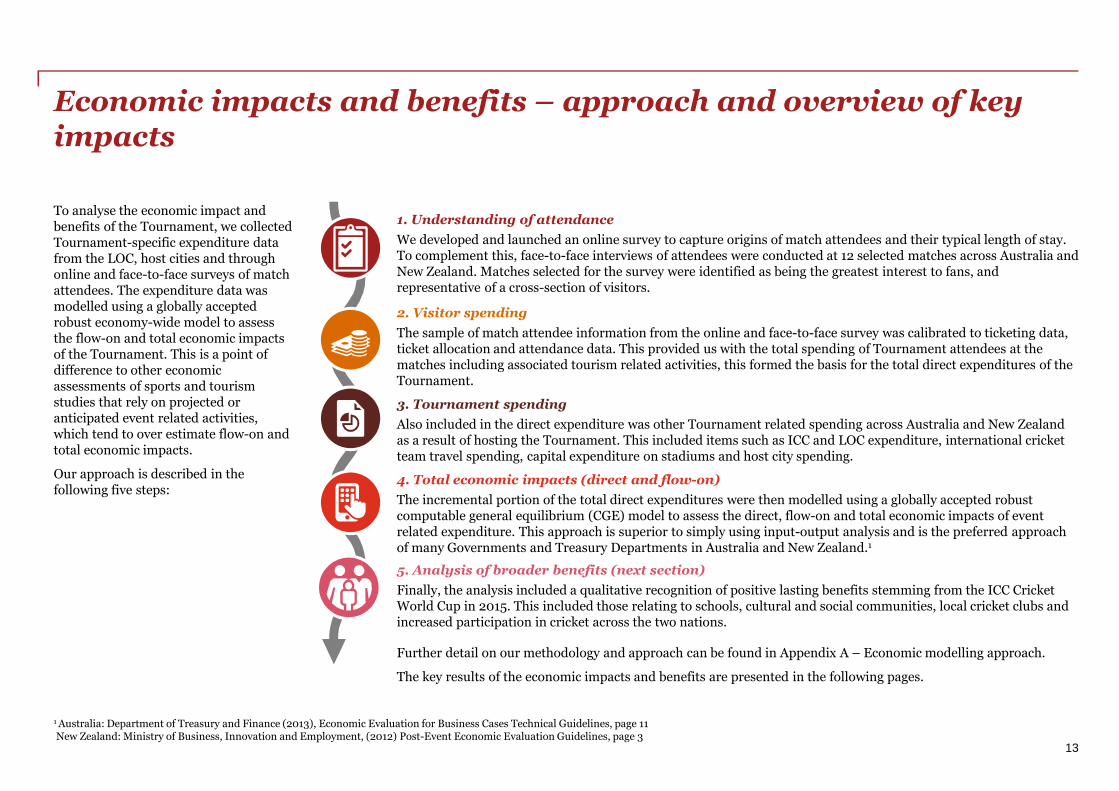
Economic impacts and benefits – approach and overview of keyimpacts
1. Understanding of attendance
We developed and launched an online survey to capture origins of match attendees and their typical length of stay.To complement this, face-to-face interviews of attendees were conducted at 12 selected matches across Australia andNew Zealand. Matches selected for the survey were identified as being the greatest interest to fans, andrepresentative of a cross-section of visitors.
2. Visitor spending
The sample of match attendee information from the online and face-to-face survey was calibrated to ticketing data,ticket allocation and attendance data. This provided us with the total spending of Tournament attendees at thematches including associated tourism related activities, this formed the basis for the total direct expenditures of theTournament.
3. Tournament spending
Also included in the direct expenditure was other Tournament related spending across Australia and New Zealandas a result of hosting the Tournament. This included items such as ICC and LOC expenditure, international cricketteam travel spending, capital expenditure on stadiums and host city spending.
4. Total economic impacts (direct and flow-on)
The incremental portion of the total direct expenditures were then modelled using a globally accepted robustcomputable general equilibrium (CGE) model to assess the direct, flow-on and total economic impacts of eventrelated expenditure. This approach is superior to simply using input-output analysis and is the preferred approachof many Governments and Treasury Departments in Australia and New Zealand.1
5. Analysis of broader benefits (next section)
Finally, the analysis included a qualitative recognition of positive lasting benefits stemming from the ICC CricketWorld Cup in 2015. This included those relating to schools, cultural and social communities, local cricket clubs andincreased participation in cricket across the two nations.
1 Australia: Department of Treasury and Finance (2013), Economic Evaluation for Business Cases Technical Guidelines, page 11New Zealand: Ministry of Business, Innovation and Employment, (2012) Post-Event Economic Evaluation Guidelines, page 3

14
Tournament attendance
The aggregate attendance for the Tournament was over one million, including threematches that exceeded the 80,000 attendance mark. In total, 20 matches were soldout, including every match involving New Zealand. Eight of the sold out matches didnot feature either of the host nations, highlighting the success of multiculturalengagement programs over the years leading up to the Tournament. The ICC CWC2015 final, played at the Melbourne Cricket Ground, was witnessed by the highestever officially recorded attendance in the world for any single day of cricket in history(93,013).3
Television audience
The Tournament was broadcast to an estimated television audience of 1.56 billionpeople (with a potential viewership of 2.51 billion worldwide), making it one of themost watched sporting events in history. A total of 44 licensees broadcast the event inseven different languages and across 212 international markets, totaling to more than19,000 hours of coverage.4 ICC CWC 2015 final broke the television record for acricket match in Australia or New Zealand (peaking at 4.22 million viewers inAustralia and almost two million in New Zealand).5
Attendance (cont’d)
The most popular ICC Cricket World Cup ever
3 ESPN Cricinfo (2015), http://stats.espncricinfo.com/ci/content/records/283309.html, last viewed 20May 20154 SMG Insight, ICC Cricket World Cup 2015 – Sponsor 1 Partner Media Evaluation5 Sinclair, Lara, Cricket World Cup breaks ratings records (Mar 30, 2015), The Australian Business Review
The ICC CWC 2015 was hailed by the ICC Chairman as the ‘most popular CricketWorld Cup in history’, based on a combination of attendance, television audience,and, perhaps most significantly, digital media.1 The widespread reach of theTournament across much of the globe, including many non-cricketing nations, wasone of the main contributors to its overwhelming success.
1International Cricket Council, ICC Chairman Hails ICC Cricket World Cup 2015 As ‘Most Popular inHistory’, http://www.icc-cricket.com/cricket-world-cup/news/2015/media-releases/87575/icc-chairman-hails-icc-cricket-world-cup-2015-as-most-popular-in-history, last viewed 26 May 20152 International Cricket Council, ICC Cricket World Cup 2015 – Digital Report
Digital media
The ICC CWC 2015 drew momentous popularity across almost all digital mediums,making it the third largest international sporting event ever in terms of digital reach(more than doubling the Sochi Winter Olympics in 2014). It also included an Indiaversus Pakistan match that was the most talked about cricket match in digital history.
Overall, the ICC CWC 2015 received 57.5 billion social media impressions. Inparticular, there were 1.4 billion live views of tweets relating to the Tournament, 700million interactions about the ICC CWC 2015 on Facebook, and 5.8 million Likes forthe Tournament Facebook page (17.3 million cumulative Likes across all ICCFacebook pages). The ICC CWC 2015 dedicated website also hosted an estimated 35.9million unique visitors, and 4.69 million users downloaded the official Tournamentmobile application. Further, 746.4 million search engine impressions were related tothe Tournament.2
15
Visitation
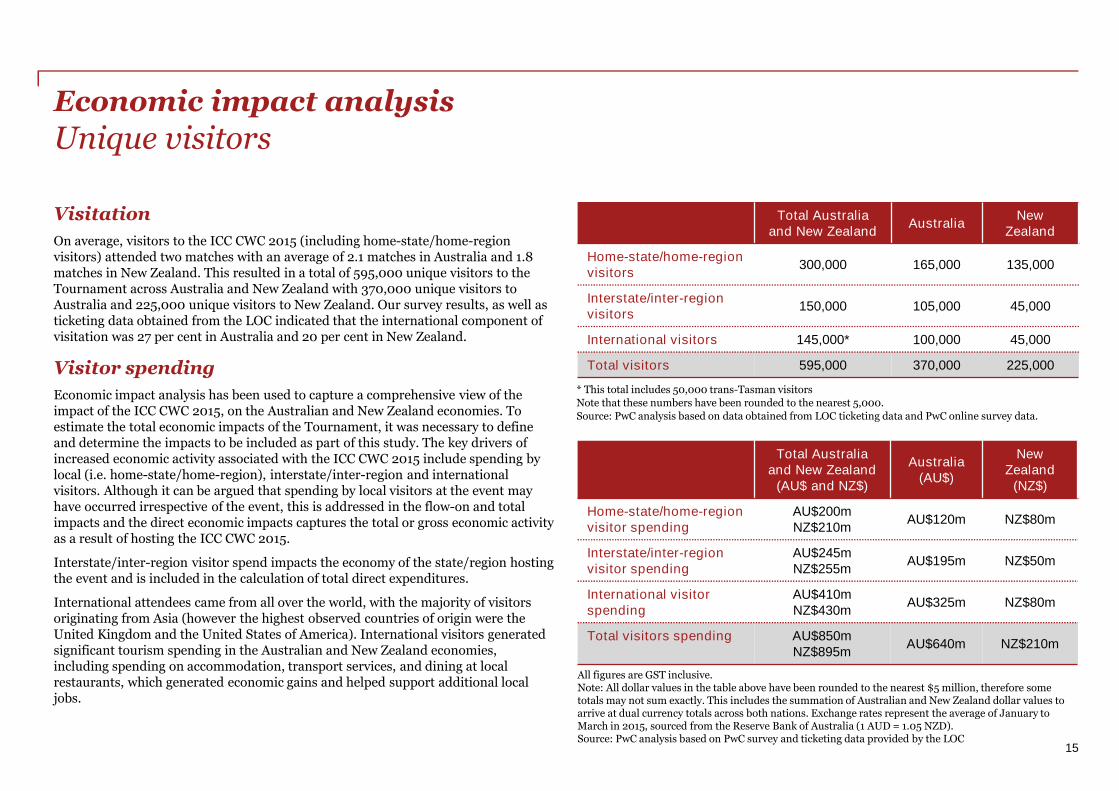
On average, visitors to the ICC CWC 2015 (including home-state/home-regionvisitors) attended two matches with an average of 2.1 matches in Australia and 1.8matches in New Zealand. This resulted in a total of 595,000 unique visitors to theTournament across Australia and New Zealand with 370,000 unique visitors toAustralia and 225,000 unique visitors to New Zealand. Our survey results, as well asticketing data obtained from the LOC indicated that the international component ofvisitation was 27 per cent in Australia and 20 per cent in New Zealand.
Visitor spending
Economic impact analysis has been used to capture a comprehensive view of theimpact of the ICC CWC 2015, on the Australian and New Zealand economies. Toestimate the total economic impacts of the Tournament, it was necessary to defineand determine the impacts to be included as part of this study. The key drivers ofincreased economic activity associated with the ICC CWC 2015 include spending bylocal (i.e. home-state/home-region), interstate/inter-region and internationalvisitors. Although it can be argued that spending by local visitors at the event mayhave occurred irrespective of the event, this is addressed in the flow-on and totalimpacts and the direct economic impacts captures the total or gross economic activityas a result of hosting the ICC CWC 2015.
Interstate/inter-region visitor spend impacts the economy of the state/region hostingthe event and is included in the calculation of total direct expenditures.
International attendees came from all over the world, with the majority of visitorsoriginating from Asia (however the highest observed countries of origin were theUnited Kingdom and the United States of America). International visitors generatedsignificant tourism spending in the Australian and New Zealand economies,including spending on accommodation, transport services, and dining at localrestaurants, which generated economic gains and helped support additional localjobs.
Economic impact analysis
Unique visitors
Total Australiaand New Zealand
AustraliaNew
Zealand
Home-state/home-regionvisitors
300,000 165,000 135,000
Interstate/inter-regionvisitors
150,000 105,000 45,000
International visitors 145,000* 100,000 45,000
Total visitors 595,000 370,000 225,000
Total Australiaand New Zealand
(AU$ and NZ$)
Australia(AU$)
NewZealand
(NZ$)
Home-state/home-regionvisitor spending
AU$200mNZ$210m
AU$120m NZ$80m
Interstate/inter-regionvisitor spending
AU$245mNZ$255m
AU$195m NZ$50m
International visitorspending
AU$410mNZ$430m
AU$325m NZ$80m
Total visitors spending AU$850mNZ$895m
AU$640m NZ$210m
* This total includes 50,000 trans-Tasman visitorsNote that these numbers have been rounded to the nearest 5,000.Source: PwC analysis based on data obtained from LOC ticketing data and PwC online survey data.
All figures are GST inclusive.Note: All dollar values in the table above have been rounded to the nearest $5 million, therefore sometotals may not sum exactly. This includes the summation of Australian and New Zealand dollar values toarrive at dual currency totals across both nations. Exchange rates represent the average of January toMarch in 2015, sourced from the Reserve Bank of Australia (1 AUD = 1.05 NZD).Source: PwC analysis based on PwC survey and ticketing data provided by the LOC
16
Attendance (cont’d)
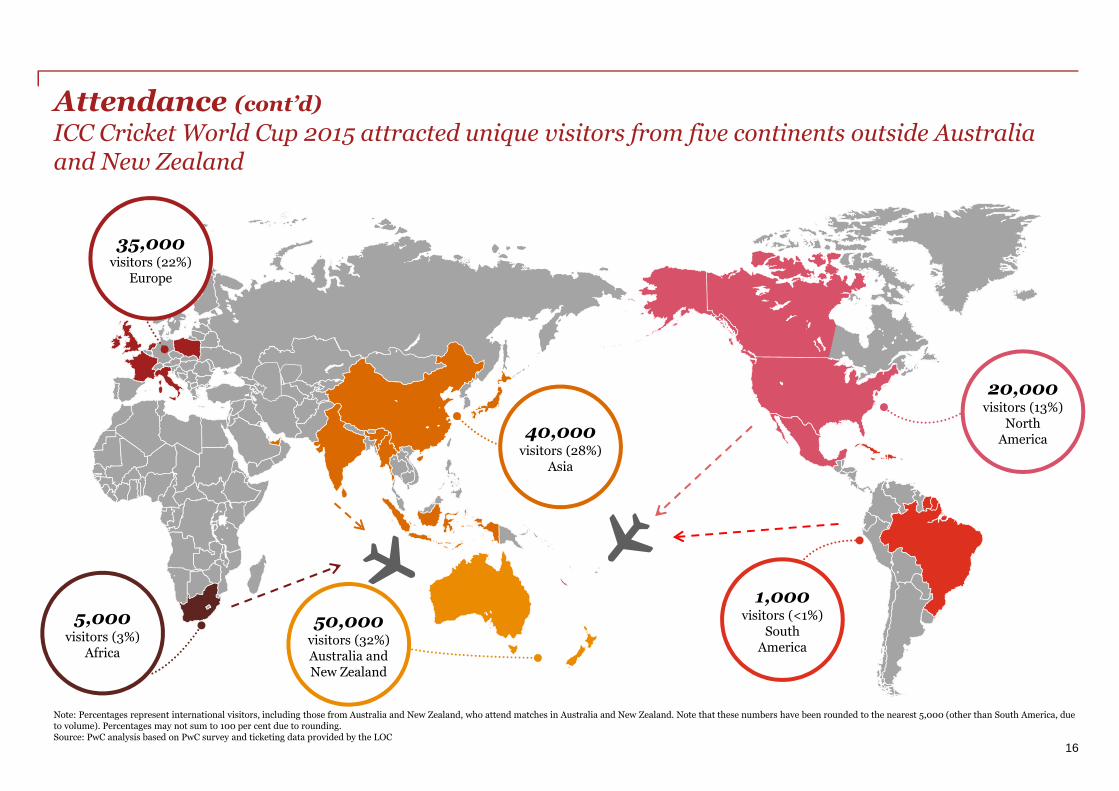
ICC Cricket World Cup 2015 attracted unique visitors from five continents outside Australiaand New Zealand
Note: Percentages represent international visitors, including those from Australia and New Zealand, who attend matches in Australia and New Zealand. Note that these numbers have been rounded to the nearest 5,000 (other than South America, dueto volume). Percentages may not sum to 100 per cent due to rounding.Source: PwC analysis based on PwC survey and ticketing data provided by the LOC
40,000visitors (28%)
Asia
5,000visitors (3%)
Africa
35,000visitors (22%)
Europe
20,000visitors (13%)
NorthAmerica
1,000visitors (<1%)
SouthAmerica
50,000visitors (32%)Australia andNew Zealand
Item DescriptionTotal Australia and
New Zealand (AU$ andNZ$)
Australia(AU$)
New Zealand(NZ$)
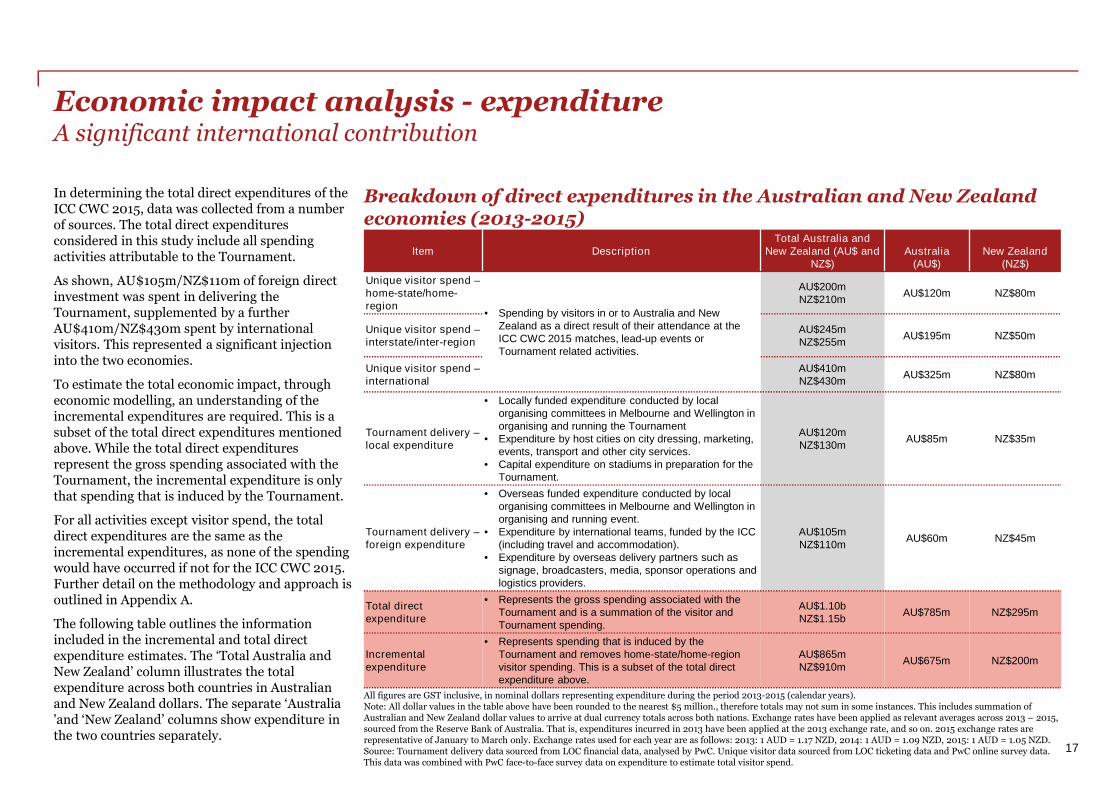
Unique visitor spend –home-state/home-region
• Spending by visitors in or to Australia and NewZealand as a direct result of their attendance at theICC CWC 2015 matches, lead-up events orTournament related activities.
AU$200mNZ$210m
AU$120m NZ$80m
Unique visitor spend –interstate/inter-region
AU$245mNZ$255m
AU$195m NZ$50m
Unique visitor spend –international
AU$410mNZ$430m
AU$325m NZ$80m
Tournament delivery –local expenditure
• Locally funded expenditure conducted by localorganising committees in Melbourne and Wellington inorganising and running the Tournament
• Expenditure by host cities on city dressing, marketing,events, transport and other city services.
• Capital expenditure on stadiums in preparation for theTournament.
AU$120mNZ$130m
AU$85m NZ$35m
Tournament delivery –foreign expenditure
• Overseas funded expenditure conducted by localorganising committees in Melbourne and Wellington inorganising and running event.
• Expenditure by international teams, funded by the ICC(including travel and accommodation).
• Expenditure by overseas delivery partners such assignage, broadcasters, media, sponsor operations andlogistics providers.
AU$105mNZ$110m
AU$60m NZ$45m
Total directexpenditure
• Represents the gross spending associated with theTournament and is a summation of the visitor andTournament spending.
AU$1.10bNZ$1.15b
AU$785m NZ$295m
Incrementalexpenditure
• Represents spending that is induced by theTournament and removes home-state/home-regionvisitor spending. This is a subset of the total directexpenditure above.
AU$865mNZ$910m
AU$675m NZ$200m
17
In determining the total direct expenditures of theICC CWC 2015, data was collected from a numberof sources. The total direct expendituresconsidered in this study include all spendingactivities attributable to the Tournament.
As shown, AU$105m/NZ$110m of foreign directinvestment was spent in delivering theTournament, supplemented by a furtherAU$410m/NZ$430m spent by internationalvisitors. This represented a significant injectioninto the two economies.
To estimate the total economic impact, througheconomic modelling, an understanding of theincremental expenditures are required. This is asubset of the total direct expenditures mentionedabove. While the total direct expendituresrepresent the gross spending associated with theTournament, the incremental expenditure is onlythat spending that is induced by the Tournament.
For all activities except visitor spend, the totaldirect expenditures are the same as theincremental expenditures, as none of the spendingwould have occurred if not for the ICC CWC 2015.Further detail on the methodology and approach isoutlined in Appendix A.
The following table outlines the informationincluded in the incremental and total directexpenditure estimates. The ‘Total Australia andNew Zealand’ column illustrates the totalexpenditure across both countries in Australianand New Zealand dollars. The separate ‘Australia'and ‘New Zealand’ columns show expenditure inthe two countries separately.
Economic impact analysis - expenditureA significant international contribution
All figures are GST inclusive, in nominal dollars representing expenditure during the period 2013-2015 (calendar years).Note: All dollar values in the table above have been rounded to the nearest $5 million., therefore totals may not sum in some instances. This includes summation ofAustralian and New Zealand dollar values to arrive at dual currency totals across both nations. Exchange rates have been applied as relevant averages across 2013 – 2015,sourced from the Reserve Bank of Australia. That is, expenditures incurred in 2013 have been applied at the 2013 exchange rate, and so on. 2015 exchange rates arerepresentative of January to March only. Exchange rates used for each year are as follows: 2013: 1 AUD = 1.17 NZD, 2014: 1 AUD = 1.09 NZD, 2015: 1 AUD = 1.05 NZD.Source: Tournament delivery data sourced from LOC financial data, analysed by PwC. Unique visitor data sourced from LOC ticketing data and PwC online survey data.This data was combined with PwC face-to-face survey data on expenditure to estimate total visitor spend.
Breakdown of direct expenditures in the Australian and New Zealandeconomies (2013-2015)
Total economic impacts of the ICC Cricket World Cup 2015
18
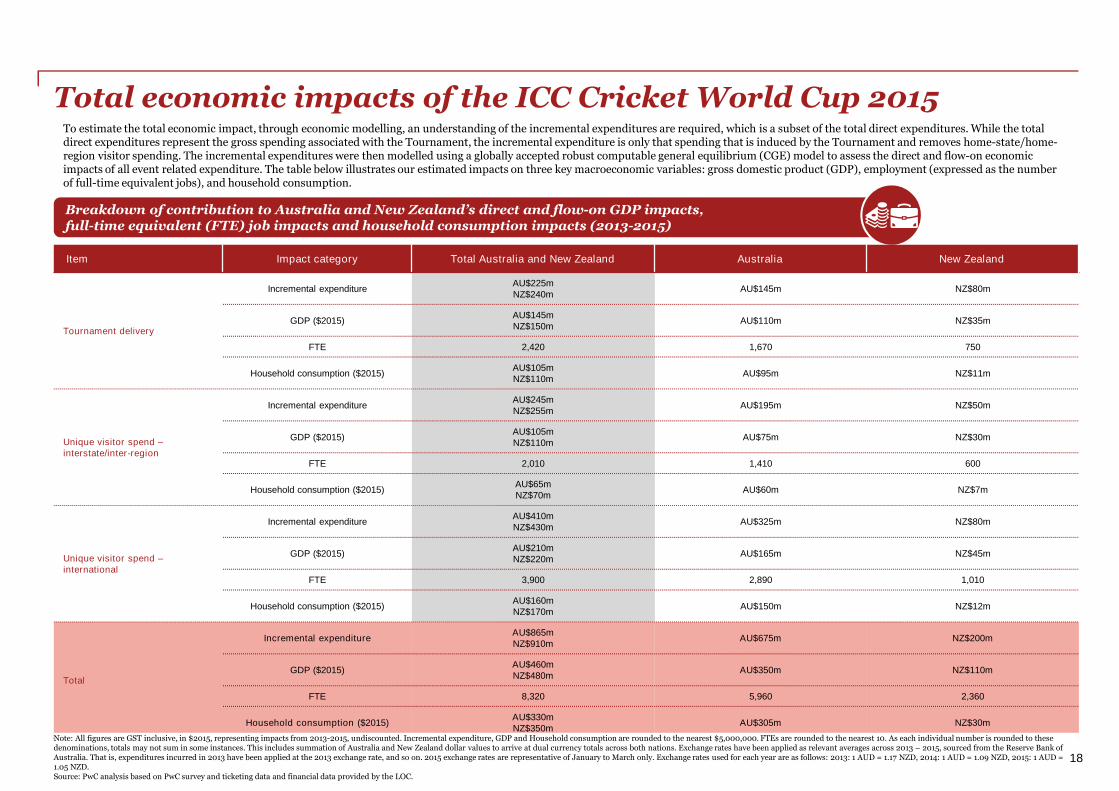
Breakdown of contribution to Australia and New Zealand’s direct and flow-on GDP impacts,full-time equivalent (FTE) job impacts and household consumption impacts (2013-2015)
Item Impact category Total Australia and New Zealand Australia New Zealand
Tournament delivery
Incremental expenditureAU$225mNZ$240m
AU$145m NZ$80m
GDP ($2015)AU$145mNZ$150m
AU$110m NZ$35m
FTE 2,420 1,670 750
Household consumption ($2015)AU$105mNZ$110m
AU$95m NZ$11m
Unique visitor spend –interstate/inter-region
Incremental expenditureAU$245mNZ$255m
AU$195m NZ$50m
GDP ($2015)AU$105mNZ$110m
AU$75m NZ$30m
FTE 2,010 1,410 600
Household consumption ($2015)AU$65mNZ$70m
AU$60m NZ$7m
Unique visitor spend –international
Incremental expenditureAU$410mNZ$430m
AU$325m NZ$80m
GDP ($2015)AU$210mNZ$220m
AU$165m NZ$45m
FTE 3,900 2,890 1,010
Household consumption ($2015)AU$160mNZ$170m
AU$150m NZ$12m
Total
Incremental expenditureAU$865mNZ$910m
AU$675m NZ$200m
GDP ($2015)AU$460mNZ$480m
AU$350m NZ$110m
FTE 8,320 5,960 2,360
Household consumption ($2015)AU$330mNZ$350m
AU$305m NZ$30m
Note: All figures are GST inclusive, in $2015, representing impacts from 2013-2015, undiscounted. Incremental expenditure, GDP and Household consumption are rounded to the nearest $5,000,000. FTEs are rounded to the nearest 10. As each individual number is rounded to thesedenominations, totals may not sum in some instances. This includes summation of Australia and New Zealand dollar values to arrive at dual currency totals across both nations. Exchange rates have been applied as relevant averages across 2013 – 2015, sourced from the Reserve Bank ofAustralia. That is, expenditures incurred in 2013 have been applied at the 2013 exchange rate, and so on. 2015 exchange rates are representative of January to March only. Exchange rates used for each year are as follows: 2013: 1 AUD = 1.17 NZD, 2014: 1 AUD = 1.09 NZD, 2015: 1 AUD =1.05 NZD.Source: PwC analysis based on PwC survey and ticketing data and financial data provided by the LOC.
To estimate the total economic impact, through economic modelling, an understanding of the incremental expenditures are required, which is a subset of the total direct expenditures. While the totaldirect expenditures represent the gross spending associated with the Tournament, the incremental expenditure is only that spending that is induced by the Tournament and removes home-state/home-region visitor spending. The incremental expenditures were then modelled using a globally accepted robust computable general equilibrium (CGE) model to assess the direct and flow-on economicimpacts of all event related expenditure. The table below illustrates our estimated impacts on three key macroeconomic variables: gross domestic product (GDP), employment (expressed as the numberof full-time equivalent jobs), and household consumption.
18
19
Total economic impacts of the ICC Cricket World Cup 2015 (cont’d)
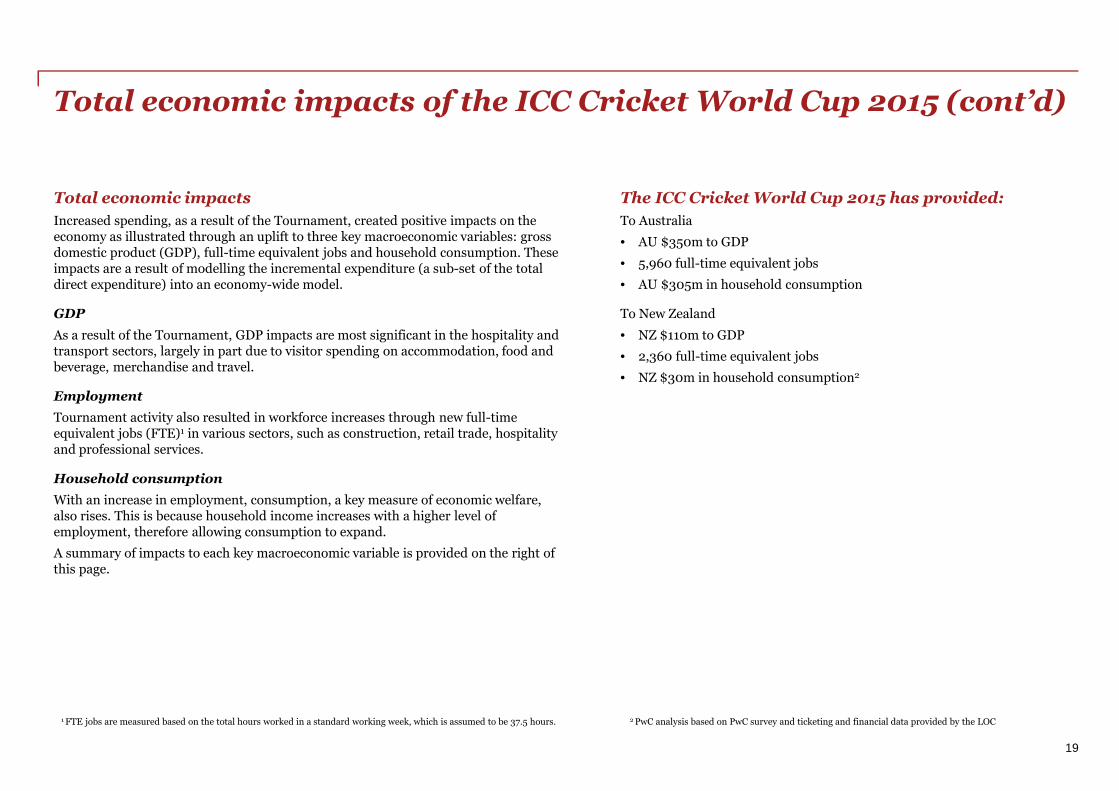
Total economic impacts
Increased spending, as a result of the Tournament, created positive impacts on theeconomy as illustrated through an uplift to three key macroeconomic variables: grossdomestic product (GDP), full-time equivalent jobs and household consumption. Theseimpacts are a result of modelling the incremental expenditure (a sub-set of the totaldirect expenditure) into an economy-wide model.
GDP
As a result of the Tournament, GDP impacts are most significant in the hospitality andtransport sectors, largely in part due to visitor spending on accommodation, food andbeverage, merchandise and travel.
Employment
Tournament activity also resulted in workforce increases through new full-timeequivalent jobs (FTE)1 in various sectors, such as construction, retail trade, hospitalityand professional services.
Household consumption
With an increase in employment, consumption, a key measure of economic welfare,also rises. This is because household income increases with a higher level ofemployment, therefore allowing consumption to expand.
A summary of impacts to each key macroeconomic variable is provided on the right ofthis page.
2 PwC analysis based on PwC survey and ticketing and financial data provided by the LOC1 FTE jobs are measured based on the total hours worked in a standard working week, which is assumed to be 37.5 hours.
The ICC Cricket World Cup 2015 has provided:
To Australia
• AU $350m to GDP
• 5,960 full-time equivalent jobs
• AU $305m in household consumption
To New Zealand
• NZ $110m to GDP
• 2,360 full-time equivalent jobs
• NZ $30m in household consumption2
85k
685k
Tournament attendance
TournamentSupport
Match Attendees
20
770k
375k
205k
190k
Tournament attendance byresidential origin
Home-state
Interstate
International
770k
165k
105k
100k
Unique visitors
370k
250k
430k
815k
Bed nights
1.5m
Home-state
Interstate
International
International
Interstate
Home-state
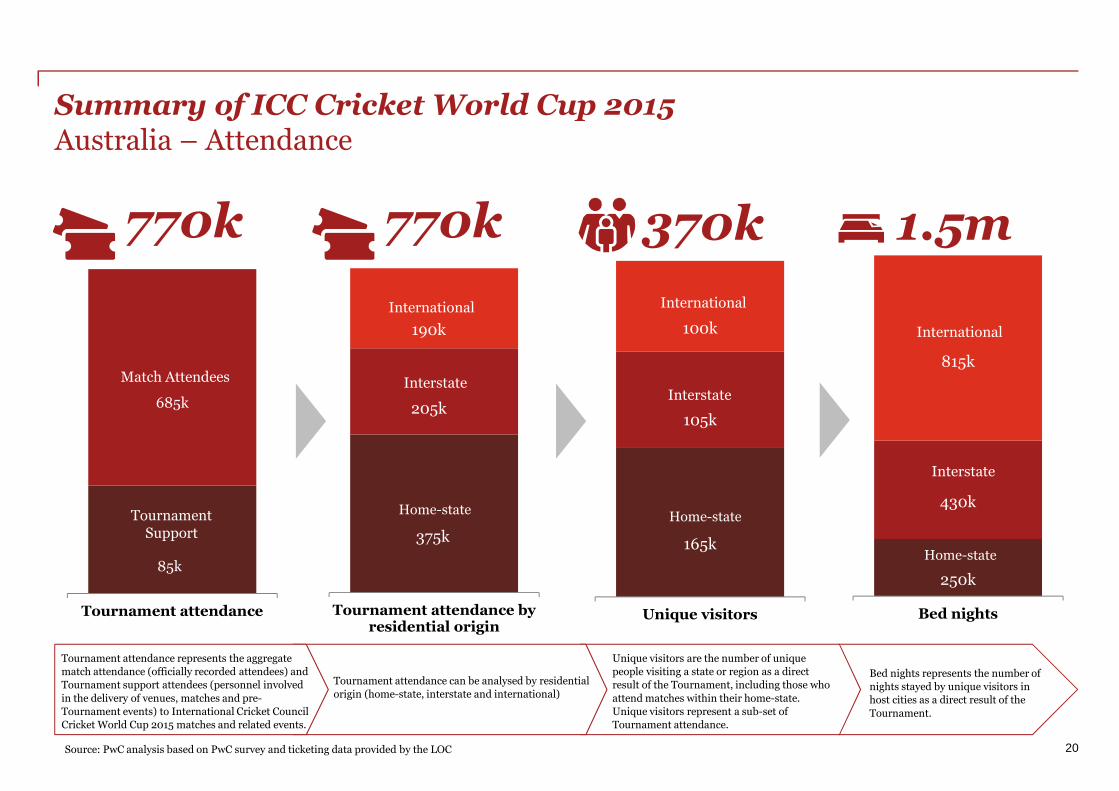
Tournament attendance represents the aggregatematch attendance (officially recorded attendees) andTournament support attendees (personnel involved
in the delivery of venues, matches and pre-Tournament events) to International Cricket CouncilCricket World Cup 2015 matches and related events.
Tournament attendance can be analysed by residentialorigin (home-state, interstate and international)
Unique visitors are the number of uniquepeople visiting a state or region as a directresult of the Tournament, including those who
attend matches within their home-state.Unique visitors represent a sub-set ofTournament attendance.
Bed nights represents the number ofnights stayed by unique visitors inhost cities as a direct result of the
Tournament.
Summary of ICC Cricket World Cup 2015Australia – Attendance
Source: PwC analysis based on PwC survey and ticketing data provided by the LOC
Total directexpenditure
Incrementalexpenditure
21
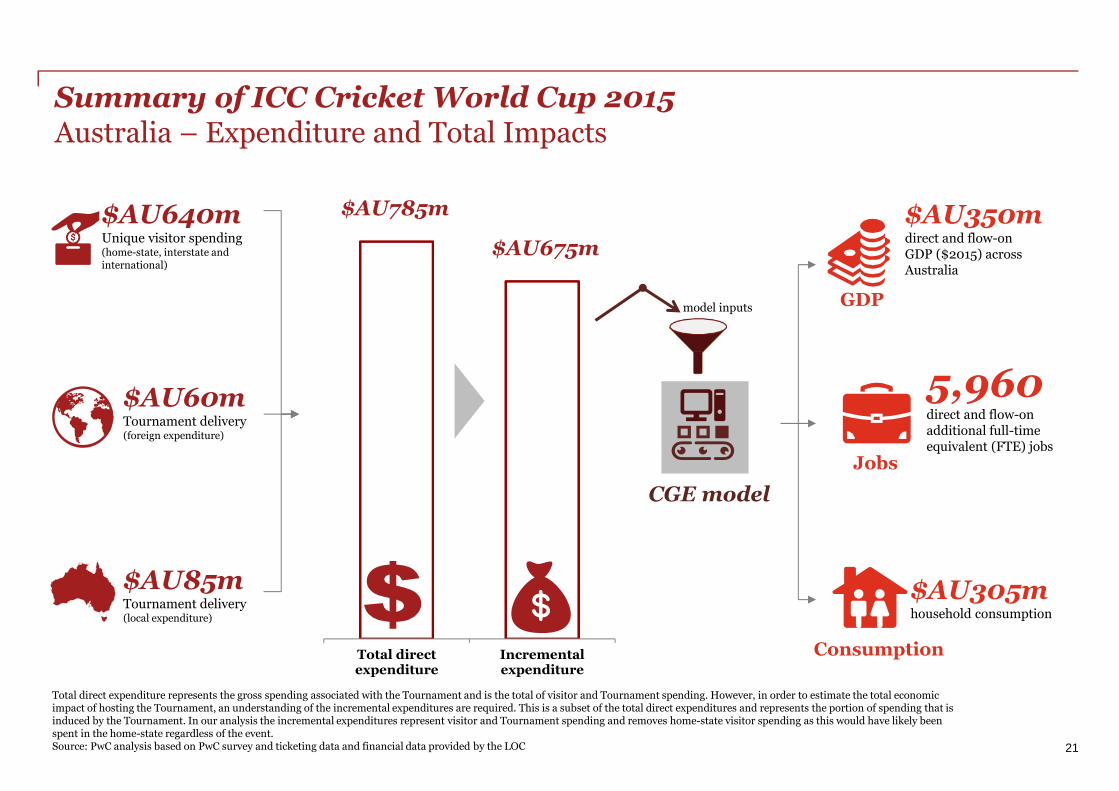
$AU785m
CGE model
$AU640mUnique visitor spending(home-state, interstate andinternational)
$AU350mdirect and flow-onGDP ($2015) acrossAustralia
$AU305mhousehold consumption
5,960direct and flow-onadditional full-timeequivalent (FTE) jobs
$AU60mTournament delivery(foreign expenditure)
$AU85mTournament delivery(local expenditure)
$AU675m
Total direct expenditure represents the gross spending associated with the Tournament and is the total of visitor and Tournament spending. However, in order to estimate the total economicimpact of hosting the Tournament, an understanding of the incremental expenditures are required. This is a subset of the total direct expenditures and represents the portion of spending that isinduced by the Tournament. In our analysis the incremental expenditures represent visitor and Tournament spending and removes home-state visitor spending as this would have likely beenspent in the home-state regardless of the event.Source: PwC analysis based on PwC survey and ticketing data and financial data provided by the LOC
Summary of ICC Cricket World Cup 2015Australia – Expenditure and Total Impacts
model inputs GDP
Jobs
Consumption
22
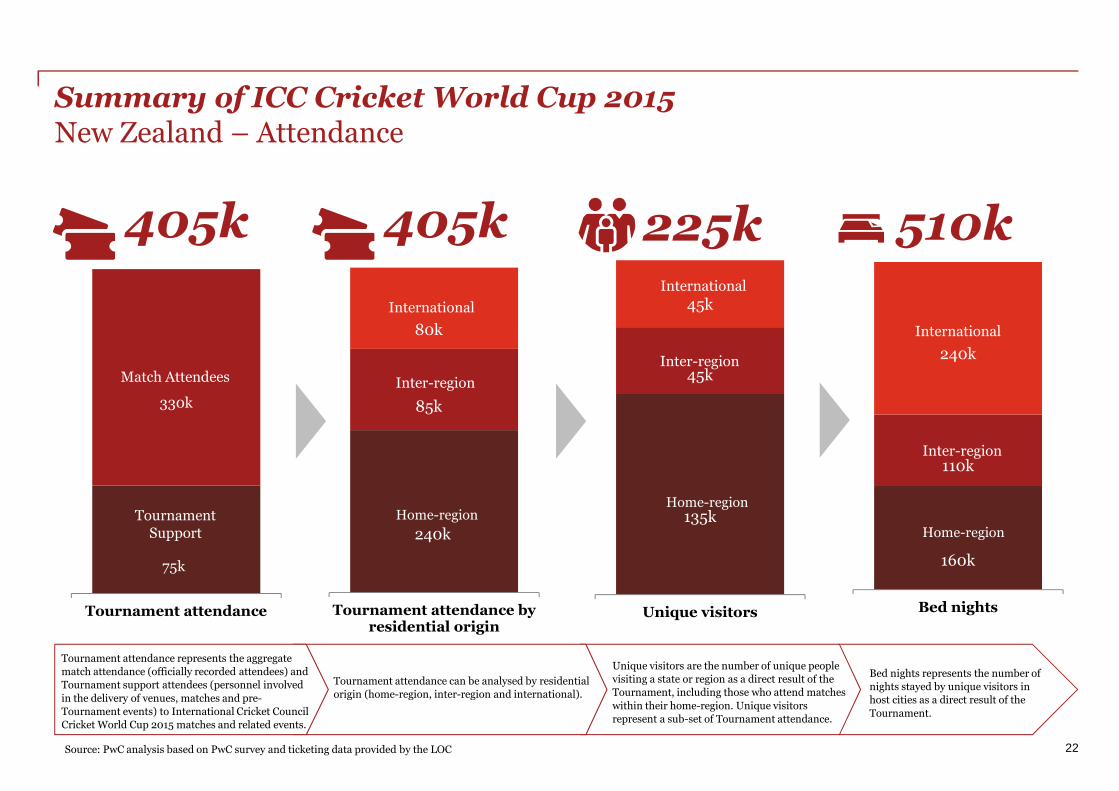
405k
240k
85k
80k
Tournament attendance byresidential origin
Home-region
Inter-region
International
405k
135k
45k
45k
Unique visitors
225k
160k
110k
240k
Bed nights
510k
Home-region
Inter-region
International
International
Inter-region
Home-region
Tournament attendance represents the aggregatematch attendance (officially recorded attendees) andTournament support attendees (personnel involved
in the delivery of venues, matches and pre-Tournament events) to International Cricket CouncilCricket World Cup 2015 matches and related events.
Tournament attendance can be analysed by residentialorigin (home-region, inter-region and international).
Unique visitors are the number of unique peoplevisiting a state or region as a direct result of theTournament, including those who attend matches
within their home-region. Unique visitorsrepresent a sub-set of Tournament attendance.
Bed nights represents the number ofnights stayed by unique visitors inhost cities as a direct result of the
Tournament.
Summary of ICC Cricket World Cup 2015New Zealand – Attendance
75k
330k
Tournament attendance
TournamentSupport
Match Attendees
Source: PwC analysis based on PwC survey and ticketing data provided by the LOC
Total directexpenditure
Incrementalexpenditure
Summary of ICC Cricket World Cup 2015New Zealand – Expenditure and Total Impacts
23
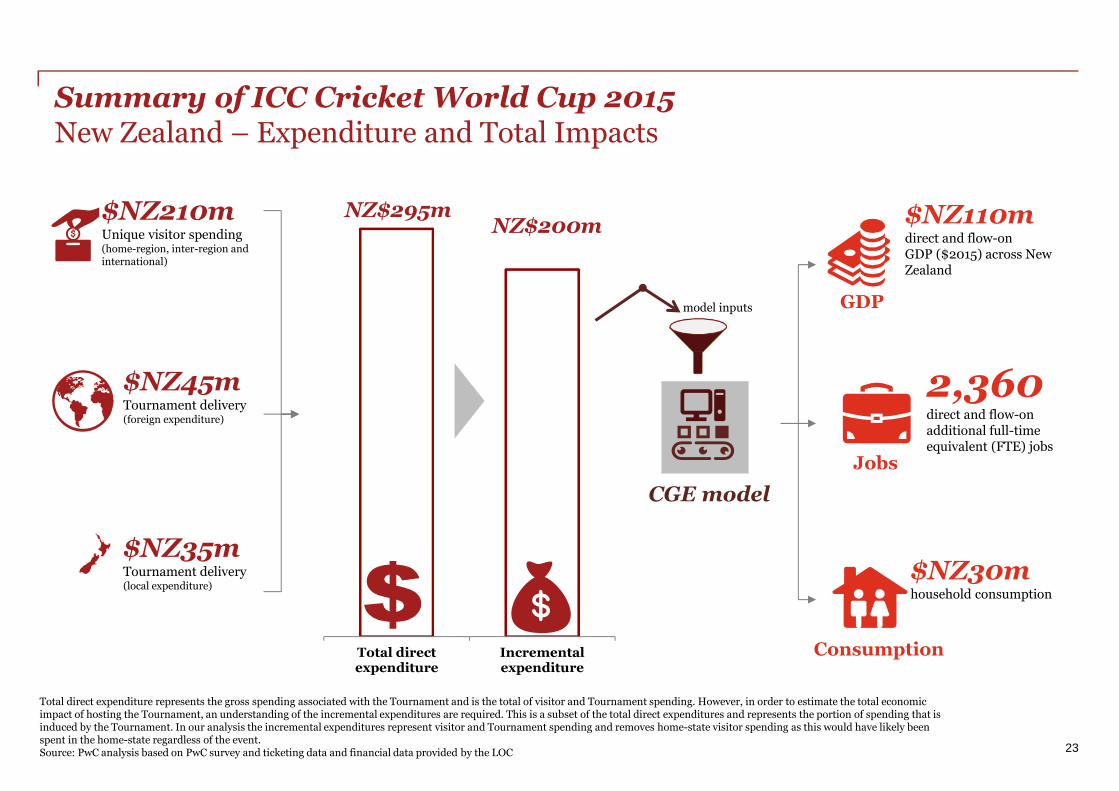
NZ$295m
CGE model
$NZ210mUnique visitor spending(home-region, inter-region andinternational)
$NZ110mdirect and flow-onGDP ($2015) across NewZealand
$NZ30mhousehold consumption
2,360direct and flow-onadditional full-timeequivalent (FTE) jobs
$NZ45mTournament delivery(foreign expenditure)
$NZ35mTournament delivery(local expenditure)
NZ$200m
Total direct expenditure represents the gross spending associated with the Tournament and is the total of visitor and Tournament spending. However, in order to estimate the total economicimpact of hosting the Tournament, an understanding of the incremental expenditures are required. This is a subset of the total direct expenditures and represents the portion of spending that isinduced by the Tournament. In our analysis the incremental expenditures represent visitor and Tournament spending and removes home-state visitor spending as this would have likely beenspent in the home-state regardless of the event.Source: PwC analysis based on PwC survey and ticketing data and financial data provided by the LOC
model inputs GDP
Jobs
Consumption
In contrast to economic impacts, broader benefits comprise measures that are qualitative in nature and may be either activity or outcome-based. They also describe long-termor downstream activity that may not normally be captured in economic impacts. While economic impacts make use of standard measures that can be estimated for nearly anytype of event, broader benefits and their accompanying measures may vary greatly by project. Outlined below are some of the broader benefits to New Zealand and Australia’seconomies of hosting the ICC CWC 2015.
25
Broader benefitsBranding and promotion
1 iSentia, http://isentia.sensed.com.au/, last viewed 20 May 20152 Newfanzone, https://newfanzone.wordpress.com/tag/icc-cricket-world-cup-2015/, last viewed 20 May 20153 Ibid4 Provided by the LOC5 Ibid6 International Cricket Council, http://www.icc-cricket.com/cricket-world-cup/news/2015/media-releases/87575/icc-chairman-hails-icc-cricket-world-cup-2015-as-most-popular-in-history, last viewed 18 May 2015
February 2015 March 2015
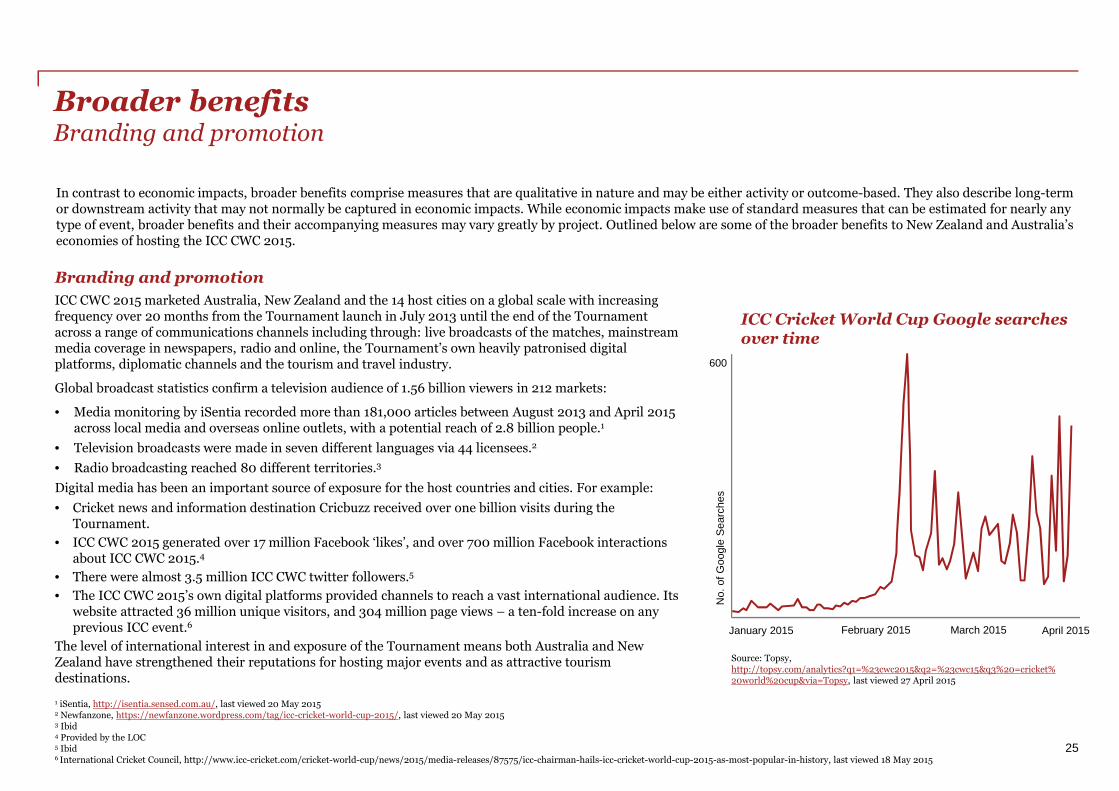
Source: Topsy,http://topsy.com/analytics?q1=%23cwc2015&q2=%23cwc15&q3%20=cricket%20world%20cup&via=Topsy, last viewed 27 April 2015
ICC Cricket World Cup Google searchesover time
No.
of
Searc
hes
600
Branding and promotion
ICC CWC 2015 marketed Australia, New Zealand and the 14 host cities on a global scale with increasingfrequency over 20 months from the Tournament launch in July 2013 until the end of the Tournamentacross a range of communications channels including through: live broadcasts of the matches, mainstreammedia coverage in newspapers, radio and online, the Tournament’s own heavily patronised digitalplatforms, diplomatic channels and the tourism and travel industry.
Global broadcast statistics confirm a television audience of 1.56 billion viewers in 212 markets:
• Media monitoring by iSentia recorded more than 181,000 articles between August 2013 and April 2015across local media and overseas online outlets, with a potential reach of 2.8 billion people.1
• Television broadcasts were made in seven different languages via 44 licensees.2
• Radio broadcasting reached 80 different territories.3
Digital media has been an important source of exposure for the host countries and cities. For example:
• Cricket news and information destination Cricbuzz received over one billion visits during theTournament.
• ICC CWC 2015 generated over 17 million Facebook ‘likes’, and over 700 million Facebook interactionsabout ICC CWC 2015.4
• There were almost 3.5 million ICC CWC twitter followers.5
• The ICC CWC 2015’s own digital platforms provided channels to reach a vast international audience. Itswebsite attracted 36 million unique visitors, and 304 million page views – a ten-fold increase on anyprevious ICC event.6
The level of international interest in and exposure of the Tournament means both Australia and NewZealand have strengthened their reputations for hosting major events and as attractive tourismdestinations.
January 2015 April 2015
26
Broader benefits (cont’d)
Tourism, infrastructure and trade
1 Tourism Research Australia: Visitor Arrivals Data, http://www.tourism.australia.com/statistics/arrivals.aspx, last viewed 21 May 20152 Statistics New Zealand: International Visitor Arrivals to New Zealand, http://www.stats.govt.nz/iva, last viewed 20 May 2015
Tourism
Australia and New Zealand and the host cities have enhanced their reputations asinternational tourist and business friendly destinations. Coordinated and streamlinedvisa and customs processes put in place by each national government made entry toboth countries more efficient for international visitors than it would otherwise havebeen. An innovative joint tourism visa for Australia and New Zealand wasimplemented for the first time as a direct result of the event.
The media opportunities provided by the Tournament are expected to have a ‘halo’affect that will encourage and drive future travel into the region. Strategic airline andpartners supplemented the appealing imagery and brand content for the Tournamentby providing a strong call-to-action and attractive packages for potential travellers tobook their holiday.
Arrivals data indicates that visitors to Australia and New Zealand from India duringthe January to March 2015 quarter were 33 per cent1 and 38 per cent2 higherrespectively than in the corresponding period in 2014.
Infrastructure
ICC CWC 2015 helped support the redevelopment of Hagley Oval in Christchurchand was a catalyst for infrastructure upgrades at Bellerive Oval in Hobart andManuka Oval in Canberra.
In addition, the Tournament provided a return on the investment in sportinginfrastructure in Host Cities by successive governments, validating the decision toinvest in these areas.
Trade
ICC CWC 2015 gave Australian and New Zealand businesses and governmentsan avenue to showcase their abilities and to host international investors,driving further indirect economic benefits from the Tournament. Austrade andNew Zealand Trade and Enterprise in conjunction with States and Regionsorganised specific programs for this purpose.
Both the Australian and New Zealand national governments and the Australianstate governments incorporated ICC CWC 2015 into a number of diplomaticinitiatives such as high-level government and official meetings. ICC CWC 2015promotional collateral was provided to support trade missions to India, SriLanka, Pakistan, South Africa, the Caribbean, the United States of Americaand the United Kingdom, boosting the level of interest and media coverage inthose countries.
Broader benefits (cont’d)
Connections and engagement
Connections
Relationships between the cricket administrative bodies in both countries and awide and diverse range of community groups and cricket stakeholders have beenconsiderably strengthened by ICC CWC 2015.
The next generation
There was a particular focus on engaging with children, recognising that they arethe future of the game as players, fans and supporters of the sport. 2,516Australian schools and 1,380 New Zealand schools took part in a bespoke schoolsprogram that offered online curriculum based learning and teaching resourcesdesigned to celebrate the game of cricket and ICC CWC 2015; every participatingschool in New Zealand received a cricket kit; the promotional programmes duringthe Tournament offered young cricket fans the chance to walk onto the field withtheir favourite players.1
Children were well represented among those who attended matches. There is anexpectation that the success of the Tournament, and specifically the success of theAustralian and New Zealand teams, will encourage greater numbers of children totake up the sport.
Participation
ICC CWC 2015 provided the opportunity for Cricket Australia and New ZealandCricket, along with State, Territory and Major Cricket Associations, their staff andstakeholders, to participate directly in the sport’s pinnacle international event.
This experience has provided many individuals within these organisations withdirect major event experience, which contributes both to their standing in theirprofession and their overall capability.
Widespread involvement
ICC CWC 2015 presented the community with the chance to get involved in theTournament in various capacities.
3,550 volunteers were accredited to perform a variety of roles during the Tournamentwhile 1,000 club bowlers had the opportunity to bowl to visiting teams duringscheduled training sessions.2
Once in a generation opportunity
As it was 23 years since ICC CWC was last hosted in Australia and New Zealand, the2015 Tournament was a rare and highly valued opportunity for New Zealand andAustralian cricket fans to watch the world’s elite cricket players live.
The event provided invaluable opportunities for local industries such as hospitalityand event management services to acquire further experience in hosting a majorevent.
New communities
Widespread involvement in large-scale events enhances social cohesion and a spirit ofcommunity. ICC CWC 2015 exemplified this by celebrating diversity in harmony,successfully attracting the interest and participation of multicultural communities.
Of the 20 sold out matches in the Tournament, eight did not involve either of the hostnations which demonstrated the high level of patronage by supporters of other teams.In fact 13 of the 14 teams played in front of sell out crowds.
The match between India and South Africa at the Melbourne Cricket Groundattracted 86,876 people – the highest attendance of any match in the Tournamentother than the Final.3
The strength of the multicultural connection with and interest in the Tournament wasfurther evidenced by ethnic business groups using the Tournament to actively engagein establishing or enhancing relationships with Australian, New Zealand and otherbusinesses and by the significant multicultural media coverage of the Tournament.
On average, one community activation event was hosted each week in the year leadingup to the Tournament.
271 Provided by the LOC2 Ibid3 Ibid
Broader benefits (cont’d)
Relationships
Government to government
The high level of government input to deliver the Tournament required considerablecommuniction and cooperation between the Australian Federal Government and theNew Zealand Government. This has contributed to a further strengthening of thealready close relationship between the two countries at top government levels.
The Australian and New Zealand Governments each established a centralised agencyto help coordinate their support and services across government agencies as well asTrans-Tasman government relations. The Major Sporting Events Taskforce inAustralia and the World Cups Office in New Zealand brought together the keygovernment departments and agencies including Immigration, Customs and BorderControl, Security, Foreign Affairs and Trade and Tourism.
National, state and local government
National, state and local government have been integral to the success of ICC CWC2015. An event of this scale cannot be delivered without the active participation andcooperation of all levels of government.
Government involvement was required in a wide number of areas, for example fromdeveloping the joint Australian/New Zealand tourism visa to on-the-ground supportin areas such as security, transport, customs and immigration.
In addition, anti-scalping and ambush marketing legislation was enhanced and thiswill protect future events.
State and regional coordination groups effectively integrated the planning anddelivery activities of key government departments and agencies together with cricketassociations and the LOC.
The engagement with the various levels of government has been intensive andpositive. Both Cricket Australia and New Zealand Cricket have strengthened existingrelationships with all levels of their respective governments and, importantly,established new relationships and linkages.
28
International
Delivering the Tournament required a high level of engagement withrepresentatives of participating teams’ governments in both host counties. Thishas provided both Cricket Australia and New Zealand Cricket with networks ofcontacts within diplomatic communities that are enthusiastic about cricket.
Broader benefits (cont’d)
Pride and social responsibility
29
Local pride
ICC CWC 2015 enhanced civic pride and amenity in host cities by providing localpeople with the chance to participate directly in a major international sportingevent and associated host city activities and celebrations.
National pride
ICC CWC 2015 was a large scale, international event. The successful hosting ofthe Tournament, the opportunity for Australians and New Zealanders to show offtheir countries to a large international audience and, importantly, the success ofthe both national teams engendered a sense of camaraderie and pride on anational scale.
Cricket pride
The Tournament has helped to reinvigorate one-day cricket as a format. In NewZealand in particular, the success of the Tournament and the performance of theBlack Caps generated renewed interest in cricket.
1 Provided by the LOC2 Ibid
Encouraging philanthropy
The Tournament had four official charity partners – two local and twointernational – who benefited from a platform to raise awareness for theirrespective causes. The partner charities were:
• The McGrath Foundation (breast cancer prevention and support)
• The Cancer Society of New Zealand
• Room to Read (an international literacy program)
• ThinkWise (HIV awareness and education)1
Vanuatu cyclone disaster relief
As a gesture of solidarity, the ICC, Cricket Australia, New Zealand Cricket andcricket fans contributed more than $200,000 during ICC CWC 2015 to assist thecommunities affected by Cyclone Pam.2
Key terms
31
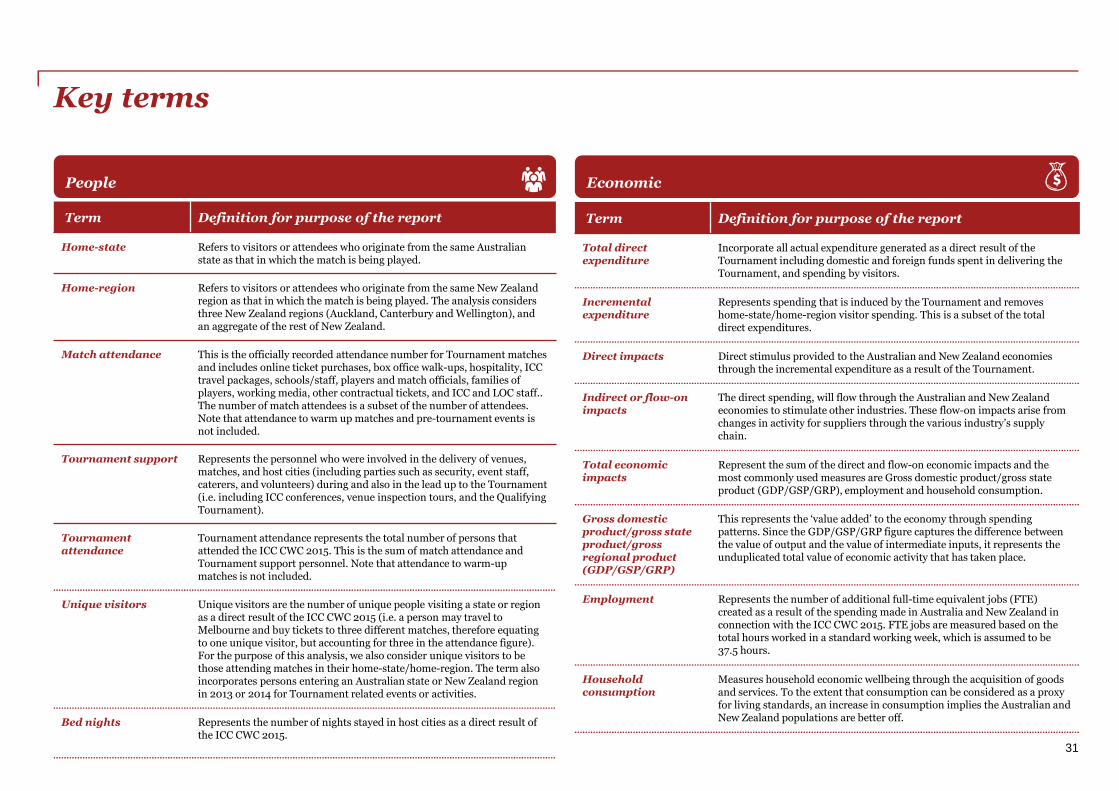
Term Definition for purpose of the report
Home-state Refers to visitors or attendees who originate from the same Australianstate as that in which the match is being played.
Home-region Refers to visitors or attendees who originate from the same New Zealandregion as that in which the match is being played. The analysis considersthree New Zealand regions (Auckland, Canterbury and Wellington), andan aggregate of the rest of New Zealand.
Match attendance This is the officially recorded attendance number for Tournament matchesand includes online ticket purchases, box office walk-ups, hospitality, ICCtravel packages, schools/staff, players and match officials, families ofplayers, working media, other contractual tickets, and ICC and LOC staff..The number of match attendees is a subset of the number of attendees.Note that attendance to warm up matches and pre-tournament events isnot included.
Tournament support Represents the personnel who were involved in the delivery of venues,matches, and host cities (including parties such as security, event staff,caterers, and volunteers) during and also in the lead up to the Tournament(i.e. including ICC conferences, venue inspection tours, and the QualifyingTournament).
Tournamentattendance
Tournament attendance represents the total number of persons thatattended the ICC CWC 2015. This is the sum of match attendance andTournament support personnel. Note that attendance to warm-upmatches is not included.
Unique visitors Unique visitors are the number of unique people visiting a state or regionas a direct result of the ICC CWC 2015 (i.e. a person may travel toMelbourne and buy tickets to three different matches, therefore equatingto one unique visitor, but accounting for three in the attendance figure).For the purpose of this analysis, we also consider unique visitors to bethose attending matches in their home-state/home-region. The term alsoincorporates persons entering an Australian state or New Zealand regionin 2013 or 2014 for Tournament related events or activities.
Bed nights Represents the number of nights stayed in host cities as a direct result ofthe ICC CWC 2015.
Term Definition for purpose of the report
Total directexpenditure
Incorporate all actual expenditure generated as a direct result of theTournament including domestic and foreign funds spent in delivering theTournament, and spending by visitors.
Incrementalexpenditure
Represents spending that is induced by the Tournament and removeshome-state/home-region visitor spending. This is a subset of the totaldirect expenditures.
Direct impacts Direct stimulus provided to the Australian and New Zealand economiesthrough the incremental expenditure as a result of the Tournament.
Indirect or flow-onimpacts
The direct spending, will flow through the Australian and New Zealandeconomies to stimulate other industries. These flow-on impacts arise fromchanges in activity for suppliers through the various industry’s supplychain.
Total economicimpacts
Represent the sum of the direct and flow-on economic impacts and themost commonly used measures are Gross domestic product/gross stateproduct (GDP/GSP/GRP), employment and household consumption.
Gross domesticproduct/gross stateproduct/grossregional product(GDP/GSP/GRP)
This represents the ‘value added’ to the economy through spendingpatterns. Since the GDP/GSP/GRP figure captures the difference betweenthe value of output and the value of intermediate inputs, it represents theunduplicated total value of economic activity that has taken place.
Employment Represents the number of additional full-time equivalent jobs (FTE)created as a result of the spending made in Australia and New Zealand inconnection with the ICC CWC 2015. FTE jobs are measured based on thetotal hours worked in a standard working week, which is assumed to be37.5 hours.
Householdconsumption
Measures household economic wellbeing through the acquisition of goodsand services. To the extent that consumption can be considered as a proxyfor living standards, an increase in consumption implies the Australian andNew Zealand populations are better off.
People Economic
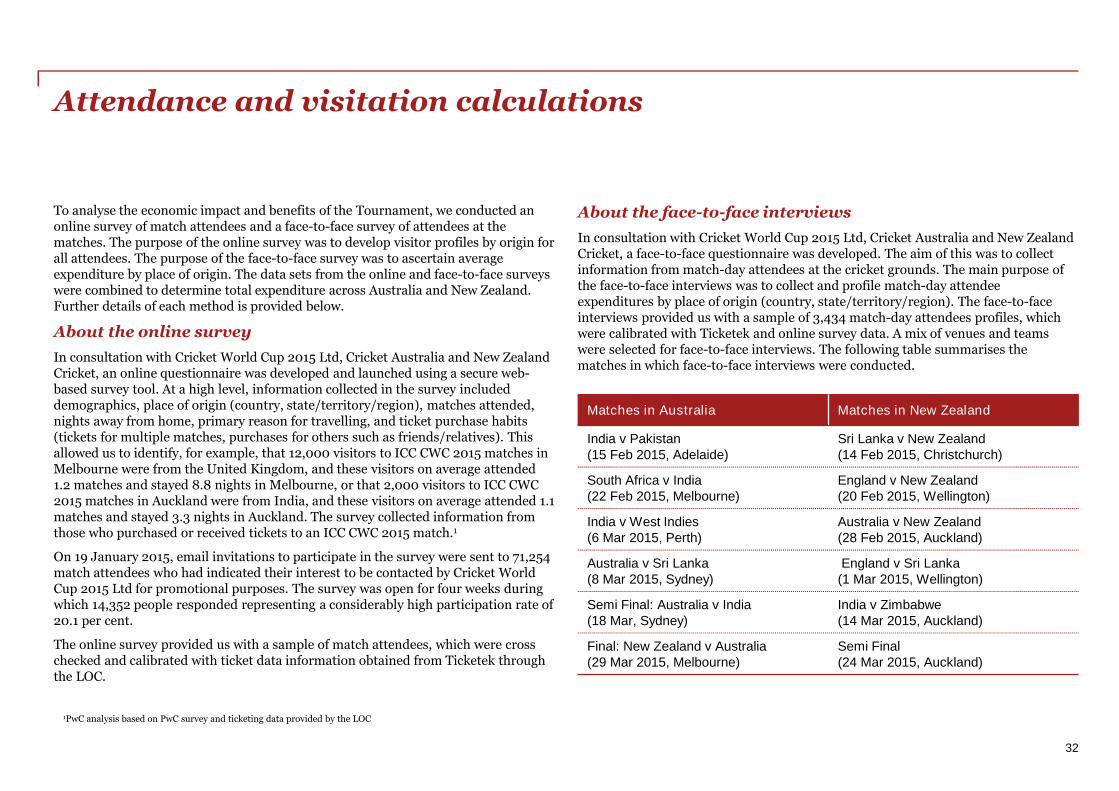
To analyse the economic impact and benefits of the Tournament, we conducted anonline survey of match attendees and a face-to-face survey of attendees at thematches. The purpose of the online survey was to develop visitor profiles by origin forall attendees. The purpose of the face-to-face survey was to ascertain averageexpenditure by place of origin. The data sets from the online and face-to-face surveyswere combined to determine total expenditure across Australia and New Zealand.Further details of each method is provided below.
About the online survey
In consultation with Cricket World Cup 2015 Ltd, Cricket Australia and New ZealandCricket, an online questionnaire was developed and launched using a secure web-based survey tool. At a high level, information collected in the survey includeddemographics, place of origin (country, state/territory/region), matches attended,nights away from home, primary reason for travelling, and ticket purchase habits(tickets for multiple matches, purchases for others such as friends/relatives). Thisallowed us to identify, for example, that 12,000 visitors to ICC CWC 2015 matches inMelbourne were from the United Kingdom, and these visitors on average attended1.2 matches and stayed 8.8 nights in Melbourne, or that 2,000 visitors to ICC CWC2015 matches in Auckland were from India, and these visitors on average attended 1.1matches and stayed 3.3 nights in Auckland. The survey collected information fromthose who purchased or received tickets to an ICC CWC 2015 match.1
On 19 January 2015, email invitations to participate in the survey were sent to 71,254match attendees who had indicated their interest to be contacted by Cricket WorldCup 2015 Ltd for promotional purposes. The survey was open for four weeks duringwhich 14,352 people responded representing a considerably high participation rate of20.1 per cent.
The online survey provided us with a sample of match attendees, which were crosschecked and calibrated with ticket data information obtained from Ticketek throughthe LOC.
About the face-to-face interviews
In consultation with Cricket World Cup 2015 Ltd, Cricket Australia and New ZealandCricket, a face-to-face questionnaire was developed. The aim of this was to collectinformation from match-day attendees at the cricket grounds. The main purpose ofthe face-to-face interviews was to collect and profile match-day attendeeexpenditures by place of origin (country, state/territory/region). The face-to-faceinterviews provided us with a sample of 3,434 match-day attendees profiles, whichwere calibrated with Ticketek and online survey data. A mix of venues and teamswere selected for face-to-face interviews. The following table summarises thematches in which face-to-face interviews were conducted.
Attendance and visitation calculations
32
Matches in Australia Matches in New Zealand
India v Pakistan(15 Feb 2015, Adelaide)
Sri Lanka v New Zealand(14 Feb 2015, Christchurch)
South Africa v India(22 Feb 2015, Melbourne)
England v New Zealand(20 Feb 2015, Wellington)
India v West Indies(6 Mar 2015, Perth)
Australia v New Zealand(28 Feb 2015, Auckland)
Australia v Sri Lanka(8 Mar 2015, Sydney)
England v Sri Lanka(1 Mar 2015, Wellington)
Semi Final: Australia v India(18 Mar, Sydney)
India v Zimbabwe(14 Mar 2015, Auckland)
Final: New Zealand v Australia(29 Mar 2015, Melbourne)
Semi Final(24 Mar 2015, Auckland)
1PwC analysis based on PwC survey and ticketing data provided by the LOC
Attendance and tourist spend
Total direct expenditure from tourist spend wasobtained through an online survey, as well as face-to-face surveys of match attendees. As discussed on theprevious page, the online survey enabled us to build aprofile of match attendees, while the face-to-face surveywas used to identify the average spend for attendeeswithin these profiles. Our survey data was thencalibrated with actual ticketing data and LOC data toform our data population.
Tournament related expenditure
In a global event such as this, the direct economicimpacts are predominately the result of expenditureson Australian and New Zealand goods and servicesassociated with the following:
• Pre-Tournament preparations over 2013 to 2015including stadia refurbishment, planning andoperational costs.
• Match day costs including venue dressing.
• International cricket team travel and per diemallowance.
• Host city contribution for the Tournament, programdelivery and security.
Total direct expenditures versusincremental expenditures
The total direct expenditures considered in this studyinclude all spending activities attributable to the ICCCWC 2015 and each component mentioned above isexplained further on the following pages.
To estimate the total economic impact (the sum of thedirect and flow-on economic impacts through economicmodelling discussed in subsequent pages), theincremental expenditures are required. While the totaldirect expenditures represent the gross spendingassociated with the ICC CWC 2015, the incrementalexpenditures is only that spending that is induced bythe ICC CWC 2015.
For all activities except visitor spend, the total directexpenditures are the same as the incrementalexpenditures, as none of the spending would haveoccurred if not for the ICC CWC 2015.
However, for visitor spend, the incrementalexpenditures were calculated as follows:
• All spending from international visitors (exceptbetween Australia and New Zealand) is included asthat is money coming from outside the economy.
Economic impact analysis
• Due to the ‘once in a lifetime’ nature of attending theICC CWC 2015, all spending on the actual game(tickets, merchandise) and getting to the game(airfares, accommodation) are regarded as inducedand coming out of savings, not sacrificing othernormal spending.
• For Australian and New Zealand visitors, spendingon food, drink, transport and retail is only includedas the net induced amount above ordinary dailyspending (as sourced from the Australian Bureau ofStatistics (ABS) Household Expenditure Survey andthe Statistics New Zealand Household EconomicSurvey).
Economic impacts
The incremental expenditures were then modelledusing a globally accepted robust computable generalequilibrium (CGE) model to assess the direct and flow-on economic impacts of all event related expenditure.This approach is superior to simply using input-outputanalysis and is the preferred approach of manyGovernments and Treasury Departments in Australiaand New Zealand.1
33
1 Australia: Department of Treasury and Finance (2013), Economic Evaluation for Business Cases Technical Guidelines, page 11New Zealand: Ministry of Business, Innovation and Employment, (2012) Post-Event Economic Evaluation Guidelines, page 3
Total economic impacts
When considering the total economic impacts, onlyincremental economic activity is considered. Therefore, theincremental portion of the total direct expenditure (excludinghome-state/home-region visitor activity) were modelled usingcomputable general equilibrium (CGE) analysis, which is aglobally accepted and robust approach. The purpose of thismodelling approach is to capture the total economic impacts(direct and flow-on) of an event, such as the ICC CWC 2015,on the economy. This technique overcomes the limitations ofsimpler input-output models, providing a more accurateestimate of the impacts and is the preferred approach of manygovernments and Treasury Departments in Australia and NewZealand.
Comprehensive economic impact analysis generally makesuse of sophisticated economic modelling to represent aneconomy and simulates the effect a change has on theeconomy. It incorporates detailed representations of industryproduction, consumption, government, trade, prices and thebehaviours that link the economy together.
For example, an incremental $1 spent directly in theAustralian or New Zealand economies in the restaurantindustry may stimulate a further 50 cents of spending by thatsector in the Australian or New Zealand food processingindustry, which would then lead to 25 cents of spending in theindustrial equipment industry. In this simple example, wewould say that the indirect effect was equal to 75 cents forevery $1 spent, for a total expenditure effect of 1.75. Fromthese expenditure impacts, the most commonly used of thesemeasures are, gross domestic product (GDP)/gross stateproduct (GSP)/gross regional product (GRP), employmentand household consumption.
Transfers of visitor spending
Visitor spending includes local (home-state/home-region),interstate/inter-region and international visitors. Interstate/inter-region visitor spend impacts the economy of thestate/region hosting the event so are included in ourcalculation of impacts. However, interstate /inter-regionspend results in a reduction in expenditure in the visitor’shome state/region, as visitors displace their home-state/home-region spend with host-state/host-region spend,essentially ‘cancelling out’ a portion of the total directexpenditure.
To account for this displacement of spending, we reduced theportion of the total direct visitor spending we considered inour CGE model to the incremental amount, by offsetting thevisitor spend in each state /region by the loss of ordinaryspending of residents of that state/region. In our analysis, weonly included the spend resulting from match attendance bystate/region less the typically spending by state/regionsourced from the Australian Bureau of Statistics HouseholdExpenditure Survey and the Statistics New ZealandHousehold Economic Survey.
For example, if ordinary daily spending on food is $10 inSouth Australia but a South Australian in Victoria for a gamespends $25 on food, the impact for that day is -$10 to SouthAustralia and +$25 to Victoria. Although the modelling inputsare state /region based, this results in a net national impact of+$15. Across thousands of visitors, this nets across to bepositive impacts to all relevant Australian states and NewZealand regions that will sum to total incremental spending.For home-state/home-region attendant of the game, there isno transfer across states so only the incremental amount iscounted in that state/region.
Total economic impact
In our CGE analysis, we have estimated the impacts of the ICCCWC 2015 on key macroeconomic variables. Each of thesemeasures is described below.
• Gross domestic product/gross state product/grossregional product (GDP/GSP/GRP) – this representsthe ‘value added’ to the economy through spendingpatterns. Since the GDP/GSP/GRP figure captures thedifference between the value of output and the value ofintermediate inputs, it represents the unduplicated totalvalue of economic activity that has taken place. TheGDP/GSP/GRP impacts in this report represent the valueadded to the economy as a result of the spending made inAustralia and New Zealand in connection with the ICCCWC 2015.
• Employment – represents the number of additional full-time equivalent jobs (FTE) created as a result of thespending made in Australia and New Zealand inconnection with the ICC CWC 2015.
• Household Consumption – measures householdeconomic wellbeing through the acquisition of goods andservices.
Indirect or flow-on impacts and total economic impacts aredescribed below.
• Indirect impacts or flow-on impacts – Theincremental spending, will flow through the Australianand New Zealand economies to stimulate other industries.These flow-on impacts arise from changes in activity forsuppliers through the various industry’s supply chain. Forexample, these impacts include companies that providegoods or services in connection with consumer spendingresulting from the Tournament. An example of an indirectimpact related to consumer spending would includeincremental demand for a food product supplier.
• Total impacts – represent the sum of the incrementaldirect and indirect economic impacts.
34
35
CGE modelling
CGE Modelling of Australian impacts
A CGE model is a mathematical model of an economy that is capable of capturingeconomy-wide impacts and inter-sectoral reallocation of resources that may resultfrom a ‘shock’ (that is, change in the status quo) to the economy. CGE models arewidely used in economic analysis of policies and projects around the world includingin Australia by both government and the private sector.
Both input-output (I-O) modelling and CGE modelling have been used previously inthe preparation of economic impact assessment for sporting events. However, weprefer to use CGE analysis as it provides a more robust assessment that is used andaccepted by government departments, particularly Treasury departments in Australiaand New Zealand. Using CGE modelling to measure economy-wide impacts issuperior to simply using input-output analysis. For example, I-O models can onlyscale up or down industries, with no regard for economic interactions andconstraints, while CGE models include these features. This means CGE models areable to more realistically capture indirect impacts such as the impact on pricesthrough increased demand for a finite product, or the impact on cost structures ofadditional demand for finite labour and capital.
The core data of a CGE model is an input-output table. An input-output table is asystem of accounts which shows, in value terms, the supply and disposal of goods andservices within the economy in a particular year. An input-output table captures salesof products to other industries for further processing (intermediate usage) or to thevarious categories of final demand. It also captures the inputs used in an industry’sproduction, whether they be intermediate or primary inputs (such as labour andcapital). The table is balanced such that total inputs to each industry are equal tototal outputs from each industry. Essentially, an input-output table is a snapshot ofan economy (whether it is a region, state, territory or country) in a particular year.
A CGE model attempts to ‘push forward’ the base input-output table through time byutilising a set of equations that capture neoclassical microeconomic theory todetermine behaviour of economic agents (such as households, governments,industries) when they are faced with changes in key economic variables, especiallyrelative prices. The equations are solved simultaneously, where some variables aredetermined by the model (endogenous variables) and some are determined outsidethe model (exogenous variables). The classification of endogenous and exogenousvariables is determined by the user based on the set of assumptions derived for thespecific modelling exercise. CGE modelling is a widely used economic impact analysistool for simulating the economy-wide effects of projects or policies, often involvinglarge expenditures and revenues, which represent ‘shocks’ to the economy. CGEmodels recognise that complex macroeconomic mechanisms and inter-industryinteractions exist in the economy and, in light of this, replicate how the economy willadjust to ‘shocks’ from significant projects and policies.
We employed a static computable general equilibrium modelling to estimate indirectand total impacts of spending activities related to the ICC CWC 2015 in Australia. Theeconomic impact assessment has been undertaken using The Enormous RegionalModel (TERM) developed by the Centre of Policy Studies (CoPS) at VictoriaUniversity (Melbourne, Australia).
The analysis was conducted to estimate key macroeconomic variables(GDP/GSP/GRP), household consumption and employment) of the Australiannational economy and eight Australian state and territory economies.
36
CGE modelling
For example, the national impact on sector ‘A’ from the CGE model is allocatedacross each of the regions. These allocations are in line with the shares (orproportions) derived from the multiplier models’ calculated impact on sector ‘A’ ineach of the regions.
This approach ensures that the differing structures of the regional economies arereflected in regional impact estimates, while also ensuring that the total of theimpacts across the four regions is equal to that estimated by the national CGE model.
Economy-wide modelling of New Zealand’s national and regional economies wereundertaken in a two step approach described below.
Modelling of New Zealand National impacts
At the New Zealand national level, impacts were estimated using the Business andEconomic Research Limited (BERL) economy-wide computable general equilibrium(CGE) model. BERL’s standard CGE model identifies 53 separate production sectors,using 40 occupation (skill) types of labour input and one physical capital input asproduction factors. These sectors produce 25 export commodities and eightconsumption commodities, demanded by domestic and overseas consumers as wellas government. The domestic household sector is divided into five different incomeclasses.
The model’s database is built on the latest official Statistics New Zealand inter-industry transactions table for the 2006/07 year. This table has been updated byBERL to the 2013/14 year using national accounts totals and data from Statistics NewZealand Annual Enterprise Survey, Business Demography Statistics and otherancillary data sources.
Modelling of New Zealand Regional impacts
Multiplier models for each of four regions (Auckland, Wellington, Canterbury, andthe rest of New Zealand) were constructed to assess the economic impacts of theTournament related spending. These multiplier models were constructed using2010/11 input-output transactions matrices for these areas, which were in turn builtfrom official Statistics New Zealand 2006/07 national input-output information, andregional data from Business Demography Statistics. Multipliers for GDP,employment and household consumption were used to estimate the indirect and totalimpacts at the regional level.
To ensure consistency between region and national impacts, estimates from themultiplier model for each region were used to determine each region’s share of thetotal New Zealand impact. These results were then calibrated on an industry level tonational impacts.
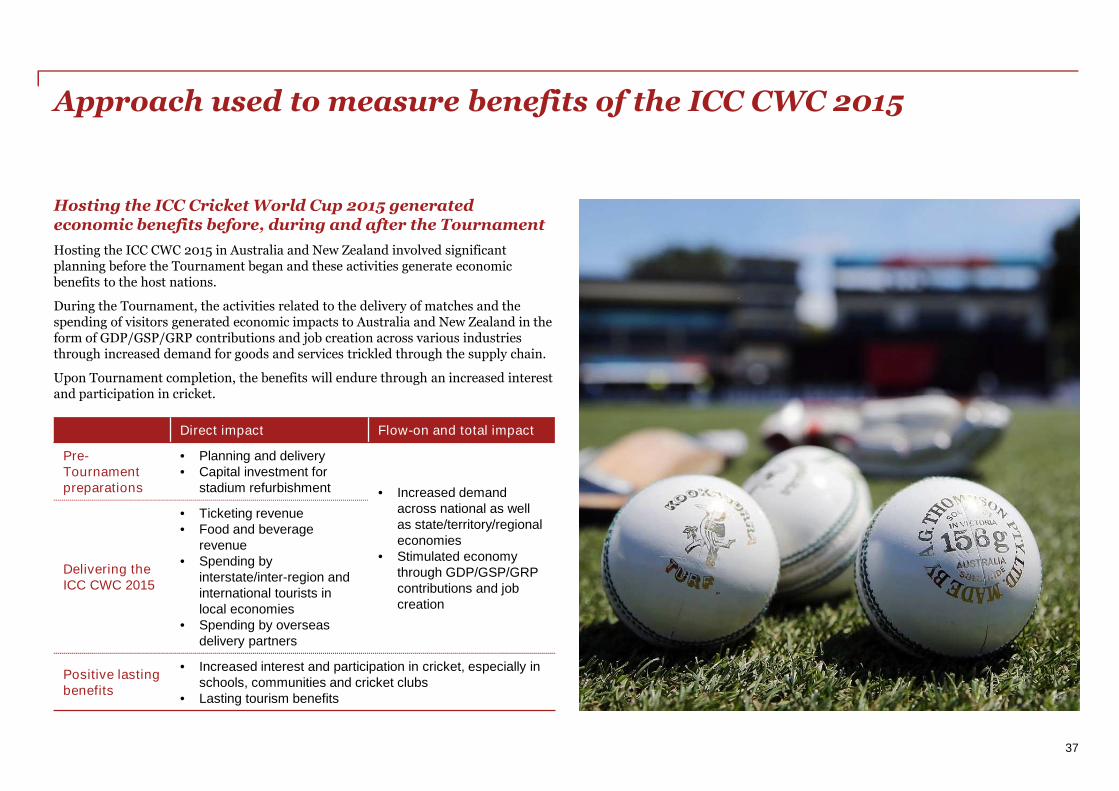
37
Hosting the ICC Cricket World Cup 2015 generatedeconomic benefits before, during and after the Tournament
Hosting the ICC CWC 2015 in Australia and New Zealand involved significantplanning before the Tournament began and these activities generate economicbenefits to the host nations.
During the Tournament, the activities related to the delivery of matches and thespending of visitors generated economic impacts to Australia and New Zealand in theform of GDP/GSP/GRP contributions and job creation across various industriesthrough increased demand for goods and services trickled through the supply chain.
Upon Tournament completion, the benefits will endure through an increased interestand participation in cricket.
Approach used to measure benefits of the ICC CWC 2015
Direct impact Flow-on and total impact
Pre-Tournamentpreparations
• Planning and delivery• Capital investment for
stadium refurbishment • Increased demandacross national as wellas state/territory/regionaleconomies
• Stimulated economythrough GDP/GSP/GRPcontributions and jobcreation
Delivering theICC CWC 2015
• Ticketing revenue• Food and beverage
revenue• Spending by
interstate/inter-region andinternational tourists inlocal economies
• Spending by overseasdelivery partners
Positive lastingbenefits
• Increased interest and participation in cricket, especially inschools, communities and cricket clubs
• Lasting tourism benefits
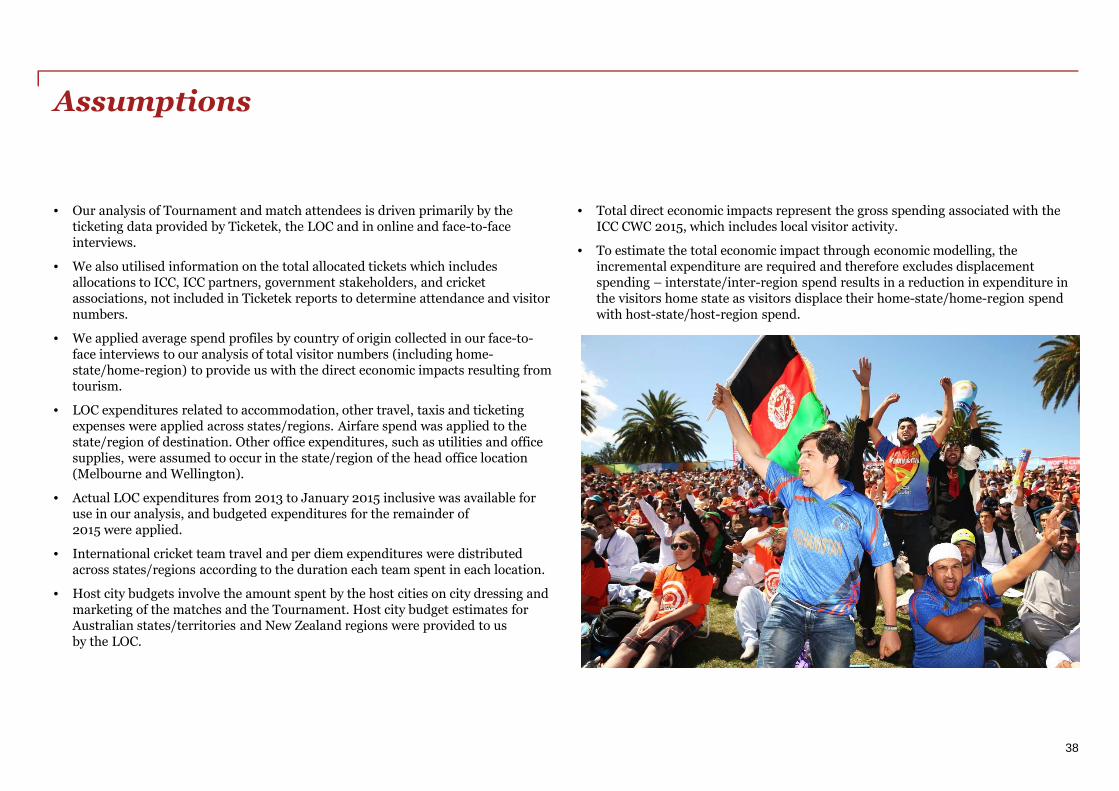
38
• Our analysis of Tournament and match attendees is driven primarily by theticketing data provided by Ticketek, the LOC and in online and face-to-faceinterviews.
• We also utilised information on the total allocated tickets which includesallocations to ICC, ICC partners, government stakeholders, and cricketassociations, not included in Ticketek reports to determine attendance and visitornumbers.
• We applied average spend profiles by country of origin collected in our face-to-face interviews to our analysis of total visitor numbers (including home-state/home-region) to provide us with the direct economic impacts resulting fromtourism.
• LOC expenditures related to accommodation, other travel, taxis and ticketingexpenses were applied across states/regions. Airfare spend was applied to thestate/region of destination. Other office expenditures, such as utilities and officesupplies, were assumed to occur in the state/region of the head office location(Melbourne and Wellington).
• Actual LOC expenditures from 2013 to January 2015 inclusive was available foruse in our analysis, and budgeted expenditures for the remainder of2015 were applied.
• International cricket team travel and per diem expenditures were distributedacross states/regions according to the duration each team spent in each location.
• Host city budgets involve the amount spent by the host cities on city dressing andmarketing of the matches and the Tournament. Host city budget estimates forAustralian states/territories and New Zealand regions were provided to usby the LOC.
• Total direct economic impacts represent the gross spending associated with theICC CWC 2015, which includes local visitor activity.
• To estimate the total economic impact through economic modelling, theincremental expenditure are required and therefore excludes displacementspending – interstate/inter-region spend results in a reduction in expenditure inthe visitors home state as visitors displace their home-state/home-region spendwith host-state/host-region spend.
Assumptions

The following tables show a snapshot of the total impacts of the Tournament across the two countries. The first table focuses on visitation and spending, split by level ofdisaggregation of visitor type (home-state/home-region, interstate/inter-region and international). The second table outlines total GDP, household consumption andemployment impacts across the two countries.
40
Total impacts of ICC Cricket World Cup 2015
All (Home-state/home-region,interstate-inter-region and
international)
Interstate/inter-region andinternational
International only
Match attendance 1,016,421 541,511 265,714
Tournament attendance 1,172,319 559,249 269,119
Average number of matches per unique visitor 2.0 1.9 1.8
Unique visitors to Tournament matches 595,000 295,000 145,000*
Average bed nights 3.4 5.3 7.2
Total bed nights 1,995,000 1,585,000 1,055,000
Average spend per unique visitor (AU$, nominal) $1,500 $2,710 $2,960
Average spend per unique visitor (NZ$, nominal) $1,570 $2,850 $3,110
Total visitor spend (AU$, nominal) $850,000,000 $780,000,000 $415,000,000
Total visitor spend (NZ$, nominal) $895,000,000 $815,000,000 $435,000,000
* Includes trans-Tasman visitors (50,000)
Impact
Total direct expenditure (AU$) AU$1,100,000,000
Total direct expenditure (NZ$) AU$1,125,000,000
Incremental expenditure (AU$) $865,000,000
Incremental expenditure (NZ$) $910,000,000
Total GDP impacts (AU$2015) $460,000,000
Total GDP impacts (NZ$2015) $480,000,000
Additional jobs created (FTE) 8,320
Total household consumption (AU$2015) $330,000,000
Total household consumption (NZ$2015) $350,000,000
Note: All figures are GST inclusive. Visitor numbers are rounded to the nearest 5,000; Bed night are rounded to the nearest 5,000; Average spend and FTEs are rounded to the nearest $10; Visitor spend, Total expenditure, GDP and Householdconsumption are rounded to the nearest $5,000,000. As each individual number is rounded to these denominations, totals may not sum in some instances. This includes summation of Australia and New Zealand dollar values to arrive at dualcurrency totals across both nations. Exchange rates have been applied as relevant averages across 2013 – 2015, sourced from the Reserve Bank of Australia. That is, expenditures incurred in 2013 have been applied at the 2013 exchange rate,and so on. 2015 exchange rates are representative of January to March only. Exchange rates used for each year are as follows: 2013: 1 AUD = 1.17 NZD, 2014: 1 AUD = 1.09 NZD, 2015: 1 AUD = 1.05 NZD.Source: PwC analysis based on PwC survey and ticketing data and financial data provided by the LOC
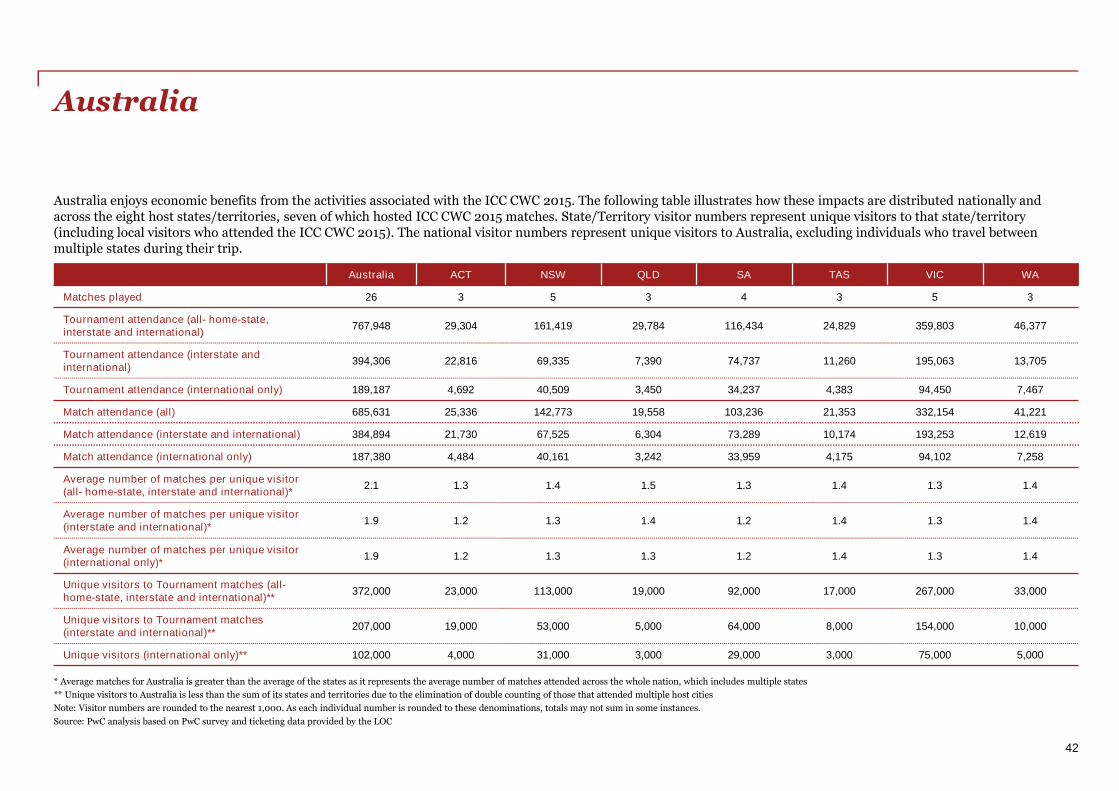
Australia enjoys economic benefits from the activities associated with the ICC CWC 2015. The following table illustrates how these impacts are distributed nationally andacross the eight host states/territories, seven of which hosted ICC CWC 2015 matches. State/Territory visitor numbers represent unique visitors to that state/territory(including local visitors who attended the ICC CWC 2015). The national visitor numbers represent unique visitors to Australia, excluding individuals who travel betweenmultiple states during their trip.
42
Australia
Australia ACT NSW QLD SA TAS VIC WA
Matches played 26 3 5 3 4 3 5 3
Tournament attendance (all- home-state,interstate and international)
767,948 29,304 161,419 29,784 116,434 24,829 359,803 46,377
Tournament attendance (interstate andinternational)
394,306 22,816 69,335 7,390 74,737 11,260 195,063 13,705
Tournament attendance (international only) 189,187 4,692 40,509 3,450 34,237 4,383 94,450 7,467
Match attendance (all) 685,631 25,336 142,773 19,558 103,236 21,353 332,154 41,221
Match attendance (interstate and international) 384,894 21,730 67,525 6,304 73,289 10,174 193,253 12,619
Match attendance (international only) 187,380 4,484 40,161 3,242 33,959 4,175 94,102 7,258
Average number of matches per unique visitor(all- home-state, interstate and international)*
2.1 1.3 1.4 1.5 1.3 1.4 1.3 1.4
Average number of matches per unique visitor(interstate and international)*
1.9 1.2 1.3 1.4 1.2 1.4 1.3 1.4
Average number of matches per unique visitor(international only)*
1.9 1.2 1.3 1.3 1.2 1.4 1.3 1.4
Unique visitors to Tournament matches (all-home-state, interstate and international)**
372,000 23,000 113,000 19,000 92,000 17,000 267,000 33,000
Unique visitors to Tournament matches(interstate and international)**
207,000 19,000 53,000 5,000 64,000 8,000 154,000 10,000
Unique visitors (international only)** 102,000 4,000 31,000 3,000 29,000 3,000 75,000 5,000
* Average matches for Australia is greater than the average of the states as it represents the average number of matches attended across the whole nation, which includes multiple states
** Unique visitors to Australia is less than the sum of its states and territories due to the elimination of double counting of those that attended multiple host cities
Note: Visitor numbers are rounded to the nearest 1,000. As each individual number is rounded to these denominations, totals may not sum in some instances.
Source: PwC analysis based on PwC survey and ticketing data provided by the LOC
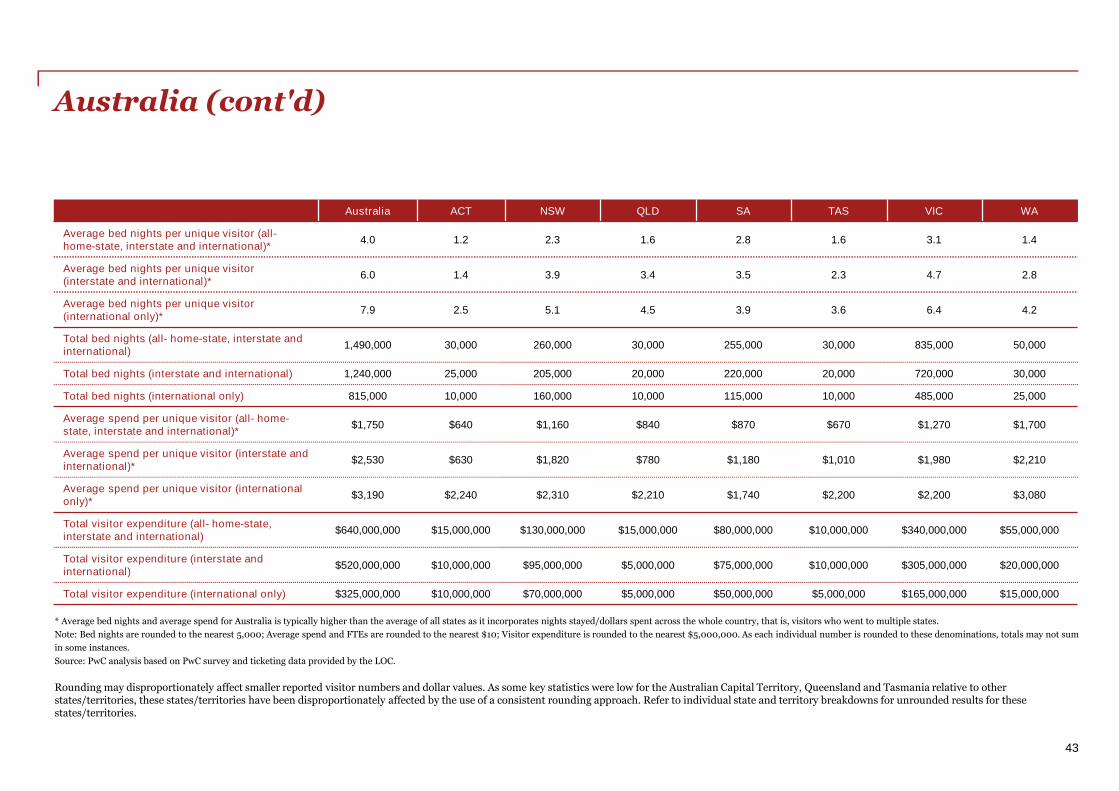
43
Australia (cont'd)
Australia ACT NSW QLD SA TAS VIC WA
Average bed nights per unique visitor (all-home-state, interstate and international)*
4.0 1.2 2.3 1.6 2.8 1.6 3.1 1.4
Average bed nights per unique visitor(interstate and international)*
6.0 1.4 3.9 3.4 3.5 2.3 4.7 2.8
Average bed nights per unique visitor(international only)*
7.9 2.5 5.1 4.5 3.9 3.6 6.4 4.2
Total bed nights (all- home-state, interstate andinternational)
1,490,000 30,000 260,000 30,000 255,000 30,000 835,000 50,000
Total bed nights (interstate and international) 1,240,000 25,000 205,000 20,000 220,000 20,000 720,000 30,000
Total bed nights (international only) 815,000 10,000 160,000 10,000 115,000 10,000 485,000 25,000
Average spend per unique visitor (all- home-state, interstate and international)*
$1,750 $640 $1,160 $840 $870 $670 $1,270 $1,700
Average spend per unique visitor (interstate andinternational)*
$2,530 $630 $1,820 $780 $1,180 $1,010 $1,980 $2,210
Average spend per unique visitor (internationalonly)*
$3,190 $2,240 $2,310 $2,210 $1,740 $2,200 $2,200 $3,080
Total visitor expenditure (all- home-state,interstate and international)
$640,000,000 $15,000,000 $130,000,000 $15,000,000 $80,000,000 $10,000,000 $340,000,000 $55,000,000
Total visitor expenditure (interstate andinternational)
$520,000,000 $10,000,000 $95,000,000 $5,000,000 $75,000,000 $10,000,000 $305,000,000 $20,000,000
Total visitor expenditure (international only) $325,000,000 $10,000,000 $70,000,000 $5,000,000 $50,000,000 $5,000,000 $165,000,000 $15,000,000
* Average bed nights and average spend for Australia is typically higher than the average of all states as it incorporates nights stayed/dollars spent across the whole country, that is, visitors who went to multiple states.
Note: Bed nights are rounded to the nearest 5,000; Average spend and FTEs are rounded to the nearest $10; Visitor expenditure is rounded to the nearest $5,000,000. As each individual number is rounded to these denominations, totals may not sum
in some instances.
Source: PwC analysis based on PwC survey and ticketing data provided by the LOC.
Rounding may disproportionately affect smaller reported visitor numbers and dollar values. As some key statistics were low for the Australian Capital Territory, Queensland and Tasmania relative to otherstates/territories, these states/territories have been disproportionately affected by the use of a consistent rounding approach. Refer to individual state and territory breakdowns for unrounded results for thesestates/territories.
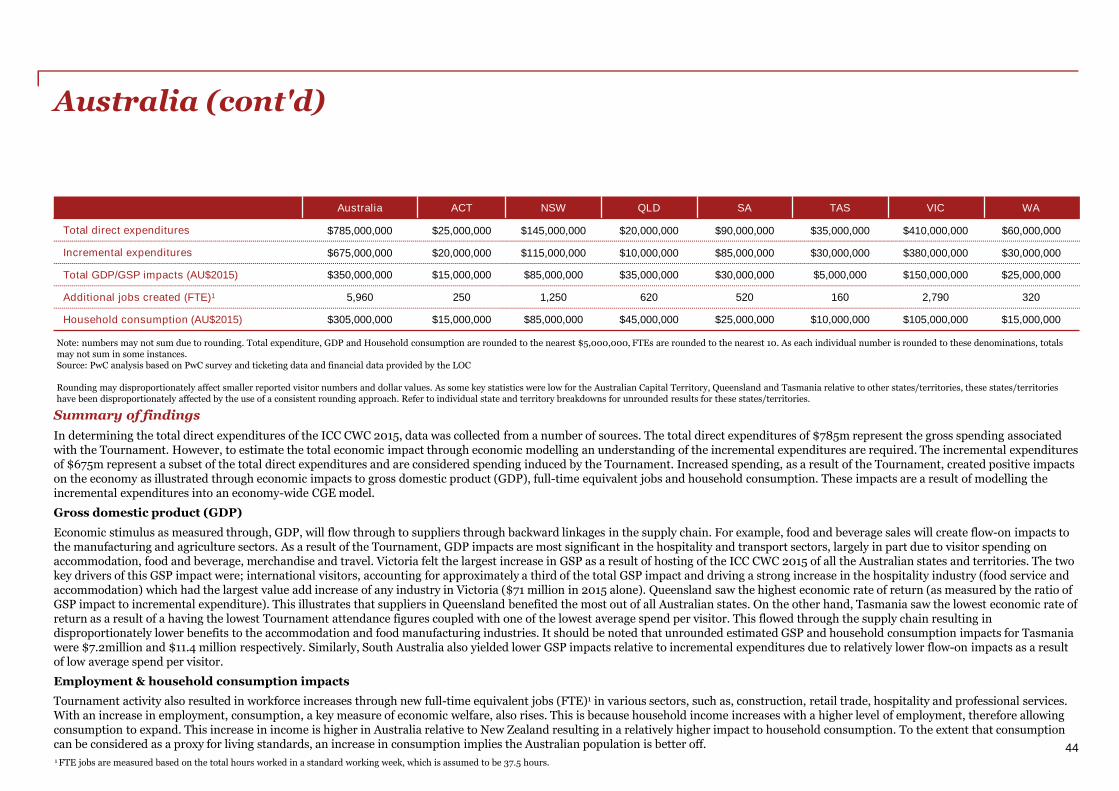
Summary of findings
In determining the total direct expenditures of the ICC CWC 2015, data was collected from a number of sources. The total direct expenditures of $785m represent the gross spending associatedwith the Tournament. However, to estimate the total economic impact through economic modelling an understanding of the incremental expenditures are required. The incremental expendituresof $675m represent a subset of the total direct expenditures and are considered spending induced by the Tournament. Increased spending, as a result of the Tournament, created positive impactson the economy as illustrated through economic impacts to gross domestic product (GDP), full-time equivalent jobs and household consumption. These impacts are a result of modelling theincremental expenditures into an economy-wide CGE model.
Gross domestic product (GDP)
Economic stimulus as measured through, GDP, will flow through to suppliers through backward linkages in the supply chain. For example, food and beverage sales will create flow-on impacts tothe manufacturing and agriculture sectors. As a result of the Tournament, GDP impacts are most significant in the hospitality and transport sectors, largely in part due to visitor spending onaccommodation, food and beverage, merchandise and travel. Victoria felt the largest increase in GSP as a result of hosting of the ICC CWC 2015 of all the Australian states and territories. The twokey drivers of this GSP impact were; international visitors, accounting for approximately a third of the total GSP impact and driving a strong increase in the hospitality industry (food service andaccommodation) which had the largest value add increase of any industry in Victoria ($71 million in 2015 alone). Queensland saw the highest economic rate of return (as measured by the ratio ofGSP impact to incremental expenditure). This illustrates that suppliers in Queensland benefited the most out of all Australian states. On the other hand, Tasmania saw the lowest economic rate ofreturn as a result of a having the lowest Tournament attendance figures coupled with one of the lowest average spend per visitor. This flowed through the supply chain resulting indisproportionately lower benefits to the accommodation and food manufacturing industries. It should be noted that unrounded estimated GSP and household consumption impacts for Tasmaniawere $7.2million and $11.4 million respectively. Similarly, South Australia also yielded lower GSP impacts relative to incremental expenditures due to relatively lower flow-on impacts as a resultof low average spend per visitor.
Employment & household consumption impacts
Tournament activity also resulted in workforce increases through new full-time equivalent jobs (FTE)1 in various sectors, such as, construction, retail trade, hospitality and professional services.With an increase in employment, consumption, a key measure of economic welfare, also rises. This is because household income increases with a higher level of employment, therefore allowingconsumption to expand. This increase in income is higher in Australia relative to New Zealand resulting in a relatively higher impact to household consumption. To the extent that consumptioncan be considered as a proxy for living standards, an increase in consumption implies the Australian population is better off. 44
Australia (cont'd)
Australia ACT NSW QLD SA TAS VIC WA
Total direct expenditures $785,000,000 $25,000,000 $145,000,000 $20,000,000 $90,000,000 $35,000,000 $410,000,000 $60,000,000
Incremental expenditures $675,000,000 $20,000,000 $115,000,000 $10,000,000 $85,000,000 $30,000,000 $380,000,000 $30,000,000
Total GDP/GSP impacts (AU$2015) $350,000,000 $15,000,000 $85,000,000 $35,000,000 $30,000,000 $5,000,000 $150,000,000 $25,000,000
Additional jobs created (FTE)1 5,960 250 1,250 620 520 160 2,790 320
Household consumption (AU$2015) $305,000,000 $15,000,000 $85,000,000 $45,000,000 $25,000,000 $10,000,000 $105,000,000 $15,000,000
1 FTE jobs are measured based on the total hours worked in a standard working week, which is assumed to be 37.5 hours.
Note: numbers may not sum due to rounding. Total expenditure, GDP and Household consumption are rounded to the nearest $5,000,000, FTEs are rounded to the nearest 10. As each individual number is rounded to these denominations, totalsmay not sum in some instances.Source: PwC analysis based on PwC survey and ticketing data and financial data provided by the LOC
Rounding may disproportionately affect smaller reported visitor numbers and dollar values. As some key statistics were low for the Australian Capital Territory, Queensland and Tasmania relative to other states/territories, these states/territorieshave been disproportionately affected by the use of a consistent rounding approach. Refer to individual state and territory breakdowns for unrounded results for these states/territories.
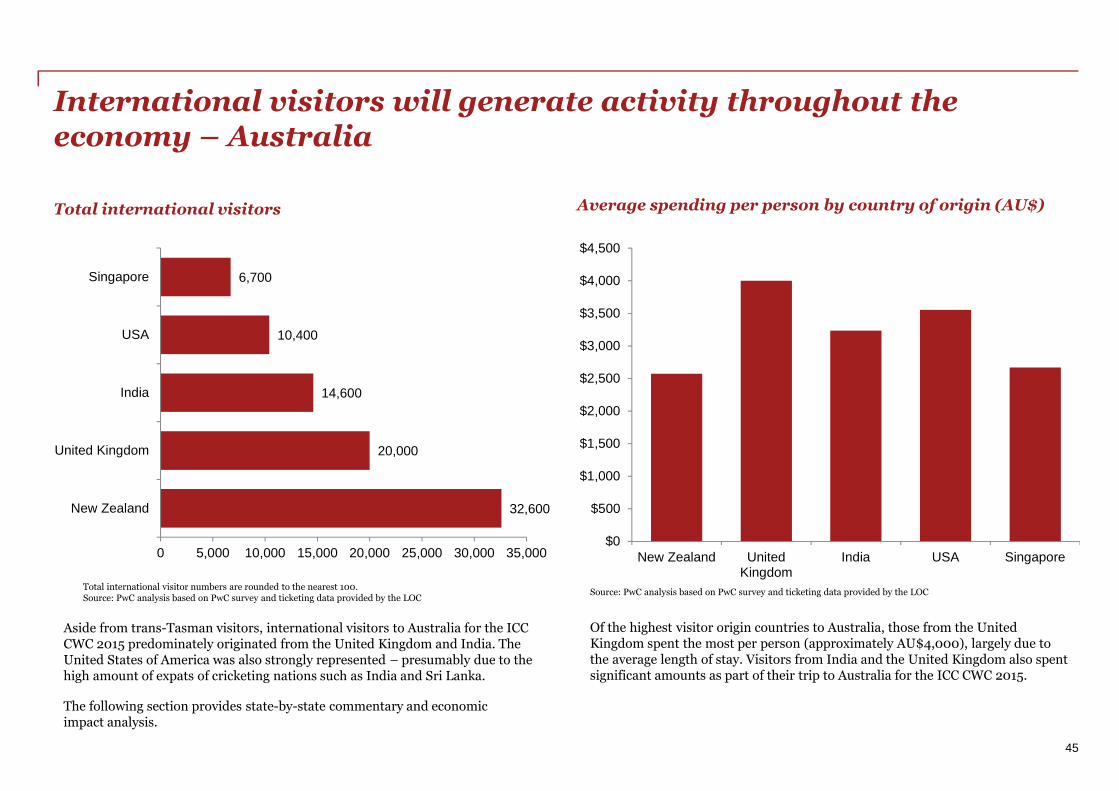
Total international visitors
International visitors will generate activity throughout theeconomy – Australia
45
32,600
20,000
14,600
10,400
6,700
0 5,000 10,000 15,000 20,000 25,000 30,000 35,000
New Zealand
United Kingdom
India
USA
Singapore
$0
$500
$1,000
$1,500
$2,000
$2,500
$3,000
$3,500
$4,000
$4,500
New Zealand UnitedKingdom
India USA Singapore
Aside from trans-Tasman visitors, international visitors to Australia for the ICCCWC 2015 predominately originated from the United Kingdom and India. TheUnited States of America was also strongly represented – presumably due to thehigh amount of expats of cricketing nations such as India and Sri Lanka.
Average spending per person by country of origin (AU$)
Source: PwC analysis based on PwC survey and ticketing data provided by the LOCTotal international visitor numbers are rounded to the nearest 100.Source: PwC analysis based on PwC survey and ticketing data provided by the LOC
The following section provides state-by-state commentary and economicimpact analysis.
Of the highest visitor origin countries to Australia, those from the UnitedKingdom spent the most per person (approximately AU$4,000), largely due tothe average length of stay. Visitors from India and the United Kingdom also spentsignificant amounts as part of their trip to Australia for the ICC CWC 2015.
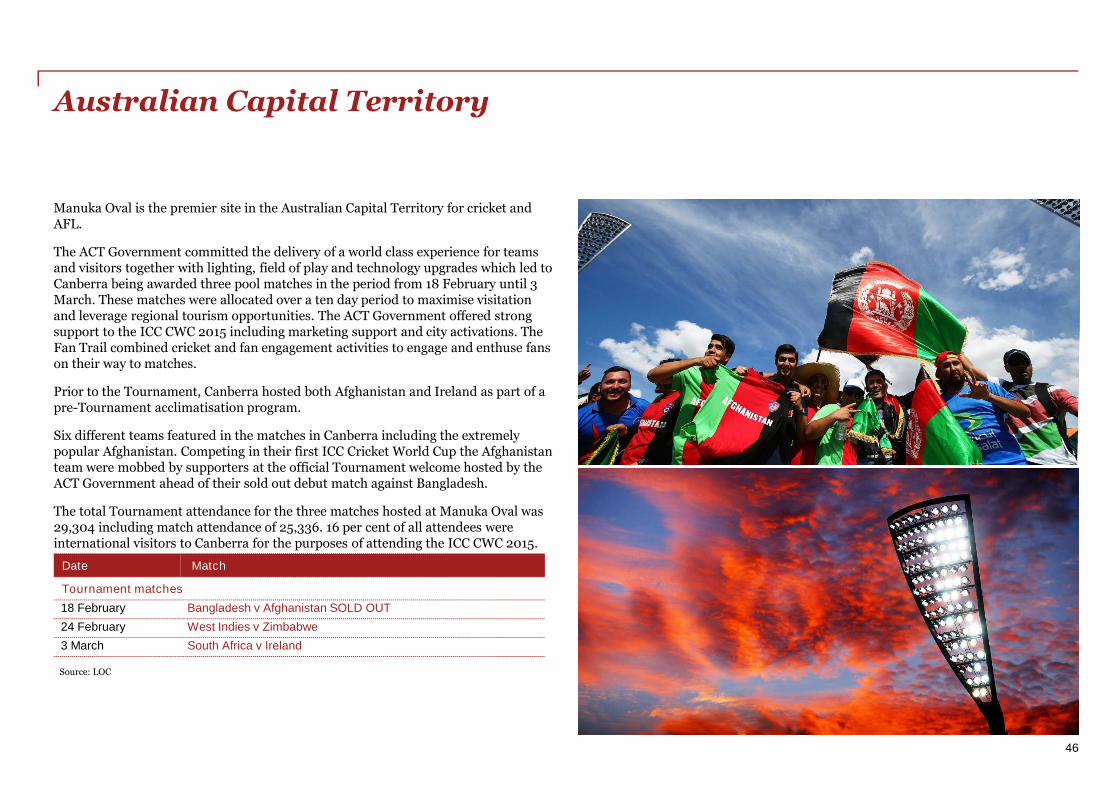
46
Manuka Oval is the premier site in the Australian Capital Territory for cricket andAFL.
The ACT Government committed the delivery of a world class experience for teamsand visitors together with lighting, field of play and technology upgrades which led toCanberra being awarded three pool matches in the period from 18 February until 3March. These matches were allocated over a ten day period to maximise visitationand leverage regional tourism opportunities. The ACT Government offered strongsupport to the ICC CWC 2015 including marketing support and city activations. TheFan Trail combined cricket and fan engagement activities to engage and enthuse fanson their way to matches.
Prior to the Tournament, Canberra hosted both Afghanistan and Ireland as part of apre-Tournament acclimatisation program.
Six different teams featured in the matches in Canberra including the extremelypopular Afghanistan. Competing in their first ICC Cricket World Cup the Afghanistanteam were mobbed by supporters at the official Tournament welcome hosted by theACT Government ahead of their sold out debut match against Bangladesh.
The total Tournament attendance for the three matches hosted at Manuka Oval was29,304 including match attendance of 25,336. 16 per cent of all attendees wereinternational visitors to Canberra for the purposes of attending the ICC CWC 2015.
Australian Capital Territory
Date Match
Tournament matches
18 February Bangladesh v Afghanistan SOLD OUT
24 February West Indies v Zimbabwe
3 March South Africa v Ireland
Source: LOC
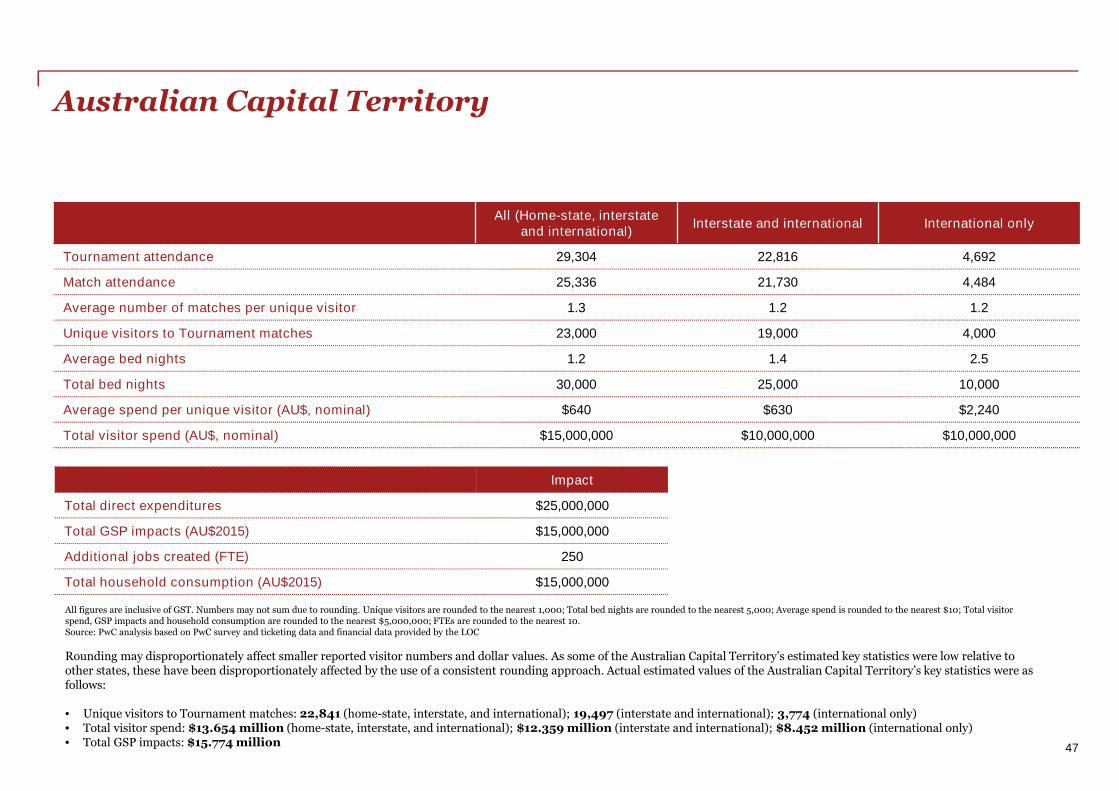
47
Australian Capital Territory
All (Home-state, interstateand international)
Interstate and international International only
Tournament attendance 29,304 22,816 4,692
Match attendance 25,336 21,730 4,484
Average number of matches per unique visitor 1.3 1.2 1.2
Unique visitors to Tournament matches 23,000 19,000 4,000
Average bed nights 1.2 1.4 2.5
Total bed nights 30,000 25,000 10,000
Average spend per unique visitor (AU$, nominal) $640 $630 $2,240
Total visitor spend (AU$, nominal) $15,000,000 $10,000,000 $10,000,000
Impact
Total direct expenditures $25,000,000
Total GSP impacts (AU$2015) $15,000,000
Additional jobs created (FTE) 250
Total household consumption (AU$2015) $15,000,000
All figures are inclusive of GST. Numbers may not sum due to rounding. Unique visitors are rounded to the nearest 1,000; Total bed nights are rounded to the nearest 5,000; Average spend is rounded to the nearest $10; Total visitorspend, GSP impacts and household consumption are rounded to the nearest $5,000,000; FTEs are rounded to the nearest 10.Source: PwC analysis based on PwC survey and ticketing data and financial data provided by the LOC
Rounding may disproportionately affect smaller reported visitor numbers and dollar values. As some of the Australian Capital Territory’s estimated key statistics were low relative toother states, these have been disproportionately affected by the use of a consistent rounding approach. Actual estimated values of the Australian Capital Territory’s key statistics were asfollows:
• Unique visitors to Tournament matches: 22,841 (home-state, interstate, and international); 19,497 (interstate and international); 3,774 (international only)• Total visitor spend: $13.654 million (home-state, interstate, and international); $12.359 million (interstate and international); $8.452 million (international only)• Total GSP impacts: $15.774 million
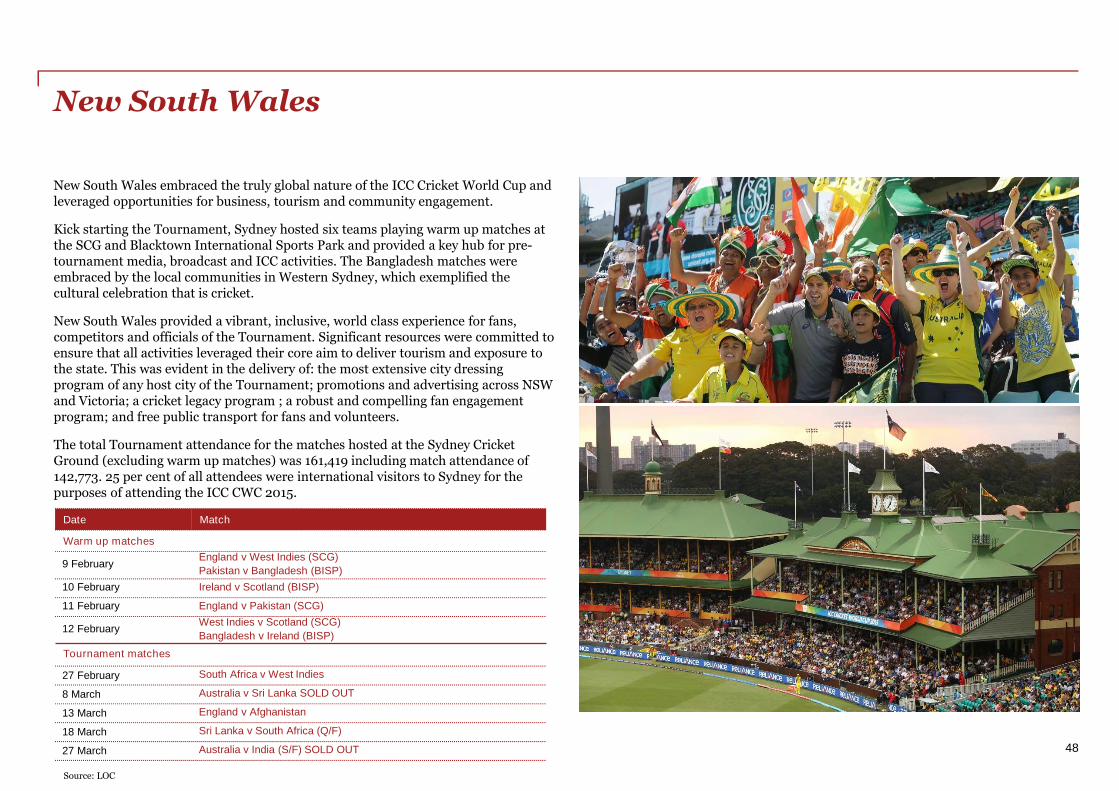
48
New South Wales embraced the truly global nature of the ICC Cricket World Cup andleveraged opportunities for business, tourism and community engagement.
Kick starting the Tournament, Sydney hosted six teams playing warm up matches atthe SCG and Blacktown International Sports Park and provided a key hub for pre-tournament media, broadcast and ICC activities. The Bangladesh matches wereembraced by the local communities in Western Sydney, which exemplified thecultural celebration that is cricket.
New South Wales provided a vibrant, inclusive, world class experience for fans,competitors and officials of the Tournament. Significant resources were committed toensure that all activities leveraged their core aim to deliver tourism and exposure tothe state. This was evident in the delivery of: the most extensive city dressingprogram of any host city of the Tournament; promotions and advertising across NSWand Victoria; a cricket legacy program ; a robust and compelling fan engagementprogram; and free public transport for fans and volunteers.
The total Tournament attendance for the matches hosted at the Sydney CricketGround (excluding warm up matches) was 161,419 including match attendance of142,773. 25 per cent of all attendees were international visitors to Sydney for thepurposes of attending the ICC CWC 2015.
New South Wales
Date Match
Warm up matches
9 FebruaryEngland v West Indies (SCG)
Pakistan v Bangladesh (BISP)
10 February Ireland v Scotland (BISP)
11 February England v Pakistan (SCG)
12 FebruaryWest Indies v Scotland (SCG)
Bangladesh v Ireland (BISP)
Tournament matches
27 February South Africa v West Indies
8 March Australia v Sri Lanka SOLD OUT
13 March England v Afghanistan
18 March Sri Lanka v South Africa (Q/F)
27 March Australia v India (S/F) SOLD OUT
Source: LOC

49
New South Wales
All (Home-state, interstateand international)
Interstate and international International only
Tournament attendance 161,419 69,335 40,509
Match attendance 142,773 67,525 40,161
Average number of matches per unique visitor 1.4 1.3 1.3
Unique visitors to Tournament matches 113,000 53,000 31,000
Average bed nights 2.3 3.9 5.1
Total bed nights 260,000 205,000 160,000
Average spend per unique visitor (AU$, nominal) $1,160 $1,820 $2,310
Total visitor spend (AU$, nominal) $130,000,000 $95,000,000 $70,000,000
Impact
Total direct expenditures $145,000,000
Total GSP impacts (AU$2015) $85,000,000
Additional jobs created (FTE) 1,250
Total household consumption (AU$2015) $85,000,000
All figures are inclusive of GST. Numbers may not sum due to rounding. Unique visitors are rounded to the nearest 1,000; Total bed nights are rounded to the nearest 5,000; Average spend is rounded to the nearest $10; Total visitorspend, GSP impacts and household consumption are rounded to the nearest $5,000,000; FTEs are rounded to the nearest 10.Source: PwC analysis based on PwC survey and ticketing data and financial data provided by the LOC
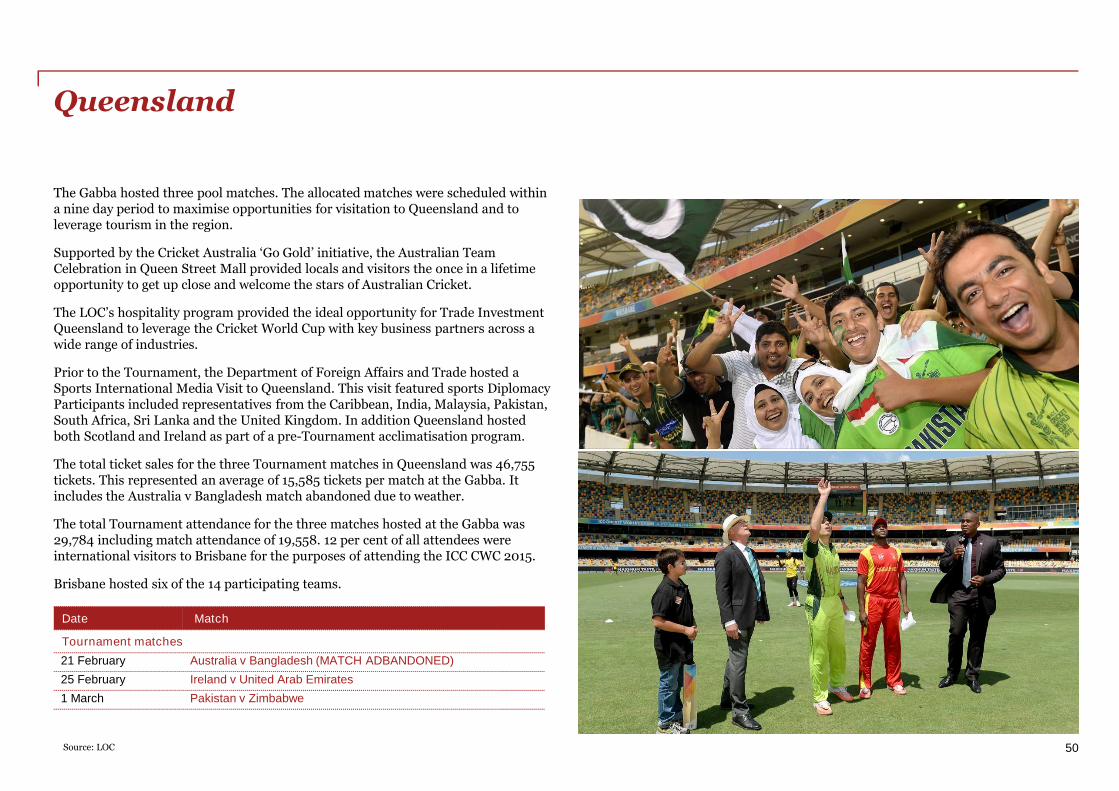
50
The Gabba hosted three pool matches. The allocated matches were scheduled withina nine day period to maximise opportunities for visitation to Queensland and toleverage tourism in the region.
Supported by the Cricket Australia ‘Go Gold’ initiative, the Australian TeamCelebration in Queen Street Mall provided locals and visitors the once in a lifetimeopportunity to get up close and welcome the stars of Australian Cricket.
The LOC’s hospitality program provided the ideal opportunity for Trade InvestmentQueensland to leverage the Cricket World Cup with key business partners across awide range of industries.
Prior to the Tournament, the Department of Foreign Affairs and Trade hosted aSports International Media Visit to Queensland. This visit featured sports DiplomacyParticipants included representatives from the Caribbean, India, Malaysia, Pakistan,South Africa, Sri Lanka and the United Kingdom. In addition Queensland hostedboth Scotland and Ireland as part of a pre-Tournament acclimatisation program.
The total ticket sales for the three Tournament matches in Queensland was 46,755tickets. This represented an average of 15,585 tickets per match at the Gabba. Itincludes the Australia v Bangladesh match abandoned due to weather.
The total Tournament attendance for the three matches hosted at the Gabba was29,784 including match attendance of 19,558. 12 per cent of all attendees wereinternational visitors to Brisbane for the purposes of attending the ICC CWC 2015.
Brisbane hosted six of the 14 participating teams.
Queensland
Date Match
Tournament matches
21 February Australia v Bangladesh (MATCH ADBANDONED)
25 February Ireland v United Arab Emirates
1 March Pakistan v Zimbabwe
Source: LOC
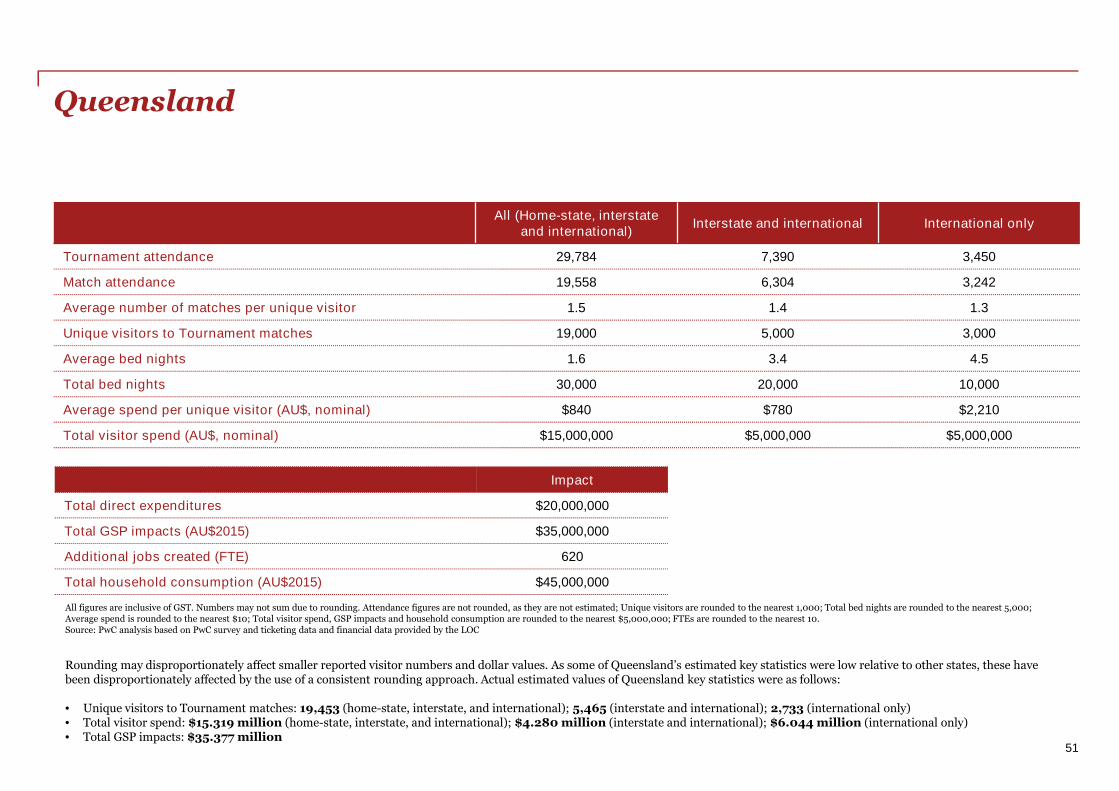
51
Queensland
All (Home-state, interstateand international)
Interstate and international International only
Tournament attendance 29,784 7,390 3,450
Match attendance 19,558 6,304 3,242
Average number of matches per unique visitor 1.5 1.4 1.3
Unique visitors to Tournament matches 19,000 5,000 3,000
Average bed nights 1.6 3.4 4.5
Total bed nights 30,000 20,000 10,000
Average spend per unique visitor (AU$, nominal) $840 $780 $2,210
Total visitor spend (AU$, nominal) $15,000,000 $5,000,000 $5,000,000
Impact
Total direct expenditures $20,000,000
Total GSP impacts (AU$2015) $35,000,000
Additional jobs created (FTE) 620
Total household consumption (AU$2015) $45,000,000
All figures are inclusive of GST. Numbers may not sum due to rounding. Attendance figures are not rounded, as they are not estimated; Unique visitors are rounded to the nearest 1,000; Total bed nights are rounded to the nearest 5,000;Average spend is rounded to the nearest $10; Total visitor spend, GSP impacts and household consumption are rounded to the nearest $5,000,000; FTEs are rounded to the nearest 10.Source: PwC analysis based on PwC survey and ticketing data and financial data provided by the LOC
Rounding may disproportionately affect smaller reported visitor numbers and dollar values. As some of Queensland’s estimated key statistics were low relative to other states, these havebeen disproportionately affected by the use of a consistent rounding approach. Actual estimated values of Queensland key statistics were as follows:
• Unique visitors to Tournament matches: 19,453 (home-state, interstate, and international); 5,465 (interstate and international); 2,733 (international only)• Total visitor spend: $15.319 million (home-state, interstate, and international); $4.280 million (interstate and international); $6.044 million (international only)• Total GSP impacts: $35.377 million
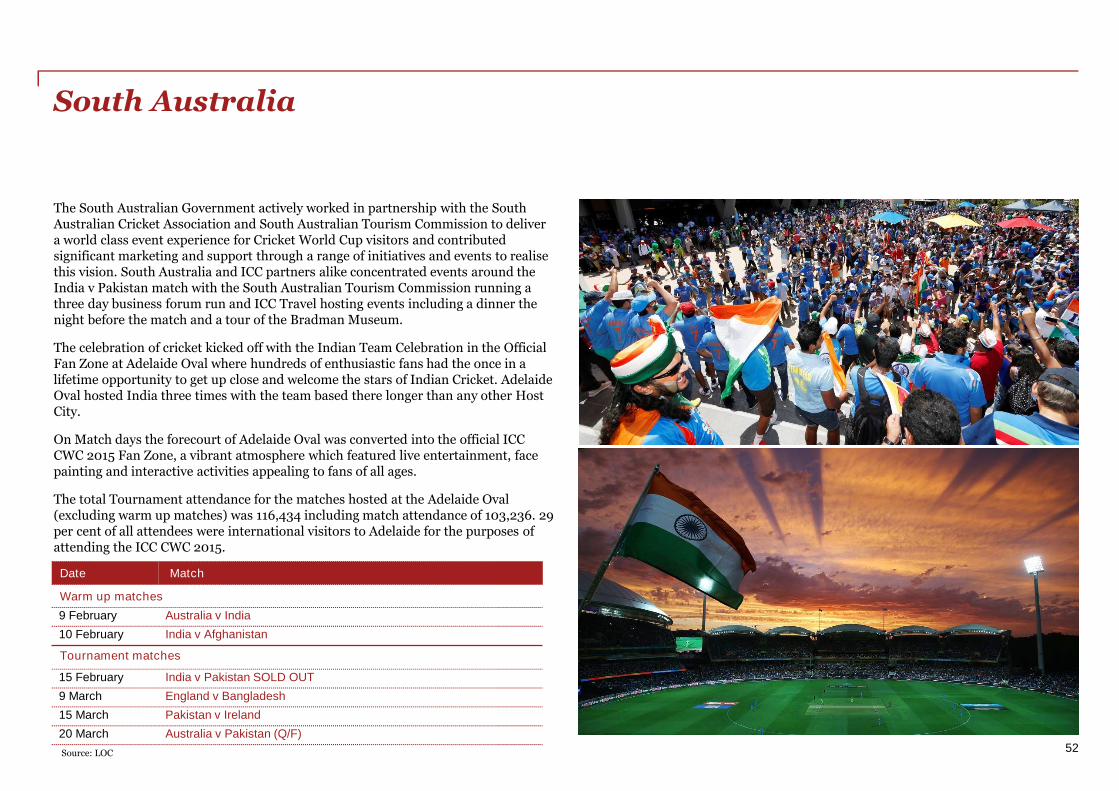
52
The South Australian Government actively worked in partnership with the SouthAustralian Cricket Association and South Australian Tourism Commission to delivera world class event experience for Cricket World Cup visitors and contributedsignificant marketing and support through a range of initiatives and events to realisethis vision. South Australia and ICC partners alike concentrated events around theIndia v Pakistan match with the South Australian Tourism Commission running athree day business forum run and ICC Travel hosting events including a dinner thenight before the match and a tour of the Bradman Museum.
The celebration of cricket kicked off with the Indian Team Celebration in the OfficialFan Zone at Adelaide Oval where hundreds of enthusiastic fans had the once in alifetime opportunity to get up close and welcome the stars of Indian Cricket. AdelaideOval hosted India three times with the team based there longer than any other HostCity.
On Match days the forecourt of Adelaide Oval was converted into the official ICCCWC 2015 Fan Zone, a vibrant atmosphere which featured live entertainment, facepainting and interactive activities appealing to fans of all ages.
The total Tournament attendance for the matches hosted at the Adelaide Oval(excluding warm up matches) was 116,434 including match attendance of 103,236. 29per cent of all attendees were international visitors to Adelaide for the purposes ofattending the ICC CWC 2015.
South Australia
Date Match
Warm up matches
9 February Australia v India
10 February India v Afghanistan
Tournament matches
15 February India v Pakistan SOLD OUT
9 March England v Bangladesh
15 March Pakistan v Ireland
20 March Australia v Pakistan (Q/F)
Source: LOC

53
South Australia
All (Home-state, interstateand international)
Interstate and international International only
Tournament attendance 116,434 74,737 34,237
Match attendance 103,236 73,289 33,959
Average number of matches per unique visitor 1.3 1.2 1.2
Unique visitors to Tournament matches 92,000 64,000 29,000
Average bed nights 2.8 3.5 3.9
Total bed nights 255,000 220,000 115,000
Average spend per unique visitor (AU$, nominal) $870 $1,180 $1,1740
Total visitor spend (AU$, nominal) $80,000,000 $75,000,000 $50,000,000
Impact
Total direct expenditures $90,000,000
Total GSP impacts (AU$2015) $30,000,000
Additional jobs created (FTE) 520
Total household consumption (AU$2015) $25,000,000
All figures are inclusive of GST. Numbers may not sum due to rounding. Unique visitors are rounded to the nearest 1,000; Total bed nights are rounded to the nearest 5,000; Average spend is rounded to the nearest $10; Total visitorspend, GSP impacts and household consumption are rounded to the nearest $5,000,000; FTEs are rounded to the nearest 10.Source: PwC analysis based on PwC survey and ticketing data and financial data provided by the LOC
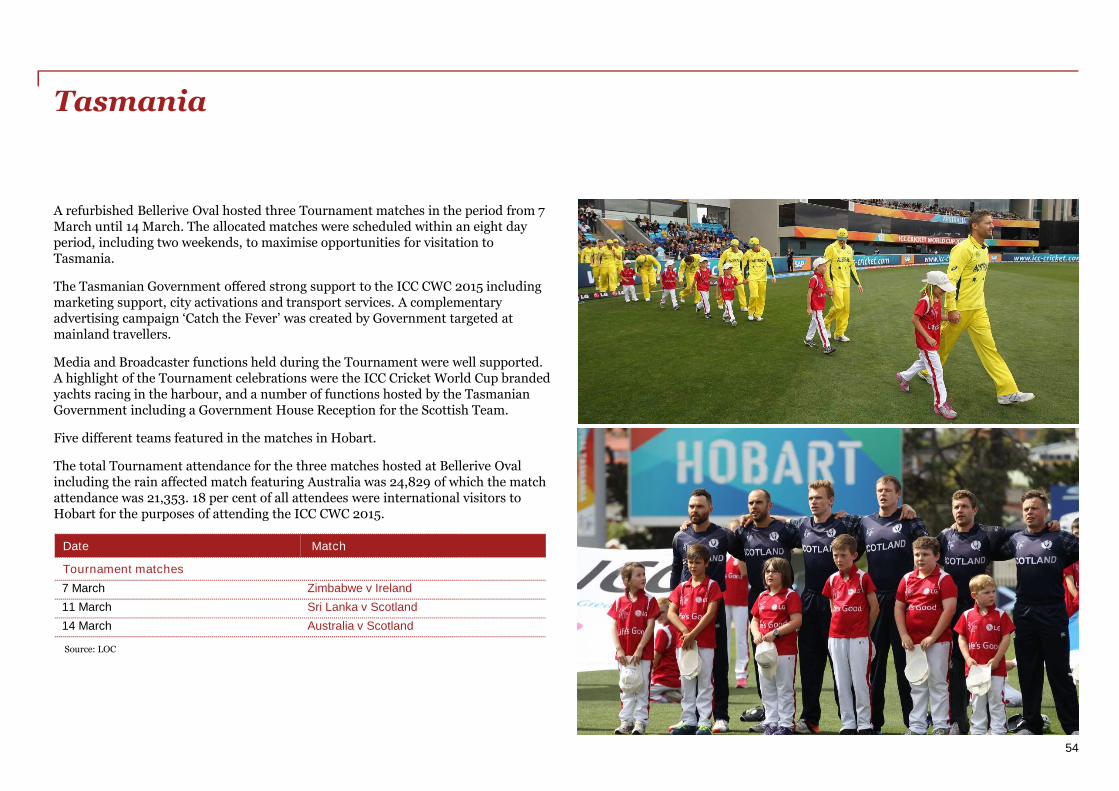
54
A refurbished Bellerive Oval hosted three Tournament matches in the period from 7March until 14 March. The allocated matches were scheduled within an eight dayperiod, including two weekends, to maximise opportunities for visitation toTasmania.
The Tasmanian Government offered strong support to the ICC CWC 2015 includingmarketing support, city activations and transport services. A complementaryadvertising campaign ‘Catch the Fever’ was created by Government targeted atmainland travellers.
Media and Broadcaster functions held during the Tournament were well supported.A highlight of the Tournament celebrations were the ICC Cricket World Cup brandedyachts racing in the harbour, and a number of functions hosted by the TasmanianGovernment including a Government House Reception for the Scottish Team.
Five different teams featured in the matches in Hobart.
The total Tournament attendance for the three matches hosted at Bellerive Ovalincluding the rain affected match featuring Australia was 24,829 of which the matchattendance was 21,353. 18 per cent of all attendees were international visitors toHobart for the purposes of attending the ICC CWC 2015.
Tasmania
Date Match
Tournament matches
7 March Zimbabwe v Ireland
11 March Sri Lanka v Scotland
14 March Australia v Scotland
Source: LOC
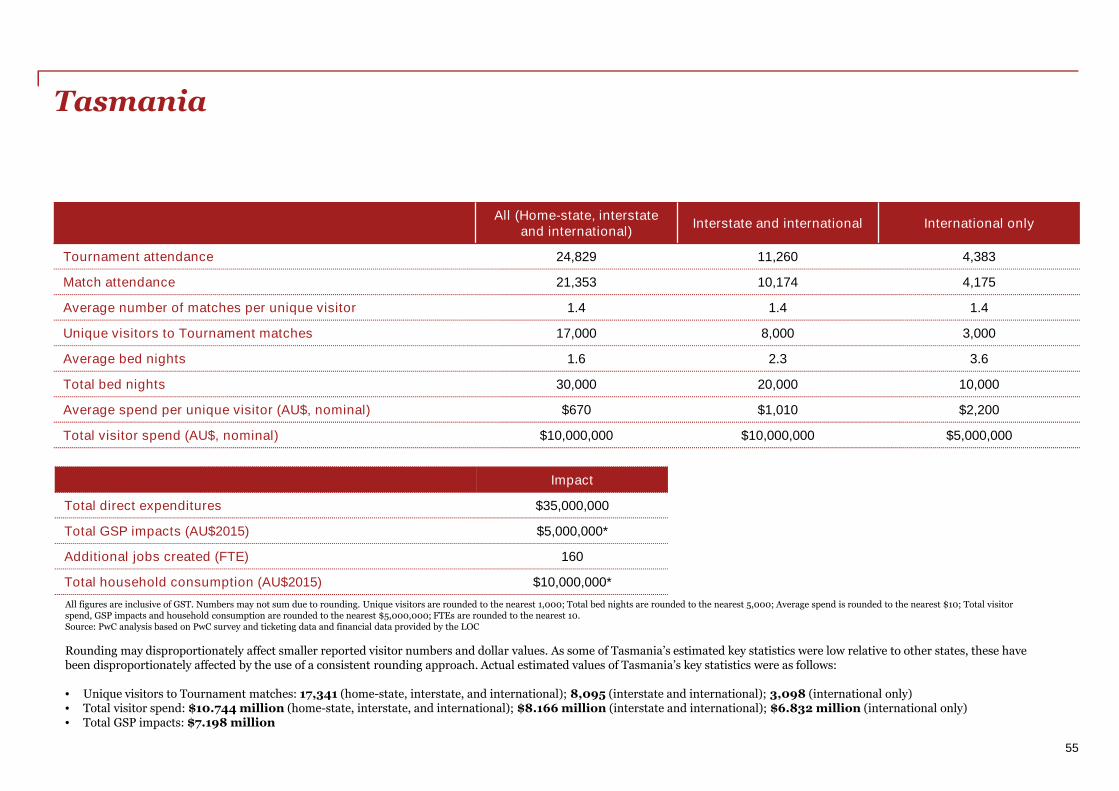
55
Tasmania
All (Home-state, interstateand international)
Interstate and international International only
Tournament attendance 24,829 11,260 4,383
Match attendance 21,353 10,174 4,175
Average number of matches per unique visitor 1.4 1.4 1.4
Unique visitors to Tournament matches 17,000 8,000 3,000
Average bed nights 1.6 2.3 3.6
Total bed nights 30,000 20,000 10,000
Average spend per unique visitor (AU$, nominal) $670 $1,010 $2,200
Total visitor spend (AU$, nominal) $10,000,000 $10,000,000 $5,000,000
Impact
Total direct expenditures $35,000,000
Total GSP impacts (AU$2015) $5,000,000*
Additional jobs created (FTE) 160
Total household consumption (AU$2015) $10,000,000*
All figures are inclusive of GST. Numbers may not sum due to rounding. Unique visitors are rounded to the nearest 1,000; Total bed nights are rounded to the nearest 5,000; Average spend is rounded to the nearest $10; Total visitorspend, GSP impacts and household consumption are rounded to the nearest $5,000,000; FTEs are rounded to the nearest 10.Source: PwC analysis based on PwC survey and ticketing data and financial data provided by the LOC
Rounding may disproportionately affect smaller reported visitor numbers and dollar values. As some of Tasmania’s estimated key statistics were low relative to other states, these havebeen disproportionately affected by the use of a consistent rounding approach. Actual estimated values of Tasmania’s key statistics were as follows:
• Unique visitors to Tournament matches: 17,341 (home-state, interstate, and international); 8,095 (interstate and international); 3,098 (international only)• Total visitor spend: $10.744 million (home-state, interstate, and international); $8.166 million (interstate and international); $6.832 million (international only)• Total GSP impacts: $7.198 million
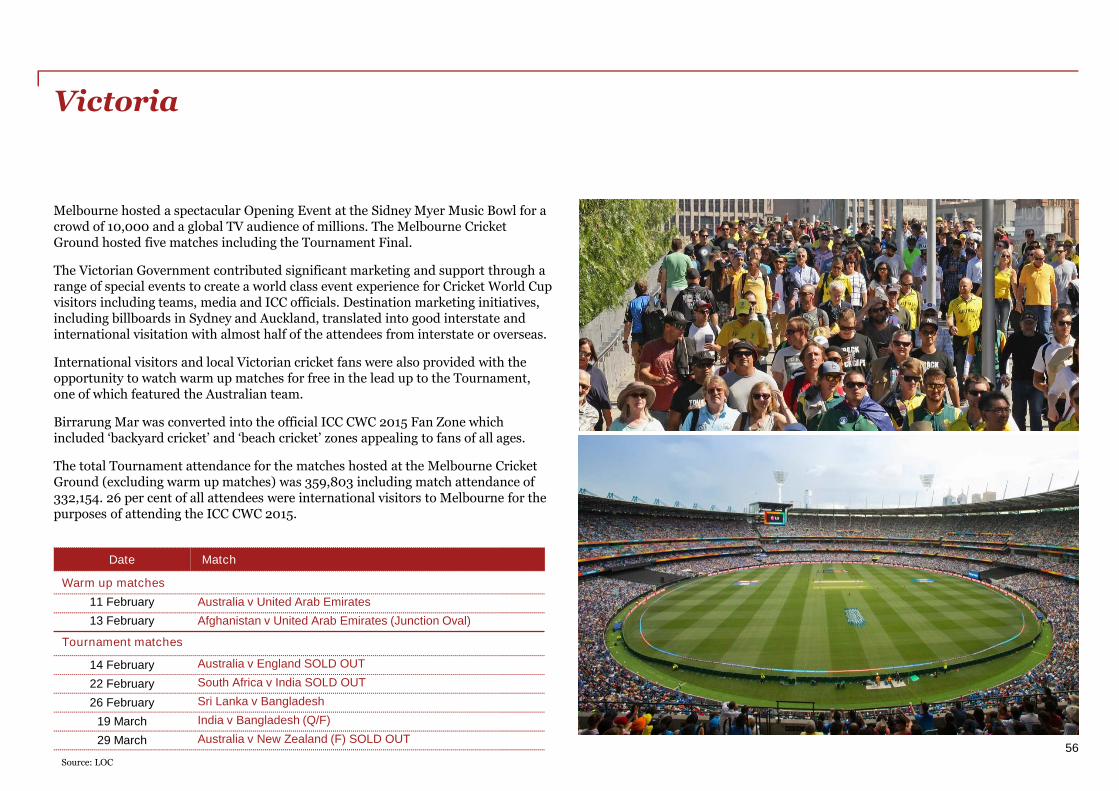
56
Melbourne hosted a spectacular Opening Event at the Sidney Myer Music Bowl for acrowd of 10,000 and a global TV audience of millions. The Melbourne CricketGround hosted five matches including the Tournament Final.
The Victorian Government contributed significant marketing and support through arange of special events to create a world class event experience for Cricket World Cupvisitors including teams, media and ICC officials. Destination marketing initiatives,including billboards in Sydney and Auckland, translated into good interstate andinternational visitation with almost half of the attendees from interstate or overseas.
International visitors and local Victorian cricket fans were also provided with theopportunity to watch warm up matches for free in the lead up to the Tournament,one of which featured the Australian team.
Birrarung Mar was converted into the official ICC CWC 2015 Fan Zone whichincluded ‘backyard cricket’ and ‘beach cricket’ zones appealing to fans of all ages.
The total Tournament attendance for the matches hosted at the Melbourne CricketGround (excluding warm up matches) was 359,803 including match attendance of332,154. 26 per cent of all attendees were international visitors to Melbourne for thepurposes of attending the ICC CWC 2015.
Victoria
Date Match
Warm up matches
11 February Australia v United Arab Emirates
13 February Afghanistan v United Arab Emirates (Junction Oval)
Tournament matches
14 February Australia v England SOLD OUT
22 February South Africa v India SOLD OUT
26 February Sri Lanka v Bangladesh
19 March India v Bangladesh (Q/F)
29 March Australia v New Zealand (F) SOLD OUT
Source: LOC
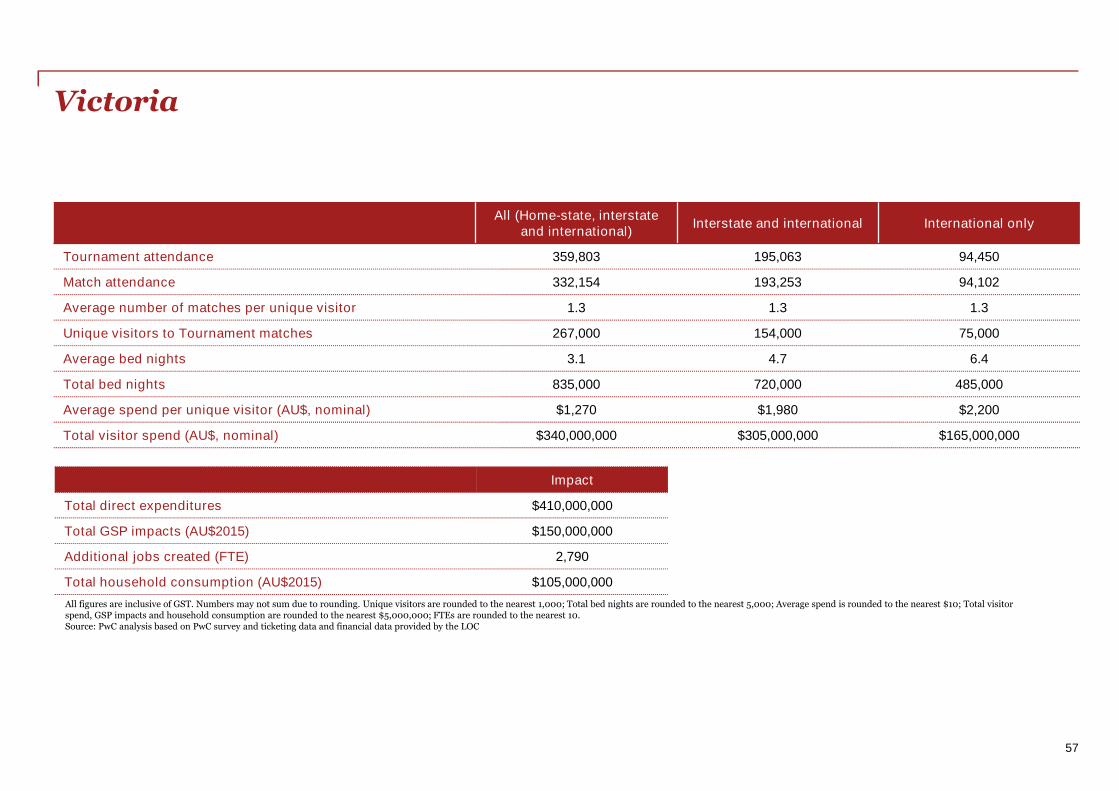
57
Victoria
All (Home-state, interstateand international)
Interstate and international International only
Tournament attendance 359,803 195,063 94,450
Match attendance 332,154 193,253 94,102
Average number of matches per unique visitor 1.3 1.3 1.3
Unique visitors to Tournament matches 267,000 154,000 75,000
Average bed nights 3.1 4.7 6.4
Total bed nights 835,000 720,000 485,000
Average spend per unique visitor (AU$, nominal) $1,270 $1,980 $2,200
Total visitor spend (AU$, nominal) $340,000,000 $305,000,000 $165,000,000
Impact
Total direct expenditures $410,000,000
Total GSP impacts (AU$2015) $150,000,000
Additional jobs created (FTE) 2,790
Total household consumption (AU$2015) $105,000,000
All figures are inclusive of GST. Numbers may not sum due to rounding. Unique visitors are rounded to the nearest 1,000; Total bed nights are rounded to the nearest 5,000; Average spend is rounded to the nearest $10; Total visitorspend, GSP impacts and household consumption are rounded to the nearest $5,000,000; FTEs are rounded to the nearest 10.Source: PwC analysis based on PwC survey and ticketing data and financial data provided by the LOC
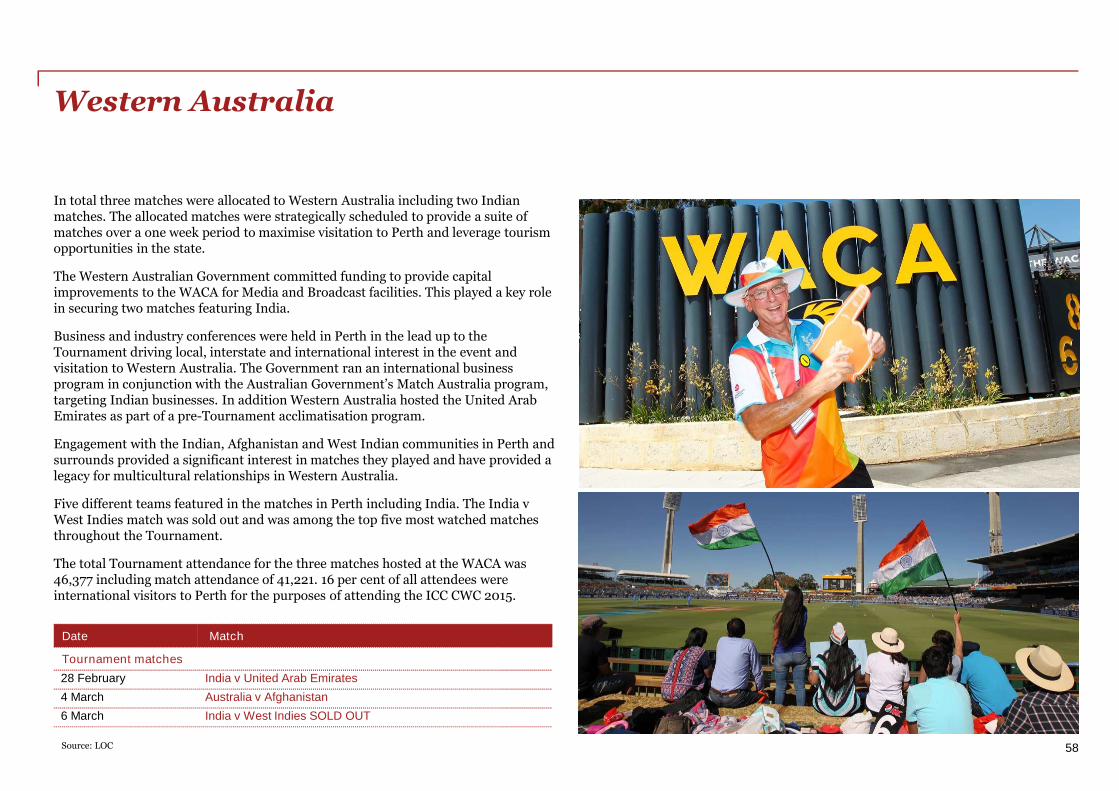
58
In total three matches were allocated to Western Australia including two Indianmatches. The allocated matches were strategically scheduled to provide a suite ofmatches over a one week period to maximise visitation to Perth and leverage tourismopportunities in the state.
The Western Australian Government committed funding to provide capitalimprovements to the WACA for Media and Broadcast facilities. This played a key rolein securing two matches featuring India.
Business and industry conferences were held in Perth in the lead up to theTournament driving local, interstate and international interest in the event andvisitation to Western Australia. The Government ran an international businessprogram in conjunction with the Australian Government’s Match Australia program,targeting Indian businesses. In addition Western Australia hosted the United ArabEmirates as part of a pre-Tournament acclimatisation program.
Engagement with the Indian, Afghanistan and West Indian communities in Perth andsurrounds provided a significant interest in matches they played and have provided alegacy for multicultural relationships in Western Australia.
Five different teams featured in the matches in Perth including India. The India vWest Indies match was sold out and was among the top five most watched matchesthroughout the Tournament.
The total Tournament attendance for the three matches hosted at the WACA was46,377 including match attendance of 41,221. 16 per cent of all attendees wereinternational visitors to Perth for the purposes of attending the ICC CWC 2015.
Western Australia
Date Match
Tournament matches
28 February India v United Arab Emirates
4 March Australia v Afghanistan
6 March India v West Indies SOLD OUT
Source: LOC
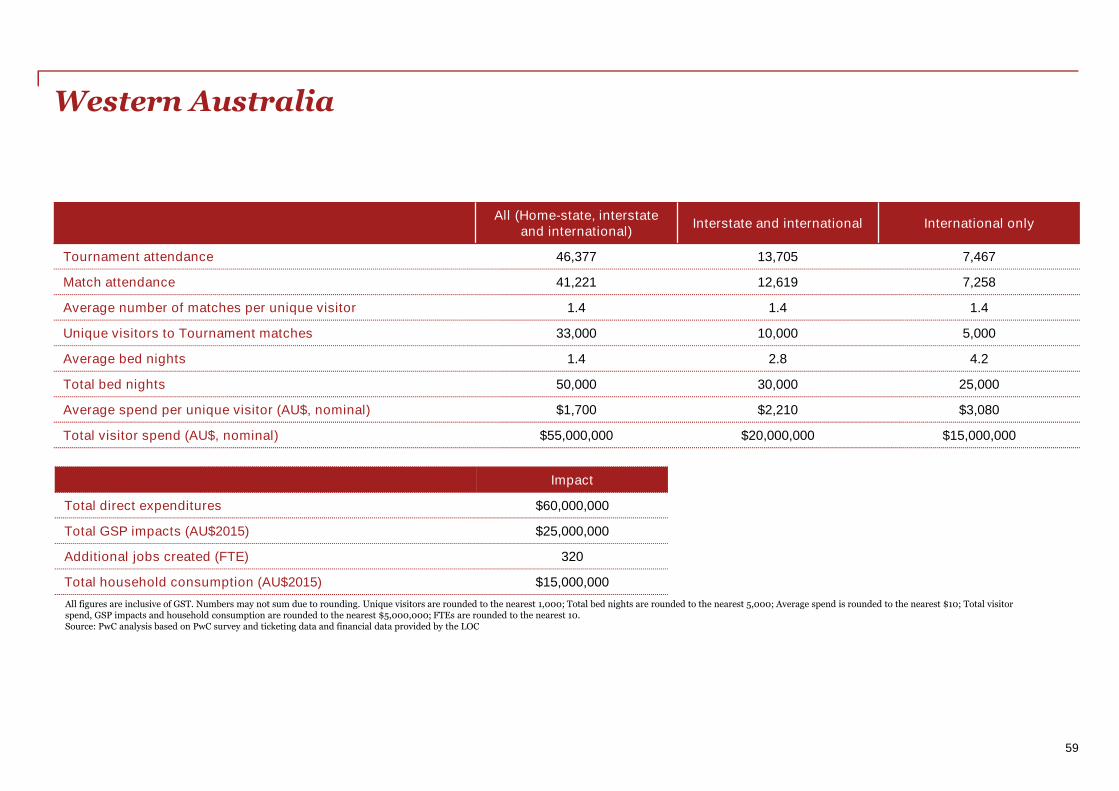
59
Western Australia
All (Home-state, interstateand international)
Interstate and international International only
Tournament attendance 46,377 13,705 7,467
Match attendance 41,221 12,619 7,258
Average number of matches per unique visitor 1.4 1.4 1.4
Unique visitors to Tournament matches 33,000 10,000 5,000
Average bed nights 1.4 2.8 4.2
Total bed nights 50,000 30,000 25,000
Average spend per unique visitor (AU$, nominal) $1,700 $2,210 $3,080
Total visitor spend (AU$, nominal) $55,000,000 $20,000,000 $15,000,000
Impact
Total direct expenditures $60,000,000
Total GSP impacts (AU$2015) $25,000,000
Additional jobs created (FTE) 320
Total household consumption (AU$2015) $15,000,000
All figures are inclusive of GST. Numbers may not sum due to rounding. Unique visitors are rounded to the nearest 1,000; Total bed nights are rounded to the nearest 5,000; Average spend is rounded to the nearest $10; Total visitorspend, GSP impacts and household consumption are rounded to the nearest $5,000,000; FTEs are rounded to the nearest 10.Source: PwC analysis based on PwC survey and ticketing data and financial data provided by the LOC
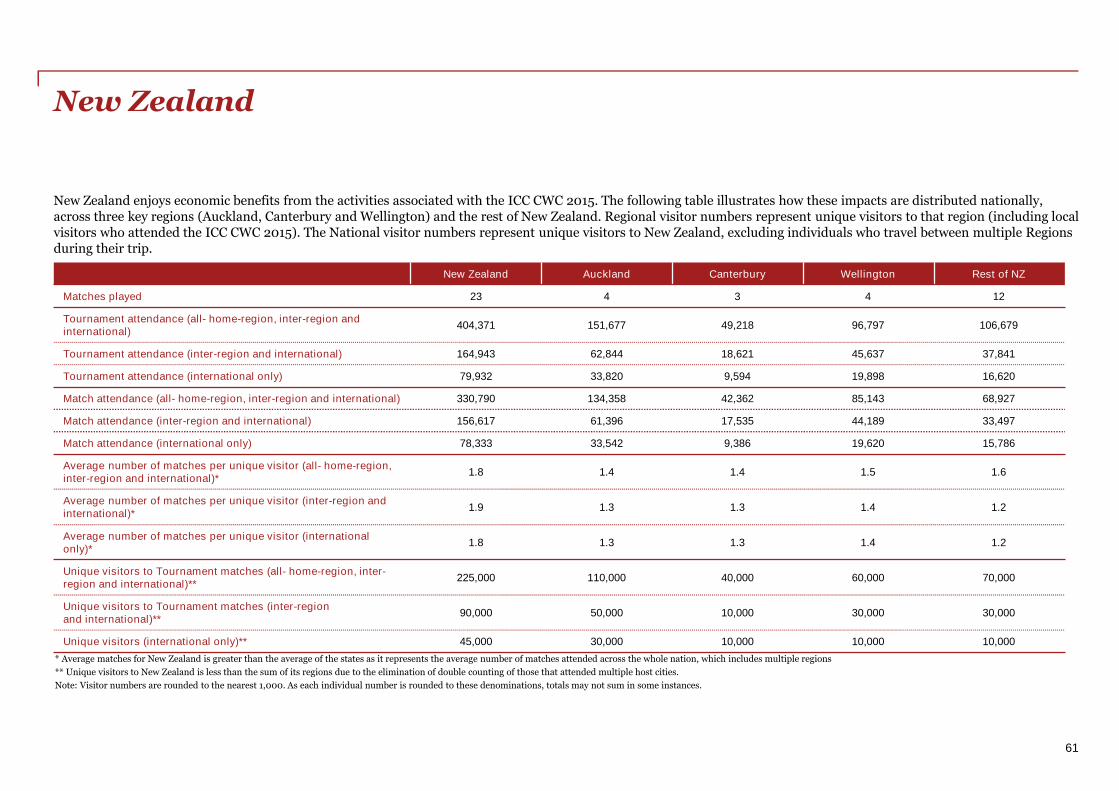
New Zealand Auckland Canterbury Wellington Rest of NZ
Matches played 23 4 3 4 12
Tournament attendance (all- home-region, inter-region andinternational)
404,371 151,677 49,218 96,797 106,679
Tournament attendance (inter-region and international) 164,943 62,844 18,621 45,637 37,841
Tournament attendance (international only) 79,932 33,820 9,594 19,898 16,620
Match attendance (all- home-region, inter-region and international) 330,790 134,358 42,362 85,143 68,927
Match attendance (inter-region and international) 156,617 61,396 17,535 44,189 33,497
Match attendance (international only) 78,333 33,542 9,386 19,620 15,786
Average number of matches per unique visitor (all- home-region,inter-region and international)*
1.8 1.4 1.4 1.5 1.6
Average number of matches per unique visitor (inter-region andinternational)*
1.9 1.3 1.3 1.4 1.2
Average number of matches per unique visitor (internationalonly)*
1.8 1.3 1.3 1.4 1.2
Unique visitors to Tournament matches (all- home-region, inter-region and international)**
225,000 110,000 40,000 60,000 70,000
Unique visitors to Tournament matches (inter-regionand international)**
90,000 50,000 10,000 30,000 30,000
Unique visitors (international only)** 45,000 30,000 10,000 10,000 10,000
New Zealand enjoys economic benefits from the activities associated with the ICC CWC 2015. The following table illustrates how these impacts are distributed nationally,across three key regions (Auckland, Canterbury and Wellington) and the rest of New Zealand. Regional visitor numbers represent unique visitors to that region (including localvisitors who attended the ICC CWC 2015). The National visitor numbers represent unique visitors to New Zealand, excluding individuals who travel between multiple Regionsduring their trip.
61
New Zealand
* Average matches for New Zealand is greater than the average of the states as it represents the average number of matches attended across the whole nation, which includes multiple regions
** Unique visitors to New Zealand is less than the sum of its regions due to the elimination of double counting of those that attended multiple host cities.
Note: Visitor numbers are rounded to the nearest 1,000. As each individual number is rounded to these denominations, totals may not sum in some instances.
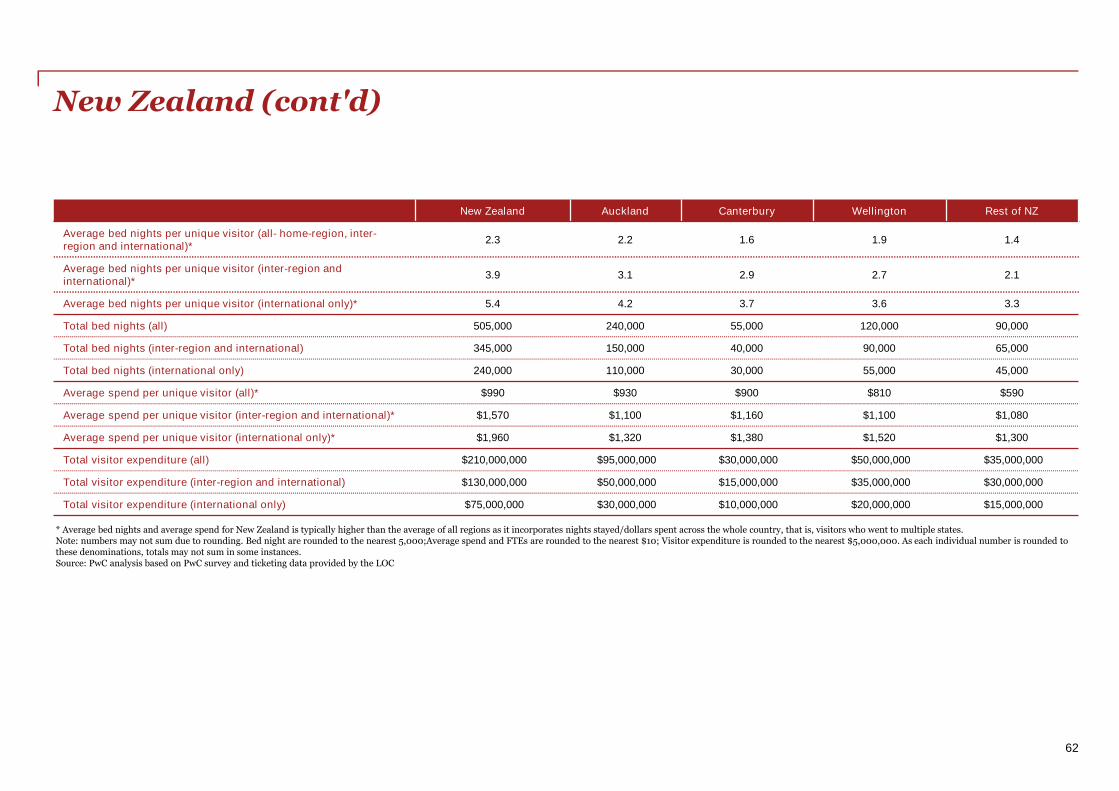
62
New Zealand (cont'd)
* Average bed nights and average spend for New Zealand is typically higher than the average of all regions as it incorporates nights stayed/dollars spent across the whole country, that is, visitors who went to multiple states.Note: numbers may not sum due to rounding. Bed night are rounded to the nearest 5,000;Average spend and FTEs are rounded to the nearest $10; Visitor expenditure is rounded to the nearest $5,000,000. As each individual number is rounded tothese denominations, totals may not sum in some instances.Source: PwC analysis based on PwC survey and ticketing data provided by the LOC
New Zealand Auckland Canterbury Wellington Rest of NZ
Average bed nights per unique visitor (all- home-region, inter-region and international)*
2.3 2.2 1.6 1.9 1.4
Average bed nights per unique visitor (inter-region andinternational)*
3.9 3.1 2.9 2.7 2.1
Average bed nights per unique visitor (international only)* 5.4 4.2 3.7 3.6 3.3
Total bed nights (all) 505,000 240,000 55,000 120,000 90,000
Total bed nights (inter-region and international) 345,000 150,000 40,000 90,000 65,000
Total bed nights (international only) 240,000 110,000 30,000 55,000 45,000
Average spend per unique visitor (all)* $990 $930 $900 $810 $590
Average spend per unique visitor (inter-region and international)* $1,570 $1,100 $1,160 $1,100 $1,080
Average spend per unique visitor (international only)* $1,960 $1,320 $1,380 $1,520 $1,300
Total visitor expenditure (all) $210,000,000 $95,000,000 $30,000,000 $50,000,000 $35,000,000
Total visitor expenditure (inter-region and international) $130,000,000 $50,000,000 $15,000,000 $35,000,000 $30,000,000
Total visitor expenditure (international only) $75,000,000 $30,000,000 $10,000,000 $20,000,000 $15,000,000
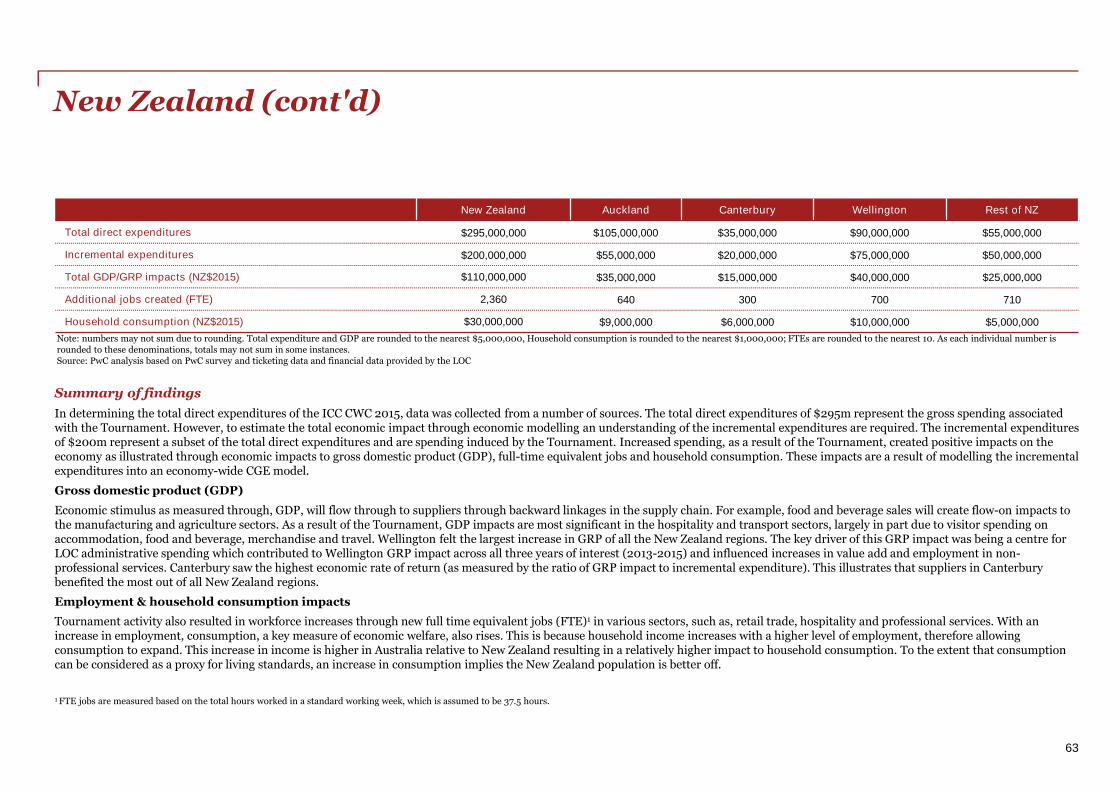
63
New Zealand (cont'd)
1 FTE jobs are measured based on the total hours worked in a standard working week, which is assumed to be 37.5 hours.
New Zealand Auckland Canterbury Wellington Rest of NZ
Total direct expenditures $295,000,000 $105,000,000 $35,000,000 $90,000,000 $55,000,000
Incremental expenditures $200,000,000 $55,000,000 $20,000,000 $75,000,000 $50,000,000
Total GDP/GRP impacts (NZ$2015) $110,000,000 $35,000,000 $15,000,000 $40,000,000 $25,000,000
Additional jobs created (FTE) 2,360 640 300 700 710
Household consumption (NZ$2015) $30,000,000 $9,000,000 $6,000,000 $10,000,000 $5,000,000
Note: numbers may not sum due to rounding. Total expenditure and GDP are rounded to the nearest $5,000,000, Household consumption is rounded to the nearest $1,000,000; FTEs are rounded to the nearest 10. As each individual number isrounded to these denominations, totals may not sum in some instances.Source: PwC analysis based on PwC survey and ticketing data and financial data provided by the LOC
Summary of findings
In determining the total direct expenditures of the ICC CWC 2015, data was collected from a number of sources. The total direct expenditures of $295m represent the gross spending associatedwith the Tournament. However, to estimate the total economic impact through economic modelling an understanding of the incremental expenditures are required. The incremental expendituresof $200m represent a subset of the total direct expenditures and are spending induced by the Tournament. Increased spending, as a result of the Tournament, created positive impacts on theeconomy as illustrated through economic impacts to gross domestic product (GDP), full-time equivalent jobs and household consumption. These impacts are a result of modelling the incrementalexpenditures into an economy-wide CGE model.
Gross domestic product (GDP)
Economic stimulus as measured through, GDP, will flow through to suppliers through backward linkages in the supply chain. For example, food and beverage sales will create flow-on impacts tothe manufacturing and agriculture sectors. As a result of the Tournament, GDP impacts are most significant in the hospitality and transport sectors, largely in part due to visitor spending onaccommodation, food and beverage, merchandise and travel. Wellington felt the largest increase in GRP of all the New Zealand regions. The key driver of this GRP impact was being a centre forLOC administrative spending which contributed to Wellington GRP impact across all three years of interest (2013-2015) and influenced increases in value add and employment in non-professional services. Canterbury saw the highest economic rate of return (as measured by the ratio of GRP impact to incremental expenditure). This illustrates that suppliers in Canterburybenefited the most out of all New Zealand regions.
Employment & household consumption impacts
Tournament activity also resulted in workforce increases through new full time equivalent jobs (FTE)1 in various sectors, such as, retail trade, hospitality and professional services. With anincrease in employment, consumption, a key measure of economic welfare, also rises. This is because household income increases with a higher level of employment, therefore allowingconsumption to expand. This increase in income is higher in Australia relative to New Zealand resulting in a relatively higher impact to household consumption. To the extent that consumptioncan be considered as a proxy for living standards, an increase in consumption implies the New Zealand population is better off.
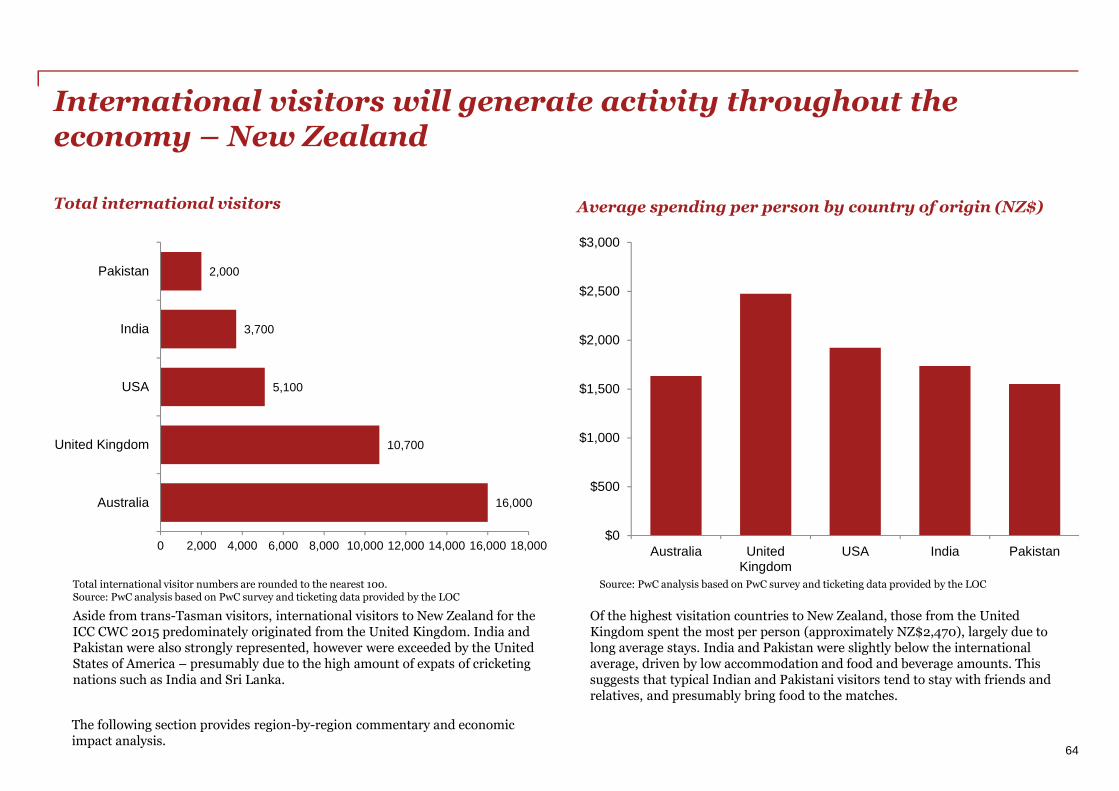
Total international visitors
International visitors will generate activity throughout theeconomy – New Zealand
64
16,000
10,700
5,100
3,700
2,000
0 2,000 4,000 6,000 8,000 10,000 12,000 14,000 16,000 18,000
Australia
United Kingdom
USA
India
Pakistan
$0
$500
$1,000
$1,500
$2,000
$2,500
$3,000
Australia UnitedKingdom
USA India Pakistan
Aside from trans-Tasman visitors, international visitors to New Zealand for theICC CWC 2015 predominately originated from the United Kingdom. India andPakistan were also strongly represented, however were exceeded by the UnitedStates of America – presumably due to the high amount of expats of cricketingnations such as India and Sri Lanka.
Average spending per person by country of origin (NZ$)
Of the highest visitation countries to New Zealand, those from the UnitedKingdom spent the most per person (approximately NZ$2,470), largely due tolong average stays. India and Pakistan were slightly below the internationalaverage, driven by low accommodation and food and beverage amounts. Thissuggests that typical Indian and Pakistani visitors tend to stay with friends andrelatives, and presumably bring food to the matches.
Total international visitor numbers are rounded to the nearest 100.Source: PwC analysis based on PwC survey and ticketing data provided by the LOC
Source: PwC analysis based on PwC survey and ticketing data provided by the LOC
The following section provides region-by-region commentary and economicimpact analysis.
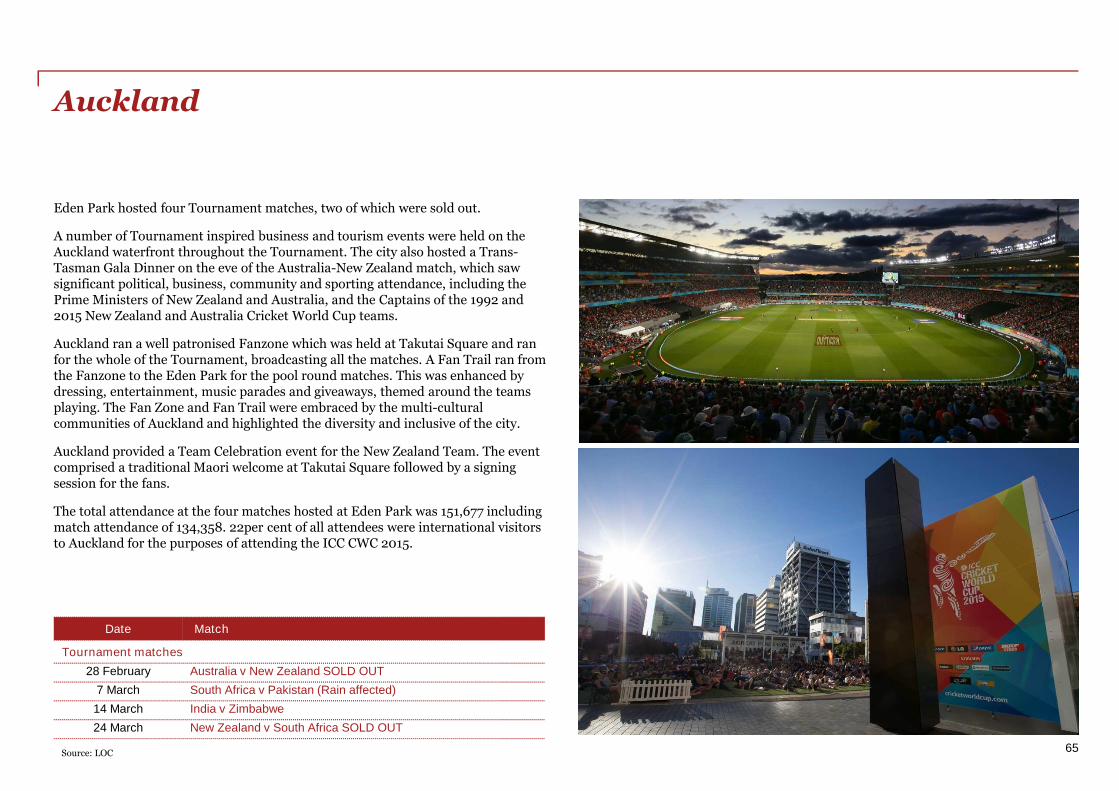
65
Eden Park hosted four Tournament matches, two of which were sold out.
A number of Tournament inspired business and tourism events were held on theAuckland waterfront throughout the Tournament. The city also hosted a Trans-Tasman Gala Dinner on the eve of the Australia-New Zealand match, which sawsignificant political, business, community and sporting attendance, including thePrime Ministers of New Zealand and Australia, and the Captains of the 1992 and2015 New Zealand and Australia Cricket World Cup teams.
Auckland ran a well patronised Fanzone which was held at Takutai Square and ranfor the whole of the Tournament, broadcasting all the matches. A Fan Trail ran fromthe Fanzone to the Eden Park for the pool round matches. This was enhanced bydressing, entertainment, music parades and giveaways, themed around the teamsplaying. The Fan Zone and Fan Trail were embraced by the multi-culturalcommunities of Auckland and highlighted the diversity and inclusive of the city.
Auckland provided a Team Celebration event for the New Zealand Team. The eventcomprised a traditional Maori welcome at Takutai Square followed by a signingsession for the fans.
The total attendance at the four matches hosted at Eden Park was 151,677 includingmatch attendance of 134,358. 22per cent of all attendees were international visitorsto Auckland for the purposes of attending the ICC CWC 2015.
Auckland
Date Match
Tournament matches
28 February Australia v New Zealand SOLD OUT
7 March South Africa v Pakistan (Rain affected)
14 March India v Zimbabwe
24 March New Zealand v South Africa SOLD OUT
Source: LOC
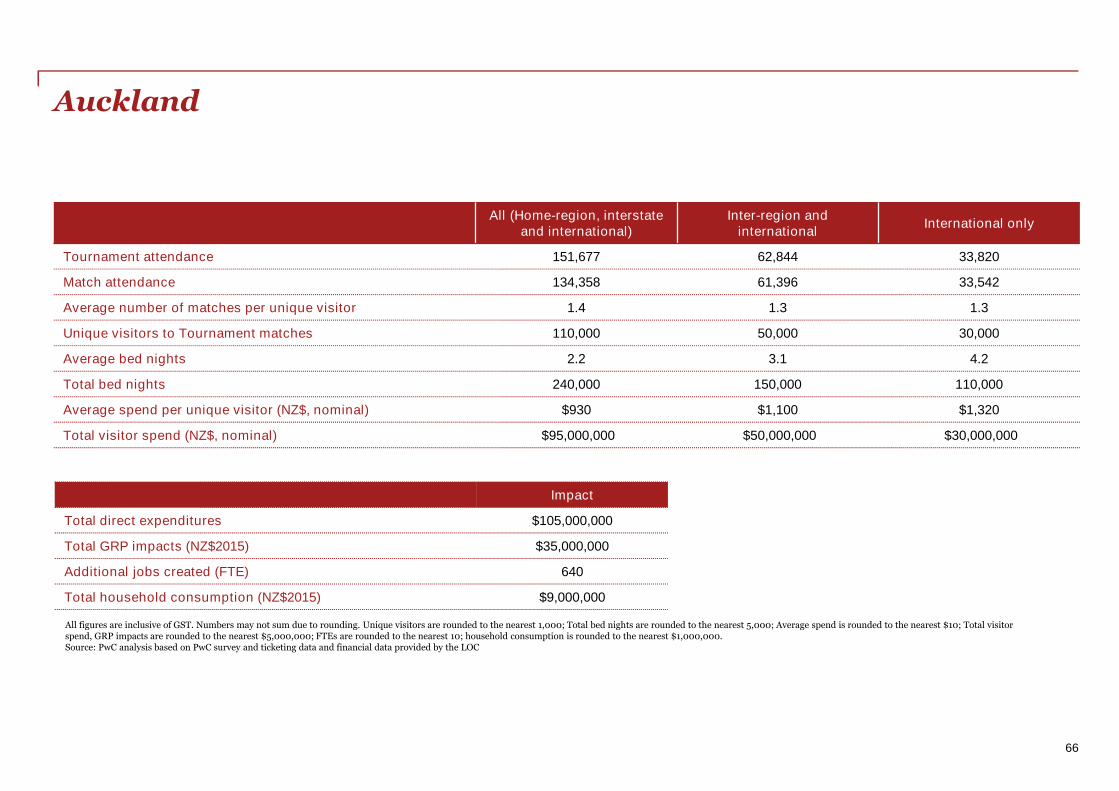
66
Auckland
All (Home-region, interstateand international)
Inter-region andinternational
International only
Tournament attendance 151,677 62,844 33,820
Match attendance 134,358 61,396 33,542
Average number of matches per unique visitor 1.4 1.3 1.3
Unique visitors to Tournament matches 110,000 50,000 30,000
Average bed nights 2.2 3.1 4.2
Total bed nights 240,000 150,000 110,000
Average spend per unique visitor (NZ$, nominal) $930 $1,100 $1,320
Total visitor spend (NZ$, nominal) $95,000,000 $50,000,000 $30,000,000
Impact
Total direct expenditures $105,000,000
Total GRP impacts (NZ$2015) $35,000,000
Additional jobs created (FTE) 640
Total household consumption (NZ$2015) $9,000,000
All figures are inclusive of GST. Numbers may not sum due to rounding. Unique visitors are rounded to the nearest 1,000; Total bed nights are rounded to the nearest 5,000; Average spend is rounded to the nearest $10; Total visitorspend, GRP impacts are rounded to the nearest $5,000,000; FTEs are rounded to the nearest 10; household consumption is rounded to the nearest $1,000,000.Source: PwC analysis based on PwC survey and ticketing data and financial data provided by the LOC
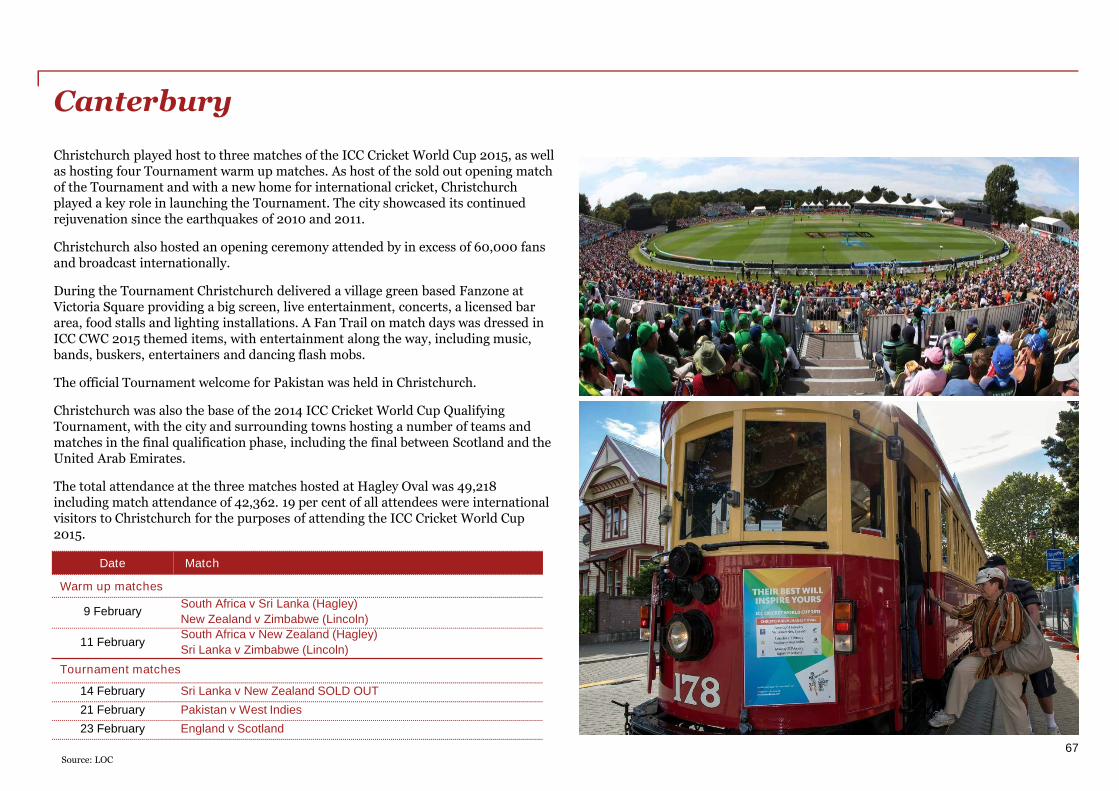
67
Christchurch played host to three matches of the ICC Cricket World Cup 2015, as wellas hosting four Tournament warm up matches. As host of the sold out opening matchof the Tournament and with a new home for international cricket, Christchurchplayed a key role in launching the Tournament. The city showcased its continuedrejuvenation since the earthquakes of 2010 and 2011.
Christchurch also hosted an opening ceremony attended by in excess of 60,000 fansand broadcast internationally.
During the Tournament Christchurch delivered a village green based Fanzone atVictoria Square providing a big screen, live entertainment, concerts, a licensed bararea, food stalls and lighting installations. A Fan Trail on match days was dressed inICC CWC 2015 themed items, with entertainment along the way, including music,bands, buskers, entertainers and dancing flash mobs.
The official Tournament welcome for Pakistan was held in Christchurch.
Christchurch was also the base of the 2014 ICC Cricket World Cup QualifyingTournament, with the city and surrounding towns hosting a number of teams andmatches in the final qualification phase, including the final between Scotland and theUnited Arab Emirates.
The total attendance at the three matches hosted at Hagley Oval was 49,218including match attendance of 42,362. 19 per cent of all attendees were internationalvisitors to Christchurch for the purposes of attending the ICC Cricket World Cup2015.
Canterbury
Date Match
Warm up matches
9 FebruarySouth Africa v Sri Lanka (Hagley)
New Zealand v Zimbabwe (Lincoln)
11 FebruarySouth Africa v New Zealand (Hagley)
Sri Lanka v Zimbabwe (Lincoln)
Tournament matches
14 February Sri Lanka v New Zealand SOLD OUT
21 February Pakistan v West Indies
23 February England v Scotland
Source: LOC

68
Canterbury
Impact
Total direct expenditures $35,000,000
Total GRP impacts (NZ$2015) $15,000,000
Additional jobs created (FTE) 300
Total household consumption (NZ$2015) $6,000,000
All Interstate and international International only
Tournament attendance 49,218 18,621 9,594
Match attendance 42,362 17,535 9,386
Average number of matches per unique visitor 1.4 1.3 1.3
Unique visitors to Tournament matches 40,000 10,000 10,000
Average bed nights 1.6 2.9 3.7
Total bed nights 55,000 40,000 30,000
Average spend per unique visitor (NZ$, nominal) $900 $1,160 $1,380
Total visitor spend (NZ$, nominal) $30,000,000 $15,000,000 $10,000,000
All figures are inclusive of GST. Numbers may not sum due to rounding. Unique visitors are rounded to the nearest 1,000; Total bed nights are rounded to the nearest 5,000; Average spend is rounded to the nearest $10; Total visitorspend, GRP impacts are rounded to the nearest $5,000,000; FTEs are rounded to the nearest 10; household consumption is rounded to the nearest $1,000,000.Source: PwC analysis based on PwC survey and ticketing data and financial data provided by the LOC
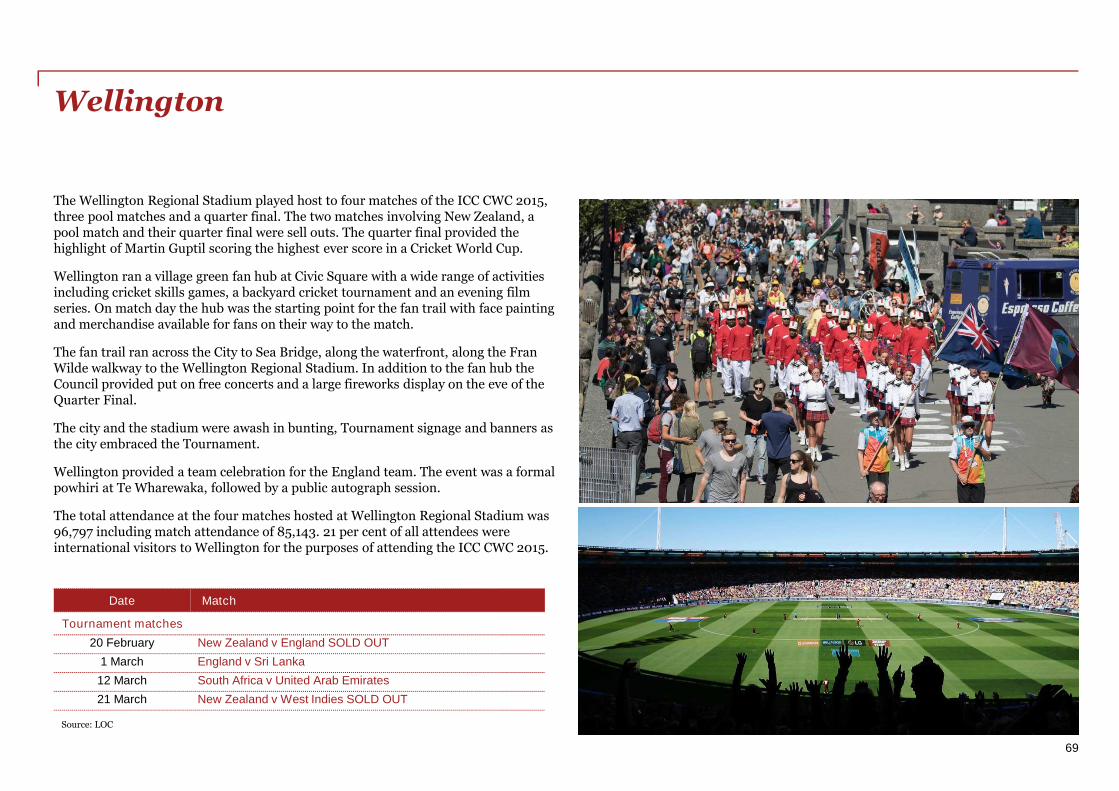
69
The Wellington Regional Stadium played host to four matches of the ICC CWC 2015,three pool matches and a quarter final. The two matches involving New Zealand, apool match and their quarter final were sell outs. The quarter final provided thehighlight of Martin Guptil scoring the highest ever score in a Cricket World Cup.
Wellington ran a village green fan hub at Civic Square with a wide range of activitiesincluding cricket skills games, a backyard cricket tournament and an evening filmseries. On match day the hub was the starting point for the fan trail with face paintingand merchandise available for fans on their way to the match.
The fan trail ran across the City to Sea Bridge, along the waterfront, along the FranWilde walkway to the Wellington Regional Stadium. In addition to the fan hub theCouncil provided put on free concerts and a large fireworks display on the eve of theQuarter Final.
The city and the stadium were awash in bunting, Tournament signage and banners asthe city embraced the Tournament.
Wellington provided a team celebration for the England team. The event was a formalpowhiri at Te Wharewaka, followed by a public autograph session.
The total attendance at the four matches hosted at Wellington Regional Stadium was96,797 including match attendance of 85,143. 21 per cent of all attendees wereinternational visitors to Wellington for the purposes of attending the ICC CWC 2015.
Wellington
Date Match
Tournament matches
20 February New Zealand v England SOLD OUT
1 March England v Sri Lanka
12 March South Africa v United Arab Emirates
21 March New Zealand v West Indies SOLD OUT
Source: LOC

70
Wellington
Impact
Total direct expenditures $90,000,000
Total GRP impacts (NZ$2015) $40,000,000
Additional jobs created (FTE) 700
Total household consumption (NZ$2015) $10,000,000
All Interstate and international International only
Tournament attendance 96,797 45,637 19,898
Match attendance 85,143 44,189 19,620
Average number of matches per unique visitor 1.5 1.4 1.4
Unique visitors to Tournament matches 60,000 30,000 10,000
Average bed nights 1.9 2.7 3.6
Total bed nights 120,000 90,000 55,000
Average spend per unique visitor (NZ$, nominal) $810 $1,100 $1,520
Total visitor spend (NZ$, nominal) $50,000,000 $35,000,000 $20,000,000
All figures are inclusive of GST. Numbers may not sum due to rounding. Unique visitors are rounded to the nearest 1,000; Total bed nights are rounded to the nearest 5,000; Average spend is rounded to the nearest $10; Total visitorspend, GRP impacts are rounded to the nearest $5,000,000; FTEs are rounded to the nearest 10; household consumption is rounded to the nearest $1,000,000.Source: PwC analysis based on PwC survey and ticketing data and financial data provided by the LOC
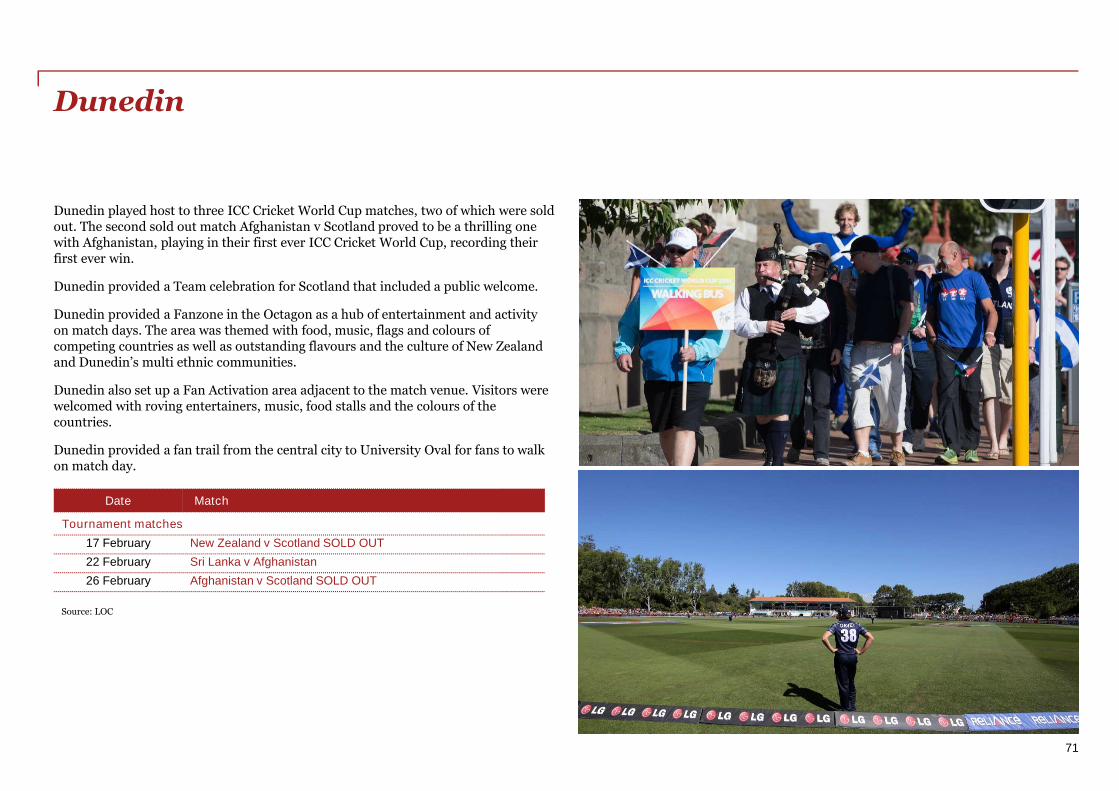
71
Dunedin played host to three ICC Cricket World Cup matches, two of which were soldout. The second sold out match Afghanistan v Scotland proved to be a thrilling onewith Afghanistan, playing in their first ever ICC Cricket World Cup, recording theirfirst ever win.
Dunedin provided a Team celebration for Scotland that included a public welcome.
Dunedin provided a Fanzone in the Octagon as a hub of entertainment and activityon match days. The area was themed with food, music, flags and colours ofcompeting countries as well as outstanding flavours and the culture of New Zealandand Dunedin’s multi ethnic communities.
Dunedin also set up a Fan Activation area adjacent to the match venue. Visitors werewelcomed with roving entertainers, music, food stalls and the colours of thecountries.
Dunedin provided a fan trail from the central city to University Oval for fans to walkon match day.
Dunedin
Date Match
Tournament matches
17 February New Zealand v Scotland SOLD OUT
22 February Sri Lanka v Afghanistan
26 February Afghanistan v Scotland SOLD OUT
Source: LOC
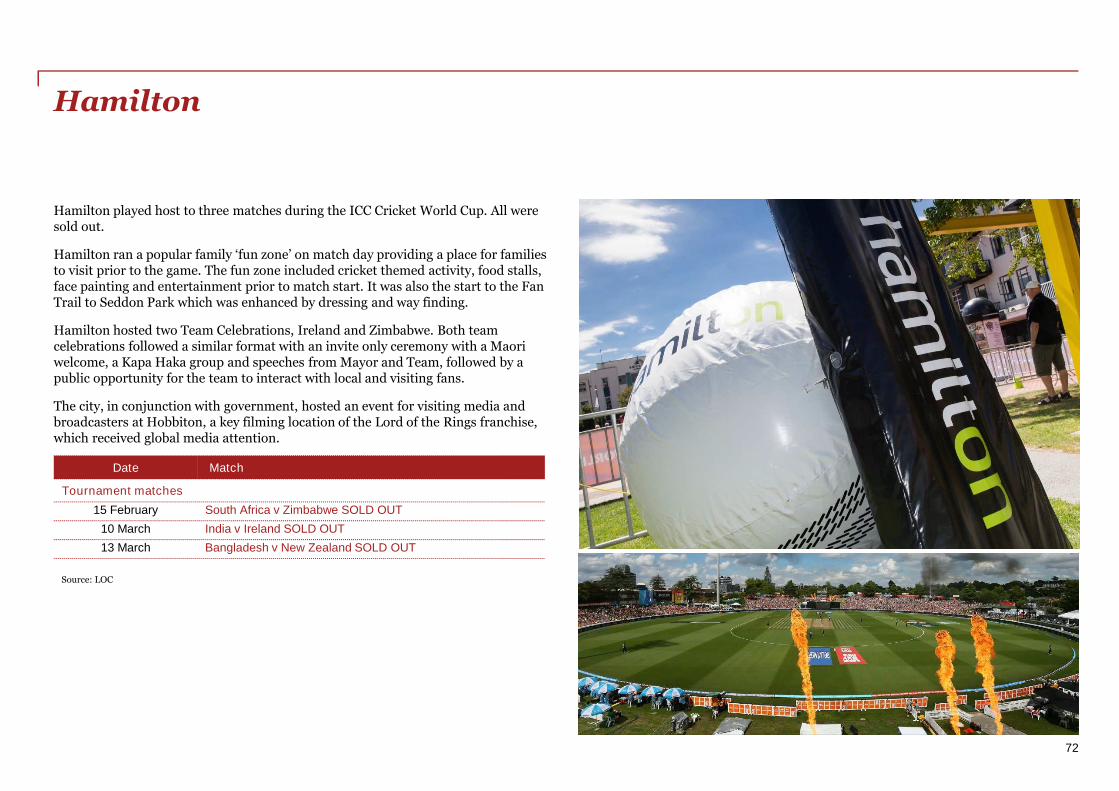
72
Hamilton played host to three matches during the ICC Cricket World Cup. All weresold out.
Hamilton ran a popular family ‘fun zone’ on match day providing a place for familiesto visit prior to the game. The fun zone included cricket themed activity, food stalls,face painting and entertainment prior to match start. It was also the start to the FanTrail to Seddon Park which was enhanced by dressing and way finding.
Hamilton hosted two Team Celebrations, Ireland and Zimbabwe. Both teamcelebrations followed a similar format with an invite only ceremony with a Maoriwelcome, a Kapa Haka group and speeches from Mayor and Team, followed by apublic opportunity for the team to interact with local and visiting fans.
The city, in conjunction with government, hosted an event for visiting media andbroadcasters at Hobbiton, a key filming location of the Lord of the Rings franchise,which received global media attention.
Hamilton
Date Match
Tournament matches
15 February South Africa v Zimbabwe SOLD OUT
10 March India v Ireland SOLD OUT
13 March Bangladesh v New Zealand SOLD OUT
Source: LOC
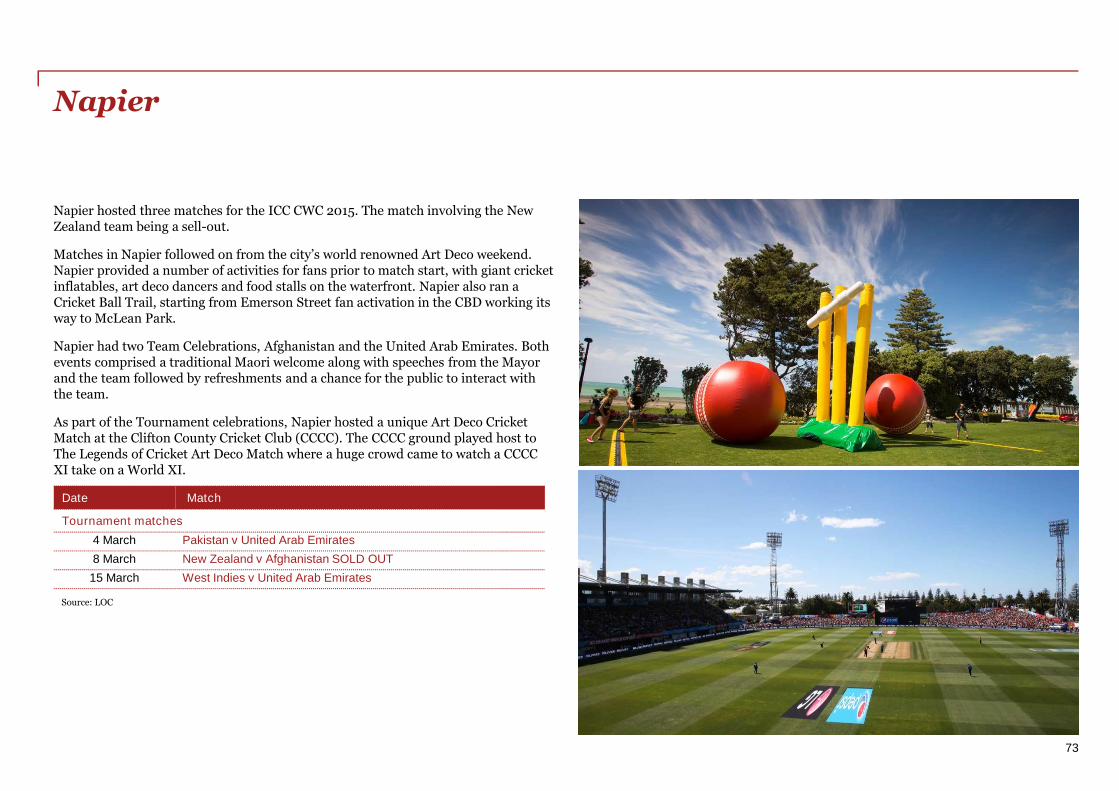
73
Napier hosted three matches for the ICC CWC 2015. The match involving the NewZealand team being a sell-out.
Matches in Napier followed on from the city’s world renowned Art Deco weekend.Napier provided a number of activities for fans prior to match start, with giant cricketinflatables, art deco dancers and food stalls on the waterfront. Napier also ran aCricket Ball Trail, starting from Emerson Street fan activation in the CBD working itsway to McLean Park.
Napier had two Team Celebrations, Afghanistan and the United Arab Emirates. Bothevents comprised a traditional Maori welcome along with speeches from the Mayorand the team followed by refreshments and a chance for the public to interact withthe team.
As part of the Tournament celebrations, Napier hosted a unique Art Deco CricketMatch at the Clifton County Cricket Club (CCCC). The CCCC ground played host toThe Legends of Cricket Art Deco Match where a huge crowd came to watch a CCCCXI take on a World XI.
Napier
Date Match
Tournament matches
4 March Pakistan v United Arab Emirates
8 March New Zealand v Afghanistan SOLD OUT
15 March West Indies v United Arab Emirates
Source: LOC
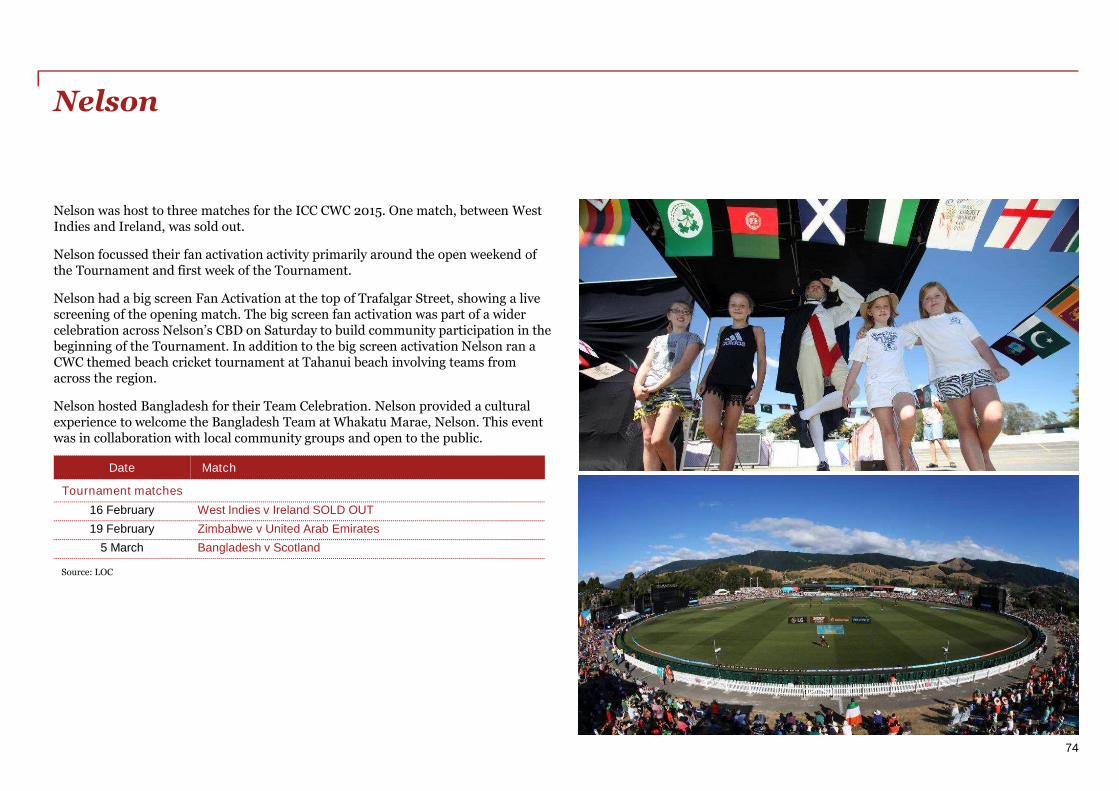
74
Nelson was host to three matches for the ICC CWC 2015. One match, between WestIndies and Ireland, was sold out.
Nelson focussed their fan activation activity primarily around the open weekend ofthe Tournament and first week of the Tournament.
Nelson had a big screen Fan Activation at the top of Trafalgar Street, showing a livescreening of the opening match. The big screen fan activation was part of a widercelebration across Nelson’s CBD on Saturday to build community participation in thebeginning of the Tournament. In addition to the big screen activation Nelson ran aCWC themed beach cricket tournament at Tahanui beach involving teams fromacross the region.
Nelson hosted Bangladesh for their Team Celebration. Nelson provided a culturalexperience to welcome the Bangladesh Team at Whakatu Marae, Nelson. This eventwas in collaboration with local community groups and open to the public.
Nelson
Date Match
Tournament matches
16 February West Indies v Ireland SOLD OUT
19 February Zimbabwe v United Arab Emirates
5 March Bangladesh v Scotland
Source: LOC
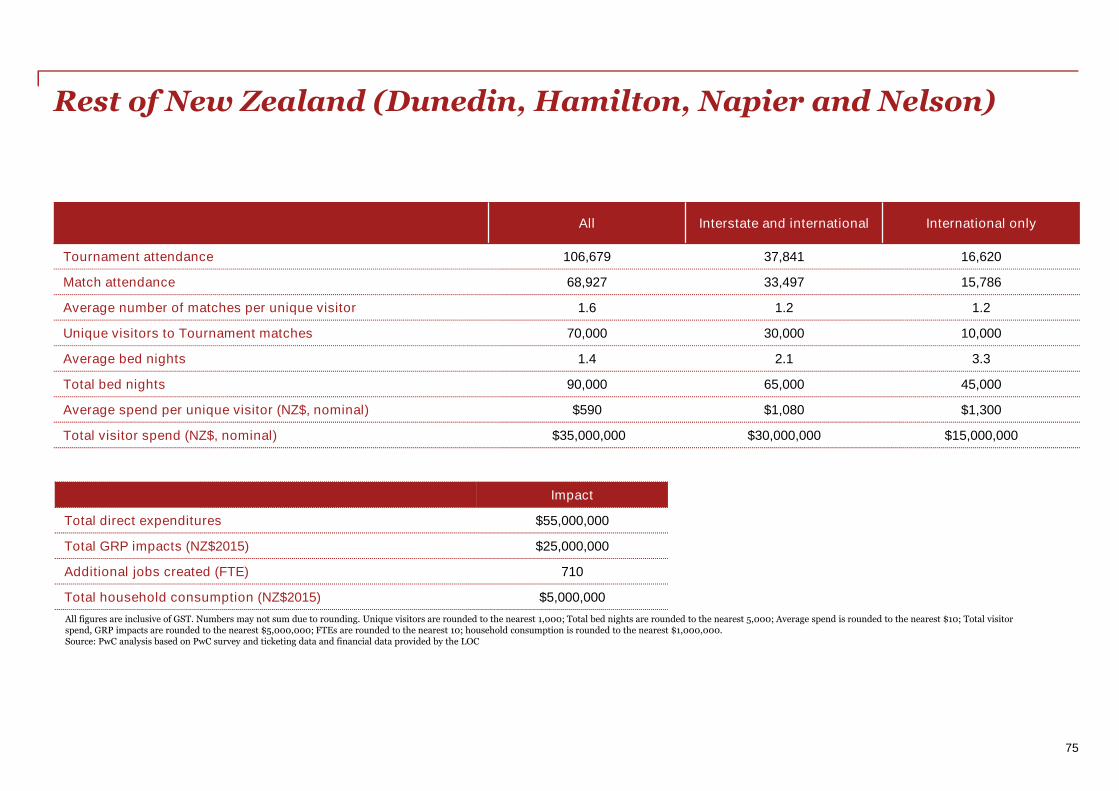
75
Rest of New Zealand (Dunedin, Hamilton, Napier and Nelson)
Impact
Total direct expenditures $55,000,000
Total GRP impacts (NZ$2015) $25,000,000
Additional jobs created (FTE) 710
Total household consumption (NZ$2015) $5,000,000
All Interstate and international International only
Tournament attendance 106,679 37,841 16,620
Match attendance 68,927 33,497 15,786
Average number of matches per unique visitor 1.6 1.2 1.2
Unique visitors to Tournament matches 70,000 30,000 10,000
Average bed nights 1.4 2.1 3.3
Total bed nights 90,000 65,000 45,000
Average spend per unique visitor (NZ$, nominal) $590 $1,080 $1,300
Total visitor spend (NZ$, nominal) $35,000,000 $30,000,000 $15,000,000
All figures are inclusive of GST. Numbers may not sum due to rounding. Unique visitors are rounded to the nearest 1,000; Total bed nights are rounded to the nearest 5,000; Average spend is rounded to the nearest $10; Total visitorspend, GRP impacts are rounded to the nearest $5,000,000; FTEs are rounded to the nearest 10; household consumption is rounded to the nearest $1,000,000.Source: PwC analysis based on PwC survey and ticketing data and financial data provided by the LOC

DRAFT
www.pwc.com.au
© 2015 PricewaterhouseCoopers. All rights reserved.PwC refers to the Australian member firm, and may sometimes refer to the PwC network.Each member firm is a separate legal entity. Please see www.pwc.com/structure for further details.
WL127025404