criminal justice case processing arrest through
TRANSCRIPT
Criminal Justice Processing Report
Andrew M. Cuomo Michael C. Green
Governor Executive Deputy Commissioner
District Attorney Report Series October 2018
Criminal Justice Case Processing
Arrest through Disposition
New York State
January - June 2018
Office of Justice Research and Performance Deputy Commissioner Theresa E. Salo

Criminal Justice Case Processing:
New York State Report
Report Overview
This report details how felony cases are processed in New York State's superior courts (Criminal
Procedure Law 10.10 and 10.20) and its publication fulfils the statutory reporting requirements
outlined in Section 837-a of Executive Law requiring the Division of Criminal Justice Services (DCJS)
to collect and analyze statistical information on felony indictments, superior court informations (SCI)
and the dispositions of felony cases.
Information about the processing of these felony cases is presented for New York State and its two
regions: New York City and the Rest of State (the 57 counties outside of the five boroughs). Arrest
and arraignment statistics also are included for the entire state and each region. Individual county-
specific reports are provided to each District Attorney's office, the New York City Office of the Special
Narcotics Prosecutor (OSNP), and the Office of the Attorney General, and are available to the public
upon request.
The data included in this report is derived from New York State's criminal history records database,
which is maintained by DCJS and known as the Computerized Criminal History (CCH) system. CCH
includes information about adult arrests for offenses that require fingerprints to be taken (Criminal
Procedure Law 160.10). During the period of analysis for this report, state law defined an adult as
anyone who is 16 or older. Arrest information is submitted to DCJS by police agencies as part of the
fingerprint transaction and disposition information is electronically transmitted to DCJS by the Office
of Court Administration.
Data Tables Overview
Tables 1 through 4 summarize arrests for offenses requiring fingerprints to be taken. Arrests - not
individuals - are being counted: If an individual is arrested multiple times during the year shown, each
arrest is counted separately. Arrests are included in the county/region where the arrest took place. If
a police agency makes an arrest outside of its county, that arrest is included in the statistics for the
county where the arrest occurred. Arrest charges are categorized by the most serious charge
reported at the time of arrest. For example, if an individual is charged with a felony and a
misdemeanor, that arrest is categorized as a felony.
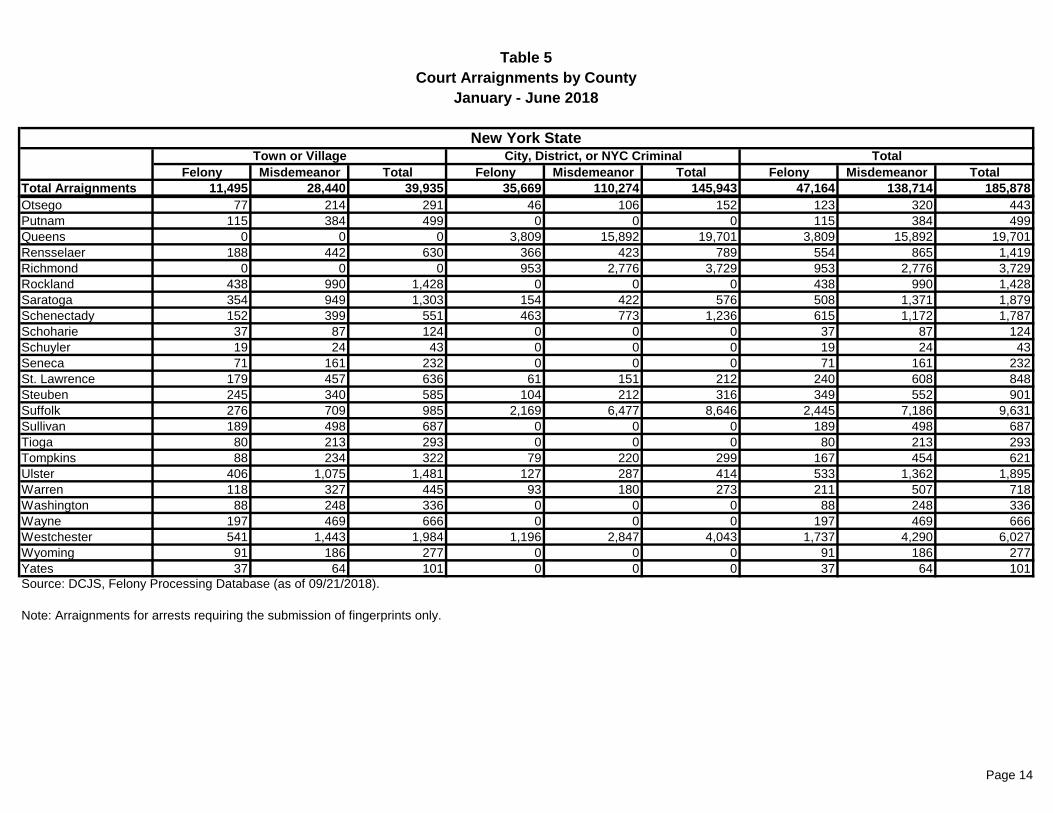
Table 5 shows the number of arraignments in local criminal courts in New York City, and in district,
city, town, or village courts outside of New York City (Criminal Procedure Law 10.10 and 10.30). The
unit of count is persons-arraigned. If an individual is arraigned on more than one charge in a court
case, the most serious charge is shown in the table. If an individual is arraigned in more than one
local criminal court case, each arraignment is counted separately.
Tables 6 through 16 summarize activity in superior courts including the number of felony
indictments and SCIs; processing times for those cases; dispositions of felony indictments/SCIs, and
sentences for felony convictions. When more than one defendant is charged in one indictment or
SCI, each defendant is counted separately. If one defendant is charged in multiple indictments or
SCIs, each indictment or SCI is counted separately. More than one indictment or SCI can result from
a single arrest and multiple arrests can be combined into one indictment or SCI. If an indictment or
SCI is superseded by another, both are counted.

Charges listed in tables 6 through 16 are categorized by the most serious charge included in the
indictment/SCI or conviction/adjudication. For example, if a defendant is charged in an indictment -
or convicted of - third-degree criminal possession of a controlled substance (a Class B felony) and
third-degree criminal possession of stolen property (a Class D felony), the case would be categorized
in the tables as a Class B drug felony.
Tables 7 and 8 summarize processing times for cases arraigned and disposed in superior court.
There are several factors that can contribute to variation in processing times including participation
by the defendant in a community-based program as an alternative to incarceration; placement on
interim supervision; the failure of a defendant to appear at scheduled court appearances; the
seriousness or complexity of the case; and prosecutorial, defense and court caseloads.
Case processing times are shown for arrest to Superior Court arraignment (Table 7) and from
arraignment to disposition (Table 8). The unit of measurement for these tables is median number of
days. Median is the middle score for a set of numbers arranged from smallest to largest. For
example, Table 8 shows the median days from arraignment in superior court to final disposition for
felony indictments/SCIs. If the median number of days between arraignment and final disposition is
130 days, this indicates half (50%) of cases disposed were disposed within 130 days and half (50%)
of cases were disposed after 130 days. Using the median, instead of the average number of days,
mitigates the impact of cases that may take an unusually long time to process (outliers).
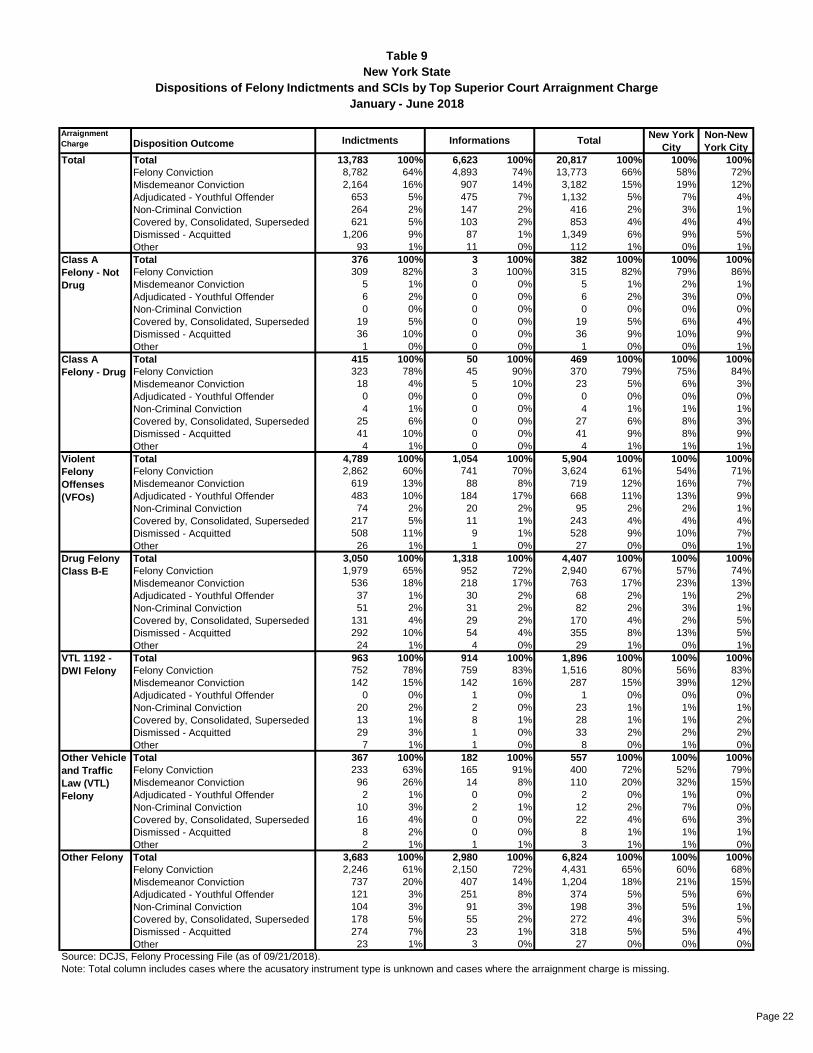
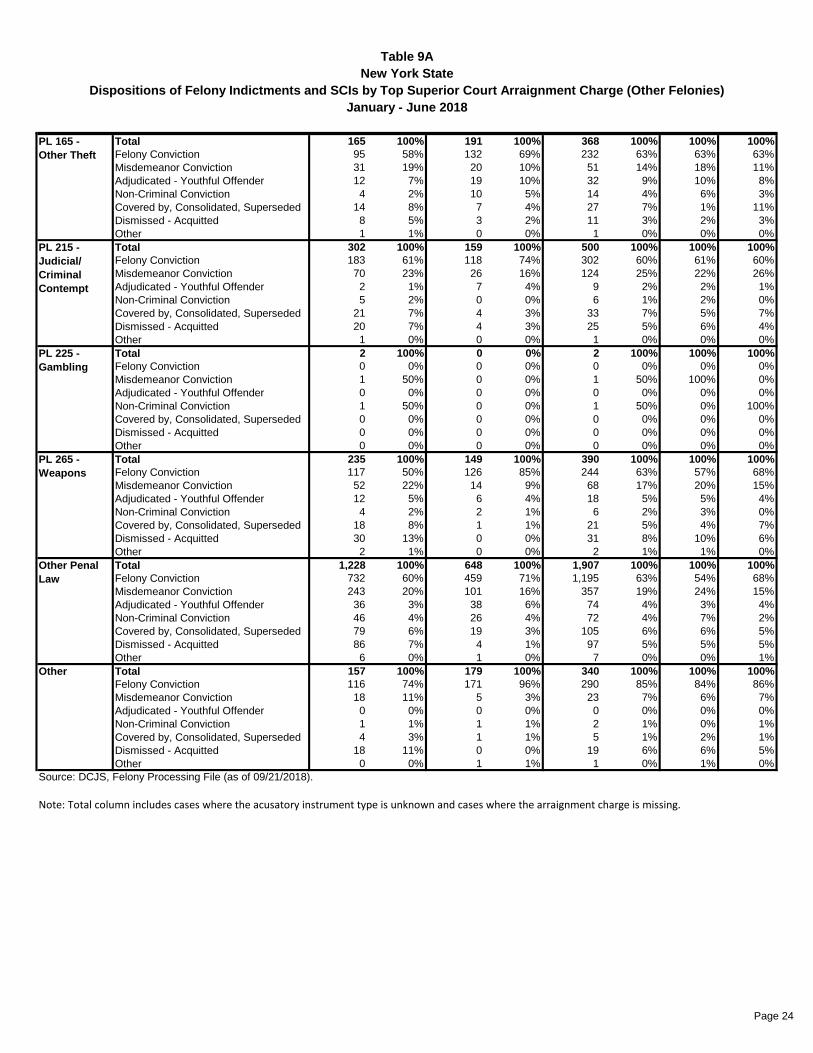
Table 9 summarizes dispositions of felony indictments/SCIs disposed during the year shown.
Table 10 compares the top arraignment charge in superior court to top conviction charge for cases
resulting in convictions during the year shown.
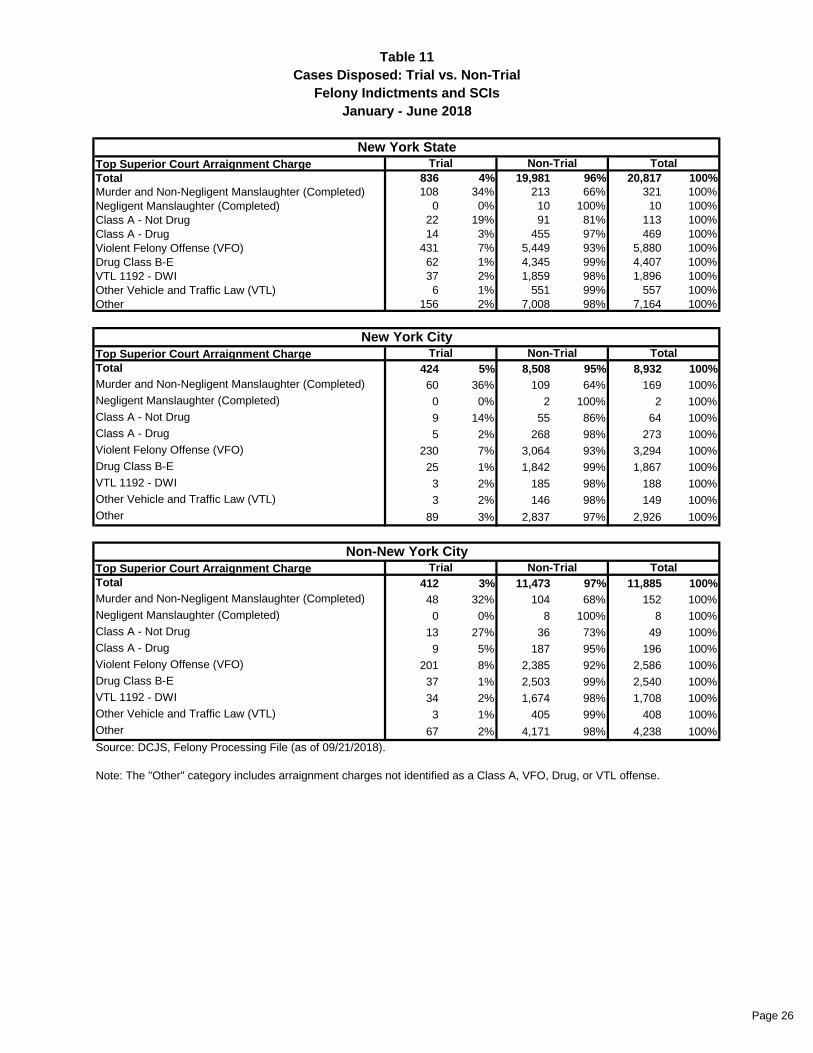
Tables 11 and 12 summarize trial versus plea bargain activity and the outcomes of cases that went
to trial. Included are cases that were sentenced or acquitted during the year shown.
Note: Cases where the defendant has been convicted but not yet sentenced are not
included in Tables 9 through 12.
Tables 13 through 16 summarize sentences for felony convictions and youthful offender
adjudications (Criminal Procedure Law Article 720). Table 13 shows sentences by prior felony
conviction, which is based on New York State criminal history information and does not include out of
state convictions. Table 13 also does not indicate under which provision of law a sentence was
imposed, including provisions of law that require a mandatory prison sentence.

• Table 1. Felony and Misdemeanor Adult Arrests
• Table 1A. Felony Arrests by PL Article
• Table 1B. Misdemeanor Arrests by PL Article
• Table 2. Felony and Misdemeanor Adult Arrests by Age Group
• Table 3. Felony Adult Arrests by Arrest County
• Table 4. Misdemeanor Adult Arrests by Arrest County
• Table 5. Court Arraignments by County
• Table 6. Superior Court Felony Arraignments
• Table 6A. Superior Court Felony Arraignments by Office
• Table 7A. Days from Arrest to Superior Court Arraignment (New York State)
• Table 7B. Days from Arrest to Superior Court Arraignment (New York City)
• Table 7C. Days from Arrest to Superior Court Arraignment (Non-New York City)
• Table 8. Days from Superior Court Felony Arraignment to Final Court Disposition
• Table 9. Dispositions of Felony Indictments and SCIs
• Table 9A. Dispositions of Felony Indictments and SCIs (Additional Detail for Other Felonies Category)
• Table 10. Superior Court Felony Cases Resulting in Conviction
• Table 11. Cases Disposed: Trial vs. Non-Trial
• Table 12. Trial Dispositions
• Table 13A. Sentences for Non-YO Felony Convictions (New York State)
• Table 13B. Sentences for Non-YO Felony Convictions (New York City)
• Table 13C. Sentences for Non-YO Felony Convictions (Non-New York City)
• Table 14. Sentences for YO Felony Adjudications by Adjudication Charge
• Table 15. Non-YO Sentences to Prison by Conviction Charge
• Table 16. YO Sentences to Prison by Adjudication Charge
Criminal Justice Case Processing:
New York State ReportTable of Contents
2017 20182017 vs.
20182017 2018
2017 vs.
2018
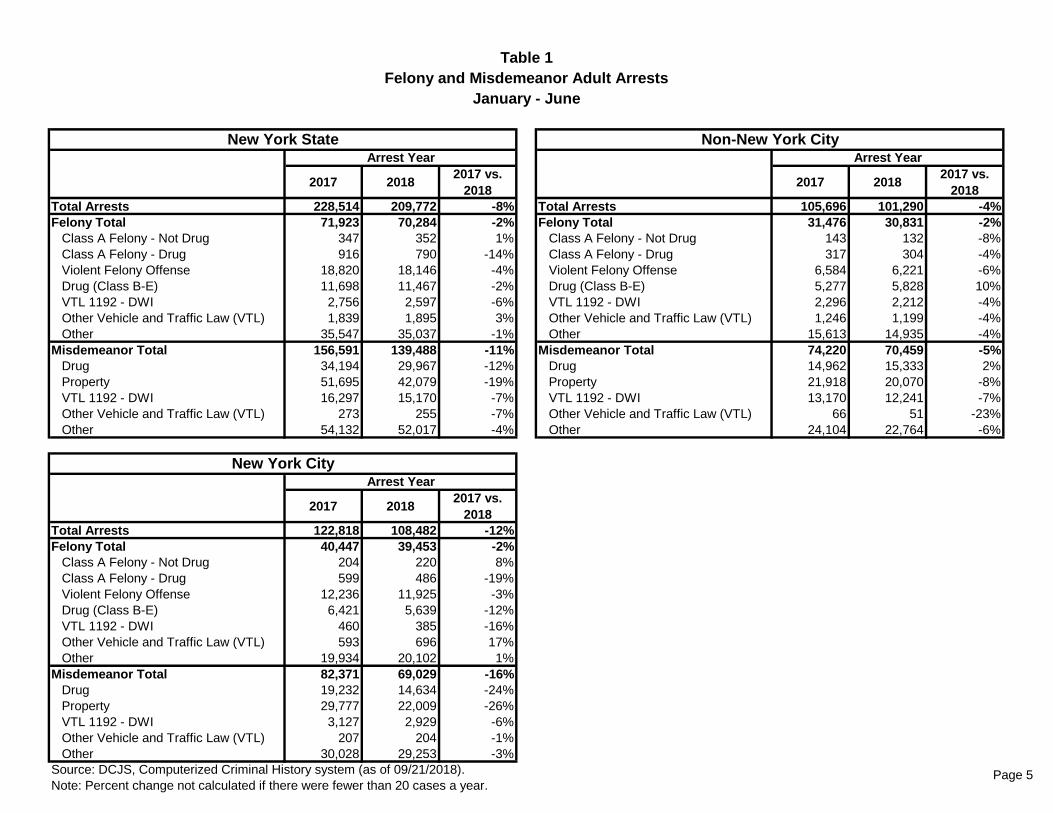
Total Arrests 228,514 209,772 -8% Total Arrests 105,696 101,290 -4%
Felony Total 71,923 70,284 -2% Felony Total 31,476 30,831 -2%
Class A Felony - Not Drug 347 352 1% Class A Felony - Not Drug 143 132 -8%
Class A Felony - Drug 916 790 -14% Class A Felony - Drug 317 304 -4%
Violent Felony Offense 18,820 18,146 -4% Violent Felony Offense 6,584 6,221 -6%
Drug (Class B-E) 11,698 11,467 -2% Drug (Class B-E) 5,277 5,828 10%
VTL 1192 - DWI 2,756 2,597 -6% VTL 1192 - DWI 2,296 2,212 -4%
Other Vehicle and Traffic Law (VTL) 1,839 1,895 3% Other Vehicle and Traffic Law (VTL) 1,246 1,199 -4%
Other 35,547 35,037 -1% Other 15,613 14,935 -4%
Misdemeanor Total 156,591 139,488 -11% Misdemeanor Total 74,220 70,459 -5%
Drug 34,194 29,967 -12% Drug 14,962 15,333 2%
Property 51,695 42,079 -19% Property 21,918 20,070 -8%
VTL 1192 - DWI 16,297 15,170 -7% VTL 1192 - DWI 13,170 12,241 -7%
Other Vehicle and Traffic Law (VTL) 273 255 -7% Other Vehicle and Traffic Law (VTL) 66 51 -23%
Other 54,132 52,017 -4% Other 24,104 22,764 -6%
2017 20182017 vs.
2018
Total Arrests 122,818 108,482 -12%
Felony Total 40,447 39,453 -2%
Class A Felony - Not Drug 204 220 8%
Class A Felony - Drug 599 486 -19%
Violent Felony Offense 12,236 11,925 -3%
Drug (Class B-E) 6,421 5,639 -12%
VTL 1192 - DWI 460 385 -16%
Other Vehicle and Traffic Law (VTL) 593 696 17%
Other 19,934 20,102 1%
Misdemeanor Total 82,371 69,029 -16%
Drug 19,232 14,634 -24%
Property 29,777 22,009 -26%
VTL 1192 - DWI 3,127 2,929 -6%
Other Vehicle and Traffic Law (VTL) 207 204 -1%
Other 30,028 29,253 -3%
Source: DCJS, Computerized Criminal History system (as of 09/21/2018).
Note: Percent change not calculated if there were fewer than 20 cases a year.
Arrest Year
New York CityArrest Year
Table 1
Felony and Misdemeanor Adult Arrests
January - June
New York StateArrest Year
Non-New York City
Page 5
2017 2018
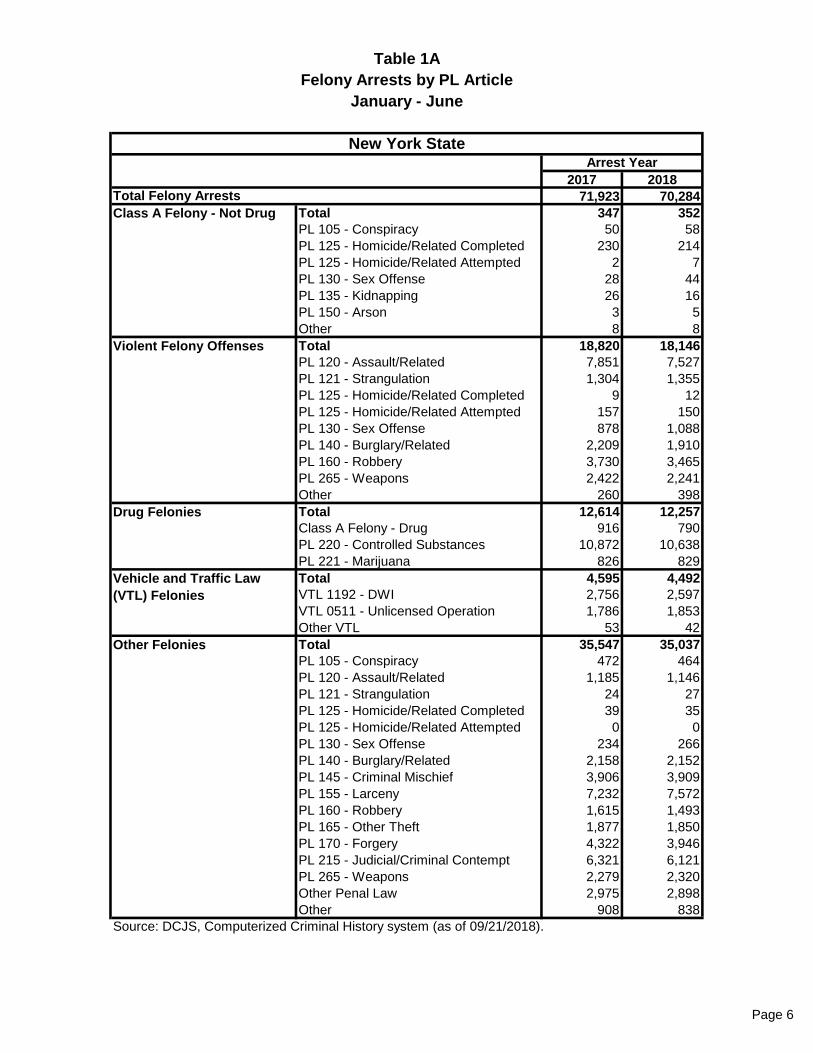
71,923 70,284
Total 347 352
PL 105 - Conspiracy 50 58
PL 125 - Homicide/Related Completed 230 214
PL 125 - Homicide/Related Attempted 2 7
PL 130 - Sex Offense 28 44
PL 135 - Kidnapping 26 16
PL 150 - Arson 3 5
Other 8 8
Total 18,820 18,146
PL 120 - Assault/Related 7,851 7,527
PL 121 - Strangulation 1,304 1,355
PL 125 - Homicide/Related Completed 9 12
PL 125 - Homicide/Related Attempted 157 150
PL 130 - Sex Offense 878 1,088
PL 140 - Burglary/Related 2,209 1,910
PL 160 - Robbery 3,730 3,465
PL 265 - Weapons 2,422 2,241
Other 260 398
Total 12,614 12,257
Class A Felony - Drug 916 790
PL 220 - Controlled Substances 10,872 10,638
PL 221 - Marijuana 826 829
Total 4,595 4,492
VTL 1192 - DWI 2,756 2,597
VTL 0511 - Unlicensed Operation 1,786 1,853
Other VTL 53 42
Total 35,547 35,037
PL 105 - Conspiracy 472 464
PL 120 - Assault/Related 1,185 1,146
PL 121 - Strangulation 24 27
PL 125 - Homicide/Related Completed 39 35
PL 125 - Homicide/Related Attempted 0 0
PL 130 - Sex Offense 234 266
PL 140 - Burglary/Related 2,158 2,152
PL 145 - Criminal Mischief 3,906 3,909
PL 155 - Larceny 7,232 7,572
PL 160 - Robbery 1,615 1,493
PL 165 - Other Theft 1,877 1,850
PL 170 - Forgery 4,322 3,946
PL 215 - Judicial/Criminal Contempt 6,321 6,121
PL 265 - Weapons 2,279 2,320
Other Penal Law 2,975 2,898
Other 908 838
Source: DCJS, Computerized Criminal History system (as of 09/21/2018).
Class A Felony - Not Drug
Violent Felony Offenses
Drug Felonies
Vehicle and Traffic Law
(VTL) Felonies
Other Felonies
Felony Arrests by PL Article
January - June
New York StateArrest Year
Total Felony Arrests
Table 1A
Page 6

2017 2018
156,591 139,488
Total 34,194 29,967
PL 220 - Controlled Substance 19,691 18,551
PL 221 - Marijuana 14,503 11,416
Total 51,695 42,079
PL 140 - Criminal Trespass/Related 5,358 4,032
PL 145 - Criminal Mischief 7,679 7,377
PL 150 - Arson 38 28
PL 155 - Larceny 24,403 23,334
PL 165 - Other Theft 14,217 7,308
Total 16,570 15,425
VTL 1192 - DWI 16,297 15,170
VTL 0511 - Unlicensed Operation 273 255
Other VTL 0 0
Total 54,132 52,017
PL 120 - Assault/Related 21,780 21,804
PL 121 - Strangulation 3,207 3,247
PL 130 - Sex Offenses 1,004 1,013
PL 205 - Resisting Arrest, Etc. 2,888 2,642
PL 215 - Judicial/Criminal Contempt 6,176 5,855
PL 240 - Public Order 4,530 4,094
PL 260 - Endangering 3,164 3,081
PL 265 - Weapons 3,630 3,259
Other Penal Law 7,350 6,679
Other 403 343
Property Misdemeanors
Vehicle and Traffic Law
(VTL) Misdemeanors
Other Misdemeanors
Source: DCJS, Computerized Criminal History system (as of 09/21/2018).
January - June
New York StateArrest Year
Total Misdemeanor Arrests
Drug Misdemeanors
Table 1B
Misdemeanor Arrests by PL Article
Page 7

2017 20182017 vs.
20182017 2018
2017 vs.
2018
228,514 209,772 -8% 105,696 101,290 -4%
Total 71,923 70,284 -2% Total 31,476 30,831 -2%
13-15 216 176 -19% 13-15 53 57 8%
16-17 3,372 3,008 -11% 16-17 1,362 1,185 -13%
18-20 7,004 6,230 -11% 18-20 3,040 2,750 -10%
21-24 10,771 9,906 -8% 21-24 4,591 4,179 -9%
25-29 13,400 13,202 -1% 25-29 6,026 5,964 -1%
30-34 10,496 10,655 2% 30-34 4,895 4,795 -2%
35-39 7,878 8,286 5% 35-39 3,594 3,925 9%
40-44 5,368 5,507 3% 40-44 2,331 2,468 6%
45-49 4,956 4,624 -7% 45-49 2,156 1,994 -8%
50-54 4,181 4,044 -3% 50-54 1,656 1,623 -2%
55+ 4,281 4,646 9% 55+ 1,772 1,891 7%
Total 156,591 139,488 -11% Total 74,220 70,459 -5%
16-17 7,699 5,717 -26% 16-17 3,405 2,742 -19%
18-20 16,680 12,954 -22% 18-20 7,832 6,740 -14%
21-24 24,762 20,397 -18% 21-24 11,792 10,542 -11%
25-29 28,583 25,660 -10% 25-29 13,908 13,187 -5%
30-34 21,279 19,964 -6% 30-34 10,397 10,373 0%
35-39 16,057 15,692 -2% 35-39 7,544 8,025 6%
40-44 11,164 10,684 -4% 40-44 5,200 5,208 0%
45-49 10,438 9,526 -9% 45-49 4,976 4,661 -6%
50-54 9,185 8,147 -11% 50-54 4,089 3,752 -8%
55+ 10,744 10,747 0% 55+ 5,077 5,229 3%
2017 20182017 vs.
2018
122,818 108,482 -12%
Total 40,447 39,453 -2%
13-15 163 119 -27%
16-17 2,010 1,823 -9%
18-20 3,964 3,480 -12%
21-24 6,180 5,727 -7%
25-29 7,374 7,238 -2%
30-34 5,601 5,860 5%
35-39 4,284 4,361 2%
40-44 3,037 3,039 0%
45-49 2,800 2,630 -6%
50-54 2,525 2,421 -4%
55+ 2,509 2,755 10%
Total 82,371 69,029 -16%
16-17 4,294 2,975 -31%
18-20 8,848 6,214 -30%
21-24 12,970 9,855 -24%
25-29 14,675 12,473 -15%
30-34 10,882 9,591 -12%
35-39 8,513 7,667 -10%
40-44 5,964 5,476 -8%
45-49 5,462 4,865 -11%
50-54 5,096 4,395 -14%
55+ 5,667 5,518 -3%
Source: DCJS, Computerized Criminal History system (as of 09/21/2018).
Notes: Age reflects age at crime.
Does not include Juvenile Delinquent arrests age 15 and under handled in Family Court.
Percent change not calculated if there were fewer than 20 cases a year.
Non-New York CityArrest Year
Total Arrests
Felony
Misdemeanor
New York CityArrest Year
New York StateArrest Year
Felony
Misdemeanor
Total Arrests
Total Arrests
Felony
Misdemeanor
Table 2
Felony and Misdemeanor Adult Arrests by Age Group
January - June
Page 8
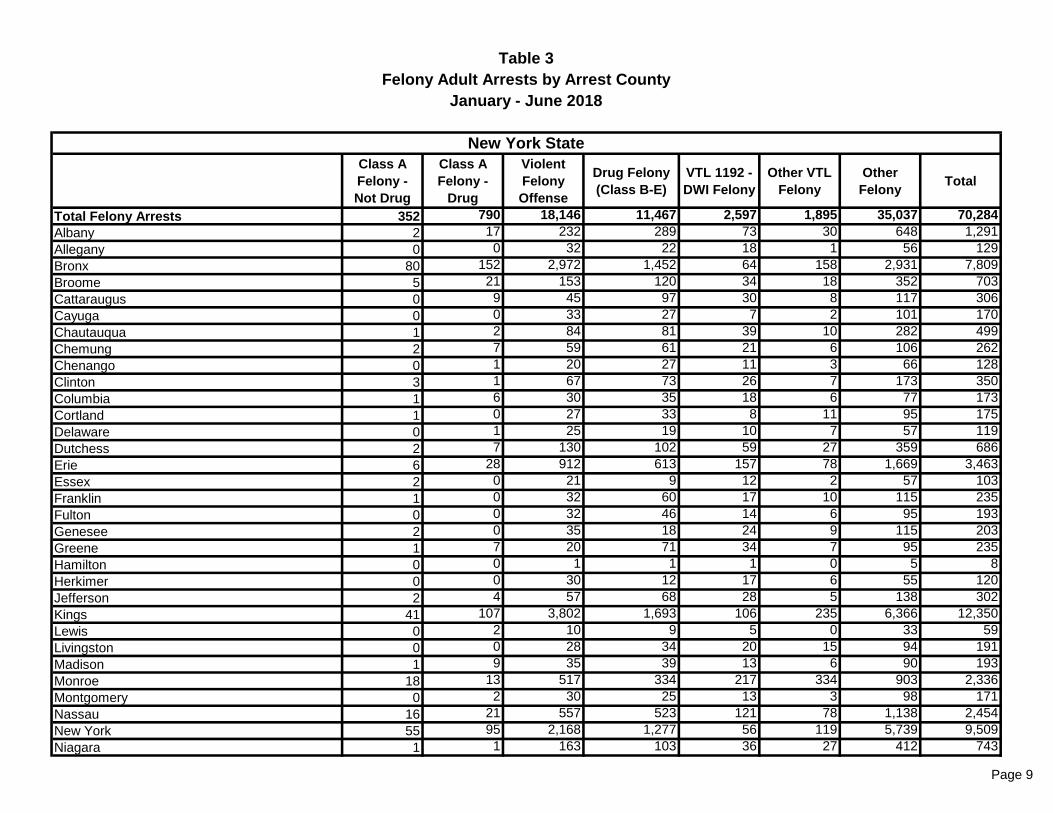
Class A
Felony -
Not Drug
Class A
Felony -
Drug
Violent
Felony
Offense
Drug Felony
(Class B-E)
VTL 1192 -
DWI Felony
Other VTL
Felony
Other
FelonyTotal
Total Felony Arrests 352 790 18,146 11,467 2,597 1,895 35,037 70,284
Albany 2 17 232 289 73 30 648 1,291
Allegany 0 0 32 22 18 1 56 129
Bronx 80 152 2,972 1,452 64 158 2,931 7,809
Broome 5 21 153 120 34 18 352 703
Cattaraugus 0 9 45 97 30 8 117 306
Cayuga 0 0 33 27 7 2 101 170
Chautauqua 1 2 84 81 39 10 282 499
Chemung 2 7 59 61 21 6 106 262
Chenango 0 1 20 27 11 3 66 128
Clinton 3 1 67 73 26 7 173 350
Columbia 1 6 30 35 18 6 77 173
Cortland 1 0 27 33 8 11 95 175
Delaware 0 1 25 19 10 7 57 119
Dutchess 2 7 130 102 59 27 359 686
Erie 6 28 912 613 157 78 1,669 3,463
Essex 2 0 21 9 12 2 57 103
Franklin 1 0 32 60 17 10 115 235
Fulton 0 0 32 46 14 6 95 193
Genesee 2 0 35 18 24 9 115 203
Greene 1 7 20 71 34 7 95 235
Hamilton 0 0 1 1 1 0 5 8
Herkimer 0 0 30 12 17 6 55 120
Jefferson 2 4 57 68 28 5 138 302
Kings 41 107 3,802 1,693 106 235 6,366 12,350
Lewis 0 2 10 9 5 0 33 59
Livingston 0 0 28 34 20 15 94 191
Madison 1 9 35 39 13 6 90 193
Monroe 18 13 517 334 217 334 903 2,336
Montgomery 0 2 30 25 13 3 98 171
Nassau 16 21 557 523 121 78 1,138 2,454
New York 55 95 2,168 1,277 56 119 5,739 9,509
Niagara 1 1 163 103 36 27 412 743
Table 3
Felony Adult Arrests by Arrest County
January - June 2018
New York State
Page 9

Class A
Felony -
Not Drug
Class A
Felony -
Drug
Violent
Felony
Offense
Drug Felony
(Class B-E)
VTL 1192 -
DWI Felony
Other VTL
Felony
Other
FelonyTotal
Total Felony Arrests 352 790 18,146 11,467 2,597 1,895 35,037 70,284
Table 3
Felony Adult Arrests by Arrest County
January - June 2018
New York State
Oneida 4 6 122 109 36 3 362 642
Onondaga 21 18 376 290 96 43 848 1,692
Ontario 1 3 40 78 27 8 152 309
Orange 5 27 241 358 113 41 494 1,279
Orleans 3 0 16 26 6 4 85 140
Oswego 0 3 54 32 38 13 202 342
Otsego 0 4 34 44 12 3 71 168
Putnam 0 2 30 55 17 5 60 169
Queens 40 120 2,545 959 133 137 4,257 8,191
Rensselaer 2 5 129 116 40 12 324 628
Richmond 4 12 438 258 26 47 809 1,594
Rockland 0 1 119 57 43 15 286 521
Saratoga 0 6 91 98 54 16 295 560
Schenectady 1 2 142 147 24 19 401 736
Schoharie 0 0 7 2 11 5 30 55
Schuyler 0 0 7 11 11 0 16 45
Seneca 0 0 21 13 23 4 62 123
St. Lawrence 1 4 64 64 16 9 158 316
Steuben 1 2 61 135 26 8 163 396
Suffolk 5 29 446 515 209 142 1,283 2,629
Sullivan 1 3 58 50 12 18 157 299
Tioga 0 2 14 25 16 2 48 107
Tompkins 3 2 53 27 20 3 76 184
Ulster 4 13 76 109 67 24 283 576
Warren 0 0 40 41 25 5 135 246
Washington 1 0 25 26 23 7 120 202
Wayne 2 0 25 28 31 6 131 223
Westchester 8 10 487 381 101 47 991 2,025
Wyoming 2 3 21 29 19 13 72 159
Yates 0 0 5 11 13 2 29 60
Source: DCJS, Computerized Criminal History system (as of 09/21/2018).
Page 10

Drug
Misdemeanor
Property
Misdemeanor
VTL 1192 -
DWI
Misdemeanor
Other VTL
Misdemeanor
Other
MisdemeanorTotal
Total Misdemeanor Arrests 29,967 42,079 15,170 255 52,017 139,488
Albany 463 720 413 4 643 2,243
Allegany 28 74 66 0 141 309
Bronx 3,625 3,875 484 32 8,493 16,509
Broome 380 662 216 0 554 1,812
Cattaraugus 84 198 128 0 170 580
Cayuga 30 136 82 0 185 433
Chautauqua 226 283 219 1 424 1,153
Chemung 155 263 105 0 238 761
Chenango 34 107 55 0 97 293
Clinton 76 187 165 0 198 626
Columbia 143 106 81 0 138 468
Cortland 93 169 79 0 127 468
Delaware 31 73 49 0 115 268
Dutchess 327 338 411 1 512 1,589
Erie 1,509 2,070 943 4 2,312 6,838
Essex 49 42 82 0 66 239
Franklin 52 86 82 0 146 366
Fulton 51 103 91 0 180 425
Genesee 51 122 112 0 143 428
Greene 121 92 132 1 126 472
Hamilton 5 3 0 0 12 20
Herkimer 65 106 100 0 138 409
Jefferson 67 278 168 0 280 793
Kings 4,546 5,503 658 42 7,306 18,055
Lewis 7 27 26 0 65 125
Livingston 96 79 107 0 124 406
Madison 51 164 73 0 164 452
Monroe 418 1,763 867 0 1,701 4,749
Montgomery 60 127 54 0 171 412
Nassau 2,746 1,232 807 17 1,488 6,290
New York 3,702 7,964 662 59 6,239 18,626
Niagara 218 449 273 0 528 1,468
Oneida 249 752 176 0 695 1,872
Onondaga 715 1,300 526 0 1,055 3,596
Table 4
Misdemeanor Adult Arrests by Arrest County
January - June 2018
New York State
Page 11

Drug
Misdemeanor
Property
Misdemeanor
VTL 1192 -
DWI
Misdemeanor
Other VTL
Misdemeanor
Other
MisdemeanorTotal
Total Misdemeanor Arrests 29,967 42,079 15,170 255 52,017 139,488
Table 4
Misdemeanor Adult Arrests by Arrest County
January - June 2018
New York State
Ontario 97 221 148 1 191 658
Orange 848 880 612 3 956 3,299
Orleans 19 96 52 0 110 277
Oswego 154 362 164 1 305 986
Otsego 56 119 95 1 126 397
Putnam 120 54 189 2 117 482
Queens 2,073 3,957 806 60 6,079 12,975
Rensselaer 153 342 169 0 353 1,017
Richmond 688 710 319 11 1,136 2,864
Rockland 221 345 256 2 415 1,239
Saratoga 259 381 355 0 486 1,481
Schenectady 140 478 107 1 614 1,340
Schoharie 13 39 29 0 63 144
Schuyler 14 24 36 0 29 103
Seneca 23 60 47 0 90 220
St. Lawrence 113 226 121 0 282 742
Steuben 125 187 145 0 217 674
Suffolk 2,320 1,902 1,255 3 2,096 7,576
Sullivan 206 166 141 1 177 691
Tioga 75 53 52 1 111 292
Tompkins 71 212 88 0 136 507
Ulster 336 319 332 1 509 1,497
Warren 121 186 136 0 178 621
Washington 106 73 104 0 157 440
Wayne 46 201 104 0 187 538
Westchester 1,058 973 695 6 1,793 4,525
Wyoming 28 35 97 0 90 250
Yates 11 25 24 0 40 100
Source: DCJS, Computerized Criminal History system (as of 09/21/2018).
Page 12

Felony Misdemeanor Total Felony Misdemeanor Total Felony Misdemeanor Total
Total Arraignments 11,495 28,440 39,935 35,669 110,274 145,943 47,164 138,714 185,878
Albany 519 1,045 1,564 655 1,001 1,656 1,174 2,046 3,220
Allegany 62 140 202 0 0 0 62 140 202
Bronx 0 0 0 3,333 15,900 19,233 3,333 15,900 19,233
Broome 441 1,100 1,541 282 698 980 723 1,798 2,521
Cattaraugus 135 216 351 132 258 390 267 474 741
Cayuga 51 102 153 90 237 327 141 339 480
Chautauqua 131 425 556 312 640 952 443 1,065 1,508
Chemung 71 321 392 109 375 484 180 696 876
Chenango 41 131 172 56 78 134 97 209 306
Clinton 160 305 465 85 190 275 245 495 740
Columbia 98 261 359 42 65 107 140 326 466
Cortland 66 204 270 87 230 317 153 434 587
Delaware 66 190 256 0 0 0 66 190 256
Dutchess 301 899 1,200 229 408 637 530 1,307 1,837
Erie 1,111 3,393 4,504 2,101 3,232 5,333 3,212 6,625 9,837
Essex 71 180 251 0 0 0 71 180 251
Franklin 126 192 318 0 0 0 126 192 318
Fulton 42 99 141 142 289 431 184 388 572
Genesee 98 203 301 71 164 235 169 367 536
Greene 169 366 535 0 0 0 169 366 535
Hamilton 4 9 13 0 0 0 4 9 13
Herkimer 68 229 297 14 40 54 82 269 351
Jefferson 113 316 429 164 324 488 277 640 917
Kings 0 0 0 5,982 21,058 27,040 5,982 21,058 27,040
Lewis 43 62 105 0 0 0 43 62 105
Livingston 122 285 407 0 0 0 122 285 407
Madison 97 186 283 56 191 247 153 377 530
Monroe 841 2,099 2,940 1,238 2,308 3,546 2,079 4,407 6,486
Montgomery 62 184 246 83 135 218 145 319 464
Nassau 0 0 0 2,408 5,790 8,198 2,408 5,790 8,198
NewYork 0 0 0 5,627 20,005 25,632 5,627 20,005 25,632
Niagara 180 459 639 525 936 1,461 705 1,395 2,100
Oneida 343 680 1,023 366 1,326 1,692 709 2,006 2,715
Onondaga 946 1,704 2,650 1,106 1,943 3,049 2,052 3,647 5,699
Ontario 167 354 521 140 244 384 307 598 905
Orange 483 1,568 2,051 486 1,071 1,557 969 2,639 3,608
Orleans 124 263 387 0 0 0 124 263 387
Oswego 157 357 514 128 372 500 285 729 1,014
Town or Village City, District, or NYC Criminal Total
Table 5
Court Arraignments by County
January - June 2018
New York State
Page 13
Felony Misdemeanor Total Felony Misdemeanor Total Felony Misdemeanor Total
Total Arraignments 11,495 28,440 39,935 35,669 110,274 145,943 47,164 138,714 185,878
Town or Village City, District, or NYC Criminal Total
Table 5
Court Arraignments by County
January - June 2018
New York State
Otsego 77 214 291 46 106 152 123 320 443
Putnam 115 384 499 0 0 0 115 384 499
Queens 0 0 0 3,809 15,892 19,701 3,809 15,892 19,701
Rensselaer 188 442 630 366 423 789 554 865 1,419
Richmond 0 0 0 953 2,776 3,729 953 2,776 3,729
Rockland 438 990 1,428 0 0 0 438 990 1,428
Saratoga 354 949 1,303 154 422 576 508 1,371 1,879
Schenectady 152 399 551 463 773 1,236 615 1,172 1,787
Schoharie 37 87 124 0 0 0 37 87 124
Schuyler 19 24 43 0 0 0 19 24 43
Seneca 71 161 232 0 0 0 71 161 232
St. Lawrence 179 457 636 61 151 212 240 608 848
Steuben 245 340 585 104 212 316 349 552 901
Suffolk 276 709 985 2,169 6,477 8,646 2,445 7,186 9,631
Sullivan 189 498 687 0 0 0 189 498 687
Tioga 80 213 293 0 0 0 80 213 293
Tompkins 88 234 322 79 220 299 167 454 621
Ulster 406 1,075 1,481 127 287 414 533 1,362 1,895
Warren 118 327 445 93 180 273 211 507 718
Washington 88 248 336 0 0 0 88 248 336
Wayne 197 469 666 0 0 0 197 469 666
Westchester 541 1,443 1,984 1,196 2,847 4,043 1,737 4,290 6,027
Wyoming 91 186 277 0 0 0 91 186 277
Yates 37 64 101 0 0 0 37 64 101
Source: DCJS, Felony Processing Database (as of 09/21/2018).
Note: Arraignments for arrests requiring the submission of fingerprints only.
Page 14

Indictments Informations Unknown Total
12,586 6,393 383 19,362 21,470
Total 265 1 1 267 317
PL 105 - Conspiracy 4 0 0 4 24
PL 125 - Homicide/Related Completed 179 0 1 180 212
PL 125 - Homicide/Related Attempted 9 0 0 9 11
PL 130 - Sex Offense 65 1 0 66 51
PL 135 - Kidnapping 6 0 0 6 19
PL 150 - Arson 2 0 0 2 0
Other Class A Felony - Not Drug 0 0 0 0 0
Total 4,047 967 42 5,056 5,789
PL 120 - Assault/Related 1,064 153 14 1,231 1,395
PL 121 - Strangulation 51 20 2 73 73
PL 125 - Homicide/Related Completed 14 2 0 16 18
PL 125 - Homicide/Related Attempted 109 0 0 109 127
PL 130 - Sex Offense 365 139 4 508 437
PL 140 - Burglary/Related 524 204 8 736 935
PL 160 - Robbery 1,003 214 9 1,226 1,493
PL 265 - Weapons 840 220 3 1,063 1,187
Other VFO 77 15 2 94 124
Total 3,288 1,330 23 4,641 5,030
Class A Felony - Drug 339 52 3 394 542
PL 220 - Controlled Substances 2,832 1,220 20 4,072 4,302
PL 221 - Marijuana 117 58 0 175 186
Total 1,191 1,094 16 2,301 2,465
VTL 1192 - DWI 875 919 15 1,809 1,935
VTL 0511 - Unlicensed Operation 302 158 1 461 485
Other VTL 14 17 0 31 45
Total 3,795 3,001 301 7,097 7,869
PL 105 - Conspiracy 144 12 0 156 404
PL 120 - Assault/Related 103 167 5 275 253
PL 121 - Strangulation 0 10 0 10 6
PL 125 - Homicide/Related Completed 34 13 0 47 53
PL 125 - Homicide/Related Attempted 0 0 0 0 0
PL 130 - Sex Offense 65 56 2 123 146
PL 140 - Burglary/Related 355 484 9 848 985
PL 155 - Larceny 875 641 20 1,536 1,757
PL 160 - Robbery 132 252 1 385 392
PL 165 - Other Theft 148 177 5 330 345
PL 170 - Forgery 317 181 4 502 588
PL 215 - Judicial/Criminal Contempt 320 145 40 505 569
PL 265 - Weapons 240 158 4 402 378
Other Penal Law Felony 684 426 27 1,137 1,240
Other/Missing 378 279 184 841 753
Source: DCJS, Felony Processing File (as of 09/21/2018).
Drug Felonies
Vehicle and
Traffic Law
(VTL)
FeloniesOther
Felonies
Table 6
Superior Court Felony Arraignments
January - June
New York State2018
2017
Total Superior Court Arraignments
Class A
Felony - Not
Drug
Violent Felony
Offenses
(VFOs)
Page 15

Indictments Informations Unknown Total
Total Superior Court Arraignments 12,586 6,393 383 19,362 21,470
Albany County DA Office 206 217 6 429 474
Allegany County DA Office 4 31 0 35 41
Bronx County DA Office 1,349 181 29 1,559 1,717
Broome County DA Office 108 145 3 256 302
Cattaraugus County DA Office 109 66 0 175 150
Cayuga County DA Office 32 33 0 65 112
Chautauqua County DA Office 62 62 1 125 194
Chemung County DA Office 148 11 3 162 172
Chenango County DA Office 63 1 3 67 77
Clinton County DA Office 71 74 12 157 165
Columbia County DA Office 33 38 2 73 87
Cortland County DA Office 37 50 4 91 79
Delaware County DA Office 11 23 0 34 55
Dutchess County DA Office 81 108 0 189 279
Erie County DA Office 313 384 58 755 843
Essex County DA Office 17 7 0 24 38
Franklin County DA Office 38 8 5 51 78
Fulton County DA Office 26 67 0 93 100
Genesee County DA Office 70 55 3 128 138
Greene County DA Office 26 38 1 65 57
Hamilton County DA Office 2 2 0 4 4
Herkimer County DA Office 36 23 1 60 51
Jefferson County DA Office 105 100 0 205 169
Kings County DA Office 1,640 245 36 1,921 2,175
Lewis County DA Office 13 17 0 30 47
Livingston County DA Office 50 50 0 100 124
Madison County DA Office 42 67 1 110 95
Monroe County DA Office 652 213 4 869 925
Montgomery County DA Office 33 48 2 83 95
Nassau County DA Office 415 492 40 947 1,080
New York County DA Office 1,953 191 45 2,189 2,401
Niagara County DA Office 63 56 2 121 197
Oneida County DA Office 213 113 2 328 415
Onondaga County DA Office 406 242 15 663 611
Ontario County DA Office 45 111 0 156 239
Orange County DA Office 319 116 15 450 503
Orleans County DA Office 43 9 4 56 41
Oswego County DA Office 47 66 4 117 167
Table 6A
Superior Court Felony Arraignments by Office
January - June
New York State2018
2017
Page 16

Indictments Informations Unknown Total
Table 6A
Superior Court Felony Arraignments by Office
January - June
New York State2018
2017
Otsego County DA Office 31 6 0 37 38
Putnam County DA Office 20 29 5 54 64
Queens County DA Office 779 665 14 1,458 1,611
Rensselaer County DA Office 162 98 5 265 214
Richmond County DA Office 256 121 15 392 375
Rockland County DA Office 162 69 1 232 241
St. Lawrence County DA Office 58 55 0 113 82
Saratoga County DA Office 33 133 4 170 177
Schenectady County DA Office 130 97 1 228 241
Schoharie County DA Office 6 7 1 14 34
Schuyler County DA Office 14 18 0 32 36
Seneca County DA Office 11 36 0 47 67
Steuben County DA Office 239 63 1 303 200
Suffolk County DA Office 781 360 12 1,153 1,287
Sullivan County DA Office 37 76 2 115 92
Tioga County DA Office 32 26 0 58 52
Tompkins County DA Office 28 40 1 69 55
Ulster County DA Office 94 55 0 149 136
Warren County DA Office 59 66 1 126 116
Washington County DA Office 81 26 0 107 104
Wayne County DA Office 58 27 0 85 141
Westchester County DA Office 165 405 14 584 589
Wyoming County DA Office 28 23 0 51 84
Yates County DA Office 30 7 0 37 33
Special Narcotics Prosecutor 348 121 4 473 616
New York State Attorney General 63 4 1 68 288
Source: DCJS, Felony Processing File (as of 09/21/2018).
Page 17

Frequency PercentCumulative
Percent
Total 19,362 100%
Less than 1 Day 107 1% 1%
1-14 Days 2,803 14% 15%
15-29 Days 2,398 12% 27%
30-59 Days 3,632 19% 46%
60-89 Days 2,070 11% 57%
90-119 Days 1,730 9% 66%
120-179 Days 2,943 15% 81%
180 Days or More 3,676 19% 100%
Unknown Time 3 0% 100%
Frequency PercentCumulative
Percent
Total 12,586 100%
Less than 1 Day 99 1% 1%
1-14 Days 2,297 18% 19%
15-29 Days 2,011 16% 35%
30-59 Days 2,780 22% 57%
60-89 Days 1,167 9% 66%
90-119 Days 879 7% 73%
120-179 Days 1,575 13% 86%
180 Days or More 1,777 14% 100%
Unknown Time 1 0% 100%
Frequency PercentCumulative
Percent
Total 6,393 100%
Less than 1 Day 7 0% 0%
1-14 Days 444 7% 7%
15-29 Days 317 5% 12%
30-59 Days 816 13% 25%
60-89 Days 873 14% 38%
90-119 Days 816 13% 51%
120-179 Days 1,329 21% 72%
180 Days or More 1,790 28% 100%
Unknown Time 1 0% 100%
Median Days = 47
SCIs Only
Median Days = 117
Source: DCJS, Felony Processing File (as of 09/21/2018).
Note: The top table may include cases where the acusatory instrument type is
unknown. These cases are not included in the middle and bottom tables.
Felony Indictments and SCIs
January - June 2018
Indictments and SCIs
Median Days = 69
Indictments Only
Table 7A
New York State
Days from Arrest to Superior Court Arraignment
Page 18

Frequency PercentCumulative
Percent
Total 8,001 100%
Less than 1 Day 4 0% 0%
1-14 Days 1,046 13% 13%
15-29 Days 1,480 18% 32%
30-59 Days 2,036 25% 57%
60-89 Days 771 10% 67%
90-119 Days 587 7% 74%
120-179 Days 878 11% 85%
180 Days or More 1,198 15% 100%
Unknown Time 1 0% 100%
Frequency PercentCumulative
Percent
Total 6,333 100%
Less than 1 Day 4 0% 0%
1-14 Days 896 14% 14%
15-29 Days 1,331 21% 35%
30-59 Days 1,856 29% 65%
60-89 Days 585 9% 74%
90-119 Days 383 6% 80%
120-179 Days 578 9% 89%
180 Days or More 699 11% 100%
Unknown Time 1 0% 100%
Frequency PercentCumulative
Percent
Total 1,524 100%
Less than 1 Day 0 0% 0%
1-14 Days 133 9% 9%
15-29 Days 113 7% 16%
30-59 Days 169 11% 27%
60-89 Days 175 11% 39%
90-119 Days 191 13% 51%
120-179 Days 286 19% 70%
180 Days or More 457 30% 100%
Unknown Time 0 0% 100%
Source: DCJS, Felony Processing File (as of 09/21/2018).
Note: The top table may include cases where the acusatory instrument type is
unknown. These cases are not included in the middle and bottom tables.
Indictments and SCIs
Median Days = 47.5
Indictments Only
Median Days = 40
SCIs Only
Median Days = 117
Table 7B
New York City
Days from Arrest to Superior Court Arraignment
Felony Indictments and SCIs
January - June 2018
Page 19

Frequency PercentCumulative
Percent
Total 11,361 100%
Less than 1 Day 103 1% 1%
1-14 Days 1,757 15% 16%
15-29 Days 918 8% 24%
30-59 Days 1,596 14% 39%
60-89 Days 1,299 11% 50%
90-119 Days 1,143 10% 60%
120-179 Days 2,065 18% 78%
180 Days or More 2,478 22% 100%
Unknown Time 2 0% 100%
Frequency PercentCumulative
Percent
Total 6,253 100%
Less than 1 Day 95 2% 2%
1-14 Days 1,401 22% 24%
15-29 Days 680 11% 35%
30-59 Days 924 15% 50%
60-89 Days 582 9% 59%
90-119 Days 496 8% 67%
120-179 Days 997 16% 83%
180 Days or More 1,078 17% 100%
Unknown Time 0 0% 100%
Frequency PercentCumulative
Percent
Total 4,869 100%
Less than 1 Day 7 0% 0%
1-14 Days 311 6% 7%
15-29 Days 204 4% 11%
30-59 Days 647 13% 24%
60-89 Days 698 14% 38%
90-119 Days 625 13% 51%
120-179 Days 1,043 21% 73%
180 Days or More 1,333 27% 100%
Unknown Time 1 0% 100%
Source: DCJS, Felony Processing File (as of 09/21/2018).
Note: The top table may include cases where the acusatory instrument type is
unknown. These cases are not included in the middle and bottom tables.
Indictments and SCIs
Median Days = 90
Indictments Only
Median Days = 61
SCIs Only
Median Days = 117
Table 7C
Non-New York City
Days from Arrest to Superior Court Arraignment
Felony Indictments and SCIs
January - June 2018
Page 20

NMedian
DaysN
Median
DaysN Median Days N
Median
Days
Median
Days
Median
Days
Total Disposed 20,817 198 851 365 5,904 267 14,062 163 308 148
Convicted - Plea 16,756 189 603 319 4,123 253 12,030 160 288 146
Convicted - Verdict 619 416 114 612 315 412 190 328 576 294
Adjudicated - Youthful Offender 1,132 253 6 801 668 306 458 143 359 109
Covered by, Consolidated, Superseded 853 93 46 108 243 138 564 78 92 96
Diverted and Dismissed 139 746 1 802 9 496 129 754 750 729
Dismissed 994 279 52 357 401 319 541 244 383 171
Acquitted 216 351 24 596 118 411 74 297 503 245
Other 108 253 5 393 27 296 76 237 316 207
Total Disposed 13,783 252 791 380 4,789 306 8,203 216 345 191
Convicted - Plea 10,596 241 546 344 3,242 294 6,808 212 327 191
Convicted - Verdict 616 417 113 614 313 412 190 328 577 294
Adjudicated - Youthful Offender 653 363 6 801 483 366 164 325 406 181
Covered by, Consolidated, Superseded 621 106 44 120 217 139 360 92 105 107
Diverted and Dismissed 89 788 1 802 7 610 81 791 791 755
Dismissed 903 289 52 357 384 331 467 255 393 174
Acquitted 214 351 24 596 117 394 73 296 503 244
Other 91 267 5 393 26 306 60 246 296 227
Total Disposed 6,623 81 53 72 1,054 79 5,516 83 72 84
Convicted - Plea 5,946 79 53 72 848 75 5,045 80 66 83
Convicted - Verdict 1 20 0 1 20 0 20
Adjudicated - Youthful Offender 475 92 0 184 91 291 92 112 90
Covered by, Consolidated, Superseded 103 57 0 11 82 92 31 57
Diverted and Dismissed 50 584 0 2 364 48 587 400 722
Dismissed 36 338 0 6 337 30 338 338
Acquitted 1 534 0 1 534 0 534
Other 11 66 0 1 45 10 116 165 66
Informations
Source: DCJS, Felony Processing File (as of 09/21/2018).
Notes: The All Cases section includes cases where the acusatory instrument type is unknown and cases where the arraignment charge is missing.
Final court disposition year is the sentence year or the year of the non-conviction disposition.
Disposition Outcome
Top Superior Court Arraignment Charge New York
City
Non-New
York City
All Cases
Indictments
Table 8
New York State
Total Class A Felonies Violent Felony Offenses Other Felonies
Days from Superior Court Felony Arraignment to Final Court Disposition by Top Superior Court Arraignment Charge
January - June 2018
Page 21
Arraignment
Charge Disposition OutcomeNew York
City
Non-New
York City
Total 13,783 100% 6,623 100% 20,817 100% 100% 100%
Felony Conviction 8,782 64% 4,893 74% 13,773 66% 58% 72%
Misdemeanor Conviction 2,164 16% 907 14% 3,182 15% 19% 12%
Adjudicated - Youthful Offender 653 5% 475 7% 1,132 5% 7% 4%
Non-Criminal Conviction 264 2% 147 2% 416 2% 3% 1%
Covered by, Consolidated, Superseded 621 5% 103 2% 853 4% 4% 4%
Dismissed - Acquitted 1,206 9% 87 1% 1,349 6% 9% 5%
Other 93 1% 11 0% 112 1% 0% 1%
Total 376 100% 3 100% 382 100% 100% 100%
Felony Conviction 309 82% 3 100% 315 82% 79% 86%
Misdemeanor Conviction 5 1% 0 0% 5 1% 2% 1%
Adjudicated - Youthful Offender 6 2% 0 0% 6 2% 3% 0%
Non-Criminal Conviction 0 0% 0 0% 0 0% 0% 0%
Covered by, Consolidated, Superseded 19 5% 0 0% 19 5% 6% 4%
Dismissed - Acquitted 36 10% 0 0% 36 9% 10% 9%
Other 1 0% 0 0% 1 0% 0% 1%
Total 415 100% 50 100% 469 100% 100% 100%
Felony Conviction 323 78% 45 90% 370 79% 75% 84%
Misdemeanor Conviction 18 4% 5 10% 23 5% 6% 3%
Adjudicated - Youthful Offender 0 0% 0 0% 0 0% 0% 0%
Non-Criminal Conviction 4 1% 0 0% 4 1% 1% 1%
Covered by, Consolidated, Superseded 25 6% 0 0% 27 6% 8% 3%
Dismissed - Acquitted 41 10% 0 0% 41 9% 8% 9%
Other 4 1% 0 0% 4 1% 1% 1%
Total 4,789 100% 1,054 100% 5,904 100% 100% 100%
Felony Conviction 2,862 60% 741 70% 3,624 61% 54% 71%
Misdemeanor Conviction 619 13% 88 8% 719 12% 16% 7%
Adjudicated - Youthful Offender 483 10% 184 17% 668 11% 13% 9%
Non-Criminal Conviction 74 2% 20 2% 95 2% 2% 1%
Covered by, Consolidated, Superseded 217 5% 11 1% 243 4% 4% 4%
Dismissed - Acquitted 508 11% 9 1% 528 9% 10% 7%
Other 26 1% 1 0% 27 0% 0% 1%
Total 3,050 100% 1,318 100% 4,407 100% 100% 100%
Felony Conviction 1,979 65% 952 72% 2,940 67% 57% 74%
Misdemeanor Conviction 536 18% 218 17% 763 17% 23% 13%
Adjudicated - Youthful Offender 37 1% 30 2% 68 2% 1% 2%
Non-Criminal Conviction 51 2% 31 2% 82 2% 3% 1%
Covered by, Consolidated, Superseded 131 4% 29 2% 170 4% 2% 5%
Dismissed - Acquitted 292 10% 54 4% 355 8% 13% 5%
Other 24 1% 4 0% 29 1% 0% 1%
Total 963 100% 914 100% 1,896 100% 100% 100%
Felony Conviction 752 78% 759 83% 1,516 80% 56% 83%
Misdemeanor Conviction 142 15% 142 16% 287 15% 39% 12%
Adjudicated - Youthful Offender 0 0% 1 0% 1 0% 0% 0%
Non-Criminal Conviction 20 2% 2 0% 23 1% 1% 1%
Covered by, Consolidated, Superseded 13 1% 8 1% 28 1% 1% 2%
Dismissed - Acquitted 29 3% 1 0% 33 2% 2% 2%
Other 7 1% 1 0% 8 0% 1% 0%
Total 367 100% 182 100% 557 100% 100% 100%
Felony Conviction 233 63% 165 91% 400 72% 52% 79%
Misdemeanor Conviction 96 26% 14 8% 110 20% 32% 15%
Adjudicated - Youthful Offender 2 1% 0 0% 2 0% 1% 0%
Non-Criminal Conviction 10 3% 2 1% 12 2% 7% 0%
Covered by, Consolidated, Superseded 16 4% 0 0% 22 4% 6% 3%
Dismissed - Acquitted 8 2% 0 0% 8 1% 1% 1%
Other 2 1% 1 1% 3 1% 1% 0%
Total 3,683 100% 2,980 100% 6,824 100% 100% 100%
Felony Conviction 2,246 61% 2,150 72% 4,431 65% 60% 68%
Misdemeanor Conviction 737 20% 407 14% 1,204 18% 21% 15%
Adjudicated - Youthful Offender 121 3% 251 8% 374 5% 5% 6%
Non-Criminal Conviction 104 3% 91 3% 198 3% 5% 1%
Covered by, Consolidated, Superseded 178 5% 55 2% 272 4% 3% 5%
Dismissed - Acquitted 274 7% 23 1% 318 5% 5% 4%
Other 23 1% 3 0% 27 0% 0% 0%
Note: Total column includes cases where the acusatory instrument type is unknown and cases where the arraignment charge is missing.
Violent
Felony
Offenses
(VFOs)
Drug Felony
Class B-E
VTL 1192 -
DWI Felony
Other Vehicle
and Traffic
Law (VTL)
Felony
Other Felony
Source: DCJS, Felony Processing File (as of 09/21/2018).
Class A
Felony - Not
Drug
Class A
Felony - Drug
Dispositions of Felony Indictments and SCIs by Top Superior Court Arraignment Charge
Indictments Informations
January - June 2018
Table 9
New York State
Total
Total
Page 22

Arraignment
Charge Disposition OutcomeNew York
City
Non-New
York City
Total 3,683 100% 2,980 100% 6,824 100% 100% 100%
Felony Conviction 2,246 61% 2,150 72% 4,431 65% 60% 68%
Misdemeanor Conviction 737 20% 407 14% 1,204 18% 21% 15%
Adjudicated - Youthful Offender 121 3% 251 8% 374 5% 5% 6%
Non-Criminal Conviction 104 3% 91 3% 198 3% 5% 1%
Covered by, Consolidated, Superseded 178 5% 55 2% 272 4% 3% 5%
Dismissed - Acquitted 274 7% 23 1% 318 5% 5% 4%
Other 23 1% 3 0% 27 0% 0% 0%
Total 107 100% 147 100% 257 100% 100% 100%
Felony Conviction 58 54% 109 74% 168 65% 53% 74%
Misdemeanor Conviction 27 25% 16 11% 45 18% 25% 12%
Adjudicated - Youthful Offender 4 4% 17 12% 21 8% 10% 7%
Non-Criminal Conviction 1 1% 5 3% 6 2% 5% 1%
Covered by, Consolidated, Superseded 4 4% 0 0% 4 2% 2% 1%
Dismissed - Acquitted 11 10% 0 0% 11 4% 4% 5%
Other 2 2% 0 0% 2 1% 1% 1%
Total 51 100% 11 100% 62 100% 100% 100%
Felony Conviction 41 80% 10 91% 51 82% 87% 81%
Misdemeanor Conviction 1 2% 0 0% 1 2% 0% 2%
Adjudicated - Youthful Offender 1 2% 1 9% 2 3% 0% 4%
Non-Criminal Conviction 0 0% 0 0% 0 0% 0% 0%
Covered by, Consolidated, Superseded 1 2% 0 0% 1 2% 7% 0%
Dismissed - Acquitted 7 14% 0 0% 7 11% 7% 13%
Other 0 0% 0 0% 0 0% 0% 0%
Total 57 100% 62 100% 121 100% 100% 100%
Felony Conviction 36 63% 52 84% 88 73% 53% 80%
Misdemeanor Conviction 12 21% 7 11% 19 16% 29% 10%
Adjudicated - Youthful Offender 2 4% 1 2% 3 2% 6% 1%
Non-Criminal Conviction 2 4% 1 2% 3 2% 6% 1%
Covered by, Consolidated, Superseded 1 2% 1 2% 3 2% 0% 3%
Dismissed - Acquitted 4 7% 0 0% 5 4% 6% 3%
Other 0 0% 0 0% 0 0% 0% 0%
Total 351 100% 521 100% 899 100% 100% 100%
Felony Conviction 240 68% 379 73% 630 70% 73% 69%
Misdemeanor Conviction 49 14% 71 14% 128 14% 17% 13%
Adjudicated - Youthful Offender 18 5% 60 12% 79 9% 4% 11%
Non-Criminal Conviction 7 2% 6 1% 15 2% 3% 1%
Covered by, Consolidated, Superseded 14 4% 2 0% 19 2% 1% 3%
Dismissed - Acquitted 20 6% 2 0% 24 3% 3% 2%
Other 3 1% 1 0% 4 0% 0% 1%
Total 896 100% 688 100% 1,619 100% 100% 100%
Felony Conviction 546 61% 446 65% 1,001 62% 60% 63%
Misdemeanor Conviction 207 23% 130 19% 344 21% 22% 20%
Adjudicated - Youthful Offender 22 2% 53 8% 75 5% 4% 5%
Non-Criminal Conviction 32 4% 31 5% 63 4% 6% 2%
Covered by, Consolidated, Superseded 17 2% 19 3% 48 3% 1% 5%
Dismissed - Acquitted 64 7% 9 1% 79 5% 6% 4%
Other 8 1% 0 0% 9 1% 1% 1%
Total 132 100% 225 100% 359 100% 100% 100%
Felony Conviction 82 62% 148 66% 230 64% 58% 69%
Misdemeanor Conviction 26 20% 17 8% 43 12% 13% 11%
Adjudicated - Youthful Offender 12 9% 49 22% 61 17% 21% 13%
Non-Criminal Conviction 1 1% 9 4% 10 3% 4% 2%
Covered by, Consolidated, Superseded 5 4% 1 0% 6 2% 1% 2%
Dismissed - Acquitted 6 5% 1 0% 9 3% 2% 3%
Other 0 0% 0 0% 0 0% 0% 0%
PL 155 -
Larceny
PL 160 -
Robbery
Informations Total
Total
PL 120 -
Assault/
Related
PL 125 -
Homicide/
Related
PL 130 - Sex
Offenses
PL 140 -
Burglary/
Related
January - June 2018
Table 9A
New York State
Dispositions of Felony Indictments and SCIs by Top Superior Court Arraignment Charge (Other Felonies)
Indictments
Page 23
Informations Total
January - June 2018
Table 9A
New York State
Dispositions of Felony Indictments and SCIs by Top Superior Court Arraignment Charge (Other Felonies)
IndictmentsTotal 165 100% 191 100% 368 100% 100% 100%
Felony Conviction 95 58% 132 69% 232 63% 63% 63%
Misdemeanor Conviction 31 19% 20 10% 51 14% 18% 11%
Adjudicated - Youthful Offender 12 7% 19 10% 32 9% 10% 8%
Non-Criminal Conviction 4 2% 10 5% 14 4% 6% 3%
Covered by, Consolidated, Superseded 14 8% 7 4% 27 7% 1% 11%
Dismissed - Acquitted 8 5% 3 2% 11 3% 2% 3%
Other 1 1% 0 0% 1 0% 0% 0%
Total 302 100% 159 100% 500 100% 100% 100%
Felony Conviction 183 61% 118 74% 302 60% 61% 60%
Misdemeanor Conviction 70 23% 26 16% 124 25% 22% 26%
Adjudicated - Youthful Offender 2 1% 7 4% 9 2% 2% 1%
Non-Criminal Conviction 5 2% 0 0% 6 1% 2% 0%
Covered by, Consolidated, Superseded 21 7% 4 3% 33 7% 5% 7%
Dismissed - Acquitted 20 7% 4 3% 25 5% 6% 4%
Other 1 0% 0 0% 1 0% 0% 0%
Total 2 100% 0 0% 2 100% 100% 100%
Felony Conviction 0 0% 0 0% 0 0% 0% 0%
Misdemeanor Conviction 1 50% 0 0% 1 50% 100% 0%
Adjudicated - Youthful Offender 0 0% 0 0% 0 0% 0% 0%
Non-Criminal Conviction 1 50% 0 0% 1 50% 0% 100%
Covered by, Consolidated, Superseded 0 0% 0 0% 0 0% 0% 0%
Dismissed - Acquitted 0 0% 0 0% 0 0% 0% 0%
Other 0 0% 0 0% 0 0% 0% 0%
Total 235 100% 149 100% 390 100% 100% 100%
Felony Conviction 117 50% 126 85% 244 63% 57% 68%
Misdemeanor Conviction 52 22% 14 9% 68 17% 20% 15%
Adjudicated - Youthful Offender 12 5% 6 4% 18 5% 5% 4%
Non-Criminal Conviction 4 2% 2 1% 6 2% 3% 0%
Covered by, Consolidated, Superseded 18 8% 1 1% 21 5% 4% 7%
Dismissed - Acquitted 30 13% 0 0% 31 8% 10% 6%
Other 2 1% 0 0% 2 1% 1% 0%
Total 1,228 100% 648 100% 1,907 100% 100% 100%
Felony Conviction 732 60% 459 71% 1,195 63% 54% 68%
Misdemeanor Conviction 243 20% 101 16% 357 19% 24% 15%
Adjudicated - Youthful Offender 36 3% 38 6% 74 4% 3% 4%
Non-Criminal Conviction 46 4% 26 4% 72 4% 7% 2%
Covered by, Consolidated, Superseded 79 6% 19 3% 105 6% 6% 5%
Dismissed - Acquitted 86 7% 4 1% 97 5% 5% 5%
Other 6 0% 1 0% 7 0% 0% 1%
Total 157 100% 179 100% 340 100% 100% 100%
Felony Conviction 116 74% 171 96% 290 85% 84% 86%
Misdemeanor Conviction 18 11% 5 3% 23 7% 6% 7%
Adjudicated - Youthful Offender 0 0% 0 0% 0 0% 0% 0%
Non-Criminal Conviction 1 1% 1 1% 2 1% 0% 1%
Covered by, Consolidated, Superseded 4 3% 1 1% 5 1% 2% 1%
Dismissed - Acquitted 18 11% 0 0% 19 6% 6% 5%
Other 0 0% 1 1% 1 0% 1% 0%
Other Penal
Law
Other
Source: DCJS, Felony Processing File (as of 09/21/2018).
Note: Total column includes cases where the acusatory instrument type is unknown and cases where the arraignment charge is missing.
PL 165 -
Other Theft
PL 215 -
Judicial/
Criminal
Contempt
PL 225 -
Gambling
PL 265 -
Weapons
Page 24

Top Conviction Charge
Class A
Felony -
Not Drug
Class A
Felony -
Drug
Violent
Felony
Offense
Drug
Felony
Class B-E
VTL 1192 -
DWI Felony
Other VTL
Felony
Other
FelonyTotal
Total 326 397 5,106 3,853 1,827 524 6,207 18,240
Class A Felony - Not Drug 107 0 2 0 0 0 1 110
Class A Felony - Drug 0 169 1 10 0 0 6 186
Violent Felony Offense 186 5 3,325 56 0 0 52 3,624
Drug Felony Class B-E 1 185 8 2,886 0 0 83 3,163
VTL 1192 - DWI Felony 0 0 6 2 1,499 4 6 1,517
Other Vehicle and Traffic Law (VTL) Felony 0 0 8 5 16 396 10 435
Other Felony 25 11 864 43 2 2 4,597 5,544
Misdemeanor 7 23 797 769 287 110 1,254 3,247
Non-Criminal Offense 0 4 95 82 23 12 198 414
Top Conviction Charge
Class A
Felony -
Not Drug
Class A
Felony -
Drug
Violent
Felony
Offense
Drug
Felony
Class B-E
VTL 1192 -
DWI Felony
Other VTL
Felony
Other
FelonyTotal
Total 320 345 4,038 2,603 914 341 3,208 11,769
Class A Felony - Not Drug 107 0 2 0 0 0 1 110
Class A Felony - Drug 0 143 1 10 0 0 6 160
Violent Felony Offense 181 5 2,559 48 0 0 42 2,835
Drug Felony Class B-E 1 166 5 1,920 0 0 78 2,170
VTL 1192 - DWI Felony 0 0 6 2 737 2 6 753
Other Vehicle and Traffic Law (VTL) Felony 0 0 8 5 13 232 10 268
Other Felony 24 9 709 31 2 1 2,208 2,984
Misdemeanor 7 18 674 536 142 96 753 2,226
Non-Criminal Offense 0 4 74 51 20 10 104 263
Top Conviction Charge
Class A
Felony -
Not Drug
Class A
Felony -
Drug
Violent
Felony
Offense
Drug
Felony
Class B-E
VTL 1192 -
DWI Felony
Other VTL
Felony
Other
FelonyTotal
Total 3 50 1,033 1,231 904 181 2,899 6,301
Class A Felony - Not Drug 0 0 0 0 0 0 0 0
Class A Felony - Drug 0 25 0 0 0 0 0 25
Violent Felony Offense 2 0 752 8 0 0 9 771
Drug Felony Class B-E 0 19 3 956 0 0 5 983
VTL 1192 - DWI Felony 0 0 0 0 757 2 0 759
Other Vehicle and Traffic Law (VTL) Felony 0 0 0 0 3 162 0 165
Other Felony 1 1 148 12 0 1 2,353 2,516
Misdemeanor 0 5 110 224 142 14 441 936
Non-Criminal Offense 0 0 20 31 2 2 91 146
SCIs Only
Top Superior Court Arraignment Charge
Source: DCJS, Felony Processing File (as of 09/21/2018).
Note: Cases where the arraignment or conviction charge was not reported were excluded from all tables.
The top table may include cases where the acusatory instrument type is unknown. These cases are not included in the middle and bottom tables.
Top Arraignment Charge by Top Conviction Charge
Indictments and SCIs
Top Superior Court Arraignment Charge
Indictments Only
Top Superior Court Arraignment Charge
January - June 2018
Table 10
New York State
Superior Court Felony Cases Resulting in Conviction
Page 25
Top Superior Court Arraignment Charge
Total 836 4% 19,981 96% 20,817 100%
Murder and Non-Negligent Manslaughter (Completed) 108 34% 213 66% 321 100%
Negligent Manslaughter (Completed) 0 0% 10 100% 10 100%
Class A - Not Drug 22 19% 91 81% 113 100%
Class A - Drug 14 3% 455 97% 469 100%
Violent Felony Offense (VFO) 431 7% 5,449 93% 5,880 100%
Drug Class B-E 62 1% 4,345 99% 4,407 100%
VTL 1192 - DWI 37 2% 1,859 98% 1,896 100%
Other Vehicle and Traffic Law (VTL) 6 1% 551 99% 557 100%
Other 156 2% 7,008 98% 7,164 100%
Top Superior Court Arraignment Charge
Total 424 5% 8,508 95% 8,932 100%
Murder and Non-Negligent Manslaughter (Completed) 60 36% 109 64% 169 100%
Negligent Manslaughter (Completed) 0 0% 2 100% 2 100%
Class A - Not Drug 9 14% 55 86% 64 100%
Class A - Drug 5 2% 268 98% 273 100%
Violent Felony Offense (VFO) 230 7% 3,064 93% 3,294 100%
Drug Class B-E 25 1% 1,842 99% 1,867 100%
VTL 1192 - DWI 3 2% 185 98% 188 100%
Other Vehicle and Traffic Law (VTL) 3 2% 146 98% 149 100%
Other 89 3% 2,837 97% 2,926 100%
Top Superior Court Arraignment Charge
Total 412 3% 11,473 97% 11,885 100%
Murder and Non-Negligent Manslaughter (Completed) 48 32% 104 68% 152 100%
Negligent Manslaughter (Completed) 0 0% 8 100% 8 100%
Class A - Not Drug 13 27% 36 73% 49 100%
Class A - Drug 9 5% 187 95% 196 100%
Violent Felony Offense (VFO) 201 8% 2,385 92% 2,586 100%
Drug Class B-E 37 1% 2,503 99% 2,540 100%
VTL 1192 - DWI 34 2% 1,674 98% 1,708 100%
Other Vehicle and Traffic Law (VTL) 3 1% 405 99% 408 100%
Other 67 2% 4,171 98% 4,238 100%
January - June 2018
Note: The "Other" category includes arraignment charges not identified as a Class A, VFO, Drug, or VTL offense.
Non-New York CityTrial Non-Trial Total
New York CityTrial Non-Trial Total
New York StateTrial Non-Trial Total
Source: DCJS, Felony Processing File (as of 09/21/2018).
Table 11
Cases Disposed: Trial vs. Non-Trial
Felony Indictments and SCIs
Page 26

Top Superior Court Arraignment Charge
Total 620 74% 216 26% 836 100%
Murder and Non-Negligent Manslaughter (Completed) 90 83% 18 17% 108 100%
Negligent Manslaughter (Completed) 0 0% 0 0% 0 0%
Class A - Not Drug 17 77% 5 23% 22 100%
Class A - Drug 10 71% 4 29% 14 100%
Violent Felony Offense (VFO) 314 73% 117 27% 431 100%
Drug Class B-E 47 76% 15 24% 62 100%
VTL 1192 - DWI 31 84% 6 16% 37 100%
Other Vehicle and Traffic Law (VTL) 4 67% 2 33% 6 100%
Other 107 69% 49 31% 156 100%
Note: The "Other" category includes arraignment charges not identified as a Class A, VFO, Drug, or VTL offense.
January - June 2018
New York StateConvicted of Any
Charge
Acquitted of All
ChargesTotal
Source: DCJS, Felony Processing File (as of 09/21/2018).
Table 12
Trial Dispositions
Felony Indictments
Page 27

N % N % N % N % N % N % N %
Total 7,104 52% 100 1% 2,102 15% 1,714 12% 2,337 17% 415 3% 13,772 100%
Murder and Non-Negligent Manslaughter (Completed) 223 99% 0 0% 0 0% 2 1% 1 0% 0 0% 226 100%
Negligent Manslaughter (Completed) 7 54% 0 0% 1 8% 2 15% 2 15% 1 8% 13 100%
Class A - Not Drug 17 100% 0 0% 0 0% 0 0% 0 0% 0 0% 17 100%
Class A - Drug 185 99% 0 0% 1 1% 0 0% 1 1% 0 0% 187 100%
Violent Felony Offense (VFO) 2,369 79% 1 0% 191 6% 218 7% 191 6% 14 0% 2,984 100%
Drug Class B-E 1,761 56% 47 2% 452 14% 246 8% 554 18% 66 2% 3,126 100%
VTL 1192 - DWI 176 11% 2 0% 214 14% 514 33% 554 36% 80 5% 1,540 100%
Other Vehicle and Traffic Law (VTL) 39 9% 0 0% 172 39% 74 17% 140 32% 16 4% 441 100%Other 2,327 44% 50 1% 1,071 20% 658 13% 894 17% 238 5% 5,238 100%
Total 2,957 37% 23 0% 1,403 18% 1,361 17% 1,913 24% 318 4% 7,975 100%
Murder and Non-Negligent Manslaughter (Completed) 156 98% 0 0% 0 0% 2 1% 1 1% 0 0% 159 100%
Negligent Manslaughter (Completed) 3 38% 0 0% 1 13% 1 13% 2 25% 1 13% 8 100%
Class A - Not Drug 9 100% 0 0% 0 0% 0 0% 0 0% 0 0% 9 100%
Class A - Drug 113 98% 0 0% 1 1% 0 0% 1 1% 0 0% 115 100%
Violent Felony Offense (VFO) 1,363 70% 1 0% 176 9% 207 11% 176 9% 14 1% 1,937 100%
Drug Class B-E 580 38% 15 1% 267 18% 190 13% 420 28% 40 3% 1,512 100%
VTL 1192 - DWI 42 4% 0 0% 114 11% 346 35% 430 43% 67 7% 999 100%
Other Vehicle and Traffic Law (VTL) 20 9% 0 0% 54 25% 42 20% 88 42% 8 4% 212 100%Other 671 22% 7 0% 790 26% 573 19% 795 26% 188 6% 3,024 100%
Total 4,147 72% 77 1% 699 12% 353 6% 424 7% 97 2% 5,797 100%
Murder and Non-Negligent Manslaughter (Completed) 67 100% 0 0% 0 0% 0 0% 0 0% 0 0% 67 100%
Negligent Manslaughter (Completed) 4 80% 0 0% 0 0% 1 20% 0 0% 0 0% 5 100%
Class A - Not Drug 8 100% 0 0% 0 0% 0 0% 0 0% 0 0% 8 100%
Class A - Drug 72 100% 0 0% 0 0% 0 0% 0 0% 0 0% 72 100%
Violent Felony Offense (VFO) 1,006 96% 0 0% 15 1% 11 1% 15 1% 0 0% 1,047 100%
Drug Class B-E 1,181 73% 32 2% 185 11% 56 3% 134 8% 26 2% 1,614 100%
VTL 1192 - DWI 134 25% 2 0% 100 18% 168 31% 124 23% 13 2% 541 100%
Other Vehicle and Traffic Law (VTL) 19 8% 0 0% 118 52% 32 14% 52 23% 8 3% 229 100%Other 1,656 75% 43 2% 281 13% 85 4% 99 4% 50 2% 2,214 100%
Notes: DCJS data do not indicate which provision of sentencing law a sentence is made under, including those that require a mandatory prison sentence.
Prior felony convictions include only those that occurred in NYS.
The "Other" category includes conviction charges not identified as a Class A, VFO, Drug, or VTL offense.
January - June 2018
Other Total
Total
No Prior
Felony
Conviction
Prior
Felony
Conviction
Source: DCJS, Felony Processing File (as of 09/21/2018).
New York State
Sentences for Non-YO Felony Convictions by Conviction Charge
Conviction Charge
Prison Direct to Parole Jail Split Probation
Table 13A
Page 28

N % N % N % N % N % N % N %
Total 3,022 59% 6 0% 959 19% 276 5% 696 13% 198 4% 5,157 100%
Murder and Non-Negligent Manslaughter (Completed) 117 99% 0 0% 0 0% 0 0% 1 1% 0 0% 118 100%
Negligent Manslaughter (Completed) 2 67% 0 0% 1 33% 0 0% 0 0% 0 0% 3 100%
Class A - Not Drug 8 100% 0 0% 0 0% 0 0% 0 0% 0 0% 8 100%
Class A - Drug 118 98% 0 0% 1 1% 0 0% 1 1% 0 0% 120 100%
Violent Felony Offense (VFO) 1,159 83% 0 0% 107 8% 69 5% 51 4% 7 1% 1,393 100%
Drug Class B-E 591 51% 1 0% 244 21% 38 3% 241 21% 39 3% 1,154 100%
VTL 1192 - DWI 6 5% 0 0% 15 13% 32 28% 52 45% 10 9% 115 100%
Other Vehicle and Traffic Law (VTL) 5 5% 0 0% 41 45% 11 12% 31 34% 3 3% 91 100%Other 1,016 47% 5 0% 550 26% 126 6% 319 15% 139 6% 2,155 100%
Total 1,281 44% 1 0% 700 24% 216 7% 547 19% 145 5% 2,890 100%
Murder and Non-Negligent Manslaughter (Completed) 81 99% 0 0% 0 0% 0 0% 1 1% 0 0% 82 100%
Negligent Manslaughter (Completed) 1 50% 0 0% 1 50% 0 0% 0 0% 0 0% 2 100%
Class A - Not Drug 4 100% 0 0% 0 0% 0 0% 0 0% 0 0% 4 100%
Class A - Drug 83 98% 0 0% 1 1% 0 0% 1 1% 0 0% 85 100%
Violent Felony Offense (VFO) 661 75% 0 0% 100 11% 63 7% 47 5% 7 1% 878 100%
Drug Class B-E 193 35% 0 0% 145 26% 24 4% 171 31% 20 4% 553 100%
VTL 1192 - DWI 0 0% 0 0% 8 12% 17 26% 31 48% 9 14% 65 100%
Other Vehicle and Traffic Law (VTL) 2 6% 0 0% 15 43% 3 9% 15 43% 0 0% 35 100%Other 256 22% 1 0% 430 36% 109 9% 281 24% 109 9% 1,186 100%
Total 1,741 77% 5 0% 259 11% 60 3% 149 7% 53 2% 2,267 100%
Murder and Non-Negligent Manslaughter (Completed) 36 100% 0 0% 0 0% 0 0% 0 0% 0 0% 36 100%
Negligent Manslaughter (Completed) 1 100% 0 0% 0 0% 0 0% 0 0% 0 0% 1 100%
Class A - Not Drug 4 100% 0 0% 0 0% 0 0% 0 0% 0 0% 4 100%
Class A - Drug 35 100% 0 0% 0 0% 0 0% 0 0% 0 0% 35 100%
Violent Felony Offense (VFO) 498 97% 0 0% 7 1% 6 1% 4 1% 0 0% 515 100%
Drug Class B-E 398 66% 1 0% 99 16% 14 2% 70 12% 19 3% 601 100%
VTL 1192 - DWI 6 12% 0 0% 7 14% 15 30% 21 42% 1 2% 50 100%
Other Vehicle and Traffic Law (VTL) 3 5% 0 0% 26 46% 8 14% 16 29% 3 5% 56 100%Other 760 78% 4 0% 120 12% 17 2% 38 4% 30 3% 969 100%
Source: DCJS, Felony Processing File (as of 09/21/2018).
Notes: DCJS data do not indicate which provision of sentencing law a sentence is made under, including those that require a mandatory prison sentence.
Prior felony convictions include only those that occurred in NYS.
The "Other" category includes conviction charges not identified as a Class A, VFO, Drug, or VTL offense.
January - June 2018
Probation Other Total
Total
No Prior
Felony
Conviction
Prior
Felony
Conviction
Table 13B
New York City
Sentences for Non-YO Felony Convictions by Conviction Charge
Conviction Charge
Prison Direct to Parole Jail Split
Page 29
N % N % N % N % N % N % N %
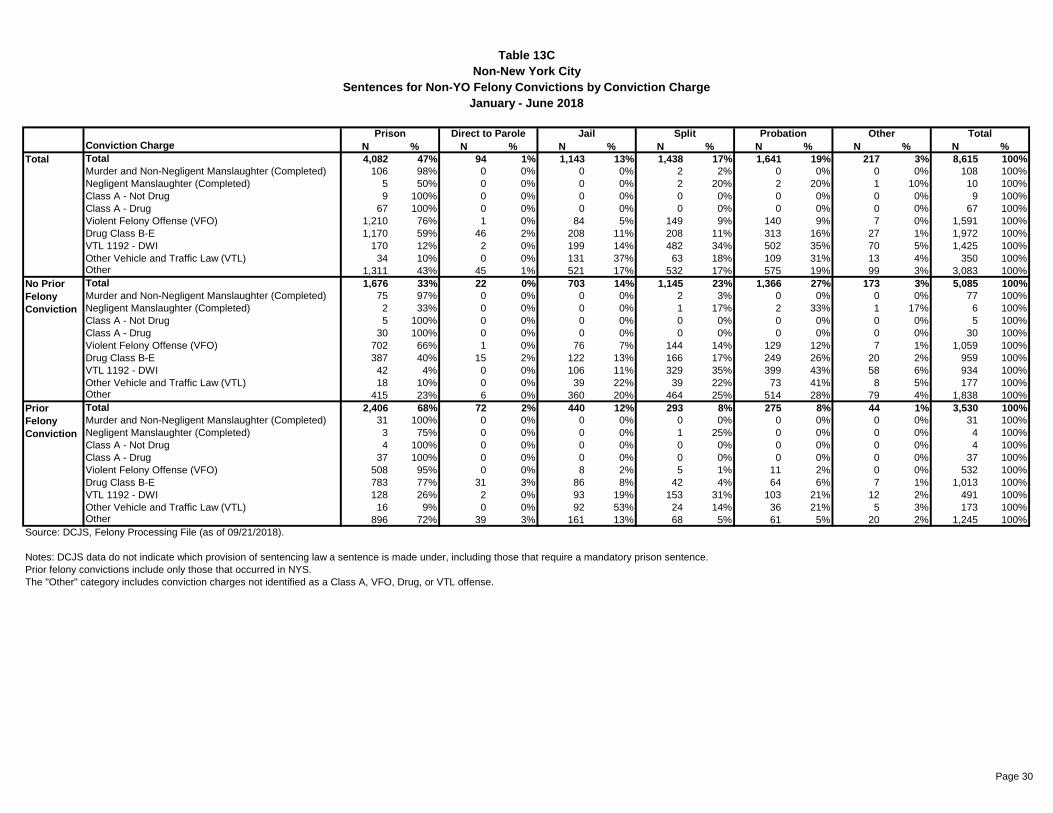
Total 4,082 47% 94 1% 1,143 13% 1,438 17% 1,641 19% 217 3% 8,615 100%
Murder and Non-Negligent Manslaughter (Completed) 106 98% 0 0% 0 0% 2 2% 0 0% 0 0% 108 100%
Negligent Manslaughter (Completed) 5 50% 0 0% 0 0% 2 20% 2 20% 1 10% 10 100%
Class A - Not Drug 9 100% 0 0% 0 0% 0 0% 0 0% 0 0% 9 100%
Class A - Drug 67 100% 0 0% 0 0% 0 0% 0 0% 0 0% 67 100%
Violent Felony Offense (VFO) 1,210 76% 1 0% 84 5% 149 9% 140 9% 7 0% 1,591 100%
Drug Class B-E 1,170 59% 46 2% 208 11% 208 11% 313 16% 27 1% 1,972 100%
VTL 1192 - DWI 170 12% 2 0% 199 14% 482 34% 502 35% 70 5% 1,425 100%
Other Vehicle and Traffic Law (VTL) 34 10% 0 0% 131 37% 63 18% 109 31% 13 4% 350 100%Other 1,311 43% 45 1% 521 17% 532 17% 575 19% 99 3% 3,083 100%
Total 1,676 33% 22 0% 703 14% 1,145 23% 1,366 27% 173 3% 5,085 100%
Murder and Non-Negligent Manslaughter (Completed) 75 97% 0 0% 0 0% 2 3% 0 0% 0 0% 77 100%
Negligent Manslaughter (Completed) 2 33% 0 0% 0 0% 1 17% 2 33% 1 17% 6 100%
Class A - Not Drug 5 100% 0 0% 0 0% 0 0% 0 0% 0 0% 5 100%
Class A - Drug 30 100% 0 0% 0 0% 0 0% 0 0% 0 0% 30 100%
Violent Felony Offense (VFO) 702 66% 1 0% 76 7% 144 14% 129 12% 7 1% 1,059 100%
Drug Class B-E 387 40% 15 2% 122 13% 166 17% 249 26% 20 2% 959 100%
VTL 1192 - DWI 42 4% 0 0% 106 11% 329 35% 399 43% 58 6% 934 100%
Other Vehicle and Traffic Law (VTL) 18 10% 0 0% 39 22% 39 22% 73 41% 8 5% 177 100%Other 415 23% 6 0% 360 20% 464 25% 514 28% 79 4% 1,838 100%
Total 2,406 68% 72 2% 440 12% 293 8% 275 8% 44 1% 3,530 100%
Murder and Non-Negligent Manslaughter (Completed) 31 100% 0 0% 0 0% 0 0% 0 0% 0 0% 31 100%
Negligent Manslaughter (Completed) 3 75% 0 0% 0 0% 1 25% 0 0% 0 0% 4 100%
Class A - Not Drug 4 100% 0 0% 0 0% 0 0% 0 0% 0 0% 4 100%
Class A - Drug 37 100% 0 0% 0 0% 0 0% 0 0% 0 0% 37 100%
Violent Felony Offense (VFO) 508 95% 0 0% 8 2% 5 1% 11 2% 0 0% 532 100%
Drug Class B-E 783 77% 31 3% 86 8% 42 4% 64 6% 7 1% 1,013 100%
VTL 1192 - DWI 128 26% 2 0% 93 19% 153 31% 103 21% 12 2% 491 100%
Other Vehicle and Traffic Law (VTL) 16 9% 0 0% 92 53% 24 14% 36 21% 5 3% 173 100%Other 896 72% 39 3% 161 13% 68 5% 61 5% 20 2% 1,245 100%
Source: DCJS, Felony Processing File (as of 09/21/2018).
Notes: DCJS data do not indicate which provision of sentencing law a sentence is made under, including those that require a mandatory prison sentence.
Prior felony convictions include only those that occurred in NYS.
The "Other" category includes conviction charges not identified as a Class A, VFO, Drug, or VTL offense.
January - June 2018
Probation Other Total
Total
No Prior
Felony
Conviction
Prior
Felony
Conviction
Table 13C
Non-New York City
Sentences for Non-YO Felony Convictions by Conviction Charge
Conviction Charge
Prison Direct to Parole Jail Split
Page 30
N % N % N % N % N % N % N %
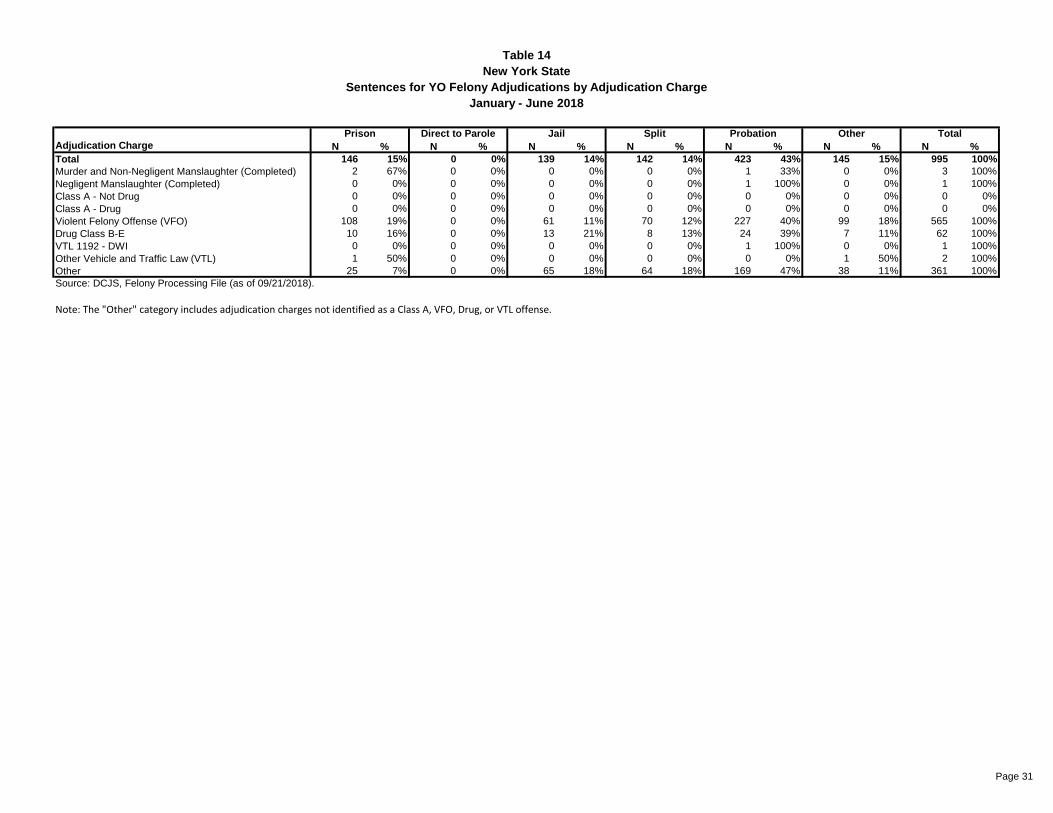
Total 146 15% 0 0% 139 14% 142 14% 423 43% 145 15% 995 100%
Murder and Non-Negligent Manslaughter (Completed) 2 67% 0 0% 0 0% 0 0% 1 33% 0 0% 3 100%
Negligent Manslaughter (Completed) 0 0% 0 0% 0 0% 0 0% 1 100% 0 0% 1 100%
Class A - Not Drug 0 0% 0 0% 0 0% 0 0% 0 0% 0 0% 0 0%
Class A - Drug 0 0% 0 0% 0 0% 0 0% 0 0% 0 0% 0 0%
Violent Felony Offense (VFO) 108 19% 0 0% 61 11% 70 12% 227 40% 99 18% 565 100%
Drug Class B-E 10 16% 0 0% 13 21% 8 13% 24 39% 7 11% 62 100%
VTL 1192 - DWI 0 0% 0 0% 0 0% 0 0% 1 100% 0 0% 1 100%
Other Vehicle and Traffic Law (VTL) 1 50% 0 0% 0 0% 0 0% 0 0% 1 50% 2 100%
Other 25 7% 0 0% 65 18% 64 18% 169 47% 38 11% 361 100%
Total
Source: DCJS, Felony Processing File (as of 09/21/2018).
Note: The "Other" category includes adjudication charges not identified as a Class A, VFO, Drug, or VTL offense.
January - June 2018
New York State
Sentences for YO Felony Adjudications by Adjudication Charge
Adjudication Charge
Prison Direct to Parole Jail Split Probation Other
Table 14
Page 31
New York
StateNew York City
Non-New
York City
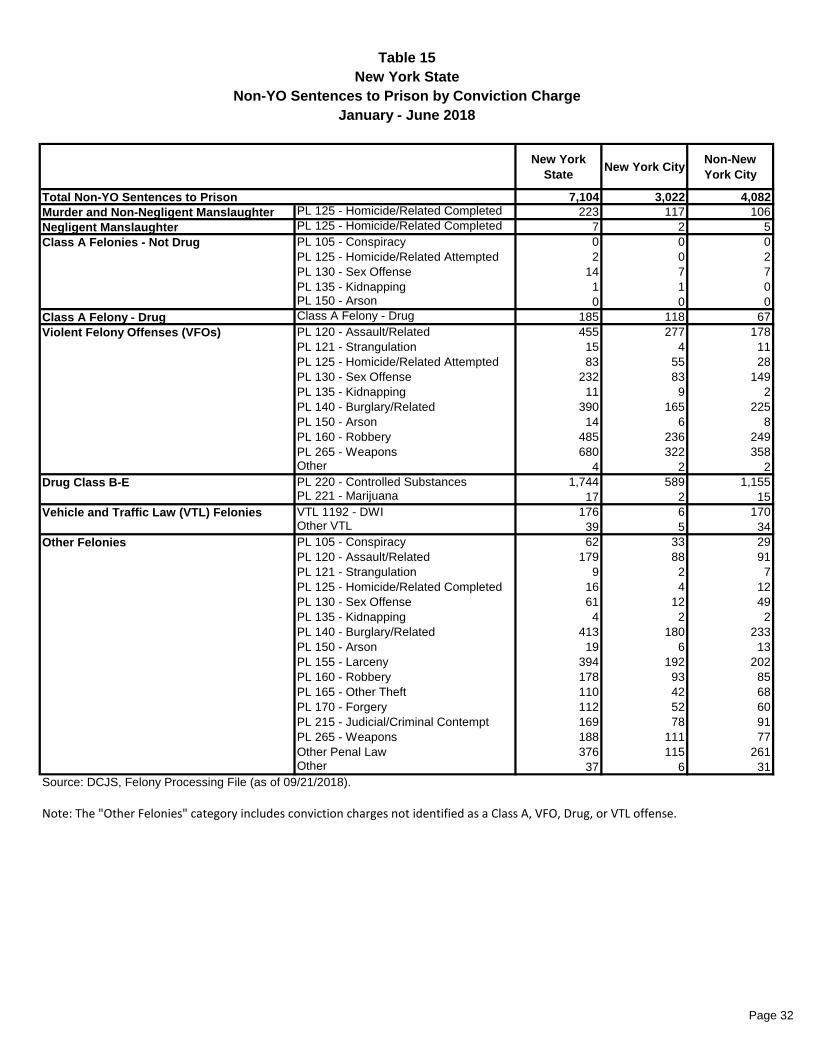
7,104 3,022 4,082
Murder and Non-Negligent Manslaughter PL 125 - Homicide/Related Completed 223 117 106
Negligent Manslaughter PL 125 - Homicide/Related Completed 7 2 5
PL 105 - Conspiracy 0 0 0
PL 125 - Homicide/Related Attempted 2 0 2
PL 130 - Sex Offense 14 7 7
PL 135 - Kidnapping 1 1 0PL 150 - Arson 0 0 0
Class A Felony - Drug Class A Felony - Drug 185 118 67
PL 120 - Assault/Related 455 277 178
PL 121 - Strangulation 15 4 11
PL 125 - Homicide/Related Attempted 83 55 28
PL 130 - Sex Offense 232 83 149
PL 135 - Kidnapping 11 9 2
PL 140 - Burglary/Related 390 165 225
PL 150 - Arson 14 6 8
PL 160 - Robbery 485 236 249
PL 265 - Weapons 680 322 358Other 4 2 2
PL 220 - Controlled Substances 1,744 589 1,155PL 221 - Marijuana 17 2 15
VTL 1192 - DWI 176 6 170Other VTL 39 5 34
PL 105 - Conspiracy 62 33 29
PL 120 - Assault/Related 179 88 91
PL 121 - Strangulation 9 2 7
PL 125 - Homicide/Related Completed 16 4 12
PL 130 - Sex Offense 61 12 49
PL 135 - Kidnapping 4 2 2
PL 140 - Burglary/Related 413 180 233
PL 150 - Arson 19 6 13
PL 155 - Larceny 394 192 202
PL 160 - Robbery 178 93 85
PL 165 - Other Theft 110 42 68
PL 170 - Forgery 112 52 60
PL 215 - Judicial/Criminal Contempt 169 78 91
PL 265 - Weapons 188 111 77
Other Penal Law 376 115 261Other 37 6 31
January - June 2018
Vehicle and Traffic Law (VTL) Felonies
Other Felonies
Source: DCJS, Felony Processing File (as of 09/21/2018).
Note: The "Other Felonies" category includes conviction charges not identified as a Class A, VFO, Drug, or VTL offense.
Total Non-YO Sentences to Prison
Table 15
New York State
Non-YO Sentences to Prison by Conviction Charge
Class A Felonies - Not Drug
Violent Felony Offenses (VFOs)
Drug Class B-E
Page 32

New York
StateNew York City
Non-New
York City
146 88 58
Murder and Non-Negligent Manslaughter PL 125 - Homicide/Related Completed 2 2 0
PL 120 - Assault/Related 15 7 8
PL 121 - Strangulation 0 0 0
PL 125 - Homicide/Related Attempted 2 2 0
PL 130 - Sex Offense 2 1 1
PL 135 - Kidnapping 0 0 0
PL 140 - Burglary/Related 7 1 6
PL 150 - Arson 0 0 0
PL 160 - Robbery 60 43 17
PL 265 - Weapons 21 16 5Other 1 0 1
PL 220 - Controlled Substances 10 5 5PL 221 - Marijuana 0 0 0
PL 105 - Conspiracy 1 1 0
PL 120 - Assault/Related 4 1 3
PL 121 - Strangulation 0 0 0
PL 125 - Homicide/Related Completed 0 0 0
PL 130 - Sex Offense 0 0 0
PL 135 - Kidnapping 0 0 0
PL 140 - Burglary/Related 4 0 4
PL 150 - Arson 0 0 0
PL 155 - Larceny 3 3 0
PL 160 - Robbery 3 1 2
PL 165 - Other Theft 3 3 0
PL 170 - Forgery 2 0 2
PL 215 - Judicial/Criminal Contempt 1 0 1
PL 265 - Weapons 1 1 0
Other Penal Law 3 0 3Other 0 0 0
Total YO Sentences to Prison
Source: DCJS, Felony Processing File (as of 09/21/2018).
Note: The "Other Felonies" category includes adjudication charges not identified as a Class A, VFO, Drug, or VTL offense.
January - June 2018
Table 16
New York State
YO Sentences to Prison by Adjudication Charge
Violent Felony Offenses (VFOs)
Drug Class B-E
Other Felonies
Page 33