critical care bioinformatics workshop sept 26th, 2009 continuous monitoring of physiological signals...
Post on 19-Dec-2015
213 views
TRANSCRIPT
Critical Care Bioinformatics WorkshopSept 26th, 2009
Continuous Monitoring of Physiological Signals
Christopher G. Wilson, Ph.D.
Departments of Pediatrics and Neurosciences
Disclosures….
Outline
• Continuous sampling as a logistical problem• Nuts and bolts of sampling• Data takes up space!• On-line versus off-line analysis• Organizing multiple data files from the same
patient• Datafarming

Why collect all that data?
• Changes in physiological signals indicate patient state (duh!)
• Without a sufficient “window” of data, you will miss changes in patient state– Currently, staff only “acquires” charting data once every
hour or so…• Retaining a “superset” of patient data allows for
more comprehensive post-hoc data mining for pathophysiologies
• Potential for improved standard of care
Nyquist-Shannon “Criterion”• The Nyquist–Shannon sampling theorem is a fundamental result in the
field of information theory, in particular telecommunications and signal processing. Sampling is the process of converting a signal (for example, a function of continuous time or space) into a numeric sequence (a function of discrete time or space). The theorem states:– If a function x(t) contains no frequencies higher than B hertz, it is completely determined
by giving its ordinates at a series of points spaced 1/(2B) seconds apart.
• This means that a bandlimited analog signal that has been digitally sampled can be perfectly reconstructed from a sequence of samples if the sampling rate exceeds 2×B samples per second, where B is the highest frequency of interest contained in the original signal.
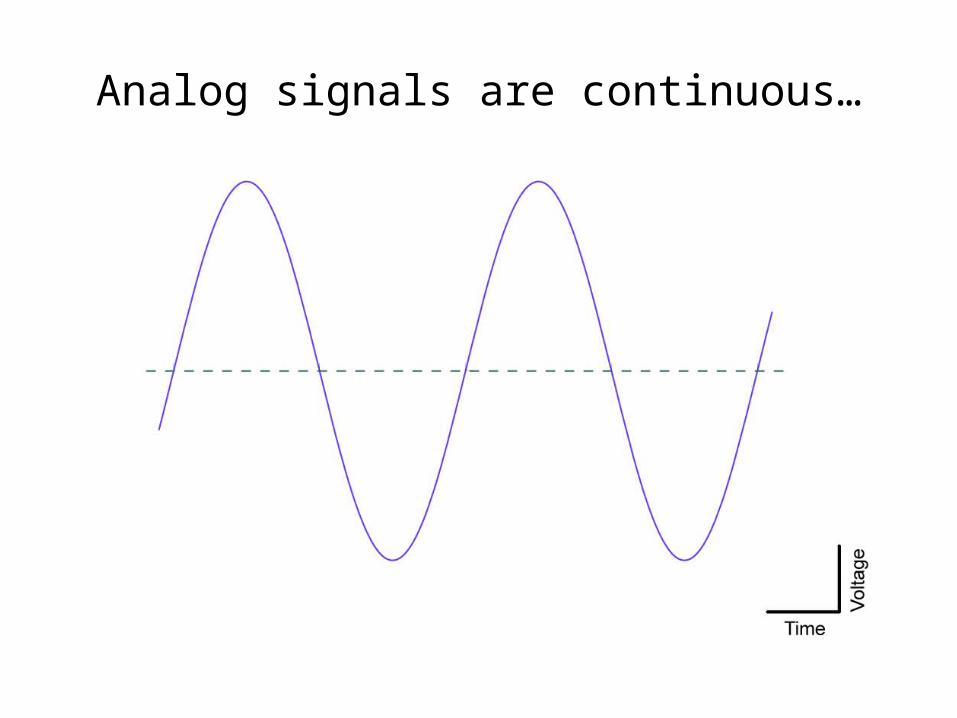
Analog signals are continuous…
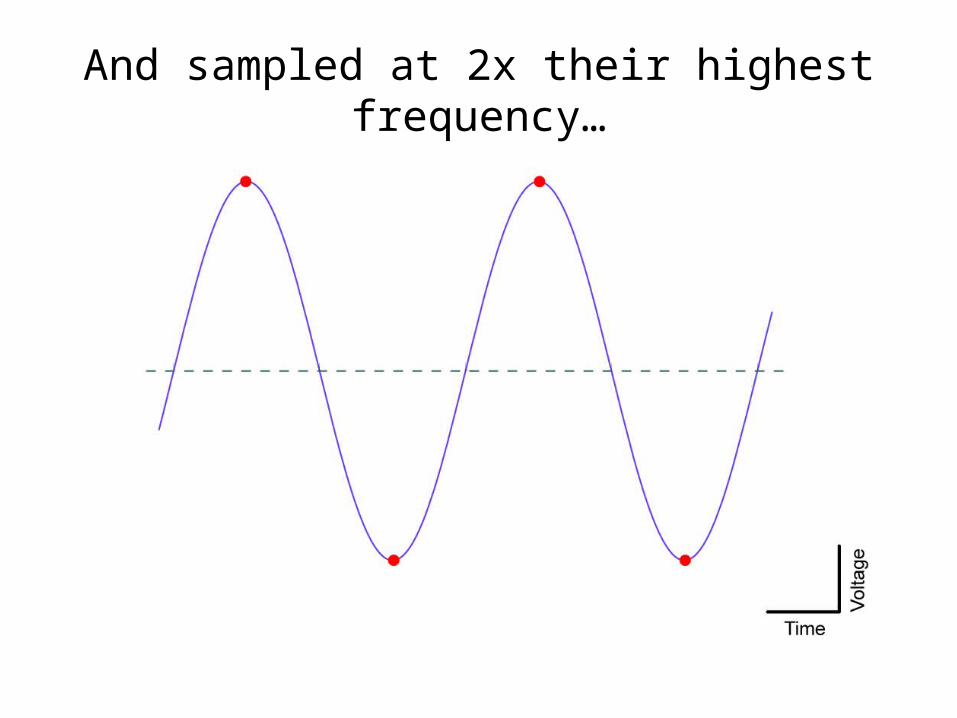
And sampled at 2x their highest frequency…
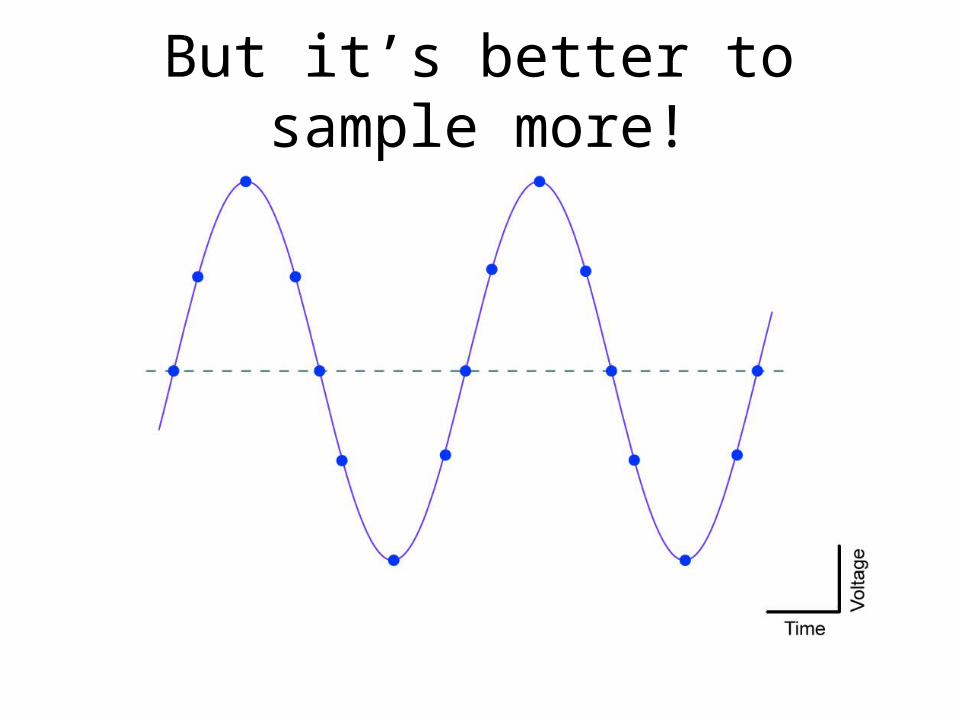
But it’s better to sample more!
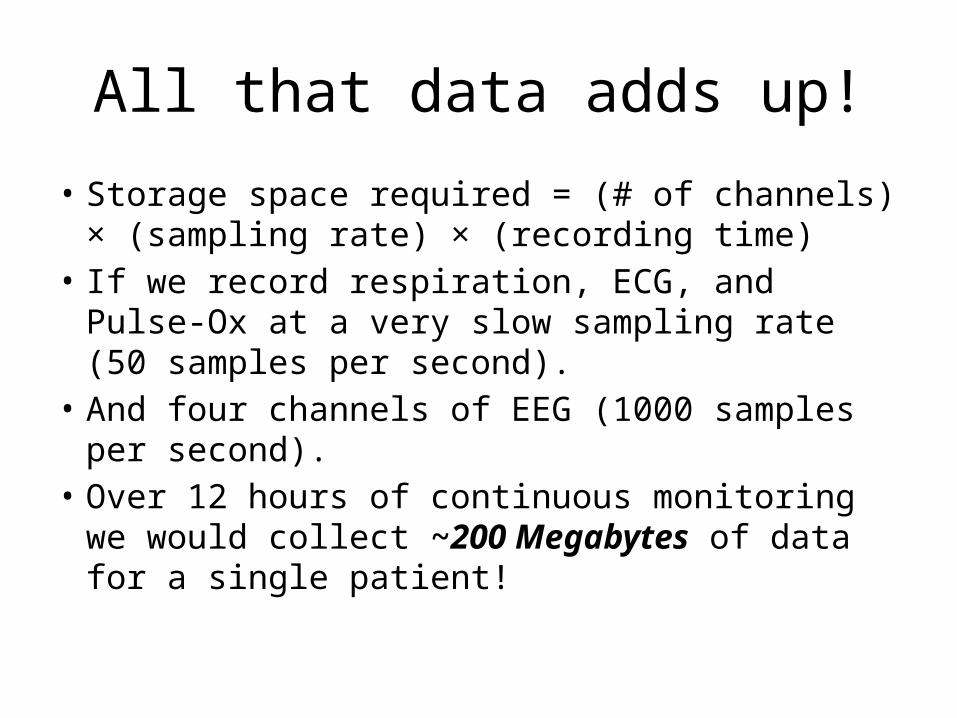
All that data adds up!
• Storage space required = (# of channels) × (sampling rate) × (recording time)
• If we record respiration, ECG, and Pulse-Ox at a very slow sampling rate (50 samples per second).
• And four channels of EEG (1000 samples per second).
• Over 12 hours of continuous monitoring we would collect ~200 Megabytes of data for a single patient!
Long-term Data Storage
• Luckily disk storage is now very cheap (approximately $100/Terabyte).
• However, with 100s of patients in the hospital per year, even with only a few hours of limited recording per patient, the data will become prohibitive to manage locally.
• Computer operating systems that can handle large datasets in memory have only recently become more common (32 bit versus 64 bit).
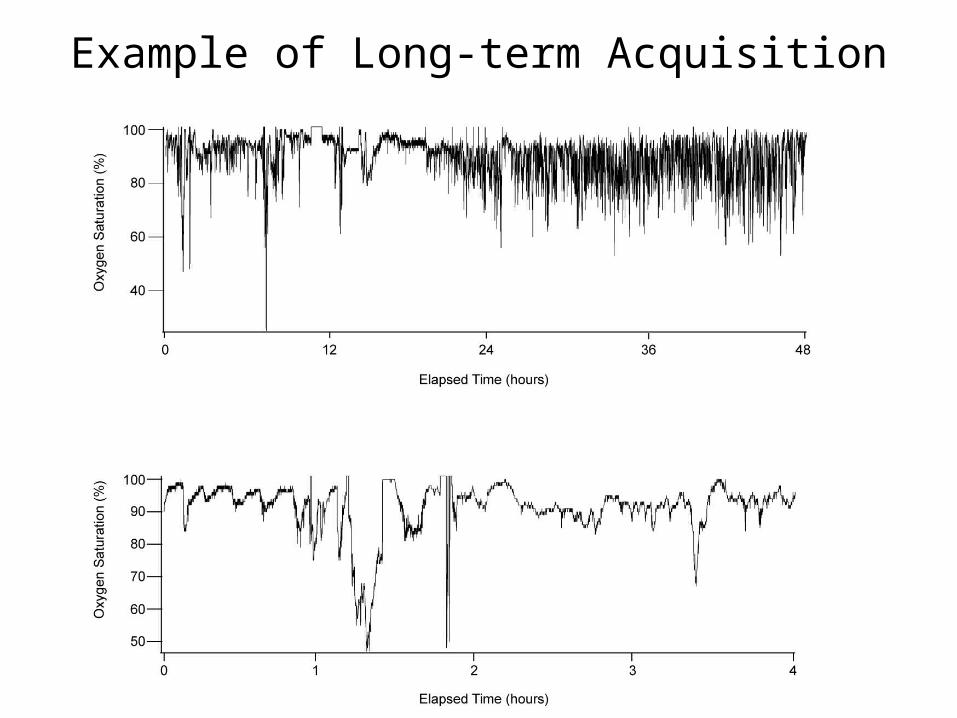
Example of Long-term Acquisition
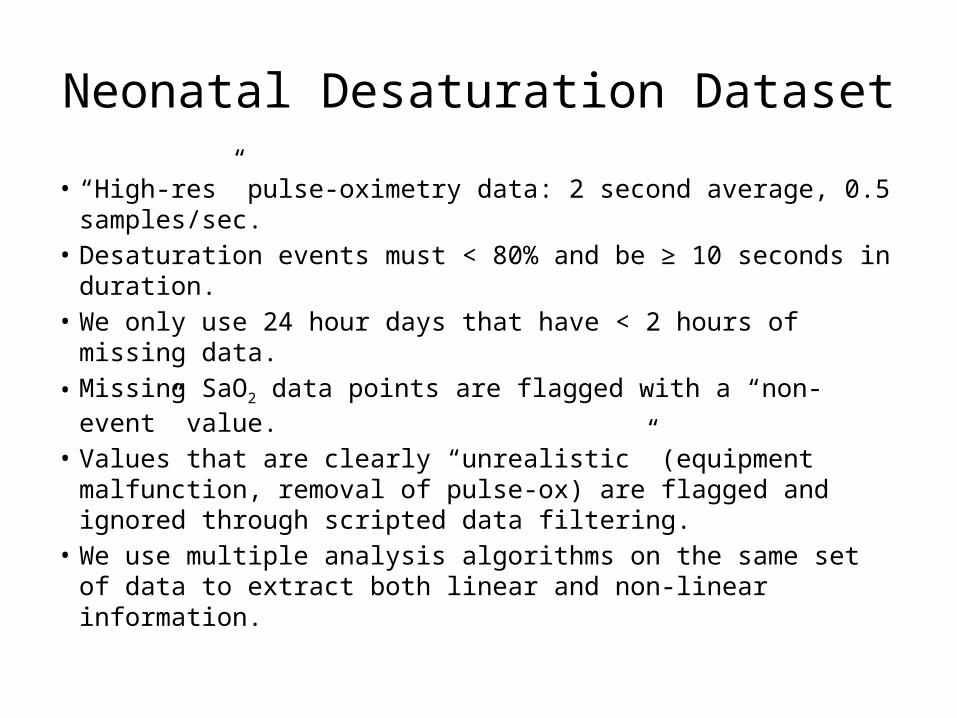
Neonatal Desaturation Dataset
• “High-res” pulse-oximetry data: 2 second average, 0.5 samples/sec.
• Desaturation events must < 80% and be ≥ 10 seconds in duration.
• We only use 24 hour days that have < 2 hours of missing data.• Missing SaO2 data points are flagged with a “non-event” value.• Values that are clearly “unrealistic” (equipment malfunction,
removal of pulse-ox) are flagged and ignored through scripted data filtering.
• We use multiple analysis algorithms on the same set of data to extract both linear and non-linear information.
Artifact sources
• Patient moves, dislodging the finger cuff• Patient is moved by transport to another
location• Equipment malfunction• Movement artifact– These sources of artifact can happen with any
signal source!
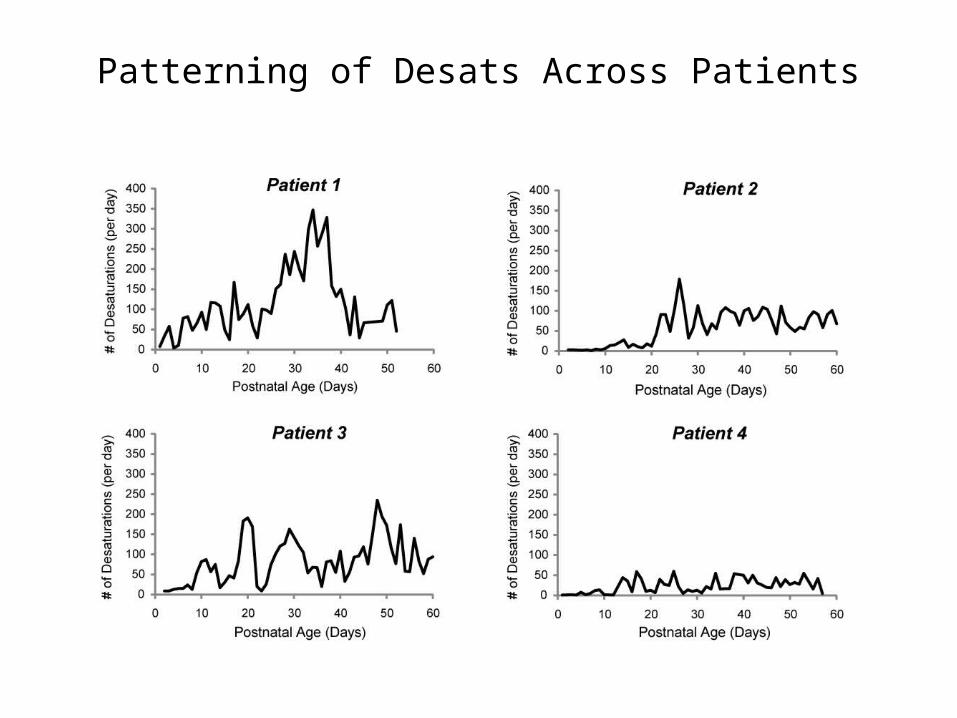
Patterning of Desats Across Patients
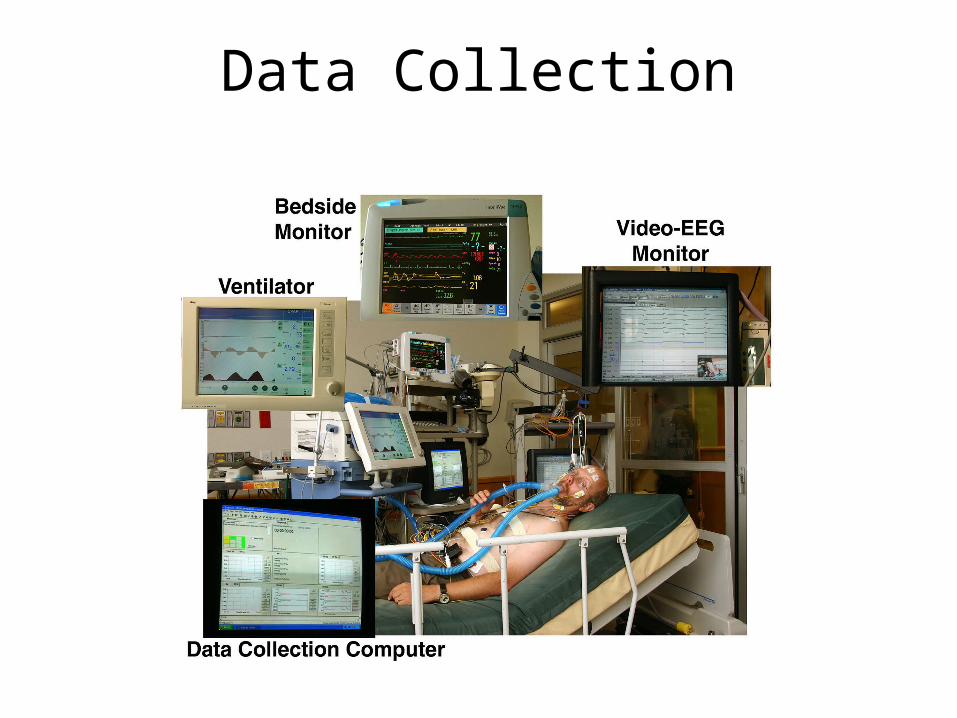
Data Collection
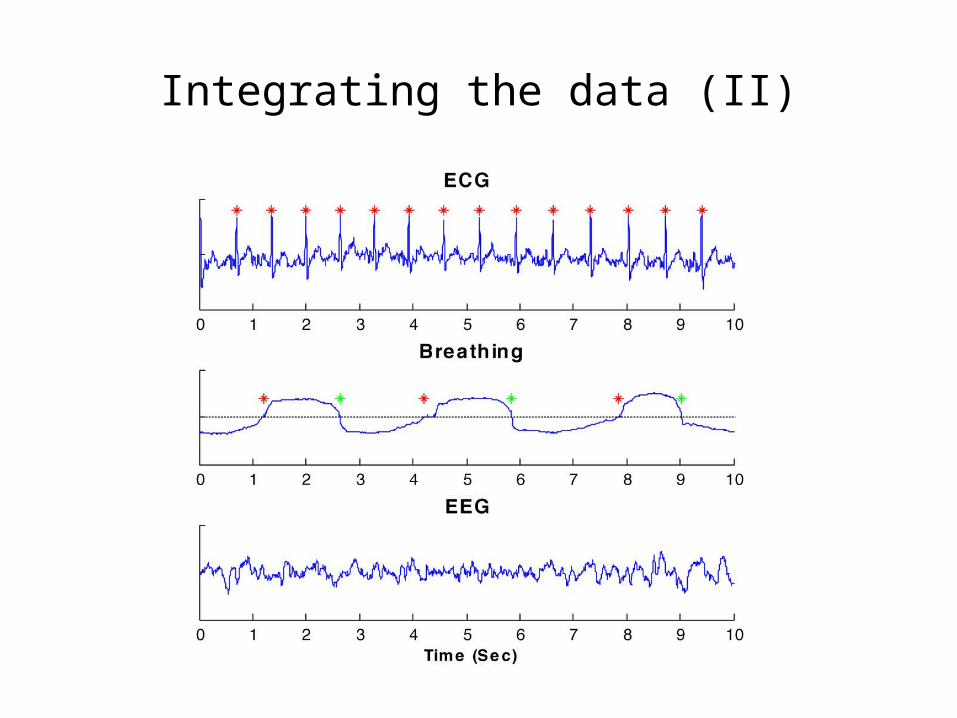
Integrating the data (II)
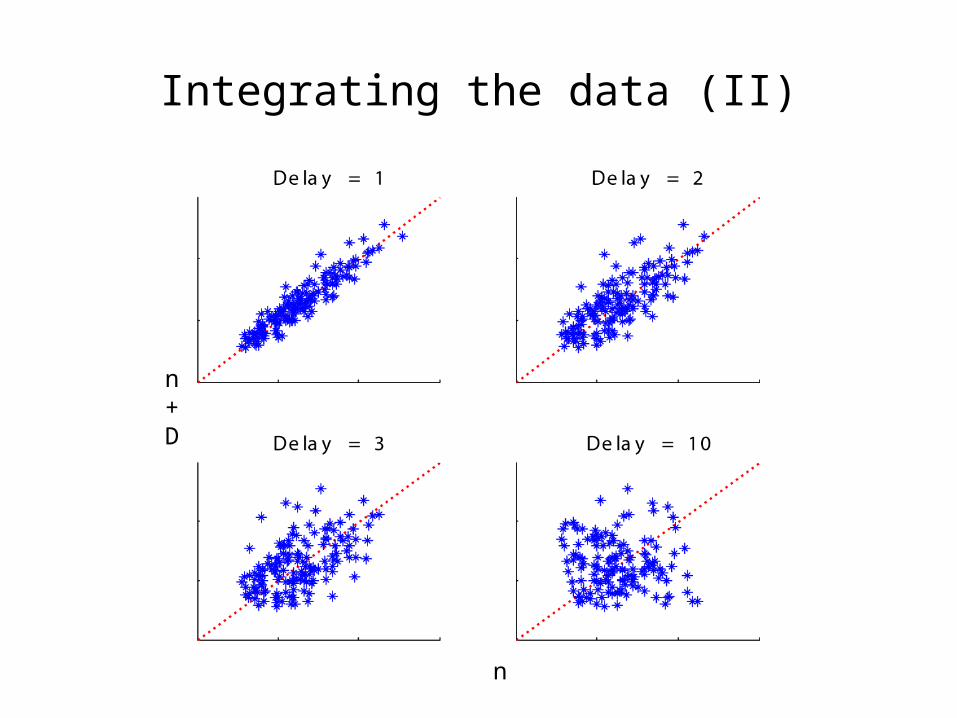
Integrating the data (II)
n
n + D
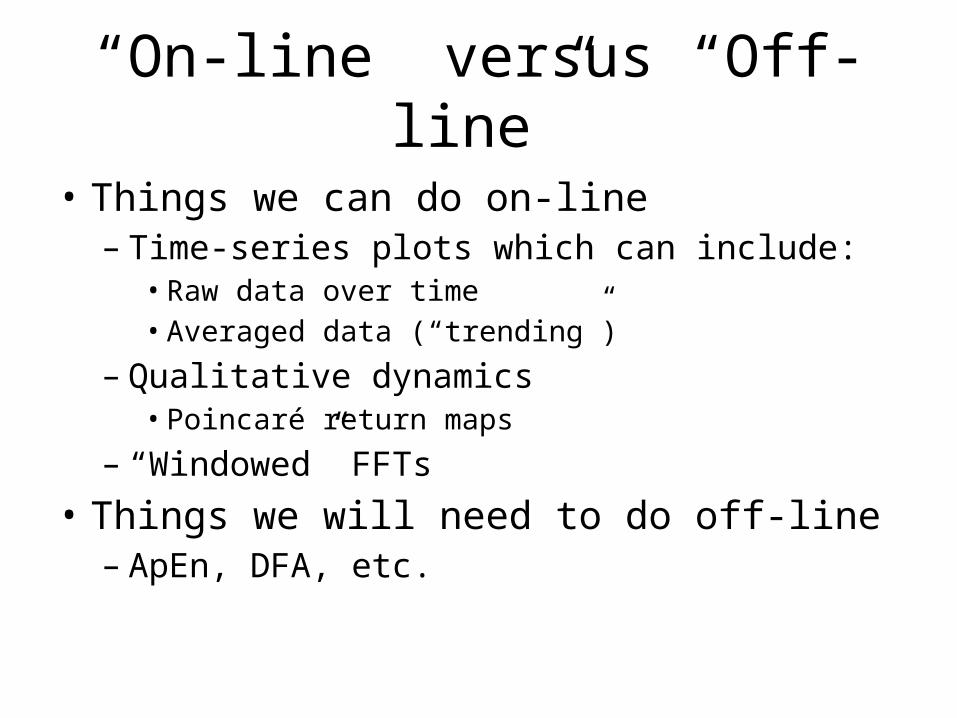
“On-line” versus “Off-line”
• Things we can do on-line– Time-series plots which can include:• Raw data over time• Averaged data (“trending”)
– Qualitative dynamics• Poincaré return maps
– “Windowed” FFTs• Things we will need to do off-line – ApEn, DFA, etc.
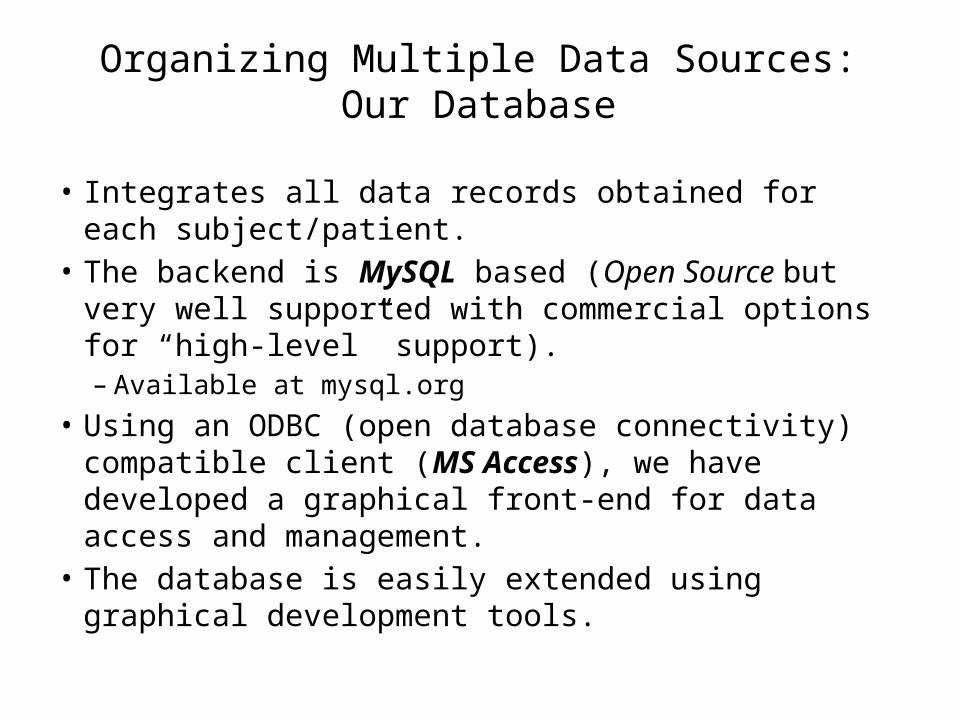
Organizing Multiple Data Sources: Our Database
• Integrates all data records obtained for each subject/patient.
• The backend is MySQL based (Open Source but very well supported with commercial options for “high-level” support). – Available at mysql.org
• Using an ODBC (open database connectivity) compatible client (MS Access), we have developed a graphical front-end for data access and management.
• The database is easily extended using graphical development tools.
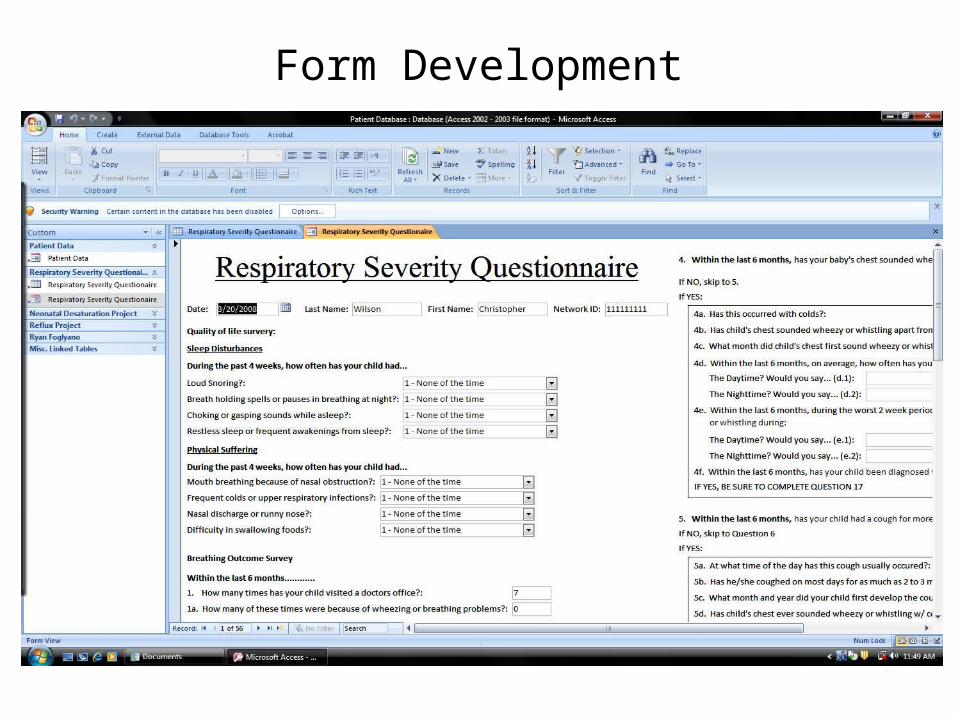
Form Development
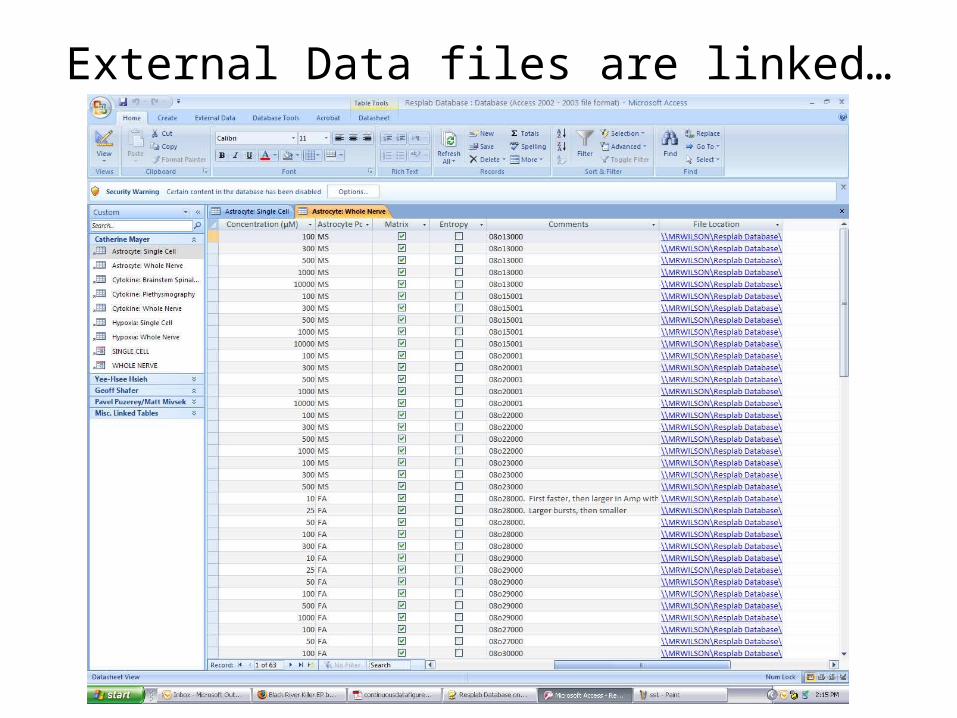
External Data files are linked…
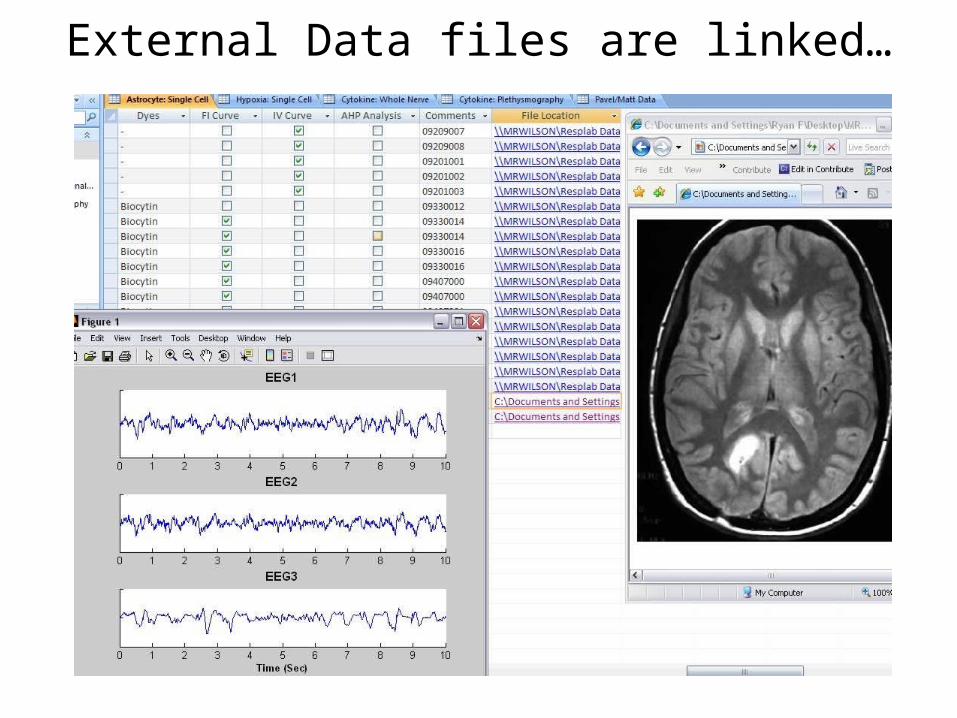
External Data files are linked…

Data Collection
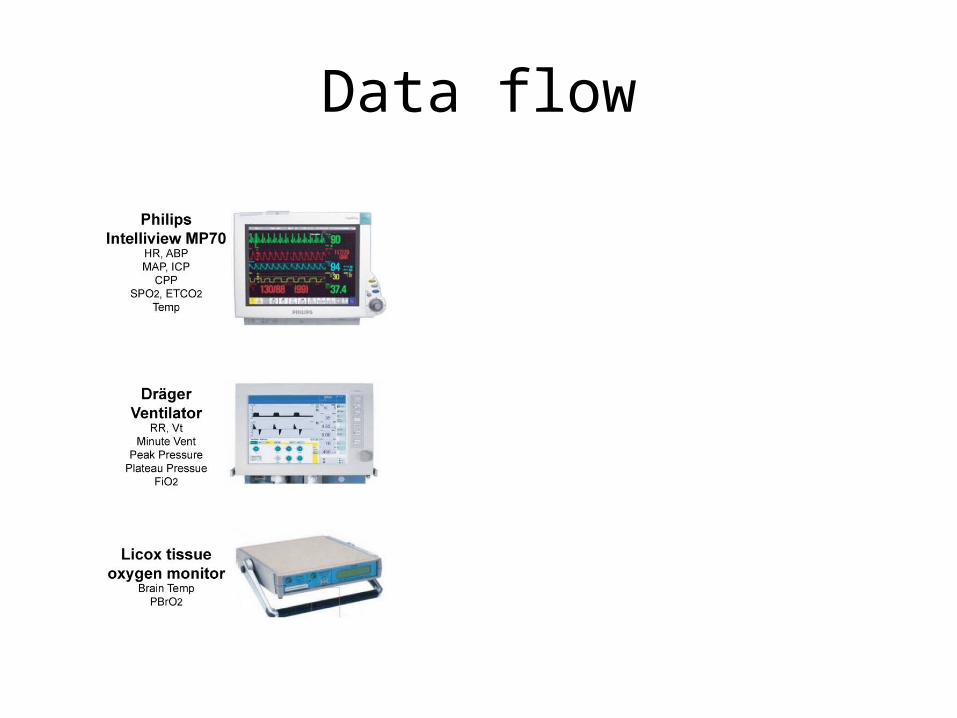
Data flow
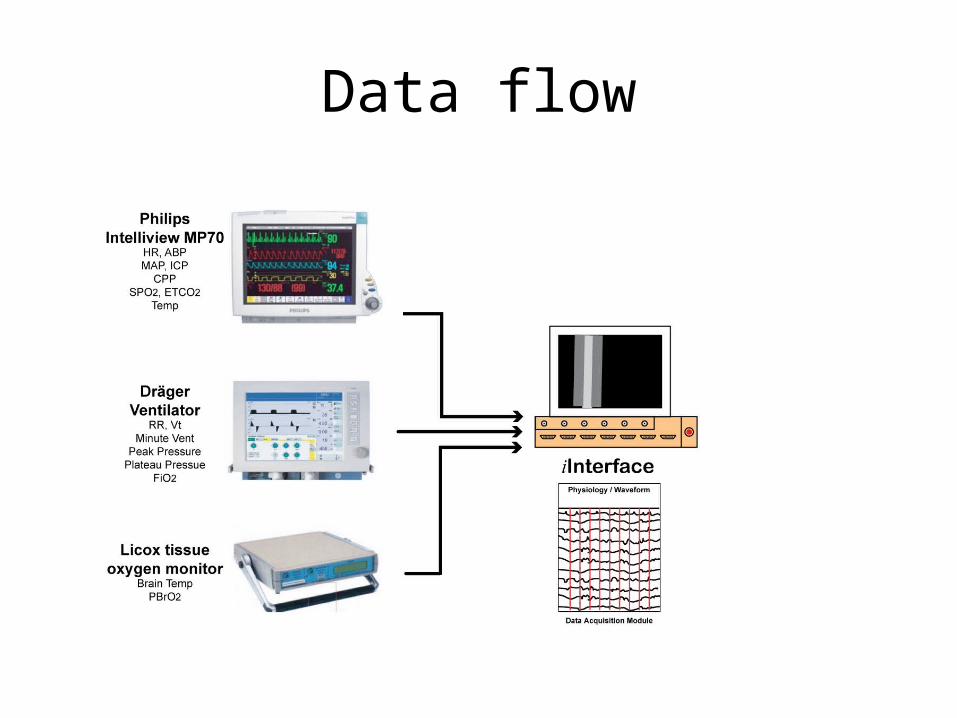
Data flow

Data flow
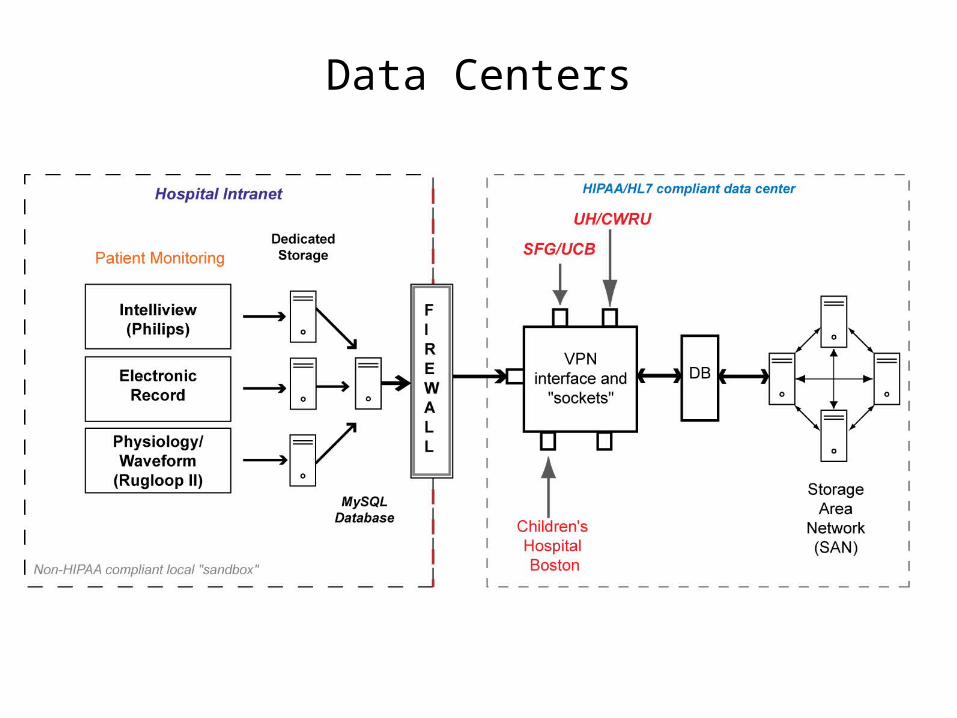
Data Centers
Summary
• Long-term patient data acquisition can be done now.• This is possible due to relatively inexpensive data storage
and acquisition hardware.• Currently, the majority of our data “digestion” and analysis
is done off-line, post-hoc.• Management of collected data using widely available
database software allows integration of patient records and high-resolution waveform and imaging data.
• A remaining challenge is long-term off-site storage of patient data in secure data centers and “open-access” standards across health care institutions.
Acknowledgements
• Kenneth Loparo, PhD• Ryan Foglyano, BME• Farhad Kaffashi, PhD• Julie DiFiore, BME• Jordan Holton, BME (major)• Bryan Kehoe, Nihon Kohden, USA
Our website: http://www.case.edu/med/bioinformatics/