critical electrical connections in abb drives factory
TRANSCRIPT

Department of Electrical Power Engineering and Mechatronics
Critical electrical connections in ABB Drives
factory
Elektrilised Kriitilised Ühendused ABB Drives’i tehases
MASTER THESIS
Student: Urmo Tuul
Student code: 163058
Supervisor: Mart Tamre
Tallinn 2019

2
AUTHOR’S DECLARATION
Hereby I declare, that I have written this thesis independently.
No academic degree has been applied for based on this material. All works, major viewpoints and data of
the other authors used in this thesis have been referenced.
“.......” .................... 2019
Author: ..............................
/signature /
Thesis is in accordance with terms and requirements
“.......” .................... 2019
Supervisor: ….........................
/signature/
Accepted for defense
“.......”....................2019
Chairman of theses defense commission: .............................................................................
/name and signature/

3
Department of Electrical Power Engineering and Mechatronics
THESIS TASK
Student: Urmo Tuul, 163058
Study program: Engineering; Manufacturing and Technology
Main specialty: Mechatronics; MAHM02/18
Supervisor(s): Mart Tamre; Professor; +372 620 3202
Consultants: Kaarel Lahtvee; Team Leader of Manufacturing and Process Engineering
ABB Drives AS; +372 568 01 295; [email protected]
Thesis topic:
The aim of the thesis is to map out and analyze the risks that may be associated with poor contact of critical
connections. At the same time the thesis also offers a possible solution to guarantee the fastening of the
joints according to the manufacturer's specification in the first time when the connections is created. The
later goal of the thesis is to compare older and newer test results and evaluate whether this solution can
be implemented on assembly line.
Lõputöö eesmärgiks on kaardistada ja analüüsida riske, mis võivad kaasneda kriitiliste ühenduste halva
kontakti korral. Samas pakub antud lõputöö välja ka võimaliku lahenduse, kuidas garanteerida ühenduste
kinnitamise tugevus vastavalt tootja poolt ettenähtud spetsifikatsioonile esimese korraga, kohe, kui
kinnitus luuakse. Lõputöö hilisem eesmärk on võrrelda varasemaid ja uuemaid katsetulemusi ning hinnata,
kas antud lahendus oleks sobilik kasutada ka ettevõtte sisestel tootmisliinidel.

4
Thesis main objectives:
1. Map out and analyze the risks that may be associated with poor electrical connections
2. Find out the possible solution how to ensure the correct tightening torque
3. Compare old and new test results
Thesis tasks and time schedule:
No Task description Deadline
1. Thesis proposal 18.2.2019
2. Selection of torque tool 20.2.2019
3. Analyzing risks caused by poor connection 2.4.2019
4. Testing tools from assembly site 23.4.2019
5. Presenting draft version to supervisors 3.5.2019
Language: ENG
Deadline for submission of thesis: 21st of May 2019
Student: Urmo Tuul .....................…….............. “.......”......................201….a
Supervisor: Mart Tamre ………….............................. “.......”......................201….a
Consultant: Kaarel Lahtvee …………........................... “.......”......................201….a
/signature/

5
TABLE OF CONTENTS
TABLE OF CONTENTS ........................................................................................................................ 5
PREFACE ............................................................................................................................................ 7
INTRODUCTION ................................................................................................................................ 8
1. MAPPING RISKS ........................................................................................................................ 9
1.1 OVERALL DANGERS REGARDING ELECTRICAL CONNECTIONS .......................................................................9
1.1.1 Loose Electrical Box Connections .............................................................................................9
1.1.2 Damaged Electrical Panels ..................................................................................................... 10
1.1.3 Ground Faults ........................................................................................................................ 10
1.2 RECOMMENDATIONS WHEN TORQUEING BOLTS AND NUTS .................................................................... 10
1.2.1 Tightening Sequence ............................................................................................................. 10
1.2.2 Flange Headed Bolts .............................................................................................................. 11
1.2.3 Gaskets ................................................................................................................................... 11
1.2.4 Embedding ............................................................................................................................. 11
1.3 RISKS WHEN REQUIRED TORQUE IS NOT USED ...................................................................................... 12
1.3.1 Connections are shifting from their position during rough transport ................................... 12
1.3.2 Weak connection causes an arcing ........................................................................................ 13
2. COMMON TIGHTENING TORQUES USED IN PRODUCTION .................................................... 18
2.1 DEFINED TIGHTENING TORQUES FOR BOLTS AND NUTS .......................................................................... 18
2.2 PFMEA – PROCESS FAILURE MODE AND EFFECTS ANALYSIS .................................................................. 20
3. TESTING DIFFERENT TOOLS .................................................................................................... 23
3.1 CHECKING TORQUE VALUES FROM COMMONLY USED ASSEMBLY LINE TOOLS ............................................. 23
3.1.1 Test setup .............................................................................................................................. 23
3.1.2 Tool for checking the torque ................................................................................................. 25
3.1.3 Air compressed tools ............................................................................................................. 27
3.1.4 Regular racket head wrench .................................................................................................. 31
3.1.5 Atlascopco Saltun SWR-30 torque wrench ............................................................................ 33
3.2 POSSIBLE TOOL SELECTION TO ENSURE CORRECT TIGHTENING TORQUE ..................................................... 35
3.2.1 WrenchStar Multi digital Torque tool .................................................................................... 35
3.2.2 Torque tool heads .................................................................................................................. 36

6
3.2.3 TCI Lineside Controller ........................................................................................................... 37
3.2.4 User interface ........................................................................................................................ 39
3.2.5 Torque values for WrenchStar Multi Torque wrench ............................................................ 43
4. COMPARSION OF THE TOOLS ................................................................................................. 45
4.1 METRICS ....................................................................................................................................... 45
4.1.1 Cost of tools ........................................................................................................................... 46
4.1.2 Monetary expense for company ........................................................................................... 47
4.1.3 Indirect saving ........................................................................................................................ 48
4.2 PROS & CONS OF WRENCHSTAR MULTI TORQUE TOOL ........................................................................ 49
4.2.1 Pros ........................................................................................................................................ 49
4.2.2 Cons ....................................................................................................................................... 49
5. IMPLEMENTING TORQUE TOOL TO ASSEMBLY LINE.............................................................. 50
5.1 PROCESS FLOW ............................................................................................................................... 51
6. SUMMARY .............................................................................................................................. 53
REFERENCES ................................................................................................................................... 55
APPENDIX ....................................................................................................................................... 57
APPENDIX 1 – SEVERITY ................................................................................................................................ 57
APPENDIX 2 – OCCURRENCE .......................................................................................................................... 58
APPENDIX 3 – DETECTION ............................................................................................................................. 60
APPENDIX 4 – TORQUE WRENCH AND TCI DATASHEETS ..................................................................................... 62

7
PREFACE
The topic of this thesis was selected by Mihkel Must, the manager of Continues Improvement and Quality
team and by Kaarel Lahtvee, the leader of Manufacturing and Process Engineering team.
Working daily as Manufacturing Engineer on cabinet’s assembly line in ABB Drives factory requires to
search for alternative and effective solutions to improve the product quality, a desire to reduce the time
needed for product final assembly and skillful process besides support for manufacturing. It is a great
opportunity to match daily work and problem solving experience with the Master’s thesis.
This thesis was completed by the supervising of TalTech University’s professor Mart Tamre and ABB
Manufacturing and Process Engineering team leader Kaarel Lahtvee.

8
INTRODUCTION
ABB Ltd. is a multinational corporation, pioneering technology leader with a comprehensive offering for
digital industries. Company operates in more than 100 countries with about 150 thousand employees.
With a history of innovation spanning more than 130 years, ABB is a leader in digital industries with four
customer-focused, globally leading businesses: Electrification, Industrial Automation, Motion, and
Robotics & Discrete Automation. Part of Motion business is Drives and Renewables that develops,
manufactures and distributes Drive units. Variable Frequency Drive units are used to run electric motors,
providing electric energy with highest possible efficiency [1].
ABB Drives factory uses both calibrated pneumatic and conventional hand tools to secure electrical
connections. Critical connections are always checked with calibrated hand tools. Unfortunately checking
the connection is not possible sometimes due to the location of the connection inside the cabinet or the
physical parameters of the tool won’t allow proper verification. Checking could be forgotten also thanks
to worker’s unorganized work habit.
The objective of the Master thesis is to map out and analyze the risks that may be associated with poor
contact of critical connections. At the same time the thesis also offers a possible solution to guarantee the
fastening of the joints according to the company’s approved specification in the first time when the
connections is created.
The later goal of the thesis is to test the current tools on assembly line. After that comparing previously
acquired torque results and evaluate whether new solution can be implemented on assembly line.
Proposed solution must simplify the production process of the company since repeated inspections of
critical connections consume the time and financial resources of the employer. In addition this solution
makes the tool calibration process more transparent as the number of different tools in production
decreases and the calibration check for the existing tools becomes longer. The focus is also on the ability
to store the results to the internal database, helping to reduce the paperwork inside the company.

9
1. Mapping risks
1.1 Overall dangers regarding electrical connections
Industrial work is to a certain extent known for its risk for injury. However it’s still not something people
often put to consideration while working in environments that risk so much injury in such a substantial
way. There are numerous ways injuries can happen when doing industrial work and operating with the
industrial machines. The most common cause is due to electricity [2].
Electrical hazards can cause many workplace fatalities and injuries that may result to normal workplace
schedules for being disrupted. Electrocution is one of the most major cause of workplace deaths in many
industries all over the world [2].
Electrical injuries may happen in various ways, such as when a worker/assembler comes into contact with
an exposed electric conductor or to a part of electric circuit. This may cause heart problems, muscle spasms
and loss of breath. An injury may also occur if electricity is passed from a conductor or circuit through a
gas and into a grounded worker. This nature of injury is more severe and can often lead to death. In
addition, workers can be burned by electrical fires or fall from heights after being shocked [2].
Poor electrical contact can cause circuit resistance to increase and impede weld current flow across the
connection. Poorly made electrical connections are the joints in high or low voltage electrical devices that
are not properly tightened or dirt and other contaminants come between contact surfaces [3].
Poor electrical wiring may cause problems. Because a connection runs all the way from the panel
to the outlet and lighting, it’s safe to say that poor wiring is not only an annoyance, but also very
dangerous. Other electrical wiring problems range from improper installation of wires to damaged
or worn panels [4].
1.1.1 Loose Electrical Box Connections
Unlike the above electrical problem, loose connections in electrical boxes is a problem that’s
harder to fix. Every electrical box has a device installed in it that can hinder you from taking a look

10
at the interior of the box to find loose connections. You can only know of a loose connection when
a problem manifests itself in the system. One good example is if a light, once switched on, just
flickers on and off. The problem can be pointed back to any of these three sources: a switch box,
the electrical panel, or the fixture box. A loose connection will lead to heat, which causes fires
[4].
1.1.2 Damaged Electrical Panels
An electrical panel, after several years of use, can wear out. Eventually, the primary breaker will
lose grip on all fuses of the panel where the breaker makes contact. When this happens, arcing
will be needed for completion of the circuit. Arcing heats up both breaker and fuses, and
eventually, will burn the fuse and make the breaker lose connection with the supply line [4].
1.1.3 Ground Faults
Grounding an electrical circuit is very important. Without a proper ground, anything with electricity flowing
through it can become dangerous. Ground faults are a good example of a stray current, which is
defined as current taking on an unintended path. Hot or neutral wires that get in contact with the
conductive material or the ground wire is a ground fault. Such an electrical mishap can happen in
an electrical box or anywhere along the run from the panel [4].
Proper tightening for electrical connections can reduce the risks related to electrical dangers.
1.2 Recommendations when torqueing bolts and nuts
1.2.1 Tightening Sequence
The majority of joints consist of more than one bolt and bring together surfaces that are not completely
flat. The sequence of tightening bolts can have a major influence on the resulting preloads. With such
joints, consideration should be given to specifying the sequence in which the bolts are to tighten. Because
the joint surfaces compress, tightening one bolt in the vicinity of another will affect the preload generated
by the first bolt tightened [5].
A good tightening sequence ensures that an even preload distribution is achieved in the joint. Since joints
containing conventional gaskets have a comparatively low compressive stiffness, bolt preloads in such

11
joints are particularly sensitive to the tightening sequence. Based on experience, if the bolts are in a circular
pattern, a crisscross tightening sequence would normally be specified. For non-circular bolt patterns, a
spiral sequence starting at the middle would normally be specified [5].
1.2.2 Flange Headed Bolts
On relatively soft materials or when high tensile bolts are used, consideration should be given to the use
of flange headed bolts and nuts. Such fasteners reduce the surface pressure under the nut surface reducing
the amount of preload lost due to embedding. Due to the larger diameter bearing faces, generally a higher
tightening torque is required because more torque is dissipated by friction [5].
1.2.3 Gaskets
Conventional gaskets are non-elastic; this results in a reduction in the bolts preload over time. The majority
of such non-elastic condition usually occurs shortly after installation. This usually causes relaxation in a
bolt. To reduce the effect of such problems, re-tightening of the bolts is frequently completed after
allowing a period of time to elapse after initial tightening [5].
1.2.4 Embedding
Embedding is a plastic deformation that occurs in the threads of the fastener and in the joint itself. It is
caused by high stresses generated by the tightening process. Such embedding results in a loss of bolt
extension and hence preload. Typically, preload loss due to embedding is in the region of 10%. It increases
with the number of joint surfaces being clamped and with the roughness of those surfaces. High surface
pressures under the bolt head can also be a cause of excessive embedding [5].
This can be due to the use of high tensile fasteners in relatively soft materials. Hardened washers or the
use of flanged fasteners can reduce such effects. Caution should be exercised in the use of short bolts
clamping several interfaces together. In such joints, the small amount of bolt extension can be significantly
reduced by the large amount of embedding, which can be anticipated [5].

12
1.3 Risks when required torque is not used
Following situations could happen when bolts and nuts are not tightened enough on critically connected
connections:
1.3.1 Connections are shifting from their position during rough transport
It can be seen on Figure 1 that low torque caused the connection to come loose during transportation (by
road and sea) and the components could shift from their original position.
Reassembling the product for some reason for example difficult product’s design, doesn’t allow other
components to fit in place in a first try but loosening the previously tightened connection a little bit makes
the assembling much easier. Later, thanks to lack of time or negligence the connections may forgot to
check. Short transportation inside production area doesn’t affect the connections to come loose and this
connection may pass the quality control.
Figure 1. Loose connection caused by low tightening torque

13
1.3.2 Weak connection causes an arcing
Here is an example of weak connection on phase bus bars and the effect of such fault. After the cabinet is
commissioned and connected to power grid, a serious electrical incident can happen. On the Figure 2 the
root cause of arching is bad connection between bus bars. This type of failure can happen when worker
assembles cabinet and makes the connections but bus bars are connected via bolts and nuts which are
tightened by hand.
Unequal torque on bus bar bolt connections causes increased resistance on loose connections and uneven
load distribution on phases and possible effect of this failure mode is arching. On previous picture pay
attention on the gap between the rightmost bus bar connections.
Figure 2. Burned connections on bus bars

14
Thanks to the cabinets mechanical design (Figure 3) subsequent double check is not able to see and verify
if the connection is correctly made.
Figure 3. Connection is located in the back area of the final prduct

Product’s data logger shows the change of difference in waveworms in three phases and two modules before the safety system shut down the
current flow through bus bars (Figure 4).
Figure 4. Current flow differences between phases

Closer look of damaged connection can be seen on Figure 5.
Figures 6 and Figure 7 are showing the arcing damages on bus bars.
Figure 5. Damaged connection on first phase
Figure 6. Arcing footprints on first phase bus bar Figure 7. Arcing footprints on third phase bus bar

17
On Figure 8 it is shown the appearance of bolts, washers and nuts that were removed from connections.
It is clearly seen the tightening torque was different for each bolt and nut.
Bolts from right bus bars don’t have visible damage on threads, they are shiny and sticky appearance
comes from collateral damage. Tightening torque was probably below the limits. Meanwhile bolts from
middle and left bus bar connetions have damaged threads from over torquing that possibly happened
during rushed assembly.
Figure 8. Damaged bolts and nuts

18
2. Common tightening torques used in production
2.1 Defined tightening torques for bolts and nuts
Calibrated torque tools are used in production and they are calibrated usually 2 to 4 times per year,
depends on a frequency of usage. Certain automatic tightening tools, such as impact wrenches or air tools,
may result a significant variations during assembly in the final torque value and the bolts preload. Different
U-joints or extensions can change the final values as well. Therefore a calibrated torque tool are used for
final tightening after the first connection is being made.
If correct tightening tool is achieved then assembler marks the connection with white marker and later,
the person who does the double check, marks the connection with black marker (Figure 9).
Figure 9. Marking of critical connection before and after double check

19
Table 1 shows the tightening torque values used in production
Combi screw/bolt Elect. Connection Nm Note!
M3 0.5 Strength class 4.6 ... 8.8
M4 1 Strength class 4.6 ... 8.8
M5 4 Strength class 8.8
M6 9 Strength class 8.8
M8 22 Strength class 8.8
M10 42 See exceptions Strength class 8.8
Hexagon bolt Elect. Connection Nm Note!
M6 9 Strength class 8.8
M8 22 Strength class 8.8
M10 42 See exceptions Strength class 8.8
M12 70 See exceptions Strength class 8.8
M16 120 See exceptions Strength class 8.8
Torx screw Elect. Connection Nm Mechanical Nm Note!
M6 5 5 Frame earthling/mech.
Set screw for fuses Bussman Nm Ferraz S. Nm Set screw to fuse Nm Note!
M8 20 13.5 Max 5 Strength class 8.8
M10 40 26 Max 5 Strength class 8.8
M12 50 46 Max 5 Strength class 8.8
Cable shoe Elect. Connection Nm Note!
M8 15 Strength class 8.8
M10 32 Strength class 8.8
M12 50 Strength class 8.8
Exceptions Elect. Connection Nm Mechanical Nm Note!
M6 Serpress 5 Strength class 8.8
M8 Serpress 15 Strength class 8.8
M10 Serpress 35 Strength class 8.8
M10 Combi Screw 10 LCL-capacitor
M16 Hexagon bolt 80 LCL-reactor bus bar
M16 Hexagon bolt 70 Lifting bar
M12 Fastening 10 B25834-S7826-K**4-1 Capacitor (Sine filter)
M10 Elec. Terminal 7
M6 Fastening 5 SKK81/22 ja 192/22 Diode (LC Charging)
M5 Elec. Terminal 3
M6 Elec. Terminal 5
Table 1. Needed tightening torque on bolt connections

20
2.2 PFMEA – Process Failure Mode and Effects Analysis
PFMEA is a step-wise means of analyzing a process, in order to identify and rate its critical failure modes
and their effect. The tool is best utilized during the design phase of a project, and should be refreshed as
the existing system is optimized. In production PFMEA tables are usually composed by various process-,
manufacturing-, mechanical- and electrical engineers in production area to search for a solution to
eliminate the risks to minimum. Once all the critical system failure modes and their associated
consequences are identified and weighted, the team can arrange itself to facilitate appropriate elimination
or frequency reduction of these opportunities based on the highest priority. Appropriate documentation
of the potential system failures and their associated risks, facilitates the implementation of continuous
improvement efforts such as engineering controls [6].
Three basic metrics are kept in mind:
Severity – Quantifying the severity of the impact of the failure effect. The scale for severity ranges from
“No effect” on the low end to “Safety hazard” – up to and including “Loss of life without warning” – on the
high end. Also the effect can be expressed in monetary damages, as well as destruction and delays [7].
Occurrence – Quantifying the frequency of occurrence of the failure mode. The scale for occurrence ranges
from “High unlikely” on the low end to “Highly likely” on the high end. Some users, teams, and
organizations will go to great lengths to provide absolute definitions for the frequency of occurrence [7].
Detection – Quantifying the ability to detect the failure at a specific process step (that is, not at a previous
or subsequent step, but at the step under consideration). The scale for detection ranges from “Almost
certain” on the low end to “Not possible” on the high end [7].
To evaluate how important is proper tightening torque for electrical connections between bus bars, PFMEA
table (Table 2) has been created to give overview of the problems regarding critical bus bar connections
and tightening. AIAG handbook was being followed when scale values were evaluated.
Scales regarding previously mentioned metrics can be found from Appendix 1 – Severity, Appendix 2 –
Occurrence and Appendix 3 – Detection.

Sub item Sub function
Requirements Potential
Failure Mode
Potential Effects of Failure
C - Customer P - Process
SEV Potential Causes
Current Process
Controls - Prevention
OC
C
Current Process
Controls - Detection
DET
RP
N
Re-commended
action(s)
Electrical connection: Fasteners
Fastener - Nm M3 - 0.5...0.8 M4 - 1...2 M5 – 4 M6 - 9 M8 – 22 M10 - 42 M12 – 70 M16 - 120 Exception: M10 - 10 LCL capacitor Exception: M16 - 80 LCL- bus bars
Too high torque
C -Loose connection due to subsequent fracture of screw. Bus bar connection overheats on the field. Arc flash. Fire inside the product.
9
1. Calibration process 2. Wrong tool used 3. Tool is broken 4. Overtightening with manual wrench
1. Assembly Manuals 2. Calibrated tools 3. Preventive maintenance
3 No check 10 270 New check system should be implemented
Electrical connection: Fasteners
Fastener - Nm M3 - 0.5...0.8 M4 - 1...2 M5 – 4 M6 - 9 M8 – 22 M10 - 42 M12 - 70 M16 - 120 Exception: M10 - 10 LCL capacitor Exception: M16 - 80 LCL- bus bars
Too low torque
C - Bus bar connection overheats on the field. Arc flash. Fire inside the product.
9
1. Calibration process 2. Wrong tool used 3. Tool is broken 4. Assembler inattention, forgets to tighten the connection 5. Assembler does not use pneumatic tools correctly (until Nm is reached) 6. Connection is rotating ( bolt + nut )
1. Assembly manuals 2. Calibrated tools 3. Preventive maintenance
3 Double check
with tools 9 243
New check system should be implemented
Table 2. PFMEA table to evaluate risks that may occur regarding wrong tightening torque

Analyzing the first line from the table (dark red)
1) Electrical connection between two bus bars is tightened too much and exceeds the required spec
(Table from subtopic 2.1).
Severity is graded to 9 - It means potential failure mode affects safe vehicle operation and/or involves
noncompliance with government regulation with warning. May endanger operator (machine or assembly)
with warning
Occurrence is graded to 3. The frequency of the failure is very low, it may happen once during 1 - 3 year
period or once per 1000000 product.
Detection is rated 10 which means that it is almost impossible to find a connection that has been
overtightened. Testers or visual inspection won’t show the faulty connection during final inspection. Using
torque tools with gauges don’t give the required accuracy.
Total RPN is calculated 270. Because the RPN number is quite high it is recommended to find/create and
implement better solutions.
Analyzing the second line from the table (light blue)
2) Electrical connection between two bus bars is tightened too weak and the connection might be
loose compared to required spec (Table from subtopic 2.1).
Severity is rated to 9 - Potential failure mode affects safe vehicle operation and/or involves noncompliance
with government regulation with warning. May endanger operator (machine or assembly) with warning
Occurrence is graded 3. The frequency of the failure happening is less than rare, it may happen once during
1 - 3 year period or once per 1000000 product.
Detection got 9 points. Loose connection can be prevented by double checking the connection with
calibrated tools. Production lines assemblers are double checking the critical connections every time when
the cabinet is being assembled. During the connection creation and later by a person of duty.
Total RPN is calculated to 243 points. Quite high RPN number indicates that is recommended to find or
create better solutions to solve issue.

23
3. Testing different tools
3.1 Checking torque values from commonly used assembly line tools
Four different torque tools have been picked up from assembly line and random connections have been
executed with these tools. After that these torque results are compared in topic 4.
All picked tools had nominal torque value of 20 Nm. 20 Nm tools were chosen thanks to relatively small
error compared to tools that have higher nominal torque values (i.e. 70 Nm) according from customer
experience. To get more reliable value, five bolt connections were made with each tool. The connections
were reopened later with calibrated torque tool (Holex) to check the tightening torque.
More information about the calibrated tool can be found from subtopic 3.1.2.
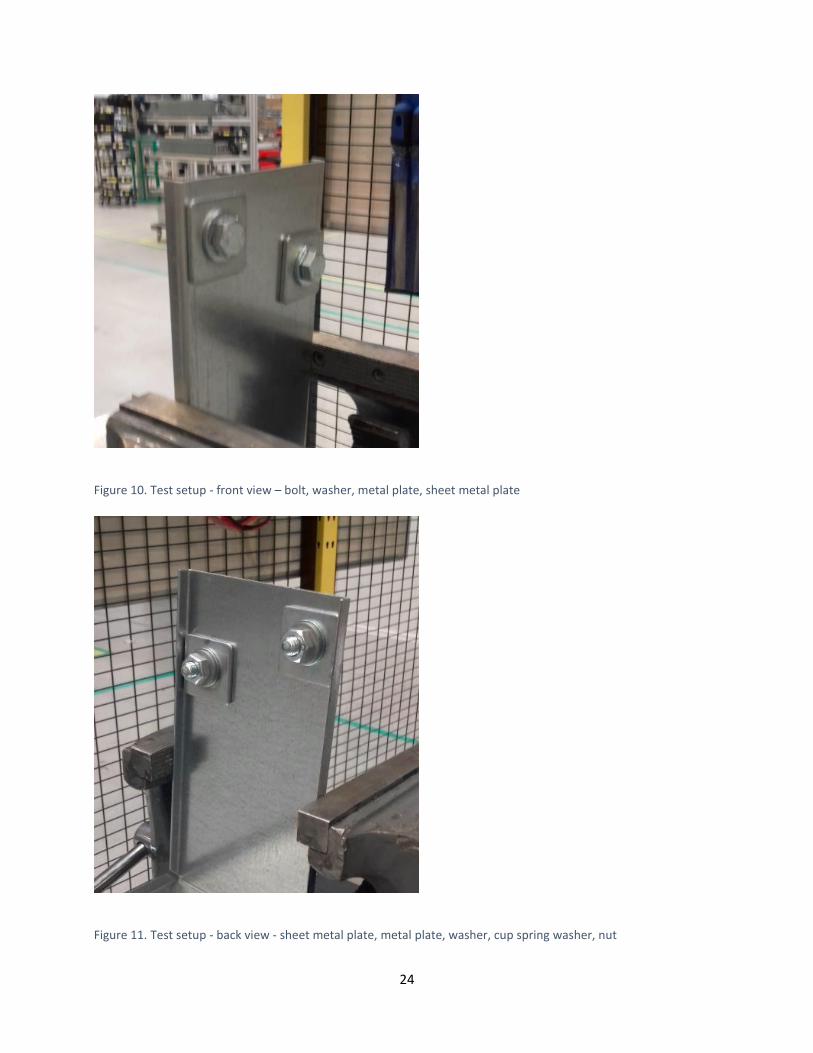
3.1.1 Test setup
For testing the randomly selected tools from production line the following setup has been constructed as
shown on Figure 10 and Figure 11.
Components that were used are close to the typical bus bar connection to simulate connections as they
are in cabinet. Parts are listed in following order (assembly order):
M10 x 35 bolt (strength class 8,8)
M10 Washer (strength class 8,8)
Metal plate (thickness 3 mm)
Sheet metal plate (thickness 1,5 mm)
Metal plate (thickness 3 mm)
M10 washer (strength class 8,8)
10 spring cup washer (strength class 8,8)
M10 nut (strength class 8,8)
Every bolt, washer and nut were used once to get more precise data result.
24
Figure 10. Test setup - front view – bolt, washer, metal plate, sheet metal plate
Figure 11. Test setup - back view - sheet metal plate, metal plate, washer, cup spring washer, nut

25
3.1.2 Tool for checking the torque
To check the previously made connections on test setup torque tool Holex has been used to check
tightening torque (Figure 12). This tool is used commonly during root cause analyzes when checking critical
connections by manufacturing engineers.
The tool is calibrated and has a range from 10 to 100 Nm.
Manufacturer: Holex, equipment model 655364_100.
The tool corresponds to EN ISO 678:2003 standard.
Desired torque target is set to 20,00 +- 10 % Nm, rotation direction is counter clockwise, threshold angle
5,00 degrees and breakaway angle is 5,00. The reason why to use these parameter like counter clockwise
direction or 5 degrees breakaway angle is to find out how much torque needed to open previously
tightened connection (20 Nm) by 5 degrees.
Etalon wasn’t used to check if the torque values are corresponding to producer’s spec but the results can
be trusted because they were executed all in same place (air temperature and humidity are constants),
time and same test set.
Overall 25 connections were measured: 5 connections for each line tool (4) and demo kit. Test values are
uploaded to tables on subtopics 3.1.3, 3.1.4, 3.1.5 and 0.
Figure 12. Holex torque wrench

26
Uncertainty of the tool:
Result = 𝑀𝑒𝑎𝑠𝑢𝑟𝑒𝑚𝑒𝑛𝑡 ± 𝐴𝑏𝑠𝑜𝑙𝑢𝑡𝑒 𝑒𝑟𝑟𝑜𝑟
Absolute error = 𝐴𝑐𝑐𝑢𝑟𝑎𝑐𝑦 𝑒𝑟𝑟𝑜𝑟 + 𝑅𝑒𝑎𝑑𝑖𝑛𝑔 𝑒𝑟𝑟𝑜𝑟
Accuracy error = 𝑀𝑒𝑎𝑠𝑢𝑟𝑒𝑚𝑒𝑛𝑡 ∙ 𝐴𝑐𝑐𝑢𝑟𝑎𝑐𝑦
100
Reading error = 𝑈𝑛𝑖𝑡𝑠 𝑟𝑒𝑎𝑑𝑖𝑛𝑔 𝑒𝑟𝑟𝑜𝑟 ∙ 𝐿𝑜𝑤𝑒𝑠𝑡 𝑢𝑛𝑖𝑡 𝑜𝑛 𝑑𝑖𝑠𝑝𝑙𝑎𝑦
From datasheet: Absolute error = ± 1% − 𝑘 = 2
± 1
100∙ 20 − 1 ∙ 0,01 = ±0,20 − 0,01
Relative error
𝐸1 [%] = (∆𝑥1−𝛼
𝑥1) ∙ 100 % = (
0,20
20,00) ∙ 100 = 1,00 %
Uncertainty of Holex test equipment if 20 Nm is set as nominal value
𝒙𝒕𝟎 = 𝒙𝟎 + ∆𝒙𝟏−𝒂 = 𝟐𝟎, 𝟎𝟎 ± 𝟎, 𝟐𝟎 𝑵𝒎

27
3.1.3 Air compressed tools
1) Air tool 1 - Atlascopco EP6PTX32 HR10-AT, serial number 7673; Manufacturing year - 2014; Torque
range 15 – 32 Nm at pressure 6,3 bar. Next calibration: W25 2019
Nominal value Measured value
Test No. Nm Nm
1 20 +- 10 % 17,34
2 20 +- 10 % 21,02
3 20 +- 10 % 19,41
4 20 +- 10 % 21,74
5 20 +- 10 % 18,29
Figure 13. Typical air tool used on assembly line
Table 3. Test results from first air tool

28
When the tool accuracy was calculated after the tests were executed, the AIAG’s (Automotive Industry
Action Group) handbook was used [14].
Calculating tool accuracy
Measurement error caused by the test device’s error
𝑢𝑆𝑇 =0,2
2= 0.1
Measurement error caused by repeatability
𝑢𝑅 = (𝑀𝑎𝑥 − 𝑀𝑖𝑛)
2 ∙ √3 =
(21,74 − 17,34)
2 ∙ √3= 1,2702
Measurement error caused by control device’s reading error
𝑢𝑅𝐸 = 1
2⁄ 𝑆𝑚𝑎𝑙𝑙𝑒𝑠𝑡 𝑑𝑖𝑔𝑖𝑡𝑎𝑙 𝑟𝑒𝑎𝑑𝑖𝑛𝑔
√3=
0,5 ∙ 0,01
√3 ≈ 0,0029
Measurement error caused by metrology error
𝑢𝑀𝐸𝑇 = 0
Measurement error caused by environment change
𝑢𝐸𝑁𝑉 = 0
Process variation
𝑢𝐴 = 0
Measurement variation
𝑢𝐵 = √𝑢𝑆𝑇2 + 𝑢𝑅
2 + 𝑢𝑅𝐸2 + 𝑢𝑀𝐸𝑇
2 + 𝑢𝐸𝑁𝑉2 = √(0,1)2 + (1,2702)2 + (0,0029)2 + 0 + 0 ≈ 1,2741
𝑢 = √𝑢𝐴2 + 𝑢𝐵
2 = √0 + 1,27412 = 1,2741
Measurement uncertainty
∆𝑥1−𝑎 = 𝑘 ∙ 𝑢 = 2 ∙ 1,2741 = 2,5482 ≈ 2,55 𝑁𝑚

29
Average value
𝑥0 = ∑ 𝑥𝑖
𝑛=
(17,37 + 21,02 + 19,41 + 21,74 + 18,29)
5= 19,56 𝑁𝑚
Final tool accuracy
𝒙𝒕 𝑨𝒊𝒓𝟏 = 𝒙𝟎 + ∆𝒙𝟏−𝒂 = 𝟏𝟗, 𝟓𝟔 ± 𝟐, 𝟓𝟓 𝑵𝒎
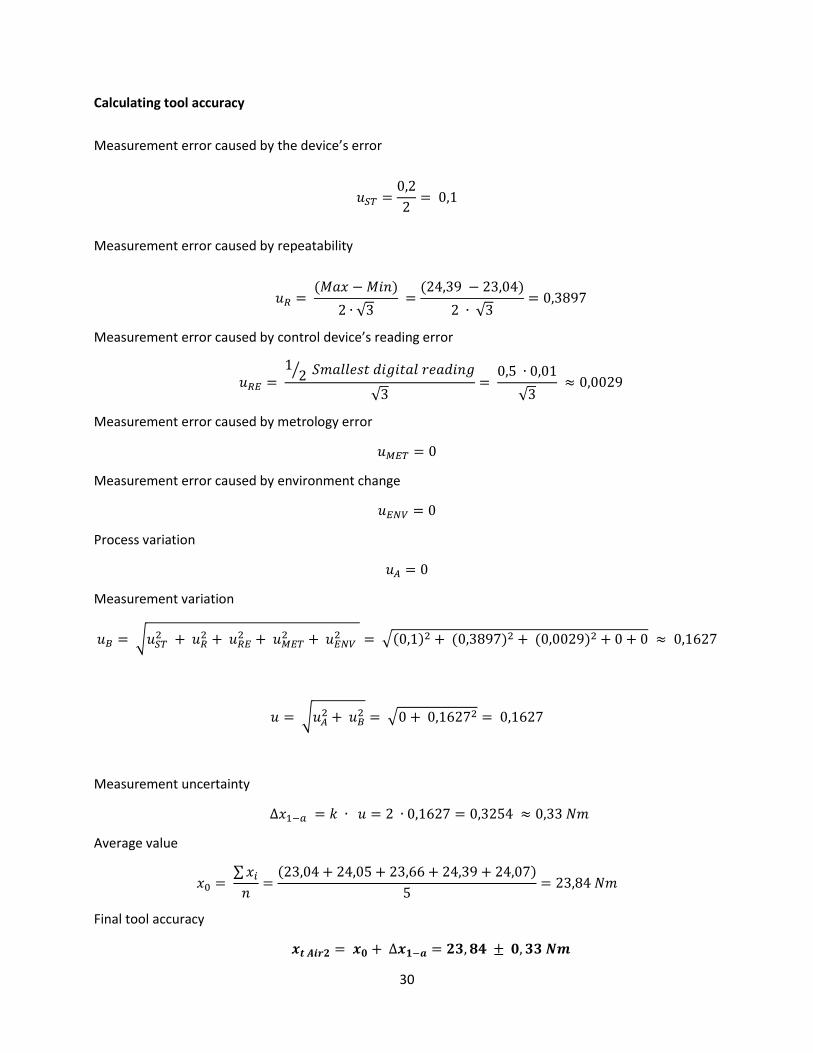
2) Air tool 2 - Atlascopco EP6PTS22 HR10-RE, serial number 6194; Manufacturing year - 2013; Torque
range 10 -22 Nm at pressure 7.0 bar. Next calibration: W25 2019
Nominal value Measured value
Test No. Nm Nm
1 20 +- 10 % 23,04
2 20 +- 10 % 24,05
3 20 +- 10 % 23,66
4 20 +- 10 % 24,39
5 20 +- 10 % 24,07
Table 4. Test results for second air tool
30
Calculating tool accuracy
Measurement error caused by the device’s error
𝑢𝑆𝑇 =0,2
2= 0,1
Measurement error caused by repeatability
𝑢𝑅 = (𝑀𝑎𝑥 − 𝑀𝑖𝑛)
2 ∙ √3 =
(24,39 − 23,04)
2 ∙ √3= 0,3897
Measurement error caused by control device’s reading error
𝑢𝑅𝐸 = 1
2⁄ 𝑆𝑚𝑎𝑙𝑙𝑒𝑠𝑡 𝑑𝑖𝑔𝑖𝑡𝑎𝑙 𝑟𝑒𝑎𝑑𝑖𝑛𝑔
√3=
0,5 ∙ 0,01
√3 ≈ 0,0029
Measurement error caused by metrology error
𝑢𝑀𝐸𝑇 = 0
Measurement error caused by environment change
𝑢𝐸𝑁𝑉 = 0
Process variation
𝑢𝐴 = 0
Measurement variation
𝑢𝐵 = √𝑢𝑆𝑇2 + 𝑢𝑅
2 + 𝑢𝑅𝐸2 + 𝑢𝑀𝐸𝑇
2 + 𝑢𝐸𝑁𝑉2 = √(0,1)2 + (0,3897)2 + (0,0029)2 + 0 + 0 ≈ 0,1627
𝑢 = √𝑢𝐴2 + 𝑢𝐵
2 = √0 + 0,16272 = 0,1627
Measurement uncertainty
∆𝑥1−𝑎 = 𝑘 ∙ 𝑢 = 2 ∙ 0,1627 = 0,3254 ≈ 0,33 𝑁𝑚
Average value
𝑥0 = ∑ 𝑥𝑖
𝑛=
(23,04 + 24,05 + 23,66 + 24,39 + 24,07)
5= 23,84 𝑁𝑚
Final tool accuracy
𝒙𝒕 𝑨𝒊𝒓𝟐 = 𝒙𝟎 + ∆𝒙𝟏−𝒂 = 𝟐𝟑, 𝟖𝟒 ± 𝟎, 𝟑𝟑 𝑵𝒎

31
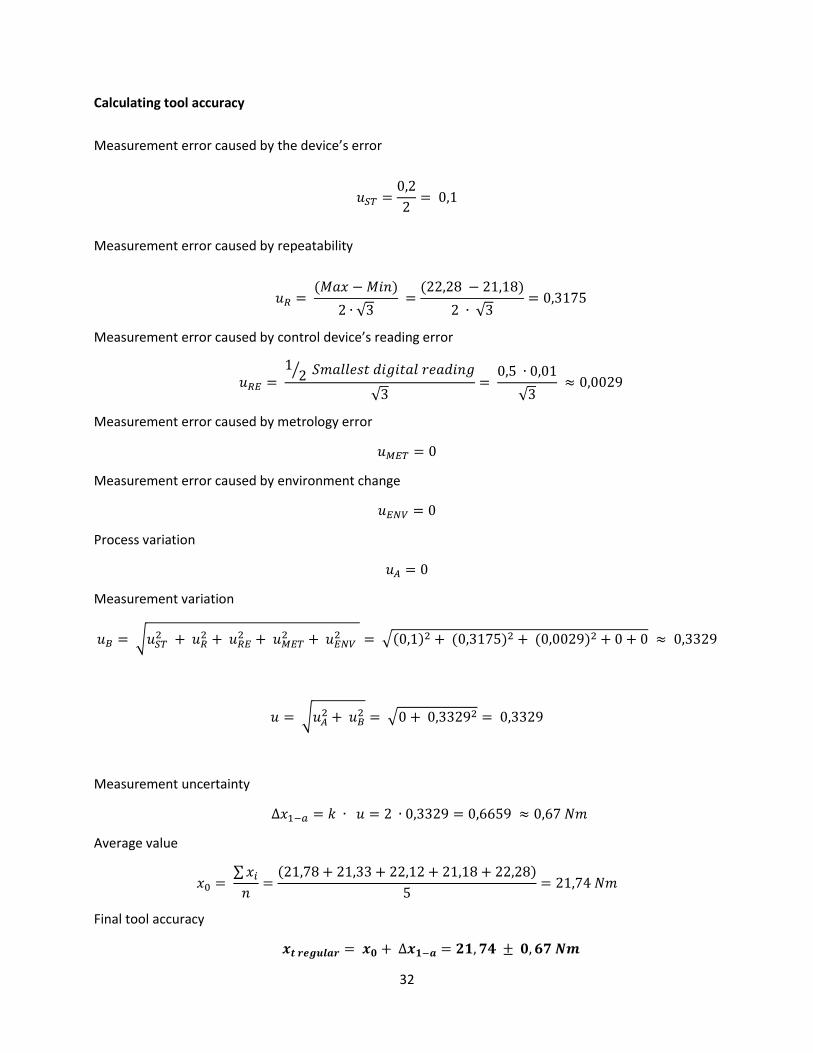
3.1.4 Regular racket head wrench
Serial number 7733; Next calibration: W11 2020
Given value Measured value
Test No. Nm Nm
1 20 +- 10 % 21.78
2 20 +- 10 % 21.33
3 20 +- 10 % 22.12
4 20 +- 10 % 21.18
5 20 +- 10 % 22.28
Figure 14. Typical racket head torque wrench used on assembly line
Table 5. Results from regular racket head wrench
32
Calculating tool accuracy
Measurement error caused by the device’s error
𝑢𝑆𝑇 =0,2
2= 0,1
Measurement error caused by repeatability
𝑢𝑅 = (𝑀𝑎𝑥 − 𝑀𝑖𝑛)
2 ∙ √3 =
(22,28 − 21,18)
2 ∙ √3= 0,3175
Measurement error caused by control device’s reading error
𝑢𝑅𝐸 = 1
2⁄ 𝑆𝑚𝑎𝑙𝑙𝑒𝑠𝑡 𝑑𝑖𝑔𝑖𝑡𝑎𝑙 𝑟𝑒𝑎𝑑𝑖𝑛𝑔
√3=
0,5 ∙ 0,01
√3 ≈ 0,0029
Measurement error caused by metrology error
𝑢𝑀𝐸𝑇 = 0
Measurement error caused by environment change
𝑢𝐸𝑁𝑉 = 0
Process variation
𝑢𝐴 = 0
Measurement variation
𝑢𝐵 = √𝑢𝑆𝑇2 + 𝑢𝑅
2 + 𝑢𝑅𝐸2 + 𝑢𝑀𝐸𝑇
2 + 𝑢𝐸𝑁𝑉2 = √(0,1)2 + (0,3175)2 + (0,0029)2 + 0 + 0 ≈ 0,3329
𝑢 = √𝑢𝐴2 + 𝑢𝐵
2 = √0 + 0,33292 = 0,3329
Measurement uncertainty
∆𝑥1−𝑎 = 𝑘 ∙ 𝑢 = 2 ∙ 0,3329 = 0,6659 ≈ 0,67 𝑁𝑚
Average value
𝑥0 = ∑ 𝑥𝑖
𝑛=
(21,78 + 21,33 + 22,12 + 21,18 + 22,28)
5= 21,74 𝑁𝑚
Final tool accuracy
𝒙𝒕 𝒓𝒆𝒈𝒖𝒍𝒂𝒓 = 𝒙𝟎 + ∆𝒙𝟏−𝒂 = 𝟐𝟏, 𝟕𝟒 ± 𝟎, 𝟔𝟕 𝑵𝒎

33
3.1.5 Atlascopco Saltun SWR-30 torque wrench
Serial number 7915; Torque range 5 – 30 Nm; Next calibration: W41 2019
Nominal value Measured value
Test No. Nm Nm
1 20 +- 10 % 20,05
2 20 +- 10 % 19,53
3 20 +- 10 % 19,47
4 20 +- 10 % 19,82
5 20 +- 10 % 19,41
Figure 15. Atlascopco torque wrench
Table 6. Test results from Atlascopco torque wrench

34
Calculating tool accuracy
Measurement error caused by the device’s error
𝑢𝑆𝑇 =0,2
2= 0,1
Measurement error caused by repeatability
𝑢𝑅 = (𝑀𝑎𝑥 − 𝑀𝑖𝑛)
2 ∙ √3 =
(20,05 − 19,41)
2 ∙ √3= 0,1847
Measurement error caused by control device’s reading error
𝑢𝑅𝐸 = 1
2⁄ 𝑆𝑚𝑎𝑙𝑙𝑒𝑠𝑡 𝑑𝑖𝑔𝑖𝑡𝑎𝑙 𝑟𝑒𝑎𝑑𝑖𝑛𝑔
√3=
0,5 ∙ 0,01
√3 ≈ 0,0029
Measurement error caused by metrology error
𝑢𝑀𝐸𝑇 = 0
Measurement error caused by environment change
𝑢𝐸𝑁𝑉 = 0
Process variation
𝑢𝐴 = 0
Measurement variation
𝑢𝐵 = √𝑢𝑆𝑇2 + 𝑢𝑅
2 + 𝑢𝑅𝐸2 + 𝑢𝑀𝐸𝑇
2 + 𝑢𝐸𝑁𝑉2 = √(0,1)2 + (0,1847)2 + (0,0029)2 + 0 + 0 ≈ 0,2101
𝑢 = √𝑢𝐴2 + 𝑢𝐵
2 = √0 + 0,21012 = 0,2101
Measurement uncertainty
∆𝑥1−𝑎 = 𝑘 ∙ 𝑢 = 2 ∙ 0,2101 = 0,4202 ≈ 0,42 𝑁𝑚
Average value
𝑥0 = ∑ 𝑥𝑖
𝑛=
(20,05 + 19,53 + 19,47 + 19,82 + 19,41)
5= 19,66 𝑁𝑚
Final tool accuracy
𝒙𝒕 𝑨𝒕𝒍𝒂𝒔𝒄𝒐𝒑𝒄𝒐 = 𝒙𝟎 + ∆𝒙𝟏−𝒂 = 𝟏𝟗, 𝟔𝟔 ± 𝟎, 𝟒𝟐 𝑵𝒎

35
3.2 Possible tool selection to ensure correct tightening torque
To ensure the correct torque value to bolt connection, the calibrated and reliable torque wrench is needed.
Chosen product is WrenchStar Multi Torque tool, manufactured by Crane Electronics LTD [8].
Crane Electronics Ltd. has a long term connection with other big corporations in car, ship and windmill
industries where achieving correct torque to product on specific connection may be vital.
Crane Electronics Ltd. has offered an opportunity to test it in production area and evaluate the benefits if
they are suitable to implement on assembly site.
3.2.1 WrenchStar Multi digital Torque tool
The WrenchStar Multi digital torque wrench is perfect for users who require torque and angle data digitally
recording and a reliable, versatile and robust torque wrench [9].
The wrench has a clear OLED display screen to view the current task information, combined with a 360°
light ring that is completely visible at any angle plus a vibration alert to indicate results [9].
The WrenchStar Multi works in combination with our revolutionary IQVu torque data collector or our TCI
lineside controller via either an RF wireless connection or via a cable. Together, they are a perfect solution
to accurately measure and tighten critical fasteners to your preset torque specifications [9].
For versatility, if the digital torque wrench goes out of range of its paired controller, it can continue to
collect data with storage for up to 200 readings, allowing you to work offline. Once back in range, the
WrenchStar Multi then automatically connects to the IQVu or TCI and communicates the data [9].
Features [9]:
A 360 light ring displaying the color status of readings and vibration alert
Can be used wirelessly (RF) or with a cable option
Quick change battery pack for extended shift time use – Chargeable internally & externally
Interchangeable heads with ID for auto length compensation
A small OLED display that is clear and bright

36
Capable of recording up to 200 readings offline before having to return to the data collector
Compatible with the most advanced data collector the IQVu and our TCI lineside controller
3.2.2 Torque tool heads
Crane Electronics can also offer a number of interchangeable torque wrench heads for our range of torque
wrenches. These are perfect for applications that require quick, efficient and repetitive head changes for
wrench operation [10].
The torque wrench heads can be supplied as standalone heads or they can be supplied with an ID chip
installed. This allows the heads to communicate with our series of torque wrenches [10].
The ID chip allows the wrench to automatically adjust its torque readings, accommodating for the size and
length of the particular attached head, making it quick and easy to swap between jobs and giving complete
peace of mind for the customer [10].
Features [10]:
Multiple sizes and head fittings
Optimized for the IQWrench and WrenchStar Multi
Optional ID chip available for automatic wrench recognition
Figure 16. Model WS1JX-0120-C1DARX torque tool

37
3.2.3 TCI Lineside Controller
The TCI (Tool Control Interface) allows the user to connect a digital torque wrench to be used in assembly
production. The WrenchStar Multi can be connected to the TCI at the push of a button [11].
Figure 17. Various head types used with MultiStar torque wrench
Figure 18. Installed chip in head

38
The TCI allows easy management, set up and diagnostics of itself via web browsers and it can be used as a
standalone and jobs can be selected and results sent to a PC or web page. The unit accepts Open Protocol
commands via Ethernet to select a ‘Job’ to use with the WrenchStar Multi [11].
The TCI has a web status page that allows Ethernet properties, RF properties, logging of messages, and
wrench status to be monitored. The web page mirrors the last torque and angle reading from wrench plus
its torque status (LO, OK and HI). LED lights on the unit show real-time status of the wrench connection on
the unit [11].
Features [11]:
Connect a digital torque wrench at the push of a button
Easy management, set up and diagnostics via web browsers
Jobs can be selected and results sent to a PC or webpage
Ethernet properties, RF properties, logging and wrench status can be monitored
Web page mirrors last torque and angle reading from wrench plus its torque status
LED lights show real time status of the connection
Figure 19. TCI controller

3.2.4 User interface
Setting up a work queue is and real easy task.
Different Torque Target can be set with minimum/maximum values under one transducer (ID).
Figure 20. Setting up torque values to wrench heads

40
First line - After finishing the tightening, the result can be seen on display. If it’s in predefined limits it is shown as green, black color shown the
connection was done manually.
Figure 21. Result (Protocol Status) is shown on PC screen

41
First line - If the final value is not in limits, the result is pointed out in red on screen with value.
Figure 22. Second result is presented on display screen

The same results are presented on tool with extra information. 19.18 Nm is higher than allowed torque,
red LED lamp is flashing (not shown on figure 23) and the letters ‘HI’ is displayed on screen. Angle is in
correct range and ‘OK’ informs user that no problems detected regarding angle.
Figure 23. Value is shown on tools display

43
3.2.5 Torque values for WrenchStar Multi Torque wrench
Nominal value Actual value Measured value
Test No. Nm Nm Nm
1 20 +- 10 % 19,18 18,83
2 20 +- 10 % 20,59 20,32
3 20 +- 10 % 20,11 19,47
4 20 +- 10 % 19,91 19,53
5 20 +- 10 % 21,45 20,72
Calculating tool accuracy
Measurement error caused by the device’s error
𝑢𝑆𝑇 =0,2
2= 0,1
Figure 24. WrenchStar Multi Torque wrench
Table 7. Test results from WrenchStar torque wrench

44
Measurement error caused by repeatability
𝑢𝑅 = (𝑀𝑎𝑥 − 𝑀𝑖𝑛)
2 ∙ √3 =
(20,72 − 18,83)
2 ∙ √3= 0. ,456
Measurement error caused by control device’s reading error
𝑢𝑅𝐸 = 1
2⁄ 𝑆𝑚𝑎𝑙𝑙𝑒𝑠𝑡 𝑑𝑖𝑔𝑖𝑡𝑎𝑙 𝑟𝑒𝑎𝑑𝑖𝑛𝑔
√3=
0,5 ∙ 0,01
√3 ≈ 0,0029
Measurement error caused by metrology error
𝑢𝑀𝐸𝑇 = 0
Measurement error caused by environment change
𝑢𝐸𝑁𝑉 = 0
Process variation
𝑢𝐴 = √1
𝑛 ∙ (𝑛 − 1) ∙ ∑(𝑥𝑖 − 𝑥)2
𝑛
𝑖=1
= √1
5 ∙ (5 − 1) ∙
√((19,18 − 20,23)2 + (20,32 − 20,23)2 + (19,47 − 20,23)2 + (19,91 − 20,23)2 + (21,45 − 20,23)2)
= √1
20 ∙ (1,14 + 0,1169 + 0,019 + 0,1142 + 1,4445) ≈ 0,3765
Measurement variation
𝑢𝐵 = √𝑢𝑆𝑇2 + 𝑢𝑅
2 + 𝑢𝑅𝐸2 + 𝑢𝑀𝐸𝑇
2 + 𝑢𝐸𝑁𝑉2 = √(0,1)2 + (0,5456)2 + (0,0029)2 + 0 + 0 ≈≈ 0,3077
𝑢 = √𝑢𝐴2 + 𝑢𝐵
2 = √0,37652 + 0,30772 = √0,2364 ≈ 0,4862
Measurement uncertainty
∆𝑥1−𝑎 = 𝑘 ∙ 𝑢 = 2 ∙ 0,4862 = 0,9724 ≈ 0,97 𝑁𝑚
Average value
𝑥0 = ∑ 𝑥𝑖
𝑛=
(18,83 + 20,32 + 19,47 + 19,53 + 20,72)
5= 19,77 𝑁𝑚
Final tool accuracy
𝒙𝒕 𝑾𝒓𝒆𝒏𝒄𝒉𝑴𝒖𝒍𝒕𝒊 = 𝒙𝟎 + ∆𝒙𝟏−𝒂 = 𝟏𝟗, 𝟕𝟕 ± 𝟎, 𝟗𝟕 𝑵𝒎

45
4. Comparsion of the tools
4.1 Metrics
Table 8 represents the different tools and other parameters which are needed on assembly site.
Tool
accuracy
Relative
error
Nominal
value
adjustable
Over/Under torque
prevention
Assembly
Speed
Data
save
Tool Nm % Yes/No Method Fast/Slow Yes/No
Air tool 1 19,56 +- 2,55 13,0 Yes Mechanical clutch Fast No
Air tool 2 23,84 +- 0,33 1,4 Yes Mechanical clutch Fast No
Regular
torque
wrench
21,74 +- 0,67 3,1 Yes Click when required
torque is reached
Slow No
Atlascopco
torque
wrench
19,66 +- 0,42 2,1 Yes Click and slipping
when required
torque is reached
Slow No
WrenchStar
Multi torque
wrench
19,77 +- 0,97 4,9 Yes Flashing lights on
tool/PC display
when required
torque is reached
Slow Yes
MultiStar wrench has quite high relative error compared to other torque tools. It comes from a method
how the tool accuracy was calculated for the tool – if other tools had presumable nominal value 20 Nm,
MultiStar had different final value for every measurement. Exactly 20 Nm with every connection couldn’t
Table 8. Comparing different parameters of tool

46
be executed. Process variation was included when calculating total measurement uncertainty that raised
the variation and the final accuracy seems less accurate.
Benefits are data result saving, easily adjustable nominal values and warning signs to user if final value has
exceeded the limits.
4.1.1 Cost of tools
Table 9 presents the costs of each tool and their additional equipment *.
Price Required
Quantity
Additional
equipment price **
Required
Quantity
Total cost
Tool EUR Pc EUR Pc EUR
Atlascopco Air
tool
3669.68 1 32.62 1 3724.05
21.75 1
Regular racket
head torque
wrench
231.05 1 - - 231.05
Atlascopco racket
head torque
wrench
475.70 1 21.75 1 497.45
WrenchStar
Multi Torque tool
3608.68 1 1718.06 1 5478.96
152.22 1
* The prices of the tools listed in the table are presented on relative scale, not on an absolute scale.
Table 9. Cost of tools

47
** Tool needs additional parts like heads, TCI or extensions that has to survive impact etc. for proper
functioning
Wrenchstar torque tool is more expensive compared to other tools. Additional parts needed for proper
function will rise the costs even higher. Common Air tools are also expensive. Regular wrenches that won’t
need extra equipment at all are the cheapest.
4.1.2 Monetary expense for company
Possible saving/expense when replacing current tool set (Figure 25) with Wrenchstar Torque tool in
production.
𝐶𝑜𝑠𝑡𝑁𝑜𝑤 = 7 ∙ 𝑅𝑒𝑔𝑢𝑙𝑎𝑟 𝑡𝑜𝑟𝑞𝑢𝑒 𝑤𝑟𝑒𝑛𝑐ℎ + 3 ∙ 𝐴𝑡𝑙𝑎𝑠𝑐𝑜𝑝𝑐𝑜 𝑡𝑜𝑟𝑞𝑢𝑒 𝑤𝑟𝑒𝑛𝑐ℎ (𝑤𝑖𝑡ℎ 𝑒𝑥𝑡𝑟𝑎 𝑒𝑞𝑢𝑖𝑝𝑚𝑒𝑛𝑡)
= 7 ∙ 231,05 + 3 ∙ (475,70 + 21,75) = 3174,95 €
𝐶𝑜𝑠𝑡𝑀𝑢𝑙𝑡𝑖𝑊𝑟𝑒𝑛𝑐ℎ = 𝑇𝑜𝑟𝑞𝑢𝑒 𝑡𝑜𝑜𝑙 + 𝑇𝐶𝐼 + 3 ∙ 𝐻𝑒𝑎𝑑𝑠 = 3608,68 + 1718,06 + 3 ∙ 152,22 = 5783,40 €
𝐸𝑥𝑝𝑒𝑛𝑠𝑒𝑠 = 𝐶𝑜𝑠𝑡𝑀𝑢𝑙𝑡𝑖𝑊𝑟𝑒𝑛𝑐ℎ − 𝐶𝑜𝑠𝑡𝑟𝑒𝑔 = 5783,40 − 3174,95 = 2608,45 €
Figure 25. Current tool set what is planned to be replaced
48
After calculations it can be seen that replacing 10 tools (and their additional equipment) with one MultiStar
torque wrench, the expenses for company is approximately 2,6 K€ higher than they are now.
Please note that indirect expenses (i.e. calibration process, quality upgrade, database creation, trainings
to use, cost for utilities etc.) weren’t considered in calculations.
4.1.3 Indirect saving
Following there isn’t possible to calculate how much company can win because data is confidential.
Indirect evaluation shows that company can benefit from implementing the MultiStar Wrench on assembly
site. Some fields can be pointed out:
Time from double checking (approximately 40 h per week) – extra person who does the double
checking is not needed and this person could be arranged to production
Quality – Failures regarding weak connections on test field are taken to minimum
TCI controller for different wrenches – depends how many tools will be replaced but TCI won’t be
needed for every torque tool
Calibration (Quality) – Calibration period is defined and informs user if it has passed.
Calibration (Quality) – Some research can be done on tools working spec regarding calibration. If
the system detects the calibration value set point has been shifted it has to warn user to send it to
person who does the preventive calibration for tool.
Cost of new tools – expenses to different tools can be reduced if torque wrench can cover most of
the torque range that is used on assembly line
Saving from R&D – easily adjustable torque wrench can save some expenses from additional tools
that are used for R&D stage products
Assembly time – worker doesn’t have to search for different torque tools when it can be done
using one (must have predefined tightening sequence) tool
Assembly time – marking with different colors on connections not needed any more
Traceability – values for the tightened connections can be taken out from database after years of
service.
49
4.2 Pros & Cons of WrenchStar Multi Torque tool
4.2.1 Pros
Results are saved to tool’s (internal) database – up to 200 results
Results will be saved to local database via RF
Mobility to use in different areas of the factory
Accurate results compared to previous tools used on assembly line
Wide working range – from 10 to 120 Nm
Easy to adjust if torque specs changes are needed
Ergonomical – lightweight and small by dimensions
Calibration once a year
Warning to user if the connection got over/under torque - Upper and lower limits tells user with
lights and vibration when the correct value range has been reached
4.2.2 Cons
Expensive tool and equipment compared to other torque wrenches
Battery – spare battery needed if intensive use
Training for persons who want to use it
Removable heads can be used one cycle during work queue
Extensions may still be needed if product design won’t allow easier assembly
Air tools still needed to reach faster assembly
50
5. Implementing torque tool to assembly line
Before releasing the tool on assembly line following steps have to be overviewed:
1. SQL database modifications
Contacting IT support and give an input to create extra table where can data be saved from tool.
2. Ordering the tool to factory and let it use on a small area of production for some period
Training of highly skilled workers is needed and later the tool can be used on assembly site. Any
recommendation and feedback in the beginning of implementation from regular users simplifies the
implementation process.
3. Checking tools working sequence
Tool’s work sequence has to be overviewed. Must get better understanding how the calibration stays
test of time. Also have to find out is it possible to write an alarming message to tool’s sequence if
calibration set point is has been shifted after some period of use.
Frequent cooperation and communication with tool manufacturer sales representatives is needed.
4. Comparing the results
During implementation period connections done by MultiStar Wrench need to be recheck (and SQL
values). It can confirm that the tool is suitable to use in a whole factory, or even in Local Business Unit.

5.1 Process flow
Product order is released to production and product’s technical data is checked by (senior) assembler or
manufacturing engineer. If the cabinet is standard product (critical connection quantity and locations have
been previously defined), assembler have to use Multistar wrench to tighten the connections and results
will be saved to database (SQL). Other connections are done by regular tools. If cabinet is ready, it will be
checked visually by Final control worker and functional testing can be started. If the system detects an
error during test (for example torque value data is missing or exceeds the limits on some critical
connections) the test will fail and cabinet is sent back to assembly line.
After the engineer has made the corrections to SQL, the connections have to be retightened with MultiStar
wrench and cabinet can sent back to Final control. If no errors detected during test and it passes with
positive then the cabinet is ready and production order can be closed.
If connections are not defined (unstandardized product) the manufacturing engineer modifies database or
informs IT support to write correct parameters to SQL. After that the same process can continue as
previously described.
Following figure on next page presents a work flow visually when the new tool will be implemented on
assembly line and how it’s going to be used in a future for every day purposes in factory.
.

Typ
ical
cab
inet
ass
emb
ly p
roce
ss m
ap
Man
ufac
turi
ng
Engi
nee
ring
Pro
du
ctio
n
pla
nn
er
Ass
em
bly
wo
rke
rFi
nal C
ontr
ol
Released order Finished order
Standard product
Start / Continue with the assembly
Checking cabinets layout, assembly
drawings etc.
Yes
Checking how many critical connections
are included in cabinet
NoInform IT support to
modify SQL database
Inform assembly worker
Using WrenchStar Multi torque tool to tighten the critical
connections
Torque and position values
to SQL
Issues detected?Major rrework
needed?Yes
Opened a critical connection?
Yes
Start with visual and fuctional testing
No
Uncomplete torque and
position values in SQL
Informing assembly worker
Delete neccessary value from SQL
Informing Manufacturing
EngineerYes
Use regular torque wrench
Continue with the assembly
No
Finishing cabinet
No
Test passes?
Yes
No

6. Summary
In conclusion bad connections between electrical contacts may cause component shifting inside the device
during transportation. In more severe cases short circuit, arching, fire or even explosion if the device is
connected to power grid. Bad connections can be eliminated by correct tightening torque on bolt
connections that is defined by manufacturer.
After creation and analyzing of PFMEA table regarding torque specs, it showed that the risk priority
numbers are high. No matter if the connection is too weak or too tight. Even though the occurrence may
be relatively small and these incidents may occur once in a 3 year period, the risk in safety and financial
impact is not acceptable. Complex design of the product or worker careless will increase the risk of
products failure. Additional actions like using smart tools in addition to double checking by different
persons and marking the connections must be taken to ensure that tightening torque for the specific
connection is in its limits.
Random tests with commonly used torque tools showed the variance of tightening torque that is applied
to connections. Some calibrated tools had set point close to the working limits while the deviation was
small, other tools had set point according to calibration data but the deviation was high. One possible
solution how to secure connections in the first attempt is to use digital Torque Wrench. It helps to reduce
waste caused by double checking and quantity of assembly tools. Tool has to notify the worker if the
connection has done correctly and save the torque value to the local database (saving values to database
helps to improve tracing of the product). If the torque value is not in its specified limits, the tool has to
warn user to redo the connection until correct torque value has been reached.
From comparison between different tools the digital torque tool was selected – the MultiStar Torque
Wrench. The benefits are that tool has programmable and adjustable working range and mobility. These
functions are a big benefit for larger production site because one tool can replace several others and the
smart tool is working range is not limited by the cable length, making the production more agile. User
interface is easily understandable and gives the worker necessary information about the joint quality. Joint
data is saved to tools data logger and is received by tool controller and saved to local data base.
Although the tool and its additional parts are expensive compared to regular tools used in the production,
the benefits can have a cost saving in the long run. Further experiments and time studies have to be
conducted to see if this tool helps reducing wasted time caused by delays in production. One major saving

54
can come from eliminating double checking of connections, but also time spent on rework and possible
field failures.

55
REFERENCES
1. ABB Ltd. homepage, About ABB
https://new.abb.com/about (19.5.2019)
2. “Electrical Hazards in Industries and How to Prevent It”
https://www.sos-electricals.co.uk/blog/electrical-hazards-in-industries-and-how-to-prevent-it/
(8.4.2019)
3. “Poor Electrical Connection”, Mechanical Connections
https://www.geschmidt.com/weldhelp-cause-poor-electrical-connection/ (26.3.2019)
4. “Problems Caused by Poor Electrical Wiring”
http://www.acesydneyelectricians.com.au/blog/problems-caused-by-poor-electrical-wiring/
(29.3.2019)
5. “Specify a Torque & Tightening Sequence for Critical Fastening Joints”, Details
https://www.mountztorque.com/Specify-a-Torque-Tightening-Sequence-for-Critical-Fastening-
Joints (2.5.2019)
6. “Process Failure Mode Effects Analysis (PFMEA) Explained”
https://www.whatissixsigma.net/pfmea/ - (2.4.2019)
7. “The Certified Six Sigma Black Belt Handbook” Third Edition – T.M. Kubiak, Donald W. Benbow;
ASQ Quality Press 2016, pages 475 – 483.
8. Home page of Crane Electronics Ltd.
https://crane-electronics.com/ (20.2.2019)
9. “WrenchStar Multi Torque Wrench”, introduction
https://crane-electronics.com/products/torque-wrenches/wrenchstar-multi-torque-wrench/
(18.2.2019)
10. “Torque Wrench Heads”, introduction
https://crane-electronics.com/products/accessories-torque-wrenches/interchangeable-torque-
wrench-heads/ (20.2.2019)
11. “TCI Lineside Controller”, introduction
https://crane-electronics.com/products/lineside-controllers/tci-controller/ (20.2.2019)
12. Datasheet of Wrenchstar Multi torque wrench
http://crane-electronics.com/wp-content/uploads/2016/12/WrenchStar-Multi-2016.pdf
(18.2.2019)

56
13. Datasheet of TCI controller
https://crane-electronics.com/wp-content/uploads/2018/02/TCI-Lineside-Controller-flyer.pdf
(18.2.2019)
14. Measurement System Analyses, Reference Manual, Fourth Edition
Manual is copyrighted by Chrysler Group LLC, Ford Motor Company, and General Motors
Corporation, with all rights reserved, 2010.
http://www.rubymetrology.com/add_help_doc/MSA_Reference_Manual_4th_Edition.pdf
(27.5.2019)

57
APPENDIX
Appendix 1 – Severity
SEVERITY (Based on AIAG FMEA 4th edition)
Effect Criteria: Severity of effect on
Product (Customer Effect) Rank Effect
Criteria: Severity of effect on Product (Customer Effect)
Failure to Meet Safety and/or
Regulatory Requirements
Potential failure mode affects safe vehicle operation and/or involves noncompliance with government regulation without warning.
10
Failure to Meet Safety and/or
Regulatory Requirements
May endanger operator (machine or assembly) without warning
Potential failure mode affects safe vehicle operation and/or involves noncompliance with government regulation with warning.
9 May endanger operator (machine or assembly) with warning
Loss or Degradation of Primary Function
Loss of primary function (vehicle inoperable, does not affect safe vehicle operation).
8 Major Disruption 100% of product may have to be scrapped. Line shutdown or stop ship.
Degradation of primary function (vehicle operable, but at reduced level of performance).
7 Significant Disruption
A portion of the production run may have to be scrapped. Deviation from primary process including decreased line speed or added manpower.
Loss or Degradation of Secondary
Function
Loss of secondary function (vehicle operable, but comfort / convenience functions inoperable)
6
Moderate Disruption
100% of production run may have to be reworked off line and accepted.
Degradation of secondary function (vehicle operable, but comfort/convenience functions inoperable).
5 A portion of the production run may have to be reworked off line and accepted.
Annoyance Appearance or Audible Noise, vehicle operable, item does not conform and noticed by most customers (>70%).
4 Moderate Disruption 100% of production run may have to be reworked in-station before it is processed.

58
Appearance or Audible Noise, vehicle operable, item does not conform and noticed by many customers (50%).
3 A portion of the production run may have to be reworked in-station before it is processed.
Appearance or Audible Noise, vehicle operable, item does not conform and noticed by discriminating customers (<25%).
2 Minor Disruption Slight inconvenience to process, operation, or operator.
No effect No discernible effect. 1 No effect No discernible effect.
* Table is taken from company’s internal database, reference can’t be done
Appendix 2 – Occurrence
OCCURANCE
Like hood of Failure Criteria: Occurrence of cause - PFMEA (Incidents per items/vehicles/opportunities)
Failure rate Rank
Very High >= 100 per thousand >= 1 in 10 Every day 10
High: repeated failures
50 per thousand 1 in 20 Once per 2-3 days 9
20 per thousand 1 in 50 Once in a week 8
10 per thousand 1 in 100 Once in a month 7
Table 10. Severity scale

59
Moderate: occasonal failure
2 per thousand 1 in 500 Once in 3 months 6
0,5 per thousand 1 in 2000 Once in 6 months 5
0,1 per thousand 1 in 10000 Once in a year 4
Low: relatively few failiures
0,01 per thousand 1 in 100000 Once in 1-3 years 3
<= 0,001 per thousand 1 in 1000000
Once in 3-5 years 2
Remote: failure is unlikely Failure is eliminated through preventive control 1
* Table is taken from company’s internal database, reference can’t be done.
Table 11. Occurrence scale

60
Appendix 3 – Detection
Detection
Opportunity for
detection
Criteria: Like hood of Detection by Process Control
Inspection
Rank
Likehood of Detection
A B C
No detection opportunity
Absolute of certainty of non-detection: 1. No current process control; 2. Cannot detect or is not checked
10 Allmost Impossible
Not likely to detect at any stage
Controls will probably not detect: 1. Control is achieved with indirect or random checks only 2. Failure mode/or Error (Cause) is not easily detected (e.g., random audits) x
9 Very remote
Problem Detection Pos Processing
Controls will probably not detect: 1. Control is achieved with visual inspection only 2. Failure Mode detection post-processing by operator through visual/tactile/audible means
x
8 Remote
Problem Detection at Source
Controls have poor chance of detection: 1. Control is achieved with double visual inspection only 2. Failure mode detection in-station by operator through visual/tactile/audible means or post-processing through use of attribute gauging (go/no-go, manual torque check (clicker wrench, etc.) x
7 Very Low
Problem Detection Post Processing
Controls may detect: 1. Control is achieved with charting methods, such as SPC 2. Failure Mode detection post-processing by operator through use of variable gauging or in-station by operator through use of attribute gauging (go/no-go, manual torque check/clicker wrench, etc.) x x
6 Low
Problem Detection at Source
Controls may detect: 1. Control is based on variable gauging after parts have left the station 2. Failure Mode or Error (Cause) detection in-station by operator through use of variable gauging or by automated control in-station that will detect discrepant part and notify operator (light, buzzer, etc.). Gauging performed on setup and first-place check (for set-up causes only) x
5 Moderate
Problem Detection Post Processing
Controls have a good change to detect 1. Error detection is subsequent operations 2. Failure Mode detection post-processing by automated controls that will detect discrepant part and lock part to prevent further processing. x x
4 Moderately High

61
Problem Detection at Source
Controls have a good change to detect: 1. Error detection in-station, or error detection is subsequent operation by multiple layers of acceptance. Cannot accept discrepant part. 2. Failure Mode detection in-station by automated controls that will detect discrepant part and automatically lock part in station to prevent further processing x x
3 High
Error Detection and/or Problem Prevention
Controls almost certain to detect: 1. Error defection in-station (automatic gauging with automatic stop feature) Cannot pass discrepant part. 2. Error (Cause) detection in-station by automated controls that will detect error and prevent discrepant part from being made x x
2 Very High
Detection not applicable; Error Prevention
Controls certain to detect: 1. Discrepant parts cannot be made because item has been error-proofed by process/product design 2. Error (Cause) prevention as a result of fixture design, machine design or part design. x
1 Almost Certain
Inspection types: A Error-proofed (in-line100% inspections) B Testers
C Manual Inspection (visual testing, common testing methods)
* Table is taken from company’s internal database, reference can’t be done.
Table 12. Detection scale

62
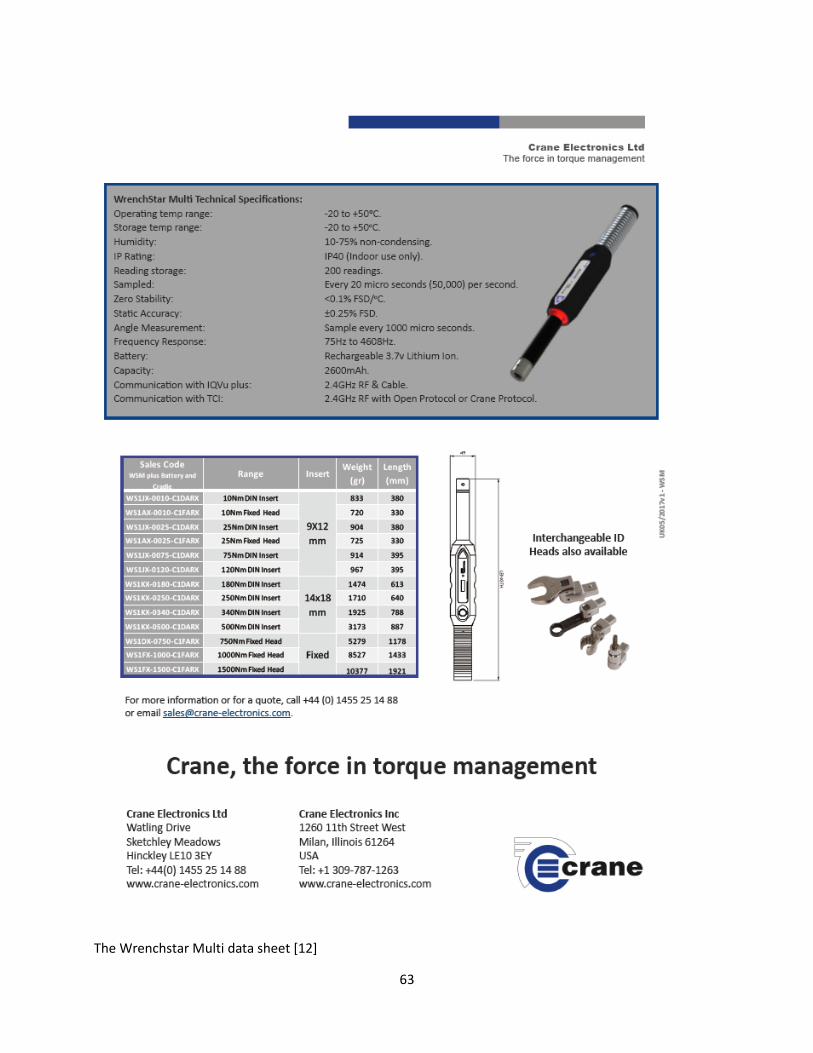
Appendix 4 – Torque wrench and TCI datasheets
63
The Wrenchstar Multi data sheet [12]

64

65
TCI controller datasheet [13]