crm impact on b2b relationships
TRANSCRIPT
The Impact of Customer Relationship Management (CRM) Technology on
Business-to-Business Customer Relationships
By
James Edward Richard
A thesis
submitted to Victoria University of Wellington
in fulfillment of the requirements for the degree of
Doctor of Philosophy
in Marketing
Victoria University of Wellington
August 2008
- i -
ABSTRACT
Recent academic and practitioner studies suggest that Customer Relationship
Management (CRM) provides improved business opportunity, yet has received mixed
performance reviews in the extant literature. This research explored the relationship
between CRM technology adoption, market orientation and relationship marketing, and
the subsequent impact on business relationships and relationship performance.
A conceptual model was developed based on the literature and information obtained
through one-to-one in-depth interviews. The model incorporated key relationship
constructs; trust, commitment and communications quality, and investigated the impact
of CRM technology adoption on these constructs and relationship performance. In
addition the firm’s market and technology orientation was considered as critical
antecedents to the adoption of CRM technology. The research incorporated a two-
phased, cross-sectional design. The first research phase was exploratory, utilising one-
on-one in-depth interviews with key informants. The objective was to explore the
conceptualised CRM technology adoption – customer relationship model for robustness
and realism. These findings were used to refine the CRM technology adoption –
customer relationship model and the measurement instrument before proceeding with
the explanatory phase of the study.
The explanatory phase of the research consisted of an instrument development stage
– creating, testing and finalising the research instrument, followed by a quantitative
study of medium and large business in the manufacturing, services and wholesale
industries in New Zealand. The objective of this stage of the research was to test and
validate the CRM technology adoption – customer relationship model and measurement
instruments. Measures of CRM technology adoption were collected from the supplier
firms, while measures of relationship strength and relationship performance were
collected separately from the customer perspective.
The benefits for practitioners include methods to improved relationship and business
performance from CRM technology implementation. The key benefit for academia is
the development of a conceptual model linking CRM technology to RM, and providing
insights into the synergies available from technology.
- ii -
ACKNOWLEDGEMENTS
I would like to express my sincere gratitude to all those who supported me with this
project. First and foremost I would like to dedicate this thesis to my wife, Claire, for her
patience and never-ending support. When I was down she was there to pick me back up,
when I needed a smile she gave it to me, when I was sad she made me laugh, and when
I needed to share, she was there to share it with.
I also wish to thank my supervisors, Professor Peter Thirkell and Professor Sid Huff,
for the time, effort and advice freely given to me throughout the project. Through them I
have learned much and will forever be in their debt for their support and patience.
Throughout the project there were a variety of people who played different roles to
support me, to those I need to give a special thanks – Val Lindsay, Nick Ashill, Ashish
Sinha, James Wiley, Jacqui Fitzgerald, the Critical Thinking in Marketing seminar
group (Nicole, Jayne, Janine, Kate, Aaron and Nick), and many others too numerous to
name. I would also like to thank Victoria University of Wellington, the Faculty of
Commerce and Administration, and the School of Marketing & International Business
for their financial support of this research.
Finally, to my parents, Nada and Lawrence, I owe both of them sincere thanks, for
providing me the environment and opportunity to experiment, learn and grow at my
own pace.
- iii -
TABLE OF CONTENTS
Abstract.............................................................................................................................i
Acknowledgements..........................................................................................................ii
List of Tables ................................................................................................................viii
List of Figures..................................................................................................................x
CHAPTER 1. Introduction.........................................................................................1 1.1. Background..............................................................................................................2 1.2. Research Problem ....................................................................................................6 1.3. Research Objectives ................................................................................................7 1.4. Conceptualisation ....................................................................................................7 1.5. Research Methodology ............................................................................................8 1.6. Delimitations of the Study.......................................................................................8 1.7. Importance and Value of the Research....................................................................9
1.7.1. Importance of the Research..............................................................................9 1.7.2. Value of the Research for Academics............................................................10 1.7.3. Value of the Research for Practitioners .........................................................10
1.8. Definitions used in this study ................................................................................11 1.9. Chapter Summary ..................................................................................................12
CHAPTER 2. Literature Review .............................................................................14 2.1. Introduction ...........................................................................................................14 2.2. Relationship between Information Technology and Marketing ............................16 2.3. Overview of the Relevant CRM Literature ...........................................................17 2.4. Evolution of Relationship Marketing ....................................................................19
2.4.1. What is a Relationship?..................................................................................20 2.4.2. Importance of Relationship Marketing ..........................................................22
2.5. Relationship Strength ............................................................................................24 2.5.1. Trust ...............................................................................................................26
2.5.1.1. Types of Trust ........................................................................................26 2.5.1.2. Findings from Trust Research ...............................................................28
2.5.2. Commitment...................................................................................................31 2.5.2.1. Defining Commitment............................................................................31 2.5.2.2. Findings from Commitment Research ...................................................32
2.5.3. Communication..............................................................................................34 2.5.3.1. Defining Communication in the Context of Relationships ....................34 2.5.3.2. Findings from Communication Research ..............................................35
2.5.4. Other Characteristics of Relationship Marketing...........................................38 2.5.4.1. Customer Satisfaction............................................................................38 2.5.4.2. Cooperation ...........................................................................................39 2.5.4.3. Power.....................................................................................................39 2.5.4.4. Performance of Duties...........................................................................40 2.5.4.5. Dependency ...........................................................................................41 2.5.4.6. Duration.................................................................................................41
- iv -
2.5.4.7. Rapport ..................................................................................................42 2.5.5. Relationship Marketing Summary .................................................................42
2.6. Market Orientation (MO) ......................................................................................43 2.7. Relationship Performance......................................................................................47 2.8. Customer Relationship Management (CRM) ........................................................49
2.8.1. CRM Definition .............................................................................................49 2.8.2. CRM IT Operational Model...........................................................................51 2.8.3. CRM Strategic Model ....................................................................................52 2.8.4. CRM Process Model ......................................................................................52 2.8.5. Current CRM Use ..........................................................................................54 2.8.6. CRM Issues ....................................................................................................55 2.8.7. Customer (Market) Orientation......................................................................58 2.8.8. Information Technology Management...........................................................59 2.8.9. Executive Commitment..................................................................................59 2.8.10. Integration of People, Process and Technology.............................................60 2.8.11. CRM Technology Adoption (CTA)...............................................................62
2.8.11.1. CRM Influence on Relationships ...........................................................64 2.8.12. Other CRM Considerations............................................................................66
2.9. Customer Relationship Orientation and Customer Expectations ..........................67 2.10. Chapter Summary ..................................................................................................68
CHAPTER 3. Research Model and Hypotheses.....................................................72 3.1. Introduction ...........................................................................................................72 3.2. The Conceptual CRM Model and Hypotheses ......................................................73
3.2.1. Market Orientation (MO)...............................................................................74 3.2.2. IT Management Orientation (ITMO).............................................................75 3.2.3. CRM Technology Adoption (CTA)...............................................................76
3.2.3.1. CRM Functionality ................................................................................77 3.2.3.2. CRM Technology Acceptance................................................................77 3.2.3.3. CRM System Integration........................................................................77
3.2.4. Relationship Strength (RS) ............................................................................78 3.2.4.1. Trust.......................................................................................................79 3.2.4.2. Commitment...........................................................................................79 3.2.4.3. Communications Quality .......................................................................80
3.2.5. Relationship Performance (RP) .....................................................................81 3.2.6. Moderator and Control Factors (secondary hypotheses) ...............................82
3.3. Research Model Summary.....................................................................................83 3.4. Chapter Summary ..................................................................................................84
CHAPTER 4. Research Methodology .....................................................................85 4.1. Introduction ...........................................................................................................85 4.2. Research Paradigm ................................................................................................85 4.3. Exploratory Research Phase ..................................................................................86
4.3.1. Exploratory Phase Approach and Objectives.................................................86 4.3.2. Sample Selection............................................................................................87
4.3.2.1. Unit of Analysis .....................................................................................88 4.3.2.2. Company Selection ................................................................................88 4.3.2.3. Respondent Selection.............................................................................89
- v -
4.3.3. Data Collection – Exploratory Phase .............................................................89 4.3.3.1. Contact...................................................................................................89 4.3.3.2. Interview Protocol .................................................................................90
4.3.4. Participation Rate and Respondent Profile ....................................................90 4.3.5. The Interviews................................................................................................91 4.3.6. Exploratory Data Analysis Procedure............................................................91
4.4. Explanatory Phase of the Research .......................................................................92 4.4.1. Explanatory Phase Approach and Objectives ................................................92 4.4.2. Overview of Research Design........................................................................93 4.4.3. Questionnaire Design.....................................................................................94
4.4.3.1. Information Required ............................................................................94 4.4.3.2. Type of Questionnaire and Method of Administration ..........................95 4.4.3.3. Form of Response ..................................................................................95 4.4.3.4. Question Wording..................................................................................96 4.4.3.5. Question Sequence.................................................................................96 4.4.3.6. Physical Aspects of the Questionnaire ..................................................96
4.5. Development of Research Instruments..................................................................97 4.5.1. Overview of Research Instrument Development ...........................................97 4.5.2. Dependent Variables ......................................................................................99
4.5.2.1. Relationship Strength (C_RS)................................................................99 4.5.2.1.1. Measurement of Trust (C_RT)...................................................100 4.5.2.1.2. Measurement of Commitment (C_CMT)...................................100 4.5.2.1.3. Measurement of Communications Quality (C_CQ) ..................101
4.5.2.2. Relationship Performance (C_RP)......................................................102 4.5.2.2.1. Measurement of Perceived Performance (C_PR) ......................102 4.5.2.2.2. Measurement of Relationship Satisfaction (C_RSA) ................102 4.5.2.2.3. Measurement of Loyalty (C_LY)...............................................103 4.5.2.2.4. Measurement of Customer Retention (C_RN)...........................103
4.5.3. Independent Variables..................................................................................103 4.5.3.1. Measures of Market Orientation (MO) ...............................................104 4.5.3.2. Measures of IT Management Orientation (ITMO) ..............................104 4.5.3.3. CRM Technology Adoption (CTA) ......................................................106
4.5.3.3.1. Measurement of CRM Functionality (CFN) ..............................107 4.5.3.3.2. Measurement of CRM Technology Acceptance (CRA) ............109 4.5.3.3.3. Measurement of CRM System Integration (CSI).......................111
4.5.4. Moderator and Control Variables ................................................................112 4.5.5. Nominated Customer Contact ......................................................................113 4.5.6. Demographic and Classification Information ..............................................114 4.5.7. Data Collection for Instrument Refinement and Verification......................114 4.5.8. Survey Implementation ................................................................................115
4.5.8.1. Sample Selection..................................................................................116 4.5.8.1.1. Unit of Analysis .........................................................................117 4.5.8.1.2. Company and Respondent Selection..........................................117
4.5.8.2. Initial Contact......................................................................................118 4.5.8.3. Cover Letter and Mail-out...................................................................118 4.5.8.4. Follow-up Procedures .........................................................................119
4.6. Data Analysis and Hypothesis-testing Procedures ..............................................119 4.6.1. Overview......................................................................................................119 4.6.2. Structural Equation Modelling.....................................................................120 4.6.3. Partial Least Squares (PLS) .........................................................................121
- vi -
4.6.3.1. Confirmatory Factor Analysis (CFA)..................................................123 4.6.4. Exploratory Factor Analysis (EFA) .............................................................123
4.7. Chapter Summary ................................................................................................124
CHAPTER 5. Data Analysis and Results..............................................................125 5.1. Introduction .........................................................................................................125 5.2. Exploratory Analysis and Results........................................................................125 5.3. Survey Response Analysis...................................................................................128
5.3.1. Response Rate ..............................................................................................128 5.3.2. Respondent and Demographic Profiles........................................................131 5.3.3. Non-response and Response Bias ................................................................132
5.4. Data Screening and Preliminary Analysis ...........................................................133 5.4.1. Overview......................................................................................................133 5.4.2. Missing Data ................................................................................................133
5.4.2.1. Non-eligible Respondents ....................................................................134 5.4.2.2. “Do not know” Response – IT Management Orientation section.......134
5.4.3. Assumptions Underlying Statistical Procedures ..........................................135 5.4.3.1. Normality of the Data ..........................................................................135 5.4.3.2. Sample Size and Power........................................................................136
5.4.4. Common Method Variance ..........................................................................136 5.5. Measurement Refinement and Initial Analysis ...................................................137
5.5.1. Validity and Reliability of Measures ...........................................................138 5.6. Exploratory Factor Analysis (EFA).....................................................................139
5.6.1. CRM Technology Adoption (CTA) - EFA ..................................................139 5.6.1.1. Final CTA 2-Factor Construct ............................................................141
5.6.2. Moderator Constructs: CXP and CRO.........................................................142 5.7. Confirmatory Factor Analysis and Measurement Model ....................................144
5.7.1. Convergent Validity .....................................................................................148 5.7.2. Discriminant Validity...................................................................................149
5.7.2.1. Final Measurement Model...................................................................150 5.8. Model Construction and Evaluation ....................................................................153
5.8.1. Measurement (Outer) Model........................................................................153 5.8.2. Structural (Inner) Model ..............................................................................155
5.8.2.1. Revised Model......................................................................................158 5.8.2.2. Model Fit .............................................................................................159
5.8.3. Direct Effects ...............................................................................................161 5.8.4. Total Effects .................................................................................................162 5.8.5. Moderator Effects ........................................................................................163
5.9. Hypothesis Testing ..............................................................................................163 5.10. Chapter Summary ................................................................................................165
CHAPTER 6. Discussion and Conclusions ...........................................................167 6.1. Introduction .........................................................................................................167 6.2. Effect of CRM Antecedents ................................................................................167
6.2.1. Market Orientation.......................................................................................168 6.2.2. IT Management Orientation.........................................................................169
6.3. Effects of CTA on Relationship Strength and Relationship Performance ..........170
- vii -
6.3.1. Relationship Strength...................................................................................171 6.3.2. Relationship Performance ............................................................................172 6.3.3. Moderator and Control Factors ....................................................................172
6.4. Research Implications and Contributions............................................................174 6.4.1. Contributions to Theory ...............................................................................174 6.4.2. Contributions to Methodology .....................................................................176
6.5. Managerial Implications ......................................................................................177 6.5.1. CRM Technology Adoption.........................................................................178 6.5.2. CRM Application Development ..................................................................179
6.6. Limitations of the Research Study.......................................................................179 6.7. Directions for Further Research ..........................................................................180 6.8. Conclusion ...........................................................................................................182
6.8.1. Closing Remarks ..........................................................................................183
Appendixes...................................................................................................................185 Appendix A1: Interview Protocols and Contact Summary Forms................................185 Appendix A2: Interview Data Display Summaries.......................................................198 Appendix A3: Scale Construction.................................................................................213 Appendix A4: Copies of Survey Questionnaires ..........................................................216
Supplier Questionnaire .............................................................................................216 Customer Questionnaire ...........................................................................................228
Appendix A5: Cover Letters .........................................................................................236 Personalised Supplier Cover Letter..........................................................................236 Generic Customer Cover Letter ...............................................................................237 Personalised Customer Cover Letter........................................................................238
Appendix A6: Summary of Supplier Respondent Demographic Information..............239 Appendix A7: Test for Non-response Bias ...................................................................242 Appendix A8: Analysis of Supplier “Do Not Know” Answers....................................245 Appendix A9: Survey Data Distribution.......................................................................247 Appendix A10: Measurement Item Loading on Composite Indicator Scales ..............251
References ....................................................................................................................252
- viii -
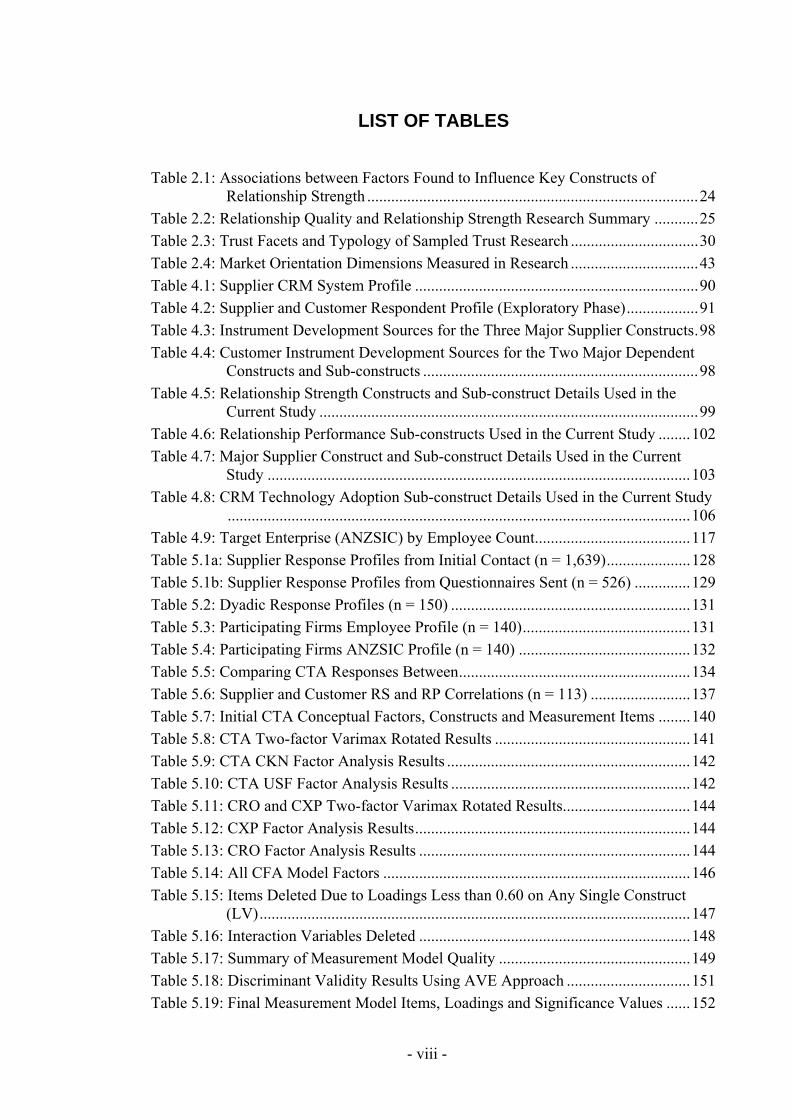
LIST OF TABLES
Table 2.1: Associations between Factors Found to Influence Key Constructs of Relationship Strength ...................................................................................24
Table 2.2: Relationship Quality and Relationship Strength Research Summary ...........25 Table 2.3: Trust Facets and Typology of Sampled Trust Research ................................30 Table 2.4: Market Orientation Dimensions Measured in Research ................................43 Table 4.1: Supplier CRM System Profile .......................................................................90 Table 4.2: Supplier and Customer Respondent Profile (Exploratory Phase)..................91 Table 4.3: Instrument Development Sources for the Three Major Supplier Constructs.98 Table 4.4: Customer Instrument Development Sources for the Two Major Dependent
Constructs and Sub-constructs .....................................................................98 Table 4.5: Relationship Strength Constructs and Sub-construct Details Used in the
Current Study ...............................................................................................99 Table 4.6: Relationship Performance Sub-constructs Used in the Current Study ........102 Table 4.7: Major Supplier Construct and Sub-construct Details Used in the Current
Study ..........................................................................................................103 Table 4.8: CRM Technology Adoption Sub-construct Details Used in the Current Study
....................................................................................................................106 Table 4.9: Target Enterprise (ANZSIC) by Employee Count.......................................117 Table 5.1a: Supplier Response Profiles from Initial Contact (n = 1,639).....................128 Table 5.1b: Supplier Response Profiles from Questionnaires Sent (n = 526) ..............129 Table 5.2: Dyadic Response Profiles (n = 150) ............................................................131 Table 5.3: Participating Firms Employee Profile (n = 140)..........................................131 Table 5.4: Participating Firms ANZSIC Profile (n = 140) ...........................................132 Table 5.5: Comparing CTA Responses Between..........................................................134 Table 5.6: Supplier and Customer RS and RP Correlations (n = 113) .........................137 Table 5.7: Initial CTA Conceptual Factors, Constructs and Measurement Items ........140 Table 5.8: CTA Two-factor Varimax Rotated Results .................................................141 Table 5.9: CTA CKN Factor Analysis Results .............................................................142 Table 5.10: CTA USF Factor Analysis Results ............................................................142 Table 5.11: CRO and CXP Two-factor Varimax Rotated Results................................144 Table 5.12: CXP Factor Analysis Results.....................................................................144 Table 5.13: CRO Factor Analysis Results ....................................................................144 Table 5.14: All CFA Model Factors .............................................................................146 Table 5.15: Items Deleted Due to Loadings Less than 0.60 on Any Single Construct
(LV)............................................................................................................147 Table 5.16: Interaction Variables Deleted ....................................................................148 Table 5.17: Summary of Measurement Model Quality ................................................149 Table 5.18: Discriminant Validity Results Using AVE Approach ...............................151 Table 5.19: Final Measurement Model Items, Loadings and Significance Values ......152

- ix -
Table 5.20: Constructs, Items and Composite Indicators .............................................154 Table 5.21: Composite Indicator Measurement Model Quality Results.......................155 Table 5.22: Composite Indicator Scales Discriminant Validity Using AVE Method ..156 Table 5.23: Inner Model Path Coefficients and Significance Level .............................157 Table 5.24: Revised Structural (Inner) Model Results .................................................159 Table 5.25: Q2 and R2 Blindfolding Results ................................................................160 Table 5.26: Total Effects...............................................................................................162 Table 5.27: Summary of Hypotheses Testing...............................................................164 Table A2.1: Interview Questionnaire Summary ...........................................................198 Table A2.2: Summary of CRM Technical Functionality Provided ..............................210 Table A2.3: Summary of CRM Functionality Implemented ........................................210 Table A2.4: CRM Integration Rating and Relationship Impact ...................................211 Table A2.5: Market Orientation Influence on CRM Technology Adoption.................211 Table A2.6: IT Management Orientation Influence on CRM Adoption.......................212 Table A3.1: Supplier Questionnaire Construction ........................................................213 Table A3.2: Customer Questionnaire Construction ......................................................215 Table A6.1: Respondent’s Gender ................................................................................239 Table A6.2: Reported Gross Revenues .........................................................................239 Table A6.3: Reported Work Experience.......................................................................239 Table A6.4: Reported Education Level.........................................................................239 Table A6.5: Respondent Age ........................................................................................239 Table A6.6: Reported Relationship Length ..................................................................240 Table A6.7: Reported Work Activity............................................................................241 Table A6.8: Reported Work Position/Title ...................................................................241 Table A7.1: Late Supplier Respondent Demographic Statistics...................................242 Table A7.2: Late Supplier Respondent CTA Response Statistics ................................242 Table A7.3: Comparing Late Supplier Respondent Demographics..............................243 Table A7.4: Comparing Late Supplier Respondent CTA Responses (n = 113) ...........244 Table A8.1: Supplier ‘Do Not Know’ Response Statistics (n = 150) ...........................245 Table A8.2: Comparing Supplier ‘Do Not Know’ Respondent CTA Construct
Responses (n = 115) ...................................................................................246 Table A9.1: Supplier Survey Data ................................................................................247 Table A9.2: Customer Survey Data ..............................................................................249
- x -
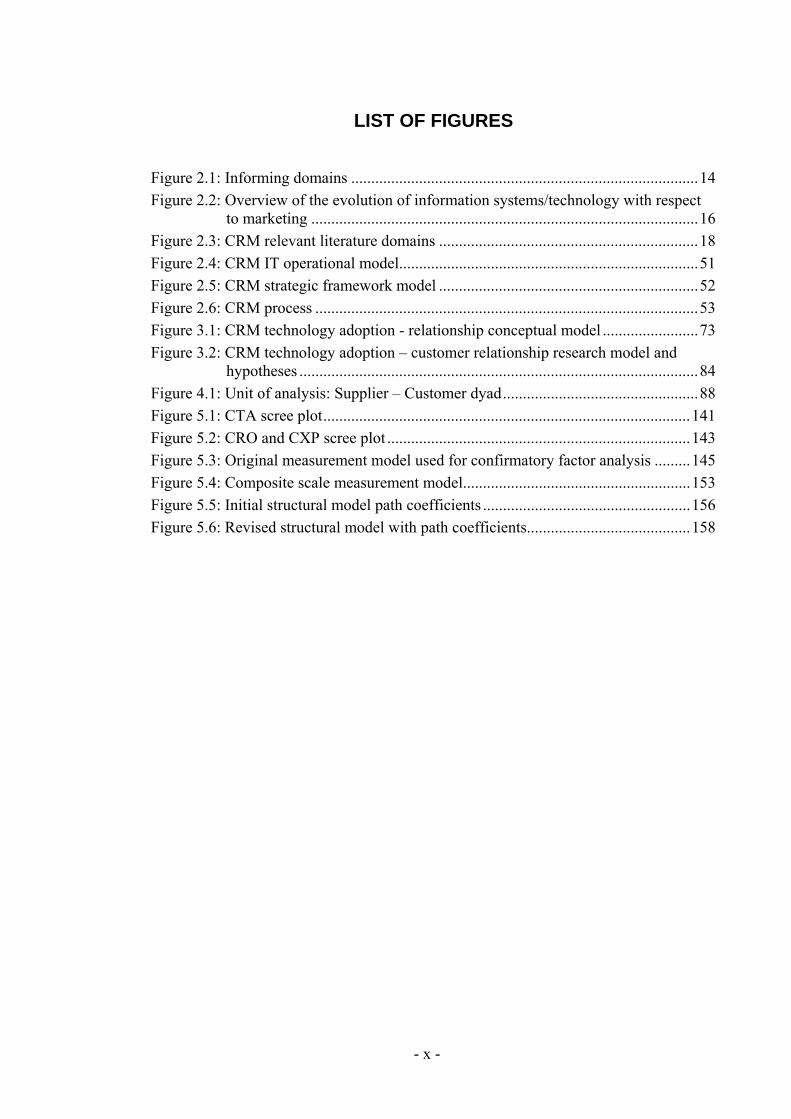
LIST OF FIGURES
Figure 2.1: Informing domains .......................................................................................14 Figure 2.2: Overview of the evolution of information systems/technology with respect
to marketing .................................................................................................16 Figure 2.3: CRM relevant literature domains .................................................................18 Figure 2.4: CRM IT operational model...........................................................................51 Figure 2.5: CRM strategic framework model .................................................................52 Figure 2.6: CRM process ................................................................................................53 Figure 3.1: CRM technology adoption - relationship conceptual model ........................73 Figure 3.2: CRM technology adoption – customer relationship research model and
hypotheses ....................................................................................................84 Figure 4.1: Unit of analysis: Supplier – Customer dyad.................................................88 Figure 5.1: CTA scree plot............................................................................................141 Figure 5.2: CRO and CXP scree plot ............................................................................143 Figure 5.3: Original measurement model used for confirmatory factor analysis .........145 Figure 5.4: Composite scale measurement model.........................................................153 Figure 5.5: Initial structural model path coefficients ....................................................156 Figure 5.6: Revised structural model with path coefficients.........................................158
- 1 -
CHAPTER 1. Introduction
With advances in technology, the proliferation of the Internet, and the emphasis on
one-to-one marketing techniques, customer relationship management (CRM) has
become a key focus of marketing (Palmatier, Gopalakrishna, & Houston, 2006; Payne
& Frow, 2005). Predicated on the views that (a) strong customer relationships are
important contributors to customer loyalty which leads in turn to corporate profitability
and (b) information technology contributes to building strong customer relationships,
CRM technology development and enterprise implementations have expanded at a
phenomenal rate (Chalmeta, 2006; Zablah, Bellenger, & Johnston, 2004). IDC (2004)
predicted that worldwide CRM applications market would reach US$11.4 billion in
revenues by 2008, compared to US$200 million in 1994, representing phenomenal
growth in CRM over the time period. Paradoxically, at the same time as investment has
increased, customer satisfaction ratings have continued to fall (Sweat & Hibbard, 1999).
Customer focus and relationship management have become fundamental marketing
and business philosophies for many companies seeking competitive advantage.
Establishing, maintaining and enhancing customer relationships have always been an
important aspect of business. However, over the last few years there has been a
significant increase in CRM related research (Kamakura et al., 2005; Ngai, 2005).
Although CRM is considered by many academics to be a business philosophy closely
related to relationship marketing, it is the link with technology that is particularly of
interest. Marketing academics have begun to explore and understand the linkage
between CRM technology, relationship marketing and business relationships as
providing opportunities for sustainable competitive advantage.
Improvements in technology enable businesses to implement CRM systems that can
create practical mass customization marketing programs, based on one-to-one marketing
techniques. This linkage between marketing and technology is viewed by some
academics as providing the opportunity to establish, cultivate and maintain long term,
mutually beneficial interactions with large numbers of customers in a cost-effective
manner (Peppers, Rogers, & Dorf, 1999; Reinartz & Kumar, 2000). By collecting past
customer transaction information, demographics, psychographics, media and channel
preferences, marketers hope to create personalized product and service offerings that
Chapter 1: Introduction
- 2 -
capture customer share, build customer loyalty and enhance profit (Niraj, Gupta, &
Narasimhan, 2001; Venkatesan & Kumar, 2004; Verhoef, 2003). CRM systems are seen
by some as an integral component of the information technology required to support and
improve the business “front-office” and the customer relationship experience (Ling &
Yen, 2001; Nguyen, Sherif, & Newby, 2007).
Despite these technological advances and high levels of investment CRM faces
serious difficulties and implementation failures (Arnold, 2002; Davids, 1999; Doherty
& Lockett, 2007; Ragowsky & Somers, 2002). CRM projects suffer from high failure
rates, resulting from a range of problems which include lack of corporate customer
focus, management commitment, change management, and people, technology and
process issues (Kale, 2004; Raman & Pashupati, 2004). It has been estimated that 55 -
80% of all CRM projects fail to produce results (Bush, Moore, & Rocco, 2005;
Seligman, 2002). A survey of 1,500 companies found that 91% of businesses plan to or
have deployed CRM technology, yet 41% of the firms with CRM projects were
experiencing significant problems (The Data Warehousing Institute, 2000). Davis
(2002) reported that many CRM implementations fail to meet fundamental business
goals; up to 70% of companies do not realize any benefit from CRM projects. Rigby,
Reichheld and Schefter (2002a) found that twenty percent of senior executives reported
that CRM initiatives had failed to deliver profitable growth. In some cases these
initiatives had been viewed to in fact have damaged existing customer relationships.
Such negative outcomes impact an organization’s ability to meet customer expectations,
build strong relationships and improve performance.
Despite the ongoing implementation problems to date, many academics and
practitioners continue to believe that CRM technology offers the potential for
substantial benefits to corporations through improved customer relationships, customer
retention, satisfaction and enhanced profitability (Bohling et al., 2006; Payne & Frow,
2005). The challenge many enterprises face is realising the considerable advantage
brought about by leveraging CRM technology and relationship marketing effectively
(Chalmeta, 2006; Ngai, 2005).
1.1. Background
Motivation for this thesis is driven by two trends in the marketing and information
technology (IT) environment. First, the growing requirement and acceptance in business
Chapter 1: Introduction
- 3 -
for marketing and IT to work closely together to deliver value to the organisation and
the customer (Ling & Yen, 2001; Nakata & Zhu, 2006; Rust & Espinoza, 2006).
Second, the growing importance of market orientation, and relationship marketing in
particular, as an effective organisational business strategy (Kohli & Jaworski, 1990;
Peppers & Rogers, 1993). With the rapid development of the Internet,e-commerce and
self-service customer support, there are increased expectations from customers for
improved, personalised service and immediacy (Beckett, Hewer, & Howcroft, 2000; M.
L. Roberts, 2003). This has prompted marketing practitioners to use technology to
capture and use customer information in order to better meet customer demands
(Álvarez, Martín, & Casielles, 2007; Peters & Fletcher, 2004b; Rust & Chung, 2006).
Customer relationships are considered superior to transactional exchange in their
ability to create sustainable competitive advantage and superior business performance
(Day, 2003). As a consequence, due to the impacts of globalisation and mass
customisation, there is an increased focus on IT to provide applications and
infrastructure in support of appropriate business-to-business customer relationships
(Day, 2000; Day & Montgomery, 1999; Kotler, 1989; O'Malley & Tynan, 2000;
Reinartz, Krafft, & Hoyer, 2004; J. S. Thomas, Blattberg, & Fox, 2004). The marketing,
management, IT, and practitioner literature make numerous references to CRM’s impact
on business orientation and performance (Almquist, Heaton, & Hall, 2002; Goodhue,
Wixom, & Watson, 2002; Palmatier et al., 2006; Rigby & Ledingham, 2004). Yet the
increased adoption of CRM systems to help manage customer information and
knowledge is perceived by some practitioners and researchers as not delivering proven
business value (IDC, 2004; Raman & Pashupati, 2004). Business-to-business (also
known as B2B and industrial buyer-seller) relationships have generally been the focus
of relationship marketing research because B2B relationships are considered more
regular, formal, constructive, and intense (Kong & Mayo, 1993; Peterson, 1995).
Business interactions, and B2B relational exchanges in particular, progress over a
period of time, from initial introduction through contractual negotiations and delivery of
promises, reflecting an ongoing process (K. Roberts, Varki, & Brodie, 2003). As well,
B2B relationships are considered to be based on rational behaviour and mutual
acceptance of reciprocity with a strong likelihood of shared benefits and burdens
(Dwyer, Schurr, & Oh, 1987), whereas consumer buyer behaviour is more emotional,
less routine or regular, and largely non-negotiable (Stern, 1997). B2B relationships are
Chapter 1: Introduction
- 4 -
closer, more intense, regular and interactive than consumer (B2C) relationships (Kong
& Mayo, 1993). The key difference between the two is the necessity and value of the
B2B exchanges; there are dependencies and the potential for competitive advantage, as
well as social and attitudinal dimensions from the buyer’s perspective (Palmer, 2007;
Sheth & Parvatiyar, 2000). For these reasons B2B relationships are the focus of this
study.
Close links between the marketing and IT departments are viewed by some as a
prerequisite for the successful implementation of CRM (Ling & Yen, 2001). However
as a consequence of different success criteria, the marketing, management and IT
disciplines have their own separate and distinct views of what constitutes successful
CRM implementation (Bose, 2002; B. A. Corner, 2002; Crosby & Johnson, 2001;
Lemon, White, & Winer, 2002; Reinartz et al., 2004). For example, measures of IT
success include system and information quality, use (i.e., task-technology fit), and user
satisfaction (DeLone & McLean, 1992, 2003; Goodhue, 1995). Whereas marketing
success is predominately measured through business performance (Kamakura, Mittal,
Rosa, & Mazzon, 2002), increasing profits (Reinartz & Kumar, 2000), capturing
additional customers, implementing marketing programs (Verhoef, 2003), improving
market share and delivering the right product (Kotler, 2003; Moorman & Rust, 1999).
Differences in CRM technology adoption and outcomes may also reflect the firm’s
information technology management and market orientation (Karimi, Somers, & Gupta,
2001).
CRM is not therefore easy to define, as it holds different meanings for different
people. This will be discussed further in Chapter 2. Some researchers consider customer
relationship management (CRM) a business strategy (Day, 2003), while others view
CRM as an organisational culture, focused on creating quality (profitable) relationships
with customers (Ngai, 2005; Romano & Fjermestad, 2003) . Still others believe that
CRM is a technology which provides a comprehensive, reliable and integrated view of
customers, delivering seamless personalised service through all customer touchpoints
(Zikmund, McLeod, & Gilbert, 2003). The use of technology generally, as an aid to
marketing (Shoemaker, 2001; Speier & Venkatesh, 2002), along with the value of CRM
specifically to relationship and business performance, have been examined with mixed
results (Croteau & Li, 2003; Stefanou, Sarmaniotis, & Stafyla, 2003). However, the
research does seem clear in indicating that the firm’s initial customer focus and

Chapter 1: Introduction
- 5 -
orientation may be a key antecedent to CRM success (Wright, Stone, & Abbott, 2002).
The ability of a firm to understand and use technology appropriately raises an additional
set of issues and may also contribute to the mixed reviews in the literature of the value
of CRM technology (Karimi et al., 2001).
Underlying the growing acceptance and adoption of CRM in business are the
concepts of market orientation and relationship marketing. Market orientation is a
business philosophy that focuses the firm’s resources on gathering, collecting,
analysing, disseminating and responding to customer and competitor information in
order to provide superior customer value (Kerin, Berkowitz, Hartley, & Rudelius, 2003;
Mitussis, O'Malley, & Patterson, 2006; Pelham, 1997). Relationship marketing builds
from a market orientation approach and encompasses the concept of establishing,
maintaining, enhancing and commercialising customer relationships in order to achieve
mutual objectives (Grönroos, 1990). Both market orientation and relationship marketing
have been the subject of significant amounts of research (Adamson, Chan, & Handford,
2003; Grönroos, 1995; Gummesson, 1994a; Kohli, Jaworski, & Kumar, 1993; Narver &
Slater, 1990). The majority of these marketing studies have indicated a positive effect of
market orientation and marketing relationships on business performance (Crosby &
Stephens, 1987).
Relationship marketing researchers have focused on what constitutes B2B
relationships – how they are created, enhanced and sustained – in an effort to
understand relationships between customers and vendors (J. C. Anderson & Narus,
1990; Dwyer et al., 1987). Key dimensions of relationships include trust, commitment
and communications, although a range of other factors also influences the development
and maintenance of relationships (Morgan & Hunt, 1994). CRM itself is viewed by
some researchers as a practical application of relationship marketing (Gummesson,
2004). Yet the linkage between CRM and these key dimensions of customer
relationships is tenuous due to the lack of empirical research (Gummesson, 2004;
Reinartz et al., 2004). It appears from the extant literature that marketing practitioners
predominantly use CRM technology to capture and manipulate customer data in order to
prioritise and target profitable customers through integrated marketing programmes
rather than to focus on developing and maintaining relationships (Goodhue et al., 2002;
Romano, 2000).
Chapter 1: Introduction
- 6 -
The literature is not explicit that CRM technology implementation has been fully
detailed or understood by organisations, let alone in a New Zealand context (Ngai,
2005; Raman & Pashupati, 2004). CRM involves IT to a significant degree, yet little
research exists on the design, use or success of systems to support CRM from the
marketing perspective (Reinartz et al., 2004). Introducing CRM is a major IT and
management undertaking for any organisation; key variables have not yet been clearly
identified, nor do current theories fully explain the behaviour of stakeholders or
organisations following CRM implementation (Chalmeta, 2006; Hughes, 2002; Ling &
Yen, 2001). The limited number of CRM-specific empirical studies and theories
available today needs to be expanded and the subject explored further (Goodhue et al.,
2002; Romano, 2000).
CRM research is still considered by many researchers as limited in scope and depth,
reflected in the lack of empirical and generalisable research (Gummesson, 2004; H.-W.
Kim, Lee, & Pan, 2002; Reinartz et al., 2004; Romano & Fjermestad, 2003; Stefanou et
al., 2003). Much of the IT-related research is focused on the functional aspects of
implementation and there continues to be a call for additional research in order to
understand, explain and benefit from the CRM phenomenon (Doherty & Lockett, 2007;
Payne & Frow, 2006; Reinartz et al., 2004; Romano, 2000). The fundamental research
problem these issues and trends evoke is outlined below.
1.2. Research Problem
The fundamental problem is the exceptionally poor business performance from CRM
implementations (Raman & Pashupati, 2004). Prior marketing and IT research indicates
that CRM applications are not uniformly delivering anticipated business improvements
(Reinartz et al., 2004), and that the problem may stem from factors such as lack of
customer orientation (Rigby et al., 2002a), IT management practice (Karimi et al., 2001)
and issues around people, process and technology (Ling & Yen, 2001). Furthermore the
available IT and marketing research indicates that customers may be suspicious of CRM
implementations (Bhattacherjee, 2002; Hoffman, Novak, & Peralta, 1999) and that
CRM applications may not actually assist in the creation or maintenance of customer
relationships (Peters & Fletcher, 2004a). One of the issues leading to confusion in the
research is the lack of an agreed CRM definition of what constitutes CRM and how the
outcomes are determined and measured. This leads us to the research question:
Chapter 1: Introduction
- 7 -
What is the impact of CRM technology adoption on B2B customer
relationships?
1.3. Research Objectives
The objectives of this research are to:
• Determine whether CRM technology adoption has a positive effect on
business-to-business relationships and the extent of that impact,
• Determine whether the supplier firm’s market orientation and technology
orientation has a positive effect on CRM technology adoption and the extent of
that impact,
• Contribute to the current marketing and IT literature on CRM technology and
relationship marketing,
• Inform CRM practitioners engaged in CRM implementation and software
development.
1.4. Conceptualisation
Based on an extensive review of the market orientation, relationship marketing and
IT literature it is proposed that CRM technology adoption has a strong positive effect on
customer relationship development and maintenance. In addition the firm’s initial
market orientation and IT management orientation is considered to positively affect the
successful adoption of CRM technology within the firm. A brief description of the key
constructs and variables follow, a more detailed discussion of the model constructs and
sub-constructs can be found in Chapter 3.
The market orientation (MO) of the firm and IT management orientation (ITMO)
(i.e., IT management practices) of the firm are considered to have positive effects on
CRM technology adoption. Based on the existing literature MO is viewed as positively
influencing the strength of the customer relationship. The CRM technology adoption
(CTA) construct is positively linked to customer relationship strength and relationship
performance. The dependent variables are relationship strength, and relationship
performance. Relationship strength is also considered to positively affect relationship
performance.
The conceptualisation of the CRM technology adoption – customer relationship
(CTA – CR) linkage is used to address how CRM technology adoption affects the
Chapter 1: Introduction
- 8 -
ability of firms to create, enhance, and sustain customer relationships in terms of the
impact of CRM technology on key relationship constructs and relationship performance.
Each linkage between the key constructs will be framed as a specific hypothesis, to be
tested with the research data. The justification for, and wording of, each specific
hypothesis is provided in Chapter 3.
1.5. Research Methodology
In order to accomplish the stated objectives, a conceptual model was developed,
tested and validated using instruments designed to measure CRM technology adoption,
relationship strength, relationship performance and potential interrelationships. A two
phase, cross-sectional design was used for this study (Creswell, 2003). The first phase
was exploratory using a multiple case design as described by Miles and Huberman
(1994), and Yin (2003) to: (a) better understand the CRM technology – B2B
relationship phenomenon, (b) further verify and refine the conceptual model, (c) inform
the scale development and (d) inform the interpretation of the survey results. Key
informants from medium and large New Zealand businesses were invited to participate
in one-on-one interviews to discuss CRM technology impact on B2B relationships. In
separate interviews customer contacts, provided by the firms, were interviewed for their
perspective on the B2B relationships. Insights gained from these interviews were used
to refine the research model, and to confirm and adjust the hypotheses. In phase two
survey instruments were developed and pre-tested in order to proceed with the
explanatory phase of the study. Once the conceptual model and research instruments
were finalised and verified a mail survey was implemented so as to empirically test the
explanatory capabilities of the conceptual model, across a number of different
businesses and industries within New Zealand.
The results of the survey were analysed using exploratory factor analysis (EFA) with
SPSS. The partial least squares technique of structural equation modelling was used to
confirm the measurement model and test the hypotheses.
1.6. Delimitations of the Study
The domain of relationships and related constructs extends into psychology, social
science, and organisational behaviour, including various aspects of marketing, business,
and IT (Kingshott, 2004; K. Roberts et al., 2003). The intent of this study is to better
understand and attempt to explain the impact of CRM technology adoption on
Chapter 1: Introduction
- 9 -
relationships in the context of business-to-business (B2B) since the existence and
importance of B2B relationship dynamics are well structured, documented and
supported in the literature (e.g., Grönroos, 1989).
Business relationships and relationship dynamics are complex and consist of a
number of dimensions (Fontenot & Wilson, 1997). Ongoing research efforts continue to
identify additional business relationship elements, antecedents and influencing factors
(Palmatier et al., 2006; Palmatier, Scheer, Houston, Evans, & Gopalakrishna, 2007). In
the development of quality relationships trust, commitment and communications quality
play a significant role. These three attributes are considered by many RM researchers as
fundamental to relationship building (e.g., Medlin, Aurifeille, & Quester, 2005; Morgan
& Hunt, 1994). For this reason the study centres in particular on the relationship
attributes of trust, commitment and communications quality. It is beyond the scope of
this research to investigate the potential effects of CRM on the myriad of additional
relationship attributes.
1.7. Importance and Value of the Research
1.7.1. Importance of the Research
The importance of CRM research is emphasised by the continued academic and
practitioner focus on relationship marketing (RM), and CRM in particular. The
Industrial Marketing Management (IMM) journal devoted a special issue to relationship
management titled “Transactions, Relationships or Both: Impact of Customer Strategies
on Firm Performance” in November 2003. They also prepared a special issue on
customer relationship management in August 2004. The Journal of Customer Behaviour
produced a special issue on CRM in the spring of 2004. In addition the Journal of
Marketing published a Special Issue on CRM in October 2005. However the Journal of
Marketing Management’s (JMM) July 1997 special issue on Relationship Marketing did
not include any articles referencing CRM specifically, indicating CRM was not viewed
as a marketing focus at that time.
The Marketing Science Institute (MSI), founded in 1961, leads the way in
developing rigorous and relevant knowledge by bringing together marketing scholars
and corporate executives. They provide funding, an open environment for, and access to
leading-edge marketing knowledge. MSI is widely acknowledged as a leader for
marketing research prioritisation for both practitioners and academics. The MSI, in their

Chapter 1: Introduction
- 10 -
research priorities for 2004 – 2006 and again for 2007 – 2009, identified customer
management as a key community of interest, and managing customers as a top tier
priority topic. The MSI community awards top tier research priorities to those areas
deemed most deserving of intensive research. Implementing and assessing the impact of
CRM has been prioritised as one of the top six topics most important to the Customer
Management community. This follows from MSI’s 2002 – 2004 research priorities
where CRM, and managing customer relations, were identified as two of the top five
topics of interest for research.
1.7.2. Value of the Research for Academics
A key contribution is a fuller exploration of the linkage between CRM and
contemporary relationship marketing theory. Existing literature implies a relationship
between CRM and RM (e.g., Gummesson, 2004; Mitussis et al., 2006), but there is little
published empirical CRM research in this area. In addition it is important to further
expand, explore and explain the links between RM theories and CRM application.
The primary contribution of this research is the conceptualisation and empirical
testing of CRM technology impacts on B2B relationships, and the operationalisation
and measurement of CRM technology adoption within firms. Developing a measure of
the impact of CRM adoption on B2B relationships provides an empirical method for
academics to better understand and predict the relationship between CRM and RM.
Measuring CRM technology adoption provides the ability to determine whether more
intense CRM technology adoption leads to better customer relationships and improved
relationship performance.
1.7.3. Value of the Research for Practitioners
Application developers, marketing and IT practitioners benefit from better
understanding the factors that affect relationships that can be created and maintained
through CRM technologies. In particular, CRM vendors benefit from understanding
how CRM technology adoption affects customer relationships, and how key attributes
around B2B relationships may be developed and better supported by CRM applications.
Marketing and IT practitioners ought to benefit from a better understanding of the
relationship between CRM adoption (i.e., type of CRM technology, integration and
acceptance), and customer relationship performance. This enhanced understanding
should assist management decision-making when evaluating CRM technology. An
Chapter 1: Introduction
- 11 -
empirical method to study the effect of CRM technology adoption on customers’
outcomes may provide additional insight for CRM applications and strategies. CRM
applications can be developed that are beneficial to relationship building in particular
and marketing more generally.
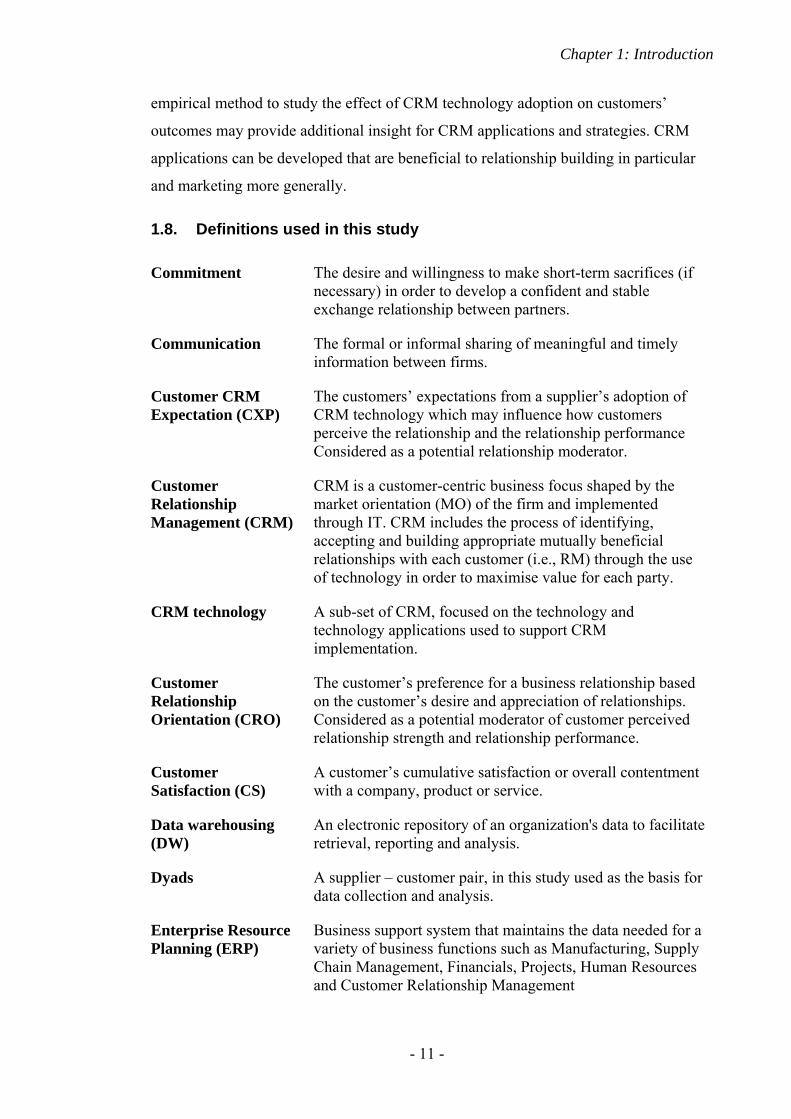
1.8. Definitions used in this study
Commitment The desire and willingness to make short-term sacrifices (if necessary) in order to develop a confident and stable exchange relationship between partners.
Communication The formal or informal sharing of meaningful and timely information between firms.
Customer CRM Expectation (CXP)
The customers’ expectations from a supplier’s adoption of CRM technology which may influence how customers perceive the relationship and the relationship performance Considered as a potential relationship moderator.
Customer Relationship Management (CRM)
CRM is a customer-centric business focus shaped by the market orientation (MO) of the firm and implemented through IT. CRM includes the process of identifying, accepting and building appropriate mutually beneficial relationships with each customer (i.e., RM) through the use of technology in order to maximise value for each party.
CRM technology A sub-set of CRM, focused on the technology and technology applications used to support CRM implementation.
Customer Relationship Orientation (CRO)
The customer’s preference for a business relationship based on the customer’s desire and appreciation of relationships. Considered as a potential moderator of customer perceived relationship strength and relationship performance.
Customer Satisfaction (CS)
A customer’s cumulative satisfaction or overall contentment with a company, product or service.
Data warehousing (DW)
An electronic repository of an organization's data to facilitate retrieval, reporting and analysis.
Dyads A supplier – customer pair, in this study used as the basis for data collection and analysis.
Enterprise Resource Planning (ERP)
Business support system that maintains the data needed for a variety of business functions such as Manufacturing, Supply Chain Management, Financials, Projects, Human Resources and Customer Relationship Management
Chapter 1: Introduction
- 12 -
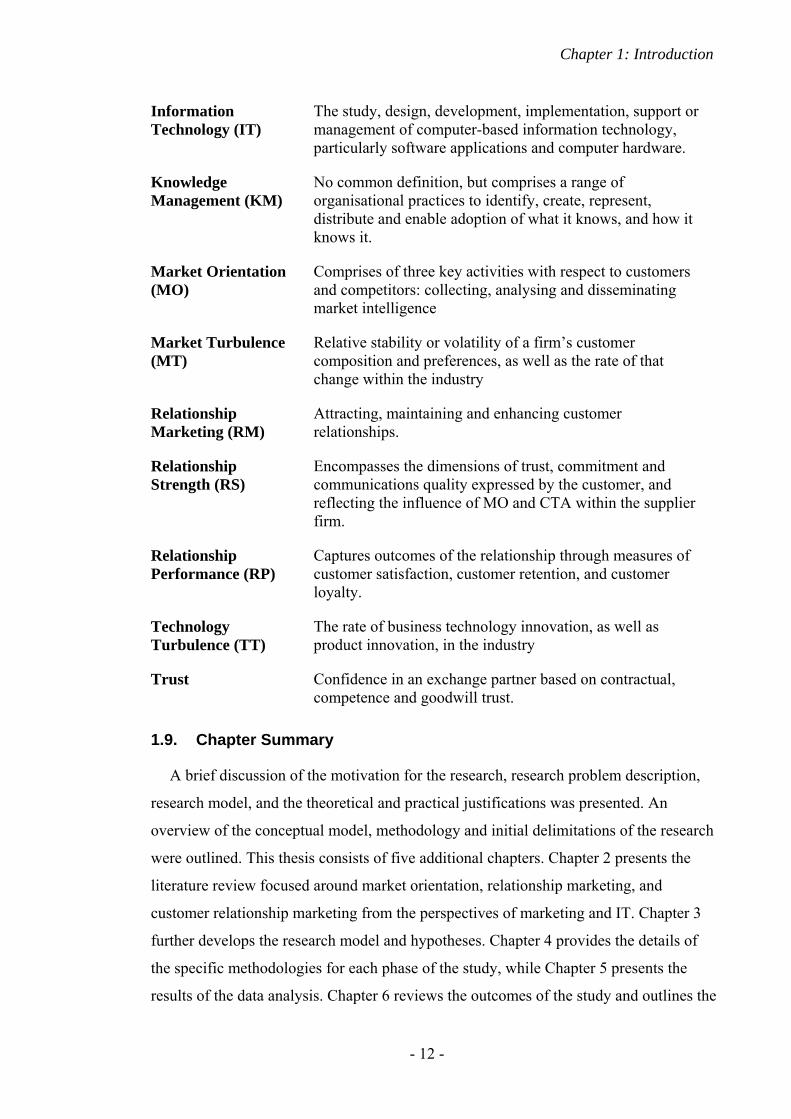
Information Technology (IT)
The study, design, development, implementation, support or management of computer-based information technology, particularly software applications and computer hardware.
Knowledge Management (KM)
No common definition, but comprises a range of organisational practices to identify, create, represent, distribute and enable adoption of what it knows, and how it knows it.
Market Orientation (MO)
Comprises of three key activities with respect to customers and competitors: collecting, analysing and disseminating market intelligence
Market Turbulence (MT)
Relative stability or volatility of a firm’s customer composition and preferences, as well as the rate of that change within the industry
Relationship Marketing (RM)
Attracting, maintaining and enhancing customer relationships.
Relationship Strength (RS)
Encompasses the dimensions of trust, commitment and communications quality expressed by the customer, and reflecting the influence of MO and CTA within the supplier firm.
Relationship Performance (RP)
Captures outcomes of the relationship through measures of customer satisfaction, customer retention, and customer loyalty.
Technology Turbulence (TT)
The rate of business technology innovation, as well as product innovation, in the industry
Trust Confidence in an exchange partner based on contractual, competence and goodwill trust.
1.9. Chapter Summary
A brief discussion of the motivation for the research, research problem description,
research model, and the theoretical and practical justifications was presented. An
overview of the conceptual model, methodology and initial delimitations of the research
were outlined. This thesis consists of five additional chapters. Chapter 2 presents the
literature review focused around market orientation, relationship marketing, and
customer relationship marketing from the perspectives of marketing and IT. Chapter 3
further develops the research model and hypotheses. Chapter 4 provides the details of
the specific methodologies for each phase of the study, while Chapter 5 presents the
results of the data analysis. Chapter 6 reviews the outcomes of the study and outlines the

Chapter 1: Introduction
- 13 -
discussion and conclusions, including limitations and areas for future research.
Appendices and references follow Chapter 6.
- 14 -
CHAPTER 2. Literature Review
2.1. Introduction
Given the multidisciplinary nature of CRM research it is important to review the
literature from the pertinent disciplines that structure this investigation. This chapter
reviews the major streams of literature in the marketing and information technology (IT)
domains which relate to CRM, summarises the main research approaches and findings,
and identifies gaps in the research. In order to establish the theoretical foundations of
this research the chapter begins by looking at the relationship between IT and marketing
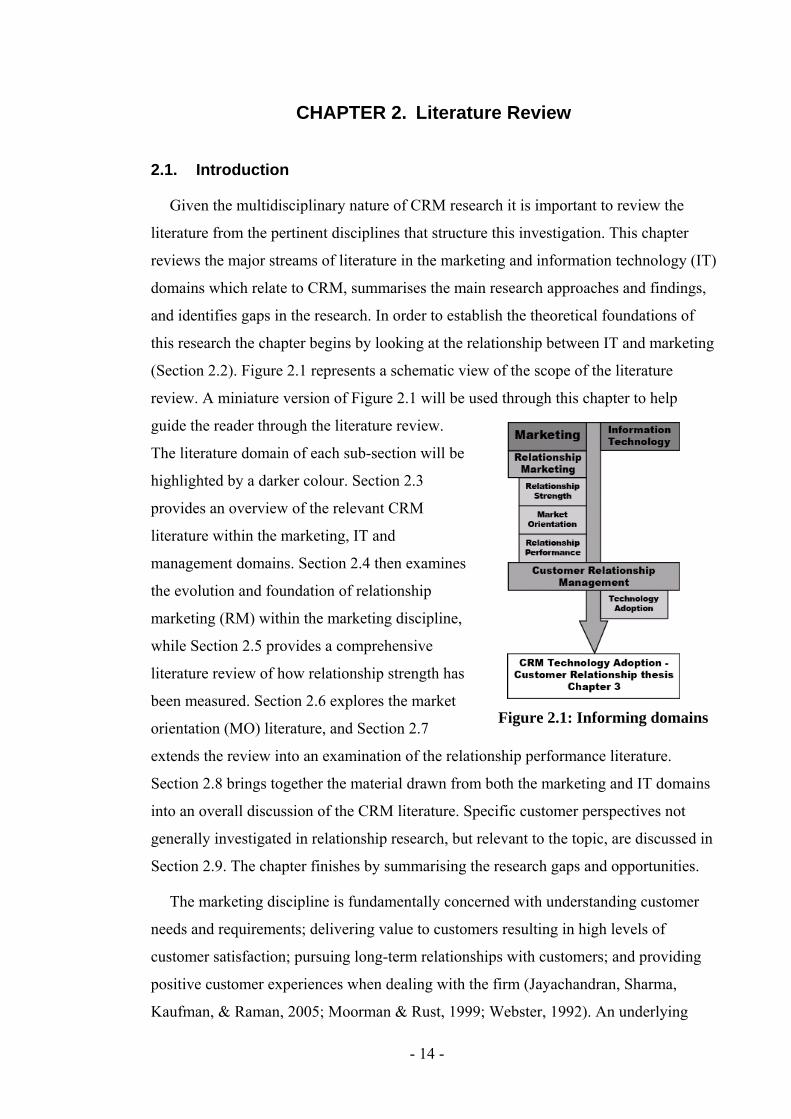
(Section 2.2). Figure 2.1 represents a schematic view of the scope of the literature
review. A miniature version of Figure 2.1 will be used through this chapter to help
guide the reader through the literature review.
The literature domain of each sub-section will be
highlighted by a darker colour. Section 2.3
provides an overview of the relevant CRM
literature within the marketing, IT and
management domains. Section 2.4 then examines
the evolution and foundation of relationship
marketing (RM) within the marketing discipline,
while Section 2.5 provides a comprehensive
literature review of how relationship strength has
been measured. Section 2.6 explores the market
orientation (MO) literature, and Section 2.7
extends the review into an examination of the relationship performance literature.
Section 2.8 brings together the material drawn from both the marketing and IT domains
into an overall discussion of the CRM literature. Specific customer perspectives not
generally investigated in relationship research, but relevant to the topic, are discussed in
Section 2.9. The chapter finishes by summarising the research gaps and opportunities.
The marketing discipline is fundamentally concerned with understanding customer
needs and requirements; delivering value to customers resulting in high levels of
customer satisfaction; pursuing long-term relationships with customers; and providing
positive customer experiences when dealing with the firm (Jayachandran, Sharma,
Kaufman, & Raman, 2005; Moorman & Rust, 1999; Webster, 1992). An underlying
Figure 2.1: Informing domains
Chapter 2: Literature Review
- 15 -
premise is that relationship marketing provides value for the firm and is an essential
element of the marketing concept (Grönroos, 1989; Morgan & Hunt, 1994; Reichheld,
1996). Businesses engaged in relationship marketing create and develop profitable
exchange relationships with customers over time. This implies that long-term
relationships with customers are better than short-term transactional exchanges,
particularly in the B2B environment (Berry, 1983; Grönroos, 1990; Raman &
Pashupati, 2004).
Information technology is concerned with the use, design, development,
implementation and support of computer-based information systems. This includes the
secure collection, storage, protection, transmission and retrieval of information (Turban,
McLean, & Wetherbe, 2003). IT attempts to provide both strategic and operational
value to businesses (DeJarnett, Laskey, & Trainor, 2004; J. C. Henderson &
Venkatraman, 1999; Leek, Turnbull, & Naude, 2003; Zinkhan, Joachimsthaler, &
Kinnear, 1987). It is concerned with the use and adoption of technology (e.g., Compeau,
Higgins, & Huff, 1999; F. D. Davis, 1989), critical aspects of technology
implementation (Brown & Vessey, 2003; Natovich, 2002; Nguyen et al., 2007), and the
strategic role of IT within businesses (Chan, Huff, Barclay, & Copeland, 1997; Enns,
Huff, & Higgins, 2003; Johnston & Carrico, 1988; Tallon, Kraemer, & Gurbaxani,
2000). IT provides the specific technology to implement one-to-one CRM applications
and techniques on a large scale which are of benefit to firms, individuals and customers
(Greenberg, 2002; Romano & Fjermestad, 2003).
The relationship marketing (RM) and technology adoption literatures contribute to
the theoretical foundation for CRM research, and CRM can be viewed as a practical
implementation of RM theory, with emphasis on one-to-one marketing techniques
enabled through technology (Buttle, 2004; F. D. Davis, 1989; Doherty & Lockett, 2007;
Gummesson, 2004; Ryals & Knox, 2001). The focus of this research is to understand
and model the impact of CRM technology adoption on B2B relationships. Settling on a
working definition of CRM is not straightforward, and will be discussed at length in this
chapter, as a prelude to the development of the formal research model.
Chapter 2: Literature Review
- 16 -
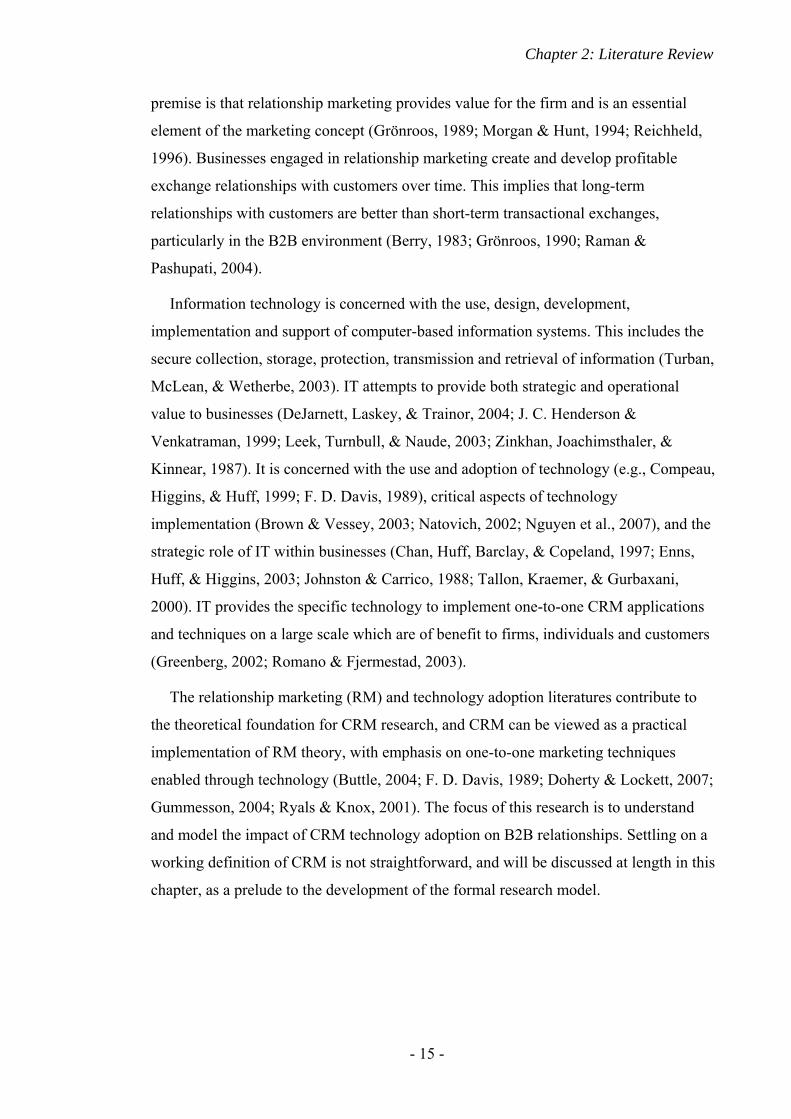
2.2. Relationship between Information Technology and Marketing
Marketing’s association with and utilisation of IT began around
the mid 1960s when the likely impact of massive data-processing
capabilities on business practice was first considered (E. Y. Li,
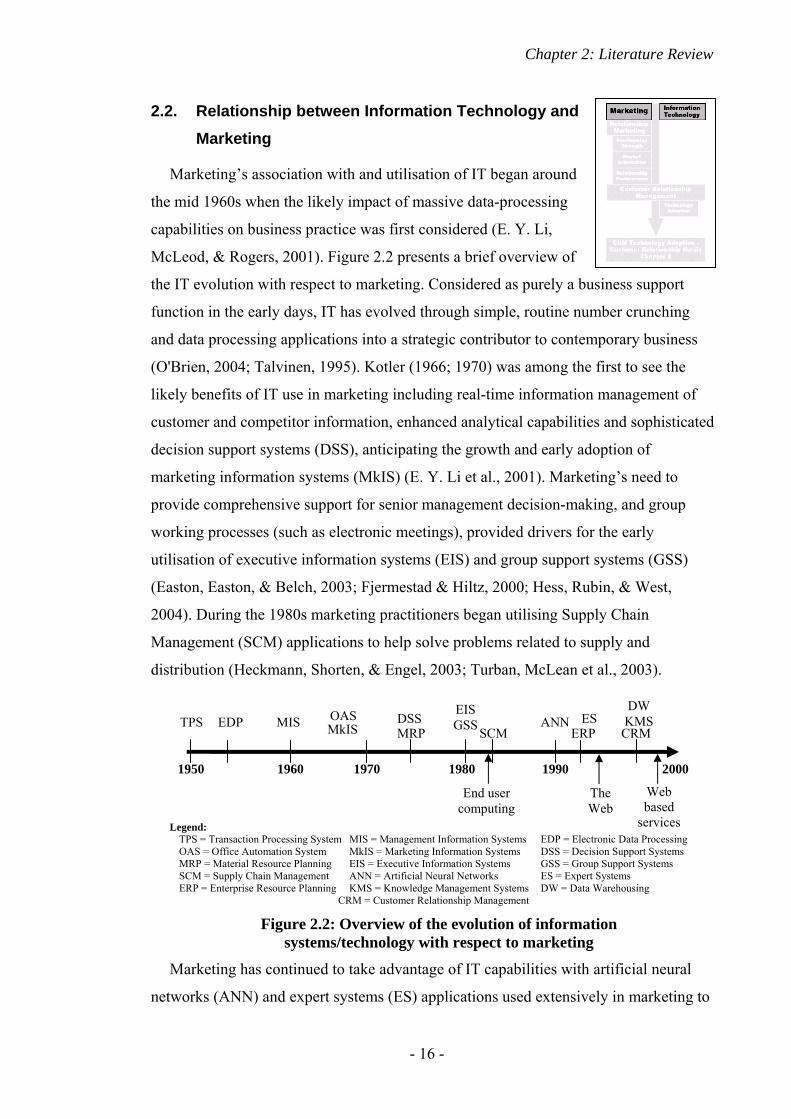
McLeod, & Rogers, 2001). Figure 2.2 presents a brief overview of
the IT evolution with respect to marketing. Considered as purely a business support
function in the early days, IT has evolved through simple, routine number crunching
and data processing applications into a strategic contributor to contemporary business
(O'Brien, 2004; Talvinen, 1995). Kotler (1966; 1970) was among the first to see the
likely benefits of IT use in marketing including real-time information management of
customer and competitor information, enhanced analytical capabilities and sophisticated
decision support systems (DSS), anticipating the growth and early adoption of
marketing information systems (MkIS) (E. Y. Li et al., 2001). Marketing’s need to
provide comprehensive support for senior management decision-making, and group
working processes (such as electronic meetings), provided drivers for the early
utilisation of executive information systems (EIS) and group support systems (GSS)
(Easton, Easton, & Belch, 2003; Fjermestad & Hiltz, 2000; Hess, Rubin, & West,
2004). During the 1980s marketing practitioners began utilising Supply Chain
Management (SCM) applications to help solve problems related to supply and
distribution (Heckmann, Shorten, & Engel, 2003; Turban, McLean et al., 2003).
Marketing has continued to take advantage of IT capabilities with artificial neural
networks (ANN) and expert systems (ES) applications used extensively in marketing to
Legend: TPS = Transaction Processing System MIS = Management Information Systems EDP = Electronic Data Processing OAS = Office Automation System MkIS = Marketing Information Systems DSS = Decision Support Systems MRP = Material Resource Planning EIS = Executive Information Systems GSS = Group Support Systems SCM = Supply Chain Management ANN = Artificial Neural Networks ES = Expert Systems ERP = Enterprise Resource Planning KMS = Knowledge Management Systems DW = Data Warehousing
CRM = Customer Relationship Management
Figure 2.2: Overview of the evolution of information systems/technology with respect to marketing
1950 1960 1970 1980 1990 2000
TPS MIS OAS DSS EIS GSS
End user computing
The Web
DW KMS
Web based
services
ERP CRM MkIS MRP EDP ANN ES
SCM
Chapter 2: Literature Review
- 17 -
help analyse and supplement customer self-service centres and web-based service
initiatives (Boone & Roehm, 2002; Fish & Segall, 2004; S. Li, Davies, Edwards,
Kinman, & Duan, 2002; Moghrabi & Eid, 1998; O'Brien, 2004; R. W. Stone & Good,
1995; Turban, McLean et al., 2003; Venugopal & Baets, 1994). Enterprise Resource
Planning (ERP) provides integrated real-time solutions across all business processes,
allowing companies to focus on their internal processes to improve efficiencies, quality
and profitability (Turban, Rainer, & Potter, 2003). Data warehousing (DW) is
considered a critical component of CRM – sometimes termed the CRM engine – while
data mining is the process of extracting information from data warehouses, looking for
previously unknown information, for use by applications such as CRM (Greenberg,
2002; Nairn, 2002; Turban, Rainer et al., 2003; Wells & Hess, 2002).
Notwithstanding the extensive history, the IT and marketing relationship can be
strained due to such factors as organisational cultural disparity between IT and
marketing, differing key performance indicators (both implicit and explicit), and
misaligned perceptions of system usability (I. Corner & Hinton, 2002). Despite the
difficulties, there continues to be a need for IT and marketing departments to actively
work together to develop comprehensive and integrated business strategies, support
management decision making, create sustainable competitive advantage, and generate
real-time market research applications (Demirdjian, 2003; Ling & Yen, 2001). As
technologies continue to converge over time, their need will become even greater.
2.3. Overview of the Relevant CRM Literature
CRM applications are relatively new to the business world, conceived in the 1980s,
but only attaining marketing prominence in the late 1990s primarily due to advances in
information technology, data management systems, improved analytics, enhanced
communications, systems integration and the rapid adoption of the Internet (Berry,
1995; Bose, 2002; Greenberg, 2002). The adoption of such technologies provides
efficiencies for business change initiated by customer demand for customised, personal
service. By collecting past customer transaction information, demographics,
psychographics, media and channel preferences marketers hope to create personalised
product and service offers that capture customer share, build customer loyalty and
enhance profit over time (Kotler, 2003; Ling & Yen, 2001; Reichheld, 1996).
Chapter 2: Literature Review
- 18 -
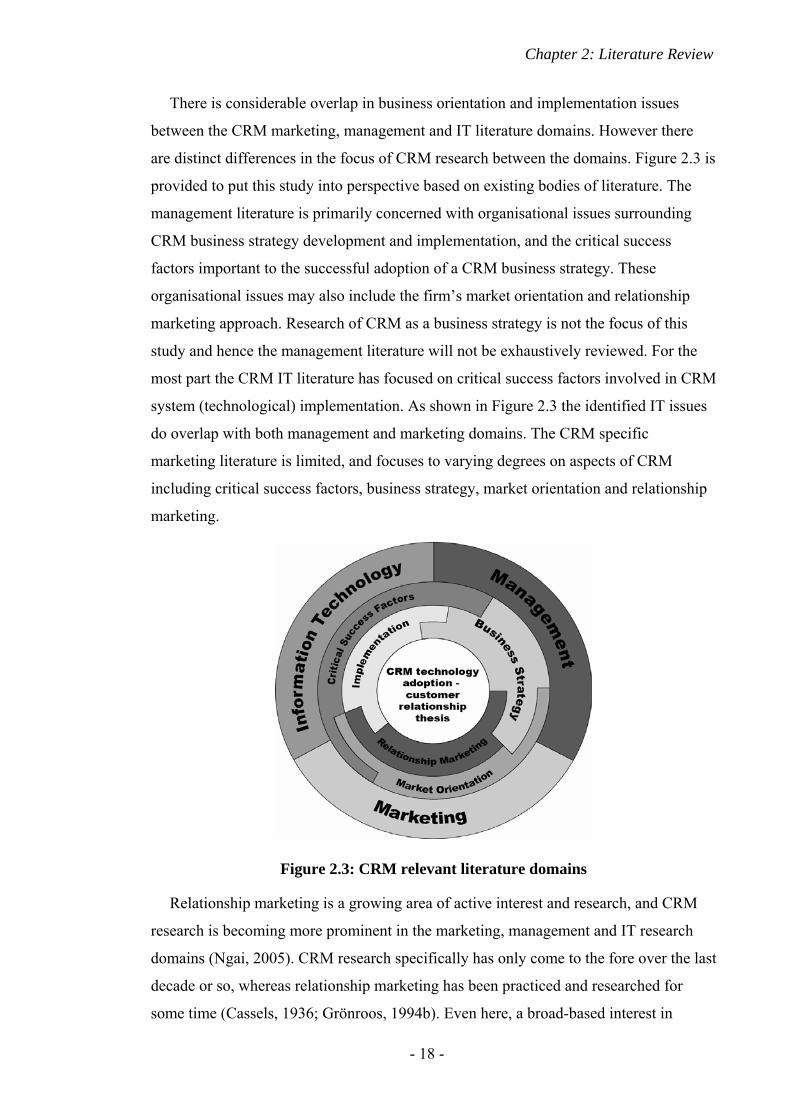
There is considerable overlap in business orientation and implementation issues
between the CRM marketing, management and IT literature domains. However there
are distinct differences in the focus of CRM research between the domains. Figure 2.3 is
provided to put this study into perspective based on existing bodies of literature. The
management literature is primarily concerned with organisational issues surrounding
CRM business strategy development and implementation, and the critical success
factors important to the successful adoption of a CRM business strategy. These
organisational issues may also include the firm’s market orientation and relationship
marketing approach. Research of CRM as a business strategy is not the focus of this
study and hence the management literature will not be exhaustively reviewed. For the
most part the CRM IT literature has focused on critical success factors involved in CRM
system (technological) implementation. As shown in Figure 2.3 the identified IT issues
do overlap with both management and marketing domains. The CRM specific
marketing literature is limited, and focuses to varying degrees on aspects of CRM
including critical success factors, business strategy, market orientation and relationship
marketing.
Relationship marketing is a growing area of active interest and research, and CRM
research is becoming more prominent in the marketing, management and IT research
domains (Ngai, 2005). CRM research specifically has only come to the fore over the last
decade or so, whereas relationship marketing has been practiced and researched for
some time (Cassels, 1936; Grönroos, 1994b). Even here, a broad-based interest in
Figure 2.3: CRM relevant literature domains

Chapter 2: Literature Review
- 19 -
relationship marketing beyond a primarily Scandinavian focus has only emerged over
the last fifteen years or so. Some authors have advocated that CRM was born from
relationship marketing and is simply the practical application of long standing
relationship marketing principles which have existed since the dawn of business itself
(Gummesson, 2004; Ryals & Knox, 2001). As a specific area of enquiry however, CRM
research is still quite new within the marketing discipline.
CRM research has maintained its distinctiveness from other marketing research areas
such as RM and market orientation (MO), possibly due to the variety of research
domains (i.e., Marketing, Management, and Information Technology), fragmented
research focus (i.e., relationship marketing, management strategy, systems
implementation), initial technology focus of CRM (e.g., technology fad), or perceived
lack of a theoretical foundation (Helfert, Ritter, & Walter, 2002). The separate
trajectories of RM and CRM research have given rise to significant gaps in the research
literature which are assessed further below (Mitussis et al., 2006).
2.4. Evolution of Relationship Marketing
As early as 1948 Alderson and Cox discussed the impact of
ecological studies on marketing theory acknowledging market
relationships “as provid[ing] one starting point for a theory of the
relationships of individual retailers or clusters and their customers”
(p. 147). Following from this Morgan and Hunt (1994) suggested an
all-encompassing RM definition: “Relationship marketing refers to all marketing
activities directed toward establishing, developing, and maintaining successful relational
exchanges” (p. 22). Some argued that this went too far and eliminated the need for a
separate definition of marketing itself (Peterson, 1995).
Since the mid-1970s contemporary studies of relationship marketing have been
driven from what has been referred to as the Nordic School of Services, and the IMP
Group in particular (Grönroos, 1995; Gummesson, 1994a). However it was not until
1983 that Berry (1983, p. 26) formally introduced “relationship marketing” into the
academic marketing literature as “attracting, maintaining and – in multi-service
organizations – enhancing customer relationships”. Mainstream marketing from the late
fifties through to the late eighties focused primarily upon the study and utilisation of the
marketing mix (the 4Ps) (Vargo & Lusch, 2004). Over the intervening years the
Chapter 2: Literature Review
- 20 -
evolution and definition of RM has been somewhat convoluted (Bitner, 1995), with
many RM researchers tending to use one of four dominate theoretical perspectives to
investigate and understand interorganisational relationships: a) commitment-trust, b)
dependency, c) transaction cost economics, and d) relational norms (Palmatier, Dant, &
Grewal, 2007). The commitment-trust perspective is best exemplified in Morgan and
Hunt’s (1994) work. The exchange dependence structure viewpoint, whereby the
interdependency of a partner determines the desire to maintain a relationship, takes into
consideration power, willingness to compromise and opportunism (Ganesan, 1994; K.
Kim & Frazier, 1997; N. Kumar, Scheer, & Steenkamp, 1995). The concepts of
relationship specific investments (RSI), and opportunistic seller behaviour highlights
transaction cost economics. Because RSIs represent sunk assets in a relationship, sellers
are less likely to act opportunistically and hence, there is a greater expectation of
partnership continuity (Rindfleisch & Heide, 1997; J. B. Smith & Barclay, 1997).
Relational norms provide the fourth substantial theoretical perspective and often
emerges with the commitment-trust viewpoint to explain the positive influence of
relationship marketing (Gundlach, Achrol, & Mentzer, 1995; Siguaw, Simpson, &
Baker, 1998). This perspective assumes that transactions are undertaken within the
context and norms of a stable ongoing relationship and that a set of common contract
norms exist (Cannon, Achrol, & Gundlach, 2000; Heide & John, 1992; Kaufmann &
Dant, 1992).
More recently however a number of authors propose that an emphasis on the 4P
marketing mix is no longer the dominant marketing logic and that RM may be a more
appropriate “new” paradigm for marketing thought, theory and practice (Dwyer et al.,
1987; Grönroos, 1989, 1990; Gummesson, 1994b; Kotler, 1992; Vargo & Lusch, 2004).
With a strengthened focus upon RM, the CRM linkage becomes clear: “CRM provides
management with the opportunity to implement relationship marketing on a company-
wide basis” (Ryals & Knox, 2001, p. 535). Or as Zablah, Bellenger, and Johnston
(2004, p. 480) state “relationship marketing is often cited as the philosophical basis of
CRM ….[and] some perceive them to be so similar as to not warrant a distinction in the
literature”.
2.4.1. What is a Relationship?
A number of perspectives on and definitions of what constitutes a business
relationship exist in the literature (Grönroos, 1990; Harker, 1999). Database marketing
Chapter 2: Literature Review
- 21 -
(Tapp, 2005), direct marketing (Pearson, 1994), one-to-one marketing (Peppers et al.,
1999), key account management (Burnett, 2001), and building and maintaining
customer networks (Shani & Chalasani, 1992) have all been used to denote and describe
business relationships (typically known as relationship marketing or RM within the
marketing field itself). Some marketers consider a relationship to begin when customer
information is collected and used in a database, or when any form of exchange of goods
or services takes place. Grönroos (1990, p. 6) more fully described establishing,
maintaining and enhancing customer relationships from the service provider’s
perspective: “1) establishing a relationship involves giving promises; 2) maintaining a
relationship is based on fulfilment of promises; and finally, 3) enhancing a relationship
means that a new set of promises are given with the fulfilment of earlier promises as a
prerequisite.” Relationships can be complex and are considered as a point along a
transactional-relational continuum, with one extreme including ongoing, long-term
business and social interactions, and the other end-point viewed as simple one-time
single transactions (Grönroos, 1994a, 1995). Two main types of relationships exist in
the business literature; business-to-business (B2B) and business-to-consumer (B2C).
Much of the marketing research has focused on what constitutes B2B relationships,
attempting to understand the elements of business relationships; in particular the
dynamics of relationship formation, growth, maintenance and termination (Dwyer et al.,
1987; Fontenot & Wilson, 1997; Morgan & Hunt, 1994). There is a long history of
research specifically examining industrial (B2B) buyer-seller relationships (J. C.
Anderson, 1995; Baxter & Matear, 2004; Cannon & Homburg, 2001; Dwyer et al.,
1987; Ganesan, 1994; Krapfel, Salmond, & Spekman, 1991; Levitt, 1983; Narayandas
& Rangan, 2004; Nielson, 1998; Shapiro, 1974; Wilson, 1995). Grönroos (2000, p. 32)
argued that there is still not enough research emphasis on trying to understand “What is
a relationship?” or “When do we know a relationship has developed?” – but the amount
of research attention focused on this area has increased markedly over recent years, and
Grönroos overstates the dearth of work in the area.
Harker (1999) undertook a substantial literature review and uncovered 26 definitions
of RM currently used in the RM research literature. Although these different
conceptualisations make it difficult to communicate a shared understanding of RM
theory and development, commonalities have emerged. For example, trust and
commitment are consistently highlighted as elements central to proper relationship
Chapter 2: Literature Review
- 22 -
development and enhancement (Morgan & Hunt, 1994; O'Malley & Tynan, 2000).
Harker (1999, p. 16) offered an RM definition based on the results and key
conceptualisations from his study:
An organisation engaged in proactively creating, developing and maintaining committed, interactive and profitable exchanges with selected customers [partners] overtime [sic] is engaged in relationship marketing.
Grönroos (1996, p. 7) suggested that:
‘Relationship marketing is to identify and establish, maintain, and enhance relationships with customers and other stakeholders, at a profit, so that the objectives of all parties involved are met;’ and ‘this is done by a mutual exchange and fulfilment of promises’.
Ironically marketers on the supplier side appear to be the ones deciding when a
relationship exists (without consultation with customers) and hence many definitions of
RM in the contemporary literature lack a customer perspective (Grönroos, 2000).
Grönroos attempted to address this issue with a customer oriented definition: “A
relationship has developed when a customer perceives that a mutual way of thinking
exists between customer and supplier or service provider” (p. 33). The “mutual way of
thinking” in his definition referred to mutual commitment, loyalty, interaction and
communications.
In summary, business relationships are complex exchanges between two parties and
a relationship may exist anywhere along a continuum – from purely transactional (i.e.,
no relationship) to fully relational (i.e., embedded partnership and collaborative), yet
necessarily mutually exclusive (Coviello, Brodie, Danaher, & Johnston, 2002;
Gummesson, 2004). It is important to recognise that customers play an important and
valued role in the initiation, development and maintenance of relationships. Therefore
utilising a definition involving the customer as a central participant is inherently
appealing as a basis for B2B relationship research (Grönroos, 1996, 2000).
2.4.2. Importance of Relationship Marketing
RM is considered by some academics as the new marketing paradigm, as relevant for
manufacturing as it is for products and services (Grönroos, 1989, 1996; Gummesson,
1994a; Vargo & Lusch, 2004). RM theory postulates that benefits to the firm accrue in
the form of protecting the customer base, by creating product differentiation and
barriers to switching, and improving profits (Dwyer et al., 1987; Low, 1996; Reichheld
& Sasser, 1990). Berry (1995) suggested that customers find RM attractive because of
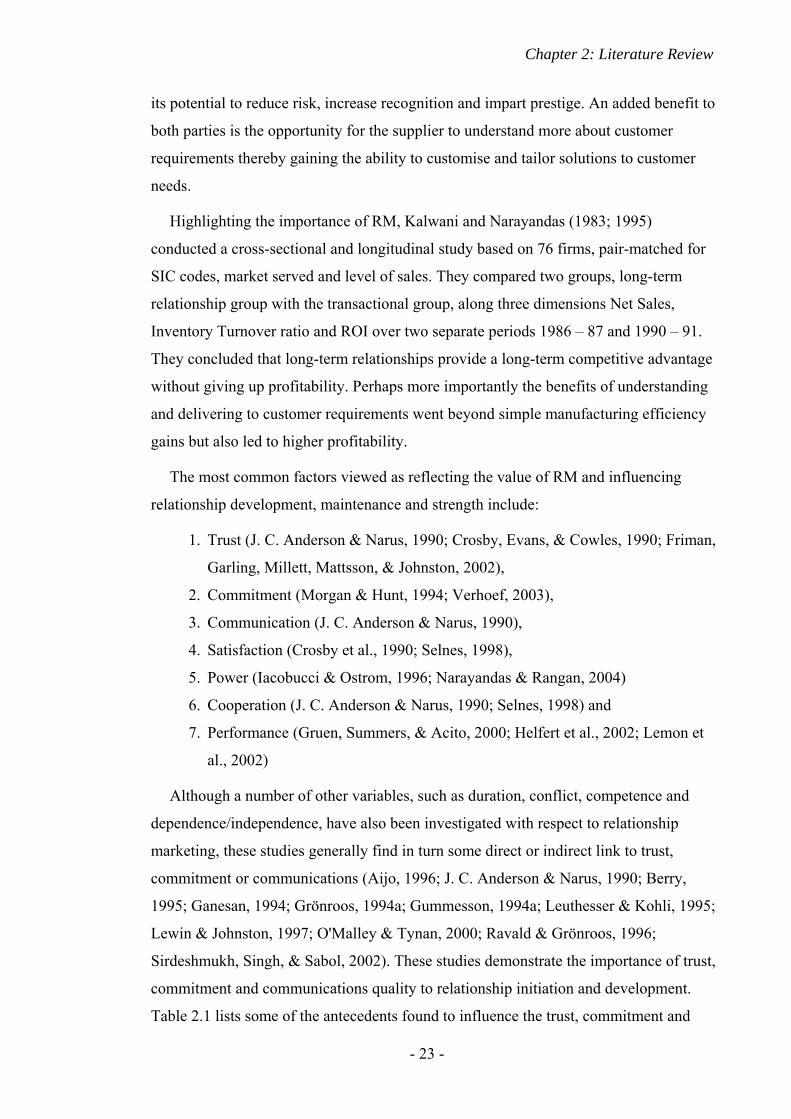
Chapter 2: Literature Review
- 23 -
its potential to reduce risk, increase recognition and impart prestige. An added benefit to
both parties is the opportunity for the supplier to understand more about customer
requirements thereby gaining the ability to customise and tailor solutions to customer
needs.
Highlighting the importance of RM, Kalwani and Narayandas (1983; 1995)
conducted a cross-sectional and longitudinal study based on 76 firms, pair-matched for
SIC codes, market served and level of sales. They compared two groups, long-term
relationship group with the transactional group, along three dimensions Net Sales,
Inventory Turnover ratio and ROI over two separate periods 1986 – 87 and 1990 – 91.
They concluded that long-term relationships provide a long-term competitive advantage
without giving up profitability. Perhaps more importantly the benefits of understanding
and delivering to customer requirements went beyond simple manufacturing efficiency
gains but also led to higher profitability.
The most common factors viewed as reflecting the value of RM and influencing
relationship development, maintenance and strength include:
1. Trust (J. C. Anderson & Narus, 1990; Crosby, Evans, & Cowles, 1990; Friman,
Garling, Millett, Mattsson, & Johnston, 2002),
2. Commitment (Morgan & Hunt, 1994; Verhoef, 2003),
3. Communication (J. C. Anderson & Narus, 1990),
4. Satisfaction (Crosby et al., 1990; Selnes, 1998),
5. Power (Iacobucci & Ostrom, 1996; Narayandas & Rangan, 2004)
6. Cooperation (J. C. Anderson & Narus, 1990; Selnes, 1998) and
7. Performance (Gruen, Summers, & Acito, 2000; Helfert et al., 2002; Lemon et
al., 2002)
Although a number of other variables, such as duration, conflict, competence and
dependence/independence, have also been investigated with respect to relationship
marketing, these studies generally find in turn some direct or indirect link to trust,
commitment or communications (Aijo, 1996; J. C. Anderson & Narus, 1990; Berry,
1995; Ganesan, 1994; Grönroos, 1994a; Gummesson, 1994a; Leuthesser & Kohli, 1995;
Lewin & Johnston, 1997; O'Malley & Tynan, 2000; Ravald & Grönroos, 1996;
Sirdeshmukh, Singh, & Sabol, 2002). These studies demonstrate the importance of trust,
commitment and communications quality to relationship initiation and development.
Table 2.1 lists some of the antecedents found to influence the trust, commitment and
Chapter 2: Literature Review
- 24 -
communications constructs in the relationship marketing research and the effect on
relationship outcomes. This table highlights and further demonstrates the potential
complexity of relationship research. Of all the factors investigated trust, commitment
and communications have been most commonly identified as a pre-requisite or primary
factor affecting relationship development and performance. With few reservations, this
set of antecedents and constructs is similar for both business customers and consumers
(Coviello & Brodie, 2001; O'Malley & Tynan, 2000).
2.5. Relationship Strength
One of the roles of marketing is to establish, maintain and
develop relationships with customers. The strength (or quality) of
business relationships between suppliers and customers has been
investigated and measured in a variety of ways (Hausman, 2001;
Morgan & Hunt, 1994; Odekerken-Schroder, De Wulf, &
Schumacher, 2003). The general consensus is that strong relationships provide
substantial benefits to both parties (Ravald & Grönroos, 1996). Although “there is no
consensus on which dimensions make up relationship quality…[d]iscussions of
Table 2.1: Associations between Antecedents Found to Influence Key Constructs of Relationship Strength
Antecedent Construct Relationship Outcomes Experience (Dwyer et al., 1987) Competence (Sirdeshmukh et al., 2002) Organisational characteristics; Individual characteristics (Moorman, Deshpandé, & Zaltman, 1993)
Shared values; Cooperation; Communication; Opportunistic behaviour (-ve); Investment (Morgan & Hunt, 1994)
Performance (Narayandas & Rangan, 2004)
Satisfaction (Verhoef, 2003) Use of power (-ve) (Iacobucci & Ostrom, 1996)
Duration (-ve) (Doney & Cannon, 1997)
TRUST
Enhanced relationship (Selnes, 1998) Functional conflict resolution; Less uncertainty; Increased commitment (Morgan & Hunt, 1994)
Improved performance (N. Sharma & Patterson, 1999)
Higher satisfaction; Increased cooperation (J. C. Anderson & Narus, 1990)
Communication; Trust; Cooperation; Investment (Morgan & Hunt, 1994)
Performance (Narayandas & Rangan, 2004)
(J. C. Anderson & Narus, 1990) Satisfaction; Price (Verhoef, 2003) Dependency (Ganesan, 1994) Loyalty (Garbarino & Johnson, 1999)
COMMITMENT
Increased cooperation; Increased acquiescence; Increased continuity; Additional investment (Morgan & Hunt, 1994)
Increased satisfaction (Verhoef, 2003) Improved performance (Narayandas & Rangan, 2004)
Increased loyalty (Garbarino & Johnson, 1999)
Initial; Frequency (Leuthesser & Kohli, 1995)
Open (Selnes, 1998) Meaningful; Timely (Lewin & Johnston, 1997)
COMMUNICATIONS QUALITY
Increased trust; Increased commitment (Morgan & Hunt, 1994)
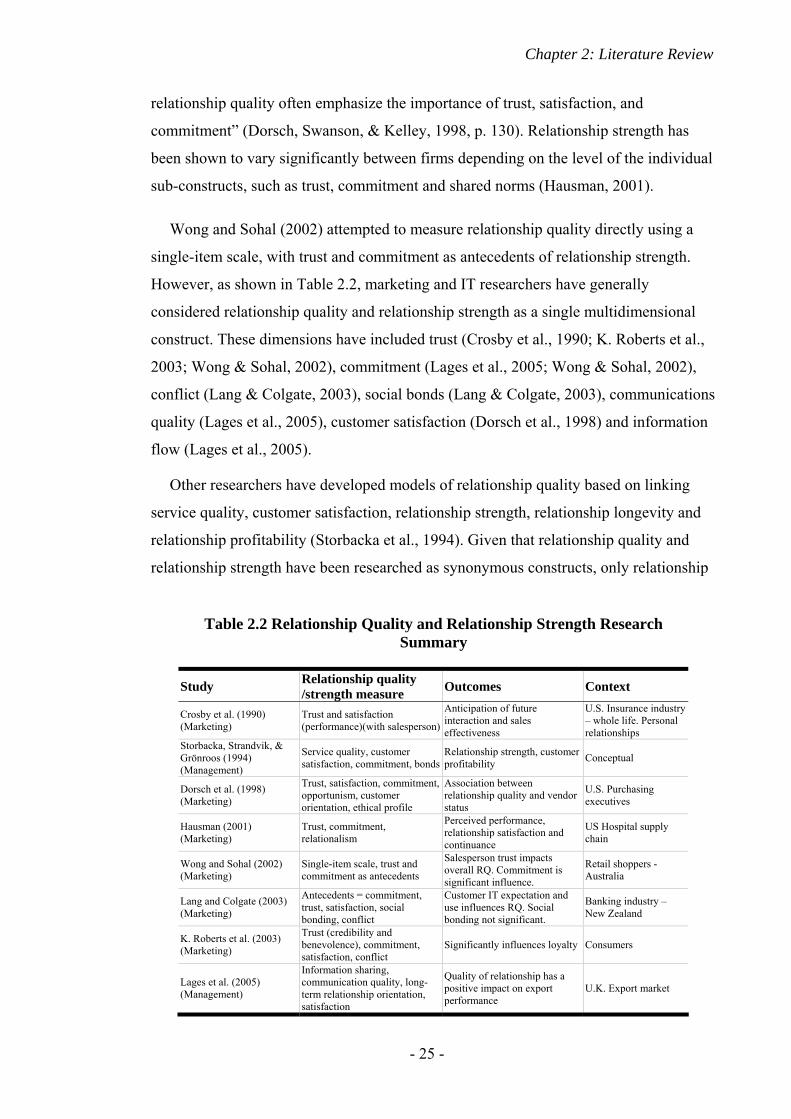
Chapter 2: Literature Review
- 25 -
relationship quality often emphasize the importance of trust, satisfaction, and
commitment” (Dorsch, Swanson, & Kelley, 1998, p. 130). Relationship strength has
been shown to vary significantly between firms depending on the level of the individual
sub-constructs, such as trust, commitment and shared norms (Hausman, 2001).
Wong and Sohal (2002) attempted to measure relationship quality directly using a
single-item scale, with trust and commitment as antecedents of relationship strength.
However, as shown in Table 2.2, marketing and IT researchers have generally
considered relationship quality and relationship strength as a single multidimensional
construct. These dimensions have included trust (Crosby et al., 1990; K. Roberts et al.,
2003; Wong & Sohal, 2002), commitment (Lages et al., 2005; Wong & Sohal, 2002),
conflict (Lang & Colgate, 2003), social bonds (Lang & Colgate, 2003), communications
quality (Lages et al., 2005), customer satisfaction (Dorsch et al., 1998) and information
flow (Lages et al., 2005).
Other researchers have developed models of relationship quality based on linking
service quality, customer satisfaction, relationship strength, relationship longevity and
relationship profitability (Storbacka et al., 1994). Given that relationship quality and
relationship strength have been researched as synonymous constructs, only relationship
Table 2.2 Relationship Quality and Relationship Strength Research Summary
Study Relationship quality /strength measure Outcomes Context
Crosby et al. (1990) (Marketing)
Trust and satisfaction (performance)(with salesperson)
Anticipation of future interaction and sales effectiveness
U.S. Insurance industry – whole life. Personal relationships
Storbacka, Strandvik, & Grönroos (1994) (Management)
Service quality, customer satisfaction, commitment, bonds
Relationship strength, customer profitability Conceptual
Dorsch et al. (1998) (Marketing)
Trust, satisfaction, commitment, opportunism, customer orientation, ethical profile
Association between relationship quality and vendor status
U.S. Purchasing executives
Hausman (2001) (Marketing)
Trust, commitment, relationalism
Perceived performance, relationship satisfaction and continuance
US Hospital supply chain
Wong and Sohal (2002) (Marketing)
Single-item scale, trust and commitment as antecedents
Salesperson trust impacts overall RQ. Commitment is significant influence.
Retail shoppers - Australia
Lang and Colgate (2003) (Marketing)
Antecedents = commitment, trust, satisfaction, social bonding, conflict
Customer IT expectation and use influences RQ. Social bonding not significant.
Banking industry – New Zealand
K. Roberts et al. (2003) (Marketing)
Trust (credibility and benevolence), commitment, satisfaction, conflict
Significantly influences loyalty Consumers
Lages et al. (2005) (Management)
Information sharing, communication quality, long-term relationship orientation, satisfaction
Quality of relationship has a positive impact on export performance
U.K. Export market
Chapter 2: Literature Review
- 26 -
strength will be discussed further (e.g., Lages et al., 2005; Palmatier, Scheer et al., 2007;
Storbacka et al., 1994). A number of specific dimensions of relationship strength from
the literature are now reviewed.
2.5.1. Trust
Trust has been conceptualised in the literature as having “confidence in an exchange
partner’s reliability and integrity” (Morgan & Hunt, 1994, p. 23), or alternatively as “a
willingness to rely on an exchange partner in whom one has confidence” (Moorman et
al., 1993, p. 82). Trust is considered by some IT researchers to be based on integrity,
credibility and competence (Bhattacherjee, 2002). Other researchers believe trust is built
through forthright and frequent two-way communications (Lewin & Johnston, 1997;
Selnes, 1998).
Numerous studies have argued that trust is the foundation of RM (Doney & Cannon,
1997; Duncan & Moriarty, 1998; Dwyer et al., 1987; Fontenot & Wilson, 1997;
Geyskens, Steenkamp, & Kumar, 1998; Lewin & Johnston, 1997; Narayandas &
Rangan, 2004; Ravald & Grönroos, 1996). Trust is a primary and fundamental
requirement for successful relationship development (Berry, 1995; Grönroos, 1996;
Medlin et al., 2005), and relationship maintenance (J. C. Anderson & Narus, 1990;
Harker, 1999). In addition trust provides the basis for loyalty, relationship enhancement
(i.e., decreased perception of risk), and yet is mediated by customer perceived value of
the relationship (i.e., perceived net benefits) (Morgan & Hunt, 1994; Selnes, 1998;
Sirdeshmukh et al., 2002). Trust has been conceptualised both as a dimension (E.
Anderson, Lodish, & Weitz, 1987; Crosby et al., 1990), and an antecedent, of
relationship strength (J. C. Anderson & Narus, 1990; Mohr & Nevin, 1990).
2.5.1.1. Types of Trust
Trust itself is considered multi-dimensional and cannot be researched or measured
successfully in a unidimensional manner (Doney & Cannon, 1997; Ganesan, 1994;
Geyskens et al., 1998; Pressey & Mathews, 2004).
Blois (1999) reviewed a number of relevant B2B marketing studies on trust and was
concerned with the lack of clarity surrounding the conceptualisation of trust, and the
different features of trust not represented in the marketing research literature (e.g., trust
and reliance; blanket trust; reciprocity; trust and trustworthiness; and organisational
trust). McKnight and Chervany (1996; 2000) proposed a four component
Chapter 2: Literature Review
- 27 -
interdisciplinary model of trust that included disposition to trust, institution-based trust,
trusting beliefs, and trusting intention. They suggested that the elements of the trusting
belief component included competence, benevolence, integrity and predictability. Other
researchers have similarly found trust, and trust development, to include competence
(Bhattacherjee, 2002; E. Kim & Tadisina, 2003; Pressey & Mathews, 2004),
benevolence (Bhattacherjee, 2002; Doney & Cannon, 1997; E. Kim & Tadisina, 2003;
Pressey & Mathews, 2004), and credibility (Bhattacherjee, 2002; Doney & Cannon,
1997; Ganesan, 1994).
Sako (1992) proposed a typology of trust for management of buyer-supplier relations
incorporating contractual trust, goodwill trust and competence trust. Contractual trust is
based upon mutually agreed obligations, expectations, ethical standards, formality, and
structure. That is, both parties believe, share and uphold similar ethical and moral
standards of business; keeping and delivering on promises (Garbarino & Johnson,
1999). This includes the expectations of payment, use and security of confidential
material, and basic honesty. Opportunism, as well as complete dependence on legal
penalties, indicates a lack of contractual trust, while oral agreements indicate increased
levels of contractual trust.
Goodwill trust captures such attributes as shared normative values, fairness,
confidentiality, dependability, discreteness and benevolence (Gounaris, 2005). This type
of trust reflects a form “of open commitment to each other ...[and] the willingness to do
more than is formally expected” (Sako, 1992, p. 38). There are no explicit promises or
professional standards to be met. Rather, there is the understanding that either party can
take the initiative to exploit new opportunities without taking unfair advantage of the
other. Goodwill trust increases the vulnerability of each party to be in the other’s debt.
Bhattacherjee (2002), in his study of trust in online firms, identified that benevolence
(goodwill) trust is a significant element of trust with the inherent belief that each party
will act in a manner that is in the best interest of the relationship.
Competence trust is grounded in the belief that the partner has the ability, technical
knowledge, expertise and capability (including managerial) to perform their role
(Moorman et al., 1993; Sako, 1992). It is similar to the concept of ability trust
(Bhattacherjee, 2002), and is “a pre-requisite for the viability of any repeated
transactions” (Sako, 1992, p. 43).
Chapter 2: Literature Review
- 28 -
2.5.1.2. Findings from Trust Research
Using a multi-format self-administered questionnaire, Moorman, Deshpandé, and
Zaltman (1993) found that 15 interpersonal and organisational factors significantly
affected users’ trust. Complementing the traditional psychological approach to trust
research by incorporating sociological theory, they found that individual user
characteristics were not key factors. The other parties’ perceived integrity, willingness
to reduce uncertainty, confidentiality, expertise, sincerity, tactfulness, timeliness, and
congeniality all significantly affected trust. Degree of formalisation was the only
organisational structure found to affect trust. Other factors significantly affecting trust
included the perceived power of the provider’s organisation, the provider’s perceived
organisational culture, the reporting structure, and the firm’s propensity for project
customisation.
From 212 usable questionnaires returned from a wide variety of industries, Pressey
and Mathews (2004), investigating patterns of UK supplier trust in long-term B2B
relationships, found that at any point in time, any of the three trusting behaviours –
contractual, goodwill or competence trust – may be in evidence, however goodwill and
contractual trust did not co-exist within the same relationship. They also found that
competence trust (the ability of the other party to perform their assigned role) was not
only relied on by both parties, but may be a fundamental requirement for trust to exist.
Furthermore trust may not necessarily progress from low levels of trust to higher levels
of trust in a linear fashion over time, but may change based on situations and events.
Anderson and Weitz (1989), studied 690 dyadic relationships between independent
manufacturing sales representatives and their principals. They found that more trusting
relationships occurred with older relationships, and trust was enhanced by two-way
communication, perceived congruent goals and between parties that provided mutual
support. Lower levels of trust were found with parties that had poor reputations, and
relationships involving asymmetrical power balance. The authors also found that older
relationships required less communication, that communication helped build trust, while
trust facilitated effective communication. However, Doney and Cannon’s (1997) study
of 210 US industrial manufacturing firms found no significant link between relationship
duration and trust.
Ganesan (1994), studying 124 US retailer buyers and 52 sellers, using a mailed
questionnaire, found that retailer and vendor commitment was mediated by trust
Chapter 2: Literature Review
- 29 -
primarily because trust reduced perceived future risk. In his study only the credibility
dimension of trust was a key predictor. Transaction specific investments (TSI) were
found to increase a firm’s perception of trustworthiness and helped create mutual
dependency and signalled commitment. Suppliers’ trust in retailers increased when
performance outcomes were satisfactory, whereas retailers valued the supplier’s
reputation more.
IT researchers have developed “initial trust” measurement instruments to help
understand how trust first comes about or is initiated. Bhattacherjee (2002) investigated
three dimensions of initial trust: ability (competence and knowledge), integrity
(principles, conduct and fairness), and benevolence (willingness to do good). The author
concluded that, since (potential) customers transfer sensitive information (i.e., e-mail
address, credit card information, personal information and preferences) to online firms,
initial trust is important to the development of online relationships. Kim and Tadisina
(2003) also developed a self-administered questionnaire to measure initial trust within
an e-commerce environment. Competence and goodwill were again found to be
significant factors impacting the development of initial trust. Within the context of
business and technology, people may trust firms similar to how they trust people
(Doney & Cannon, 1997), but people do not necessarily trust technology the same way
(Friedman, Khan, & Howe, 2000). Roberts (2003) offered the perspective that a lack of
trust is a primary obstacle to e-commerce and by implication e-interaction. Customer
concerns over privacy and data use may influence a customer’s willingness to
participate in information exchange and this may impact the buyer-seller perception of
technology and CRM adoption within supplier firms (Coupey, 2005; Peters & Fletcher,
2004b).
Trust is an important and necessary attribute for a strong and robust relationship and
contributes to relationship performance and has been shown to be mediated by variables
such as: performance (J. C. Anderson & Narus, 1990; Narayandas & Rangan, 2004),
shared values (Morgan & Hunt, 1994), perceived value add (Sirdeshmukh et al., 2002),
and customer satisfaction (Leuthesser & Kohli, 1995; Selnes, 1998).
Table 2.3 provides a summary from a number of studies indicating that the three
types of trust proposed by Sako (1992), contractual, competence and goodwill trust,
provide acceptable dimensions with which to classify and investigate trust within the
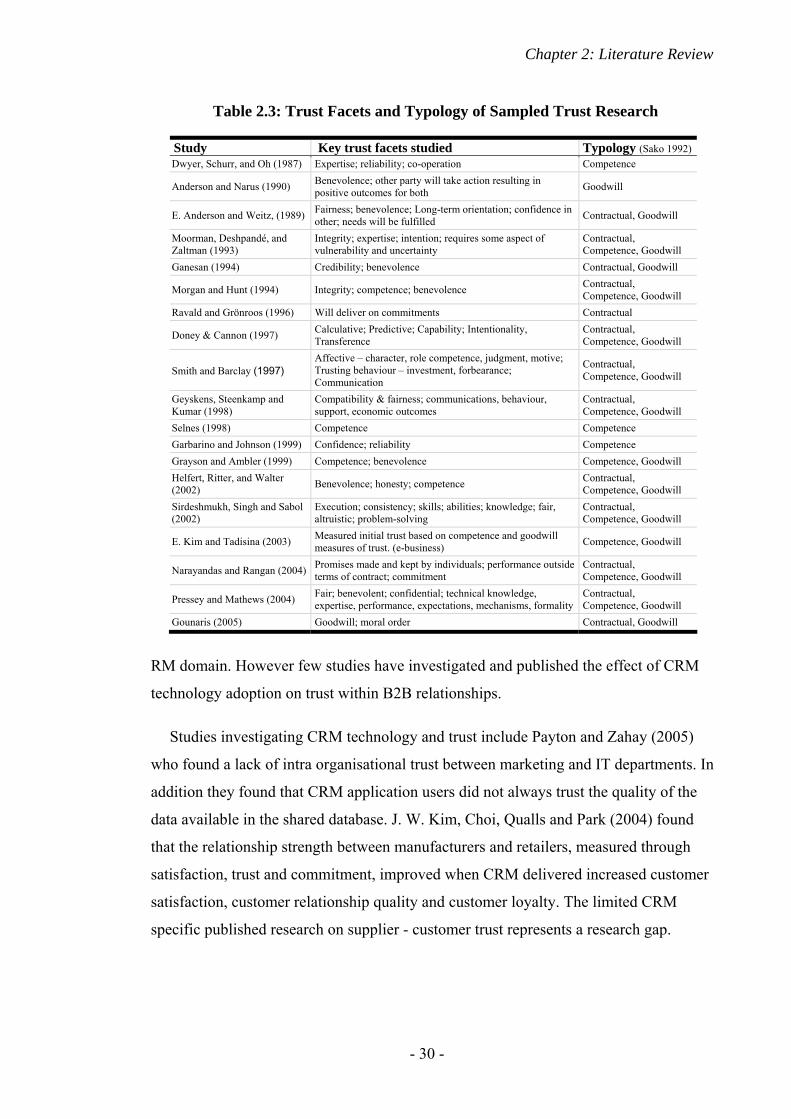
Chapter 2: Literature Review
- 30 -
RM domain. However few studies have investigated and published the effect of CRM
technology adoption on trust within B2B relationships.
Studies investigating CRM technology and trust include Payton and Zahay (2005)
who found a lack of intra organisational trust between marketing and IT departments. In
addition they found that CRM application users did not always trust the quality of the
data available in the shared database. J. W. Kim, Choi, Qualls and Park (2004) found
that the relationship strength between manufacturers and retailers, measured through
satisfaction, trust and commitment, improved when CRM delivered increased customer
satisfaction, customer relationship quality and customer loyalty. The limited CRM
specific published research on supplier - customer trust represents a research gap.
Table 2.3: Trust Facets and Typology of Sampled Trust Research
Study Key trust facets studied Typology (Sako 1992)Dwyer, Schurr, and Oh (1987) Expertise; reliability; co-operation Competence
Anderson and Narus (1990) Benevolence; other party will take action resulting in positive outcomes for both Goodwill
E. Anderson and Weitz, (1989) Fairness; benevolence; Long-term orientation; confidence in other; needs will be fulfilled Contractual, Goodwill
Moorman, Deshpandé, and Zaltman (1993)
Integrity; expertise; intention; requires some aspect of vulnerability and uncertainty
Contractual, Competence, Goodwill
Ganesan (1994) Credibility; benevolence Contractual, Goodwill
Morgan and Hunt (1994) Integrity; competence; benevolence Contractual, Competence, Goodwill
Ravald and Grönroos (1996) Will deliver on commitments Contractual
Doney & Cannon (1997) Calculative; Predictive; Capability; Intentionality, Transference
Contractual, Competence, Goodwill
Smith and Barclay (1997) Affective – character, role competence, judgment, motive; Trusting behaviour – investment, forbearance; Communication
Contractual, Competence, Goodwill
Geyskens, Steenkamp and Kumar (1998)
Compatibility & fairness; communications, behaviour, support, economic outcomes
Contractual, Competence, Goodwill
Selnes (1998) Competence Competence Garbarino and Johnson (1999) Confidence; reliability Competence Grayson and Ambler (1999) Competence; benevolence Competence, Goodwill Helfert, Ritter, and Walter (2002) Benevolence; honesty; competence Contractual,
Competence, Goodwill Sirdeshmukh, Singh and Sabol (2002)
Execution; consistency; skills; abilities; knowledge; fair, altruistic; problem-solving
Contractual, Competence, Goodwill
E. Kim and Tadisina (2003) Measured initial trust based on competence and goodwill measures of trust. (e-business) Competence, Goodwill
Narayandas and Rangan (2004) Promises made and kept by individuals; performance outside terms of contract; commitment
Contractual, Competence, Goodwill
Pressey and Mathews (2004) Fair; benevolent; confidential; technical knowledge, expertise, performance, expectations, mechanisms, formality
Contractual, Competence, Goodwill
Gounaris (2005) Goodwill; moral order Contractual, Goodwill
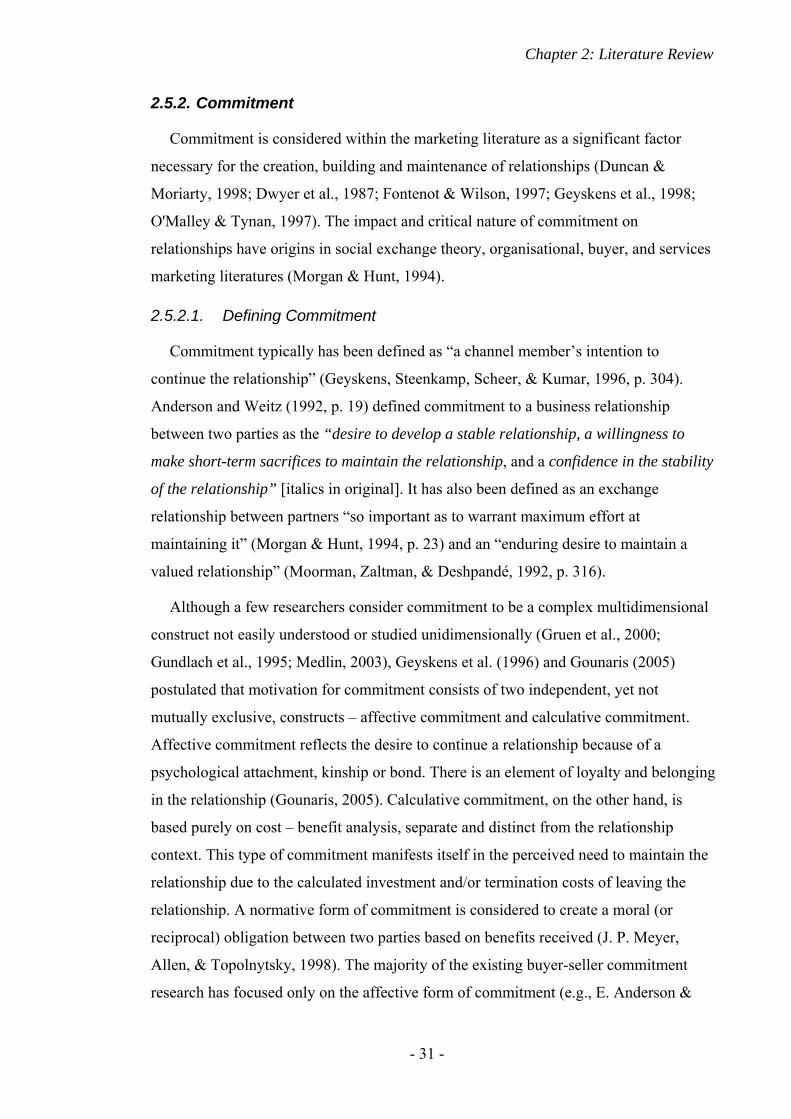
Chapter 2: Literature Review
- 31 -
2.5.2. Commitment
Commitment is considered within the marketing literature as a significant factor
necessary for the creation, building and maintenance of relationships (Duncan &
Moriarty, 1998; Dwyer et al., 1987; Fontenot & Wilson, 1997; Geyskens et al., 1998;
O'Malley & Tynan, 1997). The impact and critical nature of commitment on
relationships have origins in social exchange theory, organisational, buyer, and services
marketing literatures (Morgan & Hunt, 1994).
2.5.2.1. Defining Commitment
Commitment typically has been defined as “a channel member’s intention to
continue the relationship” (Geyskens, Steenkamp, Scheer, & Kumar, 1996, p. 304).
Anderson and Weitz (1992, p. 19) defined commitment to a business relationship
between two parties as the “desire to develop a stable relationship, a willingness to
make short-term sacrifices to maintain the relationship, and a confidence in the stability
of the relationship” [italics in original]. It has also been defined as an exchange
relationship between partners “so important as to warrant maximum effort at
maintaining it” (Morgan & Hunt, 1994, p. 23) and an “enduring desire to maintain a
valued relationship” (Moorman, Zaltman, & Deshpandé, 1992, p. 316).
Although a few researchers consider commitment to be a complex multidimensional
construct not easily understood or studied unidimensionally (Gruen et al., 2000;
Gundlach et al., 1995; Medlin, 2003), Geyskens et al. (1996) and Gounaris (2005)
postulated that motivation for commitment consists of two independent, yet not
mutually exclusive, constructs – affective commitment and calculative commitment.
Affective commitment reflects the desire to continue a relationship because of a
psychological attachment, kinship or bond. There is an element of loyalty and belonging
in the relationship (Gounaris, 2005). Calculative commitment, on the other hand, is
based purely on cost – benefit analysis, separate and distinct from the relationship
context. This type of commitment manifests itself in the perceived need to maintain the
relationship due to the calculated investment and/or termination costs of leaving the
relationship. A normative form of commitment is considered to create a moral (or
reciprocal) obligation between two parties based on benefits received (J. P. Meyer,
Allen, & Topolnytsky, 1998). The majority of the existing buyer-seller commitment
research has focused only on the affective form of commitment (e.g., E. Anderson &
Chapter 2: Literature Review
- 32 -
Weitz, 1992; N. Kumar et al., 1995; Moorman et al., 1992; Morgan & Hunt, 1994;
Wilson, 1995).
2.5.2.2. Findings from Commitment Research
Morgan and Hunt (1994) found that commitment can be a demonstration of loyalty,
whereby, for example, a supplier commits superior resources (vis-à-vis the competition)
in order to maintain and enhance an existing relationship (Ganesan, 1994). Verhoef
(2003) found that commitment is an antecedent both to customer retention and customer
share development. Other empirical studies of commitment indicate a strong
relationship between perceived commitment of both parties and their ability to
overcome difficulties (conflict) in order to achieve mutual gain (Lewin & Johnston,
1997; Narayandas & Rangan, 2004). However Gruen, Summers and Acito’s (2000)
empirical study of commitment using life insurance agents (n = 2,545) concluded that
commitment did not mediate future intention to purchase nor did it lead to retention.
The authors believed that the non-significant results may have been influenced by the
nature of the insurance industry, the use of aggregation in place of individual measures
of commitment, and the attempt to link commitment to actual retention behaviour.
Interestingly another insurance industry study undertaken by MacKenzi, Podsakoff, and
Ahearne (1998) produced similar results providing additional support to Gruen et al’s
interpretation.
Morgan and Hunt’s (1994) seminal study of commitment and trust concluded that
commitment and trust are the primary mediating factors contributing to successful RM.
They developed a questionnaire adapting a variety of existing measurement instruments
and tested 13 hypotheses with a sample of 204 members of the National Tire Dealers
and Retreaders Association (NTDRA), using correlations and structural equation
modelling (LISTREL VII). They proposed establishing clear communications for
information, such as performance evaluations, market information, forecasts and
expectations, to help develop, sustain and improve trust and commitment between
exchange partners.
Gundlach et al. (1995) investigated exchange relationships from the buyer and seller
perspective, one of only two such studies (Medlin, 2003). The authors considered a
three-component commitment model consisting of (a) input – the level of resources, (b)
attitudinal – intention, and (c) temporal – consistency over time. The results indicated
Chapter 2: Literature Review
- 33 -
that the credibility and level of input “reinforce and escalate commitment over time”
(Gundlach et al., 1995, p. 90), while intention (attitudinal component) is not a clear
predictor of commitment over time.
Narayandas and Rangan (2004) investigated relationships using grounded theory
methodology in three industrial buyer-seller settings. They found that trust affects
commitment and performance, and although individual trust is a precursor to
development of commitment, interorganisational commitment does not foster
interpersonal trust.
Gounaris (2005) collected data from 127 questionnaires mailed to companies in
Athens, Greece. As part of this research the author investigated the effect of affective
and calculative commitment on relationship maintenance and relationship investment.
He found that higher levels of trust led to increased affective commitment, and that
there was a causal relationship between trust and commitment in which trust precedes
commitment. In addition Gounaris supported the findings from Geyskens et al. (1996)
that the affective bond between the buyer-seller is important to relationship maintenance
and leads to further relationship investment and enhancement. Furthermore the
Gounaris study demonstrated that calculative commitment and affective commitment
result in significantly different behavioural intentions. The study suggested that as the
level of trust increases in the relationship, calculative commitment decreases. This
supported an earlier study which found that “trust can lead even highly interdependent
firms to focus less on calculative motivations and emphasize the desire to maintain the
relationship because of identification with and attachment to the partner” (Geyskens et
al., 1996, p. 314). Calculative commitment on the other hand appeared to have a
negative impact on the intention to maintain relationships and increase investment.
In summary, commitment is considered essential for relationship success and affects
relationship performance (Gounaris, 2005; Helfert et al., 2002; Morgan & Hunt, 1994).
The underlying motivation for relationship commitment is important in order to better
understand, investigate and predict ongoing relationship performance (Gounaris, 2005).
Although there is a lack of empirical studies focusing on affective and calculative
commitment, the distinction appears to provide a useful typology to study relationship
commitment (Gounaris, 2005). Few studies have attempted to link CRM technology
adoption and customer commitment (Park & Kim, 2003). The effect of CRM
Chapter 2: Literature Review
- 34 -
technology adoption on commitment and relationship performance is not well
understood and represents a gap in the relevant research literature.
2.5.3. Communication
Communication is used to initiate and build relationships; mediate ideas, thoughts
and feelings, transfer information, solve problems and simply connect people (Bordia,
1997; Rix, Buss, & Herford, 2001). The area of communications research is vast and
sometimes confusing, encompassing the transfer of meaning, as well as the transfer of
data, and the use of channels of communication (e.g., technology mediated
communication (TMC)) (Eunson, 2005; Rogers & Albritton, 1995). The abundance of
communication channels available today increases the volume of information, as well as
the quantity of information transferred (Rogers & Albritton, 1995). However this does
not necessarily improve the quality of communication and understanding, and instead
may culminate in Priestley’s paradox (Eunson, 2005). Priestley’s paradox proposes that
quantity of communications (especially through TMC) may actually diminish
communication quality, rather than enhance it. Similar paradoxical findings have been
demonstrated in studies of the impact of technology on interpersonal relationships
(McQuillen, 2003).
2.5.3.1. Defining Communication in the Context of Relationships
Neither communication nor communication quality appears to have single unified
definitions in the RM literature (Mohr & Nevin, 1990). Communication has been
“defined broadly as the formal as well as informal sharing of meaningful and timely
information between firms ... [focused] on the efficacy of information exchange rather
than the quantity or amount, and ... inherently taps past communications” (J. C.
Anderson & Narus, 1990, p. 44). This form of communication definition has been used
extensively in the RM literature (J. C. Anderson & Narus, 1984; Lewin & Johnston,
1997; Morgan & Hunt, 1994; N. Sharma & Patterson, 1999).
Communication effectiveness has been defined as the sharing of meaningful and
timely information, with timeliness having an impact on perceived communication
quality, satisfaction and trust (Moorman et al., 1993; N. Sharma & Patterson, 1999).
Communication openness has been used to reflect the formal and informal sharing of
plans, goals, expectations, motives and evaluation criteria (E. Anderson & Weitz, 1989;
J. C. Anderson & Narus, 1984; J. B. Smith & Barclay, 1997). Some view
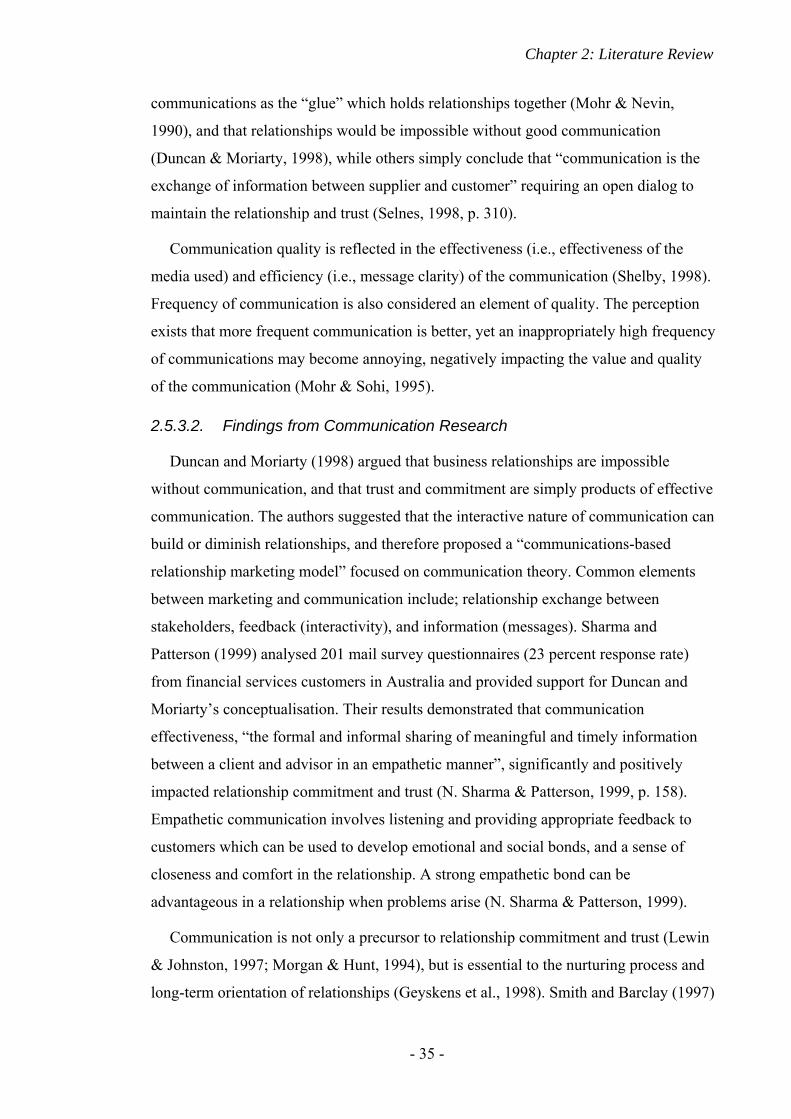
Chapter 2: Literature Review
- 35 -
communications as the “glue” which holds relationships together (Mohr & Nevin,
1990), and that relationships would be impossible without good communication
(Duncan & Moriarty, 1998), while others simply conclude that “communication is the
exchange of information between supplier and customer” requiring an open dialog to
maintain the relationship and trust (Selnes, 1998, p. 310).
Communication quality is reflected in the effectiveness (i.e., effectiveness of the
media used) and efficiency (i.e., message clarity) of the communication (Shelby, 1998).
Frequency of communication is also considered an element of quality. The perception
exists that more frequent communication is better, yet an inappropriately high frequency
of communications may become annoying, negatively impacting the value and quality
of the communication (Mohr & Sohi, 1995).
2.5.3.2. Findings from Communication Research
Duncan and Moriarty (1998) argued that business relationships are impossible
without communication, and that trust and commitment are simply products of effective
communication. The authors suggested that the interactive nature of communication can
build or diminish relationships, and therefore proposed a “communications-based
relationship marketing model” focused on communication theory. Common elements
between marketing and communication include; relationship exchange between
stakeholders, feedback (interactivity), and information (messages). Sharma and
Patterson (1999) analysed 201 mail survey questionnaires (23 percent response rate)
from financial services customers in Australia and provided support for Duncan and
Moriarty’s conceptualisation. Their results demonstrated that communication
effectiveness, “the formal and informal sharing of meaningful and timely information
between a client and advisor in an empathetic manner”, significantly and positively
impacted relationship commitment and trust (N. Sharma & Patterson, 1999, p. 158).
Empathetic communication involves listening and providing appropriate feedback to
customers which can be used to develop emotional and social bonds, and a sense of
closeness and comfort in the relationship. A strong empathetic bond can be
advantageous in a relationship when problems arise (N. Sharma & Patterson, 1999).
Communication is not only a precursor to relationship commitment and trust (Lewin
& Johnston, 1997; Morgan & Hunt, 1994), but is essential to the nurturing process and
long-term orientation of relationships (Geyskens et al., 1998). Smith and Barclay (1997)
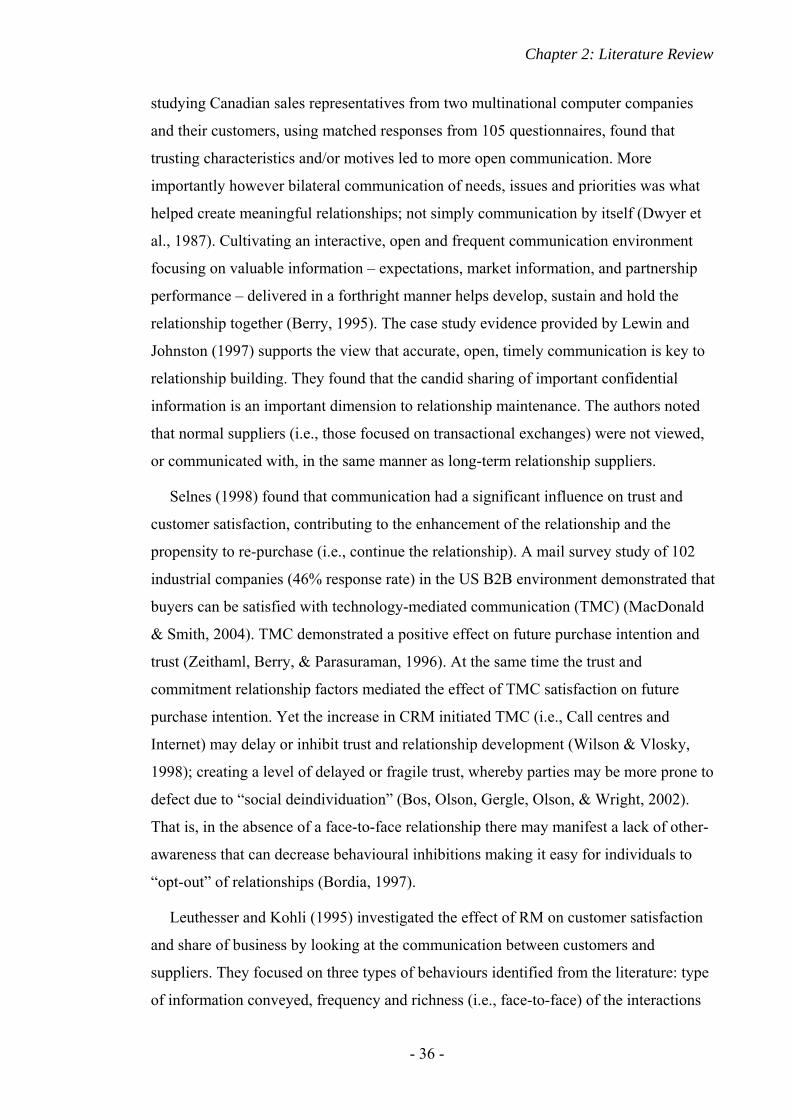
Chapter 2: Literature Review
- 36 -
studying Canadian sales representatives from two multinational computer companies
and their customers, using matched responses from 105 questionnaires, found that
trusting characteristics and/or motives led to more open communication. More
importantly however bilateral communication of needs, issues and priorities was what
helped create meaningful relationships; not simply communication by itself (Dwyer et
al., 1987). Cultivating an interactive, open and frequent communication environment
focusing on valuable information – expectations, market information, and partnership
performance – delivered in a forthright manner helps develop, sustain and hold the
relationship together (Berry, 1995). The case study evidence provided by Lewin and
Johnston (1997) supports the view that accurate, open, timely communication is key to
relationship building. They found that the candid sharing of important confidential
information is an important dimension to relationship maintenance. The authors noted
that normal suppliers (i.e., those focused on transactional exchanges) were not viewed,
or communicated with, in the same manner as long-term relationship suppliers.
Selnes (1998) found that communication had a significant influence on trust and
customer satisfaction, contributing to the enhancement of the relationship and the
propensity to re-purchase (i.e., continue the relationship). A mail survey study of 102
industrial companies (46% response rate) in the US B2B environment demonstrated that
buyers can be satisfied with technology-mediated communication (TMC) (MacDonald
& Smith, 2004). TMC demonstrated a positive effect on future purchase intention and
trust (Zeithaml, Berry, & Parasuraman, 1996). At the same time the trust and
commitment relationship factors mediated the effect of TMC satisfaction on future
purchase intention. Yet the increase in CRM initiated TMC (i.e., Call centres and
Internet) may delay or inhibit trust and relationship development (Wilson & Vlosky,
1998); creating a level of delayed or fragile trust, whereby parties may be more prone to
defect due to “social deindividuation” (Bos, Olson, Gergle, Olson, & Wright, 2002).
That is, in the absence of a face-to-face relationship there may manifest a lack of other-
awareness that can decrease behavioural inhibitions making it easy for individuals to
“opt-out” of relationships (Bordia, 1997).
Leuthesser and Kohli (1995) investigated the effect of RM on customer satisfaction
and share of business by looking at the communication between customers and
suppliers. They focused on three types of behaviours identified from the literature: type
of information conveyed, frequency and richness (i.e., face-to-face) of the interactions
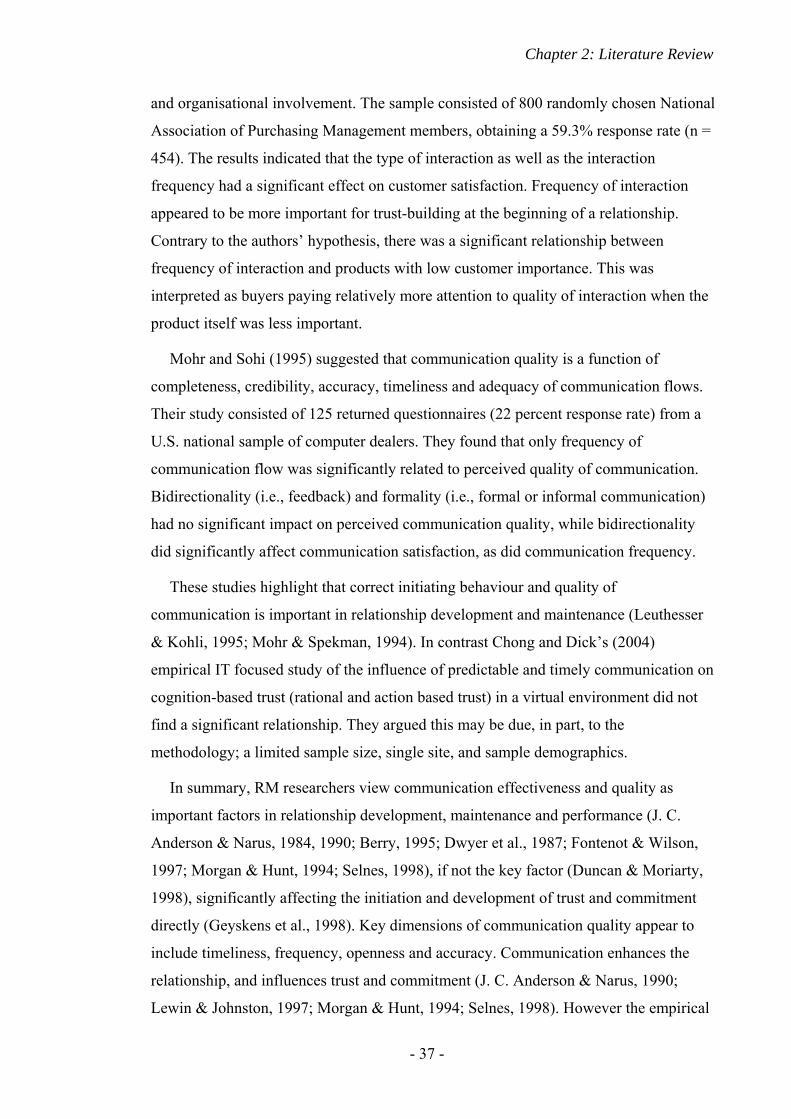
Chapter 2: Literature Review
- 37 -
and organisational involvement. The sample consisted of 800 randomly chosen National
Association of Purchasing Management members, obtaining a 59.3% response rate (n =
454). The results indicated that the type of interaction as well as the interaction
frequency had a significant effect on customer satisfaction. Frequency of interaction
appeared to be more important for trust-building at the beginning of a relationship.
Contrary to the authors’ hypothesis, there was a significant relationship between
frequency of interaction and products with low customer importance. This was
interpreted as buyers paying relatively more attention to quality of interaction when the
product itself was less important.
Mohr and Sohi (1995) suggested that communication quality is a function of
completeness, credibility, accuracy, timeliness and adequacy of communication flows.
Their study consisted of 125 returned questionnaires (22 percent response rate) from a
U.S. national sample of computer dealers. They found that only frequency of
communication flow was significantly related to perceived quality of communication.
Bidirectionality (i.e., feedback) and formality (i.e., formal or informal communication)
had no significant impact on perceived communication quality, while bidirectionality
did significantly affect communication satisfaction, as did communication frequency.
These studies highlight that correct initiating behaviour and quality of
communication is important in relationship development and maintenance (Leuthesser
& Kohli, 1995; Mohr & Spekman, 1994). In contrast Chong and Dick’s (2004)
empirical IT focused study of the influence of predictable and timely communication on
cognition-based trust (rational and action based trust) in a virtual environment did not
find a significant relationship. They argued this may be due, in part, to the
methodology; a limited sample size, single site, and sample demographics.
In summary, RM researchers view communication effectiveness and quality as
important factors in relationship development, maintenance and performance (J. C.
Anderson & Narus, 1984, 1990; Berry, 1995; Dwyer et al., 1987; Fontenot & Wilson,
1997; Morgan & Hunt, 1994; Selnes, 1998), if not the key factor (Duncan & Moriarty,
1998), significantly affecting the initiation and development of trust and commitment
directly (Geyskens et al., 1998). Key dimensions of communication quality appear to
include timeliness, frequency, openness and accuracy. Communication enhances the
relationship, and influences trust and commitment (J. C. Anderson & Narus, 1990;
Lewin & Johnston, 1997; Morgan & Hunt, 1994; Selnes, 1998). However the empirical
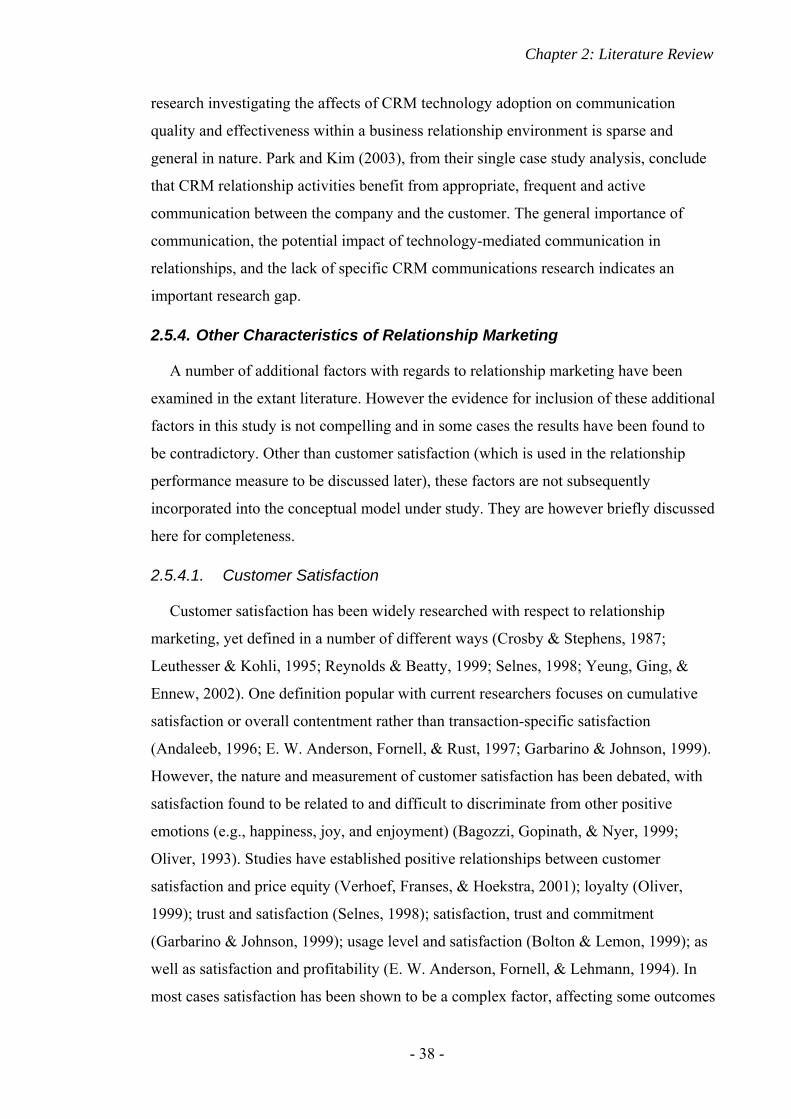
Chapter 2: Literature Review
- 38 -
research investigating the affects of CRM technology adoption on communication
quality and effectiveness within a business relationship environment is sparse and
general in nature. Park and Kim (2003), from their single case study analysis, conclude
that CRM relationship activities benefit from appropriate, frequent and active
communication between the company and the customer. The general importance of
communication, the potential impact of technology-mediated communication in
relationships, and the lack of specific CRM communications research indicates an
important research gap.
2.5.4. Other Characteristics of Relationship Marketing
A number of additional factors with regards to relationship marketing have been
examined in the extant literature. However the evidence for inclusion of these additional
factors in this study is not compelling and in some cases the results have been found to
be contradictory. Other than customer satisfaction (which is used in the relationship
performance measure to be discussed later), these factors are not subsequently
incorporated into the conceptual model under study. They are however briefly discussed
here for completeness.
2.5.4.1. Customer Satisfaction
Customer satisfaction has been widely researched with respect to relationship
marketing, yet defined in a number of different ways (Crosby & Stephens, 1987;
Leuthesser & Kohli, 1995; Reynolds & Beatty, 1999; Selnes, 1998; Yeung, Ging, &
Ennew, 2002). One definition popular with current researchers focuses on cumulative
satisfaction or overall contentment rather than transaction-specific satisfaction
(Andaleeb, 1996; E. W. Anderson, Fornell, & Rust, 1997; Garbarino & Johnson, 1999).
However, the nature and measurement of customer satisfaction has been debated, with
satisfaction found to be related to and difficult to discriminate from other positive
emotions (e.g., happiness, joy, and enjoyment) (Bagozzi, Gopinath, & Nyer, 1999;
Oliver, 1993). Studies have established positive relationships between customer
satisfaction and price equity (Verhoef, Franses, & Hoekstra, 2001); loyalty (Oliver,
1999); trust and satisfaction (Selnes, 1998); satisfaction, trust and commitment
(Garbarino & Johnson, 1999); usage level and satisfaction (Bolton & Lemon, 1999); as
well as satisfaction and profitability (E. W. Anderson, Fornell, & Lehmann, 1994). In
most cases satisfaction has been shown to be a complex factor, affecting some outcomes
Chapter 2: Literature Review
- 39 -
more than others, although customer satisfaction and performance outcomes have been
shown to be predominantly linear in nature; customer satisfaction increases as
performance improves (E. W. Anderson et al., 1994; Yeung et al., 2002). Although
satisfaction may not constitute a “unique, fundamental construct in and of itself”
(Bagozzi et al., 1999, p. 201), the cumulative perspective of customer satisfaction has
been considered and found to be significant both as a dependent and independent
variable in a number of studies (Ganesan, 1994; Leuthesser & Kohli, 1995).
2.5.4.2. Cooperation
Cooperation between firms has been defined as actions taken in order to achieve
mutually beneficial outcomes between the firms or independent singular outcomes with
the expectation of reciprocation over time (J. C. Anderson & Narus, 1990; Lewin &
Johnston, 1997). Trust, competitive strategy and dependency are generally considered a
precursor to cooperation (A. J. Campbell, 1998). Anderson and Narus (1990), using
social exchange theory and communications as the backdrop, found that firms meeting
or exceeding performance objectives through cooperation with other firms (partners)
cultivate trust and satisfaction (cf. Lewin & Johnston, 1997). They concluded that
cooperation is an antecedent not a consequence of trust, whereas Morgan and Hunt
(1994) found that commitment and trust leads to cooperation. This suggests that the
relationship between cooperation, trust and commitment is an iterative process requiring
a frank, honest and open exchange of information between the parties (J. C. Anderson &
Narus, 1990; Lewin & Johnston, 1997; Selnes, 1998). However cooperation is not
always based on trust or interdependency. Young and Wilkinson (1989) showed that in
certain instances cooperation is coerced by the more powerful member and justified by
the desired outcomes. Overall it was concluded that cooperation tended to overlap and
link strongly to trust and commitment, and that its inclusion as a distinct construct
would not add significant insight or explanatory power beyond those two constructs.
2.5.4.3. Power
Power, dependency and trust are intertwined to the extent that firms perceived to be
powerful can be more trusting, while those perceived less powerful are less trusting of
partners (Young & Wilkinson, 1989). Similarly, those firms most dependent are
generally more receptive to the stronger firms overtures and suggestions (J. C. Anderson
& Narus, 1990). The judicious exercise of power (acknowledged and accepted by the
Chapter 2: Literature Review
- 40 -
other party), can help create a mutually beneficial relationship (Dwyer et al., 1987;
Morgan & Hunt, 1994). However asymmetric power tends to leads to conflict, and
subsequent loss of trust and commitment, while mutual dependency leads to less
conflict (Morgan & Hunt, 1994; Young & Wilkinson, 1989). Asymmetric power may
be transient in nature (strongly favourable to the more powerful firm initially), yet over
time, given increased trust and commitment, culminate in lower risk, erode, or transfer
to the other party (Narayandas & Rangan, 2004). Iacobucci and Ostrom (1996) found
that good individual to individual relationships are generally balanced, symmetrical and
pleasant in nature. They suggested therefore that firms should concentrate on creating
the perception of a power balance in order to improve customer relationships. Given the
nature of the study (the effect of CRM technology adoption) and the strong interaction
between power and trust, the evidence for inclusion of power as a separate construct in
this study was not considered sufficient.
2.5.4.4. Performance of Duties
How each party performs, or is perceived to perform their duties (within and outside
the contract), affects the development, trust enhancement, and commitment within the
relationship (Narayandas & Rangan, 2004). In particular, performing above the
partner’s expectations, leads to trust and satisfaction with the partnership (J. C.
Anderson & Narus, 1990). Bolton (1998) modelled the effect of expected value on the
duration of the relationship, postulating that cumulative satisfaction anchors the
customers expectations. She found that a performance (service) ‘pluses and minuses’
balance sheet is taken into account with the cumulative effect of satisfaction being
positively related to performance over time (i.e., service continuation). Lemon, White,
and Winer (2002) investigated actual customer “service” purchase versus intention to
buy. Their results also demonstrated that customers incorporate an adaptive
expectations approach to repurchase services, that is, customers consider not only past
and current business performance measures of service but also project future
expectations and benefits of performance into their decision-making of retaining or
changing service providers. The Gruen et al. (2000) study found that performance of the
supplier positively affected customer participation and retention in professional
associations, without necessarily being mediated by commitment. Given the inclusion of
Sako’s (1992) competence trust construct, the performance of duty construct is
considered redundant for this study.
Chapter 2: Literature Review
- 41 -
2.5.4.5. Dependency
Dependency within a relationship relates to the relative power and therefore the
extent one party depends on (or must trust) the other party (J. C. Anderson & Narus,
1990). Some believe the development of interdependency is antecedent to a successful
relationship (Lendrum, 2003). However, increasing interdependence asymmetry can
decrease trust and commitment while increasing interfirm conflict. In addition Kumar,
Scheer, and Steenkamp (1995) demonstrated that relationships with greater total
interdependence exhibit higher trust, stronger commitment, and lower conflict than
relationships with lower interdependence, although perceived mutual benefit may
moderate feelings of asymmetrical dependence (Lewin & Johnston, 1997). Similarly
Geyskens et al. (1996) found evidence that interdependence enhances commitment, but
that the type of commitment will depend on trust.
However, Dwyer et al. (1987, p. 24) considered relationship development simply “a
process of ever-expanding interdependency between buyer and seller.” Furthermore
they suggested that any form of prolonged dependency (i.e., delayed payment or
scheduled delivery) initiates a relationship (expected or not), since an element of trust
and cooperation exists. Initially one firm within the relationship will be more dependent
on the other, but this dependency asymmetry can be offset over time based on
performance (within and outside contractual obligations), trust and commitment
(Narayandas & Rangan, 2004). Due to the complex interactions between dependency,
trust, power, performance and commitment, there was no compelling rationale to
include dependency as a separate construct in this study.
2.5.4.6. Duration
Duration of the relationship is thought to affect the ongoing relationship dynamics –
including trust, commitment and satisfaction (Gruen et al., 2000). Reynolds and Beatty
(1999) found that long-term satisfied customers perceive additional social benefits and
are more loyal to sales people as well as to the firm itself. Other studies however have
found a negative correlation to ongoing relationship development, explained by growing
too accustomed to each other, not challenging each other, or not initiating new
innovations (Doney & Cannon, 1997; Helfert et al., 2002). Due to the contradictory
results the duration construct was not included in this study.
Chapter 2: Literature Review
- 42 -
2.5.4.7. Rapport
Rapport or the chemistry between customer and supplier has been shown to aid the
development of trust between buyers and salespeople, as well as positively affect the
ongoing relationship dynamics between individuals and firms (Doney & Cannon, 1997).
The construct has been characterised as the quality of a relationship, enjoyable
interactions between participants, mutual trust, or simply ‘clicking’ with another person
(Bernieri, Gillis, Davis, & Grahe, 1996; Gfeller, Lynn, & Pribble, 1987; Gremler &
Gwinner, 2000; Puccinelli, Tickle-Degnen, & Rosenthal, 2003). Irrespective of the
definition, marketing researchers have recognised the value of establishing rapport
consistent with Gremler and Gwinner (2000) (DeWitt & Brady, 2003; Gremler &
Gwinner, 1998). Due to the lack of a clear definition of the rapport construct, and the
similarity between rapport measures reported in the literature and the relationship
strength and relationship quality constructs in the current study, rapport was not
included as a separate construct in this research.
2.5.5. Relationship Marketing Summary
Relationship marketing is considered an essential element of the current B2B
marketing mix. “The primary impetus behind the concept of relationship marketing is to
foster a long-term relationship and thereby create repeat purchases” (Yau et al., 2000, p.
1112). Although a number of B2B relationship factors were reviewed, trust,
commitment and communications are considered primary factors important to the
development and maintenance of business relationships (Morgan & Hunt, 1994).
Overall, the RM literature highlights the importance of incorporating these three factors
in any B2B relationship research.
As noted above, relationship marketing is considered an important element of
contemporary marketing, yet little CRM specific research has been published
investigating the effect of CRM technology adoption on relationship marketing
measures. However the extent and relative importance of relationship marketing within
a firm, as well as the customer relationships themselves, may depend on the firm’s level
of market orientation.
Chapter 2: Literature Review
- 43 -
2.6. Market Orientation (MO)
Although the term “market orientation” has been defined in a
number of ways (Kohli & Jaworski, 1990), several empirical studies
share the conclusion that market orientation (MO) has a positive
effect on business performance (Deshpandé, Farley, & Webster Jr.,
1993; Moorman & Rust, 1999; Narver & Slater, 1990). In
particular, Cano, Carrillat and Jaramillo (2004) identified, through
meta-analysis, that MO plays an important role in business performance and long-term
success, explaining approximately 12 percent of variance in business performance.
Market orientation has been defined as:
The generation of appropriate market intelligence pertaining to current and future customer needs, and the relative abilities of competitive entities to satisfy these needs; the integration and dissemination of such intelligence across departments; and the coordinated design and execution of the organization’s strategic response to market opportunities (Deng & Dart, 1994, p. 726).
Table 2.4 summarises dimensions of MO researched from selected key marketing
and customer orientation studies since 1982. Customer orientation refers to a firm’s
focus on the customer, for example, the ability to sense and respond to customer needs,
and can be defined as: understanding and meeting the customer’s ongoing needs,
addressing customer satisfaction, continuously creating customer value, providing after
sales support and demonstrating customer commitment. Competitor orientation
represents a firm’s focus on competitor activity, the ongoing collecting and
dissemination of competitor information throughout the business, the firm’s
responsiveness to competitor information and the firm’s ability to respond.
Interfunctional coordination conveys the firm’s ability to synchronise, coordinate and
Table 2.4: Market Orientation Dimensions Measured in Research
SOCO RMO
FactorsSaxe and Weitz
(1982)Narver and
Slater (1990)
Kohli, Jaworski and Kumar
(1993)
Deshpandé, Farley and Webster, Jr
(1993)
Deng and Dart (1994)
Gray, Matear, Boshoff and
Matheson (1998)
Helfert, Ritter and Walter
(2002)
Yau, McFetridge, Chow, Lee, Sin and
Tse (2000)Customer orientation X X X X X X X
Competitor orientation X X X X X
Interfunctional coordination X X X X X
Profit emphasis X X X
Long-term focus X
Responsiveness X XBonding XEmpathy XReciprocity XTrust X
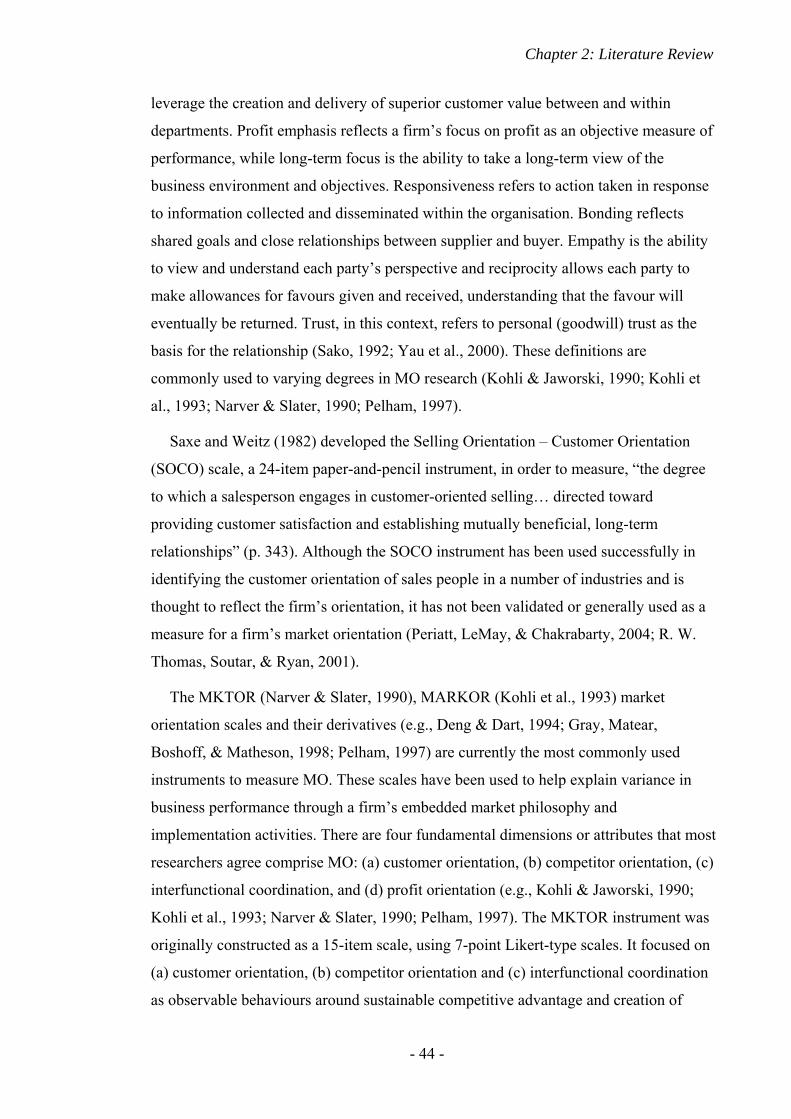
Chapter 2: Literature Review
- 44 -
leverage the creation and delivery of superior customer value between and within
departments. Profit emphasis reflects a firm’s focus on profit as an objective measure of
performance, while long-term focus is the ability to take a long-term view of the
business environment and objectives. Responsiveness refers to action taken in response
to information collected and disseminated within the organisation. Bonding reflects
shared goals and close relationships between supplier and buyer. Empathy is the ability
to view and understand each party’s perspective and reciprocity allows each party to
make allowances for favours given and received, understanding that the favour will
eventually be returned. Trust, in this context, refers to personal (goodwill) trust as the
basis for the relationship (Sako, 1992; Yau et al., 2000). These definitions are
commonly used to varying degrees in MO research (Kohli & Jaworski, 1990; Kohli et
al., 1993; Narver & Slater, 1990; Pelham, 1997).
Saxe and Weitz (1982) developed the Selling Orientation – Customer Orientation
(SOCO) scale, a 24-item paper-and-pencil instrument, in order to measure, “the degree
to which a salesperson engages in customer-oriented selling… directed toward
providing customer satisfaction and establishing mutually beneficial, long-term
relationships” (p. 343). Although the SOCO instrument has been used successfully in
identifying the customer orientation of sales people in a number of industries and is
thought to reflect the firm’s orientation, it has not been validated or generally used as a
measure for a firm’s market orientation (Periatt, LeMay, & Chakrabarty, 2004; R. W.
Thomas, Soutar, & Ryan, 2001).
The MKTOR (Narver & Slater, 1990), MARKOR (Kohli et al., 1993) market
orientation scales and their derivatives (e.g., Deng & Dart, 1994; Gray, Matear,
Boshoff, & Matheson, 1998; Pelham, 1997) are currently the most commonly used
instruments to measure MO. These scales have been used to help explain variance in
business performance through a firm’s embedded market philosophy and
implementation activities. There are four fundamental dimensions or attributes that most
researchers agree comprise MO: (a) customer orientation, (b) competitor orientation, (c)
interfunctional coordination, and (d) profit orientation (e.g., Kohli & Jaworski, 1990;
Kohli et al., 1993; Narver & Slater, 1990; Pelham, 1997). The MKTOR instrument was
originally constructed as a 15-item scale, using 7-point Likert-type scales. It focused on
(a) customer orientation, (b) competitor orientation and (c) interfunctional coordination
as observable behaviours around sustainable competitive advantage and creation of
Chapter 2: Literature Review
- 45 -
customer value (Narver & Slater, 1990). The MO score is the simple average from the
three behavioural score components. Following the scale development and testing,
Narver and Slater (1990) examined the MO construct against business performance. The
results indicated that “market orientation is strongly related to profitability and business
performance [and that] ... commodity business[es] with the greatest market orientation
have substantial control over their markets” (Narver & Slater, 1990, p. 32). In addition
their study supported the Kohli and Jaworski (1990) concept of MO as a continuum and
concluded that MO is “relevant in every business environment” (Narver & Slater, 1990,
p. 33).
Kohli, Jaworski, and Kumar’s (1993) criticism of Narver and Slater’s MKTOR
instrument was that it (a) is too narrowly focused on customers and competition, (b)
does not recognise the impact of speed of market intelligence gathering and
dissemination, and (c) includes items not specific to market orientation. The
subsequently developed MARKOR instrument provided additional validity to the MO
construct (Kohli et al., 1993). However in another study investigating the antecedents
and consequences of MO, Jaworski and Kohli (1993, p. 64) found a “linkage between a
market orientation and performance”, but could not substantiate a relationship between
MO and market share.
Pelham’s (1997) MO study of 160 small U.S. industrial firms supported an indirect
relationship between MO and profitability, mediated by firm effectiveness and sales
growth. In addition he found that MO impacted business performance more than any of
the other variables considered in the study; industry structure, and strategy (low cost and
differentiation). Varela and del Río (2003) investigated the Spanish food, timber and
chemical sectors using the simplified 20 item version of the MARKOR scale (Kohli et
al., 1993). Their results indicated that timeliness of information collection and
dissemination are important elements of a MO firm, as is senior management’s cultural
orientation and commitment to MO. In the Noble, Sinha and Kumar (2002) study,
analysing shareholder letters in US based mass merchandising company annual reports
over a period of years, performance was found to be positively influenced by sales
orientation, while production orientation and customer orientation were not significantly
related to performance assessment by senior executives. Narver and Slater (1990)
inferred that market orientation requires long-term attention, and that short-term
profitability should not be a primary focus of MO.
Chapter 2: Literature Review
- 46 -
Gray et al. (1998) believed that responsiveness to competitor action (timeliness) and
customer requirements is a necessary attribute of market orientation, while Helfert et
al’s (2002) empirical study indicated that market orientation, leading to resource
availability, is an antecedent to successful relationship performance. Studies have
demonstrated superior performance of MO in not-for-profit organisations (Cano et al.,
2004). On the other hand resource availability (or operational market orientation) may
simply reflect commitment (Morgan & Hunt, 1994).
Yau et al. (2000) believed that the existing MO instruments did not focus enough on
the customer relationship nor capture the effect or impact of relationships on business
performance. Therefore they developed a relationship marketing orientation (RMO)
instrument, consisting of four components; bonding (four items), empathy (three items),
reciprocity (three items) and trust (four items). They found the RMO construct exhibited
a significant, and more dominant, impact on business performance than did market
orientation as measured by the Narver and Slater (1990) MKTOR instrument. However
the RMO instrument only measured relationship and performance, and did not take into
account the broader MO perspective such as information collection and competition.
Market orientation “represents the foundation of high-quality marketing practice”
(Kohli et al., 1993, p. 467) and has been shown to positively influence customer
satisfaction which in turn leads to customer retention and increased profitability (Sanzo,
Santos, Vázquez, & Álvarez, 2003; Singh & Ranchod, 2004; Storbacka et al., 1994).
Although MO is widely viewed as the current basis of marketing philosophy (Hunt &
Morgan, 1995; McNamara, 1972; Sanzo et al., 2003; Varela & del Río, 2003), Gray et
al. (1998) noted that relatively few studies have attempted to generalise the results
across multiple industries and that there is more to be learned by using the MO
construct across a range of industries. Other studies suggest that a dyadic approach to
MO research may be beneficial since companies may be unable to accurately self-report
their customer orientation, implying it is the customer’s perception of a firm’s market
orientation that is related to performance (Deshpandé et al., 1993; S. Henderson, 1998).
Within the CRM context MO is best defined around the parameters central to CRM
systems and applications and proposed by a number of researchers, which are: focus on
customers, data collection, data analysis, responsiveness and dissemination of
information (Deng & Dart, 1994; Kohli et al., 1993; Narver & Slater, 1990). The
majority of definitions consider MO an adequate indicator of the level of market
Chapter 2: Literature Review
- 47 -
philosophy that guides the firm’s behaviour towards its customers (Day, 1994; Slater &
Narver, 1995) and may play a key role in the successful adoption of CRM technology
(Goodhue et al., 2002). This point is discussed and expanded on further in Section 2.8
Customer Relationship Management.
2.7. Relationship Performance
In contrast to business performance measures, such as financial
(i.e., ROI) and customer-centric measures (i.e., customer
satisfaction and retention) (e.g., Appiah-Adu & Singh, 1999),
relationship performance considers the overall relationship
behaviour and reflects customer satisfaction, loyalty, brand
awareness and overall performance compared to competitors, in addition to relationship
outcomes (Gray, Matear, & Matheson, 2002; J. W. Kim et al., 2004). Sales growth and
market share have been used as performance measures when investigating trust and
relationships across international borders (Aulakh, Kotabe, & Sahay, 1996).
Relationship performance has been successfully investigated in Chinese supplier firms
using subjective measures of commitment and profitability (Wilkinson & Wiley, 2000)
The different parties within a relationship may have diverse perspectives of the value
and performance of the existing relationship yet few studies have attempted to measure
relationship performance from both sides of the relationship dyad (Medlin, 2003). K.
Kim (2000) investigated the impact of power, trust and commitment within the US
industrial machinery industry on the solidarity of relationships between suppliers and
distributors. The dependent variable was dyadic solidarity – no other dependent variable
was tested or compared. Solidarity referred to the perceived unity, common goals and
positive relationships between the matched suppliers and distributors. The matched
responses (n = 67) to the questionnaire instrument, worded differently for supplier or
distributor, indicated that coercive influence is less likely in a relationship built on trust,
and commitment may not be sufficient to maintain a mutually beneficial relationship.
The author concluded that the dyadic analysis approach is an appropriate method to
investigate perceived and actual, firm and relationship performance.
Lages, Lages and Lages (2005) developed a relationship multidimensional scale
comprised of: (a) amount of information sharing, (b) communication quality, (c) long-
term orientation, and (d) satisfaction with the relationship. The authors found that the
Chapter 2: Literature Review
- 48 -
perception of the relationship between exporter and importer in the UK export industry
had a positive affect on export performance as measured through financial performance,
strategic performance and satisfaction with the export venture. Other researchers have
suggested that under certain circumstances satisfaction with business performance may
outweigh a lack of trust within the relationship and that more research needs to be
conducted on performance and satisfaction (Geyskens, Steenkamp, & Kumar, 1999).
Jayachandran et al.(2005) measured customer relationship performance through the
firm’s self-assessment of customer satisfaction and customer retention and found that
CRM technology use had a moderating effect on the association between relational
information processes (i.e., information capture, information integration, use and
access) and relationship performance. Their sample consisted of 172 key informants
(marketing, sales or customer service executives) from a variety of industries. Of the
172 responses however only 48 firms had implemented CRM technology. The Reinartz,
Krafft, and Hoyer (2004) study on the other hand indicated that CRM technology use
did not appear to significantly and positively effect financial performance. Their study
was conducted in the Austrian, German and Swiss financial, hospitality, online retail
and power utility consumer markets, using both primary and secondary data sources.
The sample consisted of 211 usable responses from executives responsible for CRM
operations. One explanation for the different results presented by Jayachandran et al. is
that the CRM technology effect may materialise “more easily and earlier on
intermediate process measures” (p. 190) than on financial performance outcomes.
The relationship research literature indicates that, depending on the objectives of the
research, it may be important to collect both economic and non-economic measures
separately and from both the supplier and customer perspectives (Geyskens &
Steenkamp, 2000; Geyskens et al., 1999; Medlin, 2003). These studies also indicate that
the source (i.e., objective or subjective) and type of business performance (i.e., financial
or non-financial) data is an important consideration and should reflect the purpose of the
study undertaken. The scarcity of research investigating the effect of CRM technology
adoption on customer relationship performance appears to be a significant research gap
and could enrich the relationship marketing literature.
Chapter 2: Literature Review
- 49 -
2.8. Customer Relationship Management (CRM)
Although the basis of CRM has been around since 1956 (e.g., the
segmentation of discrete customer groups), it is only within the last
6 to 10 years that CRM has created a significant impact in the
business world (Nairn, 2002). The management focus on
relationship marketing (specifically one-to-one marketing
techniques) (Peppers & Rogers, 1993; Peppers et al., 1999) and
market orientation (focused on collecting, analysing and disseminating large quantities
of customer data) helped create the opportunity for CRM technology. The rapid growth
of CRM can be attributed to: (a) fierce business competition for valuable customers, (b)
the economics of customer retention (i.e., life-time value) and (c) technology advances
(Buttle, 2004; Goodhue et al., 2002; Karimi et al., 2001; Ling & Yen, 2001; Winer,
2001).
CRM has been described from a number of different perspectives including
functional, technical and managerial aspects (Doherty & Lockett, 2007; Ngai, 2005;
Sathish, Pan, & Raman, 2002; Wright et al., 2002). From a management perspective,
due to the inherent focus on the customer, CRM is viewed as an important business
strategy and philosophy (e.g., Almquist et al., 2002; Beckett-Camarata, Camarata, &
Barker, 1998; Chang, Yen, Young, & Ku, 2002). Marketing academics view “CRM [as]
a concept that adds [practical] value to the meaning of customer orientation” (Wright et
al., 2002, p. 340), helps operationalise MO and provides marketing value (e.g., Aspinall,
Nancarrow, & Stone, 2001; Reinartz & Kumar, 2002; Rheault & Sheridan, 2002; Ryals,
2005; Srivastava, Shervani, & Fahey, 1999); while IT researchers appear primarily
interested in the technological and implementation aspects of CRM (e.g., Chalmeta,
2006; Cooper, Watson, Wixom, & Goodhue, 2000; Gefen & Ridings, 2002; Romano &
Fjermestad, 2001; Wells & Hess, 2002).
2.8.1. CRM Definition
Rigby et al. (2002a) state that most executives cannot readily define CRM, and
Greenberg (2002) quotes ten different definitions provided by leading CRM software
development business CEOs. Early definitions of CRM focused on the acquisition and
long-term retention of customers (Ling & Yen, 2001; The Data Warehousing Institute,
2000; Wyner, 1999). CRM as a business strategy is another common definition: “CRM
Chapter 2: Literature Review
- 50 -
is an approach or business strategy which provides seamless integration of every area of
business that touches the customer” (Sathish et al., 2002, p. 545). Others have defined
CRM in terms of the opportunity for profit maximisation, as in attracting and retaining
“economically valuable” customers while getting rid of “economically invaluable” ones
(Pan & Lee, 2003; Romano, 2000; Romano & Fjermestad, 2001). A number of studies
take a more integrative and holistic approach to CRM, attempting to define CRM jointly
through its relationship with technology and as a business strategy (Bose, 2002; Buttle,
2004; Dibb, 2001; Goodhue et al., 2002; J. Kim, Suh, & Hwang, 2003; Sathish et al.,
2002; The Data Warehousing Institute, 2000). This type of definition moves us closer to
capturing the dual aspects of CRM that need to be given consideration when assessing
the success or otherwise of actual CRM implementations. Each aspect considered on its
own is likely to yield an incomplete picture. Vendor (e.g., Oracle, PeopleSoft, SAP, and
Siebel) and practitioner magazine (e.g., destinationCRM.com, CRM Magazine, and
CRM Today) definitions focus on the profit potential of CRM technology
implementation. For example: “CRM…is a company-wide business strategy designed
to reduce costs and increase profitability by solidifying customer loyalty”
(destinationCRM, 2002).
CRM technology has also been viewed as providing the “glue” that integrates “front
office” (i.e., sales, support and marketing) and “back office” (i.e., ERP and/or order
fulfilment) applications for sales and marketing, via tools for detailed analysis and
modelling, along with the technology infrastructure to seamlessly provide a single
cohesive and comprehensive customer-facing unit (Buttle, 2004; I. J. Chen & Popovich,
2003). The contemporary view of CRM is defined more around using technology and IT
to help manage the relationship with customers. In general, CRM technology defining
characteristics and elements found within the extant literature generally focus around
the use of IT to: (a) acquire and retain long-term customers, (b) create a (long-term)
business strategy, (c) help implement CRM processes, and (d) increase profit (over
time).
This study adopts the more holistic CRM approach, reflecting the intent of
Gummesson (2004), and Ling and Yen (2001) regarding CRM as a customer-centric
business focus, shaped by the market orientation (MO) of the firm and implemented
through IT. In particular CRM includes the process of identifying, accepting and

Chapter 2: Literature Review
- 51 -
building appropriate mutually beneficial relationships with each customer (i.e., RM)
through the use of technology in order to maximise value for each party.
2.8.2. CRM IT Operational Model
At the most rudimentary level CRM functionality consists of contact manager
software that captures, stores and retrieves customer information in a stand-alone
configuration (e.g., Microsoft Outlook – Contact application) (Zikmund et al., 2003). At
the other end of the scale, CRM consists of a number of complex, integrated IT
components including data warehouses, data marts, analytical tools and applications
used to capture and analyse customer information from a variety of inbound
touchpoints, and provides integration to outbound touchpoints (e.g., MySAP and
Oracle) (Turban, McLean et al., 2003). The most highly sophisticated systems integrate
other functional areas of the business (e.g., incorporates ERP) (Greenberg, 2002;
O'Brien, 2004).
There are three main categories of CRM that can be implemented separately, phased
in, or integrated from the beginning – analytical, operational, and collaborative CRM.
Figure 2.4, adapted from the 2000 TDWI Study (The Data Warehousing Institute, 2000)
Ad HocQuery
Report
OLAP
Data Mining
AnalyticalApplications
Capture
Analyse
Plan
Extract, Transform, LoadProcesses
Analytical CRM Operational CRMAnalytical Tools
OutboundTouchpoints
InboundTouchpoints
Customer InfoPropensity Scores
Customer RecordsPersonal Offers
DataWarehouse
Web
CallCentre
Store
ATM
CampaignMgmt
ChurnAnalysis
PropensityScoring
Other
Extract, Transform, LoadProcesses
OperationalData Store Campaign
ResponsesCampaignResponses
E- mail
Direct Mail
MobileDevice
Tele-marketing
Ad HocQuery
Report
OLAP
Data Mining
Ad HocQuery
Report
OLAP
Data Mining
AnalyticalApplications
Capture
Analyse
Plan
Extract, Transform, LoadProcesses
Analytical CRM Operational CRMAnalytical Tools
OutboundTouchpoints
InboundTouchpoints
Customer InfoPropensity Scores
Customer InfoPropensity Scores
Customer RecordsPersonal Offers
Customer RecordsPersonal Offers
DataWarehouse
Web
CallCentre
Store
ATM
Web
CallCentre
Store
ATM
CampaignMgmt
ChurnAnalysis
PropensityScoring
Other
CampaignMgmt
ChurnAnalysis
PropensityScoring
Other
Extract, Transform, LoadProcesses
OperationalData Store Campaign
ResponsesCampaignResponses
CampaignResponsesCampaignResponses
E- mail
Direct Mail
MobileDevice
Tele-marketing
E- mail
Direct Mail
MobileDevice
Tele-marketing
Tele-marketing
Figure 2.4: CRM IT operational model
Source: Adapted from The Data Warehousing Institute (2000).
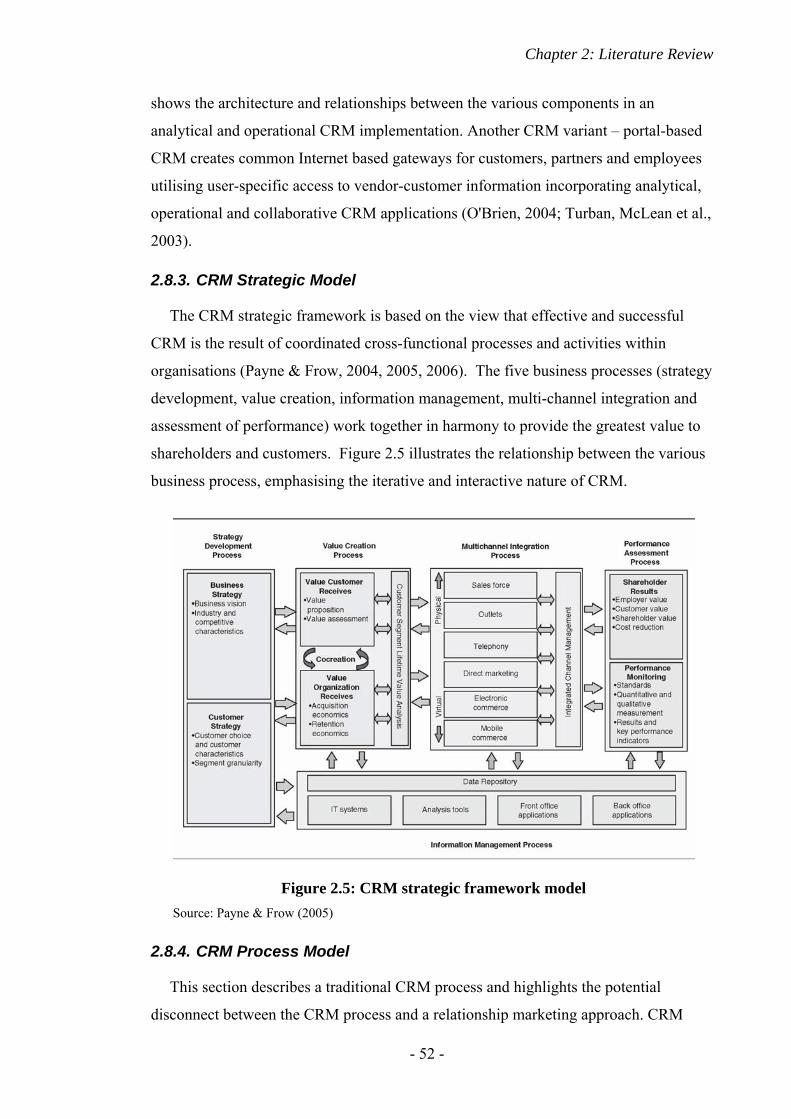
Chapter 2: Literature Review
- 52 -
shows the architecture and relationships between the various components in an
analytical and operational CRM implementation. Another CRM variant – portal-based
CRM creates common Internet based gateways for customers, partners and employees
utilising user-specific access to vendor-customer information incorporating analytical,
operational and collaborative CRM applications (O'Brien, 2004; Turban, McLean et al.,
2003).
2.8.3. CRM Strategic Model
The CRM strategic framework is based on the view that effective and successful
CRM is the result of coordinated cross-functional processes and activities within
organisations (Payne & Frow, 2004, 2005, 2006). The five business processes (strategy
development, value creation, information management, multi-channel integration and
assessment of performance) work together in harmony to provide the greatest value to
shareholders and customers. Figure 2.5 illustrates the relationship between the various
business process, emphasising the iterative and interactive nature of CRM.
2.8.4. CRM Process Model
This section describes a traditional CRM process and highlights the potential
disconnect between the CRM process and a relationship marketing approach. CRM
Figure 2.5: CRM strategic framework model Source: Payne & Frow (2005)

Chapter 2: Literature Review
- 53 -
systems are an integral component of the information technology growth to support and
improve the business “front office” and the customer relationship (O'Brien, 2004;
Turban, McLean et al., 2003). CRM technology is an IT application that consists of
three basic subsystems – a collection (input) component, a data base component, and a
delivery system (Goodhue et al., 2002; Zikmund et al., 2003). Other components may
include (but are not limited to) analysis tools and campaign management tools (Ling &
Yen, 2001; The Data Warehousing Institute, 2000). Some research literature
differentiates between CRM and e-CRM (electronic CRM) (e.g., Fjermestad &
Romano, 2003; Romano, 2000), while others view e-CRM as an extension of CRM
technology into the e-commerce realm, rather than a different application or system
(Greenberg, 2002; Turban, McLean et al., 2003).
Figure 2.6 depicts a process model of CRM, which involves (a) collecting customer
information on an ongoing basis, (b) using that knowledge to manage customer contact
through such activities as marketing campaigns and direct sales promotions, (c)
developing business and marketing strategies, (d) developing marketing programmes,
and (e) measuring success, while refining and enhancing the customer database (M. L.
Roberts, 2003; Zablah et al., 2004). The underlying assumption for the model is that the
firm conducts ongoing information collection, refines, enhances and applies the
information appropriately. Knowledge about the customer is collected, stored and made
available to customer contact personnel. As customer information is analysed, new
information is created, stored, transferred and marketing programs created and enacted.
Feedback is obtained from the marketplace, customer data is updated and refined, new
information is created and new programmes created. This CRM process is iterative and
Collect customer data
Manage customer
touchpoints
Develop marketing
programmes
Measure success
Feedback
Knowledgea b
c
d e
Develop business and marketing strategies• Segmentation• Value propositions: Product, Price, Distribution, Promotion
Collect customer data
Manage customer
touchpoints
Develop marketing
programmes
Measure success
Feedback
Knowledgea b
c
d e
Develop business and marketing strategies• Segmentation• Value propositions: Product, Price, Distribution, Promotion
Figure 2.6: CRM process model Source: Adapted from M. L. Roberts (2003)
Chapter 2: Literature Review
- 54 -
ongoing, and has similarities with knowledge management systems (KMS) (e.g., Alavi
& Leidner, 2001; Shoemaker, 2001; Zablah et al., 2004).
The model is similar to the underlying characteristics of market orientation discussed
previously, in that an MO firm is characterised by (a) continuous (near real-time)
customer data collection, (b) collecting competitor capabilities information, (c) sharing
information across departments and (d) using the information to create customer value
(Kerin et al., 2003; Kohli et al., 1993; Narver & Slater, 1990). However, the problems
with this process model include no direct linkages into the other areas of the
organisation (e.g., operations, finance and IT), and the fact that it is company focused,
not customer driven (cf. Kapoulas, Ellis, & Murphy, 2004). This traditional marketing
product focus, creating value propositions based on the 4P marketing mix model (i.e.,
process c in Figure 2.6), highlights a research gap. The traditional CRM process does
not adequately take into account the wider perspectives of relationship value and the
potential impact of the firm’s MO discussed earlier (Grönroos, 1990).
2.8.5. Current CRM Use
Today CRM is used primarily by sales, sales support and customer service staff
(including call centres and telemarketers) to portray a unified and coordinated point or
points of contact to customers. It is also used as a marketing tool to segment and target
customers, help develop marketing/sales programmes for targeted customers, and aid in
keeping track of customer activities (Ling & Yen, 2001; Shoemaker, 2001; Speier &
Venkatesh, 2002).
CRM requires the IT, and sales and marketing departments to work closely together
if the benefits of CRM are to be properly realised. Yet this has not always been the case
(Ryals & Knox, 2001; Yu, 2001). In addition CRM, by definition, and consistent with
an underlying MO philosophy, collects, stores and utilises detailed customer
information and hence is potentially a major potential contributor to organisational
knowledge and knowledge management (Alavi & Leidner, 2001; Davenport & Klahr,
1998; Kerin et al., 2003; Richard, 2003; Zablah et al., 2004).
From the practitioner perspective, CRM technology adds value to the business by: (a)
making it easy for customers to do business, (b) focusing on the end-customer for
products and services, (c) redesigning customer-facing business processes from the end-
customer’s point of view, (d) designing a comprehensive, evolving electronic business
Chapter 2: Literature Review
- 55 -
architecture, and (e) fostering customer loyalty (Turban, Rainer et al., 2003). CRM
systems also have the potential to become an integral component of “business
fulfilment,” adding customer value by integrating all the business components – from
sales through distribution (fulfilment) to invoicing and even receivables (Markowitz,
2002).
However, as discussed in detail below, CRM system implementation has received
mixed reviews in both the academic (e.g., Karimi et al., 2001; Ling & Yen, 2001; Speier
& Venkatesh, 2002) and popular literature (e.g., Arnold, 2002; Casselman, 2003; Le
Pla, 2002; Markowitz, 2002). The CRM industry suffers from “overpromising and
underdelivering” says Craig Conway, PeopleSoft Chief Executive and President, hence
CRM is seen as inadequately meeting today’s business needs let alone meeting their
potential for strategic business value (Markowitz, 2002).
2.8.6. CRM Issues
Although CRM is in some important respects consistent with marketing theory
(Abbott, Stone, & Buttle, 2001; Kotler, 2003; Ling & Yen, 2001), makes good business
sense (Buttle, 2004; Greenberg, 2002; Zikmund et al., 2003) and is available today from
a variety of suppliers (Turban, McLean et al., 2003), it has continued to face serious
difficulties and implementation failures (Adebanjo, 2003; Arnold, 2002; Davids, 1999;
Nairn, 2002; O'Brien, 2004; Raman & Pashupati, 2004; Rheault & Sheridan, 2002;
Turban, McLean et al., 2003). A number of popular business magazines (Le Pla, 2002;
Markowitz, 2002), as well as commercial research groups (IDC, 2002) have published
scathing reviews on the implementation of CRM technology, focusing on the lack of
commercial benefits gained from substantial CRM investment. Successful CRM
technology implementation and adoption requires visible, concentrated and long-term
senior management buy-in and significant organisational change if its full benefits are to
be realised (Bohling et al., 2006; Casselman, 2003; Fleischer, 2002; Ling & Yen, 2001;
Yu, 2001).
The underlying expectation of CRM technology is to deliver customer loyalty and
enhanced corporate profitability, however the META Group states that “55% of all
CRM projects don’t produce results” (R. Davis, 2002; Seligman, 2002). A survey of
1,500 companies found that 91% of businesses plan or have deployed CRM solutions,
however 41% of the firms with CRM projects were experiencing serious
Chapter 2: Literature Review
- 56 -
implementation problems (The Data Warehousing Institute, 2000). R. Davis (2002)
stated that up to 70% of companies had not realised any benefit from CRM technology
implementation or failed to meet basic company goals, such as ROI. This may in part
reflect the difficulty in identifying and matching the appropriate CRM investments and
returns (Ang & Buttle, 2002). Other studies indicate that 20% of senior executives
reported that CRM initiatives had failed to deliver profitable growth and in some cases
had even damaged existing customer relationships (Rigby et al., 2002a). In response
CRM vendors have undertaken new development, focusing on adding additional
features, benefits and value (Songini, 2002).
CRM “success” is not well defined in the IT or marketing literature. This can in part
be attributed to the difficulty in agreeing on a CRM definition, as well as the different
approaches to CRM research. The IT research focuses primarily on conceptualising and
understanding CRM system implementation issues (e.g., Brown & Vessey, 2003;
Goodhue et al., 2002; Plakoyiannaki & Tzokas, 2002), critical success factors (e.g.,
Bose, 2002; H.-W. Kim et al., 2002; Romano, 2000), and improving the use and
adoption of CRM (Ahn, Kim, & Han, 2003). Other researchers have defined CRM
success around the dimensions of systems quality, information quality and user
satisfaction, following and adapting the DeLone and McLean IS Success Model
(DeLone & McLean, 1992, 2003; H.-W. Kim et al., 2002). Brown and Vessey (2003, p.
66) defined the IT perspective of CRM implementation success most appropriately and
succinctly as: “an up-and-running system with agreed-upon requirements delivered
within schedule and budget.” There have been relatively few empirical studies
attempting to link CRM success directly with business performance or relationship
performance metrics such as market share and retention (e.g., Croteau & Li, 2003; J. W.
Kim et al., 2004).
This is in contrast to the marketing research, which has primarily been focused on the
impact of CRM on customer relationship measures (e.g., Day, 2000; Garbarino &
Johnson, 1999; Lemon et al., 2002; Reinartz & Kumar, 2003). This does not imply that
marketing researchers have ignored the potential business performance aspects of CRM,
and they have found for example that CRM technology tends to positively influence
business performance and customer satisfaction measures (e.g., Gummesson, 2004;
Raman & Pashupati, 2004; Reinartz et al., 2004; Srinivasan & Moorman, 2005).
Chapter 2: Literature Review
- 57 -
CRM marketing research attempts to link success more directly to business
performance measures, while also investigating the interaction of RM implementation
and IT efficiencies (e.g., Gummesson, 2004; Lemon et al., 2002; Peppard, 2000;
Reinartz et al., 2004). The management literature appears to have a more general view
of CRM “success” focusing on how to use CRM as a change catalyst to stimulate
business growth (Rigby & Ledingham, 2004; Seybold, 2001) or support customer
oriented business strategies (Reinartz & Kumar, 2002; Winer, 2001; Zeithaml, Rust, &
Lemon, 2001). The extant literature suggests that CRM “success” is predicated on:
successful CRM system implementation (Brown & Vessey, 2003; Ling & Yen, 2001),
CRM’s ability to support the customer facing aspects of an MO business approach
(Gummesson, 2004; Raman & Pashupati, 2004), and improving economic performance
(Reinartz et al., 2004).
It is evident that the poor results reported for CRM implementation can be partly
explained by the conflicting CRM models and related research. Some of the issues
related to measures of CRM success include the inability to a) isolate, test and examine
CRM technology factors apart from CRM strategic, organisational and business factors;
b) correctly isolate and separate CRM investment; and c) identify and measure the
dependent variable(s)(e.g., loyalty, retention or profitability) (Ang & Buttle, 2006; J.
Kim et al., 2003; Reinartz et al., 2004). CRM research has tended to emphasise
increased profitability, performance improvements and customer retention with little or
no focus on measuring relationship development (Aspinall et al., 2001; Hirschowitz,
2001). The limited reports of CRM accomplishment have generally focused on project
management success, improved data quality, management leadership and strategic
readiness for CRM implementation (Bohling et al., 2006; Bose, 2002; Kennedy,
Kelleher, & Quigley, 2006; Nguyen et al., 2007; Yu, 2001). Others consider the basis of
CRM evaluation and success as a customer intimacy issue and that customers should be
able to see some improvement in relationship measures from a successful CRM
technology implementation (e.g., Payne, 2006).
The CRM implementation challenges have been compared to the early days of ERP
implementation, implying that it may only be a matter of time before the factors which
make CRM technology successful are understood and measurable benefits are more
fully realised (Brown & Vessey, 2003; Sheng, 2002; Woodcock & Starkey, 2001; Yu,
2001). The majority of CRM IT research, although focused on what needs to take place
Chapter 2: Literature Review
- 58 -
within an organisation to implement CRM successfully (Chalmeta, 2006; Nguyen et al.,
2007) does parallel the business philosophy and MO aspects discussed earlier. Some of
the critical factors in CRM implementation, discussed in detail in the next few sections,
include: a customer oriented culture; the IT management approach; executive
commitment, and the integration of people, process and technology.
2.8.7. Customer (Market) Orientation
Both the marketing and IT literatures agree that a customer-centric focus (market
orientation) is considered an essential theoretical foundation for CRM success (Davids,
1999; Ling & Yen, 2001; Lloyd, Scullin, Allora, & Fjermestad, 2001; Plakoyiannaki &
Tzokas, 2002) and this is supported by case study research from both domains (Abbott
et al., 2001; Goodhue et al., 2002; Wright et al., 2002). The case study research,
primarily carried out in the U.S.A. and the U.K., emphasises that relationship marketing
needs to be accepted as the core strategy across the company and highlights the
importance of customer relationships at all levels of the organisation, with customer
loyalty a high priority.
Fundamental to CRM strategy development and success, from a marketing outlook,
is the need to embrace ongoing relationships with customers (Abbott et al., 2001).
Reviews of existing CRM implementations, from both marketing and IT perspectives,
highlight the need to develop customer focused business strategies before attempting to
implement CRM (Lloyd et al., 2001; Rigby et al., 2002a). In addition the IT literature
suggests, for CRM to deliver optimum benefit, this marketing focus must be a business
strategy accepted throughout the firm (Ling & Yen, 2001). Furthermore, marketing
research indicates that CRM adds value to the concept of customer orientation. Wright
et al. (2002) examined how CRM has altered traditional marketing views. They
concluded that CRM technology is only an enabler, while CRM itself is an attitude that
must be cultivated in people, processes and management in order for “CRM” to be fully
successful. Firms identified as not marketing or customer focused were found to be slow
to adopt CRM (Abbott et al., 2001).
The customer centric philosophy that the IT literature discusses is similar to the
market orientation concept found in the marketing literature, which highlights a research
gap between the two research domains. That is, although the importance of a customer-
oriented business philosophy has been cited as critical to CRM technology
Chapter 2: Literature Review
- 59 -
implementation success, little empirical research is available in the extant literature
linking MO to CRM technology implementation.
2.8.8. Information Technology Management
CRM technology implementation success may simply be the result of IT
management practices. IT management sophistication describes the level of IT maturity
within the firm (Karimi et al., 2001; Stefanou et al., 2003). In an empirical study
investigating the role of IT steering committees and IT maturity Karimi, Bhattacherjee,
Gupta and Somers (2000) found that IT management sophistication within a firm can be
characterised by the degree, complexity and level of IT planning, control, organisation
and integration.
A company’s IT maturity refers to the focus and capability of the firm to involve (a)
top-down planning process linking IT strategy to business requirements, (b) broad
distribution of application technology transfer, and (c) effective exploitation of IT
through technology integration (Johnston & Carrico, 1988; Karimi, Gupta, & Somers,
1996a, 1996b). Karimi et al. (2001), investigating the impact of IT management and
leadership on CRM implementation developed a questionnaire to measure IT
management sophistication and IT leadership with respect to CRM technology
adoption, along with IT’s potential for impact on marketing and operations. The authors
identified IT-leader firms as having an above average potential for IT to positively
impact marketing and operations. IT-enabled customer focused firms have the same
potential to impact marketing, but not operations. IT-enabled operations firms have the
same potential, as the IT-leader firms, to impact operations but not marketing. The IT-
laggard firms have less than average potential for their CRM technology
implementation to impact marketing and operations. The results indicated that IT
management practices within a firm have significant implications for CRM technology
adoption and success, but the authors did not compare the results against existing
marketing management practices or the potential effect on customer relationships.
2.8.9. Executive Commitment
The IT literature indicates that senior level champions are necessary for IT systems’
adoption and success, and CRM is no exception (Beath, 1991; Bose, 2002; Howell &
Higgins, 1990; H.-W. Kim et al., 2002; J. Lee & Runge, 2001; Ling & Yen, 2001;
Mirchandani & Motwani, 2001; Palvia & Chervany, 1995). CRM adoption needs to be
Chapter 2: Literature Review
- 60 -
demonstrated throughout the organisation in order to obtain management and employee
buy-in, create or maintain a customer-oriented culture and embrace a culture of change
(Fjermestad & Romano, 2003; Hansotia, 2002; Plakoyiannaki & Tzokas, 2002). Clear
communication and resource commitment from senior management facilitates IT
system deployment (Gefen & Ridings, 2002), and acceptance within organisations;
“commitment was needed from people at the top of the company” in order to make
CRM “happen” (Abbott et al., 2001, p. 28).
Based on their studies of ERP projects over the last 10 years, Brown and Vessey
(2003) found that top management must be “engaged in the project, not just involved”
(p. 66) to achieve CRM system implementation success. Croteau and Li (2003) found,
in their study of 57 large Canadian firms, significant relationships between senior
management support and CRM impact, and also between knowledge management
capabilities and RM impact. However the level of sponsorship required varied
depending on the organisational level (i.e., departmental or corporate-wide) and
sophistication (i.e., personal contact management or enterprise-wide integration) of the
CRM system implemented (Gallivan, 2001; Goodhue et al., 2002). The focus,
engagement and leadership from senior management plays an essential role in
establishing and maintaining customer orientation, reducing resistance, and improving
usability – all critical to CRM implementation success (Kennedy et al., 2006; Locander,
Hamilton, Ladik, & Stuart, 2002; Markus, 1983).
The executive commitment factor reinforces the importance of IT management
practices and the market orientation of the business firm in the adoption and successful
implementation of CRM technology.
2.8.10. Integration of People, Process and Technology
Taking an integrative and balanced approach to people, process and technology is
important. Speier and Venkatesh (2002) explored the role of the sales person in
sustaining CRM practices since adoption is required to support CRM. Their premise
was that sales force automation (SFA) provides salespeople with tools which enhance
their knowledge of customers, providing the ability to generate better and more timely
alternatives and decisions, improving customer relationships and hence productivity.
Using a theoretical lens of technical diffusion and identity theory they studied two
organisations in which SFA had been rejected in order to ascertain why SFA had failed.
Chapter 2: Literature Review
- 61 -
They concluded that forcing technology sales tools onto an unprepared sales force might
create significant conflict within sales people, to the extent that some become
disgruntled and voluntarily leave the company. In a similar vein, Bush, Moore and
Rocco (2005) found that sales force buy-in, to both the technology and any
organisational change, was critical to the successful adoption of CRM.
Sathish, Pan, and Raman (2002) defined a CRM organisation as one that successfully
implements a business strategy providing seamless customer touch points through
integration of people, process and technology. Plakoyiannaki and Tzokas’ (2002)
proposed a building block approach to CRM encompassing people, process and
technology: (a) create a customer oriented corporate view, (b) focus on customer value
creation, (c) collect and transform data to gain customer insight, (d) introduce a
knowledge management process for knowledge creation and dissemination, (e) segment
markets and prepare profitable customer portfolios, (f) continually define, develop and
deliver value propositions, (g) enhance the value proposition through innovative use of
campaign and channel management, and (h) measure performance to help decision-
making. Implementing CRM is thought to not only require significant business process
changes, but also is considered a catalyst for business process re-engineering (Hansotia,
2002). A critical element of CRM deployment is understanding existing business
processes before CRM is actually deployed (Buttle, 2004).
The impetus for CRM technology infrastructure efforts often comes from the IT
group because IT professionals see not only the opportunities for enterprise wide
systems, but also difficulties caused by non-standardized infrastructures (Goodhue et
al., 2002). However Ling and Yen (2001) theoretically analysed CRM technology
implementations and concluded that CRM technology success for firms arises from the
successful and innovative utilisation of customer information formed around the
effective collaboration of IT and marketing. Although the literature recognises the
potential impact of IT to provide the basis for a sustainable competitive advantage
(Bharadwaj, Varadarajan, & Fahy, 1993), it is imperative that IT and marketing
departments work closely together on CRM system implementation (Ling & Yen, 2001;
Yu, 2001).
Ling and Yen (2001) proposed a methodology for CRM implementation and
suggested firm’s need to resolve legacy systems issues and stand-alone product related
processes and systems in order to: (a) become customer centric, (b) capture customer
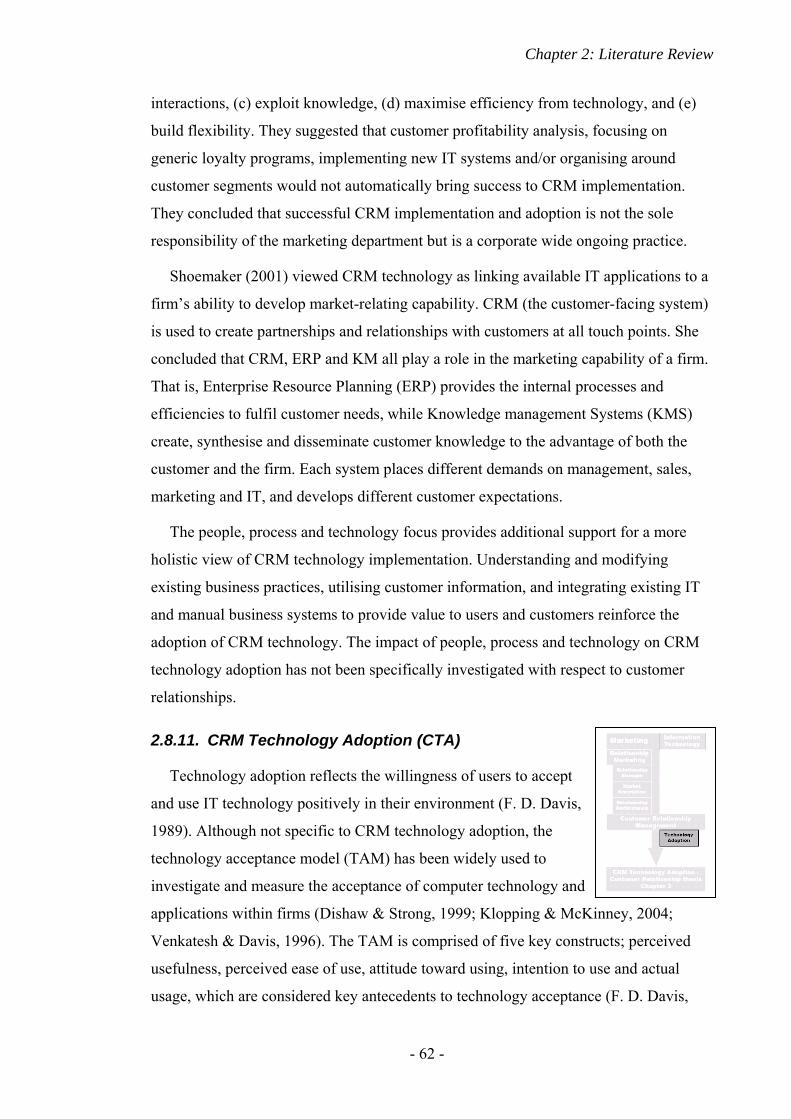
Chapter 2: Literature Review
- 62 -
interactions, (c) exploit knowledge, (d) maximise efficiency from technology, and (e)
build flexibility. They suggested that customer profitability analysis, focusing on
generic loyalty programs, implementing new IT systems and/or organising around
customer segments would not automatically bring success to CRM implementation.
They concluded that successful CRM implementation and adoption is not the sole
responsibility of the marketing department but is a corporate wide ongoing practice.
Shoemaker (2001) viewed CRM technology as linking available IT applications to a
firm’s ability to develop market-relating capability. CRM (the customer-facing system)
is used to create partnerships and relationships with customers at all touch points. She
concluded that CRM, ERP and KM all play a role in the marketing capability of a firm.
That is, Enterprise Resource Planning (ERP) provides the internal processes and
efficiencies to fulfil customer needs, while Knowledge management Systems (KMS)
create, synthesise and disseminate customer knowledge to the advantage of both the
customer and the firm. Each system places different demands on management, sales,
marketing and IT, and develops different customer expectations.
The people, process and technology focus provides additional support for a more
holistic view of CRM technology implementation. Understanding and modifying
existing business practices, utilising customer information, and integrating existing IT
and manual business systems to provide value to users and customers reinforce the
adoption of CRM technology. The impact of people, process and technology on CRM
technology adoption has not been specifically investigated with respect to customer
relationships.
2.8.11. CRM Technology Adoption (CTA)
Technology adoption reflects the willingness of users to accept
and use IT technology positively in their environment (F. D. Davis,
1989). Although not specific to CRM technology adoption, the
technology acceptance model (TAM) has been widely used to
investigate and measure the acceptance of computer technology and
applications within firms (Dishaw & Strong, 1999; Klopping & McKinney, 2004;
Venkatesh & Davis, 1996). The TAM is comprised of five key constructs; perceived
usefulness, perceived ease of use, attitude toward using, intention to use and actual
usage, which are considered key antecedents to technology acceptance (F. D. Davis,
Chapter 2: Literature Review
- 63 -
Bagozzi, & Warshaw, 1989; Venkatesh & Davis, 2000). Although there is evidence that
user acceptance is important and necessary for CRM technology adoption within a firm,
there has been relatively little CRM specific research published in this area (Speier &
Venkatesh, 2002). Wu and Wu (2005), using a modified TAM questionnaire with CIOs
as respondents, found among other results, that a user’s attitude to use CRM depends on
the perceived usefulness and not on ease of use, and that the relative advantage of using
CRM technology can predict attitudes to use CRM. In addition trust and perceived ease
of use in the online world are intertwined and have been found to be positively related
to the use of e-vendor web sites (Gefen, Karahanna, & Straub, 2003).
CRM technology offers the opportunity to add customer value (and perceived
usefulness) through the knowledge management capabilities (Massey, Montoya-Weiss,
& Holcom, 2001; Rowley, 2002; Zablah et al., 2004). Payne and Frow (2005; 2006)
view value creation as part of the process involved in a comprehensive CRM strategy.
They consider three elements as central to value creation: (a) what value the firm can
provide to customers, (b) what value the firm can receive from customers, and (c)
managing the value exchange.
Choosing functionality and integrating CRM technology with existing systems
presents two of the most difficult and expensive undertakings and has led to perceived
CRM failure and user discontent (Brown & Vessey, 2003; Goodhue et al., 2002; Ling &
Yen, 2001). Raman and Pashupati (2004) asked respondents to identify their CRM
system functionality. They found that CRM users categorised functionality as: Sales
Force Automation (60.4%), Collaborative Communication (37%), Marketing
Automation (33.3%), and Customer Service Functions (25.9%). In addition, four areas
of CRM analytics were identified by the respondents: forecast customer preferences
(33%), evaluate channel performance (28%), track customer loyalty (25%), and
calculate retention rates (19%). The measurement technique the authors used allowed
respondents to describe the use of CRM technology within their firm; however this
technique was limited by the respondents’ understanding of technology, their ability to
communicate that functionality, and the researcher’s interpretation of the respondent’s
written meaning of the CRM functionality.
Stefanou et al. (2003), in their CRM investigation of large Greek organisations, also
collected information regarding the type of IT and CRM systems used. Only descriptive
statistics were supplied, with 53.4 percent of the respondents reporting implementing
Chapter 2: Literature Review
- 64 -
ERP systems, 21.9 percent using non-ERP systems and 24.7 percent employing
customised or in-house systems. Of concern is that nearly 50 percent of the respondents
did not answer this question, possibly reflecting their lack of specific IT system
knowledge. Neither study (Raman & Pashupati, 2004; Stefanou et al., 2003) reported
system functionality or integration as a potential independent variable linked to
relationship quality or performance. Although there were indications that the level of
CRM technology employed did reflect the level of customer-centricity within the firm,
it was not related to customer-centric initiatives, such as customer satisfaction research
(Stefanou et al., 2003).
The extent of CRM systems integration throughout the organisation has been raised
as a potential source of concern for CRM adoption and success (e.g., Ling & Yen, 2001;
Zeng, Wen, & Yen, 2003). Meyer and Kolbe (2005) identified a number of CRM
technology integration layers (social, process, technical and organisational) and
characteristics (resource collaboration or communication interaction), and suggested
that successful CRM integration included inter-departmental and inter-organisational
activities, spanning strategy, processes and systems within and outside the company.
Technology acceptance, functionality and integration, as outlined herein, appear to
provide a sound basis from which to investigate CRM technology adoption and the
effect on customer relationships.
2.8.11.1. CRM Influence on Relationships
Conceptually CRM technology adoption should enhance the ability for firms to
influence and contribute positively to the antecedents and factors affecting trust,
commitment and communication quality while helping to initiate, develop and sustain
customer relationships (Berry, 1995; Kapoulas et al., 2004; Ling & Yen, 2001; Mitussis
et al., 2006; Too, Souchon, & Thirkell, 2001). Peters and Fletcher (2004b) demonstrated
that by introducing CRM technology responsibly and respecting data privacy issues,
customers are more willing to provide additional, detailed and pertinent information to
suppliers, which in turn permits suppliers to better satisfy and communicate with
customers – gaining their trust and commitment (although this may not always be the
case (Croteau & Li, 2003)). This “better” information and trusting relationship
culminates in improved overall performance for the firm, as indicated by business
performance and relationship performance metrics (Croteau & Li, 2003; Karimi et al.,
Chapter 2: Literature Review
- 65 -
2001). Mithas, Krishnan and Fornell (2005), in their cross-sectional study of U.S. firms,
found a positive effect between CRM technology use and customer knowledge and
customer satisfaction. The J. W. Kim et al. (2004) study of 263 Korean appliance
manufacturers and retailers found that CRM adoption does improve manufacturer-
retailer relationship quality in terms of sales effectiveness, relationship strength and
marketing efficiency.
Lang and Colgate (2003) demonstrated that customers’ expectation and perception of
IT significantly influenced their perception of relationship quality in the banking
industry. The authors collected questionnaire data from 1,346 New Zealanders (55.5%
response rate) focused on identifying IT gaps, that is, the difference between a
customer’s preferred usage of various IT mediums and what is available to them in the
banking industry. A positive IT gap meant customers prefer to use more IT for business
interaction, while a negative IT gap meant the customer would prefer to use less IT. The
results showed that IT had a significant impact on relationships. Trust, satisfaction and
conflict showed the most sensitivity to the IT gap, while commitment and social
bonding were less so. Lang and Colgate concluded that customers with any perception
of an IT gap view their relationship as weaker than those who are satisfied with the level
of IT use. Furthermore, understanding how customers want to use IT to interact, and
making it as easy as possible to do so, can enhance relationships. Karimi, Somers and
Gupta (2001) identified that CRM systems can play a major role improving customer
service (customer satisfaction and customer retention). They suggested that further
research can be directed at examining integration of CRM technologies, how to use IT
to delight, engage, entertain and energize the customer and create a personalised
experience for customers. But again there was little mention how CRM technology can
help relationships.
Other studies have found that the use of CRM technology and data base applications
can build stronger relationship through cross-selling and up-selling (Kamakura,
Ramaswami, & Srivastava, 1991; Kamakura, Wedel, de Rosa, & Mazzon, 2003).
However, Cass and Lauer (2002) examined relationships in the light of CRM
technology and concluded that firms manage customers through CRM according to the
firm’s plan – not the customer’s plan. The whole customer (e.g., background, history
and experiences) is not recognised through CRM technology, only pertinent
transactional attributes (i.e., a reductionist view of the data and the customer) are
Chapter 2: Literature Review
- 66 -
recognised, collected, analysed and dealt with, which may not reflect the actual
customer as a person, nor necessarily lead to a mutually valued relationship. Cochran
(2004) extended this view further and concluded that if companies did not provide real,
tangible customer benefits information sharing will stop and only transactional
relationships will persist. Sathish et al. (2002) suggested that considerable research is
still required in order to fully understand the CRM phenomenon, but do not mention
relationship development or maintenance.
2.8.12. Other CRM Considerations
In commercialising CRM applications little focus has been placed on existing RM
theory and CRM’s potential to develop stronger ties to relationship building at a
fundamental level. For example, the CRM business process (refer to Figure 2.6)
employs product, price, place (distribution) and promotion as fundamental elements of
the business and marketing strategies, yet the current marketing literature views the 4Ps
as insufficient to create, develop, sustain or enhance relationships (Grönroos, 1994a;
Gummesson, 2002; Vargo & Lusch, 2004). Although Winer (2001) identified the need
for a relationship component within his seven component CRM evaluation framework,
he did not expand upon the necessary elements, techniques or applications to achieve or
measure this component. Romano (2000) and Romano and Fjermestad (2001) do not
specifically include a relationship component in their five areas for future CRM IT
research:
1. Markets, consisting of participants, resource allocation, transactions and
communications,
2. Business models, involving logistics, communication channels, intermediation,
branding and portals and/or hubs
3. Knowledge management (KM), including repositories, ownership,
transformation, KM process, and people management
4. Technology, for example user interface, media (voice/video) and virtual reality
5. Human factors including accessibility, usability, privacy, trust, behaviours, and
attitudes.
CRM and customer support involves a high degree of data and information
management involving a balance between human and computer-based knowledge
(Davenport & Klahr, 1998). Knowledge management capabilities within the
Chapter 2: Literature Review
- 67 -
organisation was found to be one of two key factors affecting CRM impact (Croteau &
Li, 2003); while Shoemaker’s (2001) work indicated an opportunity for IT and
marketing departments to work together to build knowledge management systems
alongside CRM systems to help develop sustainable competitive advantage.
In spite of the recognised high CRM technology implementation failure rate (e.g.,
Adebanjo, 2003; Fjermestad & Romano, 2003; Rheault & Sheridan, 2002), the literature
does indicate that CRM technology may provide long-term benefits for business and
customers (Bohling et al., 2006; Gummesson, 2004; M. Meyer & Kolbe, 2005).
However two underlying research gaps are apparent: (a) a lack of common CRM
knowledge and understanding between technology (IT departments), users (Sales and
Marketing departments), and senior management vision and direction; and (b) the lack
of focus on the linkage between CRM technology adoption and customer relationships
(Ling & Yen, 2001; Shoemaker, 2001).
2.9. Customer Relationship Orientation and Customer Expectations
A B2B relationship consists of two willing parties using relationship components
such as mutual trust and commitment to initiate and maintain their relation (Gounaris,
2005; Yau et al., 2000). Yet the relationship process may not be completely reciprocal
between the buyer and the seller; in any specific instance sellers may want a relationship
while customers may prefer single transactions (Grönroos, 1991). Although there are
models that identify the unique perspective of customers in an exchange, few studies
have empirically investigated the effect of the customer’s orientation toward B2B
relationships (Pels, Coviello, & Brodie, 2000).
The customer’s orientation towards initiating and continuing a relationship has an
effect on the development of the relationship, and has been shown to moderate the
impact of relationship investment and the subsequent outcomes (De Wulf, Odekerken-
Schroder, & Iacobucci, 2001; Palmatier et al., 2006; Peters & Fletcher, 2004b). Ganesan
(1994) found that the customer’s relationship orientation played an important part in the
development and continuation of relationships. For example, some customers
considered short-term relationships advantageous and would pursue short-term gains
(i.e., price reduction). Peters and Fletcher (2004b, p. 61) investigated “the relationship
orientation exhibited by the respondent towards a company nominated by them [the
respondent]” by measuring the customer’s trust and commitment, on a seven-item
Chapter 2: Literature Review
- 68 -
instrument. The sample consisted of 108 (22% response rate) questionnaires completed
by customers who had received direct mail within the prior two days. The authors were
interested in whether the customer’s relationship orientation toward their nominated
firm had any bearing on their: (a) information privacy concerns, (b) trust of the use of
data collected by firms, and (c) receptivity to direct marketing. The findings suggested
that the customer’s relationship orientation may be positively influenced by responsible
data use. Another study, using a series of four focus groups to investigate customer
attitudes toward RM in the financial services industry, found that some customers “did
not embrace RM themselves because of an overriding wish to limit and control the
boundaries of the relationship” (Kapoulas et al., 2004, p. 41). Furthermore “several e-
customers [bold in original] did not appreciate (nor desire) FSIs’ [financial service
firms’] attempts to move towards RM, whereas others favoured these latest moves” (p.
39).
In addition customers having a positive relationship orientation may be more inclined
to view relationship performance positively, or alternatively imprint specific
expectations as to what that relationship should entail (Garbarino & Johnson, 1999). A
case study of an industrial chemical manufacturer found that customers do form
additional expectations from a relationship after CRM technology is adopted by the
manufacturer (Richard, Thirkell, & Huff, 2007). There was an expectation that CRM
technology-enabled suppliers would understand and deal with customer issues better
(e.g., reducing frequency of late deliveries, running out of stock, and improving supply
chain management) and that suppliers would have a better overall understanding of the
customers’ business and therefore better meet the customer’s specific needs. Customers
also perceived more frequent and productive customer-supplier meetings.
The effect of a customer relationship orientation may moderate the relationship
between suppliers and customers in a B2B environment. Similarly customers may
develop expectations from a supplier’s adoption of CRM technology, which may
moderate certain aspects of the relationship performance.
2.10. Chapter Summary
The CRM research to date has focused on CRM technology implementation issues,
identifying critical CRM success factors (process, management and stakeholders), and
highlighting CRM benefit for sales, marketing and the firm (but rarely extended to the

Chapter 2: Literature Review
- 69 -
customer, (cf. Kapoulas et al., 2004)). Market orientation (MO), relationship marketing
(RM) and customer relationship management (CRM) are important concepts in current
marketing theory and practice. Factors found in the IT and marketing literature that
reputably affect CRM adoption and success include:
1. Market orientation (Abbott et al., 2001; Davids, 1999; French, 2001; Goodhue
et al., 2002; Ling & Yen, 2001; Lloyd et al., 2001; Plakoyiannaki & Tzokas,
2002; Reinartz et al., 2004; Rigby et al., 2002a),
2. IT management orientation (Karimi et al., 2000; Karimi et al., 2001)
3. The ability to build customer relationships (Fournier, Dobscha, & Mick, 1998;
Pan & Lee, 2003; Rigby et al., 2002a).
4. People, process and technology issues, including CRM acceptance (Lloyd et
al., 2001; Speier & Venkatesh, 2002).
The decision to implement CRM technology can be a change catalyst for business
reengineering while refocusing the business on contemporary metrics such as customer
lifetime value, retention rate, and customer satisfaction (Goodhue et al., 2002;
Shoemaker, 2001). Common themes found in the CRM marketing and IT literatures
include the impact of market orientation and the relationship between people, process,
and technology. CRM research is also increasing in the areas of customer acquisition,
development and retention (Kamakura et al., 2005; Ngai, 2005).
Fundamentally, CRM technology adoption is viewed by both IT and marketing
academics and researchers, and portrayed by vendors and academics, as a practical
approach to RM (Greenberg, 2002; Gummesson, 2004; Turban, McLean et al., 2003).
However there are few empirical studies linking MO, CRM and RM (Tuominen, Rajala,
& Möller, 2004). Additional empirical research linking CRM and market orientation is
required in order to help focus the different perspectives and consolidate the current
conceptualisations and theory (Helfert et al., 2002).
The level of IT management practices, reflecting the influence of IT management on
business practices within a firm, has been shown to effect CRM performance outcomes
with respect to customer satisfaction measures (Karimi et al., 2001). However the
specific influence of such IT management practices on the adoption of CRM technology
within the firm has not been fully investigated.
Chapter 2: Literature Review
- 70 -
There are few CRM studies specifically investigating the impact of CRM
functionality adopted or level of CRM system integration within the firm. Although
some studies describe the CRM functional components in place at the time of the study
(e.g., Abbott et al., 2001; Brown & Vessey, 2003; Goodhue et al., 2002), most do not.
Stefanou et al. (2003) and Raman and Pashupati (2004) are two studies that do identify
and collect CRM functionality and integration data from respondents, but give limited
discussion to the impact. Another study found that the extent of CRM technology
adopted (based on a hypothesised CRM process measured through formative indicators)
did not have a significant impact on economic performance (Reinartz et al., 2004).
However the impact of the extent of CRM acceptance within a firm on relationship
strength and performance (i.e., customer satisfaction, loyalty and retention) has not been
adequately investigated or detailed (Raman & Pashupati, 2004; Stefanou et al., 2003).
Other than the more technical issues necessary for CRM technology adoption and
success, knowledge utilisation has also been shown to be important to the adoption and
success of CRM (i.e., a reflection of CRM usefulness) (Bose & Sugumaran, 2003; F. D.
Davis, 1989).
Little empirical CRM-related research has been undertaken in the areas of initiation,
development and sustaining customer relationships. It takes two for a relationship and
the customer needs to view the proposal for a relationship and its outcomes positively as
well (Fournier et al., 1998). Trust, commitment and communication between the parties
have consistently been shown to help create, nurture and enhance customer relationships
(Cochran, 2004; Duncan & Moriarty, 1998; Jutla, Craig, & Bodorik, 2001; Morgan &
Hunt, 1994; Rosenbaum & Huang, 2002), and are fundamental for successful RM and
CRM. Communication and trust are interlinked; good communications supports trust
building, and trust facilitates two-way, open communications (E. Anderson & Weitz,
1989). Relationships flourish when there is a symmetry, or balance, between the core
trust, commitment, and communication relational elements (Lewin & Johnston, 1997).
These core relationship constructs have also been found to help predict relationship
performance (Hausman, 2001; Wilson, 1995). Enhanced relationship performance
represents outcomes that are efficient, productive and effective, and lead to cooperative
behaviour between customers, individuals or partners (Berry, 1983; Morgan & Hunt,
1994).
Chapter 2: Literature Review
- 71 -
CRM technology is viewed by some as a RM enabler with the ability to help create
“relationships” (Almquist et al., 2002; Bose, 2002; Buttle, 2004; Doherty & Lockett,
2007; Ling & Yen, 2001; Zablah et al., 2004). Without technology RM implementation
is expensive and time consuming but technological advances provide the ability for
efficiency gains (Berry, 1995; Goodhue et al., 2002). Tracking, customising,
integrating, communicating, minimising errors, augmenting core services and
personalising can be implemented quickly and cost effectively through technology
(Berry, 1995).
To help overcome Sheth’s (2002) concern that the IT focused CRM sales and
marketing automation may marginalise marketing and diffuse customer focus,
additional marketing and IT cross-discipline research is necessary. It is important for
academics, researchers, practitioners and application developers to better understand,
not only the impact of CRM technology adoption on relationship and business
performance, but also the impact on relationship building since relationships are now
considered key to customer retention, customer satisfaction and marketing success.
Trust, commitment and communications have been heavily researched with respect to
relationships, yet research gaps exist in the area of RM, CRM and relationship
performance.
The gaps evident in the extant research include: (a) the discontinuity of CRM related
research between the IT and marketing domains; (b) the role of market orientation and
IT management orientation in the acceptance, adoption and subsequent success of CRM
technology within the firm; (c) the impact of the degree of CRM technology adoption
on creation, maintenance and enhancement of B2B customer relationships, and (d) the
lack of empirical research linking CRM technology adoption with RM theory and
practice (Stefanou et al., 2003). The lack of generalisable research in these areas may be
a factor contributing to the high perceived CRM “failures” being cited in the literature.
The question not answered is: What is the impact of CRM technology adoption on B2B
customer relationships and relationship performance?
The next chapter addresses these gaps in the research by presenting and developing
the research model more fully in order to investigate the CRM phenomenon and its
affects on B2B relationship strength and performance.
- 72 -
CHAPTER 3. Research Model and Hypotheses
3.1. Introduction
Chapter 2 provided the literature review and background to the current research and
the research model. This chapter formally introduces the conceptual model, outlines the
relationships between RM and CRM, the significant research gaps, and presents the
research model and hypotheses to be tested.
Relationship marketing (RM) is considered an emerging dominant marketing theory
and CRM is an example of a RM application (Gummesson, 2004; Vargo & Lusch,
2004). However, as Gummesson states in his commentary on Vargo and Lusch’s 2004
article discussing technology and marketing, “it has been observed how relationship
marketing principles, transformed into customer relationship management software
(eCRM), partially get lost by the neglect of human aspects” (Day et al., 2004, p. 21).
This apparent disconnect between CRM technology adoption and RM, as well as the
gap in knowledge and understanding between CRM application and RM theory is
important for academics and practitioners (Helfert et al., 2002). The value and impact of
CRM technology adoption on relationship strength and relationship performance
requires better understanding and clarification. The research gap linking CRM
technology adoption with the relationship side of RM is the focus of this study.
CRM technology and applications has evolved (and continues to evolve) primarily
through IT capability and pragmatic business requirements, while the marketing and IT
research literature has focused on uncovering and analysing the technical and more
general managerial aspects of CRM (Ngai, 2005). There appears to be little published
research focused directly on the antecedents and relationship factors that effect the
creation and improvement of business relationships through CRM technology. In
addition, the linkage between market orientation, IT management orientation and CRM
technology adoption needs to be better understood. Understanding these gaps and the
CRM application drivers will have implications for the managerial, technical
implementation and application development dimensions of CRM technology.
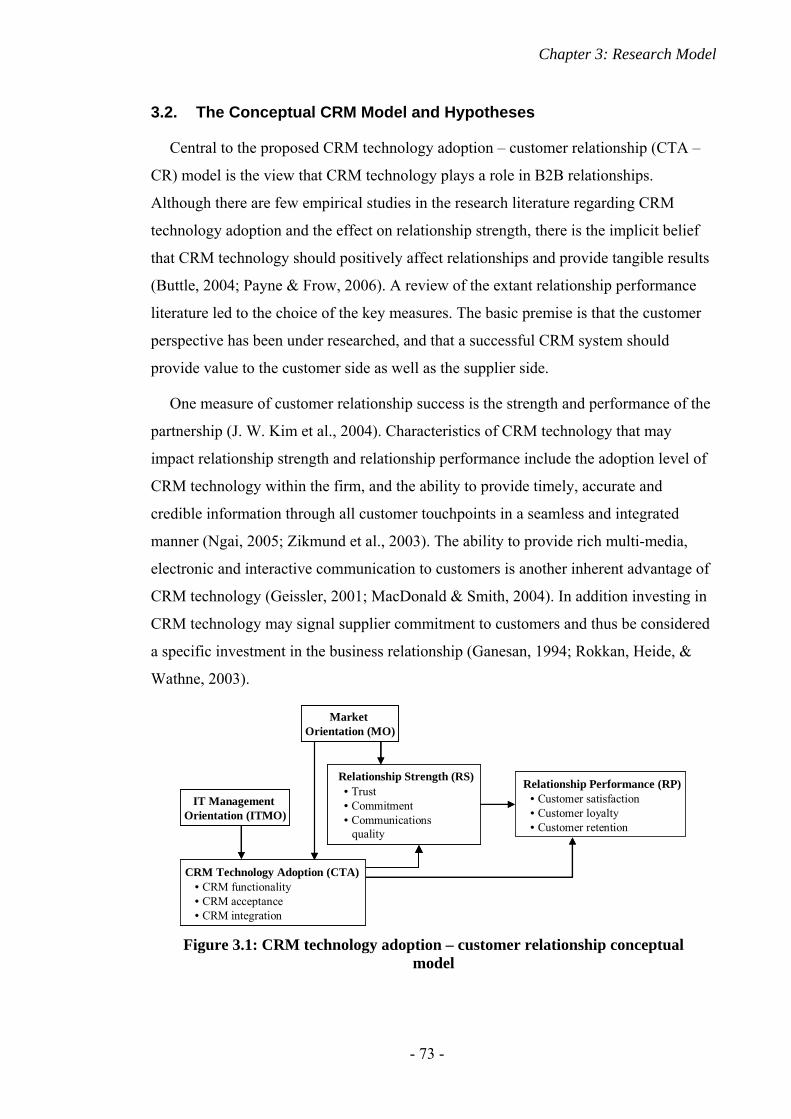
Chapter 3: Research Model
- 73 -
3.2. The Conceptual CRM Model and Hypotheses
Central to the proposed CRM technology adoption – customer relationship (CTA –
CR) model is the view that CRM technology plays a role in B2B relationships.
Although there are few empirical studies in the research literature regarding CRM
technology adoption and the effect on relationship strength, there is the implicit belief
that CRM technology should positively affect relationships and provide tangible results
(Buttle, 2004; Payne & Frow, 2006). A review of the extant relationship performance
literature led to the choice of the key measures. The basic premise is that the customer
perspective has been under researched, and that a successful CRM system should
provide value to the customer side as well as the supplier side.
One measure of customer relationship success is the strength and performance of the
partnership (J. W. Kim et al., 2004). Characteristics of CRM technology that may
impact relationship strength and relationship performance include the adoption level of
CRM technology within the firm, and the ability to provide timely, accurate and
credible information through all customer touchpoints in a seamless and integrated
manner (Ngai, 2005; Zikmund et al., 2003). The ability to provide rich multi-media,
electronic and interactive communication to customers is another inherent advantage of
CRM technology (Geissler, 2001; MacDonald & Smith, 2004). In addition investing in
CRM technology may signal supplier commitment to customers and thus be considered
a specific investment in the business relationship (Ganesan, 1994; Rokkan, Heide, &
Wathne, 2003).
Relationship Strength (RS)• Trust• Commitment• Communications
quality
Relationship Performance (RP)• Customer satisfaction• Customer loyalty• Customer retention
CRM Technology Adoption (CTA)• CRM functionality• CRM acceptance• CRM integration
Market Orientation (MO)
IT Management Orientation (ITMO)
Relationship Strength (RS)• Trust• Commitment• Communications
quality
Relationship Strength (RS)• Trust• Commitment• Communications
quality
Relationship Performance (RP)• Customer satisfaction• Customer loyalty• Customer retention
Relationship Performance (RP)• Customer satisfaction• Customer loyalty• Customer retention
CRM Technology Adoption (CTA)• CRM functionality• CRM acceptance• CRM integration
CRM Technology Adoption (CTA)• CRM functionality• CRM acceptance• CRM integration
Market Orientation (MO)
IT Management Orientation (ITMO)
Figure 3.1: CRM technology adoption – customer relationship conceptual
model
Chapter 3: Research Model
- 74 -
Each component of the conceptual CTA – CR model in Figure 3.1 will now be
discussed in detail.
3.2.1. Market Orientation (MO)
The extant literature suggests that market orientation (MO) positively affects CRM
adoption and customer relationships (Farrelly & Quester, 2003; Ling & Yen, 2001;
Sanzo et al., 2003). Market orientation reflects a company culture focused on the
customer (Day, 1994; Kirca, Jayachandran, & Bearden, 2005; Noble et al., 2002). In a
highly market-orientated firm there is continuous and ongoing information collection
and internal dissemination of customer and competitor data (Deng & Dart, 1994; Kohli
& Jaworski, 1990). The orientation (culture) of the firm is considered to play a major
role in the successful adoption, implementation and acceptance of CRM technology
(Raman, Wittmann, & Rauseo, 2006; van Bentum & Stone, 2005). A number of
marketing and IT researchers have highlighted that preparing the organisation with the
right business and management culture and processes is paramount for the successful
implementation of CRM technologies (J.-S. Chen & Ching, 2004; Goodhue et al., 2002;
M. L. Roberts, Liu, & Hazard, 2005). “The presence of a customer-centric
organizational culture makes the introduction of a CRM strategy much less threatening
to the company’s people” (Buttle, 2004, p. 45). As Rigby et al. (2002a, p. 103) state,
“installing CRM technology before creating a customer-focused organization is perhaps
the most dangerous pitfall.”
Facets of the firm’s culture, particularly market orientation, have been demonstrated
through case study to positively affect CRM implementation and performance results
(Abbott et al., 2001; Goodhue et al., 2002). It is postulated therefore that the firm’s
existing MO will have an effect on employee adoption of CRM technology, as well as
the perception of relationship strength when CRM technology is implemented. This
leads to the following two hypotheses:
H1: The greater the level of market orientation of the firm the greater the
CRM technology adoption within the firm
H2: The greater the level of market orientation of the firm the greater the
overall relationship strength between the firm and the customer.
Chapter 3: Research Model
- 75 -
3.2.2. IT Management Orientation (ITMO)
A firm’s IT management orientation, reflecting the level of IT management practices,
planning, organisation and control, has been demonstrated to influence the acceptance
and adoption of information technology solutions (Karimi et al., 1996a; Karimi et al.,
2001; Sabherwal & Kirs, 1994). The IT management responsibility has changed
substantially over the years necessitating a broadening of skills in operations, strategy
and management in order to understand the potential impact of IT on business
(Applegate & Elam, 1992). IT executives now play a key role in business strategy
development, identifying IT value for functional areas, and working closely with other
senior managers to implement IT business solutions (Enns et al., 2003; Feeny, Edwards,
& Simpson, 1992; Stephens, Ledbetter, Mitra, & Ford, 1992). This more strategic IT
function necessitates both business nuance and IT sophistication in order for the IT
executive to be effective (Enns et al., 2003; Sabherwal & Kirs, 1994). In addition, IT
management within the organisation can play a major role with respect to what type of
CRM technology and functionality is purchased, implemented and supported (F. D.
Davis, 1989; Ling & Yen, 2001; Ngai, 2005; Romano & Fjermestad, 2001).
The firm’s IT management sophistication and IT leadership position may reflect the
technical orientation of the firm as well as the relative importance placed on the
decision to implement CRM technology. IT management practices have been shown to
affect the organisation’s ability to utilise technology in support of marketing (Karimi et
al., 2001). In particular, firms that have strong IT leadership and demonstrate IT
management sophistication through technology use benefit more from technology
(Karimi et al., 1996a). In the context of this study IT management orientation is
considered to influence the functionality (analytical, operational, collaborative), user
acceptance, and level of integration (departmental or enterprise-wide) of the CRM
technology solution (Karimi et al., 2001; Ling & Yen, 2001). Hence IT management
orientation is expected to play an important role in the implementation, utilisation and
adoption of CRM within the organisation (Karimi et al., 2001). This factor is reflected
in the IT management orientation (ITMO) construct and leads to the following
hypothesis:
H3: The greater the level of IT management orientation of the firm, the
greater the CRM technology adoption.
Chapter 3: Research Model
- 76 -
3.2.3. CRM Technology Adoption (CTA)
Implementing CRM technology within a firm is thought to positively affect the
initiation and development of relationships (Berry, 1995; Ling & Yen, 2001). However
an organisation can implement a wide variety of CRM applications and systems (Abbott
et al., 2001; Buttle, 2004; Computerworld, 2004; Goodhue et al., 2002). And although it
is possible to determine whether a firm has CRM technology or not, the type, extent,
sophistication, user acceptance, and integration of the CRM technology implementation
within a firm is important to the effectiveness and utilisation (Karimi et al., 2001;
Raman & Pashupati, 2004; Speier & Venkatesh, 2002; Stefanou et al., 2003). Although
there may be strategic business reasons for CRM technology implementation, the
purpose of the CRM technology adoption scale is not to address this aspect, but rather to
focus on the technology adopted by the user of the CRM system.
A CTA scale is proposed in order to establish a standardised method of measuring
the degree of CRM technology adoption within a firm. CRM systems are rarely
explicitly defined operationally in the research literature, making it difficult to compare
studies and results (cf. Raman & Pashupati, 2004). The academic and practitioner
literature reports of implemented CRM technology range from databases, call centres,
data analysis tools, e-mail, Internet and group support systems (i.e., Lotus Notes) to
sophisticated SAP systems (Abbott et al., 2001; Computerworld, 2004). There is a need
for a standardised CRM technology adoption scale reflecting:
1. Functionality (i.e., type of CRM technology) (Gefen & Ridings, 2002; Karimi
et al., 2001; Ling & Yen, 2001),
2. The acceptance level (and extent of use) within the firm (F. D. Davis, 1989;
Gefen & Ridings, 2002; Goodhue & Thompson, 1995; Speier & Venkatesh,
2002), and
3. The level of integration with existing organisational IT systems and processes
(Buttle, 2004; Ling & Yen, 2001).
Based on the theoretical foundation that CRM is a special application of RM, the
extent of CTA technology adoption is proposed to be positively linked to both
relationship strength and relationship performance (Gummesson, 2004).
Chapter 3: Research Model
- 77 -
3.2.3.1. CRM Functionality
CRM functionality refers to the CRM applications introduced into the firm. CRM
applications and systems encompass a wide range of products and services from a
variety of suppliers (Computerworld, 2004).
Other than the Raman and Pashupati (2004) paper few other studies have focused on
CRM functionality and the potential effect on outcomes. Due to the wide variety of
CRM applications and functionality available, a CRM technology continuum is
conceptually appropriate in order to determine where a firm “sits” relative to other
firms. At the extremes of this continuum are “contact manager” applications (e.g.,
Microsoft “Outlook”) at one end, and CRM enterprise suites, highly sophisticated
client/server applications, offering 360 degree views of the customer (e.g., MySAP,
Siebel, PeopleSoft) at the other (Buttle, 2004; Greenberg, 2002; Turban, McLean et al.,
2003; Zikmund et al., 2003).
3.2.3.2. CRM Technology Acceptance
User acceptance relates to the habitual use of the technology, as part of the job
function to achieve results (F. D. Davis et al., 1989). The desired results in the case of
CRM technology can be described as collecting customer information, accessing, and
using that customer information on a regular basis to complete the job requirements (J.
W. Kim et al., 2004). User acceptance can also be influenced by a number of factors
including perceived ease of use, attitude toward the system, and usefulness (F. D. Davis
et al., 1989; Frambach, 1993). As Speier and Venkatesh (2002) demonstrated user
acceptance is necessary for CRM technology to be successfully adopted within the firm.
Perceived use and usefulness of CRM technology within an organisation reflects the
user’s utilisation of the CRM applications and technology. Due to the nature of the CTA
construct, the higher the level of CRM technology acceptance within the firm the more
likely perceived and measurable benefits will accrue to both users and customers.
3.2.3.3. CRM System Integration
The implementation of an enterprise wide CRM system is not generally a “turnkey”
solution, due to idiosyncratic business processes, procedures and customer interfaces
(Gefen & Ridings, 2002). However purchasing and implementing stand-alone CRM
software such as ACT! requires little integration on a PC or in a small business
Chapter 3: Research Model
- 78 -
environment and is relatively simple. Organisations implementing CRM technology
may incorporate any combination of operational, analytical and/or collaborative CRM,
in any number of variations (e.g., ACT!, 2004; Epiphany, 2004; Microsoft, 2004;
Oracle, 2004; PeopleSoft, 2003; SAP, 2004; SAS, 2004; Siebel, 2004).
A number of researchers have indicated the importance of system integration as a
critical success factor of CRM technology implementation (Bull, 2003; Goodhue et al.,
2002; M. Meyer & Kolbe, 2005; Plakoyiannaki & Tzokas, 2002). There are two aspects
of systems integration that are pertinent to CRM technology adoption: first, integration
into existing legacy systems and organisational applications; and second, integration
across other functional customer touchpoints (Buttle, 2004; Payne & Frow, 2006). The
ability to link the CRM system to finance, operations, distribution, and human resources
provides additional value to users, and potentially to customers: customer queries and
complaints can be handled more professionally with credible, accurate and timely
information.
Similarly, integrating call centres, e-mail and websites through CRM technology
provides the opportunity for seamless and transparent customer touchpoints. The extent
of CRM integration within the firm should manifest itself in the customer’s perceived
relationship strength and performance and leads to the following two hypotheses:
H4: The greater the level of CRM technology adoption within a firm the
greater the overall relationship strength with customers.
H5: The greater the level of CRM technology adoption within a firm the
greater the relationship performance.
3.2.4. Relationship Strength (RS)
Although there are no strict definitions of relationship strength (RS) in the literature,
RS has been considered a higher-order construct by most relationship researchers in
both the business-to-consumer and business-to-business environments (Lages et al.,
2005). For example, a number of studies have defined RS as consisting of a variety of
dimensions including trust, commitment, communication quality, information sharing,
conflict, long-term relationship orientation, satisfaction, opportunism and customer
orientation (Crosby et al., 1990; Dorsch et al., 1998; Lages et al., 2005; Lang & Colgate,
2003; Storbacka et al., 1994; Wong & Sohal, 2002). Trust and commitment are central
to most evaluations of relationships and can not be easily discarded (K. Roberts et al.,
Chapter 3: Research Model
- 79 -
2003). Similarly communication is generally considered a key antecedent or driver of
relationships and relationship quality (Duncan & Moriarty, 1998; Lages et al., 2005;
Morgan & Hunt, 1994). More importantly, CRM technology provides the potential for
extensive, frequent and bidirectional communication beyond traditional
communications media (i.e., telephony and postal service). Hence the communication
aspect is considered an important aspect of RS within the CRM context. The other
factors noted above have been shown to be dimensions of RS in specific circumstances.
For example, information sharing in UK export industry (Lages et al., 2005) or conflict
in consumer services (K. Roberts et al., 2003). Relationship strength in this study
encompasses the dimensions of trust, commitment and communications quality
expressed by the customer, and reflecting the influence of MO and CTA within the
supplier firm. In addition it is proposed, based on prior research, that relationship
strength is positively related to relationship performance (Lages et al., 2005).
3.2.4.1. Trust
It is not uncommon to define trust narrowly based on the theory being tested and the
paradigm being used (McKnight & Chervany, 1996). Trust has been defined, used and
studied extensively in the area of relationship initiation, development and maintenance
(Berry, 1995; Morgan & Hunt, 1994). Elements of trust are considered to play a
significant role in the initiation, development and maintenance of relationships and are
central to the concept of RS (K. Roberts et al., 2003). Trust is just as important in the
online environment, affecting customer’s perceptions and willingness to participate and
establish relationships with suppliers online (Gefen et al., 2003; E. Kim & Tadisina,
2003; Pennington, Wilcox, & Grover, 2004; Rosenbaum & Huang, 2002). Since CRM
technology incorporates aspects of the online environment, the RS trust factor may be
affected by CRM technology adoption.
The trust typology proposed by Sako (1992) incorporating contractual trust,
competence trust and goodwill trust, is used to define trust in this study.
3.2.4.2. Commitment
Commitment is considered necessary for relationship continuation, an antecedent to
customer retention, and to positively affect relationships (Helfert et al., 2002; Morgan &
Hunt, 1994; Verhoef, 2003). However not all studies have demonstrated that
commitment leads to customer retention (Gruen et al., 2000). Antecedents to
Chapter 3: Research Model
- 80 -
commitment include forming a psychological attachment or affective commitment,
deploying superior resources compared to the competition, and working together to
provide customer preferred solutions (Garbarino & Johnson, 1999; Lewin & Johnston,
1997). From this perspective the affective and calculative classifications of commitment
provide a useful typology to study relationship commitment (Gounaris, 2005).
CRM technology adoption may be considered as committing resources toward the
relationship in the form of a transaction specific investment (TSI) (J. W. Kim et al.,
2004). Some TSIs has been demonstrated to improve relationships between retailers and
suppliers by indicating commitment to customers (Ganesan, 1994). However the nature
and perceived benefit of the TSI may dictate whether there is any improvement in
relationship quality (J. W. Kim et al., 2004). The adoption of CRM technology by a
supplier may be viewed as an instrumental component, or affirmative action,
demonstrating customer commitment – that is, by collecting and utilising customer data
to develop value congruence. Offering leading edge technology, like CRM, in order to
provide superior customer solutions exhibits greater resource deployment. In addition
CRM technology implementation may be interpreted as attempting to form affective
bonds, through acknowledging the values and goals of customers (Gundlach et al.,
1995).
3.2.4.3. Communications Quality
Some researchers consider communication as the basis for relationships or even as
the foundation of a marketing model (Duncan & Moriarty, 1998; Lewin & Johnston,
1997). Effective quality communication aids relationship initiation and building, and is
brought about through timeliness, frequency, accuracy, completeness and credibility
(Mohr & Sohi, 1995; Mohr & Spekman, 1994). Timeliness of the information has been
shown to be important in relationship building in that the more timely the information
the greater the trust (Moorman et al., 1993). Mohr and Sohi (1995) also demonstrated
that frequency (and feedback) were viewed as positive attributes of quality
communication, while formal and informal sharing of meaningful and timely
information has been shown to significantly contribute to relationship commitment and
trust (J. C. Anderson & Narus, 1990; N. Sharma & Patterson, 1999).
CRM technology is considered by many as possessing the potential to develop
improved bilateral communication (interactions) with customers, and implement one-to-
Chapter 3: Research Model
- 81 -
one marketing techniques to a broad customer base (Dibb, 2001; Gummesson, 2004;
Ling & Yen, 2001; Winer, 2001; Yu, 2001). Therefore the adoption of CRM technology
by a firm has the potential to improve the communications quality between the firm and
the customer within a relationship.
As Sharma and Patterson (1999, p. 163) state “regular communications can help
develop a sense of closeness and ease in the relationship, and be instrumental in
building emotional and social bonds, thus making the relationship more resistant to the
occasional problems that inevitably develop from time to time.”
This study views communication quality as a construct based on attributes such as
communication frequency, openness, formality, and bidirectionality.
3.2.5. Relationship Performance (RP)
Financial business performance will not be addressed directly in this study for two
reasons. First, Lages, Lages and Lages (2005) have already demonstrated that
relationship strength has a positive effect on business performance. Second, traditional
marketing metrics (i.e., market share) and business performance measures (i.e., sales
growth) may not be appropriate to evaluate relationships and CRM (Payne & Frow,
2005). For example, an increase in market share (objective measure) may develop from
new marketing and sales initiatives, not necessarily from the adoption of CRM
technology. Similarly “objective” profitability measures would not demonstrate whether
profitability was improved by enhanced business relationships or merely from the
acquisition of a new major customer. As Parvatiyar and Sheth (2000, p. 24) indicate “if
the purpose of a particular relationship marketing effort is to enhance distribution
efficiencies by reducing overall distribution cost, measuring the program’s impact on
revenue growth and share of customer’s business may not be appropriate”. Although a
balanced scorecard approach has been used to measure RM performance, other
measures such as relationship satisfaction and loyalty have also been successfully
utilised (Parvatiyar & Sheth, 2000; Reichheld & Sasser, 1990). Therefore relationship
measures were favoured over more “objective” market- or financial-based measures
(Bharadwaj et al., 1993).
Compared to relationship strength, relationship performance considers the overall
relationship behaviour and reflects the ongoing quality of the relationship and
encompasses customer satisfaction in addition to relationship performance (J. W. Kim
Chapter 3: Research Model
- 82 -
et al., 2004). That is, one may trust the other party to behave in a certain manner, be
committed to purchase from them due to price, and even communicate frequently, but
yet not be a satisfied or loyal customer. Improvement in RP is considered a driver of
CRM technology implementation in business, yet there are few CRM specific
quantitative studies that investigate this linkage (Firth, 2001; J. W. Kim et al., 2004;
Reinartz et al., 2004; Zeithaml et al., 2001). Relationship performance captures
outcomes of the relationship through measures of customer satisfaction (Farrell &
Oczkowski, 2002; Guo, 2002; Stefanou et al., 2003; Verhoef, 2003; Webster, 2000),
customer retention (Croteau & Li, 2003; Jutla et al., 2001; J. W. Kim et al., 2004) and
customer loyalty (Matear, Osborne, Garrett, & Gray, 2002; Sanzo et al., 2003; Webb,
Webster, & Krepapa, 2000). Relationship performance is measured separately as a
consequence of relationship strength (Hausman, 2001), and leads to the following
hypothesis:
H6: The greater the level of relationship strength the greater the
relationship performance.
3.2.6. Moderator and Control Factors (secondary hypotheses)
A customer’s preference for a relationship has been found to influence the desire and
appreciation of relationships (Kapoulas et al., 2004; Peters & Fletcher, 2004b). Hence
customer relationship orientation (CRO) was included as a potential moderator of
customer perceived relationship strength and relationship performance. Similarly,
customers have been shown to form expectations from a supplier’s adoption of
technology which may influence how customers perceive the relationship and the
relationship performance (Garbarino & Johnson, 1999; Richard et al., 2007). Therefore
customer CRM expectations (CXP) were also included as potential relationship
moderators.
H7: The greater the level of customer relationship orientation the greater
the CRM technology adoption effect on (a) relationship strength and
(b) relationship performance.
H8: The greater the level of customer CRM expectation the greater the
CRM technology adoption effect on (a) relationship strength and (b)
relationship performance.
Chapter 3: Research Model
- 83 -
Market turbulence (MT) and technological turbulence (TT) within the business
environment have been shown to interact significantly with key variables in marketing
studies investigating MO and business performance (Pelham, 1999; Pulendran, Speed,
& Widing, 2003), although not in all cases (Jaworski & Kohli, 1993; Subramanian &
Gopalakrishna, 2001). Market turbulence reflects the relative stability or volatility of a
firm’s customer composition and preferences, as well as the rate of that change within
the industry (Kohli & Jaworski, 1990). For example, a firm whose customers have
rapidly changing preferences may require a higher level of market orientation (i.e., need
to be more in tune with customer needs) in order to succeed. Technology turbulence
refers to the rate of business technology innovation, as well as product innovation, in the
industry (Appiah-Adu, 1997; Kohli & Jaworski, 1990). Firms competing in a extremely
technology turbulent industry may not require as high a level of market orientation to
succeed since early technology adoption is highly valued by customers in these
industries (Appiah-Adu, 1997). Since market orientation (MO) and IT management
orientation (ITMO) were considered antecedent variables, MT and TT were included as
potential moderator factors in the research model. This leads to the following
hypotheses:
H9: The greater the level of market turbulence the stronger the market
orientation effect on CRM technology adoption.
H10: The greater the level of technology turbulence the stronger the (a)
market orientation effect on CRM technology adoption, and (b) the IT
management orientation effect on CRM technology adoption.
3.3. Research Model Summary
The initial CRM technology adoption – customer relationship (CTA – CR) research
model, Figure 3.2, summarises the hypothesised linkages between the proposed
constructs under investigation in this study. The hypothesised positive impact of a
supplier firm’s market orientation (MO) (H1) and IT management orientation (ITMO)
(H3) on CTA are considered. Central to the model acceptance is the hypothesised
positive effect of CRM technology adoption (CTA) on customer perceived relationship
strength (RS) (H4) and relationship performance (RP) (H5). The two variables, customer
relationship orientation (H7a and H7b) and customer CRM expectations, (H8a and H8b)
believed to moderate CTA’s effect on RS and RP are also considered and tested.
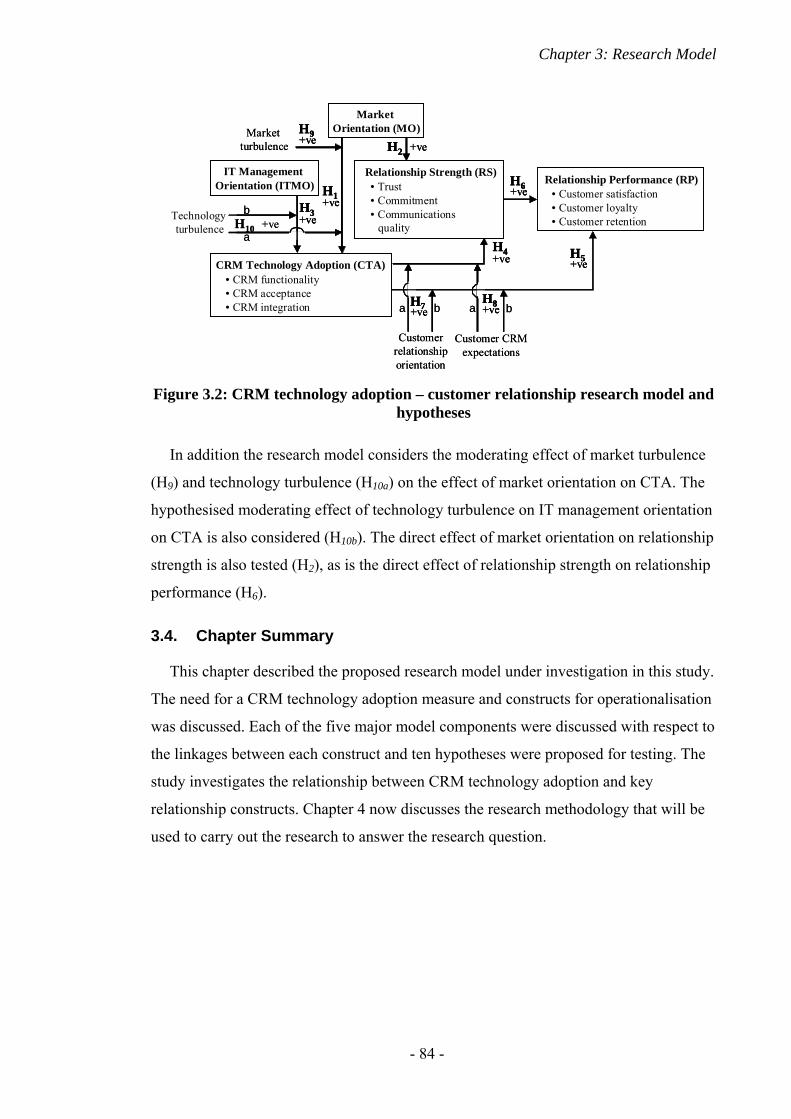
Chapter 3: Research Model
- 84 -
In addition the research model considers the moderating effect of market turbulence
(H9) and technology turbulence (H10a) on the effect of market orientation on CTA. The
hypothesised moderating effect of technology turbulence on IT management orientation
on CTA is also considered (H10b). The direct effect of market orientation on relationship
strength is also tested (H2), as is the direct effect of relationship strength on relationship
performance (H6).
3.4. Chapter Summary
This chapter described the proposed research model under investigation in this study.
The need for a CRM technology adoption measure and constructs for operationalisation
was discussed. Each of the five major model components were discussed with respect to
the linkages between each construct and ten hypotheses were proposed for testing. The
study investigates the relationship between CRM technology adoption and key
relationship constructs. Chapter 4 now discusses the research methodology that will be
used to carry out the research to answer the research question.
Technology turbulence
Relationship Strength (RS)• Trust• Commitment• Communications
quality
Relationship Performance (RP)• Customer satisfaction• Customer loyalty• Customer retention
CRM Technology Adoption (CTA)• CRM functionality• CRM acceptance• CRM integration
Market Orientation (MO)Market
turbulence
Customer relationship orientation
Customer CRM expectations
+veH1
+veH2
+veH3
+veH6
+veH4
+veH5
+veH7 +ve
H8a ab b
+veH9
IT Management Orientation (ITMO)
+veH10a
bTechnology turbulence
Relationship Strength (RS)• Trust• Commitment• Communications
quality
Relationship Strength (RS)• Trust• Commitment• Communications
quality
Relationship Performance (RP)• Customer satisfaction• Customer loyalty• Customer retention
Relationship Performance (RP)• Customer satisfaction• Customer loyalty• Customer retention
CRM Technology Adoption (CTA)• CRM functionality• CRM acceptance• CRM integration
CRM Technology Adoption (CTA)• CRM functionality• CRM acceptance• CRM integration
Market Orientation (MO)Market
turbulence
Customer relationship orientation
Customer CRM expectations
+veH1+veH1
+veH2 +veH2
+veH3+veH3
+veH6+veH6
+veH4+veH4
+veH5+veH5
+veH7+veH7 +ve
H8+veH8a ab b
+veH9+veH9
IT Management Orientation (ITMO)
+veH10a
b
Figure 3.2: CRM technology adoption – customer relationship research model and
hypotheses
- 85 -
CHAPTER 4. Research Methodology
4.1. Introduction
Following the development of the research model and hypotheses in Chapter 3, the
purpose of this chapter is to discuss the methods used for refining, validating and testing
the model. The chapter begins with an overview of the general research paradigms and
approaches utilised in the research, followed by a description of the exploratory and
explanatory research phases of the study. The procedures adopted for sample selection,
data collection and data analysis are also discussed.
4.2. Research Paradigm
A research paradigm underlies the researcher’s basic beliefs of inquiry, it is “a set of
linked assumptions about the world which is shared by a community of scientists
investigating that world” (Deshpandé, 1983, p. 101) and acts as “a criterion for choosing
problems that . . . can be assumed to have solutions” (Kuhn, 1996, p. 37). The nature of
the positivist paradigm is that there is a single reality that exists, objectively measurable,
inherently understandable and outcome oriented. A post-modernist paradigm (e.g.,
constructivism, interpretivist ,or participatory) considers reality as a social construct,
interpreted by people based on their participation in events (Lincoln & Guba, 2000).
The interpretivist paradigms tend to deeply explore, richly describe, and holistically
understand the phenomenon in detail, while the positivist paradigm forms the basis of
scientific tradition and, although not limited to, underlies most experimental and
quantitative research methods (Deshpandé, 1983; Gummesson, 2003; Hirschman, 1986;
Lincoln & Guba, 2000; Marsden & Littler, 1996). A post-positivist paradigm is not as
extreme as the positivist view, in that it accepts an imperfect reality which is mostly
perceivable and understandable, providing outcomes and research findings that are
probably true (Hunt, 1990; Lincoln & Guba, 2000; Shrivastava & Kale, 2003).
Choosing a research method is generally based on (a) the researcher’s view of reality
(ontology), since this influences the choice of research methodology (Chung &
Alagaratnam, 2001; Hirschman, 1986); and then (b) the requirements stemming from
the central research question and the objectives of the research (Stake, 1994, 2000; Yin,
2003). CRM research in the marketing and IT domains have utilised both qualitative
research methods for theory building (e.g., Abbott et al., 2001; Goodhue et al., 2002;
Chapter 4: Research Methodology
- 86 -
Kapoulas et al., 2004; Wells & Hess, 2002), and quantitative methods for theory testing
(e.g., Croteau & Li, 2003; Karimi et al., 2001; Peters & Fletcher, 2004b; Reinartz et al.,
2004; Rosenbaum & Huang, 2002). The CRM phenomenon under study includes both
subjective and objective aspects of business outcomes (John & Reve, 1982). That is, the
study includes objective measures as well as subjective perceptions of the people who
form relationships within the B2B context (Medlin, 2003). The post-modernist
paradigms are more subjective in nature, with constructed meaning or interpretation
having more value than measurement and hence are not generally considered
appropriate for survey or experimental research (Perry, Riege, & Brown, 1999). The
post-positivist paradigm is suitable for both qualitative and quantitative research and is
the perspective adopted by the researcher in this study (Chung & Alagaratnam, 2001;
Lincoln & Guba, 2000).
In consideration of the objectives of the study and the phenomenon itself, a post-
positivist paradigm is appropriate (Hunt, 1990; Perry, 1998). Next the research
methodology is discussed, consisting of an exploratory phase and an explanatory phase.
4.3. Exploratory Research Phase
The exploratory phase of the research was conducted using the qualitative
methodology described by Creswell (1998; 2003) and Yin (2003). This phase is used to
explore and better understand how managers and customers perceive the specific
business relationships, aspects and issues emanating from CRM technology
implementation within organisations (Denzin & Lincoln, 2000).
4.3.1. Exploratory Phase Approach and Objectives
Qualitative research “help[s] the researcher to understand the potential survey
respondents’ general perspective on the issues, frame of reference, way of thinking, and
typical vocabulary” (Alreck & Settle, 2004, p. 386), thereby providing a detailed and
rich understanding of the CTA – CR phenomenon. A dyadic multiple case design was
chosen since it is considered superior to single-case design, in that it provides additional
data points, more generalisable results, and more convincing conclusions (Yin, 2003).
Multiple-case design has been used successfully by a number of CRM researchers (e.g.,
Abbott et al., 2001; Goodhue et al., 2002).
Chapter 4: Research Methodology
- 87 -
The scope of the qualitative phase is limited to refining the conceptual model,
informing scale development and aiding interpretation of the subsequent quantitative
research results. The purpose and objectives of the exploratory phase are to:
1. Determine if support exists for the proposed CRM technology acceptance –
customer relationship (CTA – CR) model,
2. Explore and validate the proposed variables in the model, specifically the
impact of CRM technology adoption on business relationships,
3. Gain additional insight into the motivation, attitudes and emotions influencing
CRM technology adoption,
4. Identify relevant existing or previously unidentified variables (Creswell, 1998,
2003),
5. Ascertain practitioner familiarity with specific terms and expressions in the
survey questionnaires (Hair, Bush, & Ortinau, 2003), and
6. Provide detailed contextual data so as to better interpret the research instrument
data and results (Creswell, 2003).
The data obtained in this phase were used to help shape the conceptual model and
develop appropriate scales before proceeding to the explanatory phase of the research
(DeVellis, 2003; Rossiter, 2002; Spector, 1992; Stake, 1995).
4.3.2. Sample Selection
Since CRM technology adoption diversity was desirable, a maximum variation and
purposeful sampling strategy was incorporated, where cases are selected on their
potential contribution to theory and the demands of the research objective, in order to
identify firms with different types of CRM systems (Aaker, Kumar, & Day, 2004;
Eisenhardt, 1989; T. W. Lee, 1999; Narayandas & Rangan, 2004). Participating supplier
firms were requested to nominate customers to interview, and it was considered more
efficient and cost effective if firms and customers were in proximity to the interviewer,
therefore convenience sampling was also included as part of the sampling strategy
(Miles & Huberman, 1994).
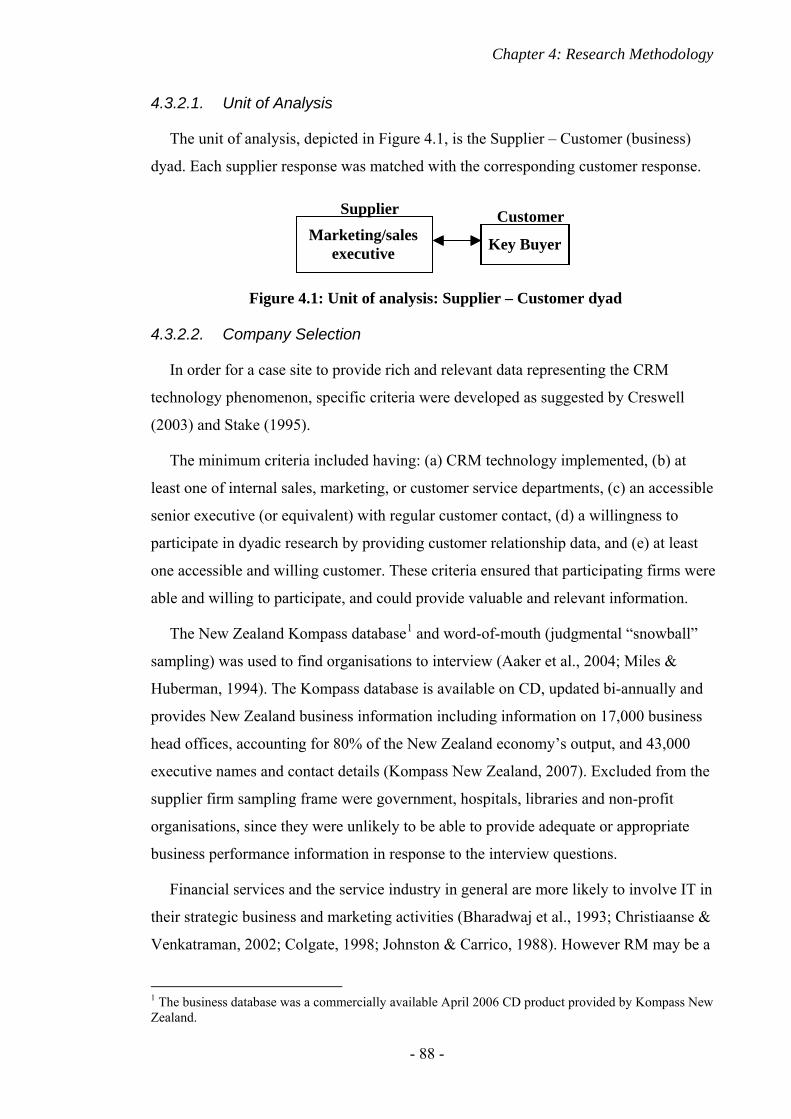
Chapter 4: Research Methodology
- 88 -
4.3.2.1. Unit of Analysis
The unit of analysis, depicted in Figure 4.1, is the Supplier – Customer (business)
dyad. Each supplier response was matched with the corresponding customer response.
4.3.2.2. Company Selection
In order for a case site to provide rich and relevant data representing the CRM
technology phenomenon, specific criteria were developed as suggested by Creswell
(2003) and Stake (1995).
The minimum criteria included having: (a) CRM technology implemented, (b) at
least one of internal sales, marketing, or customer service departments, (c) an accessible
senior executive (or equivalent) with regular customer contact, (d) a willingness to
participate in dyadic research by providing customer relationship data, and (e) at least
one accessible and willing customer. These criteria ensured that participating firms were
able and willing to participate, and could provide valuable and relevant information.
The New Zealand Kompass database1 and word-of-mouth (judgmental “snowball”
sampling) was used to find organisations to interview (Aaker et al., 2004; Miles &
Huberman, 1994). The Kompass database is available on CD, updated bi-annually and
provides New Zealand business information including information on 17,000 business
head offices, accounting for 80% of the New Zealand economy’s output, and 43,000
executive names and contact details (Kompass New Zealand, 2007). Excluded from the
supplier firm sampling frame were government, hospitals, libraries and non-profit
organisations, since they were unlikely to be able to provide adequate or appropriate
business performance information in response to the interview questions.
Financial services and the service industry in general are more likely to involve IT in
their strategic business and marketing activities (Bharadwaj et al., 1993; Christiaanse &
Venkatraman, 2002; Colgate, 1998; Johnston & Carrico, 1988). However RM may be a
1 The business database was a commercially available April 2006 CD product provided by Kompass New Zealand.
Figure 4.1: Unit of analysis: Supplier – Customer dyad
Marketing/salesexecutive
Supplier
Key Buyer
Customer
Chapter 4: Research Methodology
- 89 -
more dominant and important marketing mechanism in the manufacturing sector (Yau
et al., 2000). Since relatively few CRM marketing studies have investigated multiple
industries, a broadly representative sample of businesses was sought in order to aid
generalisability (Croteau & Li, 2003; Raman & Pashupati, 2004; Reinartz et al., 2004).
Ten firms meeting the criteria were chosen from the Wellington, New Zealand area.
4.3.2.3. Respondent Selection
The selection of participants was driven by the theoretical framework identified from
the CRM and RM literature (Miles & Huberman, 1994). Given that CRM usage, and
day-to-day relationship building and maintenance is generally within the domain of
sales and marketing, the study focused on participants from this functional area within
the supplier firm (Abbott et al., 2001; Speier & Venkatesh, 2002). In-depth interviews
were conducted with a single senior management informant, responsible for customer
relationships on a day-to-day basis, because (a) they are more likely to use CRM
technology if it exists within the firm, (b) they tend to be more involved in the overall
customer sales and marketing process, and (c) they would be familiar with their
organisation’s culture and IT strategy (Menon, Bharadwaj, Adidam, & Edison, 1999;
Moorman & Miner, 1997). Although the use of multiple respondents is preferred to help
overcome potential response bias and gain multiple perspectives (triangulation)
(Creswell, 2003; T. W. Lee, 1999; Yin, 2003), it was considered too problematic to find
knowledgeable second respondents in small and medium-sized (SME) businesses
(Reinartz et al., 2004).
The nominated customers were recommended by supplier participants,
knowledgeable in the business relationship and regularly conducted business with the
customer. Keeping in mind the cost and time constraints, the research question, and the
objectives for the exploratory stage of the research, single respondents, one from each
supplier firm and one from each customer firm, were deemed appropriate.
4.3.3. Data Collection – Exploratory Phase
4.3.3.1. Contact
To increase acceptance, the most senior manager in each targeted organisation was
contacted by telephone and asked to nominate the most appropriate sales or marketing
person in their organisation to participate (Jobber & O'Reilly, 1998). Each nominated

Chapter 4: Research Methodology
- 90 -
person was contacted, agreed to a 60-minute interview and provided one customer
contact potentially willing to participate in the study. The nominated customers were
telephoned independently by the researcher to set up interviews, unless otherwise
suggested by the supplier firm, in which case the researcher contacted the nominated
customer after the supplier firm had gained the customer’s approval. Initial interview
durations with the nominated customers were set for one hour.
4.3.3.2. Interview Protocol
Interview protocols were developed, as recommended by Yin (2003), one for the
supplier interviews and one for the customer interviews, and used to guide each
interview (Miles & Huberman, 1994). These protocols ensured all the essential and
necessary information regarding the proposed research model and associated research
questions were collected and recorded. The customer protocol did not include any
questions regarding CRM technology implementation. In addition to the protocols, a
contact summary form, and interview follow-up forms were developed and used for
data recording and later analysis (Stake, 1995).
A separate telephone interview protocol was developed (Fontana & Frey, 1994), and
subsequently used for one customer telephone interview. The protocols and forms are
provided in Appendix A1.
4.3.4. Participation Rate and Respondent Profile
Eleven companies were contacted and ten agreed to participate. The firm choosing
not to participate stated a lack of time and interest. Eisenhardt (1989), and Miles and
Huberman (1994) consider ten to be a sufficient number for exploratory case research.
More important is the information richness derived from the cases rather than the
Table 4.1: Supplier Industry and CRM System Profile
Firm Industry CRM System TecCo Computer Services ACT! RecCo Recruitment Services Custom database MarCo Marketing Services Inhouse build FinCo Finance Custom build TelCo Telecommunications Vantive FOCiS BMSCo Wholesale Trade ACT! DocCo Document Services CoWeb ComCo Telecommunications Salesforce.com CompCo Computer Services Siebel BankCo Finance Certegy

Chapter 4: Research Methodology
- 91 -
sample size (Perry, 1998), and the sample cases provided a rich medium for analysis.
The supplier profiles shown in Table 4.1 indicate that these companies encompass a
broad range of industries and utilise a variety of IT systems and solutions to provide
CRM applications. Table 4.2 provides the respondent and firm profiles, indicating a
good spread across the categories of small (2 – 20 employees), medium (50 – 190
employees) and large businesses (300+ employees).
4.3.5. The Interviews
The supplier firm interviews were conducted at the participating firms’ offices in all
cases. The customer interviews were also conducted at their places of business, except
for two, one conducted over the telephone and the other conducted offsite. All
interviewees agreed to be tape-recorded and were given the opportunity to review the
written transcripts; in addition notes were taken during the interviews.
4.3.6. Exploratory Data Analysis Procedure
Miles and Huberman (1994, p. 10) stipulate that qualitative data analysis progress
through parallel and simultaneous processes of “data reduction, data display, and
conclusion drawing/verification.” To this end each interview transcript was analysed
Table 4.2: Supplier and Customer Respondent Profile (Exploratory Phase)
Firm R ANZSIC Informant title / position Size TecCo S L7834 Owner Small MgtCo C L7855 Owner Small RecCo S L7861 Account executive Medium GovDp C M8112 HR manager Large MarCo S L7853 Account manager Small InsCo C K7422 General manager - Marketing Medium FinCo S K7340 Manager – Investor Services Small FinAd C K7340 Owner – Investment advisor Small TelCo S J7120 Account manager Large PropCo C L7712 General Manager IT Medium BMSCo S F4539 Owner Small SupCo C F4539 Services manager Small DocCo S L7832 Strategic account manager Medium EdGvCo C M8112 Sales manager Medium ComCo S J7120 Corporate account manager Large UniCo C N8431 E-communications supervisor Large CompCo S L7834 Client Relations Executive Medium HlthCo C K7421 Commercial and business manager Large BankCo S K7321 General manager credit cards Medium NpoCo C Q9629 IT manager Small Note: R = Respondent; S = Supplier firm; C = Customer firm
Chapter 4: Research Methodology
- 92 -
through selection, summarising, and abstracting the data in order to uncover key themes
and constructs from the text segments (Ryan & Bernard, 2000). The conclusions and
verifying process involves a continuous process of “noting regularities, patterns,
explanations, possible configurations, causal flows, and propositions” (Miles &
Huberman, p. 11). Similarities and differences in perceptions of the relationship
between the firm and the customer were identified and organised to simplify and
understand the complex information. Leximancer 2.21 software was used to help
structure and analyse the interview data (A. E. Smith, 2005; A. E. Smith & Humphreys,
2006).
Yin (2003) advocates cross-case synthesis for multiple case studies since cross-case
analysis provides the possibility of replication and generalisation compared to single
within-case analysis. Cross-case analysis was conducted by comparing and contrasting
case-by-case, word tables and feature arrays in order to aggregate and examine common
themes and findings shared by the participating companies, first separately by supplier
and customer, and then combined (Eisenhardt, 1989; Miles & Huberman, 1994;
Mohrman, Gibson, & Mohrman Jr., 2001; Yin, 2003). Since one of the primary
purposes of the research was the development and validation of a generalised CTA –
CR model, cross-case analysis was favoured over within-case analysis.
The results were compared to the research model and the extant literature in order to
refine the CTA – CR model and help select items for the questionnaire. Appendix A2
provides a summary of the interviews, used to inform the scale development and
subsequent interpretation of the survey results from the explanatory phase. Next, the
methodology employed in the explanatory research phase is discussed.
4.4. Explanatory Phase of the Research
4.4.1. Explanatory Phase Approach and Objectives
This phase of the research tested and validated the research model, to thereby
establish theory for better understanding and predicting the effects of the CRM
phenomenon (Sekaran, 2003). First, an overview of the research design is presented,
followed by questionnaire design, development of the research instruments, the survey
implementation methodology, data screening and preliminary analysis, and finally the
data analysis and hypothesis testing procedures.
Chapter 4: Research Methodology
- 93 -
4.4.2. Overview of Research Design
Given the potential difficulty in identifying and gaining access to businesses
contemplating CRM technology adoption, a cross-sectional study was determined more
appropriate than a longitudinal study. Longitudinal studies provide the ability to observe
and test parameters over time with the same individuals or organisation. The advantage
of longitudinal study is that complex variables and interactions that evolve over time
(i.e., relationships) can be identified and causal linkages established more readily
(Bowen & Wiersema, 1999). Hence cross-sectional research limits causal inference
since timing effects may not be understood or captured (MacCallum & Austin, 2000;
Pinsonneault & Kraemer, 1993). A cross-sectional design for this study was justified
however due to cost and resource constraints, and because the study’s primary purpose
was to validate the proposed CTA – CR model, not to identify changes in relationships
over time due to CRM technology adoption (King, 2001; Pinsonneault & Kraemer,
1993; Scandura & Williams, 2000).
In addition, since a number of CRM technology adoption construct measures were to
be developed, a research design that facilitated measurement development was required
(Churchill & Brown, 2004). Measurement development is highly dependent on
respondents that are representative of the population for which the scale is intended
(Alreck & Settle, 2004), since “sample non-representativeness can severely harm a scale
development effort” (DeVellis, 2003, p. 90). Sample representativeness was obtained
through an appropriate random selection procedure described in detail later in the
Sample Selection section.
Although personal interviews are preferable for research dealing with relationships,
the time and cost required to identify and interview a large, diverse sample of
companies and customers made personal interviewing unfeasible (Aaker et al., 2004;
Alreck & Settle, 2004). Telephone interviewing was also dismissed due to the length
and detail of the measuring instrument (136 items for the supplier survey) (Aaker et al.,
2004; Hair et al., 2003; Jobber, Allen, & Oakland, 1985). Internet surveys are becoming
more popular, but suffer from a number of issues including (Couper, Kapteya,
Schonlau, & Winter, 2007; Ranchhod & Zhou, 2001; Simsek & Veiga, 2001):
1. Sampling representativeness, and low response rate, due to user variability in
e-mail use, Internet availability and familiarity,
2. Lack of professional image and design,
Chapter 4: Research Methodology
- 94 -
3. Perceived lack of anonymity, and confidentiality.
Direct mail surveys provide a number of advantages: relatively low cost, access to
widely dispersed samples, minimal resource requirements, and allows time for
thoughtful answers or consultation (Aaker et al., 2004; Hair et al., 2003). The
anonymity provided by mail surveys may also help overcome any sensitivity
surrounding the relationship between the two parties (supplier – customer) (Churchill &
Iacobucci, 2005). Another advantage of the mail survey in the current research is that
the supplier firm also received the customer questionnaire to forward on2. This allowed
the supplier firm to review and become comfortable with the questions their customers
were being asked to answer. Limitations of mail surveys include the possibilities of low
response rate, non-response bias and a loss of control once the survey is in the postal
system (Aaker et al., 2004). Satisfactory response rates can be hard to forecast and
difficult to obtain, however there are techniques and guidelines to help improve
response rates (Dillman, 2000; Dillman, Sinclair, & Clark, 1993; Jobber, 1986; Jobber
& O'Reilly, 1996, 1998), and non-response bias can be estimated (Armstrong &
Overton, 1977; Assael & Keon, 1982).
4.4.3. Questionnaire Design
There are two primary objectives of questionnaire design related to data quality: first,
to reduce non-response, and second, reduce or avoid measurement error (Alreck &
Settle, 2004; Churchill & Peter, 1984; Dillman, 1998, 2000; Fink, 1995; Hair et al.,
2003; McDaniel & Gates, 2005). In addition to the methods proposed by Dillman
(1998; 2000), the nine-step procedure for developing a questionnaire, proposed by
Churchill and Iacobucci (2005) guided the questionnaire design in this study.
4.4.3.1. Information Required
The research objectives, the CTA – CR model and subsequent hypotheses
determined the information required from the research instruments. Five types of
information were sought from the supplier firm; (a) market orientation, (b) IT
management orientation, (c) CRM technology adopted (function, user acceptance and
integration with other systems), (d) environmental characteristics (technology and
marketing turbulence), and (e) personal and organisational demographic classifying 2 The majority of firms preferred to review the customer questionnaire before agreeing to nominate or send out the customer survey; only five firms freely nominated a customer and provided contact details during the original telephone conversation.
Chapter 4: Research Methodology
- 95 -
information (gender, age, work experience, education, business industry, organisation
size, length of relationship with nominated customer, and respondent title). In addition,
relationship strength (trust, commitment, communications), and relationship
performance (perceived performance, satisfaction, loyalty and retention) data were
collected from the supplier respondents. Five types of customer information were
similarly sought: (a) relationship strength, (b) relationship performance, (c)
environmental characteristics, (d) customer characteristics (CRM expectations,
relationship orientation), and (e) personal and organisational demographic classifying
information. Appendix A3 provides the item construction details included in the two
questionnaires.
4.4.3.2. Type of Questionnaire and Method of Administration
Since there was no reason to disguise the rationale or motivation of the study, and
standardisation of questions and responses was necessary for comparison purposes to
enable statistical analysis of the results, a structured-undisguised, self-administered
questionnaire was selected (Alreck & Settle, 2004; Churchill & Iacobucci, 2005;
Netemeyer, Bearden, & Sharma, 2003). Given that the questionnaire was mailed to
supplier firms, with the majority of customer questionnaires forwarded on by the
supplier firm, the self-administered questionnaire was an appropriate method of
administration (McDaniel & Gates, 2005).
4.4.3.3. Form of Response
Rating scales are commonly used in social science research to measure latent
(unobservable) constructs (Alreck & Settle, 2004; Netemeyer et al., 2003). All
constructs in the measuring instrument used seven-point Likert-type scales, except for
one semantic differential scale dealing with communications and a checklist (ranking-
type scale) for one aspect of CRM system integration. Although a five-point scale is
considered adequate, a seven-point scale provides a finer level of detail and does not
place undue cognitive burden on the respondent (Lissitz & Green, 1975; Miller, 1956;
Preston & Colman, 2000). In addition seven appears to be optimal for information
processing purposes and scale reliability (Churchill & Peter, 1984; Cox, 1980; Green &
Rao, 1970; Peter, 1979).
The majority of the scales were treated as interval, with demographic information
fundamentally considered as nominal (DeVellis, 2003; Kirk-Smith, 1998; Nunnally,
Chapter 4: Research Methodology
- 96 -
1959; Nunnally & Bernstein, 1994; F. S. Roberts, 1994; Suppes & Zinnes, 1963;
Traylor, 1983).
4.4.3.4. Question Wording
The literature on survey research methodology provides excellent guidelines for
composing the questions (Alreck & Settle, 2004; Churchill & Iacobucci, 2005; Dillman,
2000; E. Lee, Hu, & Toh, 2004). Questionnaire items from previously published and
validated questionnaires on information systems (Karimi et al., 1996a; Karimi et al.,
2001; Venkatesh & Davis, 2000; Venkatesh, Davis, Morris, & Davis, 2003), marketing
management (Avlonitis & Panagopoulos, 2005; Jayachandran et al., 2005), market
orientation (Pelham & Wilson, 1996), trust (Ganesan, 1994), commitment (Gounaris,
2005; N. Kumar et al., 1995), communication (Z. G. Li & Dant, 1997; Mohr & Sohi,
1995), business relationship (Andaleeb, 1996; Z. G. Li & Dant, 1997), loyalty (Zeithaml
et al., 1996), retention (Sin, Tse, Yau, Lee, & Chow, 2002), and technology and
marketing turbulence (Jaworski & Kohli, 1993; Moorman & Miner, 1997) were adapted
to the context of this study.
4.4.3.5. Question Sequence
The sequence of the questions, or even the order of two or more questions, may have
a significant effect on the answers provided in a survey (Tourangeau, Rips, & Rasinski,
2000). Dillman (2000) and other researchers (Aaker et al., 2004; Churchill & Iacobucci,
2005; Parasuraman, Grewal, & Krishnan, 2004) provide guidelines to help order the
question sequence appropriately. Applying the guidelines involved dividing the supplier
questionnaire into eight sections, and the customer questionnaire into four sections.
Details of the questionnaire construction can be found in Appendix A3.
4.4.3.6. Physical Aspects of the Questionnaire
The perception of questionnaire importance is reflected in its presentation, design
and layout; the respondent’s first impression is a lasting one (Churchill & Iacobucci,
2005; Jobber, 1989; Mayer & Piper, 1982; Sanchez, 1992), even “[t]he format, spacing,
and positioning of questions can have a significant effect on the results” (Malhotra,
1999, p. 312). Following Dillman’s (1978; 2000) recommendations, and to make the
questionnaire appear shorter and less dense, the supplier questionnaire was formatted
into a user friendly six page double-sided standard size A4 booklet. The 136 items in the
Chapter 4: Research Methodology
- 97 -
supplier survey were distributed across 11 sides of paper 3. The customer questionnaire
was similarly formatted into a four page double-sided booklet, with the 72 items
distributed across six sides of paper.
Each questionnaire had a reference number hand written on the top right hand corner
of the cover page to facilitate the matching of supplier and customer questionnaire
returns. There is an argument that respondents may decline to participate or provide
different answers if they believe they can be identified, although recent research is
inconclusive as to the effect of anonymity on mail surveys (Jobber, 1986; Jobber &
Saunders, 1993; Malhotra, 1999; Michaelidou & Dibb, 2006). Confidentiality, however,
was promised in the cover letter and reinforced at the appropriate sections in the
questionnaire.
Following the pre-test the final questionnaire was professionally printed in colour
and stapled in booklet form by the Victoria University of Wellington printing
department.
4.5. Development of Research Instruments
Following the exploratory phase, the construction and validation of the final research
instrument was undertaken. Two versions of the final instrument were prepared – one
version to be administered to the supplier firms (subtitled ‘Supplier Questionnaire’),
another version for the customer firms (subtitled ‘Customer Questionnaire’). The
supplier questionnaire consisted of scales to measure all of the previously outlined
constructs – market orientation (MO), IT management orientation (ITMO), CRM
technology adoption (CTA), relationship strength (RS), and relationship performance
(RP) – including environmental moderating variables. The customer questionnaire
included only the two specific construct measurement scales – RS, RP – and the
environmental moderating variables. However, as additional control variables, the
customer instrument also measured the customer’s CRM expectations (CXP) and their
relationship orientation (CRO).
4.5.1. Overview of Research Instrument Development
Development of the two research instruments used in the explanatory phase of the
study utilised existing scales and measures wherever possible (Menon et al., 1999; 3 In both cases the questionnaire cover page did not contain any questions; the customer questionnaire included page 7 intentionally blank.
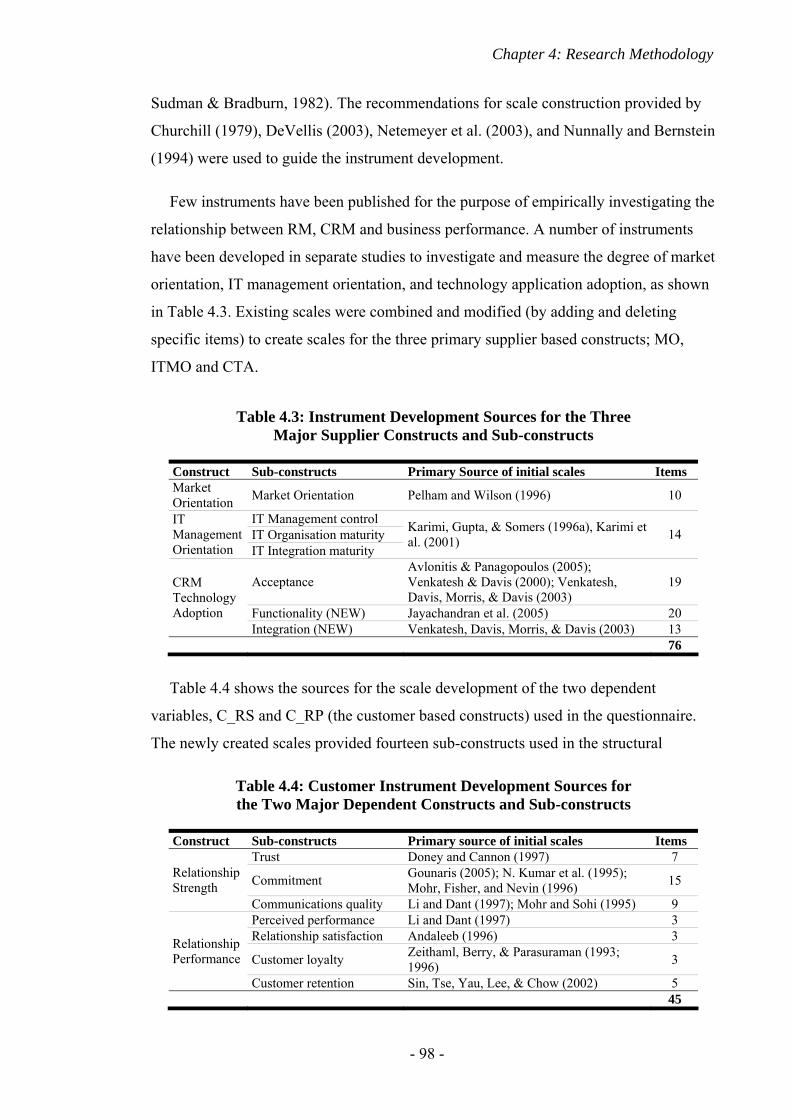
Chapter 4: Research Methodology
- 98 -
Sudman & Bradburn, 1982). The recommendations for scale construction provided by
Churchill (1979), DeVellis (2003), Netemeyer et al. (2003), and Nunnally and Bernstein
(1994) were used to guide the instrument development.
Few instruments have been published for the purpose of empirically investigating the
relationship between RM, CRM and business performance. A number of instruments
have been developed in separate studies to investigate and measure the degree of market
orientation, IT management orientation, and technology application adoption, as shown
in Table 4.3. Existing scales were combined and modified (by adding and deleting
specific items) to create scales for the three primary supplier based constructs; MO,
ITMO and CTA.
Table 4.4 shows the sources for the scale development of the two dependent
variables, C_RS and C_RP (the customer based constructs) used in the questionnaire.
The newly created scales provided fourteen sub-constructs used in the structural
Table 4.3: Instrument Development Sources for the Three Major Supplier Constructs and Sub-constructs
Construct Sub-constructs Primary Source of initial scales Items Market Orientation Market Orientation Pelham and Wilson (1996) 10
IT Management control IT Organisation maturity
IT Management Orientation IT Integration maturity
Karimi, Gupta, & Somers (1996a), Karimi et al. (2001) 14
Acceptance Avlonitis & Panagopoulos (2005); Venkatesh & Davis (2000); Venkatesh, Davis, Morris, & Davis (2003)
19
Functionality (NEW) Jayachandran et al. (2005) 20
CRM Technology Adoption
Integration (NEW) Venkatesh, Davis, Morris, & Davis (2003) 13 76
Table 4.4: Customer Instrument Development Sources for the Two Major Dependent Constructs and Sub-constructs
Construct Sub-constructs Primary source of initial scales Items Trust Doney and Cannon (1997) 7
Commitment Gounaris (2005); N. Kumar et al. (1995); Mohr, Fisher, and Nevin (1996) 15 Relationship
Strength Communications quality Li and Dant (1997); Mohr and Sohi (1995) 9 Perceived performance Li and Dant (1997) 3 Relationship satisfaction Andaleeb (1996) 3
Customer loyalty Zeithaml, Berry, & Parasuraman (1993; 1996) 3
Relationship Performance
Customer retention Sin, Tse, Yau, Lee, & Chow (2002) 5 45
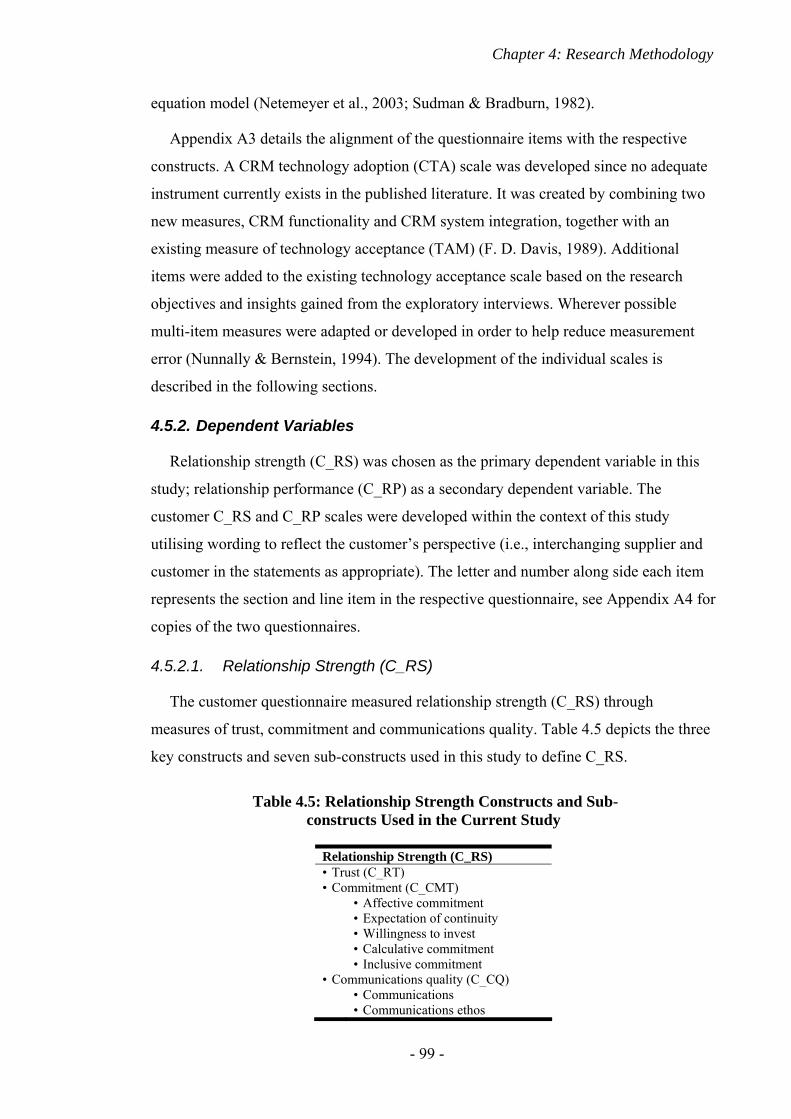
Chapter 4: Research Methodology
- 99 -
equation model (Netemeyer et al., 2003; Sudman & Bradburn, 1982).
Appendix A3 details the alignment of the questionnaire items with the respective
constructs. A CRM technology adoption (CTA) scale was developed since no adequate
instrument currently exists in the published literature. It was created by combining two
new measures, CRM functionality and CRM system integration, together with an
existing measure of technology acceptance (TAM) (F. D. Davis, 1989). Additional
items were added to the existing technology acceptance scale based on the research
objectives and insights gained from the exploratory interviews. Wherever possible
multi-item measures were adapted or developed in order to help reduce measurement
error (Nunnally & Bernstein, 1994). The development of the individual scales is
described in the following sections.
4.5.2. Dependent Variables
Relationship strength (C_RS) was chosen as the primary dependent variable in this
study; relationship performance (C_RP) as a secondary dependent variable. The
customer C_RS and C_RP scales were developed within the context of this study
utilising wording to reflect the customer’s perspective (i.e., interchanging supplier and
customer in the statements as appropriate). The letter and number along side each item
represents the section and line item in the respective questionnaire, see Appendix A4 for
copies of the two questionnaires.
4.5.2.1. Relationship Strength (C_RS)
The customer questionnaire measured relationship strength (C_RS) through
measures of trust, commitment and communications quality. Table 4.5 depicts the three
key constructs and seven sub-constructs used in this study to define C_RS.
Table 4.5: Relationship Strength Constructs and Sub-constructs Used in the Current Study
Relationship Strength (C_RS) • Trust (C_RT) • Commitment (C_CMT) • Affective commitment • Expectation of continuity • Willingness to invest • Calculative commitment • Inclusive commitment • Communications quality (C_CQ) • Communications • Communications ethos

Chapter 4: Research Methodology
- 100 -
4.5.2.1.1. Measurement of Trust (C_RT)
The seven-point Likert scale developed by Doney and Cannon (1997) was adapted
and used to measure the customer’s perception of trust with the supplier (x̄ = 5.30, SD =
1.20, α = 0.94; as reported in the original study). Unless otherwise noted, the seven-
point Likert response scale used in the current study ranged from “Strongly Disagree” to
Strongly Agree”. The eight items used to measure trust in the customer questionnaire:
A2: This supplier keeps promises it makes to our firm.
A3: This supplier is not always honest with us.
A4: We believe the information that this vendor provides us
A5: This supplier is genuinely concerned that our business succeeds.
A6: When making important decisions, this supplier considers our welfare as well as its
own.
A7: We trust this supplier keeps our best interests in mind.
A8: This supplier is trustworthy.
A9: We find it necessary to be cautious with this supplier.
4.5.2.1.2. Measurement of Commitment (C_CMT)
The N. Kumar, Scheer, & Steenkamp (1995) nine-item, seven-point Likert-type scale
measures a firm’s affective commitment (C_AFC), propensity for relationship
continuation (C_EOC), and willingness to invest (C_WTI) (α = 0.82). The results of the
in-depth interviews did not support the inclusion of a normative component of
commitment. The scale items as adapted for this study are listed below:
A10: Even if we could, we would not drop the supplier because we like being associated
with them.
A11: We want to remain a member of the supplier’s network because we genuinely
enjoy our relationship with them.
A12: Our positive feelings towards the supplier are a major reason we continue working
with them.
A13: We expect our relationship with the supplier to continue for a long time.
A14: The renewal of our relationship with the supplier is virtually automatic.
A15: It is unlikely our firm will still be doing business with this supplier in two years.
A16: If the supplier requested it, we would be willing to make further investment in
supporting the supplier’s line.
A17: We are willing to put more effort and investment in building our business in the
supplier’s product.
Chapter 4: Research Methodology
- 101 -
A18: In the future we will work to link our firm with the supplier’s in the customer’s
mind.
Calculative commitment (C_CLC) was measured adapting the Gounaris (2005)
measurement scale (α = 0.87):
A19: It would be difficult to break this relationship.
A20: There are no worthwhile alternative suppliers.
A21: There is a high cost to change suppliers.
The customer questionnaire also included three items to measure inclusive
commitment (C_ICT) (a general commitment to the supplier) adapted from the Mohr,
Fisher, and Nevin (1996) scale (α = 0.80):
A22: We are very committed to carrying this supplier’s products.
A23: We would like to discontinue this supplier’s products.
A24: We have a minimal commitment to this supplier.
4.5.2.1.3. Measurement of Communications Quality (C_CQ)
Communications was measured by adapting Li and Dant’s (1997) four-item, five-
point Likert-type scale (α = 0.83), while communications ethos was measured using
Mohr and Sohi’s (1995) five-item, five point semantic differential scale (α = 0.92).
The customer questionnaire communication scale (C_CM) consisted of the following
four items:
A25: We keep each other informed about events that affect each other.
A26: We often exchange information informally.
A27: We often exchange information beyond what is required by our formal agreements.
A28: We provide each other with information that may be of help.
The customer questionnaire communication ethos scale (C_CME) consisted of the
following five semantic-differential items. The response scale consisted of a seven-point
scale (1 to 7):
Please indicate the nature of your communication with this supplier:
A29: Untimely - Timely
A30: Inaccurate - Accurate
A31: Inadequate - Adequate
A32: Incomplete - Complete
A33: Not credible - Credible
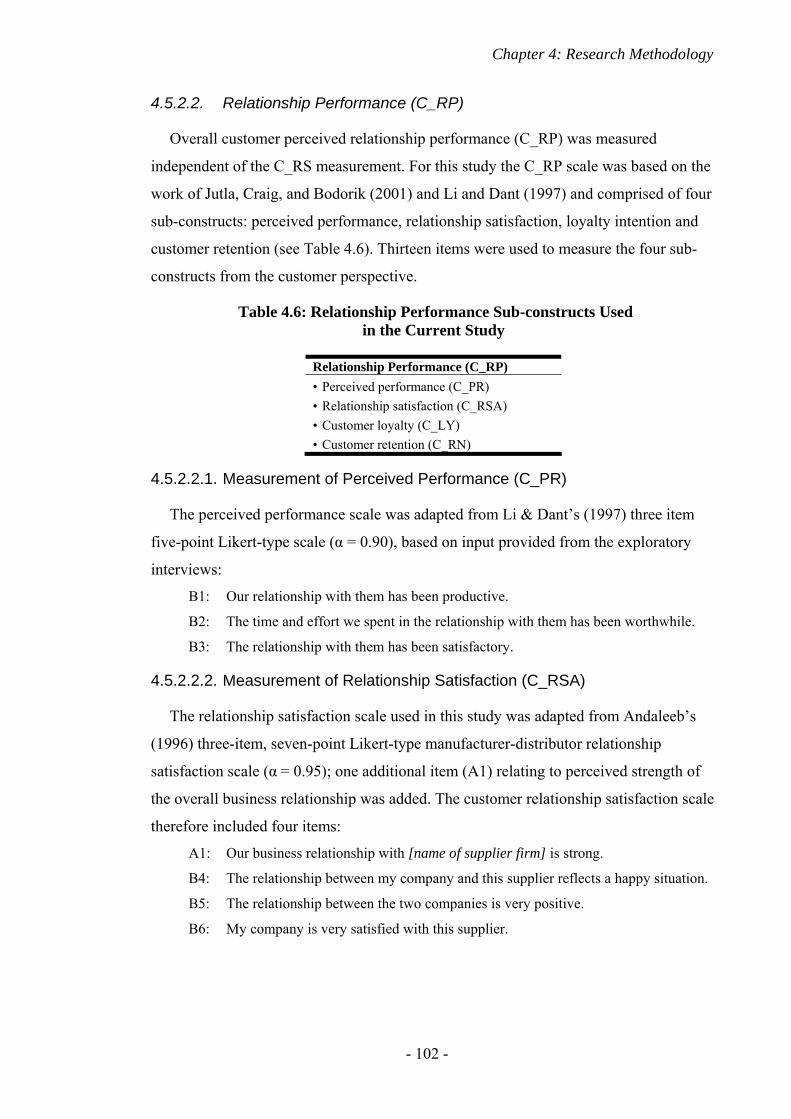
Chapter 4: Research Methodology
- 102 -
4.5.2.2. Relationship Performance (C_RP)
Overall customer perceived relationship performance (C_RP) was measured
independent of the C_RS measurement. For this study the C_RP scale was based on the
work of Jutla, Craig, and Bodorik (2001) and Li and Dant (1997) and comprised of four
sub-constructs: perceived performance, relationship satisfaction, loyalty intention and
customer retention (see Table 4.6). Thirteen items were used to measure the four sub-
constructs from the customer perspective.
4.5.2.2.1. Measurement of Perceived Performance (C_PR)
The perceived performance scale was adapted from Li & Dant’s (1997) three item
five-point Likert-type scale (α = 0.90), based on input provided from the exploratory
interviews:
B1: Our relationship with them has been productive.
B2: The time and effort we spent in the relationship with them has been worthwhile.
B3: The relationship with them has been satisfactory.
4.5.2.2.2. Measurement of Relationship Satisfaction (C_RSA)
The relationship satisfaction scale used in this study was adapted from Andaleeb’s
(1996) three-item, seven-point Likert-type manufacturer-distributor relationship
satisfaction scale (α = 0.95); one additional item (A1) relating to perceived strength of
the overall business relationship was added. The customer relationship satisfaction scale
therefore included four items:
A1: Our business relationship with [name of supplier firm] is strong.
B4: The relationship between my company and this supplier reflects a happy situation.
B5: The relationship between the two companies is very positive.
B6: My company is very satisfied with this supplier.
Table 4.6: Relationship Performance Sub-constructs Used in the Current Study
Relationship Performance (C_RP) • Perceived performance (C_PR) • Relationship satisfaction (C_RSA) • Customer loyalty (C_LY) • Customer retention (C_RN)
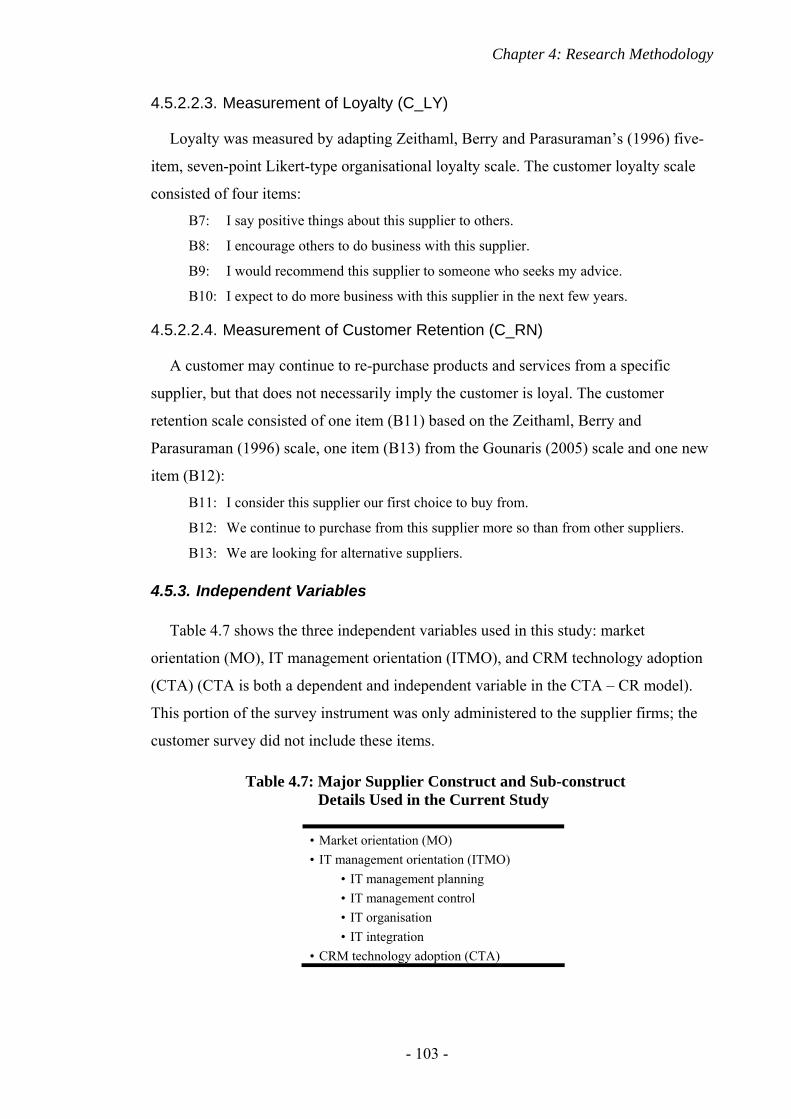
Chapter 4: Research Methodology
- 103 -
4.5.2.2.3. Measurement of Loyalty (C_LY)
Loyalty was measured by adapting Zeithaml, Berry and Parasuraman’s (1996) five-
item, seven-point Likert-type organisational loyalty scale. The customer loyalty scale
consisted of four items:
B7: I say positive things about this supplier to others.
B8: I encourage others to do business with this supplier.
B9: I would recommend this supplier to someone who seeks my advice.
B10: I expect to do more business with this supplier in the next few years.
4.5.2.2.4. Measurement of Customer Retention (C_RN)
A customer may continue to re-purchase products and services from a specific
supplier, but that does not necessarily imply the customer is loyal. The customer
retention scale consisted of one item (B11) based on the Zeithaml, Berry and
Parasuraman (1996) scale, one item (B13) from the Gounaris (2005) scale and one new
item (B12):
B11: I consider this supplier our first choice to buy from.
B12: We continue to purchase from this supplier more so than from other suppliers.
B13: We are looking for alternative suppliers.
4.5.3. Independent Variables
Table 4.7 shows the three independent variables used in this study: market
orientation (MO), IT management orientation (ITMO), and CRM technology adoption
(CTA) (CTA is both a dependent and independent variable in the CTA – CR model).
This portion of the survey instrument was only administered to the supplier firms; the
customer survey did not include these items.
Table 4.7: Major Supplier Construct and Sub-construct Details Used in the Current Study
• Market orientation (MO) • IT management orientation (ITMO) • IT management planning • IT management control • IT organisation • IT integration • CRM technology adoption (CTA)
Chapter 4: Research Methodology
- 104 -
4.5.3.1. Measures of Market Orientation (MO)
Pelham and Wilson’s (1996) nine-item, five-point Likert-type market orientation
scale (α = 0.92), based on Narver and Slater’s (1990) MO operationalisation, was
adapted to measure MO. Ten items on the supplier questionnaire, listed below,
comprised the measure for MO:
C1: All our functions (not just marketing and sales) are responsive to serving target
markets.
C2: All our functions are integrated in serving target markets.
C3: Our firm’s strategy for competitive advantage is based on a thorough
understanding of our customer needs.
C4: All our managers understand how the entire business can contribute to creating
customer value.
C5: Information on customers, marketing success, and marketing failures is
communicated across the firm.
C6: If a major competitor were to launch an intensive campaign targeted at our customers, we would implement a response immediately.
C7: Our firm’s market strategies are to a great extent driven by our understanding of
possibilities for creating value for customers.
C8: Our firm responds quickly to negative customer satisfaction wherever it may occur
in the organisation.
C9: Senior managers frequently discuss competitive strengths and weaknesses.
C10: We frequently leverage targeted opportunities to take advantage of competitor’s
weaknesses.
4.5.3.2. Measures of IT Management Orientation (ITMO)
Karimi et al. (2001) developed an instrument to measure the level of IT management
sophistication through 20 items reflecting IT Planning (IMP) (6 items, α = 0.88), IT
management control (IMC) (6 items, α = 0.86), IT organisation (IMO) (4 items, α =
0.80) and IT integration (IMI) (4 items, α = 0.78) (Karimi et al., 2000; Karimi et al.,
1996a). The nature of the ITMO construct focused on management practices, rather than
technical IT issues, therefore it was anticipated that informed executives should be able
to answer the questions posed in the questionnaire (Churchill & Iacobucci, 2005).
However, in order to make this section less threatening a separate ‘Do not know’
(DNK) category was added to the Likert seven-point scale. Although adding this
category may increase the percentage of DNK answers, the amount of guessing should
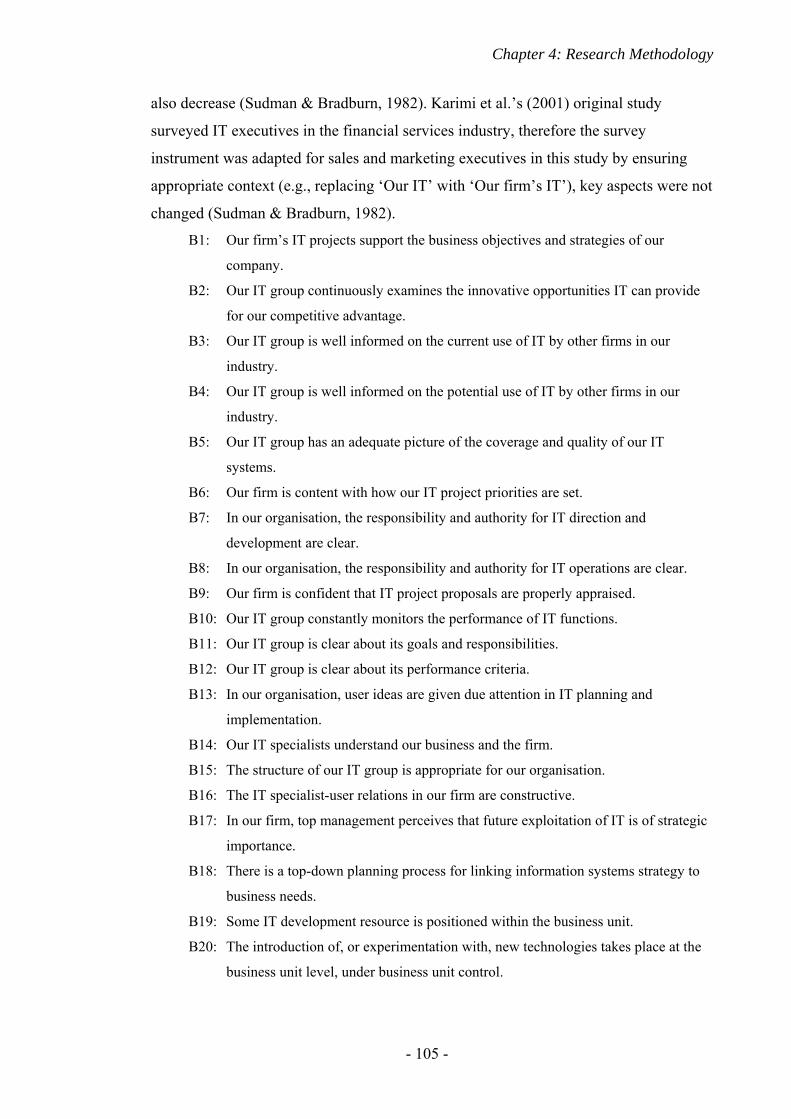
Chapter 4: Research Methodology
- 105 -
also decrease (Sudman & Bradburn, 1982). Karimi et al.’s (2001) original study
surveyed IT executives in the financial services industry, therefore the survey
instrument was adapted for sales and marketing executives in this study by ensuring
appropriate context (e.g., replacing ‘Our IT’ with ‘Our firm’s IT’), key aspects were not
changed (Sudman & Bradburn, 1982).
B1: Our firm’s IT projects support the business objectives and strategies of our
company.
B2: Our IT group continuously examines the innovative opportunities IT can provide
for our competitive advantage.
B3: Our IT group is well informed on the current use of IT by other firms in our
industry.
B4: Our IT group is well informed on the potential use of IT by other firms in our
industry.
B5: Our IT group has an adequate picture of the coverage and quality of our IT
systems.
B6: Our firm is content with how our IT project priorities are set.
B7: In our organisation, the responsibility and authority for IT direction and
development are clear.
B8: In our organisation, the responsibility and authority for IT operations are clear.
B9: Our firm is confident that IT project proposals are properly appraised.
B10: Our IT group constantly monitors the performance of IT functions.
B11: Our IT group is clear about its goals and responsibilities.
B12: Our IT group is clear about its performance criteria.
B13: In our organisation, user ideas are given due attention in IT planning and
implementation.
B14: Our IT specialists understand our business and the firm.
B15: The structure of our IT group is appropriate for our organisation.
B16: The IT specialist-user relations in our firm are constructive.
B17: In our firm, top management perceives that future exploitation of IT is of strategic
importance.
B18: There is a top-down planning process for linking information systems strategy to
business needs.
B19: Some IT development resource is positioned within the business unit.
B20: The introduction of, or experimentation with, new technologies takes place at the
business unit level, under business unit control.
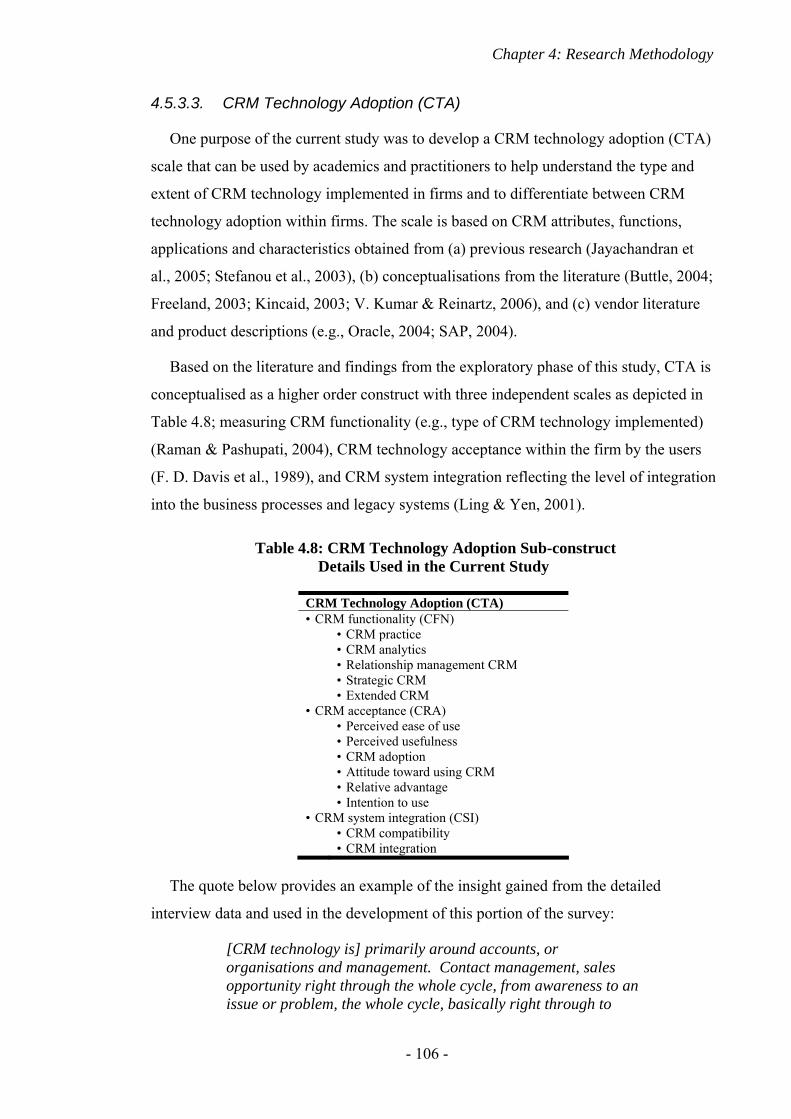
Chapter 4: Research Methodology
- 106 -
4.5.3.3. CRM Technology Adoption (CTA)
One purpose of the current study was to develop a CRM technology adoption (CTA)
scale that can be used by academics and practitioners to help understand the type and
extent of CRM technology implemented in firms and to differentiate between CRM
technology adoption within firms. The scale is based on CRM attributes, functions,
applications and characteristics obtained from (a) previous research (Jayachandran et
al., 2005; Stefanou et al., 2003), (b) conceptualisations from the literature (Buttle, 2004;
Freeland, 2003; Kincaid, 2003; V. Kumar & Reinartz, 2006), and (c) vendor literature
and product descriptions (e.g., Oracle, 2004; SAP, 2004).
Based on the literature and findings from the exploratory phase of this study, CTA is
conceptualised as a higher order construct with three independent scales as depicted in
Table 4.8; measuring CRM functionality (e.g., type of CRM technology implemented)
(Raman & Pashupati, 2004), CRM technology acceptance within the firm by the users
(F. D. Davis et al., 1989), and CRM system integration reflecting the level of integration
into the business processes and legacy systems (Ling & Yen, 2001).
The quote below provides an example of the insight gained from the detailed
interview data and used in the development of this portion of the survey:
[CRM technology is] primarily around accounts, or organisations and management. Contact management, sales opportunity right through the whole cycle, from awareness to an issue or problem, the whole cycle, basically right through to
Table 4.8: CRM Technology Adoption Sub-construct Details Used in the Current Study
CRM Technology Adoption (CTA) • CRM functionality (CFN) • CRM practice • CRM analytics • Relationship management CRM • Strategic CRM • Extended CRM • CRM acceptance (CRA) • Perceived ease of use • Perceived usefulness • CRM adoption • Attitude toward using CRM • Relative advantage • Intention to use • CRM system integration (CSI) • CRM compatibility • CRM integration
Chapter 4: Research Methodology
- 107 -
closing it. Forecasting, activity tracking, tracking events, keeping track of meetings, presentations, workshops,[CRM technology is] a repository for customer information, and reports. Those sorts of things can be tied to the CRM system. Organisation charts. It’s not used here for service; it is used for marketing, although I don’t personally use it for marketing. Though marketing people use it worldwide it’s not used in a service kind of way at all. There’s no integration. Computer Company, Client Relations Executive (Supplier – CRM user)
Note: Where different Likert scale anchor points are used in this section of the
questionnaire, they are italicized and shown in parentheses after the item.
4.5.3.3.1. Measurement of CRM Functionality (CFN)
CRM functionality has not been previously reported in published work as a key
variable (or antecedent) in the adoption or success of CRM technology (Raman &
Pashupati, 2004; Stefanou et al., 2003). A new scale to measure CRM functionality was
based on the extant literature and feedback from the exploratory research interviews
(Greenberg, 2002; V. Kumar & Reinartz, 2006; Payne, 2006; Payne & Frow, 2005).
This new CRM functionality scale consisted of five dimensions; CRM Practice, CRM
Analytics, Relationship Management CRM, Strategic CRM and Extended CRM.
CRM Practice (CPR)
CRM practice relates to functional aspects of the actual tools and applications within
the firm used by the respondent and correspond to the operational aspects of CRM
(Buttle, 2004). The four items listed below focused on sales tools, contact centre
process, customer support process and functional linkages to measure this construct
(Buttle, 2004; Goodhue et al., 2002).
A2: The sales force tools available to me are (The seven-point Likert-type scale for this
item was anchored with: Manual – Fully automated)
A3: Our customer contact centre processes are (Manual – Fully automated)
A4: Our customer support and service processes are (Manual – Fully automated)
A5: All of our systems (e.g., Finance, Sales, and Operations) are linked and talk to each
other. (Not at all – Fully linked)
CRM Analytics (CAN)
CRM analytics “involves the capture, storage, organization, analysis, interpretation
and use of data created from the operational side of the business” (Payne, 2006, p. 23).
The measurement of the construct investigates what information sources, types of
Chapter 4: Research Methodology
- 108 -
analysis and analysis tools are available to the respondent and how automated these
functions are (Buttle, 2004; Goodhue et al., 2002). Three items - availability of
customer information, data analysis, and analysis tools - were used to measure this
construct:
A6: Customer information sources available to me are primarily (Manual card files –
Online profiles)
A7: The customer analyses available to me give (No insights – Detailed insights)
A8: The analysis tools that we use are (Manual – Fully automated)
Relationship Management CRM (RMC)
A central CRM concept is the ability for businesses to better manage customer
relationships, leading to improved customer metrics (Mithas et al., 2005; Reinartz et al.,
2004). The six items used to measure this construct dealt with the extent to which the
CRM technology in place provided assistance to maintain customer relationships,
customer information from customer contact points, a single view of the customer, a
single source of customer information, Internet access to customer and product
information, database updates.
A1: To what extent does your information technology help you maintain relationships
with your customers? (Not at all – To a great extent)
A9: Our customer contact points provide me with (No customer information –
Complete customer information)
A10: Our processes provide me with a single view of the customer. (No single view –
Complete 360 view)
A11: To what extent is a single source for all customer information available? (No single
source – Single source)
A12: To what extent is the Internet / Intranet used to help find customer and product
information? (Not at all – All the time)
A13: To what extent is our customer database(s) updated? (Infrequently – In real time)
Strategic CRM (STC)
Retention, dissemination and strategic use of customer and competitor information
within the firm were used to reflect the strategic CRM construct (Payne & Frow, 2005).
Four items in the supplier questionnaire attempted to measure the extent each supplier
firm engaged in knowledge retention, utilising customer knowledge for decision-
making, dissemination of customer and competitor information within the firm.
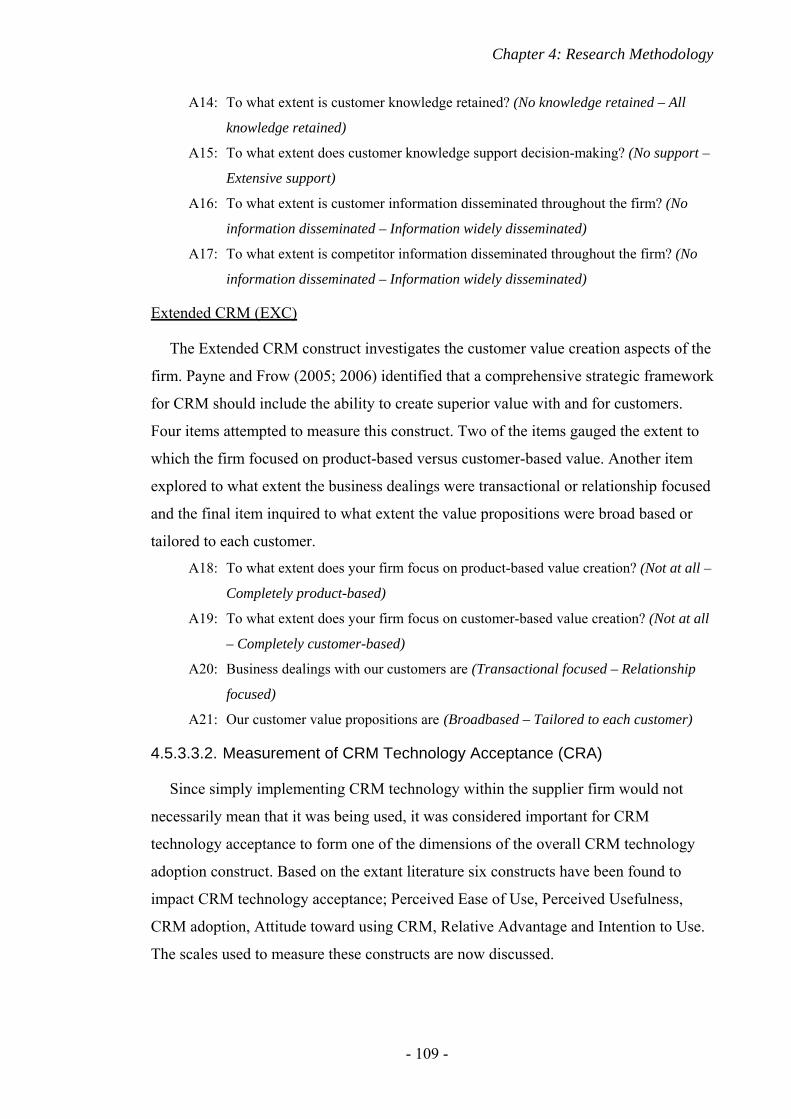
Chapter 4: Research Methodology
- 109 -
A14: To what extent is customer knowledge retained? (No knowledge retained – All
knowledge retained)
A15: To what extent does customer knowledge support decision-making? (No support –
Extensive support)
A16: To what extent is customer information disseminated throughout the firm? (No
information disseminated – Information widely disseminated)
A17: To what extent is competitor information disseminated throughout the firm? (No
information disseminated – Information widely disseminated)
Extended CRM (EXC)
The Extended CRM construct investigates the customer value creation aspects of the
firm. Payne and Frow (2005; 2006) identified that a comprehensive strategic framework
for CRM should include the ability to create superior value with and for customers.
Four items attempted to measure this construct. Two of the items gauged the extent to
which the firm focused on product-based versus customer-based value. Another item
explored to what extent the business dealings were transactional or relationship focused
and the final item inquired to what extent the value propositions were broad based or
tailored to each customer.
A18: To what extent does your firm focus on product-based value creation? (Not at all –
Completely product-based)
A19: To what extent does your firm focus on customer-based value creation? (Not at all
– Completely customer-based)
A20: Business dealings with our customers are (Transactional focused – Relationship
focused)
A21: Our customer value propositions are (Broadbased – Tailored to each customer)
4.5.3.3.2. Measurement of CRM Technology Acceptance (CRA)
Since simply implementing CRM technology within the supplier firm would not
necessarily mean that it was being used, it was considered important for CRM
technology acceptance to form one of the dimensions of the overall CRM technology
adoption construct. Based on the extant literature six constructs have been found to
impact CRM technology acceptance; Perceived Ease of Use, Perceived Usefulness,
CRM adoption, Attitude toward using CRM, Relative Advantage and Intention to Use.
The scales used to measure these constructs are now discussed.
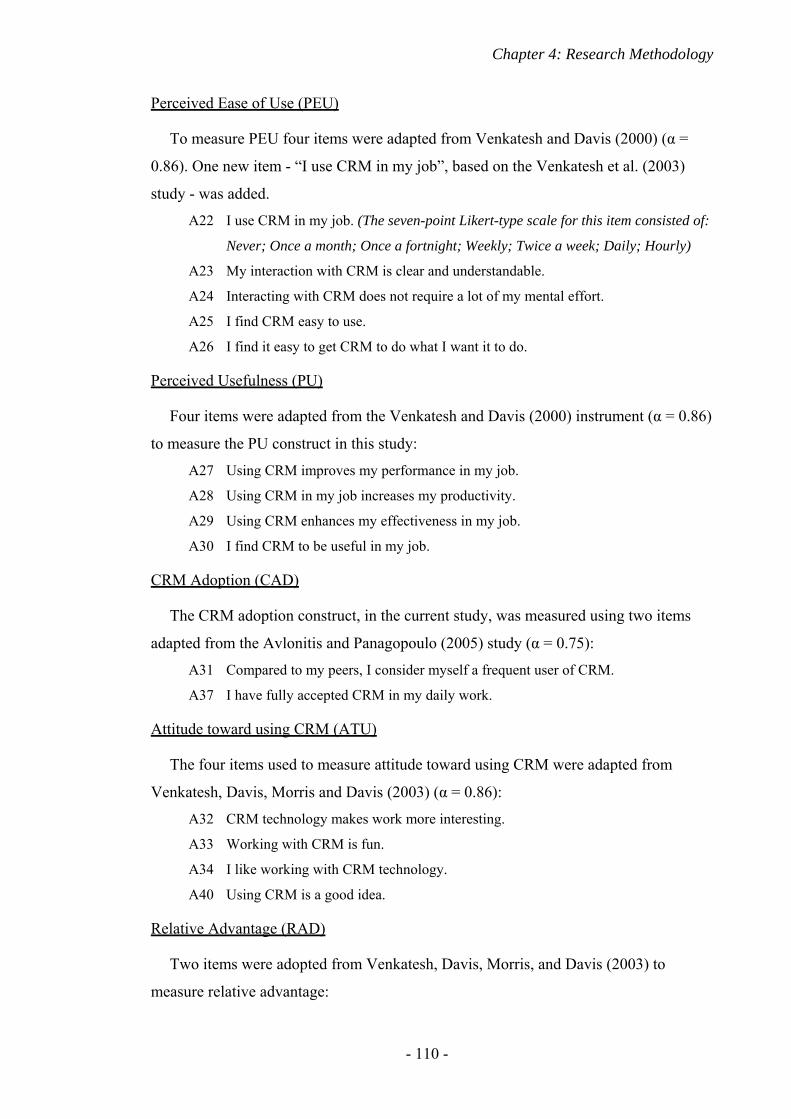
Chapter 4: Research Methodology
- 110 -
Perceived Ease of Use (PEU)
To measure PEU four items were adapted from Venkatesh and Davis (2000) (α =
0.86). One new item - “I use CRM in my job”, based on the Venkatesh et al. (2003)
study - was added.
A22 I use CRM in my job. (The seven-point Likert-type scale for this item consisted of:
Never; Once a month; Once a fortnight; Weekly; Twice a week; Daily; Hourly)
A23 My interaction with CRM is clear and understandable.
A24 Interacting with CRM does not require a lot of my mental effort.
A25 I find CRM easy to use.
A26 I find it easy to get CRM to do what I want it to do.
Perceived Usefulness (PU)
Four items were adapted from the Venkatesh and Davis (2000) instrument (α = 0.86)
to measure the PU construct in this study:
A27 Using CRM improves my performance in my job.
A28 Using CRM in my job increases my productivity.
A29 Using CRM enhances my effectiveness in my job.
A30 I find CRM to be useful in my job.
CRM Adoption (CAD)
The CRM adoption construct, in the current study, was measured using two items
adapted from the Avlonitis and Panagopoulo (2005) study (α = 0.75):
A31 Compared to my peers, I consider myself a frequent user of CRM.
A37 I have fully accepted CRM in my daily work.
Attitude toward using CRM (ATU)
The four items used to measure attitude toward using CRM were adapted from
Venkatesh, Davis, Morris and Davis (2003) (α = 0.86):
A32 CRM technology makes work more interesting.
A33 Working with CRM is fun.
A34 I like working with CRM technology.
A40 Using CRM is a good idea.
Relative Advantage (RAD)
Two items were adopted from Venkatesh, Davis, Morris, and Davis (2003) to
measure relative advantage:
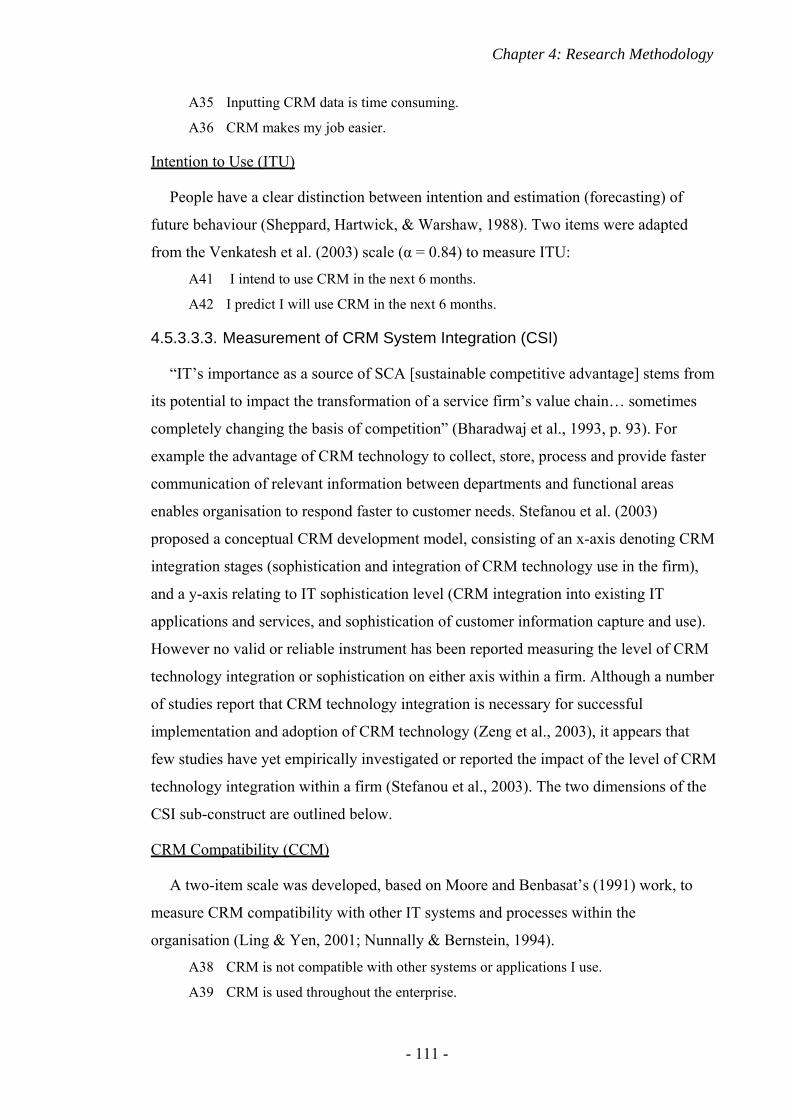
Chapter 4: Research Methodology
- 111 -
A35 Inputting CRM data is time consuming.
A36 CRM makes my job easier.
Intention to Use (ITU)
People have a clear distinction between intention and estimation (forecasting) of
future behaviour (Sheppard, Hartwick, & Warshaw, 1988). Two items were adapted
from the Venkatesh et al. (2003) scale (α = 0.84) to measure ITU:
A41 I intend to use CRM in the next 6 months.
A42 I predict I will use CRM in the next 6 months.
4.5.3.3.3. Measurement of CRM System Integration (CSI)
“IT’s importance as a source of SCA [sustainable competitive advantage] stems from
its potential to impact the transformation of a service firm’s value chain… sometimes
completely changing the basis of competition” (Bharadwaj et al., 1993, p. 93). For
example the advantage of CRM technology to collect, store, process and provide faster
communication of relevant information between departments and functional areas
enables organisation to respond faster to customer needs. Stefanou et al. (2003)
proposed a conceptual CRM development model, consisting of an x-axis denoting CRM
integration stages (sophistication and integration of CRM technology use in the firm),
and a y-axis relating to IT sophistication level (CRM integration into existing IT
applications and services, and sophistication of customer information capture and use).
However no valid or reliable instrument has been reported measuring the level of CRM
technology integration or sophistication on either axis within a firm. Although a number
of studies report that CRM technology integration is necessary for successful
implementation and adoption of CRM technology (Zeng et al., 2003), it appears that
few studies have yet empirically investigated or reported the impact of the level of CRM
technology integration within a firm (Stefanou et al., 2003). The two dimensions of the
CSI sub-construct are outlined below.
CRM Compatibility (CCM)
A two-item scale was developed, based on Moore and Benbasat’s (1991) work, to
measure CRM compatibility with other IT systems and processes within the
organisation (Ling & Yen, 2001; Nunnally & Bernstein, 1994).
A38 CRM is not compatible with other systems or applications I use.
A39 CRM is used throughout the enterprise.
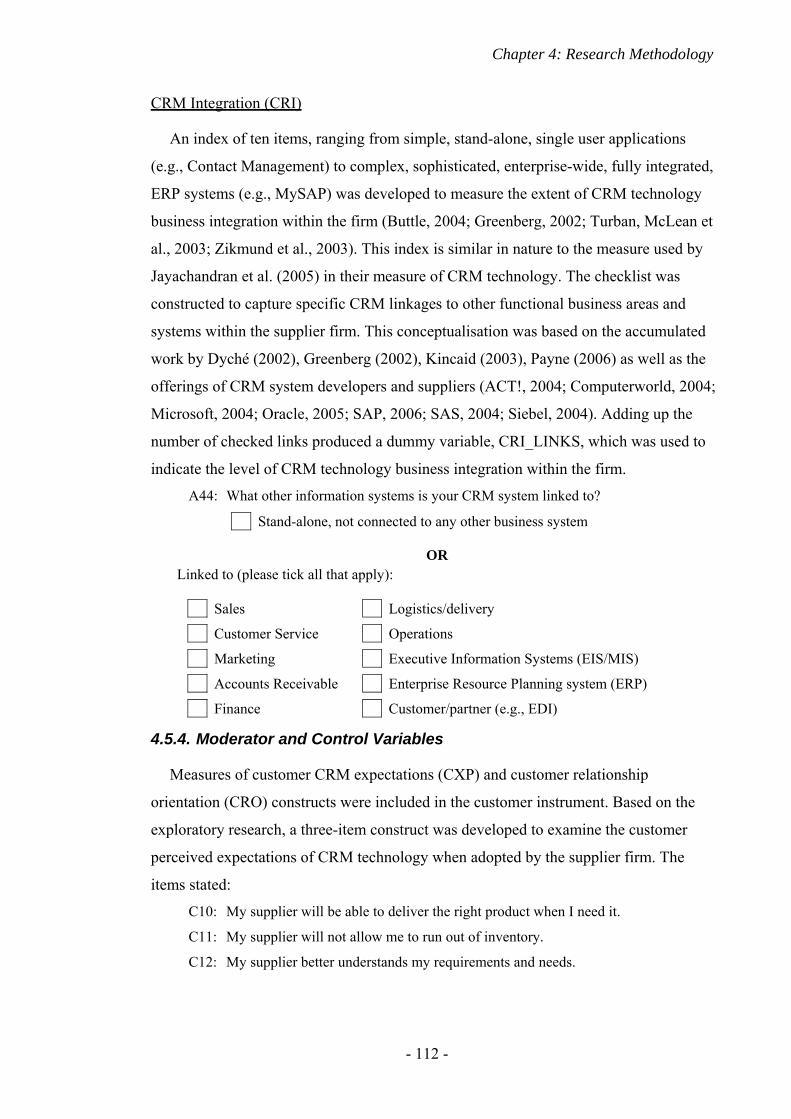
Chapter 4: Research Methodology
- 112 -
CRM Integration (CRI)
An index of ten items, ranging from simple, stand-alone, single user applications
(e.g., Contact Management) to complex, sophisticated, enterprise-wide, fully integrated,
ERP systems (e.g., MySAP) was developed to measure the extent of CRM technology
business integration within the firm (Buttle, 2004; Greenberg, 2002; Turban, McLean et
al., 2003; Zikmund et al., 2003). This index is similar in nature to the measure used by
Jayachandran et al. (2005) in their measure of CRM technology. The checklist was
constructed to capture specific CRM linkages to other functional business areas and
systems within the supplier firm. This conceptualisation was based on the accumulated
work by Dyché (2002), Greenberg (2002), Kincaid (2003), Payne (2006) as well as the
offerings of CRM system developers and suppliers (ACT!, 2004; Computerworld, 2004;
Microsoft, 2004; Oracle, 2005; SAP, 2006; SAS, 2004; Siebel, 2004). Adding up the
number of checked links produced a dummy variable, CRI_LINKS, which was used to
indicate the level of CRM technology business integration within the firm.
A44: What other information systems is your CRM system linked to?
Stand-alone, not connected to any other business system
OR Linked to (please tick all that apply):
Sales Logistics/delivery
Customer Service Operations
Marketing Executive Information Systems (EIS/MIS)
Accounts Receivable Enterprise Resource Planning system (ERP)
Finance Customer/partner (e.g., EDI)
4.5.4. Moderator and Control Variables
Measures of customer CRM expectations (CXP) and customer relationship
orientation (CRO) constructs were included in the customer instrument. Based on the
exploratory research, a three-item construct was developed to examine the customer
perceived expectations of CRM technology when adopted by the supplier firm. The
items stated:
C10: My supplier will be able to deliver the right product when I need it.
C11: My supplier will not allow me to run out of inventory.
C12: My supplier better understands my requirements and needs.
Chapter 4: Research Methodology
- 113 -
The CRO measure was also developed based on information extracted from the
exploratory research and included three items:
C13: I think long-term relationships are good.
C14: If I had to choose I would choose a long-term relationship.
C15: Business relationships provide additional value to my firm.
Market turbulence (MT) and technological turbulence (TT) interaction with the key
variables were measured in both questionnaires. The Jaworski and Kohli (1993) five-
item, five point Likert-type scale was adapted and used to measure market turbulence (α
= 0.68).
G7/C5: In our kind of business, customers’ product preferences change quite a bit
over time.
G8/C6: Our customers tend to look for new products all the time.
G9/C7: We are witnessing demand for our products and services from customers who
never bought them before.
G10/C8: New customers tend to have product-related needs that are different from
those of our existing customers.
G11/C9: The nature of the market has changed significantly over the last few years.
Technology turbulence was measured using an adaptation of the Jaworski and Kohli
(1993) four-item, five point Likert-type scale (α = 0.88).
G3/C1: The technology in our industry is changing rapidly.
G4/C2: Technology changes provide big opportunities in our industry.
G5/C3: Many new product ideas have been made possible through technological
breakthroughs in our industry.
G6/C4: Technological developments in our industry are rather minor.
4.5.5. Nominated Customer Contact
Mid-way through the supplier questionnaire (Section D), preceding the sections on
relationship strength and relationship performance, supplier respondents were asked to
nominate a customer, including the company name, contact person and phone number,
email and/or address. This customer information was necessary in order to send out the
customer surveys and follow up customer participation. The respondents were informed
that this information would remain confidential. In addition the respondent was asked to
indicate on a seven-point Likert scale the strength of the business relationship with the
customer.
Chapter 4: Research Methodology
- 114 -
In order to control for potential bias caused by the nominated customer selection (J.
C. Anderson & Narus, 1984; K. Kim, 2000; Rokkan et al., 2003), the statement
requesting the information included the following: “If you have not already done so,
please provide customer contact details for either your third or your fourth most
important customer.”
4.5.6. Demographic and Classification Information
Section H requested background information of the respondent and the firm,
including (a) gender, (b) industry, (c) annual gross revenue, (d) number of employees in
the firm, (e) length of relationship with the nominated customer, (f) full-time work
experience, (g) education level, (h) age and (i) position or title. These respondent
profiles were collected partly to determine sample representativeness and response bias,
and partly to determine whether some of these factors might comprise important
covariates in later analysis. The last page of the questionnaire provided space to note
any additional thoughts or comments on the issues raised and an opportunity to request
a summary of the results.
4.5.7. Data Collection for Instrument Refinement and Verification
A pre-test was conducted with five CRM sales and marketing users, also considered
CRM experts, and five academic colleagues from Victoria University of Wellington.
Ten specifically chosen experts was deemed a sufficient number for a pre-test
(Moorman et al., 1993; Spector, 1992). The questionnaire was reviewed by each of
them to ensure adequate understanding, comprehensibility, face validity, and reliability
of measures employed. The pre-test respondents focused primarily on content validity
(the extent to which the items reflect the constructs), questionnaire response formats
(appropriateness of item statements and scale points) and instructions (DeVellis, 2003;
Diamantopoulos, Reynolds, & Schlegelmilch, 1994; Netemeyer et al., 2003). The
respondents found that the questionnaires were easy to complete, easy to understand and
generally were able to be completed within the suggested timeframe (25 minutes for the
supplier questionnaire and 10 minutes for the customer questionnaire). The pre-test
indicated that respondents were comfortable with the seven-point Likert scale format.
Based on the feedback several modifications were incorporated into the questionnaires.
Two questions were deleted, the wording of certain scale items was modified, extensive
section explanations were removed, and the instructions were simplified and clarified.
Chapter 4: Research Methodology
- 115 -
Rearrangement of some questions was undertaken to improve the flow and sequencing
of the questionnaire. In particular the first questions were revised to make them more
salient and appealing, since, as Dillman (2000, p. 92) emphasises “no single question is
more crucial than the first one” and may influence whether the questionnaire will be
completed or discarded. A definition of CRM technology was added to the front cover;
and the inside front cover and second page included a succinct definition of CRM
technology highlighted in bold typeface, to ensure there was a common definition
readily available in the sections relating to CRM.
4.5.8. Survey Implementation
Survey implementation should attempt to: (a) reduce the respondent response burden,
(b) provide appropriate incentive to participate, and (c) build trust in the researcher-
respondent interaction (Dillman, 1978). Therefore a modified Total Design Method
(TDM) was used to guide the survey implementation, in order to improve data quality,
and optimise the response rate (Dillman, 2000).
There are a number of reasons respondents may not participate in mail surveys,
including time constraints, too many questionnaires, questionnaire length, and
complexity (Baldauf, Reisinger, & Moncrief, 1999; Huber & Power, 1985).
Organisational respondents may be prohibited from providing detailed or confidential
information due to sensitivity issues surrounding the CRM implementation (Hair et al.,
2003). Poor business relationship or confidentiality issues with customers may make
asking for their customer participation problematic. In addition informants may submit
inaccurate data since the linkage between self-reported attitude and behaviour is tenuous
(Kirk-Smith, 1998). To help overcome non-participation by potential respondents,
respondents were offered a summary of the completed study as a tangible benefit of
their participation, confidentiality of the study was emphasised, the university
connection was highlighted and the participant’s process streamlined as much as
possible (Gendall, Hoek, & Esslemont, 1995).
Although incentives, in general, are considered advantageous in generating higher
response rates (Dillman, 2000; Jobber, Mirza, & Wee, 1991; Jobber, Saunders, &
Mitchell, 2004), the current study was guided by Jobber and Saunders (1993) who
found that the influence of incentives in a B2B context may be offset by simply making
Chapter 4: Research Methodology
- 116 -
additional quality contacts, and effective telephone and mail follow-up. Therefore the
following steps were implemented:
1. Firms were contacted by telephone to verify current contact details. If there
was no answer, or the appropriate person was busy or not available, the call
was noted in the Call Back Log and two additional call attempts were made.
On the third call a message was left briefly outlining the purpose of the call and
asking for the contact person to call the researcher back.
2. A personal request was made to each CEO/MD/Sales/Marketing manager to
participate.
3. A cover letter and questionnaire(s) were mailed to the appropriate informant
with detailed information regarding purpose, due dates, benefits to their
organisation, and researcher’s contact details.
4. Self-addressed, free-post return envelope(s) were included in the mail-out
(Jobber & O'Reilly, 1998).
5. Each firm was followed-up through the post and through telephone calls.
4.5.8.1. Sample Selection
Less than 20 employees is considered small business, while greater than 100
employees is considered large business in New Zealand (Locke, 2004; Statistics New
Zealand, 2005). Small business are less likely to adopt extensive IT, due to their lack of
readiness, little peer pressure and perceived benefit (Iacovou, Benbasat, & Dexter,
1995; J. Lee, 2004). Therefore companies with twenty or more employees were selected
for the study. Based on New Zealand business census data this employee cut-off point
represents 4,669 enterprises (see Table 4.9), 2.8% of the total enterprises in New
Zealand (Statistics New Zealand, 2005).
The ANZSIC (Australian New Zealand Standard Industry Classification) divisions
targeted for this research were Manufacturing (Division C), Wholesaling (Division F),
and Services (Divisions J, K and L), shown in Table 4.9. Educational institutions,
government bodies, hospitals and libraries were excluded since they are non-profit
oriented and are less likely to utilise CRM practices.
A list of New Zealand companies in the manufacturing, wholesale and services
industries was compiled from the Kompass (April 2006) database. The subset of New
Zealand-based firms with contact details identified from the Kompass database and

Chapter 4: Research Methodology
- 117 -
meeting the ANZSIC and business criteria was 3,414. From this list 1,689 randomly
selected companies were contacted by telephone in order to identify the appropriate
person, gain agreement to participate, collect customer contact details and validate
contact details in the database. This study employed a purposeful heterogeneous mix of
industries in order to provide a greater opportunity to generalise the results (John &
Reve, 1982).
4.5.8.1.1. Unit of Analysis
The unit of analysis is the same as described in the exploratory phase: the supplier -
customer dyad. This type of dyadic relationship unit of analysis has been investigated
previously by Medlin (2003), Gundlach, Achrol and Mentzer (1995) and K. Kim
(2000).
4.5.8.1.2. Company and Respondent Selection
Well-informed and knowledgeable executives make good informants, providing as
accurate and sound information as those collected from multiple sources (Menon et al.,
1999; Zahra & Covin, 1993). There has been some controversy regarding single
informant responses, however, studies have shown that key informants can supply
reliable data given their role provides them with the required information and they are
willing to participate (D. T. Campbell, 1955; John & Reve, 1982; K. Kim, 2000).
However, “when dependent and independent variable data are collected from a single
informant, common-method bias can be a potential problem” (Menon et al., 1999)4.
Keeping in mind the research question, as to whether CRM technology adoption
impacts business relationships and relationship performance, the lack of empirical
4 Measures used to address common-method bias are discussed in detail in Chapter 5.
Table 4.9: Target Enterprise (ANZSIC) by Employee Count
ANZSIC Division Employee Count Size Group(4)
0 1-5 6-9 10-19 20-49 50-99 100+ Total C Manufacturing 9,720 6,130 1,953 1,973 1,292 432 353 21,853 F Wholesale Trade 8,835 4,905 1,358 1,134 661 174 121 17,188 J Communication Services 2,579 565 52 58 28 11 16 3,309 K Finance and Insurance 8,645 1,589 261 146 92 34 52 10,819 L Property and Business Services 95,407 13,475 2,284 1,663 899 271 233 114,232
Total Enterprises 125,186 26,664 5,908 4,974 2,972 922 775 167,401
Target population 4,669
Source: Statistics New Zealand (2005)
Chapter 4: Research Methodology
- 118 -
dyadic research, and the requirement for matched customer data, a dual respondent
approach – from the supplier and from the customer – was deemed appropriate. It was
imperative that at least one customer be matched to each firm, agreed to participate in
the study and returned a completed questionnaire.
J. C. Anderson and Narus (1990), in their study of working partnerships between
manufacturers and distributors, found the collection of dyadic data difficult and
problematic. One of the primary issues was that the first or second highest selling
distributors had very uniform working relationships with the manufacturers – providing
little variation. To overcome this issue, researchers asked the distributors to “specify as
their manufacturer partner the firm that supplied the fourth-highest-selling product line
and accounted for at least 5% of their total sales… or… third-highest-selling product
line, and so on” (p. 46). K. Kim (2000), and Rokkan, Heide, and Wathne (2003), have
used similar selection criteria to overcome potential respondent selection bias in their
distributor-supplier dyad research. Following the approach taken by these earlier
researchers, each potential supplier participant in the present study was asked to provide
the contact details for a customer that they feel are representative of their “third or
fourth most important” customer, and who may be willing to participate.
4.5.8.2. Initial Contact
Each CEO, marketing manager or sales manager was initially contacted by telephone
to establish the identity of a key person responsible for customer relationships,
determine survey eligibility, confirm details and gain respondent agreement to
participate in the survey (Dillman, 2000; Jobber & O'Reilly, 1998; Schlegelmilch &
Diamantopoulos, 1991). Appropriate survey questionnaire packages were sent to the
contact person at the supplier firm, and also to the customer contact person if available,
for the collection of data from the participating supplier firms and customers.
4.5.8.3. Cover Letter and Mail-out
Three different cover letters were necessary in order to provide an appropriate letter
for each type of recipient (supplier firm, unknown customer, known customer). In the
cases where the customer contact details were given over the telephone during the initial
contact (known customer), a personalised customer cover letter was produced. The
majority of supplier firms only provided the customer contact details once they had
received both questionnaires, and forwarded the customer questionnaire themselves
Chapter 4: Research Methodology
- 119 -
(unknown customer). In this case the customer questionnaire package consisted of a
generic customer cover letter. The body of the cover letter was similar in all three cases,
see Appendix A5.
4.5.8.4. Follow-up Procedures
Follow-up procedures were especially important in this study since the methodology
depended on completed survey responses from both the supplier and customer firms.
Due to the potentially sensitive nature of the survey, dealing with interfirm and personal
relationships, and the criticality of the customer to also return a survey, a follow-up
procedure was standardised for this study. The follow-up procedure included a postcard
mailer to the supplier firm after three weeks, followed by a telephone call two weeks
later (Reinartz et al., 2004). During the telephone follow-up process two telephone
attempts were made before a message was left which invited the potential participant to
contact the researcher.
A follow-up process for nominated customers included a telephone call one week
after receiving the completed supplier questionnaire. Customers continued to receive
telephone follow-up until they returned a completed survey, promised to complete the
survey, declined to participate or after three unsuccessful attempts. The overall follow-
up process continued until the number of matched surveys (dyads) met the minimum
sample size requirements and was considered sufficient by the researcher5.
Non-deliverable surveys were not considered a problem since (a) the database was
developed using the latest Kompass CDROM (April 2006), (b) addresses and contact
details were verified on the initial telephone contact, and (c) any returned surveys were
re-verified with the original contact person, re-addressed and re-mailed. However one
supplier followed-up did report that the survey was mailed back, but was never received
by the researcher.
4.6. Data Analysis and Hypothesis-testing Procedures
4.6.1. Overview
Data was collected separately from both the supplier and the customer, and the
returned surveys matched and coded. Data summaries using SPSS, factor analysis and
5 The minimum sample size requirements are discussed in the following PLS section and again in Chapter 5.
Chapter 4: Research Methodology
- 120 -
structural equation modelling (SEM) was used to analyse the data, validate the
measurement model and test the hypotheses.
4.6.2. Structural Equation Modelling
Structural equation modelling (SEM) has a long history and is widely used in a
number of disciplines, including marketing (Chau, 1997; Maruyama, 1998) and
information systems (Rivard & Huff, 1988). SEM is a powerful second generation
multivariate technique for analysing results that may have a number of variables,
allowing the assessment of measurement properties and theoretical (structural)
relationships, including unobservable latent variables with multiple relationships,
simultaneously within the same analysis (Chin, 1998a, 2000). SEM uses a combination
of multiple regression, factor analysis and path analysis techniques to simultaneously
estimate measurement of, and the relationships between, a number of theoretically
related constructs (latent variables) (Hoyle, 1995; Kelloway, 1998; Kline, 2005;
Maruyama, 1998; Schumacker & Lomax, 2004).
SEM provides advantages over other multivariate analysis techniques. For example
analysis of variance (ANOVA) and regression models assume error free measurement
of the dependent variable and separate measurement models (Bagozzi, 1977). In
contrast SEM determines measurement error, and tests measurement and structural
models simultaneously. The SEM iterative analysis process allows the testing of
complex and large-scale models in a systematic and comprehensive manner (Gefen,
Straub, & Boudreau, 2000; Wilcox, 1998).
There are two fundamental SEM techniques; covariance based and principal
component based. Covariance-based SEM assumes data to be multivariate normal,
meeting the requirements of univariate normality, linearity, homoscedasticity, non-
multicollinearity, scaled relative variance, and requires fairly large sample sizes (e.g.,
samples of 250 or more) (Hair, Black, Babin, Andersen, & Tatham, 2006; Kline, 2005;
Schumacker & Lomax, 2004). Data distributions departing from these assumptions may
not produce valid SEM results. Hence covariance-based SEM has difficulty coping with
relatively small sample sizes when examining large numbers of interactions, non-linear
relationships between variables and constructs, multicollinearity and heteroscedasticity
(Gefen et al., 2000). Covariance-based SEM has also been shown to exhibit serious
flaws when not applied properly with respect to: (a) data characteristics, (b) reliability
Chapter 4: Research Methodology
- 121 -
and validity, (c) evaluating model fit, (d) model respecification, and (e) equivalent
models (Shook, Ketchen, Hult, & Kacmar, 2004).
Although SEM’s strength is the ability to estimate both the measures of a latent
variable, and a number of interrelated variables simultaneously, while allowing
dependent variables in one equation to become independent variables in others,
“[s]tructural equation modelling is inherently a confirmatory technique” (Kelloway,
1998, p. 7). SEM relies on theory in order to specify a model for testing.
Model specification includes two distinct components (a) a measurement model and
(b) a structural model (Hoyle, 1995; Kline, 2005). Within the SEM analysis,
confirmatory factor analysis is employed to validate the items (indicators) explicitly
measuring the individual latent variables. The structural model on the other hand
formally describes the causal relationship between the latent variables to be estimated
and tested (Hoyle, 1995).
4.6.3. Partial Least Squares (PLS)
Partial least squares (PLS) is a specific variance-based (principal components)
second generation SEM analysis technique that is appropriate for testing complex
structural models with multiple constructs where latent variables (theoretical
constructs), non-normal data, small sample size and multicollinearity exist (Fornell &
Bookstein, 1982; Fornell & Cha, 1994; Hulland, 1999; Wold, 1985). Although the
covariance-based methods (e.g., LISREL) has dominated the marketing literature PLS
provides some unique advantages (Fornell & Bookstein, 1982; Fornell & Cha, 1994;
Wold, 1982). Since PLS is conducted as a series of interdependent ordinary least
squares (OLS) regressions, PLS does not (a) require large sample sizes, (b) assume any
specified multivariate distribution, or (c) demand observation independence (Fornell &
Bookstein, 1982; Fornell & Cha, 1994). Some researchers consider it to be a
complementary alternative to the covariance-based SEM technique (Chin, 1995; Hair et
al., 2006).
Social science data does not always meet the stringent requirements of multivariate
normality, interval scaling or sample sizes required by covariance-based SEM
techniques (Fornell & Bookstein, 1982). PLS uses an estimation procedure that only
involves a part of the model in each step; measurement models are estimated separately
construct by construct (block by block). Hence PLS only needs enough cases to estimate
Chapter 4: Research Methodology
- 122 -
the largest number of parameters for any one structural equation (Fornell & Cha, 1994).
Chin (2000) suggests a minimum sample size of 30 cases or ten times the construct with
the greatest number of structural paths going into it. The research model, discussed in
Chapter 3 and evaluated in Chapter 5, indicates that the largest number of structural
paths going into the CTA construct is four; therefore the minimum sample size required
by PLS to evaluate the model is 40 dyads.
The aim of “PLS is to maximize variance explained” (Chin, 1995, p. 6) from
observed or unobserved variables, whereas covariance-based SEM techniques (i.e.,
LISREL) attempt to account for observed covariance and provide the best fit to a
theoretical covariance matrix (Fornell & Bookstein, 1982; Fornell & Cha, 1994). Hence
covariance SEM techniques are better suited for theory testing while PLS is better
suited for explaining complex relationships (Fornell & Bookstein, 1982; Fornell,
Lorange, & Roos, 1990; Tobias, 1995). PLS iteratively minimises all residual variances
until the parameter estimates stabilize. In particular PLS considers all path coefficients
simultaneously, allowing analysis of direct, indirect and spurious relationships, and
estimates the individual item weightings within the theoretical model rather than in
isolation, (Birkinshaw, Morrison, & Hulland, 1995). PLS is most useful for exploratory
research with little previous developed theory, many and complex variable interactions,
and non-normal data distributions. PLS avoids indeterminacy (where factor scores
cannot be calculated) and the occurrence of multiple solutions, both issues with
covariance-based SEM techniques, by utilising component scores and explicitly
defining the unobservable latent variables (Cool, Dierickx, & Jemison, 1989;
Lastovicka & Thamodaran, 1991).
The social science disciplines where PLS has been used includes, information
systems (e.g., Compeau & Higgins, 1995; Hwang, 2005; Karimi, Somers, & Gupta,
2004; Rivard & Huff, 1988; Wixom & Watson, 2001), strategic management (e.g.,
Birkinshaw et al., 1995; Cool et al., 1989; Delios & Beamish, 1999; Johansson & Yip,
1994), organisational behaviour (e.g., Howell & Higgins, 1990) and marketing (e.g.,
Arnett, Laverie, & Meiers, 2003; Ashill, Carruthers, & Krisjanous, 2005, 2006; Barclay,
1991; Grégoire & Fisher, 2006; Klemz, Boshoff, & Mazibuko, 2006; O'Cass, 2002; J.
B. Smith & Barclay, 1997; Zinkhan et al., 1987).
PLS is considered particularly appropriate for this research since (a) the focus is
theory development rather than theory testing, (b) the proposed CRM technology
Chapter 4: Research Methodology
- 123 -
adoption – customer relationship model conceptualisation is complex with latent
variables constructs taking on both dependent and independent roles simultaneously, (c)
there are a smaller number of cases than would be required were a covariance-matching
method used, and (d) the data distribution is non-normal.
In practice SEM is conducted with computer software utilising a covariance-based
(e.g., LISREL, EQS and AMOS) or component-based (e.g., PLS-Graph and SmartPLS)
approach (Bentler, 2005; Byrne, 2001, 2006; Chin, 1998a; Joereskog & Soerbom, 1982;
Ringle, Wende, & Will, 2005). SmartPLS version 2.0 M3 was chosen to conduct the
PLS analysis (Ringle et al., 2005).
4.6.3.1. Confirmatory Factor Analysis (CFA)
Confirmatory factor analysis (CFA) is generally used to assist in the confirmation
and validation of the unidimensionality of constructs used in a survey. Although there
are differences of opinion among researchers regarding acceptable criteria, minimum
factor component loadings of 0.70 or higher are normally considered significant for
CFA purposes and are adopted in this study (Hair et al., 2006; Nunnally & Bernstein,
1994).
4.6.4. Exploratory Factor Analysis (EFA)
Factor analysis is a series of procedures primarily used for data reduction and
summarisation. The relationships between large numbers of interrelated variables are
examined and underlying factors are extracted based on correlation groupings. Factor
analysis is also used to identify smaller sets of uncorrelated variables to be used in
subsequent multivariate analysis (Malhotra, 2007).
Exploratory factor analysis (EFA) is used as a first step to identify and validate factor
groupings reflecting underlying theoretical constructs. Since PLS is dependent to some
extent on theory to guide the model development and construction, it is not appropriate
for EFA. EFA considers the correlated factor loadings of all items related to a construct
(and / or series of sub-constructs) simultaneously to determine appropriate independent
factor components (Nunnally & Bernstein, 1994). To aid interpretation, factor loadings
can also be rotated (e.g., varimax) in order to produce orthogonal or “clean” loadings on
independent components. In this study, minimum factor component loadings of 0.60 or
higher are considered significant for EFA purposes, while factors exhibiting cross-
loadings of 0.45 and above should be considered for deletion (Hair et al., 2006).
Chapter 4: Research Methodology
- 124 -
4.7. Chapter Summary
This chapter outlined the research method to be used in this study. The research is
divided into two phases. The exploratory phase of the research used a multiple-case
design method in order to better understand the CRM technology adoption – customer
relationship (CTA – CR) phenomenon within the business-to-business environment.
The results from this phase were used in finalising the conceptual model and design of
the research instrument. Instrument development utilised existing scales and measures
wherever possible, however since measures did not exist for some constructs (e.g.,
CTA, CRO and CXP), scales were developed and tested specifically for this study. Two
different instruments were developed – one for the supplier firm (independent
variables), another for the customer (dependent variables).
The explanatory phase of the research consisted of a mail survey, the data
subsequently used to validate the CTA - CR model and test the hypotheses. This
involved distributing and collecting survey questionnaires from 1,689 New Zealand
business firms in the manufacturing, communications, services and wholesale
industries. The customer survey questionnaire was delivered to customers nominated by
the participating supplier firms. Each participating supplier firm response was matched
with the customer response to form a dyad. The unit of analysis in this study is the
supplier – customer dyad relationship. Structural equation modelling (SEM) and other
data analysis techniques were discussed. Due to the complexity of the CTA - CR model
with latent variables taking on both dependent and independent roles, a small sample
size, and non-normal data distributions, partial least squares (PLS) data analysis was
selected to test the research hypotheses.
- 125 -
CHAPTER 5. Data Analysis and Results
5.1. Introduction
The purpose of this chapter is to reflect briefly upon the contribution of the
qualitative (exploratory) phase, and present a full analysis of the relevant data collected
from the quantitative (explanatory) phase of the research. The chapter presents key
insights from the exploratory research, as well as the results from the questionnaire
survey, including the multivariate analysis techniques undertaken, and the results of the
hypotheses testing.
5.2. Exploratory Analysis and Results
The ten supplier and customer interviews from the exploratory phase were analysed
using the guidelines provided by Miles and Huberman (1994) and Yin (2003). Detailed
summaries of the qualitative data analysis can be found in Appendix A2. Where
available representative quotes from the interview data are presented to exemplify the
results of the qualitative data analysis. The key insights gained include:
1. Overall support for the proposed CRM technology acceptance – customer
relationship model. Both supplier and customer firm respondents agreed that
CRM technology can play an important role in B2B relationships (see
Appendix A2.1: Q14, Q22, Q25).
[I]t enables people who aren't good at relationships to at least have a reasonable level of performance…. it provides reminders of things they should be doing anyway, and consistency. HR Manager (Customer).
The most important word in CRM is relationships and CRM is to help that. Investor Services Manager (Supplier – CRM user).
2. Validation of the proposed variables and the impact of CRM technology
adoption on business relationships. Supplier respondents indicated that the MO
of the firm influenced CRM technology adoption (Appendix A2.5). Responses
to the ITMO questions provided mixed responses from the supplier firms
(Appendix A2.6), thereby providing support for its inclusion as a variable. The
analysis results also corroborated the CTA, relationship strength and
relationship performance constructs and sub-constructs (Appendix A2.1).
Chapter 5: Data Analysis
- 126 -
Once again I think as a customer you don't know if someone is using a CRM system. You just don't know that. Your relationship with them might be absolutely brilliantly, they're timely, their information is good and that maybe coming out of the CRM system but you don't know that. Supply Company Services Manager (Customer).
We’re very market orientated…[but]… No I think it’s totally accidental that [the implementation of CRM technology] happened and I think it’s probably the other way round. We have the CRM system and I guess we’re all realising that it could have a potential effect if we used it properly. Telco Account Manager (Supplier – CRM user).
3. Important insights into the motivation, attitudes and emotions influencing
CRM technology adoption were identified. For example (see Appendix A2.1
for details):
• CRM technology provides a form of business advantage; either around
the use of technology to better capture and use information about the
customer, or to aid in documentation, time management and business
reporting. Some respondents were cynical toward management’s reasons
for adopting CRM technology.
CRM itself to me is a tool to foster the relationship or to continue [to do] the small things which you need to do to keep building a relationship. Owner, Management Company (Customer).
CRM is used to record my relationship, it's to record my services – I can win or lose business particularly if I have opposition involved, by not recording the information correctly and not having that information readily retrievable. Owner, Technical Services Company (Supplier – CRM user).
• Expectations of CRM technology users centred around sales support and
knowledge (information) management,
I think the majority of people actually in the sales side of the organisation would actually think it's a really important tool for them to do the job, learn to carry out the day-to-day forecasts, and upkeep of their territory basically. Strategic Account manager (Supplier – CRM user).
• Benefits of CRM technology included a common repository available to
any interested and authorised internal party, as well as the ability to
identify customer and product trends,

Chapter 5: Data Analysis
- 127 -
Related to the research side CRM provides you the ability to identify issues over geography, over time, and over a large number of stuff inside their head and of course different sorts of relationships where there can also be similar patterns going. HR Manager (Customer).
[CRM]enables a good handover of accounts from person to person. It enables virtual teams to function within accounts by being able to access information about that account on an as needed basis. It enable different people in the organisation to have a view of what's happening at an account level and a portfolio level and a regional level without having to keep reinventing the wheel. Corporate Account Manager (Supplier – CRM user).
• CRM systems are considered more as a business tool or enabler, and not
necessarily helpful initiating B2B relationships, except perhaps by
providing good leads. Some respondents considered CRM technology to
play a critical role in relationships. Others indicated far less involvement
of CRM technology to influence relationship dimensions such as
customer satisfaction and loyalty.
Putting information into a database enables an organisation to, research is a very general term, find out what makes a good relationship, which bits of the ingredients are having more of an impact upon the relationships. HR Manager (Customer).
I think the majority of people actually in the sales side of the organisation would actually think it's a really important tool for them to do the job…. Strategic Account Manager (Supplier – CRM user).
I don’t think it’s that well received amongst the sales force. I think most people find it a bugbear. I think the management find it a bit of a bugbear. I think a lot of people have struggled to get to like it and get to understand it. Telco Account Manager (Supplier – CRM user).
4. Support for the existing variables used in the CTA – CR research model.
I think it's important because it's, it is about demonstrating, you know, a willingness or a desire to invest in the relationship, so commitment to me is around the resources being applied to the innovation…. Healthcare Commercial Manager (Customer).
So the communication you know I guess it's almost a, I don't know for want of a better term a high team issue there, if you can’t communicate properly then there's going to be no trust. The commitment won't happen and none of them [relationship factors] will happen. IT General Manger (Customer).
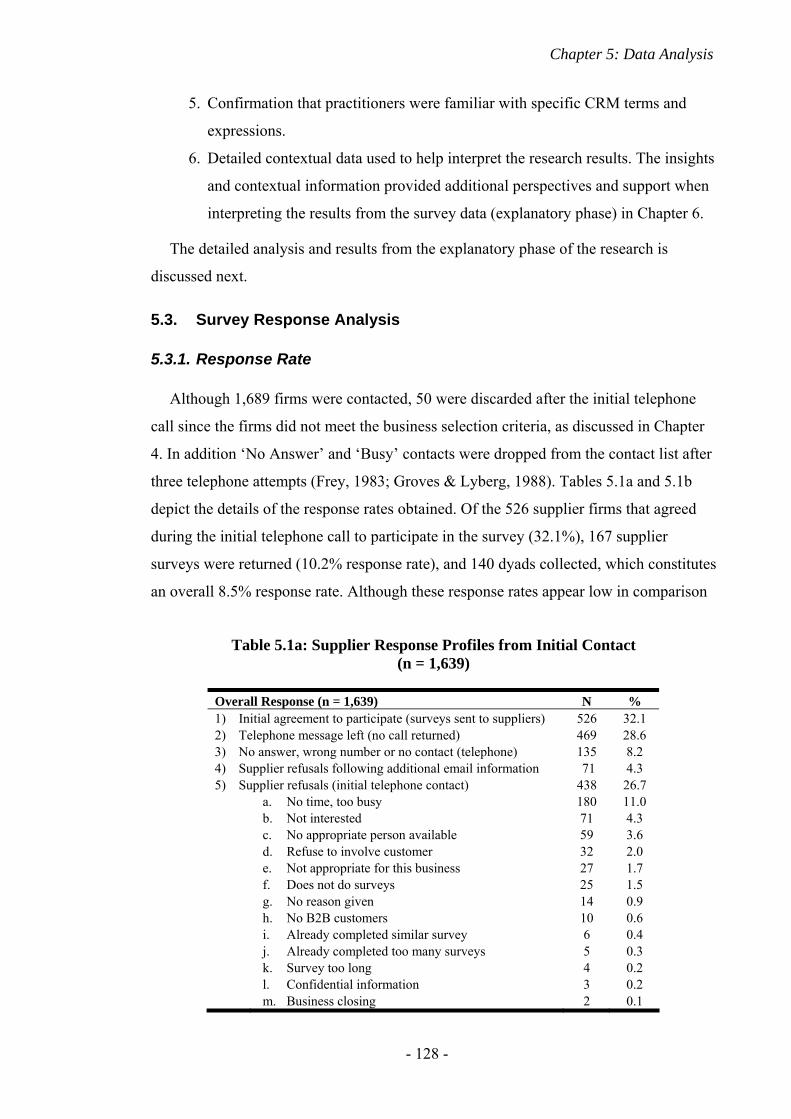
Chapter 5: Data Analysis
- 128 -
5. Confirmation that practitioners were familiar with specific CRM terms and
expressions.
6. Detailed contextual data used to help interpret the research results. The insights
and contextual information provided additional perspectives and support when
interpreting the results from the survey data (explanatory phase) in Chapter 6.
The detailed analysis and results from the explanatory phase of the research is
discussed next.
5.3. Survey Response Analysis
5.3.1. Response Rate
Although 1,689 firms were contacted, 50 were discarded after the initial telephone
call since the firms did not meet the business selection criteria, as discussed in Chapter
4. In addition ‘No Answer’ and ‘Busy’ contacts were dropped from the contact list after
three telephone attempts (Frey, 1983; Groves & Lyberg, 1988). Tables 5.1a and 5.1b
depict the details of the response rates obtained. Of the 526 supplier firms that agreed
during the initial telephone call to participate in the survey (32.1%), 167 supplier
surveys were returned (10.2% response rate), and 140 dyads collected, which constitutes
an overall 8.5% response rate. Although these response rates appear low in comparison
Table 5.1a: Supplier Response Profiles from Initial Contact (n = 1,639)
Overall Response (n = 1,639) N % 1) Initial agreement to participate (surveys sent to suppliers) 526 32.1 2) Telephone message left (no call returned) 469 28.6 3) No answer, wrong number or no contact (telephone) 135 8.2 4) Supplier refusals following additional email information 71 4.3 5) Supplier refusals (initial telephone contact) 438 26.7 a. No time, too busy 180 11.0 b. Not interested 71 4.3 c. No appropriate person available 59 3.6 d. Refuse to involve customer 32 2.0 e. Not appropriate for this business 27 1.7 f. Does not do surveys 25 1.5 g. No reason given 14 0.9 h. No B2B customers 10 0.6 i. Already completed similar survey 6 0.4 j. Already completed too many surveys 5 0.3 k. Survey too long 4 0.2 l. Confidential information 3 0.2 m. Business closing 2 0.1
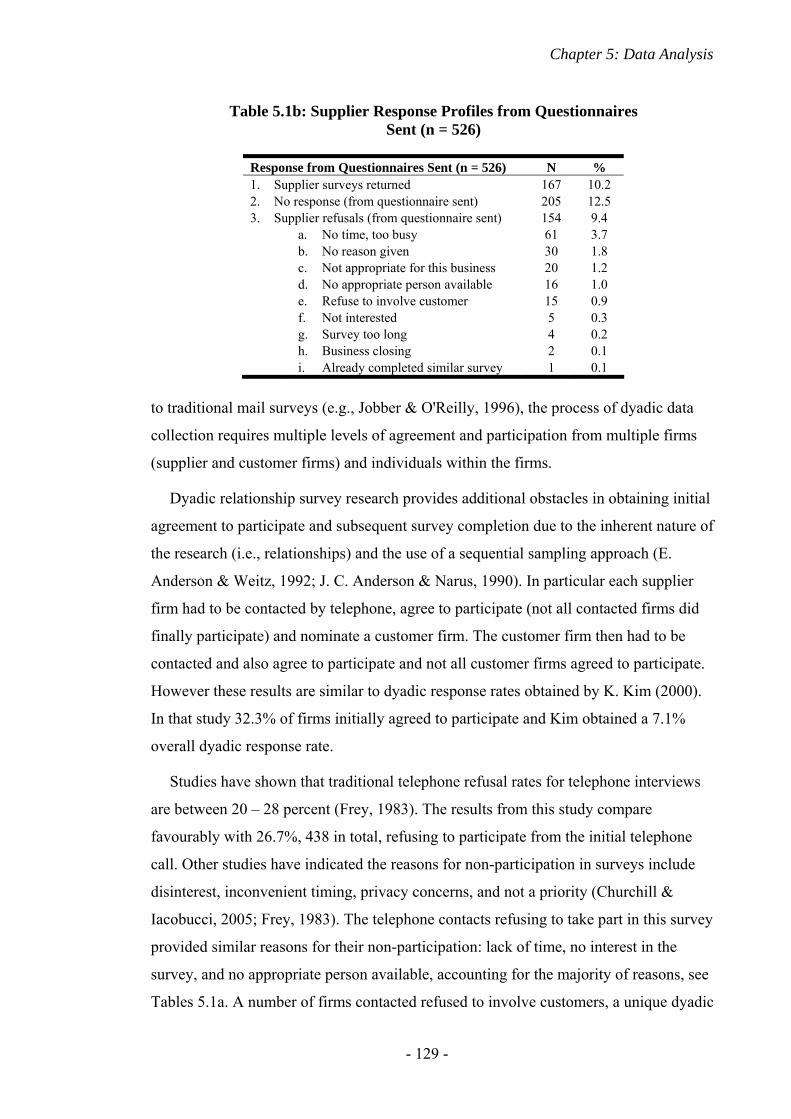
Chapter 5: Data Analysis
- 129 -
to traditional mail surveys (e.g., Jobber & O'Reilly, 1996), the process of dyadic data
collection requires multiple levels of agreement and participation from multiple firms
(supplier and customer firms) and individuals within the firms.
Dyadic relationship survey research provides additional obstacles in obtaining initial
agreement to participate and subsequent survey completion due to the inherent nature of
the research (i.e., relationships) and the use of a sequential sampling approach (E.
Anderson & Weitz, 1992; J. C. Anderson & Narus, 1990). In particular each supplier
firm had to be contacted by telephone, agree to participate (not all contacted firms did
finally participate) and nominate a customer firm. The customer firm then had to be
contacted and also agree to participate and not all customer firms agreed to participate.
However these results are similar to dyadic response rates obtained by K. Kim (2000).
In that study 32.3% of firms initially agreed to participate and Kim obtained a 7.1%
overall dyadic response rate.
Studies have shown that traditional telephone refusal rates for telephone interviews
are between 20 – 28 percent (Frey, 1983). The results from this study compare
favourably with 26.7%, 438 in total, refusing to participate from the initial telephone
call. Other studies have indicated the reasons for non-participation in surveys include
disinterest, inconvenient timing, privacy concerns, and not a priority (Churchill &
Iacobucci, 2005; Frey, 1983). The telephone contacts refusing to take part in this survey
provided similar reasons for their non-participation: lack of time, no interest in the
survey, and no appropriate person available, accounting for the majority of reasons, see
Tables 5.1a. A number of firms contacted refused to involve customers, a unique dyadic
Table 5.1b: Supplier Response Profiles from Questionnaires Sent (n = 526)
Response from Questionnaires Sent (n = 526) N % 1. Supplier surveys returned 167 10.2 2. No response (from questionnaire sent) 205 12.5 3. Supplier refusals (from questionnaire sent) 154 9.4 a. No time, too busy 61 3.7 b. No reason given 30 1.8 c. Not appropriate for this business 20 1.2 d. No appropriate person available 16 1.0 e. Refuse to involve customer 15 0.9 f. Not interested 5 0.3 g. Survey too long 4 0.2 h. Business closing 2 0.1 i. Already completed similar survey 1 0.1
Chapter 5: Data Analysis
- 130 -
research reason for non-participation. Some initial telephone contacts were extremely
negative and vocal regarding the potential use of their customers in relationship
research. Others were obviously not comfortable in approaching their customers to
participate in this type of survey regarding the status of their relationship, see Tables
5.1a and 5.1b (47 stating outright they did not want to involve the customer).
There were also indications that the nature of the survey investigating B2B
relationships was considered intrusive or sensitive. A large number of potential
respondents who had reviewed additional email information or received the customer
questionnaire to forward-on did not respond. The high number of non-respondents and
refusals (430) may indicate a reluctance to involve their customer6, in which case the
‘Refuse to involve customer’ figure may understate the true reason for non-
participation.
Given the known difficulty of gaining dyadic survey participation a number of tactics
were employed to increase the response rate from the supplier firm (E. Anderson &
Weitz, 1992; K. Kim, 2000), including the use of a pre-notification telephone call to
screen potential participants and request cooperation (Schlegelmilch &
Diamantopoulos, 1991); the use of Victoria University of Wellington official letter-
head; the promise of confidentiality and personalisation; a copy of the results; a front
cover coloured graphic to attract attention; use of closed-ended questions; a postage
paid return envelope; and two reminders in the form of a follow-up postcard and a
follow-up telephone call with a second questionnaire if necessary (Dillman, 2000;
Jobber & O'Reilly, 1996). The process followed to increase customer questionnaire
returns depended on the return of the supplier questionnaire. Once the supplier
questionnaire was returned the nominated customer contact details were available. If
after two weeks following the return of the supplier questionnaire, the customer
questionnaire had not been received, a telephone call was made to the customer to (a)
ensure they had received the questionnaire, (b) answer any questions they may have,
and (c) determine a return date for the questionnaire. If the nominated customer had not
received the questionnaire from the supplier, a customer questionnaire was either posted
or emailed directly to them. After three days the customer was called again to ensure
they had received the questionnaire and would complete it. 6 A total of 71 potential respondents receiving additional email information (see Table 5.1a) and 359 potential respondents receiving the customer questionnaire (see Table 5.1b) did not return the questionnaire.
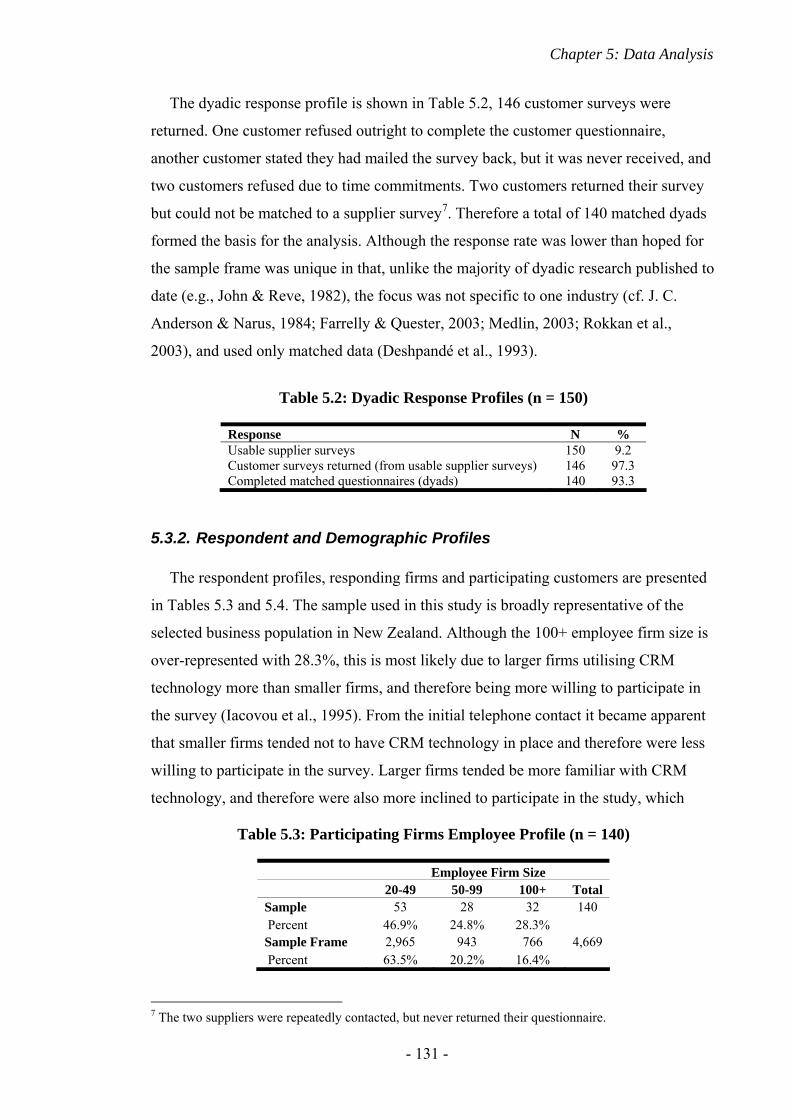
Chapter 5: Data Analysis
- 131 -
The dyadic response profile is shown in Table 5.2, 146 customer surveys were
returned. One customer refused outright to complete the customer questionnaire,
another customer stated they had mailed the survey back, but it was never received, and
two customers refused due to time commitments. Two customers returned their survey
but could not be matched to a supplier survey7. Therefore a total of 140 matched dyads
formed the basis for the analysis. Although the response rate was lower than hoped for
the sample frame was unique in that, unlike the majority of dyadic research published to
date (e.g., John & Reve, 1982), the focus was not specific to one industry (cf. J. C.
Anderson & Narus, 1984; Farrelly & Quester, 2003; Medlin, 2003; Rokkan et al.,
2003), and used only matched data (Deshpandé et al., 1993).
5.3.2. Respondent and Demographic Profiles
The respondent profiles, responding firms and participating customers are presented
in Tables 5.3 and 5.4. The sample used in this study is broadly representative of the
selected business population in New Zealand. Although the 100+ employee firm size is
over-represented with 28.3%, this is most likely due to larger firms utilising CRM
technology more than smaller firms, and therefore being more willing to participate in
the survey (Iacovou et al., 1995). From the initial telephone contact it became apparent
that smaller firms tended not to have CRM technology in place and therefore were less
willing to participate in the survey. Larger firms tended be more familiar with CRM
technology, and therefore were also more inclined to participate in the study, which
7 The two suppliers were repeatedly contacted, but never returned their questionnaire.
Table 5.2: Dyadic Response Profiles (n = 150)
Response N % Usable supplier surveys 150 9.2 Customer surveys returned (from usable supplier surveys) 146 97.3 Completed matched questionnaires (dyads) 140 93.3
Table 5.3: Participating Firms Employee Profile (n = 140)
Employee Firm Size 20-49 50-99 100+ Total Sample 53 28 32 140 Percent 46.9% 24.8% 28.3% Sample Frame 2,965 943 766 4,669 Percent 63.5% 20.2% 16.4%
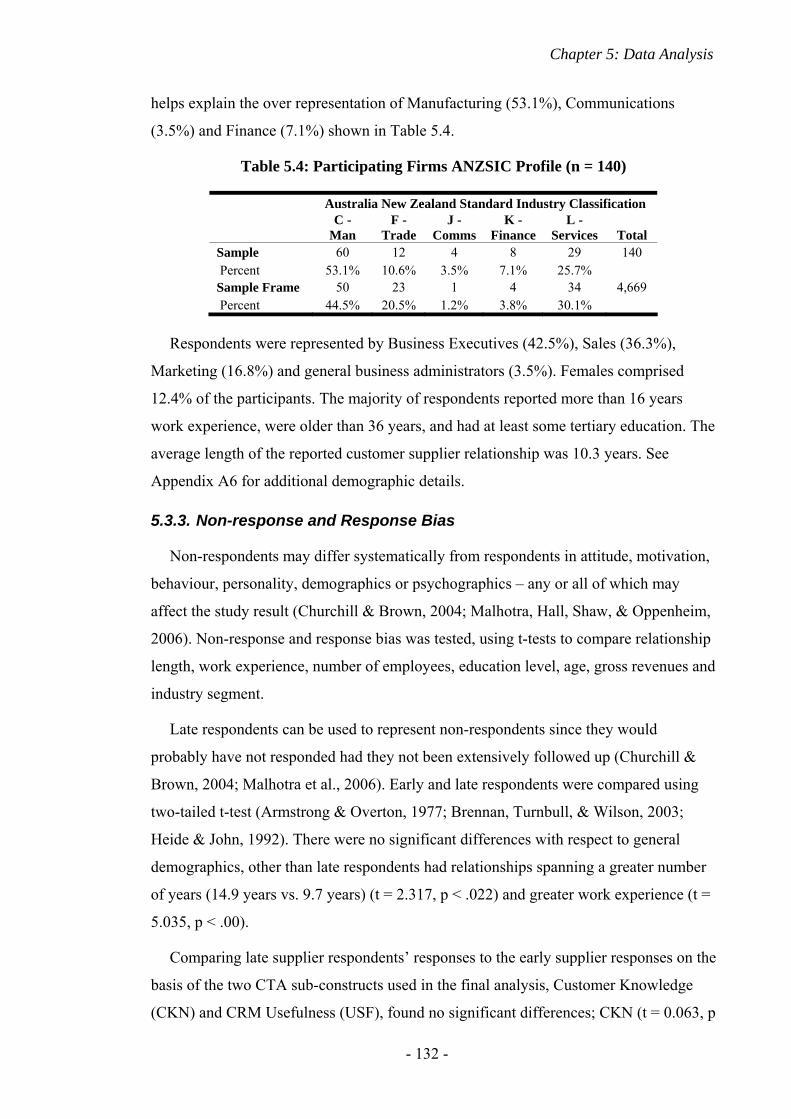
Chapter 5: Data Analysis
- 132 -
helps explain the over representation of Manufacturing (53.1%), Communications
(3.5%) and Finance (7.1%) shown in Table 5.4.
Respondents were represented by Business Executives (42.5%), Sales (36.3%),
Marketing (16.8%) and general business administrators (3.5%). Females comprised
12.4% of the participants. The majority of respondents reported more than 16 years
work experience, were older than 36 years, and had at least some tertiary education. The
average length of the reported customer supplier relationship was 10.3 years. See
Appendix A6 for additional demographic details.
5.3.3. Non-response and Response Bias
Non-respondents may differ systematically from respondents in attitude, motivation,
behaviour, personality, demographics or psychographics – any or all of which may
affect the study result (Churchill & Brown, 2004; Malhotra, Hall, Shaw, & Oppenheim,
2006). Non-response and response bias was tested, using t-tests to compare relationship
length, work experience, number of employees, education level, age, gross revenues and
industry segment.
Late respondents can be used to represent non-respondents since they would
probably have not responded had they not been extensively followed up (Churchill &
Brown, 2004; Malhotra et al., 2006). Early and late respondents were compared using
two-tailed t-test (Armstrong & Overton, 1977; Brennan, Turnbull, & Wilson, 2003;
Heide & John, 1992). There were no significant differences with respect to general
demographics, other than late respondents had relationships spanning a greater number
of years (14.9 years vs. 9.7 years) (t = 2.317, p < .022) and greater work experience (t =
5.035, p < .00).
Comparing late supplier respondents’ responses to the early supplier responses on the
basis of the two CTA sub-constructs used in the final analysis, Customer Knowledge
(CKN) and CRM Usefulness (USF), found no significant differences; CKN (t = 0.063, p
Table 5.4: Participating Firms ANZSIC Profile (n = 140)
Australia New Zealand Standard Industry Classification
C -
Man F -
Trade J -
Comms K -
Finance L -
Services Total Sample 60 12 4 8 29 140 Percent 53.1% 10.6% 3.5% 7.1% 25.7% Sample Frame 50 23 1 4 34 4,669 Percent 44.5% 20.5% 1.2% 3.8% 30.1%
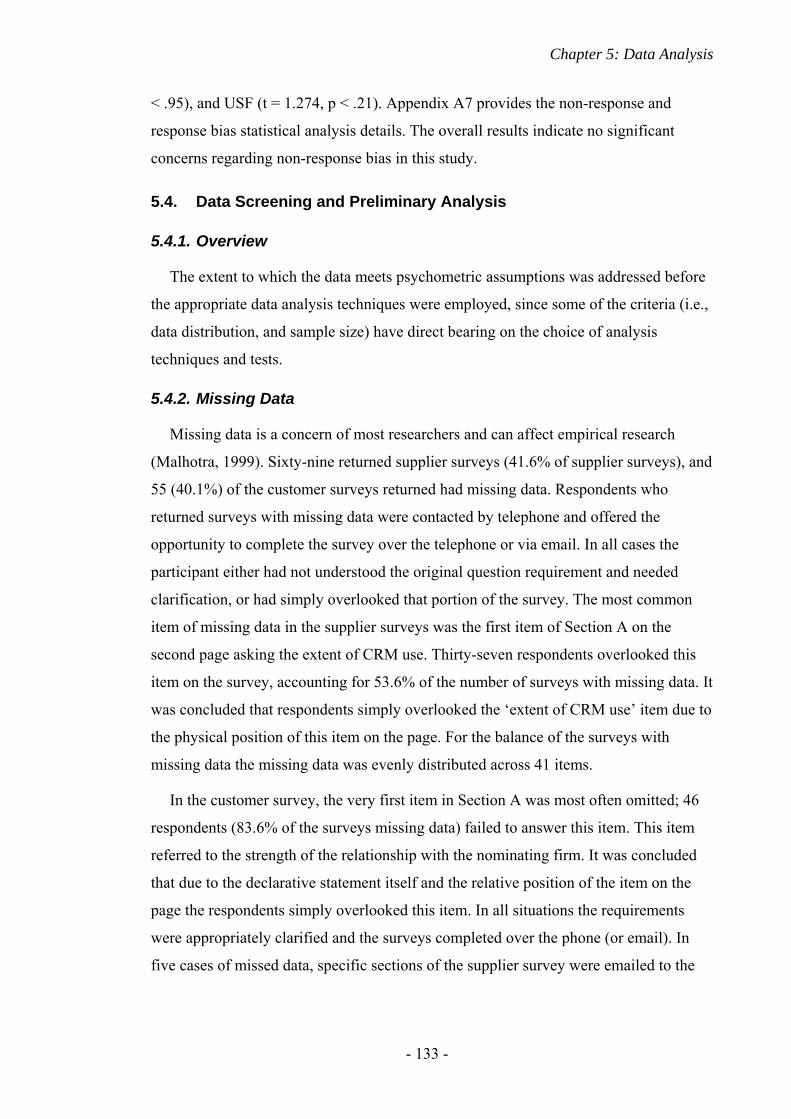
Chapter 5: Data Analysis
- 133 -
< .95), and USF (t = 1.274, p < .21). Appendix A7 provides the non-response and
response bias statistical analysis details. The overall results indicate no significant
concerns regarding non-response bias in this study.
5.4. Data Screening and Preliminary Analysis
5.4.1. Overview
The extent to which the data meets psychometric assumptions was addressed before
the appropriate data analysis techniques were employed, since some of the criteria (i.e.,
data distribution, and sample size) have direct bearing on the choice of analysis
techniques and tests.
5.4.2. Missing Data
Missing data is a concern of most researchers and can affect empirical research
(Malhotra, 1999). Sixty-nine returned supplier surveys (41.6% of supplier surveys), and
55 (40.1%) of the customer surveys returned had missing data. Respondents who
returned surveys with missing data were contacted by telephone and offered the
opportunity to complete the survey over the telephone or via email. In all cases the
participant either had not understood the original question requirement and needed
clarification, or had simply overlooked that portion of the survey. The most common
item of missing data in the supplier surveys was the first item of Section A on the
second page asking the extent of CRM use. Thirty-seven respondents overlooked this
item on the survey, accounting for 53.6% of the number of surveys with missing data. It
was concluded that respondents simply overlooked the ‘extent of CRM use’ item due to
the physical position of this item on the page. For the balance of the surveys with
missing data the missing data was evenly distributed across 41 items.
In the customer survey, the very first item in Section A was most often omitted; 46
respondents (83.6% of the surveys missing data) failed to answer this item. This item
referred to the strength of the relationship with the nominating firm. It was concluded
that due to the declarative statement itself and the relative position of the item on the
page the respondents simply overlooked this item. In all situations the requirements
were appropriately clarified and the surveys completed over the phone (or email). In
five cases of missed data, specific sections of the supplier survey were emailed to the
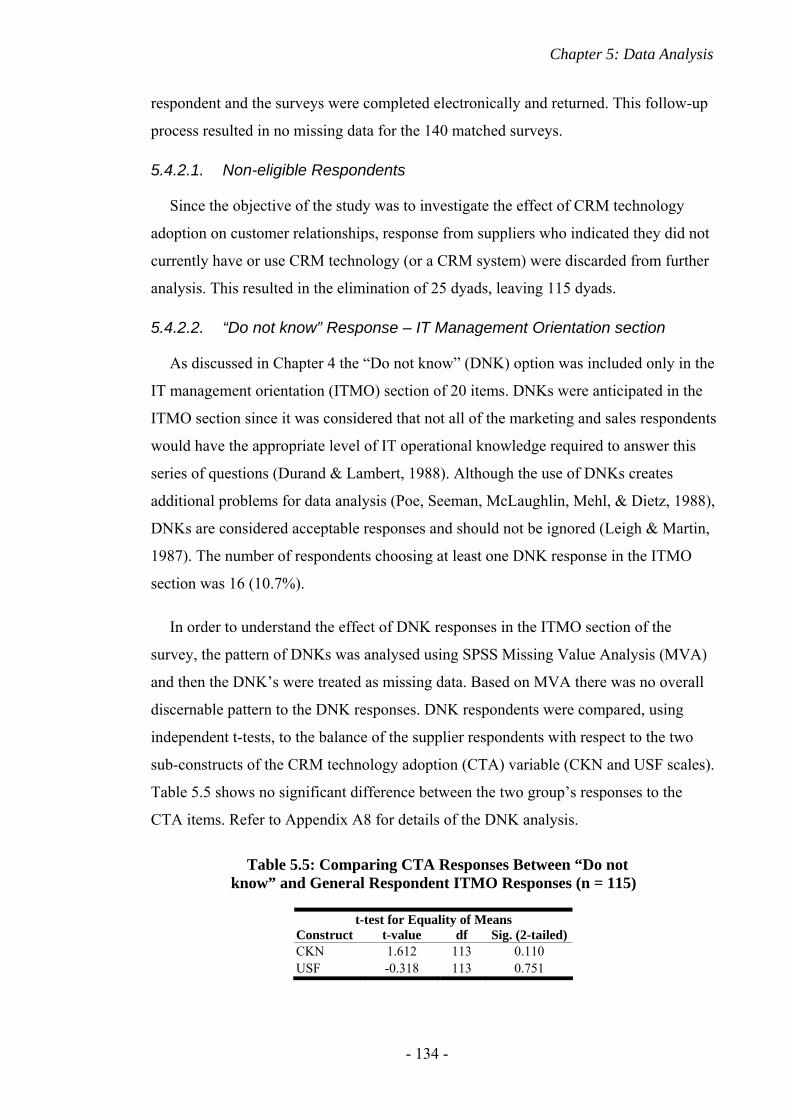
Chapter 5: Data Analysis
- 134 -
respondent and the surveys were completed electronically and returned. This follow-up
process resulted in no missing data for the 140 matched surveys.
5.4.2.1. Non-eligible Respondents
Since the objective of the study was to investigate the effect of CRM technology
adoption on customer relationships, response from suppliers who indicated they did not
currently have or use CRM technology (or a CRM system) were discarded from further
analysis. This resulted in the elimination of 25 dyads, leaving 115 dyads.
5.4.2.2. “Do not know” Response – IT Management Orientation section
As discussed in Chapter 4 the “Do not know” (DNK) option was included only in the
IT management orientation (ITMO) section of 20 items. DNKs were anticipated in the
ITMO section since it was considered that not all of the marketing and sales respondents
would have the appropriate level of IT operational knowledge required to answer this
series of questions (Durand & Lambert, 1988). Although the use of DNKs creates
additional problems for data analysis (Poe, Seeman, McLaughlin, Mehl, & Dietz, 1988),
DNKs are considered acceptable responses and should not be ignored (Leigh & Martin,
1987). The number of respondents choosing at least one DNK response in the ITMO
section was 16 (10.7%).
In order to understand the effect of DNK responses in the ITMO section of the
survey, the pattern of DNKs was analysed using SPSS Missing Value Analysis (MVA)
and then the DNK’s were treated as missing data. Based on MVA there was no overall
discernable pattern to the DNK responses. DNK respondents were compared, using
independent t-tests, to the balance of the supplier respondents with respect to the two
sub-constructs of the CRM technology adoption (CTA) variable (CKN and USF scales).
Table 5.5 shows no significant difference between the two group’s responses to the
CTA items. Refer to Appendix A8 for details of the DNK analysis.
Table 5.5: Comparing CTA Responses Between “Do not know” and General Respondent ITMO Responses (n = 115)
t-test for Equality of Means Construct t-value df Sig. (2-tailed) CKN 1.612 113 0.110 USF -0.318 113 0.751
Chapter 5: Data Analysis
- 135 -
Since the overall number of DNKs was relatively small, and restricted to the ITMO
section only, in order to preserve the data properties to allow full analysis of the data,
the DNK responses were treated as missing values and were substituted using series
means. Two cases were deleted from subsequent analysis since they exhibited extremely
high DNK responses in the ITMO section at 70% and 100% respectively. This left 113
dyads as the final number of cases for analysis.
5.4.3. Assumptions Underlying Statistical Procedures
5.4.3.1. Normality of the Data
Normality of the data was assessed using the Kolmogorov-Smirnov (KS) test, visual
examination of normal probability plots, and by computing skewness and kurtosis
measures (Carver & Nash, 2005). Skewness ratings of ± 1 and kurtosis scores of ± 2 are
considered mild and fall within the ‘normal’ range, while scores outside of this range
have the potential to restrict the data analysis and subsequent interpretation of results
(Heck, 1998; Kline, 2005). Considering the relationship strength (RS) and relationship
performance (RP) questions related to relationships with a current supplier, it was
anticipated that customers would tend to respond more positively than negatively
toward their supplier, resulting in a skewed data distribution on these specific items. As
expected, the data distribution from a number of customer items relating to relationship
strength and performance was highly skewed with corresponding high kurtosis. (The
survey criteria did specify that supplier firms nominate their third or fourth most
important customers in an attempt to reduce or neutralise this effect.) Six items from the
supplier data regarding CRM technology adoption (CTA) also exhibited similar
distribution concerns (see Appendix A9 for survey data distribution details).
When confronted with non-normal data distributions for factor analysis, attempts
should be made to normalise the data in order to conduct appropriate and valid data
analysis (Rummel, 1970). However, the result of data transformations, although
facilitating data analysis, can restrict and alter subsequent interpretation of the results
and therefore should not be conducted unnecessarily (Hair et al., 2006; Rummel, 1970).
Although many multivariate analysis techniques are known to be robust with respect to
data distributions, (i.e., some deviation from normality is acceptable) (Hau & Marsh,
2004; Muthén & Kaplan, 1985; S. Sharma, Durvasula, & Dillon, 1989; Yanagihara &
Yuan, 2005), as a precaution the CTA principal components exploratory factor analysis

Chapter 5: Data Analysis
- 136 -
was conducted twice, once using untransformed data, and a second time using
transformed data. Both analysis approaches led to similar conclusions8, therefore only
the untransformed data is reported in the exploratory factor analysis (EFA) results.
Since PLS is not restricted or constrained by the distribution properties of the data, and
for the sake of consistency with the factor analysis results, only the untransformed data
was used to conduct the PLS analysis (Chin, 1995; Wold, 1985).
5.4.3.2. Sample Size and Power
Since little guidance is available from the SEM and PLS literature regarding
statistical power, factor analysis criteria were adopted (Chin, 1998a). Hair et al. (2006)
provide guidelines for identifying significant factor loadings for factor analysis
dependent on sample size. Given a sample size of 113 cases, a factor loading of 0.55 or
greater is considered significant, assuming a 0.05 significance level for a Type I error
(α), and a power level of 80 percent (Cohen, 1992). (A Type I error is the probability of
accepting a “false positive” as true.) For this study the more conservative 0.60 level was
used as the minimum criterion for assessing factor loadings.
5.4.4. Common Method Variance
Common-method bias is recognised as a major source of measurement error and can
have a substantial impact on observed relationships between the measured variables
(Bagozzi & Yi, 1991; Nunnally & Bernstein, 1994). Although there are a number of
sources of common method bias, including context and item characteristics, the use of
the same respondent for independent and dependent measures is a common source and
has been shown to produce significant artificial covariance (Podasakoff, MacKenzie,
Lee, & Podsakoff, 2003). Podasakoff et al. suggest a set of procedures to control for
common method bias and recommend in the first instance that “predictor and criterion
variables [can] be measured from different sources….Additional statistical remedies
could be used but in our view are probably unnecessary in these instances” (p. 897). The
use of supplier respondents for the dependent variables and customer respondents for
the dependent variables helped reduce common method bias (Reinartz et al., 2004).
Another potential source of common method bias, related to the general
measurement context specific to this dyadic research, is the existing relationship
between supplier and customer. There was the possibility that suppliers colluded with 8 A detailed comparison of the TD and UTD EFA methods and results are available on request.
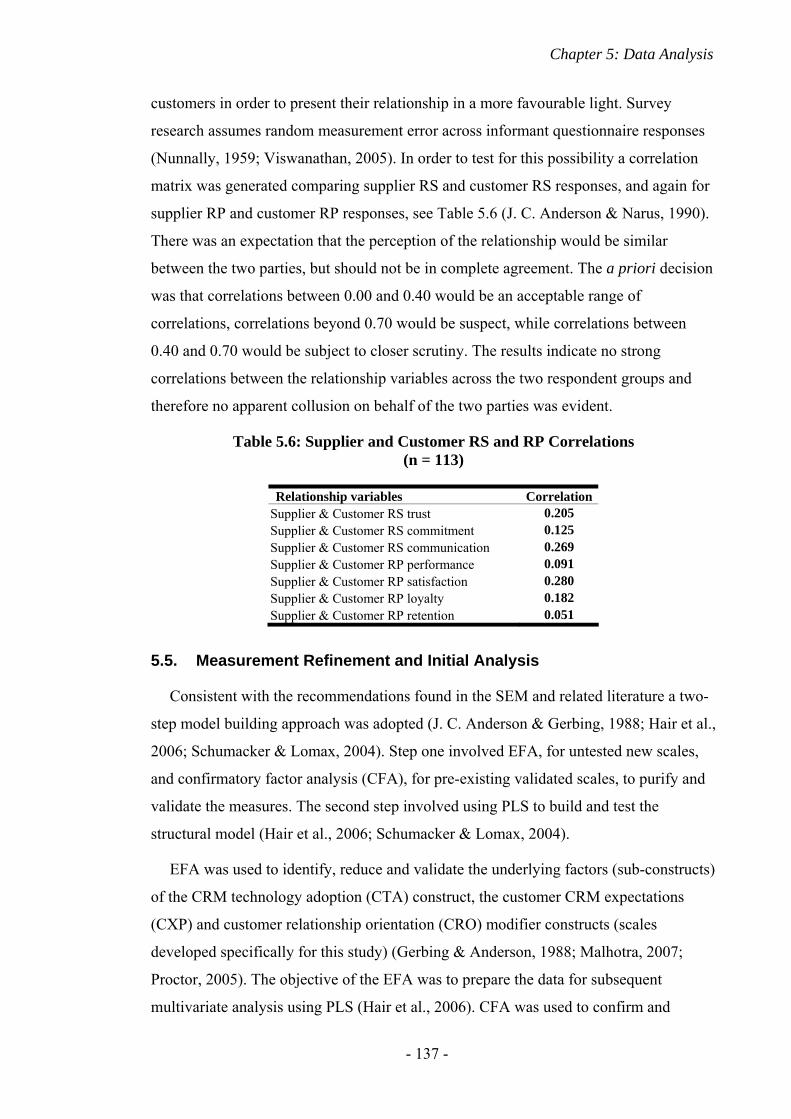
Chapter 5: Data Analysis
- 137 -
customers in order to present their relationship in a more favourable light. Survey
research assumes random measurement error across informant questionnaire responses
(Nunnally, 1959; Viswanathan, 2005). In order to test for this possibility a correlation
matrix was generated comparing supplier RS and customer RS responses, and again for
supplier RP and customer RP responses, see Table 5.6 (J. C. Anderson & Narus, 1990).
There was an expectation that the perception of the relationship would be similar
between the two parties, but should not be in complete agreement. The a priori decision
was that correlations between 0.00 and 0.40 would be an acceptable range of
correlations, correlations beyond 0.70 would be suspect, while correlations between
0.40 and 0.70 would be subject to closer scrutiny. The results indicate no strong
correlations between the relationship variables across the two respondent groups and
therefore no apparent collusion on behalf of the two parties was evident.
5.5. Measurement Refinement and Initial Analysis
Consistent with the recommendations found in the SEM and related literature a two-
step model building approach was adopted (J. C. Anderson & Gerbing, 1988; Hair et al.,
2006; Schumacker & Lomax, 2004). Step one involved EFA, for untested new scales,
and confirmatory factor analysis (CFA), for pre-existing validated scales, to purify and
validate the measures. The second step involved using PLS to build and test the
structural model (Hair et al., 2006; Schumacker & Lomax, 2004).
EFA was used to identify, reduce and validate the underlying factors (sub-constructs)
of the CRM technology adoption (CTA) construct, the customer CRM expectations
(CXP) and customer relationship orientation (CRO) modifier constructs (scales
developed specifically for this study) (Gerbing & Anderson, 1988; Malhotra, 2007;
Proctor, 2005). The objective of the EFA was to prepare the data for subsequent
multivariate analysis using PLS (Hair et al., 2006). CFA was used to confirm and
Table 5.6: Supplier and Customer RS and RP Correlations (n = 113)
Relationship variables Correlation Supplier & Customer RS trust 0.205 Supplier & Customer RS commitment 0.125 Supplier & Customer RS communication 0.269 Supplier & Customer RP performance 0.091 Supplier & Customer RP satisfaction 0.280 Supplier & Customer RP loyalty 0.182 Supplier & Customer RP retention 0.051
Chapter 5: Data Analysis
- 138 -
reduce the number of factors from the remaining constructs (MO, ITMO, C_RS, and
C_RP) and modifier constructs (TT and MT). SPSS 14.0 software was used to perform
the EFA, while SmartPLS software was used to conduct the CFA (Falk & Miller, 1992;
Ringle et al., 2005).
To establish factorability a visual inspection of the correlation matrix was conducted
to ensure a substantial number of correlations greater than 0.30, as well the Bartlett test
of sphericity (p < .05), and the measure of sampling adequacy (MSA > 0.50) were
examined (Hair et al., 2006). Criteria for the number of factors extracted included
eigenvalues greater than 1 (latent root criteria), as well as factor conceptualisations
based on theory, and scree plot analysis. Unrotated and rotated factor matrices were
computed, factors loadings interpreted and factor models respecified as appropriate
(Hair et al., 2006). Varimax (orthogonal) rotation was employed for interpretation of the
factor matrices under investigation (Hair et al., 2006; Nunnally & Bernstein, 1994).
Each variable within each factor matrix was examined for significance and cross-
loading. EFA variables found to have factor loadings of more than 0.45 across more
than one factor were considered for deletion. Ideally variables load only on a single
factor and have communality measures greater than 0.50. Communality represents the
total amount of variance the specific variable shares with all other variables included in
the factor analysis. Communality values greater than 0.50 indicate a strong relationship
between the items; and provide the basis for good explanatory value. Communality
values less than 0.50 indicates other extraneous sources of variance impact the
relationship more than or equal to the identified measurement item, leading to less than
adequate explanatory value.
In summary, to retain individual items measuring specific constructs the items had to
exhibit; (a) a communality greater than 0.50, (b) a factor loading greater than 0.60 on a
single factor and (c) for EFA, cross-loading less than 0.45 on any other factor.
5.5.1. Validity and Reliability of Measures
Content reliability considers whether the items actually measure the construct under
consideration (Bagozzi, 1994a). Assessment of item reliability is conducted “by
examining the loadings (or simple correlations) of the measures with their respective
construct” (Hulland, 1999, p. 198). Convergent validity was examined through
Cronbach’s alpha and the Fornell and Larcker (1981) composite reliability (CR)
Chapter 5: Data Analysis
- 139 -
measure (Hulland, 1999). Many authorities recommend a Cronbach’s alpha loading
benchmark of 0.70 (Nunnally & Bernstein, 1994) however some propose a less
conservative level of 0.60 (Hair et al., 2006). This internal consistency measure
represents how well the items converge to measure the construct. Well-formed items
measuring a single construct will exhibit higher Cronbach’s alphas, while low internal
consistency measures of a construct (e.g., below 0.60) may indicate poor construct
definition or a multidimensional construct. In the latter case the construct should be split
into separate unidimensional constructs with respective items, or items should be
eliminated until only a one-dimensional construct remains (Hair et al., 2006).
Discriminant validity was assessed using the AVE procedure described in Fornell
and Larcker (1981), where they suggest that the squared correlations (shared variance
between a construct and its measures) be less than the average variance extracted (AVE)
by the items measuring the constructs. The AVE is the “average variance shared
between a construct and its measures…This measure should be greater than the variance
shared between the construct and the other constructs in the model” (Hulland, 1999, p.
200).
5.6. Exploratory Factor Analysis (EFA)
Exploratory factor analysis (EFA) explores data from an atheoretical perspective,
allowing the data to load on factors independent of theory or a priori assumptions
(Gerbing & Anderson, 1988; Ullman, 2006). Unlike CFA there is no fixed number of
factors or loading assumptions. The item loadings and number of constructs are not
predetermined through theoretical conceptualisation or previous empirical results (Hair
et al., 2006). The following two sections describe the results of the EFA conducted on
the items comprising the CTA, CRO and CXP constructs.
5.6.1. CRM Technology Adoption (CTA) - EFA
Since CTA is a new construct conceived specifically for this study, EFA and
reliability analysis were used to assess the items measuring CTA. Table 5.7 lists all the
CTA items used in the EFA. An inspection of the CTA correlation matrix indicated that
(a) a number of correlations exceeded 0.30, (b) the Bartlett test of sphericity (χ2 =
3,227.548, p < .000) was significant, (c) the MSA = 0.818 was adequate, and therefore
factor analysis was appropriate.
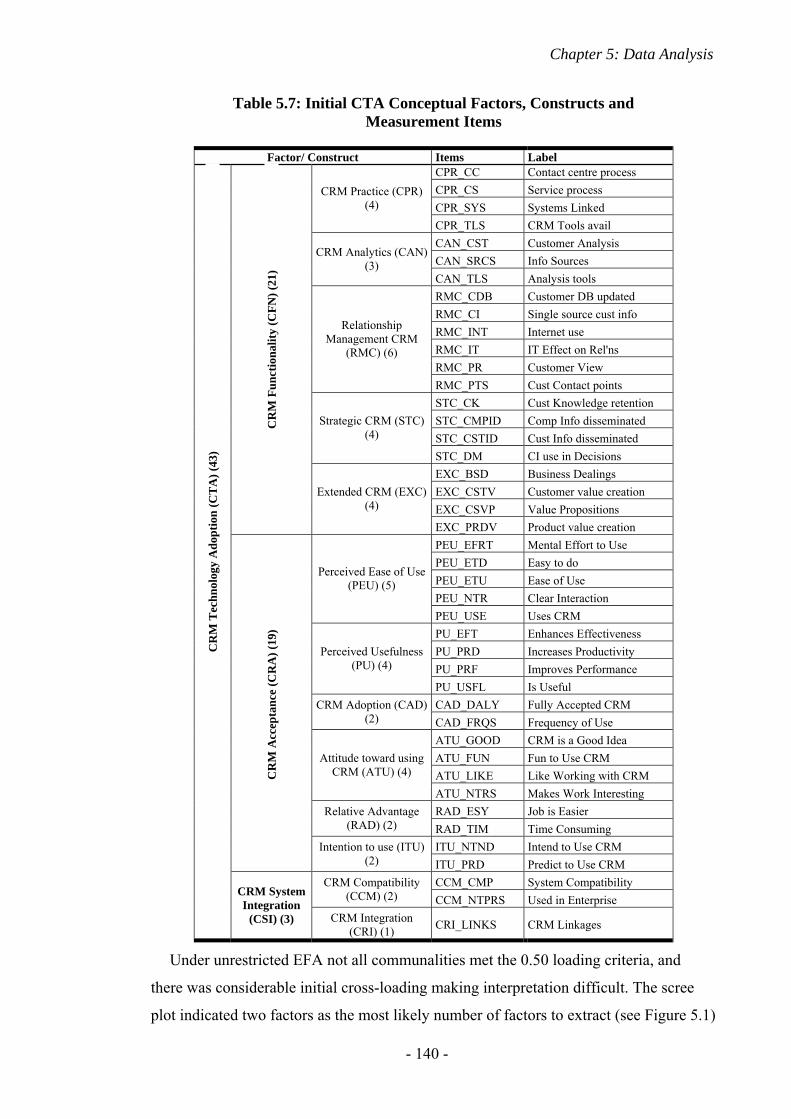
Chapter 5: Data Analysis
- 140 -
Table 5.7: Initial CTA Conceptual Factors, Constructs and Measurement Items
Factor/ Construct Items Label CPR_CC Contact centre process CPR_CS Service process CPR_SYS Systems Linked
CRM Practice (CPR) (4)
CPR_TLS CRM Tools avail CAN_CST Customer Analysis CAN_SRCS Info Sources
CRM Analytics (CAN) (3)
CAN_TLS Analysis tools RMC_CDB Customer DB updated RMC_CI Single source cust info RMC_INT Internet use RMC_IT IT Effect on Rel'ns RMC_PR Customer View
Relationship Management CRM
(RMC) (6)
RMC_PTS Cust Contact points STC_CK Cust Knowledge retention STC_CMPID Comp Info disseminated STC_CSTID Cust Info disseminated
Strategic CRM (STC) (4)
STC_DM CI use in Decisions EXC_BSD Business Dealings EXC_CSTV Customer value creation EXC_CSVP Value Propositions
CR
M F
unct
iona
lity
(CFN
) (21
)
Extended CRM (EXC) (4)
EXC_PRDV Product value creation PEU_EFRT Mental Effort to Use PEU_ETD Easy to do PEU_ETU Ease of Use PEU_NTR Clear Interaction
Perceived Ease of Use (PEU) (5)
PEU_USE Uses CRM PU_EFT Enhances Effectiveness PU_PRD Increases Productivity PU_PRF Improves Performance
Perceived Usefulness (PU) (4)
PU_USFL Is Useful CAD_DALY Fully Accepted CRM CRM Adoption (CAD)
(2) CAD_FRQS Frequency of Use ATU_GOOD CRM is a Good Idea ATU_FUN Fun to Use CRM ATU_LIKE Like Working with CRM
Attitude toward using CRM (ATU) (4)
ATU_NTRS Makes Work Interesting RAD_ESY Job is Easier Relative Advantage
(RAD) (2) RAD_TIM Time Consuming ITU_NTND Intend to Use CRM
CR
M A
ccep
tanc
e (C
RA
) (19
)
Intention to use (ITU) (2) ITU_PRD Predict to Use CRM
CCM_CMP System Compatibility CRM Compatibility (CCM) (2) CCM_NTPRS Used in Enterprise
CR
M T
echn
olog
y A
dopt
ion
(CT
A) (
43)
CRM System Integration
(CSI) (3) CRM Integration (CRI) (1) CRI_LINKS CRM Linkages
Under unrestricted EFA not all communalities met the 0.50 loading criteria, and
there was considerable initial cross-loading making interpretation difficult. The scree
plot indicated two factors as the most likely number of factors to extract (see Figure 5.1)
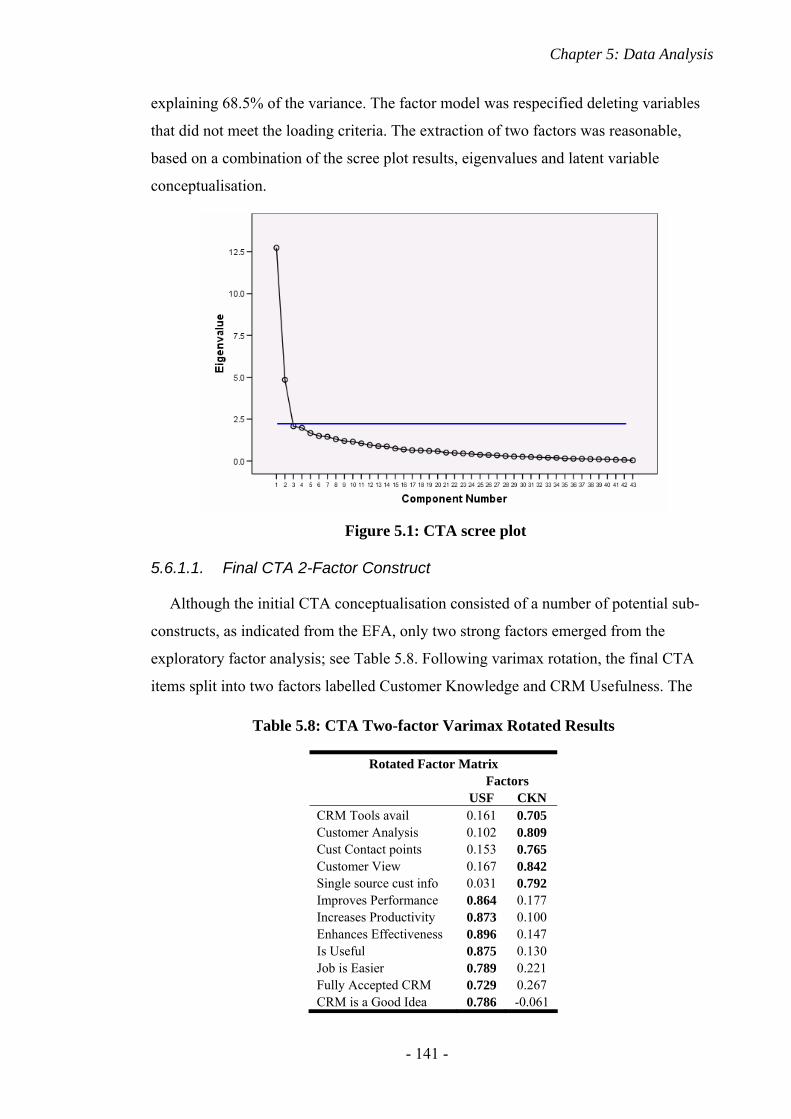
Chapter 5: Data Analysis
- 141 -
explaining 68.5% of the variance. The factor model was respecified deleting variables
that did not meet the loading criteria. The extraction of two factors was reasonable,
based on a combination of the scree plot results, eigenvalues and latent variable
conceptualisation.
5.6.1.1. Final CTA 2-Factor Construct
Although the initial CTA conceptualisation consisted of a number of potential sub-
constructs, as indicated from the EFA, only two strong factors emerged from the
exploratory factor analysis; see Table 5.8. Following varimax rotation, the final CTA
items split into two factors labelled Customer Knowledge and CRM Usefulness. The
Figure 5.1: CTA scree plot
Table 5.8: CTA Two-factor Varimax Rotated Results
Rotated Factor Matrix Factors USF CKN CRM Tools avail 0.161 0.705 Customer Analysis 0.102 0.809 Cust Contact points 0.153 0.765 Customer View 0.167 0.842 Single source cust info 0.031 0.792 Improves Performance 0.864 0.177 Increases Productivity 0.873 0.100 Enhances Effectiveness 0.896 0.147 Is Useful 0.875 0.130 Job is Easier 0.789 0.221 Fully Accepted CRM 0.729 0.267 CRM is a Good Idea 0.786 -0.061

Chapter 5: Data Analysis
- 142 -
first factor extracted, measured by seven items reflected the extent to which CRM
technology is useful to the user and the job requirements and is termed CRM Usefulness
(USF). The second factor, measured by five items, focused on the extent to which CRM
technology helps accumulate and provide customer knowledge (CKN). Subsequent
CFA showed that the average variance explained by the five CKN factors is 63.2%, and
71.2%, for the seven USF factors, both greater than the minimum 50% criteria. Tables
5.9 and 5.10 show that the communalities of the items are all greater than 0.50, the
individual factor loadings are strong (all greater than 0.70), and the respective
Cronbach’s alphas exceeds the minimum criteria of 0.60 for exploratory analysis (Hair
et al., 2006; Nunnally & Bernstein, 1994). These two constructs and related items are
used in further multivariate analysis and hypothesis testing using PLS.
5.6.2. Moderator Constructs: CXP and CRO
Customer CRM expectations (CXP) and customer relationship orientation (CRO) are
new scales designed to measure moderator constructs within the CTA – CR model. In
Table 5.9: CTA CKN Factor Analysis Results
Customer Knowledge (CKN) 5 items Loading Com* Cronbach's Alpha AVE#
CPR_TLS CRM Tools avail 0.723 0.523 CAN_CST Customer Analysis 0.814 0.663 RMC_PTS Cust Contact points 0.788 0.622 RMC_PR Customer View 0.859 0.739 RMC_CI Single source cust info 0.782 0.611
0.847 63.15
Note. * Com =Communality; # AVE = Average Variance Explained
Table 5.10: CTA USF Factor Analysis Results
CRM Usefulness (USF) 7 items Loading Com* Cronbach's Alpha AVE#
PU_PRF Improves Performance 0.883 0.780
PU_PRD Increases Productivity 0.878 0.770 PU_EFT Enhances Effectiveness 0.909 0.826
PU_USFL Is Useful 0.883 0.780 RAD_ESY Job is Easier 0.816 0.666
CAD_DALY Fully Accepted CRM 0.767 0.588 ATU_GOOD CRM is a Good Idea 0.760 0.577
0.921 71.24
Note. * Com =Communality; # AVE = Average Variance Explained
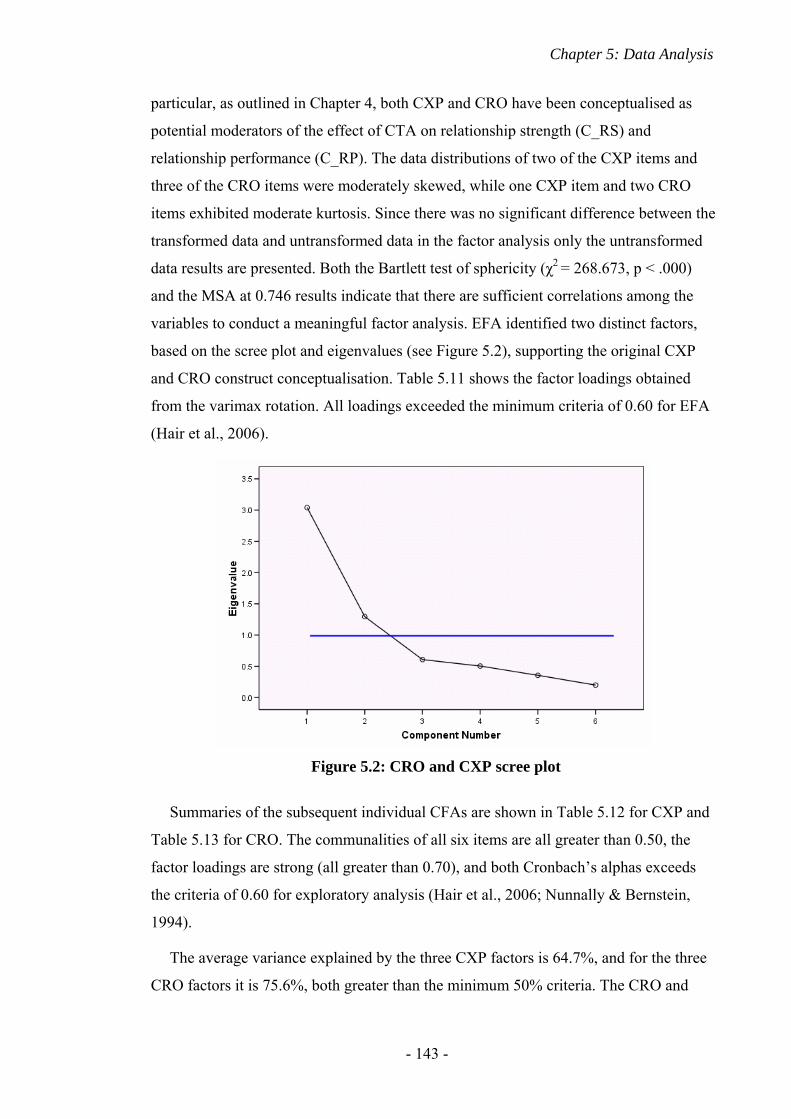
Chapter 5: Data Analysis
- 143 -
particular, as outlined in Chapter 4, both CXP and CRO have been conceptualised as
potential moderators of the effect of CTA on relationship strength (C_RS) and
relationship performance (C_RP). The data distributions of two of the CXP items and
three of the CRO items were moderately skewed, while one CXP item and two CRO
items exhibited moderate kurtosis. Since there was no significant difference between the
transformed data and untransformed data in the factor analysis only the untransformed
data results are presented. Both the Bartlett test of sphericity (χ2 = 268.673, p < .000)
and the MSA at 0.746 results indicate that there are sufficient correlations among the
variables to conduct a meaningful factor analysis. EFA identified two distinct factors,
based on the scree plot and eigenvalues (see Figure 5.2), supporting the original CXP
and CRO construct conceptualisation. Table 5.11 shows the factor loadings obtained
from the varimax rotation. All loadings exceeded the minimum criteria of 0.60 for EFA
(Hair et al., 2006).
Summaries of the subsequent individual CFAs are shown in Table 5.12 for CXP and
Table 5.13 for CRO. The communalities of all six items are all greater than 0.50, the
factor loadings are strong (all greater than 0.70), and both Cronbach’s alphas exceeds
the criteria of 0.60 for exploratory analysis (Hair et al., 2006; Nunnally & Bernstein,
1994).
The average variance explained by the three CXP factors is 64.7%, and for the three
CRO factors it is 75.6%, both greater than the minimum 50% criteria. The CRO and
Figure 5.2: CRO and CXP scree plot
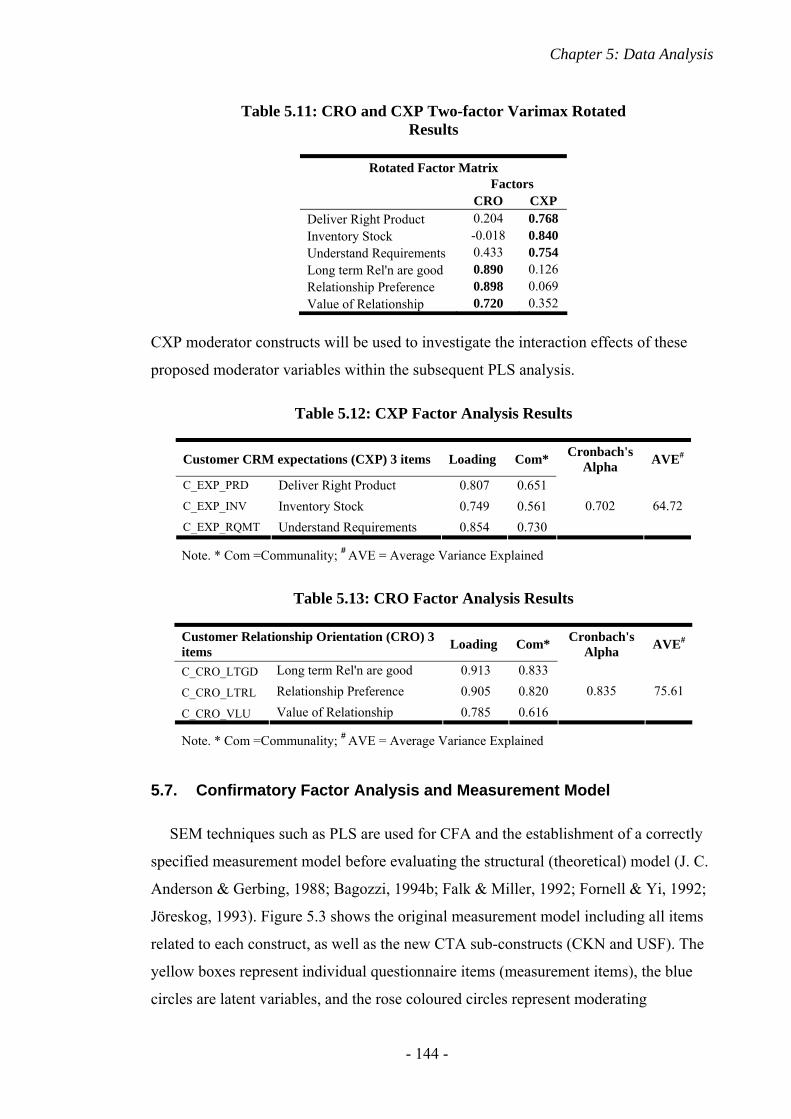
Chapter 5: Data Analysis
- 144 -
CXP moderator constructs will be used to investigate the interaction effects of these
proposed moderator variables within the subsequent PLS analysis.
5.7. Confirmatory Factor Analysis and Measurement Model
SEM techniques such as PLS are used for CFA and the establishment of a correctly
specified measurement model before evaluating the structural (theoretical) model (J. C.
Anderson & Gerbing, 1988; Bagozzi, 1994b; Falk & Miller, 1992; Fornell & Yi, 1992;
Jöreskog, 1993). Figure 5.3 shows the original measurement model including all items
related to each construct, as well as the new CTA sub-constructs (CKN and USF). The
yellow boxes represent individual questionnaire items (measurement items), the blue
circles are latent variables, and the rose coloured circles represent moderating
Table 5.11: CRO and CXP Two-factor Varimax Rotated Results
Rotated Factor Matrix Factors CRO CXP Deliver Right Product 0.204 0.768 Inventory Stock -0.018 0.840 Understand Requirements 0.433 0.754 Long term Rel'n are good 0.890 0.126 Relationship Preference 0.898 0.069 Value of Relationship 0.720 0.352
Table 5.12: CXP Factor Analysis Results
Customer CRM expectations (CXP) 3 items Loading Com* Cronbach's Alpha AVE#
C_EXP_PRD Deliver Right Product 0.807 0.651 C_EXP_INV Inventory Stock 0.749 0.561 C_EXP_RQMT Understand Requirements 0.854 0.730
0.702 64.72
Note. * Com =Communality; # AVE = Average Variance Explained
Table 5.13: CRO Factor Analysis Results
Customer Relationship Orientation (CRO) 3 items Loading Com* Cronbach's
Alpha AVE#
C_CRO_LTGD Long term Rel'n are good 0.913 0.833
C_CRO_LTRL Relationship Preference 0.905 0.820
C_CRO_VLU Value of Relationship 0.785 0.616 0.835 75.61
Note. * Com =Communality; # AVE = Average Variance Explained
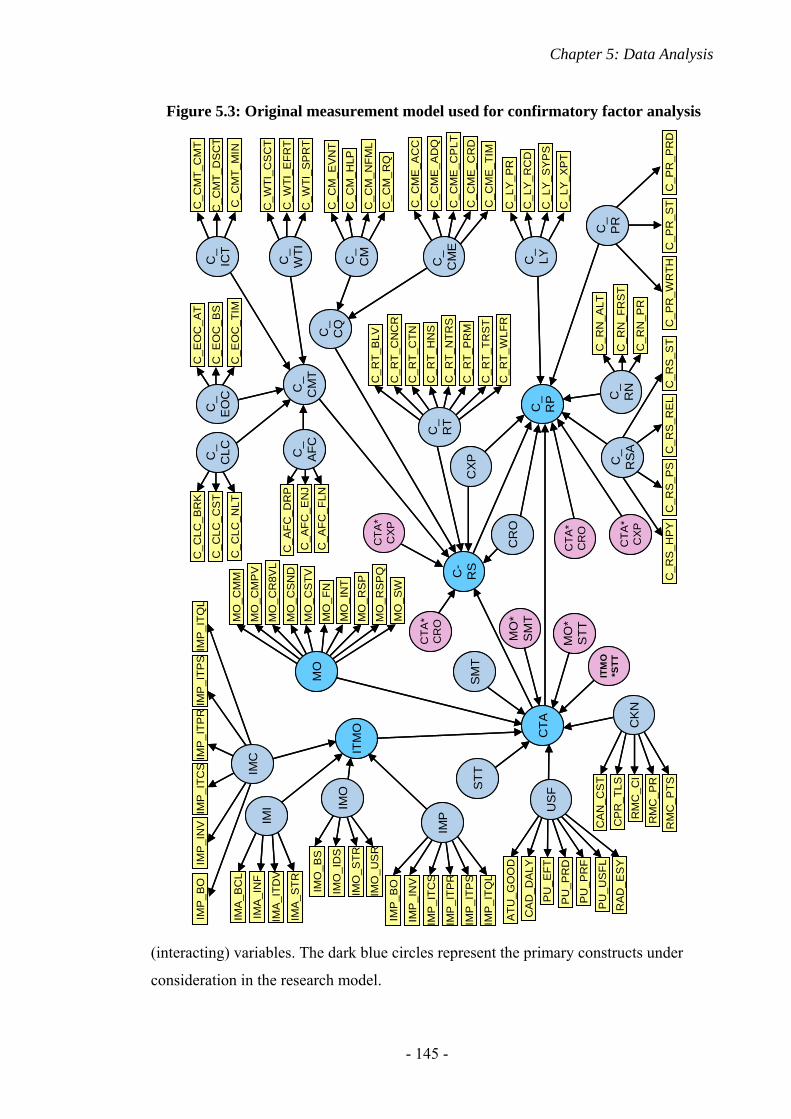
Chapter 5: Data Analysis
- 145 -
(interacting) variables. The dark blue circles represent the primary constructs under
consideration in the research model.
Figure 5.3: Original measurement model used for confirmatory factor analysis
ITM
O
SM
T
CR
O
C_
RP
IMA
_BC
L
IMA
_IN
F
IMA
_ITD
V
C_C
MT_
CM
T
C_C
MT_
DS
CT
C_C
MT_
MIN
C_W
TI_C
SC
T
C_W
TI_E
FRT
IMA
_STR IM
O_B
S
IMO
_ID
S
IMO
_STR
IMO
_US
R
IMP
_BO
IMP
_IN
V
IMP
_ITC
S
IMP
_ITP
R
IMP
_ITP
S
IMP
_ITQ
L
IMP
_BO
IMP
_IN
VIM
P_I
TCS
IMP
_ITP
RIM
P_I
TPS
IMP
_ITQ
L
ATU
_GO
OD
CA
D_D
ALY
PU
_EFT
PU
_PR
D
PU
_PR
F
PU
_US
FLR
AD
_ES
Y
CA
N_C
ST
CP
R_T
LSR
MC
_CI
RM
C_P
RR
MC
_PTS
MO
_CM
M
MO
_CM
PV
MO
_CR
8VL
MO
_CS
ND
MO
_CS
TV
MO
_FN
MO
_IN
TM
O_R
SP
MO
_RS
PQ
MO
_SW
MO
*S
TT
C_A
FC_D
RP
C_A
FC_E
NJ
C_A
FC_F
LN
C_C
LC_B
RK
C_C
LC_C
ST
C_C
LC_N
LT
C_E
OC
_AT
C_E
OC
_BS
C_E
OC
_TIM
C_W
TI_S
PR
T
C_C
M_E
VN
T
C_C
M_H
LP
C_C
M_N
FML
C_C
M_R
Q
C_C
ME
_AC
C
C_C
ME
_AD
Q
C_C
ME
_CP
LTC
_CM
E_C
RD
C_C
ME
_TIM
C_R
S_H
PY
C_R
S_P
SC
_RS
_RE
LC
_RS
_STC_R
N_A
LT
C_R
N_F
RS
T
C_R
N_P
R
C_P
R_P
RD
C_P
R_S
TC
_PR
_WR
TH
C_L
Y_P
R
C_L
Y_R
CD
C_L
Y_S
YP
SC
_LY
_XP
T
C_R
T_B
LV
C_R
T_C
NC
R
C_R
T_C
TN
C_R
T_H
NS
C_R
T_N
TRS
C_R
T_P
RM
C_R
T_TR
ST
C_R
T_W
LFR
IMC
IMP
C_
CM
T
C_
CLC
ITM
O*S
TT
STT
CTA
*C
RO
CTA
*C
XP
C-
RS
CX
P
C_
CM
E
CTA
C_
PR
MO
*S
MT
C_
RS
A
US
F
CK
N
IMO
IMI
MO
C_
EO
CC
_ IC
T
C_
RN
C_
AFC
C_
CQ
C_
LY
C_
RT
CTA
*C
RO
CTA
*C
XP
C_
WTI
C_
CM
ITM
O
SM
T
CR
O
C_
RP
IMA
_BC
L
IMA
_IN
F
IMA
_ITD
V
C_C
MT_
CM
T
C_C
MT_
DS
CT
C_C
MT_
MIN
C_W
TI_C
SC
T
C_W
TI_E
FRT
IMA
_STR IM
O_B
S
IMO
_ID
S
IMO
_STR
IMO
_US
R
IMP
_BO
IMP
_IN
V
IMP
_ITC
S
IMP
_ITP
R
IMP
_ITP
S
IMP
_ITQ
L
IMP
_BO
IMP
_IN
VIM
P_I
TCS
IMP
_ITP
RIM
P_I
TPS
IMP
_ITQ
L
ATU
_GO
OD
CA
D_D
ALY
PU
_EFT
PU
_PR
D
PU
_PR
F
PU
_US
FLR
AD
_ES
Y
CA
N_C
ST
CP
R_T
LSR
MC
_CI
RM
C_P
RR
MC
_PTS
MO
_CM
M
MO
_CM
PV
MO
_CR
8VL
MO
_CS
ND
MO
_CS
TV
MO
_FN
MO
_IN
TM
O_R
SP
MO
_RS
PQ
MO
_SW
MO
*S
TT
C_A
FC_D
RP
C_A
FC_E
NJ
C_A
FC_F
LN
C_A
FC_D
RP
C_A
FC_E
NJ
C_A
FC_F
LN
C_C
LC_B
RK
C_C
LC_C
ST
C_C
LC_N
LT
C_E
OC
_AT
C_E
OC
_BS
C_E
OC
_TIM
C_W
TI_S
PR
T
C_C
M_E
VN
T
C_C
M_H
LP
C_C
M_N
FML
C_C
M_R
Q
C_C
ME
_AC
C
C_C
ME
_AD
Q
C_C
ME
_CP
LTC
_CM
E_C
RD
C_C
ME
_TIM
C_R
S_H
PY
C_R
S_P
SC
_RS
_RE
LC
_RS
_STC_R
N_A
LT
C_R
N_F
RS
T
C_R
N_P
R
C_P
R_P
RD
C_P
R_S
TC
_PR
_WR
TH
C_L
Y_P
R
C_L
Y_R
CD
C_L
Y_S
YP
SC
_LY
_XP
T
C_R
T_B
LV
C_R
T_C
NC
R
C_R
T_C
TN
C_R
T_H
NS
C_R
T_N
TRS
C_R
T_P
RM
C_R
T_TR
ST
C_R
T_W
LFR
IMC
IMP
C_
CM
T
C_
CLC
ITM
O*S
TT
STT
CTA
*C
RO
CTA
*C
XP
C-
RS
CX
P
C_
CM
E
CTA
C_
PR
MO
*S
MT
C_
RS
A
US
F
CK
N
IMO
IMI
MO
C_
EO
CC
_ IC
T
C_
RN
C_
AFC
C_
CQ
C_
LY
C_
RT
CTA
*C
RO
CTA
*C
XP
C_
WTI
C_
CM
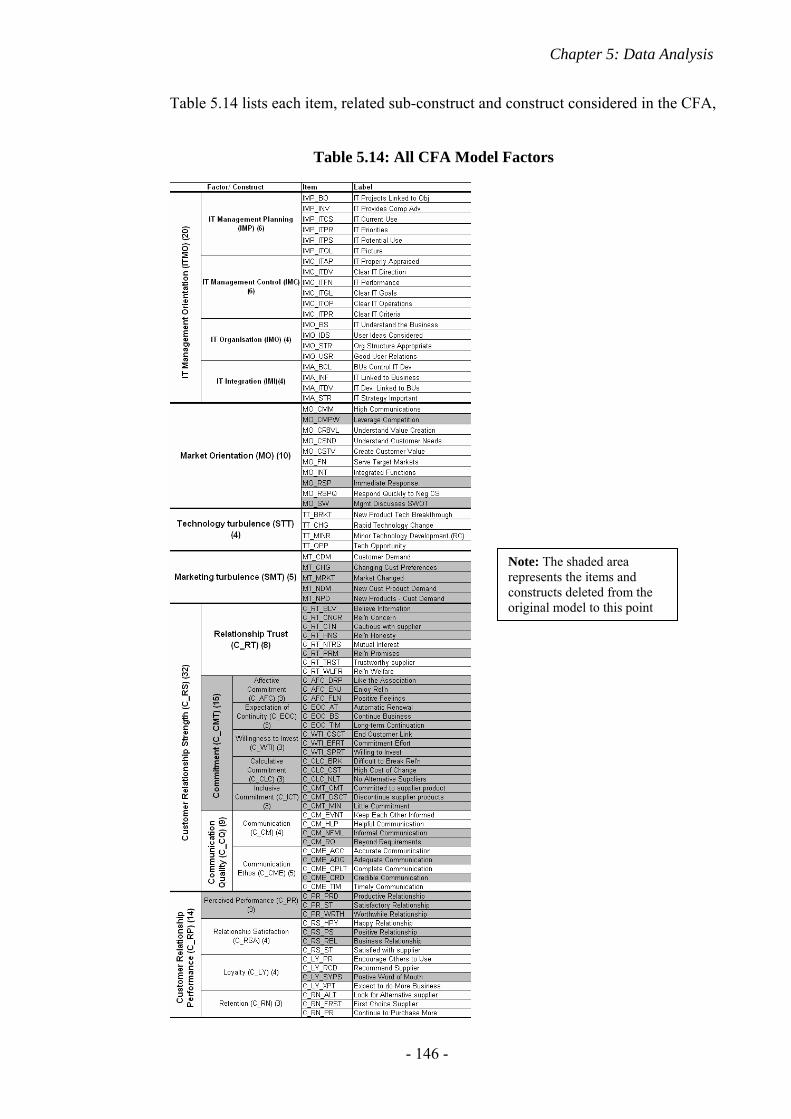
Chapter 5: Data Analysis
- 146 -
Table 5.14 lists each item, related sub-construct and construct considered in the CFA,
Table 5.14: All CFA Model Factors
Note: The shaded area represents the items and constructs deleted from the original model to this point
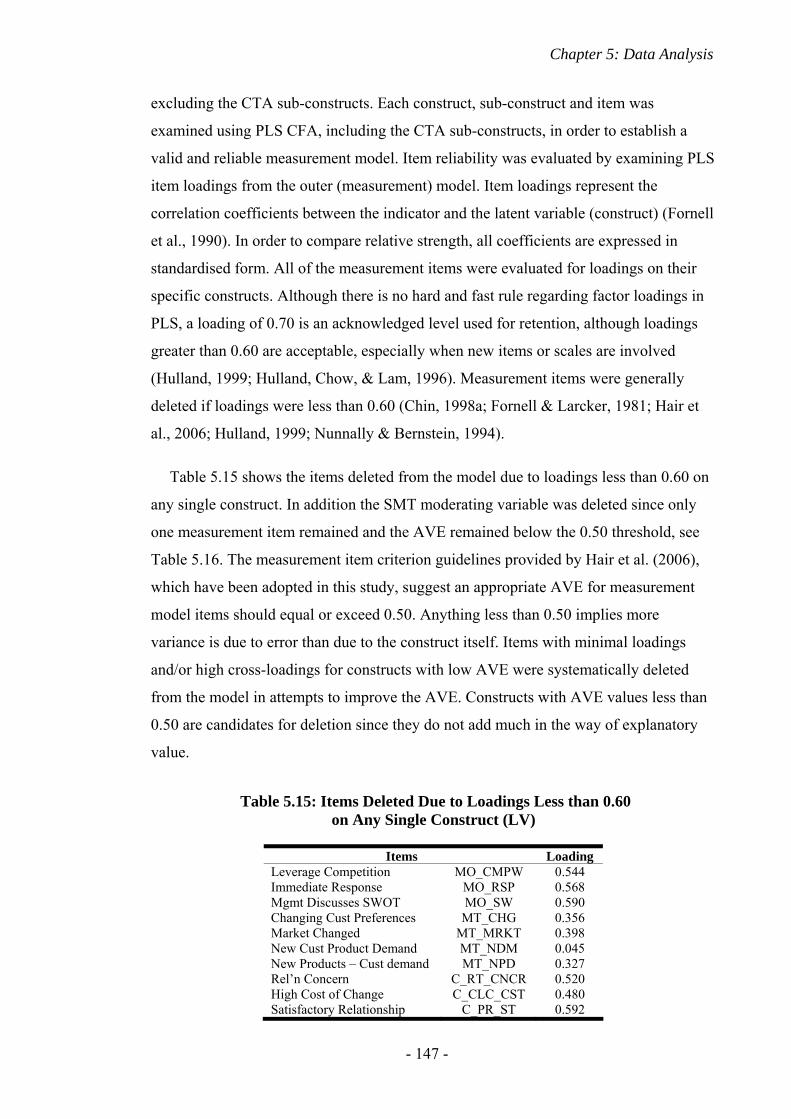
Chapter 5: Data Analysis
- 147 -
excluding the CTA sub-constructs. Each construct, sub-construct and item was
examined using PLS CFA, including the CTA sub-constructs, in order to establish a
valid and reliable measurement model. Item reliability was evaluated by examining PLS
item loadings from the outer (measurement) model. Item loadings represent the
correlation coefficients between the indicator and the latent variable (construct) (Fornell
et al., 1990). In order to compare relative strength, all coefficients are expressed in
standardised form. All of the measurement items were evaluated for loadings on their
specific constructs. Although there is no hard and fast rule regarding factor loadings in
PLS, a loading of 0.70 is an acknowledged level used for retention, although loadings
greater than 0.60 are acceptable, especially when new items or scales are involved
(Hulland, 1999; Hulland, Chow, & Lam, 1996). Measurement items were generally
deleted if loadings were less than 0.60 (Chin, 1998a; Fornell & Larcker, 1981; Hair et
al., 2006; Hulland, 1999; Nunnally & Bernstein, 1994).
Table 5.15 shows the items deleted from the model due to loadings less than 0.60 on
any single construct. In addition the SMT moderating variable was deleted since only
one measurement item remained and the AVE remained below the 0.50 threshold, see
Table 5.16. The measurement item criterion guidelines provided by Hair et al. (2006),
which have been adopted in this study, suggest an appropriate AVE for measurement
model items should equal or exceed 0.50. Anything less than 0.50 implies more
variance is due to error than due to the construct itself. Items with minimal loadings
and/or high cross-loadings for constructs with low AVE were systematically deleted
from the model in attempts to improve the AVE. Constructs with AVE values less than
0.50 are candidates for deletion since they do not add much in the way of explanatory
value.
Table 5.15: Items Deleted Due to Loadings Less than 0.60 on Any Single Construct (LV)
Items Loading Leverage Competition MO_CMPW 0.544 Immediate Response MO_RSP 0.568 Mgmt Discusses SWOT MO_SW 0.590 Changing Cust Preferences MT_CHG 0.356 Market Changed MT_MRKT 0.398 New Cust Product Demand MT_NDM 0.045 New Products – Cust demand MT_NPD 0.327 Rel’n Concern C_RT_CNCR 0.520 High Cost of Change C_CLC_CST 0.480 Satisfactory Relationship C_PR_ST 0.592
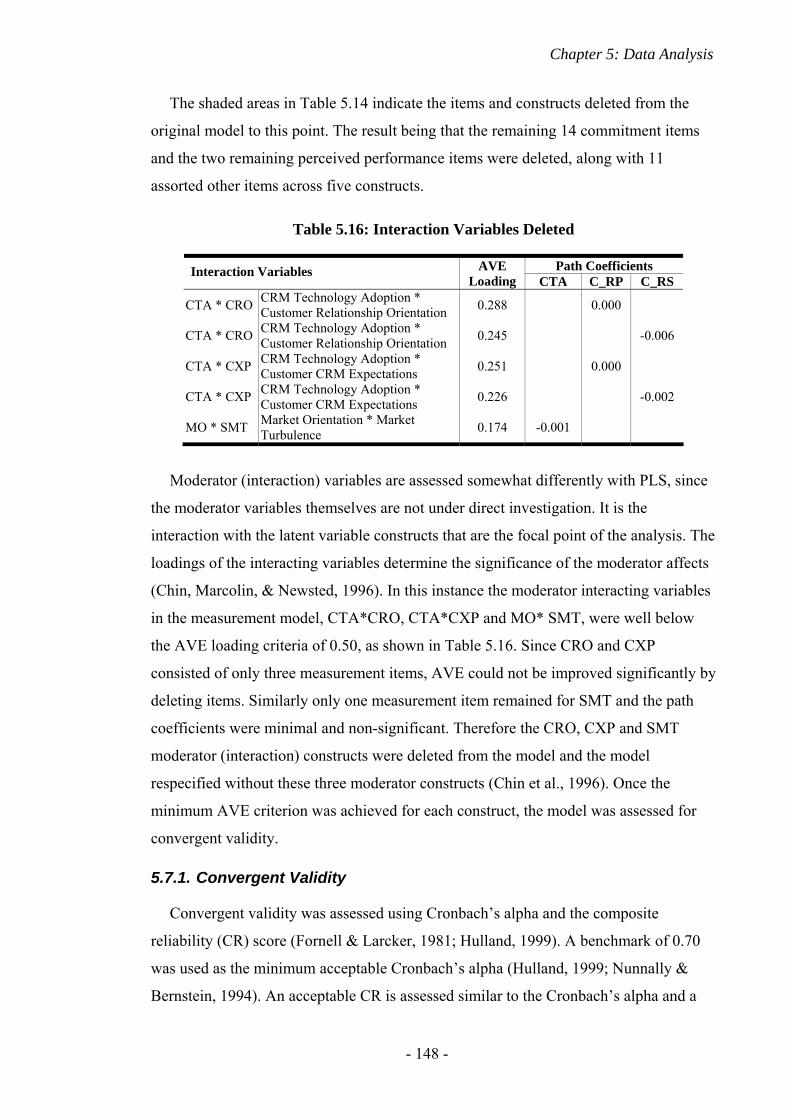
Chapter 5: Data Analysis
- 148 -
The shaded areas in Table 5.14 indicate the items and constructs deleted from the
original model to this point. The result being that the remaining 14 commitment items
and the two remaining perceived performance items were deleted, along with 11
assorted other items across five constructs.
Moderator (interaction) variables are assessed somewhat differently with PLS, since
the moderator variables themselves are not under direct investigation. It is the
interaction with the latent variable constructs that are the focal point of the analysis. The
loadings of the interacting variables determine the significance of the moderator affects
(Chin, Marcolin, & Newsted, 1996). In this instance the moderator interacting variables
in the measurement model, CTA*CRO, CTA*CXP and MO* SMT, were well below
the AVE loading criteria of 0.50, as shown in Table 5.16. Since CRO and CXP
consisted of only three measurement items, AVE could not be improved significantly by
deleting items. Similarly only one measurement item remained for SMT and the path
coefficients were minimal and non-significant. Therefore the CRO, CXP and SMT
moderator (interaction) constructs were deleted from the model and the model
respecified without these three moderator constructs (Chin et al., 1996). Once the
minimum AVE criterion was achieved for each construct, the model was assessed for
convergent validity.
5.7.1. Convergent Validity
Convergent validity was assessed using Cronbach’s alpha and the composite
reliability (CR) score (Fornell & Larcker, 1981; Hulland, 1999). A benchmark of 0.70
was used as the minimum acceptable Cronbach’s alpha (Hulland, 1999; Nunnally &
Bernstein, 1994). An acceptable CR is assessed similar to the Cronbach’s alpha and a
Table 5.16: Interaction Variables Deleted
Path Coefficients Interaction Variables AVE Loading CTA C_RP C_RS
CTA * CRO CRM Technology Adoption * Customer Relationship Orientation 0.288 0.000
CTA * CRO CRM Technology Adoption * Customer Relationship Orientation 0.245 -0.006
CTA * CXP CRM Technology Adoption * Customer CRM Expectations 0.251 0.000
CTA * CXP CRM Technology Adoption * Customer CRM Expectations 0.226 -0.002
MO * SMT Market Orientation * Market Turbulence 0.174 -0.001
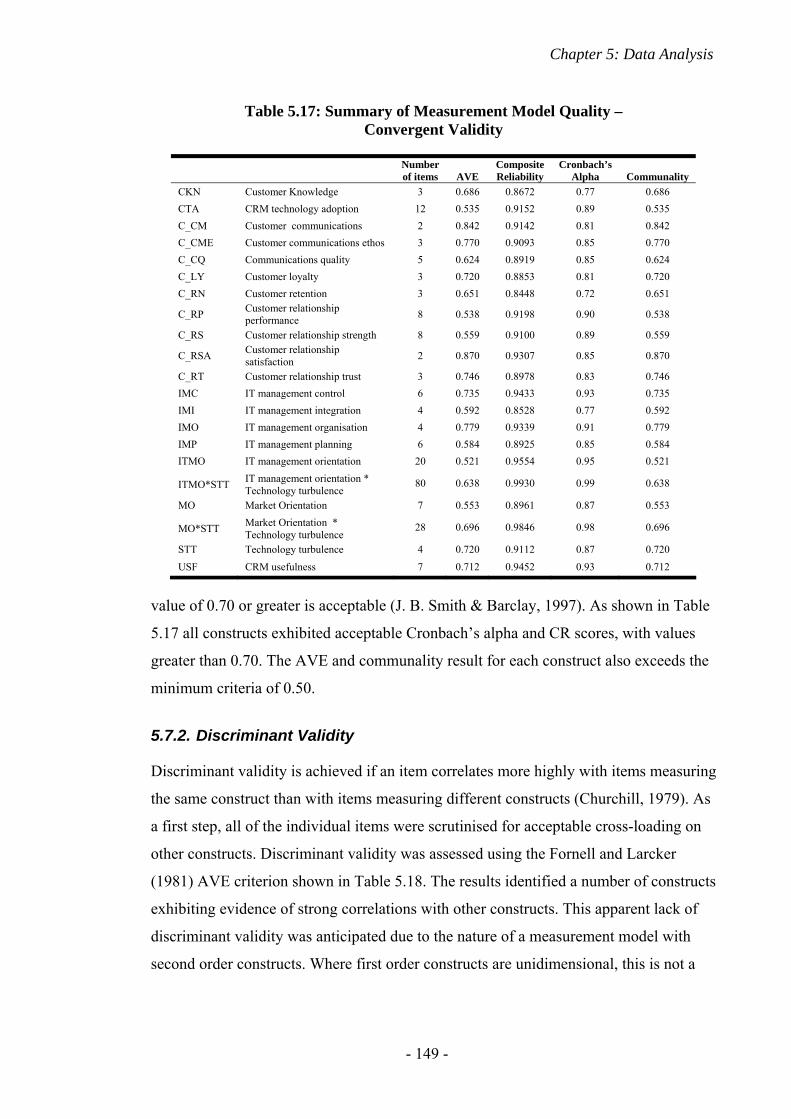
Chapter 5: Data Analysis
- 149 -
value of 0.70 or greater is acceptable (J. B. Smith & Barclay, 1997). As shown in Table
5.17 all constructs exhibited acceptable Cronbach’s alpha and CR scores, with values
greater than 0.70. The AVE and communality result for each construct also exceeds the
minimum criteria of 0.50.
5.7.2. Discriminant Validity
Discriminant validity is achieved if an item correlates more highly with items measuring
the same construct than with items measuring different constructs (Churchill, 1979). As
a first step, all of the individual items were scrutinised for acceptable cross-loading on
other constructs. Discriminant validity was assessed using the Fornell and Larcker
(1981) AVE criterion shown in Table 5.18. The results identified a number of constructs
exhibiting evidence of strong correlations with other constructs. This apparent lack of
discriminant validity was anticipated due to the nature of a measurement model with
second order constructs. Where first order constructs are unidimensional, this is not a
Table 5.17: Summary of Measurement Model Quality – Convergent Validity
Number of items AVE
Composite Reliability
Cronbach’s Alpha Communality
CKN Customer Knowledge 3 0.686 0.8672 0.77 0.686 CTA CRM technology adoption 12 0.535 0.9152 0.89 0.535 C_CM Customer communications 2 0.842 0.9142 0.81 0.842 C_CME Customer communications ethos 3 0.770 0.9093 0.85 0.770 C_CQ Communications quality 5 0.624 0.8919 0.85 0.624 C_LY Customer loyalty 3 0.720 0.8853 0.81 0.720 C_RN Customer retention 3 0.651 0.8448 0.72 0.651
C_RP Customer relationship performance 8 0.538 0.9198 0.90 0.538
C_RS Customer relationship strength 8 0.559 0.9100 0.89 0.559
C_RSA Customer relationship satisfaction 2 0.870 0.9307 0.85 0.870
C_RT Customer relationship trust 3 0.746 0.8978 0.83 0.746 IMC IT management control 6 0.735 0.9433 0.93 0.735 IMI IT management integration 4 0.592 0.8528 0.77 0.592 IMO IT management organisation 4 0.779 0.9339 0.91 0.779 IMP IT management planning 6 0.584 0.8925 0.85 0.584 ITMO IT management orientation 20 0.521 0.9554 0.95 0.521
ITMO*STT IT management orientation * Technology turbulence
80 0.638 0.9930 0.99 0.638
MO Market Orientation 7 0.553 0.8961 0.87 0.553
MO*STT Market Orientation * Technology turbulence
28 0.696 0.9846 0.98 0.696
STT Technology turbulence 4 0.720 0.9112 0.87 0.720
USF CRM usefulness 7 0.712 0.9452 0.93 0.712
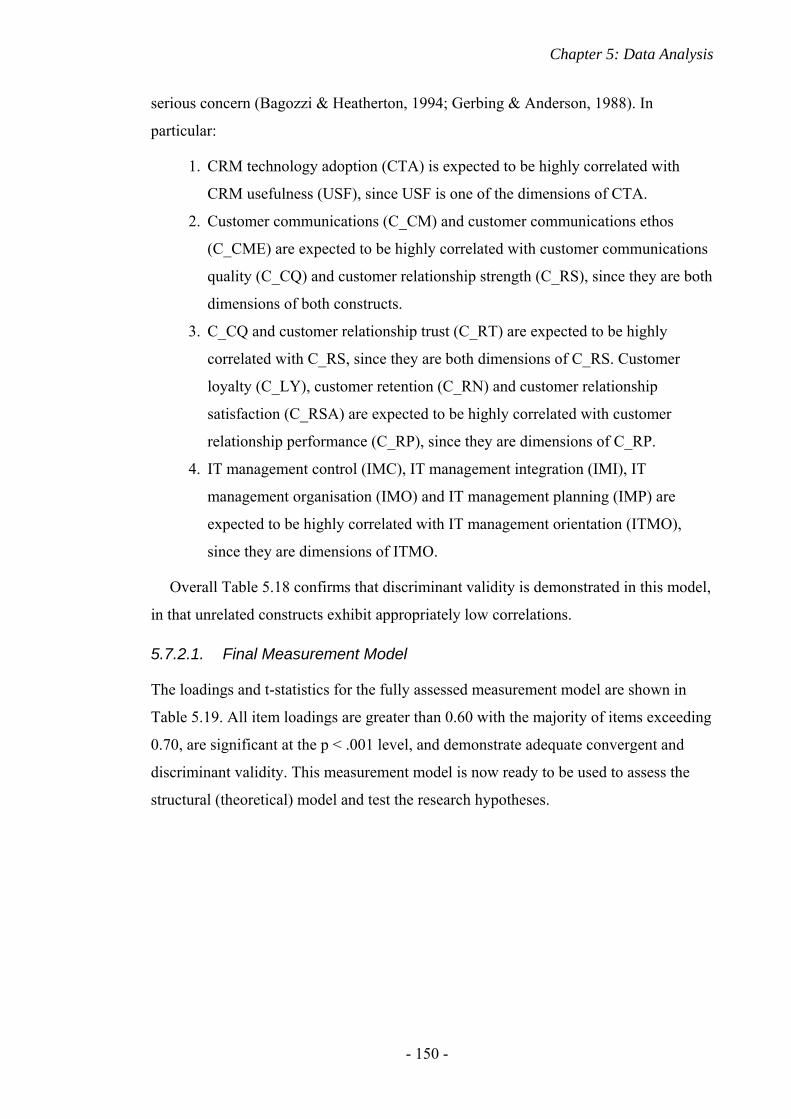
Chapter 5: Data Analysis
- 150 -
serious concern (Bagozzi & Heatherton, 1994; Gerbing & Anderson, 1988). In
particular:
1. CRM technology adoption (CTA) is expected to be highly correlated with
CRM usefulness (USF), since USF is one of the dimensions of CTA.
2. Customer communications (C_CM) and customer communications ethos
(C_CME) are expected to be highly correlated with customer communications
quality (C_CQ) and customer relationship strength (C_RS), since they are both
dimensions of both constructs.
3. C_CQ and customer relationship trust (C_RT) are expected to be highly
correlated with C_RS, since they are both dimensions of C_RS. Customer
loyalty (C_LY), customer retention (C_RN) and customer relationship
satisfaction (C_RSA) are expected to be highly correlated with customer
relationship performance (C_RP), since they are dimensions of C_RP.
4. IT management control (IMC), IT management integration (IMI), IT
management organisation (IMO) and IT management planning (IMP) are
expected to be highly correlated with IT management orientation (ITMO),
since they are dimensions of ITMO.
Overall Table 5.18 confirms that discriminant validity is demonstrated in this model,
in that unrelated constructs exhibit appropriately low correlations.
5.7.2.1. Final Measurement Model
The loadings and t-statistics for the fully assessed measurement model are shown in
Table 5.19. All item loadings are greater than 0.60 with the majority of items exceeding
0.70, are significant at the p < .001 level, and demonstrate adequate convergent and
discriminant validity. This measurement model is now ready to be used to assess the
structural (theoretical) model and test the research hypotheses.
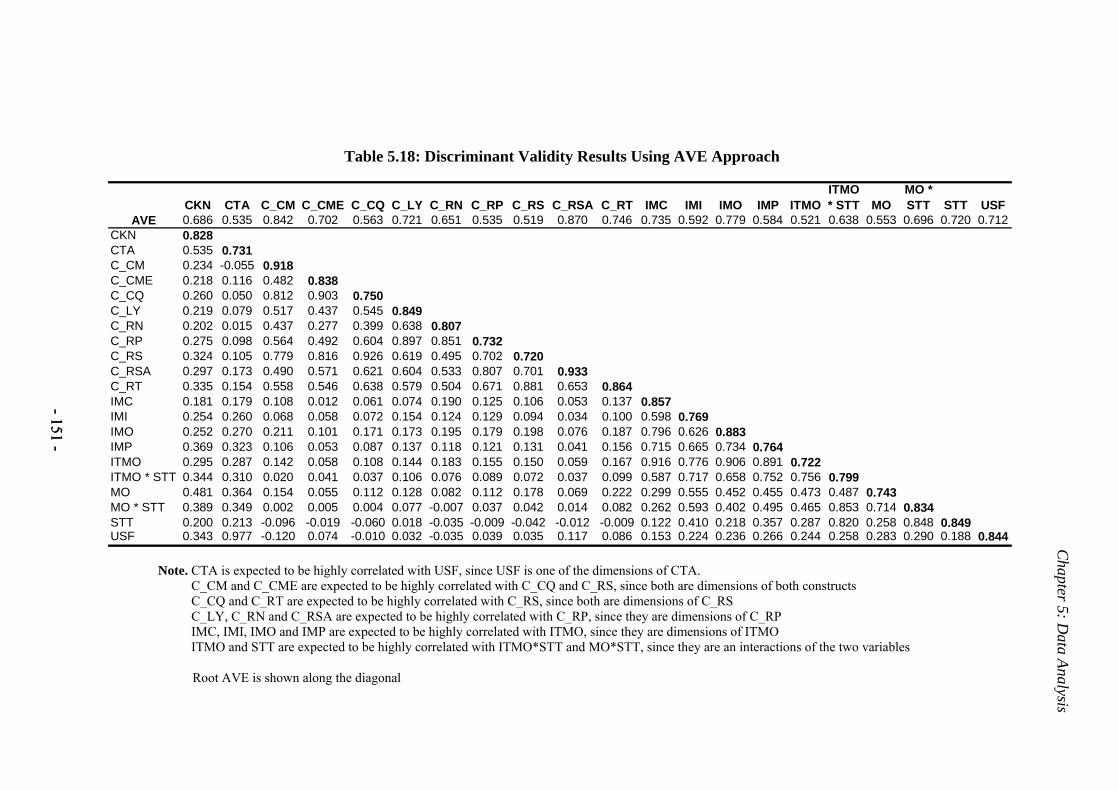
Table 5.18: Discriminant Validity Results Using AVE Approach
CKN CTA C_CM C_CME C_CQ C_LY C_RN C_RP C_RS C_RSA C_RT IMC IMI IMO IMP ITMOITMO * STT MO
MO * STT STT USF
AVE 0.686 0.535 0.842 0.702 0.563 0.721 0.651 0.535 0.519 0.870 0.746 0.735 0.592 0.779 0.584 0.521 0.638 0.553 0.696 0.720 0.712CKN 0.828CTA 0.535 0.731C_CM 0.234 -0.055 0.918C_CME 0.218 0.116 0.482 0.838C_CQ 0.260 0.050 0.812 0.903 0.750C_LY 0.219 0.079 0.517 0.437 0.545 0.849C_RN 0.202 0.015 0.437 0.277 0.399 0.638 0.807C_RP 0.275 0.098 0.564 0.492 0.604 0.897 0.851 0.732C_RS 0.324 0.105 0.779 0.816 0.926 0.619 0.495 0.702 0.720C_RSA 0.297 0.173 0.490 0.571 0.621 0.604 0.533 0.807 0.701 0.933C_RT 0.335 0.154 0.558 0.546 0.638 0.579 0.504 0.671 0.881 0.653 0.864IMC 0.181 0.179 0.108 0.012 0.061 0.074 0.190 0.125 0.106 0.053 0.137 0.857IMI 0.254 0.260 0.068 0.058 0.072 0.154 0.124 0.129 0.094 0.034 0.100 0.598 0.769IMO 0.252 0.270 0.211 0.101 0.171 0.173 0.195 0.179 0.198 0.076 0.187 0.796 0.626 0.883IMP 0.369 0.323 0.106 0.053 0.087 0.137 0.118 0.121 0.131 0.041 0.156 0.715 0.665 0.734 0.764ITMO 0.295 0.287 0.142 0.058 0.108 0.144 0.183 0.155 0.150 0.059 0.167 0.916 0.776 0.906 0.891 0.722ITMO * STT 0.344 0.310 0.020 0.041 0.037 0.106 0.076 0.089 0.072 0.037 0.099 0.587 0.717 0.658 0.752 0.756 0.799MO 0.481 0.364 0.154 0.055 0.112 0.128 0.082 0.112 0.178 0.069 0.222 0.299 0.555 0.452 0.455 0.473 0.487 0.743MO * STT 0.389 0.349 0.002 0.005 0.004 0.077 -0.007 0.037 0.042 0.014 0.082 0.262 0.593 0.402 0.495 0.465 0.853 0.714 0.834STT 0.200 0.213 -0.096 -0.019 -0.060 0.018 -0.035 -0.009 -0.042 -0.012 -0.009 0.122 0.410 0.218 0.357 0.287 0.820 0.258 0.848 0.849USF 0.343 0.977 -0.120 0.074 -0.010 0.032 -0.035 0.039 0.035 0.117 0.086 0.153 0.224 0.236 0.266 0.244 0.258 0.283 0.290 0.188 0.844
Note. CTA is expected to be highly correlated with USF, since USF is one of the dimensions of CTA. C_CM and C_CME are expected to be highly correlated with C_CQ and C_RS, since both are dimensions of both constructs C_CQ and C_RT are expected to be highly correlated with C_RS, since both are dimensions of C_RS C_LY, C_RN and C_RSA are expected to be highly correlated with C_RP, since they are dimensions of C_RP IMC, IMI, IMO and IMP are expected to be highly correlated with ITMO, since they are dimensions of ITMO ITMO and STT are expected to be highly correlated with ITMO*STT and MO*STT, since they are an interactions of the two variables
Root AVE is shown along the diagonal
-151 --151 -
Chapter 5: D
ata Analysis
Chapter 5: Data Analysis
- 152 -
Table 5.19: Final Measurement Model Items, Loadings and Significance Values
Item Label Loading t-statistic sig.CPR_TLS CRM Tools avail 0.785 13.442 p<0.001RMC_PR Customer View 0.865 23.751 p<0.001RMC_PTS Cust Contact points 0.832 21.858 p<0.001ATU_GOOD CRM is a Good Idea 0.757 10.074 p<0.001CAD_DALY Fully Accepted CRM 0.770 14.408 p<0.001RAD_ESY Job is Easier 0.817 15.488 p<0.001PU_EFT Enhances Effectiveness 0.908 56.921 p<0.001PU_PRD Increases Productivity 0.877 28.196 p<0.001PU_PRF Improves Performance 0.883 40.793 p<0.001PU_USFL Is Useful 0.882 30.994 p<0.001IMP_BO IT Projects Linked to Obj 0.671 8.855 p<0.001IMP_INV IT Provides Comp Adv 0.804 17.095 p<0.001IMP_ITCS IT Current Use 0.849 26.422 p<0.001IMP_ITPR IT Priorities 0.620 9.938 p<0.001IMP_ITPS IT Potential Use 0.794 13.596 p<0.001IMP_ITQL IT Picture 0.818 14.939 p<0.001IMC_ITAP IT Properly Appraised 0.821 25.298 p<0.001IMC_ITDV Clear IT Direction 0.874 37.154 p<0.001IMC_ITFN IT Performance 0.832 20.638 p<0.001IMC_ITGL Clear IT Goals 0.891 36.329 p<0.001IMC_ITOP Clear IT Operations 0.854 24.906 p<0.001IMC_ITPR Clear IT Criteria 0.870 30.513 p<0.001IMO_BS IT Understand the Business 0.889 37.590 p<0.001IMO_IDS User Ideas Considered 0.858 30.004 p<0.001IMO_STR Org Structure Appropriate 0.884 32.601 p<0.001IMO_USR Good User Relations 0.900 34.663 p<0.001IMA_BCL BUs Control IT Dev 0.782 15.889 p<0.001IMA_INF IT Linked to Business 0.807 22.705 p<0.001IMA_ITDV IT Dev. Linked to BUs 0.746 14.814 p<0.001IMA_STR IT Strategy Important 0.741 13.253 p<0.001MO_CMM High Communications 0.738 11.438 p<0.001MO_CR8VL Understand Value Creation 0.722 10.958 p<0.001MO_CSND Understand Customer Needs 0.778 10.520 p<0.001MO_CSTV Create Customer Value 0.782 14.344 p<0.001MO_FN Serve Target Markets 0.749 10.596 p<0.001MO_INT Integrated Functions 0.755 12.316 p<0.001MO_RSPQ Respond Quickly to Neg CS 0.674 8.427 p<0.001TT_BRKT New Product Tech Breakthrough 0.853 4.809 p<0.001TT_CHG Rapid Technology Change 0.826 3.850 p<0.001TT_MINR Minor Technology Development 0.766 3.422 p<0.001TT_OPP Tech Opportunity 0.900 3.950 p<0.001C_RT_NTRS Mutual Interest 0.911 47.718 p<0.001C_RT_TRST Trustworthy supplier 0.832 20.929 p<0.001C_RT_WLFR Rel'n Welfare 0.846 19.788 p<0.001C_CM_EVNT Keep Each Other Informed 0.931 56.136 p<0.001C_CM_HLP Helpful Communication 0.904 27.972 p<0.001C_CME_ACC Accurate Communication 0.849 17.585 p<0.001C_CME_CPLT Complete Communication 0.894 34.539 p<0.001C_CME_CRD Credible Communication 0.888 45.276 p<0.001C_RS_HPY Happy Relationship 0.939 77.887 p<0.001C_RS_ST Satisfied with supplier 0.927 55.652 p<0.001C_LY_PR Encourage Others to Use 0.866 22.342 p<0.001C_LY_RCD Recommend Supplier 0.881 31.863 p<0.001C_LY_XPT Expect to do More Business 0.797 16.343 p<0.001C_RN_ALT Look for Alternative supplier 0.608 8.409 p<0.001C_RN_FRST First Choice Supplier 0.919 56.496 p<0.001C_RN_PR Continue to Purchase More 0.860 18.567 p<0.001
Cus
tom
er
Rel
atio
nshi
p Pe
rfor
man
ce Relationship
Satisfaction
Loyalty (C_LY) (3)
Retention (C_RN) (3)
Market Orientation (MO) (7)
Technology turbulence (STT) (4)
Cus
tom
er
Rel
atio
nshi
p St
reng
th (C
_RS) Relationship Trust
(C_RT) (3)
Communication (C_CM) (2)
Communication Ethos (C_CME) (3)
IT M
anag
emen
t Orie
ntat
ion
(ITM
O) (
20)
IT Management Planning (IMP) (6)
IT Management Control (IMC) (6)
IT Organisation (IMO) (4)
IT Integration (IMI) (4)
Factor/ Construct
CR
M T
echn
olog
y A
dopt
ion
(CTA
) (12
) Customer Knowledge (CKN)
(3)
CRM Usefulness (USF) (7)
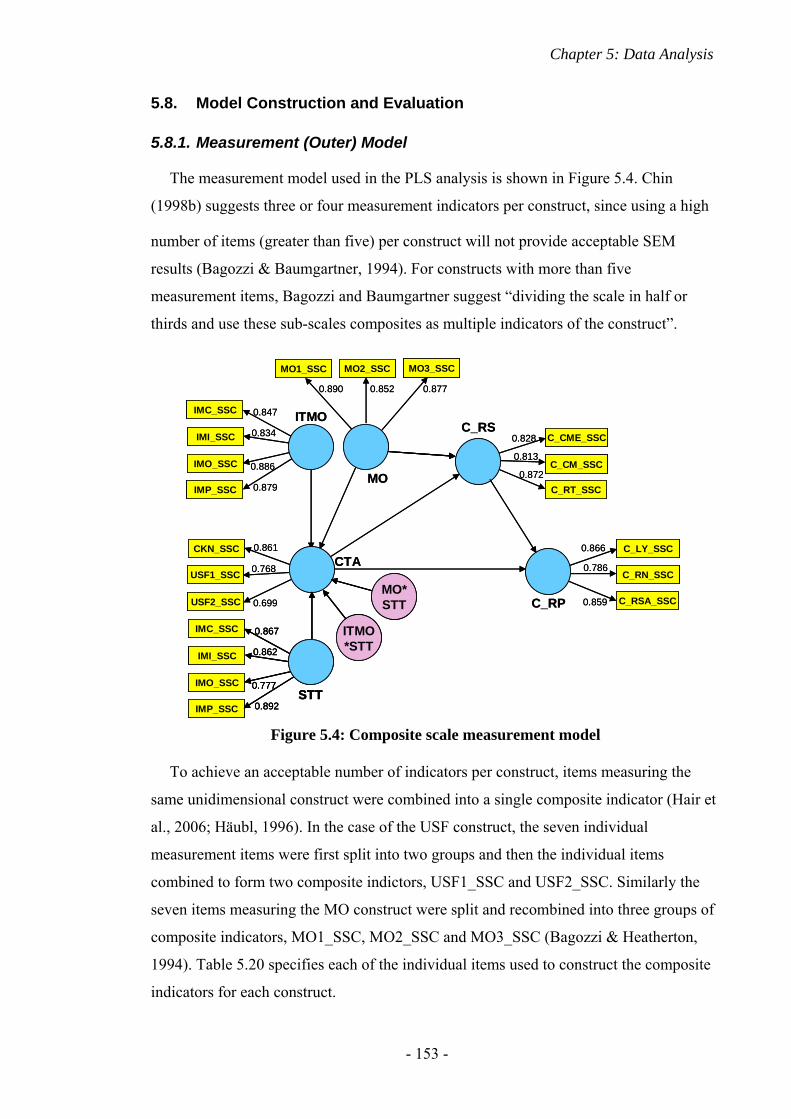
Chapter 5: Data Analysis
- 153 -
5.8. Model Construction and Evaluation
5.8.1. Measurement (Outer) Model
The measurement model used in the PLS analysis is shown in Figure 5.4. Chin
(1998b) suggests three or four measurement indicators per construct, since using a high
number of items (greater than five) per construct will not provide acceptable SEM
results (Bagozzi & Baumgartner, 1994). For constructs with more than five
measurement items, Bagozzi and Baumgartner suggest “dividing the scale in half or
thirds and use these sub-scales composites as multiple indicators of the construct”.
To achieve an acceptable number of indicators per construct, items measuring the
same unidimensional construct were combined into a single composite indicator (Hair et
al., 2006; Häubl, 1996). In the case of the USF construct, the seven individual
measurement items were first split into two groups and then the individual items
combined to form two composite indictors, USF1_SSC and USF2_SSC. Similarly the
seven items measuring the MO construct were split and recombined into three groups of
composite indicators, MO1_SSC, MO2_SSC and MO3_SSC (Bagozzi & Heatherton,
1994). Table 5.20 specifies each of the individual items used to construct the composite
indicators for each construct.
Figure 5.4: Composite scale measurement model
CTA
IMC_SSC
IMI_SSC
IMO_SSC
IMP_SSC
CKN_SSC
USF1_SSC
USF2_SSC
MO1_SSC MO2_SSC MO3_SSC
C_CME_SSC
C_CM_SSC
C_RT_SSC
C_LY_SSC
C_RN_SSC
C_RSA_SSC
0.847
0.834
0.886
0.879
0.861
0.768
0.890 0.852 0.877
0.828
0.813
0.872
0.699
0.866
0.786
0.859
ITMO
MO
C_RS
C_RPMO*STT
STT
IMC_SSC
IMI_SSC
IMO_SSC
IMP_SSC
0.867
0.862
0.777
0.892
ITMO*STT
MO*STT
STT
IMC_SSC
IMI_SSC
IMO_SSC
IMP_SSC
0.867
0.862
0.777
0.892
ITMO*STT
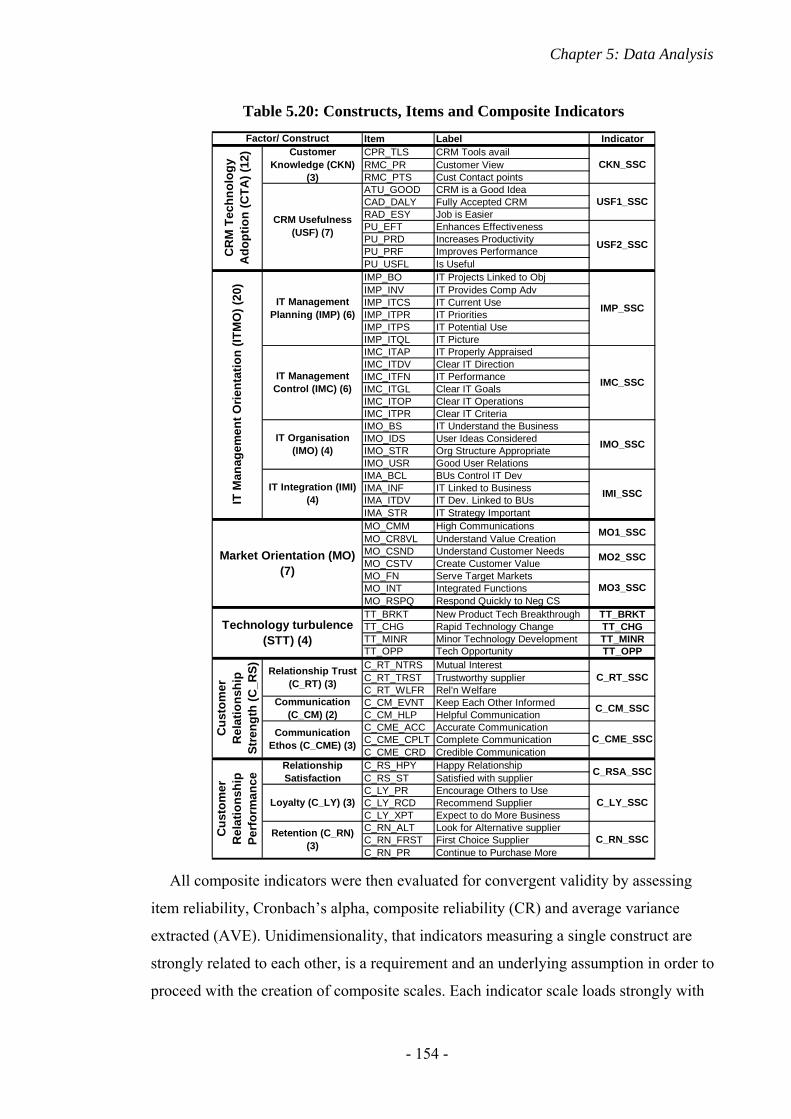
Chapter 5: Data Analysis
- 154 -
All composite indicators were then evaluated for convergent validity by assessing
item reliability, Cronbach’s alpha, composite reliability (CR) and average variance
extracted (AVE). Unidimensionality, that indicators measuring a single construct are
strongly related to each other, is a requirement and an underlying assumption in order to
proceed with the creation of composite scales. Each indicator scale loads strongly with
Table 5.20: Constructs, Items and Composite Indicators
Item Label IndicatorCPR_TLS CRM Tools availRMC_PR Customer ViewRMC_PTS Cust Contact pointsATU_GOOD CRM is a Good IdeaCAD_DALY Fully Accepted CRMRAD_ESY Job is EasierPU_EFT Enhances EffectivenessPU_PRD Increases ProductivityPU_PRF Improves PerformancePU_USFL Is UsefulIMP_BO IT Projects Linked to ObjIMP_INV IT Provides Comp AdvIMP_ITCS IT Current UseIMP_ITPR IT PrioritiesIMP_ITPS IT Potential UseIMP_ITQL IT PictureIMC_ITAP IT Properly AppraisedIMC_ITDV Clear IT DirectionIMC_ITFN IT PerformanceIMC_ITGL Clear IT GoalsIMC_ITOP Clear IT OperationsIMC_ITPR Clear IT CriteriaIMO_BS IT Understand the BusinessIMO_IDS User Ideas ConsideredIMO_STR Org Structure AppropriateIMO_USR Good User RelationsIMA_BCL BUs Control IT DevIMA_INF IT Linked to BusinessIMA_ITDV IT Dev. Linked to BUsIMA_STR IT Strategy ImportantMO_CMM High CommunicationsMO_CR8VL Understand Value CreationMO_CSND Understand Customer NeedsMO_CSTV Create Customer ValueMO_FN Serve Target MarketsMO_INT Integrated FunctionsMO_RSPQ Respond Quickly to Neg CSTT_BRKT New Product Tech Breakthrough TT_BRKTTT_CHG Rapid Technology Change TT_CHGTT_MINR Minor Technology Development TT_MINRTT_OPP Tech Opportunity TT_OPPC_RT_NTRS Mutual InterestC_RT_TRST Trustworthy supplierC_RT_WLFR Rel'n WelfareC_CM_EVNT Keep Each Other InformedC_CM_HLP Helpful CommunicationC_CME_ACC Accurate CommunicationC_CME_CPLT Complete CommunicationC_CME_CRD Credible CommunicationC_RS_HPY Happy RelationshipC_RS_ST Satisfied with supplierC_LY_PR Encourage Others to UseC_LY_RCD Recommend SupplierC_LY_XPT Expect to do More BusinessC_RN_ALT Look for Alternative supplierC_RN_FRST First Choice SupplierC_RN_PR Continue to Purchase More
Cus
tom
er
Rel
atio
nshi
p Pe
rfor
man
ce Relationship
Satisfaction
Loyalty (C_LY) (3)
Retention (C_RN) (3)
Market Orientation (MO) (7)
Technology turbulence (STT) (4)
Cus
tom
er
Rel
atio
nshi
p St
reng
th (C
_RS) Relationship Trust
(C_RT) (3)
Communication (C_CM) (2)
Communication Ethos (C_CME) (3)
IT M
anag
emen
t Orie
ntat
ion
(ITM
O) (
20)
IT Management Planning (IMP) (6)
IT Management Control (IMC) (6)
IT Organisation (IMO) (4)
IT Integration (IMI) (4)
Factor/ Construct
CR
M T
echn
olog
y A
dopt
ion
(CTA
) (12
) Customer Knowledge (CKN)
(3)
CRM Usefulness (USF) (7)
CKN_SSC
USF1_SSC
USF2_SSC
IMP_SSC
IMC_SSC
IMO_SSC
IMI_SSC
MO1_SSC
MO2_SSC
MO3_SSC
C_RT_SSC
C_RN_SSC
C_CM_SSC
C_CME_SSC
C_RSA_SSC
C_LY_SSC
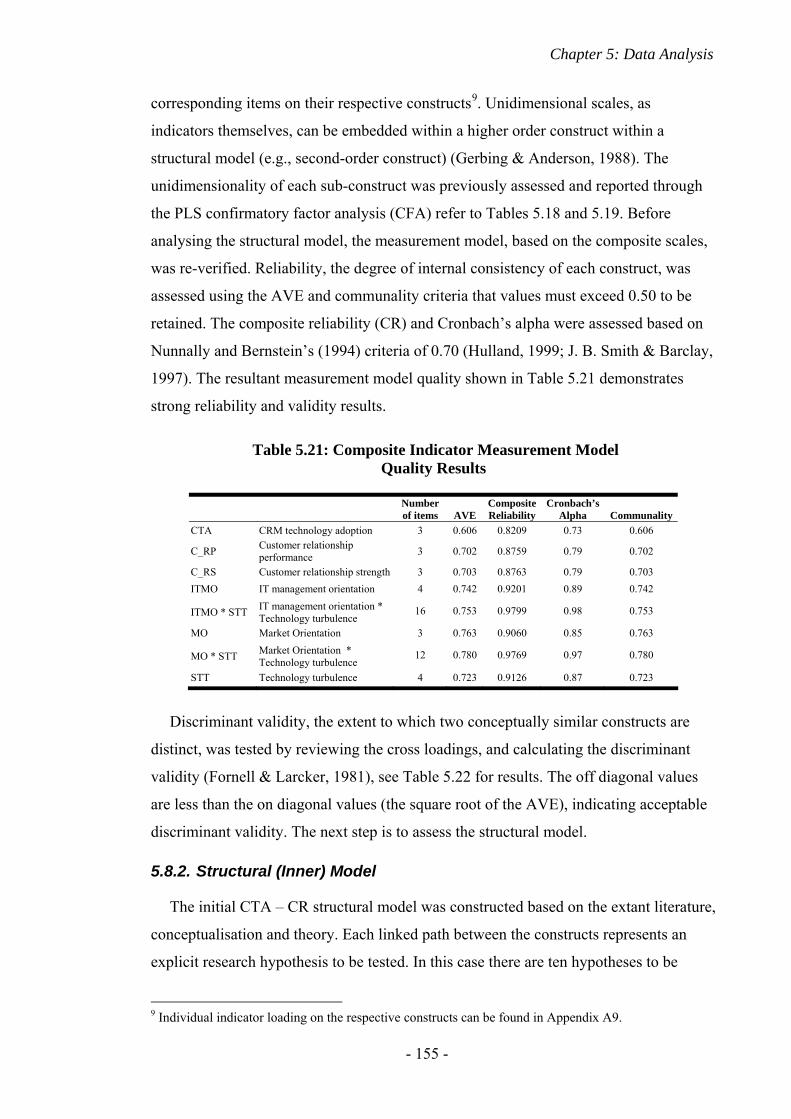
Chapter 5: Data Analysis
- 155 -
corresponding items on their respective constructs9. Unidimensional scales, as
indicators themselves, can be embedded within a higher order construct within a
structural model (e.g., second-order construct) (Gerbing & Anderson, 1988). The
unidimensionality of each sub-construct was previously assessed and reported through
the PLS confirmatory factor analysis (CFA) refer to Tables 5.18 and 5.19. Before
analysing the structural model, the measurement model, based on the composite scales,
was re-verified. Reliability, the degree of internal consistency of each construct, was
assessed using the AVE and communality criteria that values must exceed 0.50 to be
retained. The composite reliability (CR) and Cronbach’s alpha were assessed based on
Nunnally and Bernstein’s (1994) criteria of 0.70 (Hulland, 1999; J. B. Smith & Barclay,
1997). The resultant measurement model quality shown in Table 5.21 demonstrates
strong reliability and validity results.
Discriminant validity, the extent to which two conceptually similar constructs are
distinct, was tested by reviewing the cross loadings, and calculating the discriminant
validity (Fornell & Larcker, 1981), see Table 5.22 for results. The off diagonal values
are less than the on diagonal values (the square root of the AVE), indicating acceptable
discriminant validity. The next step is to assess the structural model.
5.8.2. Structural (Inner) Model
The initial CTA – CR structural model was constructed based on the extant literature,
conceptualisation and theory. Each linked path between the constructs represents an
explicit research hypothesis to be tested. In this case there are ten hypotheses to be
9 Individual indicator loading on the respective constructs can be found in Appendix A9.
Table 5.21: Composite Indicator Measurement Model Quality Results
Number of items AVE
Composite Reliability
Cronbach’s Alpha Communality
CTA CRM technology adoption 3 0.606 0.8209 0.73 0.606
C_RP Customer relationship performance 3 0.702 0.8759 0.79 0.702
C_RS Customer relationship strength 3 0.703 0.8763 0.79 0.703 ITMO IT management orientation 4 0.742 0.9201 0.89 0.742
ITMO * STT IT management orientation * Technology turbulence
16 0.753 0.9799 0.98 0.753
MO Market Orientation 3 0.763 0.9060 0.85 0.763
MO * STT Market Orientation * Technology turbulence
12 0.780 0.9769 0.97 0.780
STT Technology turbulence 4 0.723 0.9126 0.87 0.723
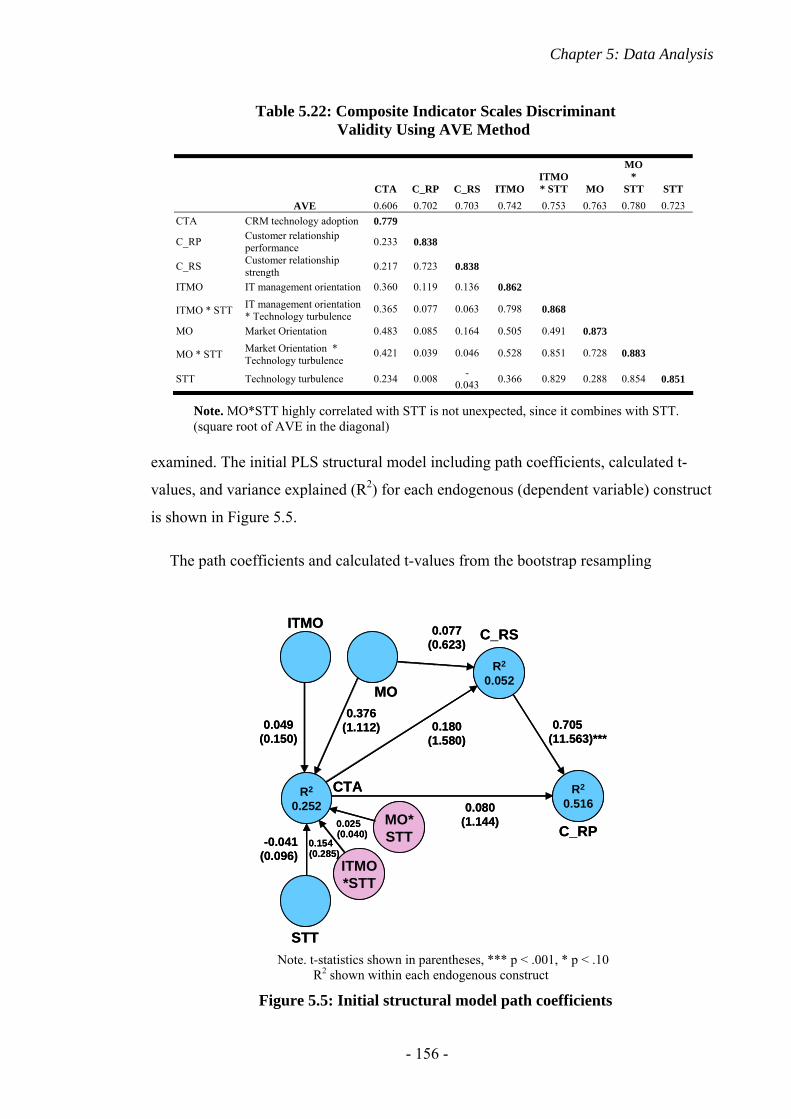
Chapter 5: Data Analysis
- 156 -
examined. The initial PLS structural model including path coefficients, calculated t-
values, and variance explained (R2) for each endogenous (dependent variable) construct
is shown in Figure 5.5.
The path coefficients and calculated t-values from the bootstrap resampling
Table 5.22: Composite Indicator Scales Discriminant Validity Using AVE Method
CTA C_RP C_RS ITMO ITMO * STT MO
MO *
STT STT AVE 0.606 0.702 0.703 0.742 0.753 0.763 0.780 0.723
CTA CRM technology adoption 0.779
C_RP Customer relationship performance 0.233 0.838
C_RS Customer relationship strength 0.217 0.723 0.838
ITMO IT management orientation 0.360 0.119 0.136 0.862
ITMO * STT IT management orientation * Technology turbulence
0.365 0.077 0.063 0.798 0.868
MO Market Orientation 0.483 0.085 0.164 0.505 0.491 0.873
MO * STT Market Orientation * Technology turbulence
0.421 0.039 0.046 0.528 0.851 0.728 0.883
STT Technology turbulence 0.234 0.008 -0.043 0.366 0.829 0.288 0.854 0.851
Note. MO*STT highly correlated with STT is not unexpected, since it combines with STT. (square root of AVE in the diagonal)
0.376
0.077
0.7050.180
0.080
0.049(0.150)
(1.112)
(0.623)
(11.563)***(1.580)
(1.144)
R2
0.516
ITMO
MO
C_RS
C_RP
CTAR2
0.252MO*STT
STT
ITMO*STT
-0.041(0.096)
0.025(0.040)
0.154(0.285)
R2
0.052
0.376
0.077
0.7050.180
0.080
0.049(0.150)
(1.112)
(0.623)
(11.563)***(1.580)
(1.144)
R2
0.516
ITMO
MO
C_RS
C_RP
CTAR2
0.252MO*STT
STT
ITMO*STT
-0.041(0.096)
0.025(0.040)
0.154(0.285)
R2
0.052
Note. t-statistics shown in parentheses, *** p < .001, * p < .10
R2 shown within each endogenous construct
Figure 5.5: Initial structural model path coefficients
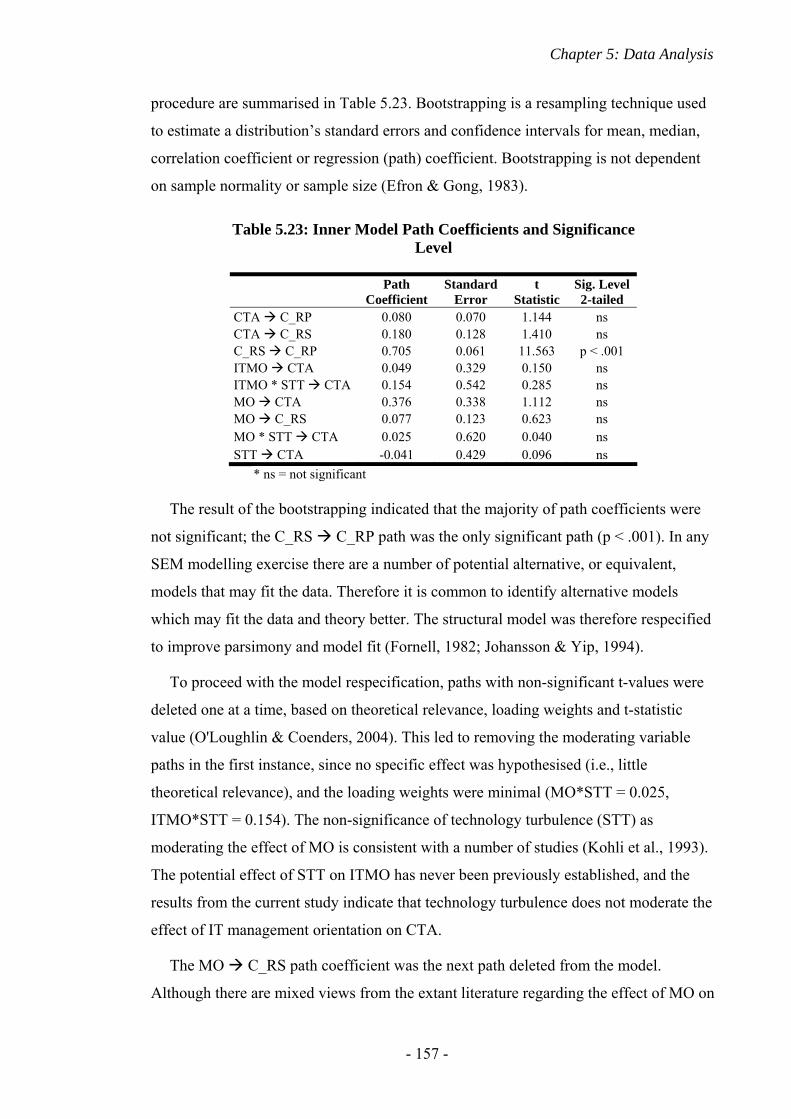
Chapter 5: Data Analysis
- 157 -
procedure are summarised in Table 5.23. Bootstrapping is a resampling technique used
to estimate a distribution’s standard errors and confidence intervals for mean, median,
correlation coefficient or regression (path) coefficient. Bootstrapping is not dependent
on sample normality or sample size (Efron & Gong, 1983).
The result of the bootstrapping indicated that the majority of path coefficients were
not significant; the C_RS C_RP path was the only significant path (p < .001). In any
SEM modelling exercise there are a number of potential alternative, or equivalent,
models that may fit the data. Therefore it is common to identify alternative models
which may fit the data and theory better. The structural model was therefore respecified
to improve parsimony and model fit (Fornell, 1982; Johansson & Yip, 1994).
To proceed with the model respecification, paths with non-significant t-values were
deleted one at a time, based on theoretical relevance, loading weights and t-statistic
value (O'Loughlin & Coenders, 2004). This led to removing the moderating variable
paths in the first instance, since no specific effect was hypothesised (i.e., little
theoretical relevance), and the loading weights were minimal (MO*STT = 0.025,
ITMO*STT = 0.154). The non-significance of technology turbulence (STT) as
moderating the effect of MO is consistent with a number of studies (Kohli et al., 1993).
The potential effect of STT on ITMO has never been previously established, and the
results from the current study indicate that technology turbulence does not moderate the
effect of IT management orientation on CTA.
The MO C_RS path coefficient was the next path deleted from the model.
Although there are mixed views from the extant literature regarding the effect of MO on
Table 5.23: Inner Model Path Coefficients and Significance Level
Path Coefficient
Standard Error
t Statistic
Sig. Level 2-tailed
CTA C_RP 0.080 0.070 1.144 ns CTA C_RS 0.180 0.128 1.410 ns C_RS C_RP 0.705 0.061 11.563 p < .001 ITMO CTA 0.049 0.329 0.150 ns ITMO * STT CTA 0.154 0.542 0.285 ns MO CTA 0.376 0.338 1.112 ns MO C_RS 0.077 0.123 0.623 ns MO * STT CTA 0.025 0.620 0.040 ns STT CTA -0.041 0.429 0.096 ns
* ns = not significant
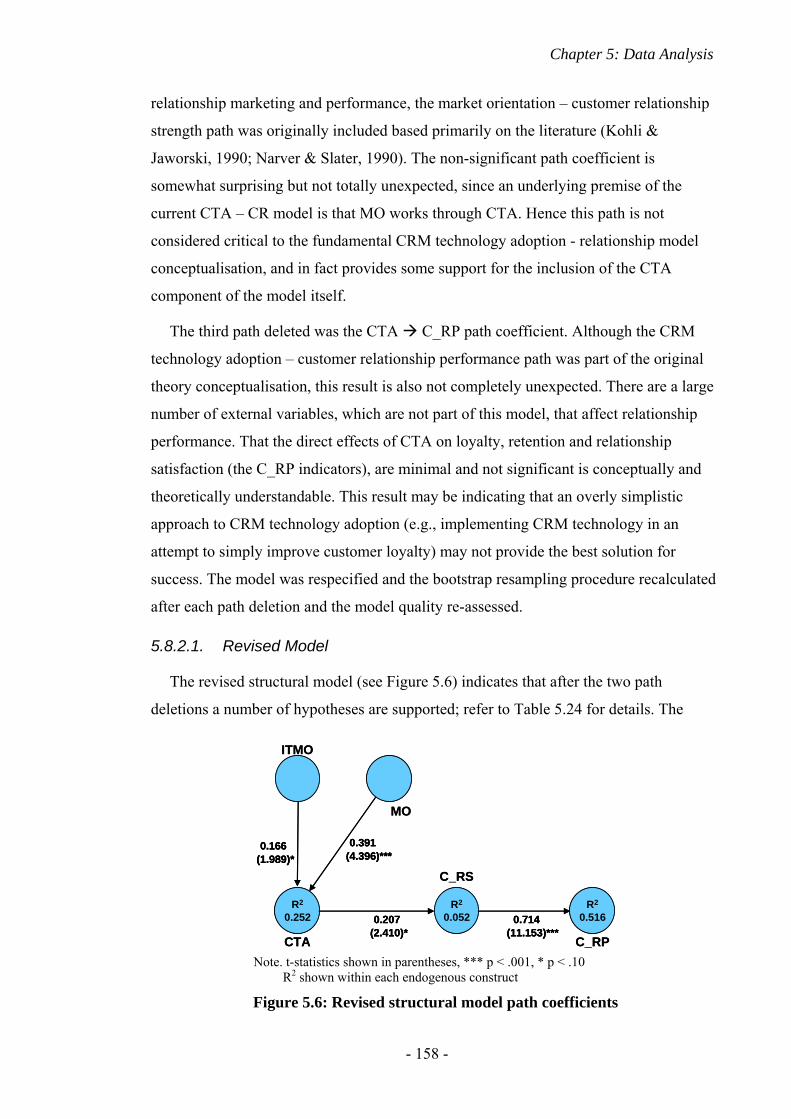
Chapter 5: Data Analysis
- 158 -
relationship marketing and performance, the market orientation – customer relationship
strength path was originally included based primarily on the literature (Kohli &
Jaworski, 1990; Narver & Slater, 1990). The non-significant path coefficient is
somewhat surprising but not totally unexpected, since an underlying premise of the
current CTA – CR model is that MO works through CTA. Hence this path is not
considered critical to the fundamental CRM technology adoption - relationship model
conceptualisation, and in fact provides some support for the inclusion of the CTA
component of the model itself.
The third path deleted was the CTA C_RP path coefficient. Although the CRM
technology adoption – customer relationship performance path was part of the original
theory conceptualisation, this result is also not completely unexpected. There are a large
number of external variables, which are not part of this model, that affect relationship
performance. That the direct effects of CTA on loyalty, retention and relationship
satisfaction (the C_RP indicators), are minimal and not significant is conceptually and
theoretically understandable. This result may be indicating that an overly simplistic
approach to CRM technology adoption (e.g., implementing CRM technology in an
attempt to simply improve customer loyalty) may not provide the best solution for
success. The model was respecified and the bootstrap resampling procedure recalculated
after each path deletion and the model quality re-assessed.
5.8.2.1. Revised Model
The revised structural model (see Figure 5.6) indicates that after the two path
deletions a number of hypotheses are supported; refer to Table 5.24 for details. The
0.207(2.410)*
0.714(11.153)***
0.166(1.989)*
0.391(4.396)***
R2
0.052
ITMO
C_RS
C_RPCTA
R2
0.252R2
0.516
MO
0.207(2.410)*0.207
(2.410)*0.714
(11.153)***0.714
(11.153)***
0.166(1.989)*0.166
(1.989)*0.391
(4.396)***0.391
(4.396)***
R2
0.052
ITMO
C_RS
C_RPCTA
R2
0.252R2
0.516
MO
Note. t-statistics shown in parentheses, *** p < .001, * p < .10
R2 shown within each endogenous construct
Figure 5.6: Revised structural model path coefficients
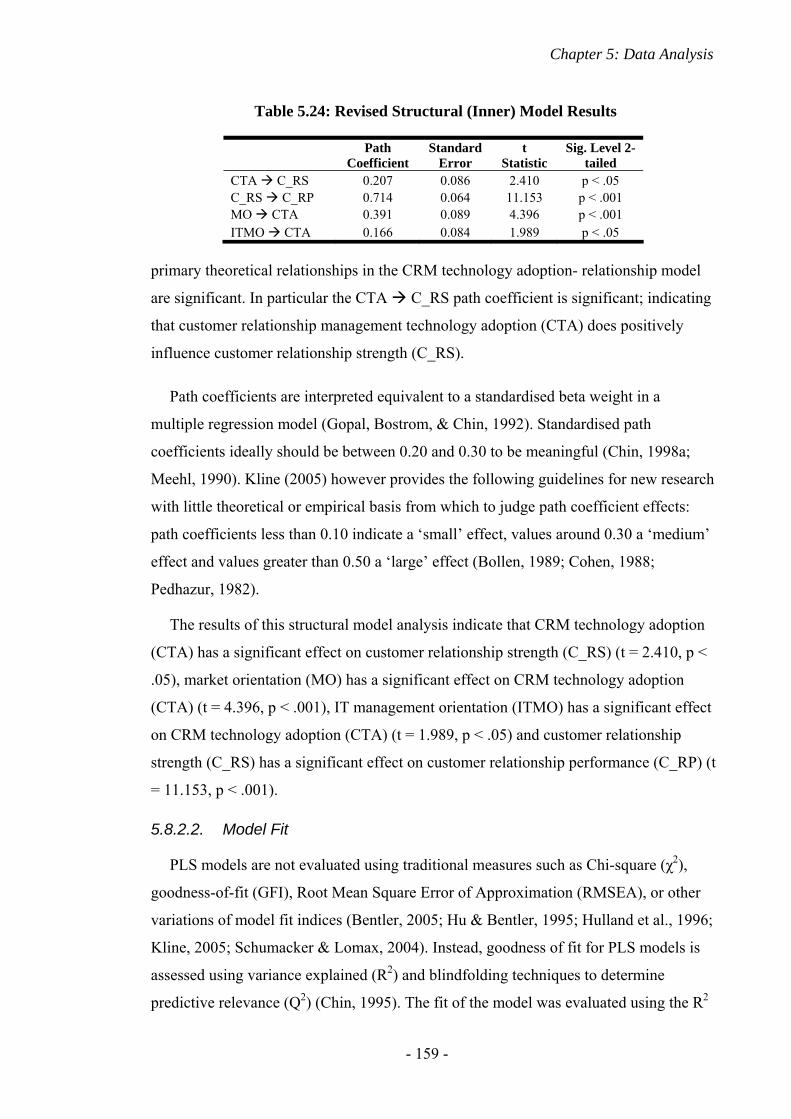
Chapter 5: Data Analysis
- 159 -
primary theoretical relationships in the CRM technology adoption- relationship model
are significant. In particular the CTA C_RS path coefficient is significant; indicating
that customer relationship management technology adoption (CTA) does positively
influence customer relationship strength (C_RS).
Path coefficients are interpreted equivalent to a standardised beta weight in a
multiple regression model (Gopal, Bostrom, & Chin, 1992). Standardised path
coefficients ideally should be between 0.20 and 0.30 to be meaningful (Chin, 1998a;
Meehl, 1990). Kline (2005) however provides the following guidelines for new research
with little theoretical or empirical basis from which to judge path coefficient effects:
path coefficients less than 0.10 indicate a ‘small’ effect, values around 0.30 a ‘medium’
effect and values greater than 0.50 a ‘large’ effect (Bollen, 1989; Cohen, 1988;
Pedhazur, 1982).
The results of this structural model analysis indicate that CRM technology adoption
(CTA) has a significant effect on customer relationship strength (C_RS) (t = 2.410, p <
.05), market orientation (MO) has a significant effect on CRM technology adoption
(CTA) (t = 4.396, p < .001), IT management orientation (ITMO) has a significant effect
on CRM technology adoption (CTA) (t = 1.989, p < .05) and customer relationship
strength (C_RS) has a significant effect on customer relationship performance (C_RP) (t
= 11.153, p < .001).
5.8.2.2. Model Fit
PLS models are not evaluated using traditional measures such as Chi-square (χ2),
goodness-of-fit (GFI), Root Mean Square Error of Approximation (RMSEA), or other
variations of model fit indices (Bentler, 2005; Hu & Bentler, 1995; Hulland et al., 1996;
Kline, 2005; Schumacker & Lomax, 2004). Instead, goodness of fit for PLS models is
assessed using variance explained (R2) and blindfolding techniques to determine
predictive relevance (Q2) (Chin, 1995). The fit of the model was evaluated using the R2
Table 5.24: Revised Structural (Inner) Model Results
Path
Coefficient Standard
Error t
Statistic Sig. Level 2-
tailed CTA C_RS 0.207 0.086 2.410 p < .05 C_RS C_RP 0.714 0.064 11.153 p < .001 MO CTA 0.391 0.089 4.396 p < .001 ITMO CTA 0.166 0.084 1.989 p < .05
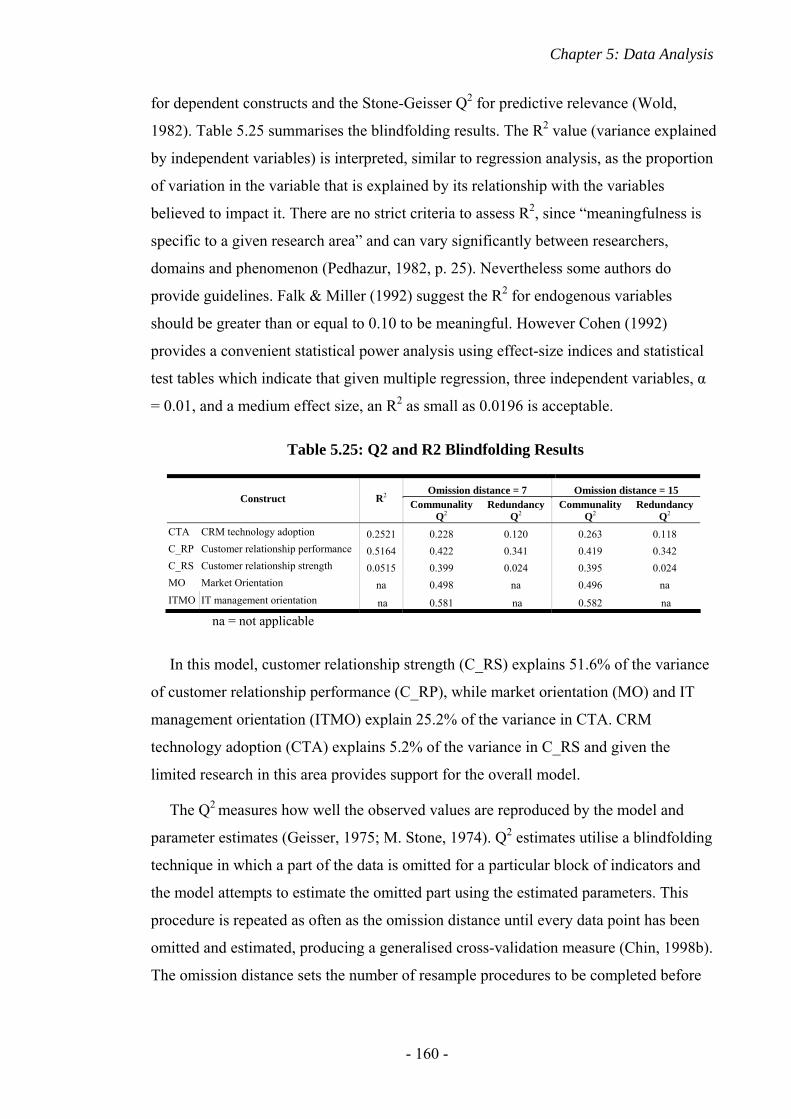
Chapter 5: Data Analysis
- 160 -
for dependent constructs and the Stone-Geisser Q2 for predictive relevance (Wold,
1982). Table 5.25 summarises the blindfolding results. The R2 value (variance explained
by independent variables) is interpreted, similar to regression analysis, as the proportion
of variation in the variable that is explained by its relationship with the variables
believed to impact it. There are no strict criteria to assess R2, since “meaningfulness is
specific to a given research area” and can vary significantly between researchers,
domains and phenomenon (Pedhazur, 1982, p. 25). Nevertheless some authors do
provide guidelines. Falk & Miller (1992) suggest the R2 for endogenous variables
should be greater than or equal to 0.10 to be meaningful. However Cohen (1992)
provides a convenient statistical power analysis using effect-size indices and statistical
test tables which indicate that given multiple regression, three independent variables, α
= 0.01, and a medium effect size, an R2 as small as 0.0196 is acceptable.
In this model, customer relationship strength (C_RS) explains 51.6% of the variance
of customer relationship performance (C_RP), while market orientation (MO) and IT
management orientation (ITMO) explain 25.2% of the variance in CTA. CRM
technology adoption (CTA) explains 5.2% of the variance in C_RS and given the
limited research in this area provides support for the overall model.
The Q2 measures how well the observed values are reproduced by the model and
parameter estimates (Geisser, 1975; M. Stone, 1974). Q2 estimates utilise a blindfolding
technique in which a part of the data is omitted for a particular block of indicators and
the model attempts to estimate the omitted part using the estimated parameters. This
procedure is repeated as often as the omission distance until every data point has been
omitted and estimated, producing a generalised cross-validation measure (Chin, 1998b).
The omission distance sets the number of resample procedures to be completed before
Table 5.25: Q2 and R2 Blindfolding Results
Omission distance = 7 Omission distance = 15 Construct R2 Communality
Q2 Redundancy
Q2 Communality
Q2 Redundancy
Q2 CTA CRM technology adoption 0.2521 0.228 0.120 0.263 0.118 C_RP Customer relationship performance 0.5164 0.422 0.341 0.419 0.342 C_RS Customer relationship strength 0.0515 0.399 0.024 0.395 0.024 MO Market Orientation na 0.498 na 0.496 na ITMO IT management orientation na 0.581 na 0.582 na
na = not applicable
Chapter 5: Data Analysis
- 161 -
the jackknifed estimates of mean, standard deviation and standard error are calculated
(Fornell & Cha, 1994; Sambamurthy & Chin, 1994).
There are two types of predictive relevance (Q2) estimates. The cross-validated
communality Q2 is produced by predicting the omitted data points through the
underlying latent variable. That is, some data points from cases and items of a construct
are omitted, and the remaining items are used to estimate a PLS model. This PLS
model, with the omitted data, is then used to estimate the omitted data points.
The redundancy Q2, on the other hand, tests how well antecedent constructs predict
the omitted data. Of the two Q2 measures, the redundancy Q2 is the stronger test of the
theoretical model to predict missing data at the item level. The estimation is repeated for
all cases yielding an overall Q2 measure of redundancy index, without a loss of degrees
of freedom (Fornell & Bookstein, 1982). In either case an estimate larger than zero (0)
indicates the model has predictive relevance, whereas a Q2 less than zero (0) implies a
lack of predictive relevance in the model (Fornell & Cha, 1994). As can be seen from
Table 5.25 the Q2 results are positive and similar across omission distances, indicating
predictive relevance and stable model estimates.
To summarise, the CTA – CR model has been evaluated and validated through a
number of processes. First, exploratory and confirmatory factor analysis were conducted
to determine the appropriate construct measures. The final measurement item’s loadings
on the appropriate constructs were assessed based on minimum loading criteria of 0.60
(Hulland, 1999). Convergent validity was demonstrated using both Cronbach’s alpha
and the composite reliability measure (Fornell & Larcker, 1981). Discriminant validity
was satisfactorily demonstrated using the AVE approach (Fornell & Larcker, 1981).
The theoretical relationships between the constructs were evaluated by examining the
weightings and significance of the path coefficients in the structural model using t-tests.
The model was respecified, in an attempt to provide an improved and more
parsimonious fit to the data. The revised model demonstrated satisfactory fit from the
variance explained (R2) and predictive relevance (Q2) measures. The structural model
results, from the revised model, are now discussed further.
5.8.3. Direct Effects
In the original model only two of the hypothesised paths, C_RS C_RP and MO
CTA, are significant at the 99.9% CI level, while ITMO CTA is significant only at
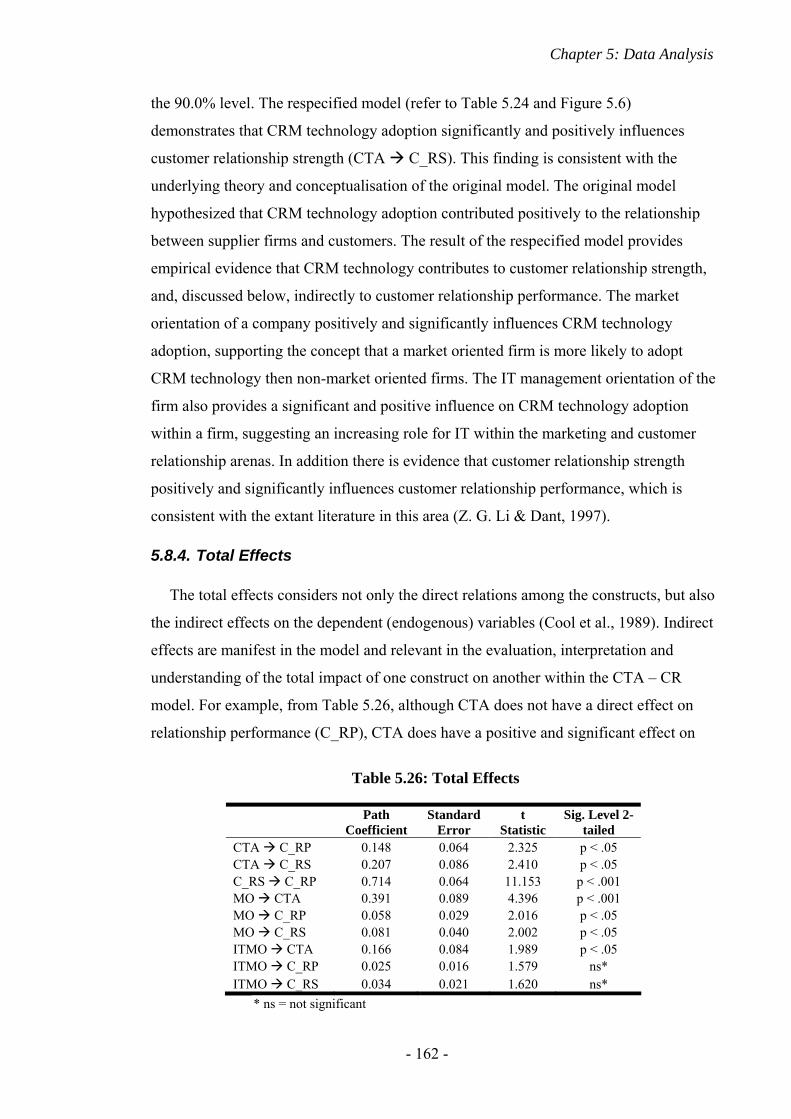
Chapter 5: Data Analysis
- 162 -
the 90.0% level. The respecified model (refer to Table 5.24 and Figure 5.6)
demonstrates that CRM technology adoption significantly and positively influences
customer relationship strength (CTA C_RS). This finding is consistent with the
underlying theory and conceptualisation of the original model. The original model
hypothesized that CRM technology adoption contributed positively to the relationship
between supplier firms and customers. The result of the respecified model provides
empirical evidence that CRM technology contributes to customer relationship strength,
and, discussed below, indirectly to customer relationship performance. The market
orientation of a company positively and significantly influences CRM technology
adoption, supporting the concept that a market oriented firm is more likely to adopt
CRM technology then non-market oriented firms. The IT management orientation of the
firm also provides a significant and positive influence on CRM technology adoption
within a firm, suggesting an increasing role for IT within the marketing and customer
relationship arenas. In addition there is evidence that customer relationship strength
positively and significantly influences customer relationship performance, which is
consistent with the extant literature in this area (Z. G. Li & Dant, 1997).
5.8.4. Total Effects
The total effects considers not only the direct relations among the constructs, but also
the indirect effects on the dependent (endogenous) variables (Cool et al., 1989). Indirect
effects are manifest in the model and relevant in the evaluation, interpretation and
understanding of the total impact of one construct on another within the CTA – CR
model. For example, from Table 5.26, although CTA does not have a direct effect on
relationship performance (C_RP), CTA does have a positive and significant effect on
Table 5.26: Total Effects
Path
Coefficient Standard
Error t
Statistic Sig. Level 2-
tailed CTA C_RP 0.148 0.064 2.325 p < .05 CTA C_RS 0.207 0.086 2.410 p < .05 C_RS C_RP 0.714 0.064 11.153 p < .001 MO CTA 0.391 0.089 4.396 p < .001 MO C_RP 0.058 0.029 2.016 p < .05 MO C_RS 0.081 0.040 2.002 p < .05 ITMO CTA 0.166 0.084 1.989 p < .05 ITMO C_RP 0.025 0.016 1.579 ns* ITMO C_RS 0.034 0.021 1.620 ns*
* ns = not significant
Chapter 5: Data Analysis
- 163 -
C_RP through relationship strength (C_RS), (t = 2.325, p < .05). Similarly market
orientation (MO) has a positive and significant effect on C_RP (t = 2.016, p < .05), and
C_RS (t = 2.002, p < .05), through CTA, whereas IT management orientation (ITMO)
does not directly or indirectly influence C_RP or C_RS (t = not significant).
The results from the total effects analysis demonstrate that CRM technology
adoption does positively and significantly influence customer relationship performance,
but only through customer relationship strength (CTA C_RP). The results also show
that market orientation positively and significantly influences customer relationship
strength and customer relationship performance through CRM technology adoption.
That market orientation influences RS and RP through CTA is interesting and may shed
some light on the reasons for perceived CRM technology implementation failures.
These results also provide empirical support for recent literature arguing that successful
CRM technology adoption is more likely with a market oriented firm (Abbott et al.,
2001; J.-S. Chen & Ching, 2004; Goodhue et al., 2002; Ling & Yen, 2001; Rigby,
Reichheld, & Schefter, 2002b).
5.8.5. Moderator Effects
Technology turbulence (STT) and market turbulence (SMT) were originally
considered potential moderators of CRM technology adoption; however neither
moderator resulted in any significant interactions within the model. Similarly the
customer relationship orientation (CRO) and customer CRM expectations (CXP)
moderators did not significantly influence customer relationship strength or
performance. These results imply that the supplier’s perceived level of technology
turbulence and market turbulence does not play a significant role in the effect of the
model antecedents to adoption of CRM technology. In addition the customer’s
perceptions of relationship strength and relationship performance are not dependent on
the relationship predisposition of the customer, nor their CRM expectations.
5.9. Hypothesis Testing
Although hypotheses cannot definitively be proved as true, hypotheses are
statistically accepted or rejected based on levels of significance and confidence
intervals. Therefore, to ‘accept’ the hypothesis simply means that there is not sufficient
statistical evidence to actually reject the hypotheses. In this study the test results were
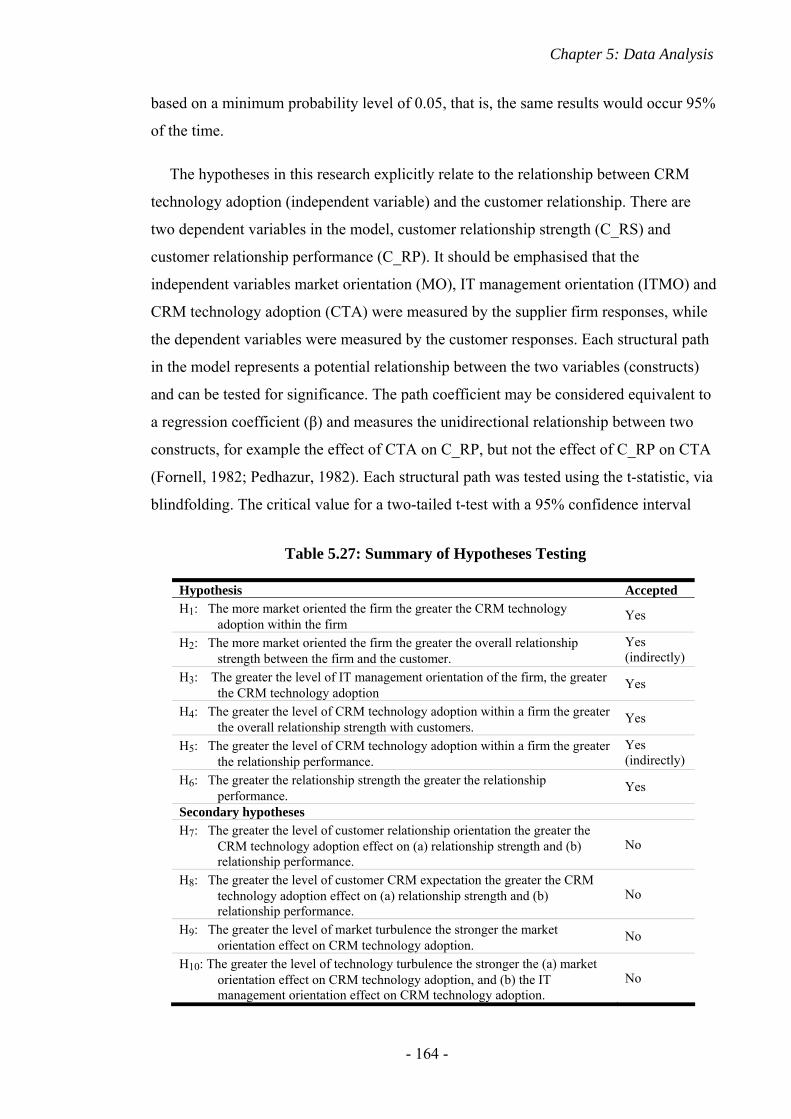
Chapter 5: Data Analysis
- 164 -
based on a minimum probability level of 0.05, that is, the same results would occur 95%
of the time.
The hypotheses in this research explicitly relate to the relationship between CRM
technology adoption (independent variable) and the customer relationship. There are
two dependent variables in the model, customer relationship strength (C_RS) and
customer relationship performance (C_RP). It should be emphasised that the
independent variables market orientation (MO), IT management orientation (ITMO) and
CRM technology adoption (CTA) were measured by the supplier firm responses, while
the dependent variables were measured by the customer responses. Each structural path
in the model represents a potential relationship between the two variables (constructs)
and can be tested for significance. The path coefficient may be considered equivalent to
a regression coefficient (β) and measures the unidirectional relationship between two
constructs, for example the effect of CTA on C_RP, but not the effect of C_RP on CTA
(Fornell, 1982; Pedhazur, 1982). Each structural path was tested using the t-statistic, via
blindfolding. The critical value for a two-tailed t-test with a 95% confidence interval
Table 5.27: Summary of Hypotheses Testing
Hypothesis Accepted H1: The more market oriented the firm the greater the CRM technology
adoption within the firm Yes
H2: The more market oriented the firm the greater the overall relationship strength between the firm and the customer.
Yes (indirectly)
H3: The greater the level of IT management orientation of the firm, the greater the CRM technology adoption
Yes
H4: The greater the level of CRM technology adoption within a firm the greater the overall relationship strength with customers.
Yes
H5: The greater the level of CRM technology adoption within a firm the greater the relationship performance.
Yes (indirectly)
H6: The greater the relationship strength the greater the relationship performance.
Yes
Secondary hypotheses H7: The greater the level of customer relationship orientation the greater the
CRM technology adoption effect on (a) relationship strength and (b) relationship performance.
No
H8: The greater the level of customer CRM expectation the greater the CRM technology adoption effect on (a) relationship strength and (b) relationship performance.
No
H9: The greater the level of market turbulence the stronger the market orientation effect on CRM technology adoption.
No
H10: The greater the level of technology turbulence the stronger the (a) market orientation effect on CRM technology adoption, and (b) the IT management orientation effect on CRM technology adoption.
No
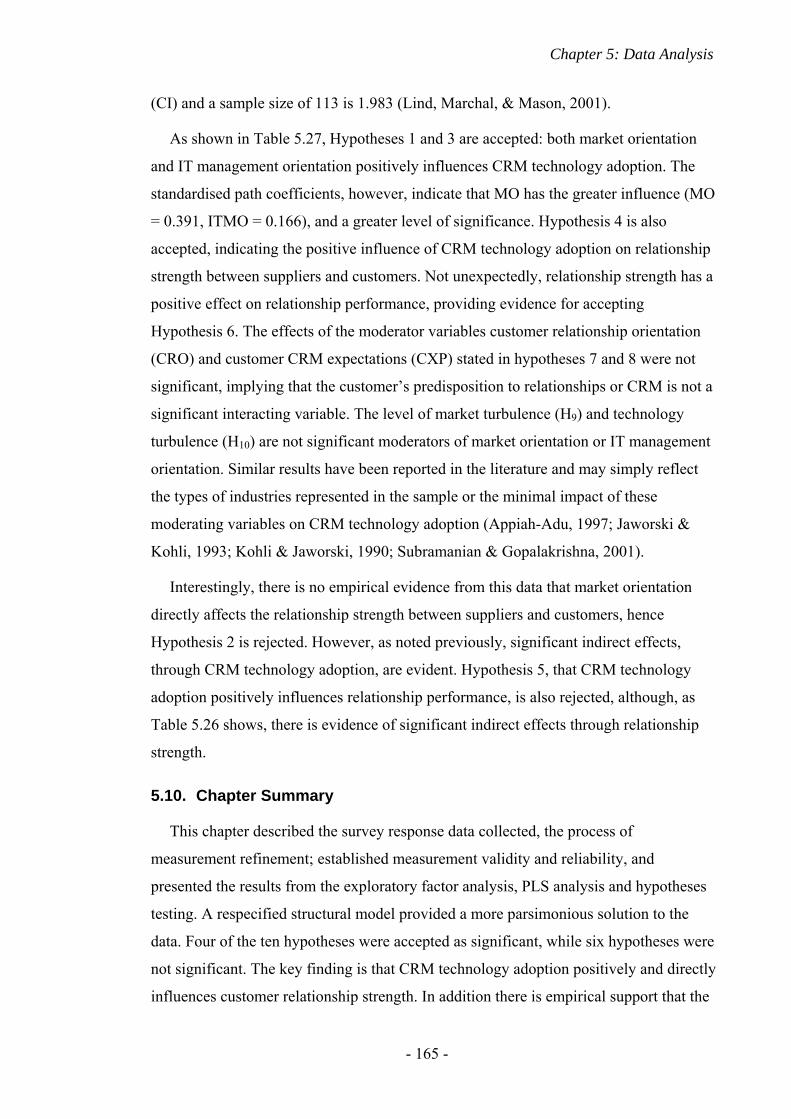
Chapter 5: Data Analysis
- 165 -
(CI) and a sample size of 113 is 1.983 (Lind, Marchal, & Mason, 2001).
As shown in Table 5.27, Hypotheses 1 and 3 are accepted: both market orientation
and IT management orientation positively influences CRM technology adoption. The
standardised path coefficients, however, indicate that MO has the greater influence (MO
= 0.391, ITMO = 0.166), and a greater level of significance. Hypothesis 4 is also
accepted, indicating the positive influence of CRM technology adoption on relationship
strength between suppliers and customers. Not unexpectedly, relationship strength has a
positive effect on relationship performance, providing evidence for accepting
Hypothesis 6. The effects of the moderator variables customer relationship orientation
(CRO) and customer CRM expectations (CXP) stated in hypotheses 7 and 8 were not
significant, implying that the customer’s predisposition to relationships or CRM is not a
significant interacting variable. The level of market turbulence (H9) and technology
turbulence (H10) are not significant moderators of market orientation or IT management
orientation. Similar results have been reported in the literature and may simply reflect
the types of industries represented in the sample or the minimal impact of these
moderating variables on CRM technology adoption (Appiah-Adu, 1997; Jaworski &
Kohli, 1993; Kohli & Jaworski, 1990; Subramanian & Gopalakrishna, 2001).
Interestingly, there is no empirical evidence from this data that market orientation
directly affects the relationship strength between suppliers and customers, hence
Hypothesis 2 is rejected. However, as noted previously, significant indirect effects,
through CRM technology adoption, are evident. Hypothesis 5, that CRM technology
adoption positively influences relationship performance, is also rejected, although, as
Table 5.26 shows, there is evidence of significant indirect effects through relationship
strength.
5.10. Chapter Summary
This chapter described the survey response data collected, the process of
measurement refinement; established measurement validity and reliability, and
presented the results from the exploratory factor analysis, PLS analysis and hypotheses
testing. A respecified structural model provided a more parsimonious solution to the
data. Four of the ten hypotheses were accepted as significant, while six hypotheses were
not significant. The key finding is that CRM technology adoption positively and directly
influences customer relationship strength. In addition there is empirical support that the
Chapter 5: Data Analysis
- 166 -
market orientation of a firm works through CRM technology to positively influence
customer relationship strength and relationship performance.
Although the direct effect of the firm’s market orientation on relationship strength
(H2) is not significant, there is a significant indirect effect through CTA. The effect of
market orientation on business performance has been difficult to establish directly (Han,
Kim, & Srivastava, 1998; Narver & Slater, 1990), however one characteristic of market
orientation is the collection and dissemination of customer and competitor information
(Slater & Narver, 1995). CRM technology may provide an appropriate medium from
which to collect and disseminate such information. The second hypothesis not supported
is that CRM technology adoption would positively affect relationship performance (H5).
Previous studies have shown CRM technology to positively affect customer satisfaction
(Srinivasan & Moorman, 2005) and retention (Jayachandran et al., 2005), both are
components of the relationship performance construct used in this study.
Notwithstanding the non-significant direct effect, there is evidence of a significant
indirect effect of CRM technology adoption on relationship performance through
relationship strength. This indirect result provides a level of support for the positive
effect of CRM technology adoption on relationship performance, consistent with the
extant literature. Chapter 6 will discuss the implications of the results for practitioners
and academics, and the contribution to the marketing and IT literatures.
- 167 -
CHAPTER 6. Discussion and Conclusions
6.1. Introduction
The primary objectives of the study were to determine the effect of CRM technology
adoption on business-to-business relationships, and the impact of market orientation and
technology orientation on that adoption. To this end the research drew upon the
management, IT and marketing literatures from which a preliminary research model was
conceptualised. The model was then refined and tested through a two-stage, cross-
sectional research design, involving an exploratory, qualitative phase to inform the
explanatory, quantitative approach. The exploratory phase, involving in-depth
interviews with key informants from medium and large New Zealand businesses, helped
refine and validate the conceptual model. Insights gained from these interviews were
used to confirm and adjust the hypotheses, and informed the scale development for the
explanatory phase. A mail survey was conducted using a dyadic approach, matching
supplier and customer responses, with medium and large New Zealand businesses
across a number and variety of industry sectors. The results of the nationwide survey
were analysed using Partial Least Squares.
The purpose of this chapter is to discuss and draw conclusions from the results of the
research. The central objective of this research was to develop and test an integrated
conceptual model in order to understand the effect of CRM technology adoption on
customer relationships. The study sought to extend previous research in the marketing
and information technology areas by investigating the impact of market orientation
(MO) and IT management orientation (ITMO) factors on CRM technology adoption
(CTA), and the subsequent impact of these factors on customer relationship strength
(C_RS) and relationship performance (C_RP). Two key findings are evident from the
research results. The first is that market orientation works through CTA to influence and
predict relationship strength and relationship performance. The second finding is that
the extent of CRM technology adoption within a firm can help predict relationship
strength.
6.2. Effect of CRM Antecedents
The results of this study clearly indicate that between the two antecedents, market
orientation and IT management orientation, market orientation is the more important
Chapter 6: Discussion and Conclusions
- 168 -
factor predicting CRM technology adoption within a firm. The market orientation of a
firm positively influences employee adoption of CRM technology within the firm. This
finding provides empirical evidence for the CRM literature where market orientation
has been conceptualised as a factor contributing to the success of CRM technology
implementation (Ling & Yen, 2001; Lloyd et al., 2001; Wright et al., 2002).
6.2.1. Market Orientation
With respect to H1: The greater the level of market orientation of the firm the greater
the CRM technology adoption within the firm, the data demonstrate that market
orientation significantly and positively impacts CRM technology adoption. That is, the
greater the market orientation levels of the firm the greater the adoption of CRM
technology. This result supports the view that market oriented firms, and their
employees, are more likely to recognise and adopt the inherent market orientation
advantages of CRM technology: (a) intelligence generation, (b) intelligence
dissemination, and (c) responsiveness within the CRM technology framework (Kohli et
al., 1993). The implication is that firms with little market orientation may not realise the
full relationship value from the implementation of a CRM system. The finding
underscores the importance of market orientation as a key factor in the successful
implementation and adoption of CRM technology. In addition it shows that CRM
technology adoption by a firm can provide value to customer relationships and that
through the correct use of CRM technology customer relationships can be enhanced.
Of particular interest is the finding that market orientation influences and predicts
relationship strength and relationship performance through CRM technology adoption
(CTA). H2: The greater the level of market orientation of the firm the greater the
overall relationship strength between the firm and the customer hypothesised, based on
the extant literature, that the firm’s market orientation would directly influence
relationship strength with the customer (Farrelly & Quester, 2003; Helfert et al., 2002;
Sanzo et al., 2003; Yau et al., 2000). However, no significant direct relationship was
found between market orientation of the supplier firm and customer relationship
strength. This result supports studies where market orientation is not considered an
accurate predictor of performance (Deshpandé et al., 1993; S. Henderson, 1998).
Jayachandran, Sharma, Kaufman and Raman (2005) reported similar results between a
firm’s customer orientation and their relational information processes. One
interpretation is that for the market orientation of a firm to manifest itself the firm
Chapter 6: Discussion and Conclusions
- 169 -
requires a medium which can satisfy the three key characteristics of market orientation:
intelligence generation, intelligence dissemination, and responsiveness as found in
CRM technology. These results support Gummesson’s (2004) view that CRM is simply
the practical application of relationship marketing principles, whereby both the
appropriate orientation and the technical capability are required to enjoy success (Day et
al., 2004).
The influence of market orientation working through CRM technology may help
explain the divergent results from both CRM research and market orientation research.
CRM technology implementation has not always demonstrated positive results or
successful implementation (Arnold, 2002; Davids, 1999; R. Davis, 2002; Nairn, 2002;
O'Brien, 2004; Raman & Pashupati, 2004; Rigby et al., 2002a) and market orientation is
not uniformly viewed as valuable predictor of business performance (Deshpandé et al.,
1993; S. Henderson, 1998; Langerak, 2003; Noble et al., 2002). The current results
indicate that firms with a strong market orientation are more likely to successfully adopt
and use CRM technology to deliver market oriented value to customers (i.e., improved
information, response and communication), thereby improving relationship strength and
performance (i.e., retention, loyalty and customer satisfaction). On the other hand, firms
with weak market orientation are less likely to successfully adopt CRM technology to
deliver customer value and improve customer relationship strength. The implication is
that neither market orientation nor CRM technology is sufficiently valuable alone. It is
the two working in concert that provides the greatest potential value.
From an alternate perspective, a firm with a strong market orientation, but without
any medium (i.e., CRM technology) to collect, generate, or disseminate customer and
competitor information would have difficulty demonstrating and leveraging the value of
that market orientation to customers. As Wright et al (2002, p. 340) state “CRM [is] a
concept that adds value to the meaning of customer orientation.” The evidence from this
study indicates that CRM technology can provide an appropriate medium, as well as
offer a response channel to interact with customers, from which market orientation can
successfully influence relationship strength and relationship performance.
6.2.2. IT Management Orientation
IT management orientation (IT management style and practices) has been
demonstrated to influence the success of CRM technology adoption (Karimi et al.,
Chapter 6: Discussion and Conclusions
- 170 -
2001). The results of testing H3: The greater the level of IT management orientation of
the firm, the greater the CRM technology adoption confirms that IT management
orientation does play a role, albeit limited, in predicting CRM technology adoption
within a firm. The IT management orientation of the firm’s managers can provide a
positive predisposition towards the adoption of CRM technology within the firm.
Emphasising the usefulness and customer knowledge benefits appears to provide the
greatest incentive for users to adopt CRM technology. One interpretation is that
business management which provides and communicates clear IT direction,
organisation, planning and control, aids both the firm’s CRM technology decision
making and subsequent employee adoption. Clearly positioning and communicating the
CRM technology advantage, focusing on improved customer knowledge and CRM
usefulness, improves the users’ perception and adoption of the CRM technology. Users
are more likely to adopt CRM technology provided they can appreciate the advantages
(F. D. Davis, 1989; Venkatesh & Davis, 2000; Venkatesh et al., 2003). These results
support and help explain other findings where clear direction and practices from
management positively impact the successful adoption of CRM technology (Karimi et
al., 2001; Ling & Yen, 2001).
However the IT management orientation factor is not as important as the market
orientation of the firm in adding value to the firm and the customer.
6.3. Effects of CTA on Relationship Strength and Relationship Performance
Not only does CRM technology adoption provide a medium for market orientation to
influence relationship strength and relationship performance, CTA also predicts
relationship strength itself. That is, the two dimensions of CTA, customer knowledge
and CRM usefulness provide valuable information and processes to benefit relationship
building through trust and communications. Customer relationship orientation (CRO)
did not appear to moderate the effect of CTA on relationship strength or relationship
performance. Although the exploratory phase indicated that some customers have
expectations from CRM implementation (CXP) (see Appendix A2, Q9), the survey
results indicate that any such expectations do not play a significant role in the
moderation of the CTA effect on relationship strength or relationship performance.
Chapter 6: Discussion and Conclusions
- 171 -
6.3.1. Relationship Strength
Trust is an essential attribute of relationships (Narayandas & Rangan, 2004;
Sirdeshmukh et al., 2002), and is enhanced by two-way communications (E. Anderson
& Weitz, 1989). The positive significant result of testing H4: The greater the level of
CRM technology adoption within a firm the greater the overall relationship strength
with customers provides further support for the prevailing view that trust and
communication are necessary for strong relationships between suppliers and customers
(Berry, 1995; Duncan & Moriarty, 1998; Dwyer et al., 1987; Fontenot & Wilson, 1997;
Geyskens et al., 1998). An interpretation of this result is that, independent of the firm’s
market orientation, CRM technology provides a platform from which to collect and
communicate relevant information between suppliers and customers, thus helping to
build trust between the two parties. CRM technology applications collect customer data
from multiple sources and can provide a complete view of the customer. The customer
knowledge (CKN) and CRM usefulness (USF) dimensions provide a significant
conceptual and tangible linkage between CTA and relationship strength. In particular,
this aspect of CRM technology provides the capability for supplier – customer
interaction consistency, relevancy and appropriateness (Zablah et al., 2004).
Reinartz, Krafft, and Hoyer (2004) recognized that consistency in the CRM process
aids the identification and measurement of valuable customers. Consistency in actions
and information can build and enhance levels of trust and relationship strength more
generally (Pan & Lee, 2003; Rheault & Sheridan, 2002). Relevancy is an aspect of
communication which is favoured by customers (Ansari & Mela, 2003; Postma &
Brokke, 2002; Thorbjornsen, Supphellen, Nysveen, & Pedersen, 2002). The right mix of
communications can help develop and maintain trust in a relationship (MacDonald &
Smith, 2004). Contractual, goodwill and competence trust is enhanced by a firm’s
knowledge, appropriate behaviour and communications; knowing what is required,
delivering to the contract, and informing the customer accurately, credibly and
completely is a fundamental requirement and basis of trust (Sako, 1992; Tellefsena &
Thomas, 2005).
This means that CRM application developers, CRM system implementers and CRM
users need to highlight and make use of the fact that CRM technology can help provide
appropriate levels of relevance and consistency to relationships. CRM technology is a
powerful medium for collecting, analysing and communicating relevant and useful
Chapter 6: Discussion and Conclusions
- 172 -
customer information. Through the consistent, relevant and appropriate use of customer
knowledge relationships can be developed and improved.
6.3.2. Relationship Performance
Performance has multiple definitions, evidences considerable multidimensionality
and is itself influenced by a number of external factors (Dess & Robinson, 1984;
Venkatraman & Ramanujam, 1986). Therefore it is not completely surprising that H5:
The greater the level of CRM technology adoption within a firm the greater the
relationship performance was not supported and that CTA did not significantly
influence relationship performance directly. Reinartz et al. (2004) for example found
that the level of CRM technology did not significantly improve economic performance
through the CRM process. The results from this study demonstrate however that CTA
does work through relationship strength to positively influence relationship
performance. This is most likely due to the impact of trust and communication on the
relationship satisfaction, loyalty and retention dimensions of relationship performance
(Garbarino & Johnson, 1999; Moorman et al., 1993; Morgan & Hunt, 1994; Selnes,
1998). CRM technology provides the basis for interaction consistency, relevancy and
appropriateness of behaviour and communication. Data from the exploratory interviews,
particularly the customer perspective, lend weight to the interpretation that the CRM
technology adds value to relationship strength and relationship performance by
incorporating and enhancing not only trust building and communications functionality,
but more importantly dependability and consistency (see Appendix A2, Q14, Q16, Q17
and Q22). It is the dependability (goodwill trust) dimension which contributes a higher
level of relationship satisfaction, hence improved customer retention and loyalty
(Bhattacherjee, 2002; Gounaris, 2005; Sako, 1992; Tellefsena & Thomas, 2005).
That H6: The greater the level of relationship strength the greater the relationship
performance was found to be significant is consistent with other studies and provides
support for developing trust, commitment and strong communication channels in order
to improve business and relationship performance (Z. G. Li & Dant, 1997).
6.3.3. Moderator and Control Factors
Neither of the two moderator variables, customer relationship orientation (CRO) and
customer CRM expectation (CXP), included in the research model had a significant
influence on CRM technology adoption’s impact on relationship trust or relationship
Chapter 6: Discussion and Conclusions
- 173 -
performance. Contrary to existing studies the non-significance of H7: The greater the
level of customer relationship orientation the greater the CRM technology adoption
effect on (a) relationship strength and (b) relationship performance indicates that the
orientation of the customer towards relationships may not be all that important to
maintaining B2B relationships (Ganesan, 1994; Jayachandran et al., 2005; Kapoulas et
al., 2004). This implies that a customer’s predisposition to a supplier relationship does
not materially affect CTA’s impact on the supplier – customer relationship. However,
the raw data were highly skewed (e.g., x̄ = 6.63, SD = 0.82) indicating that the majority
of customers considered themselves relationship oriented and hence this dimension of
relationships needs to be examined more thoroughly in future research (see Appendix
A9.2 for additional detail).
Similarly, the results from testing hypothesis H8: The greater the level of customer
CRM expectation the greater the CRM technology adoption effect on (a) relationship
strength and (b) relationship performance was found to be non-significant. These
results indicate that any pre-formed customer expectations, based on either previous
experience or supplier promises, does not influence CTA’s affect on customer
relationship strength or performance.
Although market turbulence (MT) and technological turbulence (TT) have been
shown to interact significantly with key variables in marketing studies investigating MO
and business performance, this was not the case in this study (e.g., Pelham, 1999;
Pulendran et al., 2003). Hypothesis H9: The greater the level of market turbulence the
stronger the market orientation effect on CRM technology adoption was found to be
non-significant, indicating that MT does not moderate the effect of MO on the adoption
of CTA. This is somewhat counter intuitive; one would expect that high customer churn
or a more volatile and competitive environment would positively influence the effect of
MO on the adoption of business practices aimed at reducing customer churn and dealing
with volatility. One interpretation of this result is that firms do not understand the
potential application of CRM technology to add value to business relationships in a
turbulent market environment. On the other hand firms may simply consider a turbulent
market environment as normal.
Neither of the two versions of hypothesis H10: The greater the level of technology
turbulence the stronger the (a) market orientation effect on CRM technology adoption,
and (b) the IT management orientation effect on CRM technology adoption provided

Chapter 6: Discussion and Conclusions
- 174 -
significant results. The lack of technology turbulence, across a variety of industries, to
moderate MO and ITMO suggests the application of new technology itself does little to
influence the general adoption of CRM technology.
6.4. Research Implications and Contributions
The results of the research provide a number of contributions to theory, research and
practice.
6.4.1. Contributions to Theory
The development and empirical testing of the CRM technology adoption – customer
relationship (CTA – CR) model, bringing together the IT and marketing research areas,
is a key contribution of this study. The CTA – CR model establishes clear links between
(a) CRM technology adoption and key relationship marketing components, (b) IT
management orientation and CTA, and (c) market orientation and CTA.
In particular, three findings contribute to theory building in the marketing and IT
domains. First, CRM technology adoption has been demonstrated to positively affect
relationship strength and indirectly affect relationship performance. Jayachandran et al.
(2005) demonstrated that relational information processes positively influenced
customer relationship performance. The current study expands upon those findings and
clearly demonstrates that it is the CRM knowledge management applications and
usefulness aspects of the information that are important to the users of CRM
technology. In addition the present study also provides empirical support to the
Jayachandran et al. qualitative finding that communications (through relationship
strength in the current study) plays an important role influencing relationship
performance. This study shows that knowledge management plays a key role in CRM
technology adoption (Romano & Fjermestad, 2003). This result supports a growing
consensus that KM is a competitive advantage for companies with the ability and
capability to tap into the customer and competitor information, analyse the information,
use it and disseminate the knowledge appropriately throughout the organisation (Bose &
Sugumaran, 2003; Bueren, Schierholz, Kolbe, & Brenner, 2005; H. Lee & Choi, 2003).
Second, and perhaps more importantly, market orientation influences relationship
strength through CRM technology. The results of this study support the view that
market orientation requires a mechanism, such as CRM technology, in order to manifest
Chapter 6: Discussion and Conclusions
- 175 -
itself appropriately (Wright et al., 2002). It may be that one of the underlying reasons
for the mixed results and debate surrounding the impact of market orientation is simply
the lack of an effective mechanism to deliver specific outcomes from a firm’s market
orientation (Gray et al., 1998; Langerak, 2003).
Third, IT management orientation positively influences CRM technology adoption,
although it does not impact relationship strength and relationship performance directly.
Although the results do not completely support Karimi et al. (2001) finding that IT
management practices influence CRM technology adoption and customer service (i.e.,
relationship strength and relationship performance), they do support and extend Karimi
et al.’s original study which was focused only on IT managers in financial services. In
particular the results of the IT Management Orientation scale, successfully administered
to marketing, sales and customer service executives was found to be generalisable, valid
and robust across industries and functional areas. These results provide additional
empirical evidence that IT management practice is a key component in the initial
adoption and success of CRM technology (J. C. Henderson & Venkatraman, 1999; Ling
& Yen, 2001; Ravichandran & Rai, 2000).
In addition, while the importance of determining the CRM technology adoption level
within a firm has been identified, few studies have focused on understanding and
measuring the level of CRM technology adoption by users (Jayachandran et al., 2005;
Reinartz et al., 2004). This study introduces a new scale used to determine the level of
CRM technology adoption within a firm. This scale measures customer knowledge and
CTM usefulness and can be used to predict customer relationship strength and
relationship performance. Previous studies attempting to measure CRM practice have
not always measured technology adoption, emphasising instead strategic readiness (e.g.,
Bull, 2003; Payne & Frow, 2006), organisational preparedness (e.g., Liu, 2007; Sin,
Tse, & Yim, 2005), systems and process (e.g., Bueren et al., 2005; Jayachandran et al.,
2005) or performance benefits (e.g., Ang & Buttle, 2006). However a number of recent
studies have focused on the level of IT or CRM investment and resources (e.g., Reinartz
et al., 2004; Srinivasan & Moorman, 2005), IT architecture (e.g., Stefanou et al., 2003),
and the extent of system integration (e.g., Ling & Yen, 2001; M. Meyer & Kolbe, 2005;
Zeng et al., 2003).
The use of the technology adoption model (TAM) is extended into the CRM and
marketing research context. TAM has been used extensively to explain and analyse
Chapter 6: Discussion and Conclusions
- 176 -
information systems usage behaviour (Venkatesh & Davis, 2000; Venkatesh et al.,
2003), but has not been widely used to investigate CRM usage (cf. Robinson, Marshall,
& Stamps, 2005; Wu & Wu, 2005). In particular the results from this study indicate that
CRM usefulness, and not ease of use or attitude provides clear support for the
applicability, robustness and generalisability of the TAM scales in the CRM technology
context. The underlying TAM theory is that users adopt technology which provides
some distinct and valuable advantage (F. D. Davis et al., 1989). The current study
provides supports that view that implementing new technology and gaining user
acceptance depends first and foremost on the usefulness of the application.
The research adds empirical support for the view that CRM requires a holistic
conceptualisation; that both IT and marketing need to be involved and work together in
order to be successful, and that the firm’s business and market orientation needs to be
relationship marketing focused and properly aligned with the CRM technology
implementation (Mitussis et al., 2006).
6.4.2. Contributions to Methodology
The study reviews methodological issues and obstacles to be considered when
conducting dyadic business relationship research. A CRM technology adoption measure
was developed and verified. A number of scales have been developed attempting to
measure CRM technology from a variety of perspectives. In particular Raman and
Pashupati (2004) have attempted to measure the CRM functionality in use, Stefanou et
al. (2003) considered the level of CRM technology employed, while Reinartz et al.
(2004) developed an instrument to measure the CRM processes utilised within a firm
Sin, Tse and Yim (2005) identified and measured the extent of CRM technology support
available within firms. The CTA scale developed in this study measures two key value
add outcomes of CRM technology adoption. First, from the CRM user’s perspective, the
extent to which CRM technology helps accumulate and provide customer knowledge
(CKN) and second, based on the technology adoption model (TAM), the level of CRM
usefulness (USF) to the user (F. D. Davis, 1989).
The use of PLS within a dyadic business-to-business marketing study including
moderating variables was demonstrated. The use of PLS to test hypotheses within
complex models is still relatively underutilised in marketing. However this multivariate
analysis technique “is ideal for the early stages of theory development” and has been
Chapter 6: Discussion and Conclusions
- 177 -
demonstrated as a useful technique for small samples with non-normal distributions,
such as found in dyadic research (Grégoire & Fisher, 2006, p. 38).
Traditionally the robustness of multivariate analysis techniques using non-normal
data distributions have been demonstrated through Monte Carlo simulation (Hau &
Marsh, 2004; Muthén & Kaplan, 1985; Yanagihara & Yuan, 2005). The current
research provides a case study of the robustness of factor analysis with highly non-
normal (extreme kurtosis and skewness) and transformed data (Rummel, 1970).
The utilisation of the relationship dyad overcomes a key weakness of many previous
studies in CRM; specifically taking the research focus and perspective exclusively from
the CRM user and not explicitly measuring the potential customer impact (e.g.,
Jayachandran et al., 2005; Reinartz et al., 2004). In a related sense insights from both
the qualitative and quantitative research methods were gained that could only be
obtained through the dyadic research model.
6.5. Managerial Implications
Given the uneven CRM technology implementation and adoption success rate, many
companies and practitioners are concerned about the return on investment from CRM
(Brown & Vessey, 2003; Croteau & Li, 2003; Gummesson, 2004; J. W. Kim et al.,
2004; Lemon et al., 2002; Reinartz et al., 2004). This study provides evidence that the
firm’s level of market orientation will impact CRM technology adoption and
relationship marketing outcomes. Providing clear processes for collecting, analysing,
using and communicating customer knowledge is important in building better customer
relationships. Managers need to spend time to ensure CRM users understand the
usefulness of the CRM applications to add value to their jobs as well as the capability of
CRM technology to identify and help meet customer needs. For those firms considering
CRM adoption, it would be prudent to address the level of market orientation within the
firm first. IT management involvement with CRM business decisions at the senior
levels of the organisation benefits the extent of CRM technology adoption within the
firm, although it does not appear to add any relationship marketing value in and of
itself. IT managers need to provide clear communication of IT strategy, effective IT
system integration, and quality IT management based on an understanding of the
strategic direction of the business, and technology in order to positively impact CRM
technology adoption within the firm. People need to understand how CRM technology
Chapter 6: Discussion and Conclusions
- 178 -
will be useful to them in their job and how the CRM system can provide improved
customer information and knowledge. The key message here is to take time
understanding how the CRM technology fits with the organisation’s culture and
business requirements, and how it will add value (Day, 1994; Karimi et al., 2001). IT
management needs to provide and communicate clear and unambiguous implementation
plans, focused on CRM usefulness to customers, users and business requirements. On
the other hand implementing CRM technology, no matter how expensive or feature
laden, will not by itself automatically deliver relationship benefits. CRM technology is
not the silver bullet that can eliminate poor customer relationships, processes or
business culture.
Companies looking to implement CRM technology need therefore to consider a
balanced portfolio of action. This means cultivating and aligning a customer-centric
market orientation, preparing and implementing a comprehensive IT implementation
plan, identifying and implementing process change requirements, and communicating
the expected CRM technology benefits. A balanced approach can provide a synergy
where the whole is more than the sum of the individual parts.
6.5.1. CRM Technology Adoption
CRM technology provides a number of advantages including providing an interactive
and broad-based medium for information collection and dissemination. The results of
this study indicate that users consider the most important dimensions of CRM
technology to be the organisation and provision of customer knowledge (CKN) and the
CRM usefulness (USF) of the technology itself. As indicated from the items found to
measure CKN, it is the customer knowledge gathering and information storage and
retrieval applications that differentiate successful from less successful CRM technology
adoptions. This is consistent with the interview data, which suggests both the suppliers
and the customers perceive that CRM systems and technology provides better customer
history, improved knowledge transfer, and facilitates data collection and data retrieval
(refer to Appendix A2 Q12 and Q13 for additional detail).
The items found to measure USF demonstrate a focus on performance, effectiveness
and productivity improvements. Other measures indicate that the attitude toward, and
acceptance of, CRM technology is a differentiator for adoption. The perspective is again
supported by the interview data, with users indicating that CRM system implementation
Chapter 6: Discussion and Conclusions
- 179 -
should provide better integration with other systems, improved knowledge management,
and increased sales support (refer to Appendix A2, Q12 and Q13 for additional detail).
From both the survey and the interview data it appears that the users are not overly
concerned regarding the specific CRM technology implemented. The responses suggest
that customer information collection applications (e.g., knowledge management) and
perceived data utilisation applications (e.g., information collection and retrieval)
provide the most important advantages. These are deemed to be the applications which
help build and sustain relationships.
6.5.2. CRM Application Development
This research provides some useful additional perspectives for CRM software and
systems developers. CRM technology can genuinely be used to enhance relationships.
In particular, developing applications that combine customer knowledge collection with
trust building and appropriate communication tools benefits both customers and
suppliers. CRM technology adoption influences customer relationship performance only
through customer relationship strength. This implies that mechanisms to support
building customer loyalty, improving relationship satisfaction and retaining customers
should be strengthened through CRM applications. It is the communications and trust-
building features of CRM systems that are most likely to result in performance
improvements. CRM technology software and system developers need to look more
closely at the features of their systems that can reinforce consistency, relevance,
dependability, appropriateness, trust building and communications aspect of CRM.
Enhancements to CRM knowledge management applications can in addition help to
smooth the effects of staff turnover and prevent the loss of corporate knowledge
(Droege & Hoobler, 2003). CRM databases can provide a knowledge repository for
customer information that can bolster the organisation’s ongoing and continuous
relationship effort (Bose & Sugumaran, 2003; Bueren et al., 2005; H. Lee & Choi,
2003).
6.6. Limitations of the Research Study
The present research focused on only a snapshot in time to test the hypothesised
model and provide some general principles. CRM is an evolving process where some of
the identified variables, such as market orientation, or customer satisfaction, would be
Chapter 6: Discussion and Conclusions
- 180 -
expected to change over time and vary across firms. That similar traits were exhibited
across firms provides justification for the current design and hypothesised model. Since
CRM is a dynamic phenomenon a longitudinal design would provide additional benefit;
tracking the implementation and adoption of CRM technology over time could further
test and refine our insights into the relationship between market orientation, CRM
technology adoption and customer relations.
A potential methodological limitation was the small sample size due to the sequential
data collection approach required by the dyadic research. The small sample size makes a
Type II error more likely, that is, the statistical tests employed may fail to detect
significant relationships. The measurement items and relationship constructs are
imperfect; there are additional variables which might have been included in the
measurement of relationship strength and performance. In addition, factors other than
CRM technology are known to affect supplier – customer relationships, such as the
strategic fit between organisations (Selnes & Sallis, 2003), inter-firm power asymmetry
(J. C. Anderson & Narus, 1984; Iacobucci & Ostrom, 1996; Narayandas & Rangan,
2004), cooperation (J. C. Anderson & Narus, 1990) and commitment (Morgan & Hunt,
1994). Expanding the model to include additional relational factors could uncover
additional CRM technology linkages and benefits, as well as provide a better
understanding of CRM technology within a broader relationship context.
The CTA operational measures did not differentiate functionality or the integration
of the actual CRM technology adopted. The result of the exploratory factor analysis
(EFA) indicates that the scales did not adequately measure the functionality and
integration constructs. The CRM scales were newly created for this study, and therefore
there exists opportunity for further measurement refinement. The scope of the present
findings contributes useful insights and the incorporation of additional factors is left for
further research.
6.7. Directions for Further Research
The combination of marketing and information technology provides many
opportunities for research and the results of this study open a number of avenues for
further investigation. Although the results indicate customer relationship orientation
showed no significant moderating effect on CTA, the customer data were highly skewed
towards relationship orientation. Given the positive impact of CRO reported by
Chapter 6: Discussion and Conclusions
- 181 -
(Jayachandran et al., 2005) there is a need to investigate further and better understand
the impact of the customer’s perspective on relationships. The exploratory interview
data, as well as the survey data, indicate customer expectations development and
subsequent consequences is a promising research area, since suppliers adopting CRM
technology, but not achieving (or managing) customer expectations may create
customer dissatisfaction, to the detriment of their CRM implementation and
relationship-building efforts.
The impact of market turbulence and technology turbulence on CRM technology
adoption may be influenced by industry. Identifying and investigating CRM technology
adoption in industries that are more susceptible to market and technology turbulence
(i.e., technology based products and services) would be beneficial in understanding the
potential differential effects of CRM technology adoption and impact between industry
sectors. A portion of the reported CRM failures may simply stem from specific
industries inappropriately implementing CRM technology as a proxy for a customer-
centric business strategy.
A small number of interview participants indicated that customer expectations may
be developed with the awareness that supplier firms have implemented CRM. If so,
there is a danger that customer expectations may not be realised by supplier firms
causing a relationship backlash. Research into this area, including the impact of CRM
implied and explicit promises on relationships, may be a fruitful avenue of study.
Similarly, from the dyadic-based interviews, a number of customers stated that the
supplier firm was not market oriented, contrary to the supplier’s perception. The
inability for firms to accurately self-report their market orientation has been reported in
the literature (S. Henderson, 1998). Therefore there may be some advantage to use the
customer’s perception of the supplier’s market orientation in the CTA – CR model.
Another research approach is to investigate CRM technology adoption and the link to
business performance measures of both the supplier and the customer sides. Is there a
flow-on effect to the customer from a supplier firm adopting CRM? The current
research attempted to provide generalisable results by aggregating a number of different
industries, however, CRM technology adoption and relationship market orientation may
have differential effect based on the type of industry (Yau et al., 2000). In addition firm
size may impact the adoption, functionality and integration of CRM deployed, since
Chapter 6: Discussion and Conclusions
- 182 -
larger companies spend more on information technology than smaller firms (Mahmood
& Mann, 1993; Mitra & Chaya, 1996).
6.8. Conclusion
The research brought together a number of domains and areas of marketing and IT,
including technology adoption, customer relationship management, and relationship
marketing. Market orientation and IT management orientation were considered and
found to be antecedents to CRM technology adoption. A CTA measurement instrument
was developed in order to provide a measure of CTA technology implemented and
adopted by firms. The dependent variables were relationship strength and relationship
performance measured from the customer perspective. The independent variables
consisted of market orientation, IT management orientation and CTA. Data collection
began with ten dyadic (matched supplier – customer) interviews used to inform the
model and scale development. A mail survey, using matched pairs of suppliers and
customer (supplier – customer dyads) provided the data which were analysed using
PLS. The results were interpreted in light of the existing literature and the qualitative
data captured in the exploratory phase of the research.
The results showed that greater CRM technology adoption improves relationship
strength and consequently relationship performance. As expected, the level of IT
management orientation (ITMO) within a firm positively influences CRM technology
adoption. This suggests that companies which embrace IT as part of their business
strategy more successfully adopt and benefit more from CRM technology.
More interestingly however, are the results which indicate that market orientation
works through CTA to positively affect relationship strength, but does not directly
influence relationship strength. This finding suggests that the firm’s market orientation
is leveraged through CRM technology, and that gaining maximum benefits from CRM
technology depends on a firm’s level of market orientation. The results also demonstrate
that CTA can, itself, influence relationship strength and relationship performance
through trust-building and communications functionality.
The outcomes of the research met the objectives set out in Chapter 1, which were to:
• Determine whether CRM technology adoption has a positive effect on
business-to-business relationships and the extent of that impact. The results
Chapter 6: Discussion and Conclusions
- 183 -
of the PLS analysis show that CTA does have a significant and positive effect
on B2B relationships.
• Determine whether the supplier firm’s market orientation and IT
management orientation has a positive effect on CRM technology adoption
and the extent of that impact. The results demonstrate that market orientation
and IT management orientation do significantly and positively influence CRM
technology adoption within a firm.
• Contribute to the current marketing and IT literature on CRM technology
and relationship marketing. This study adds to the growing CRM literature in
the business-to-business context. The results complement a number of recently
published studies and extend the research into new areas, methodologically by
incorporating dyadic research techniques using PLS, and developing a CRM
technology adoption measurement instrument. In addition the data provide
support for the CTA – CR conceptualisation, and the link between CRM
technology and relationship marketing has been empirically demonstrated.
• Inform CRM practitioners engaged in CRM implementation and software
development. The study is of interest to businesses that currently have CRM
systems or are considering CRM technology implementation - sixty-three
supplier respondents requested a summary of the results. The findings benefit
CRM vendors and software developers through an improved understanding
how CRM technology adoption, products and applications affect customer
relationships. This has the potential for improved CRM applications around
B2B relationships.
6.8.1. Closing Remarks
In spite of the mixed reviews and variable levels of reported success regarding its
effectiveness, companies continue to implement CRM and the associated technology in
an attempt to improve business performance (Bohling et al., 2006; Boulding, Staelin,
Ehret, & Johnston, 2005; Reinartz et al., 2004). There is a growing concern that the
classical 4Ps of marketing are no longer sufficient for business success and that
businesses need to focus more on long-term relationships with customers and partners
(Day et al., 2004; Mithas et al., 2005). Companies generally invest in technology to
achieve tangible results and CRM technology has been heralded as a vehicle for
implementing relationship marketing (Jayachandran et al., 2005). This study provides
Chapter 6: Discussion and Conclusions
- 184 -
clear evidence that CRM technology adoption by a firm can significantly and positively
affects customer relationships, thereby improving customer satisfaction, loyalty and
retention. The extent of the effect is dependent on the level of market orientation within
the firm. These findings support the view that a sufficient level of market orientation,
coupled with CRM technology and supported by appropriate IT management positively
affects customer relationship strength and relationship performance. The challenge to
both the businesses implementing CRM technology and the CRM vendors themselves is
properly developing and implementing all the customer facing, knowledge management
and communications components comprehensively in order to gain more than simply
what a ‘sum of the individual parts’ might suggest. This study provides guidance as to
what areas of CRM technology need to be emphasised in order to improve customer
relationships. It also provides insights to CRM vendors regarding application
development areas to assist their customers in implementing successful CRM
technology.
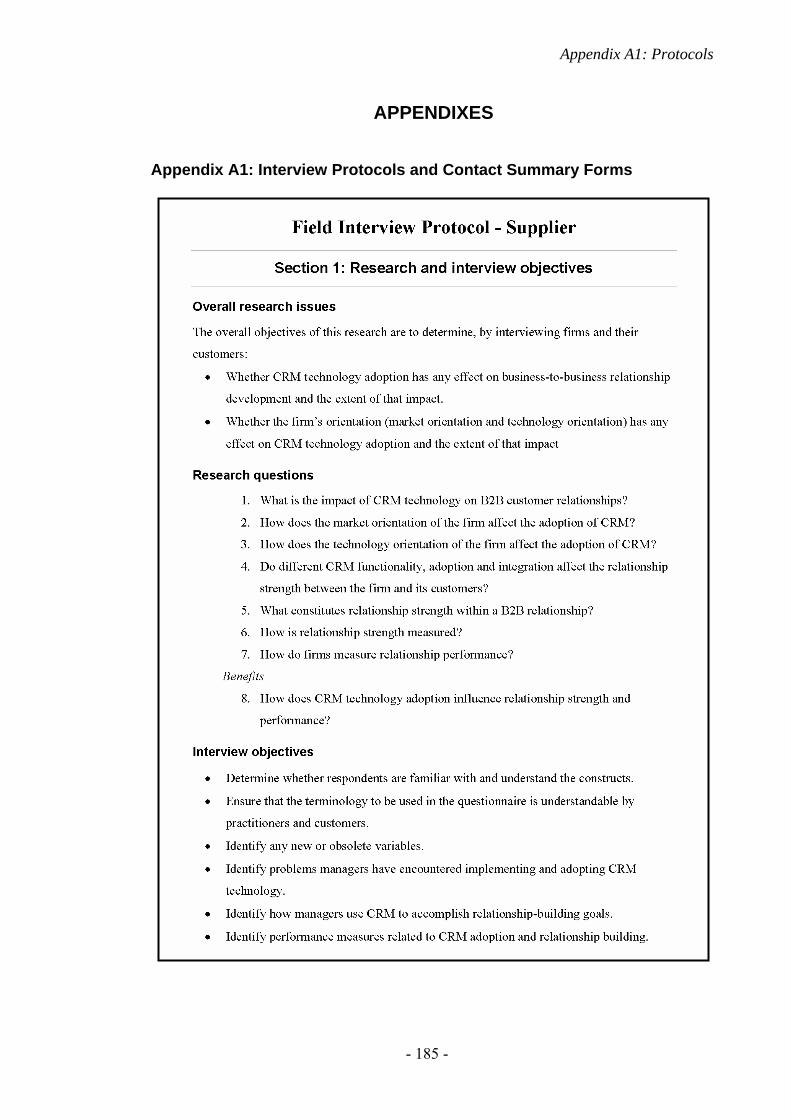
Appendix A1: Protocols
- 185 -
APPENDIXES
Appendix A1: Interview Protocols and Contact Summary Forms
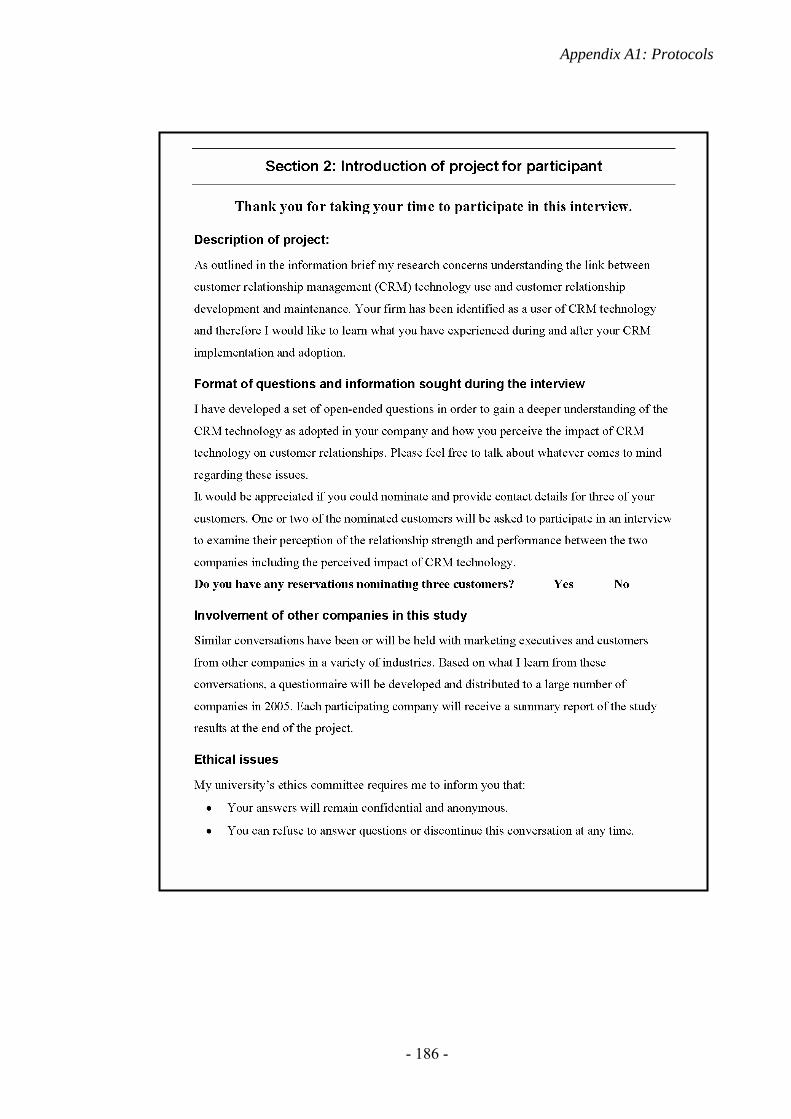
Appendix A1: Protocols
- 186 -
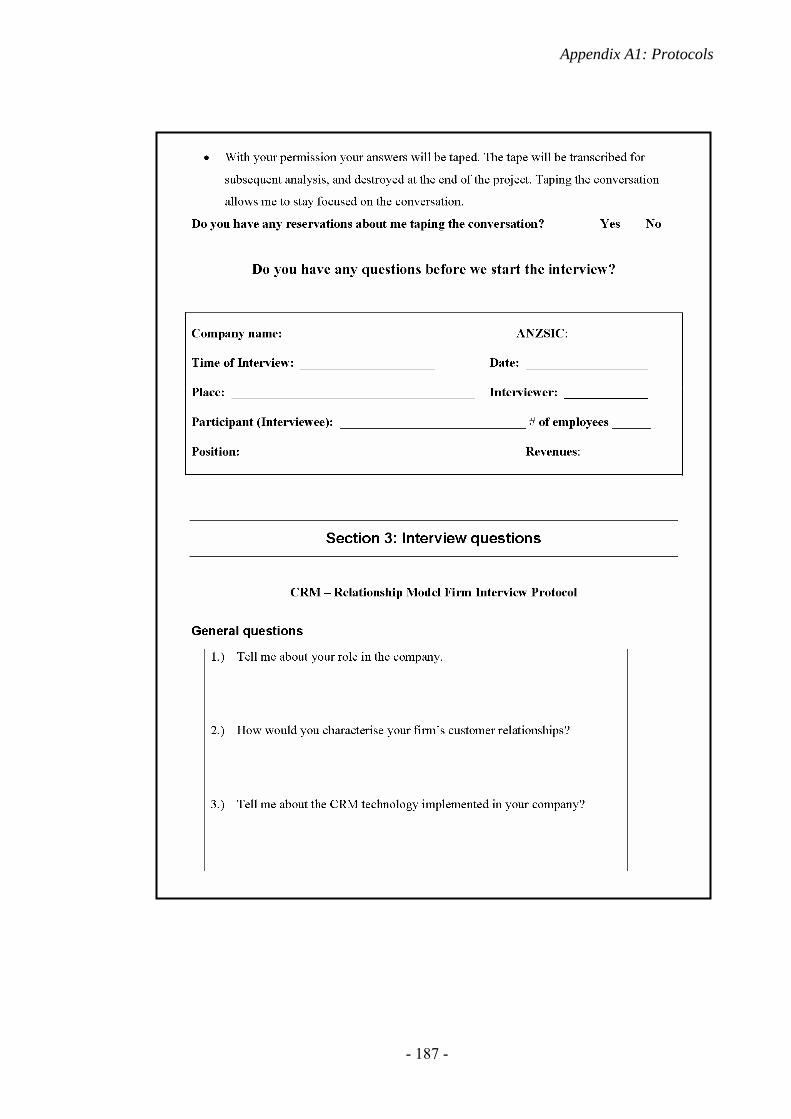
Appendix A1: Protocols
- 187 -
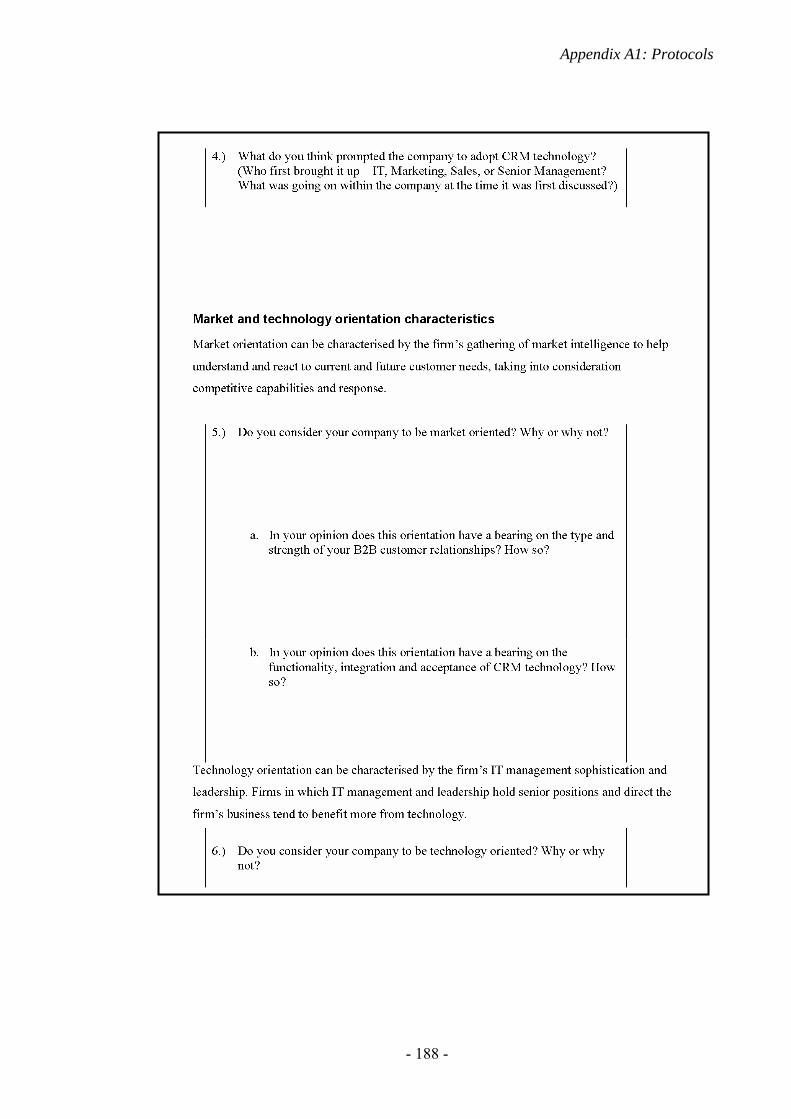
Appendix A1: Protocols
- 188 -
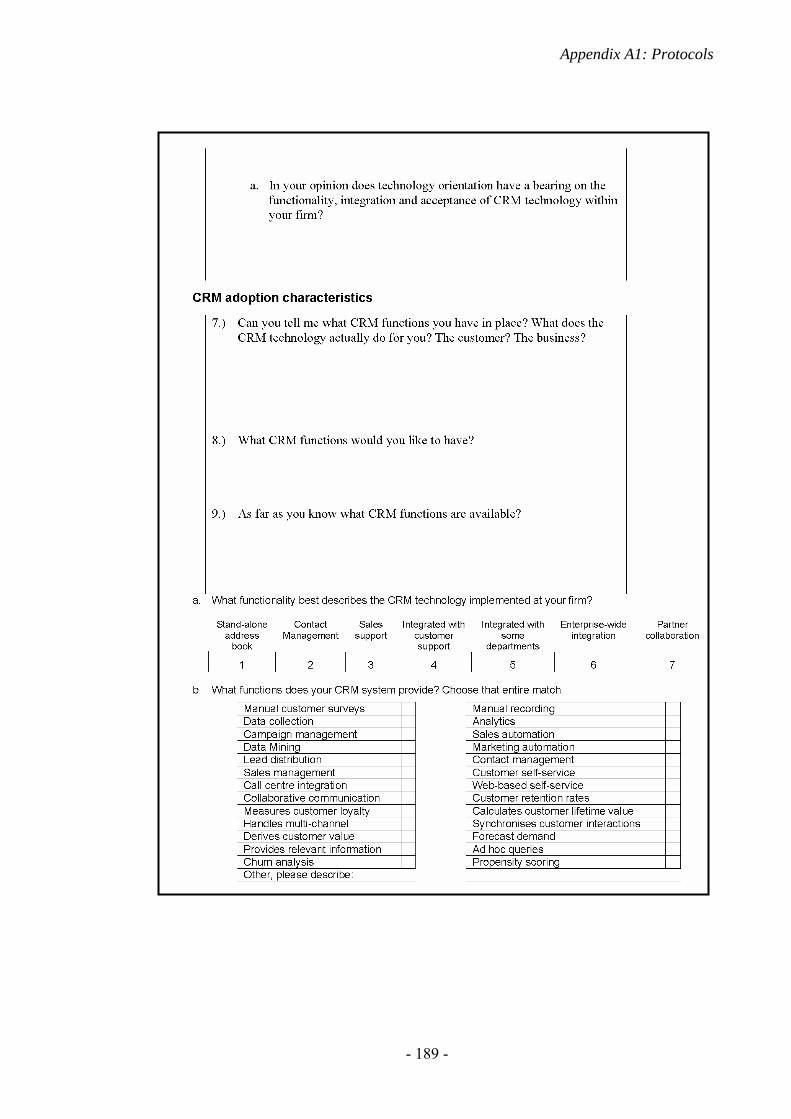
Appendix A1: Protocols
- 189 -
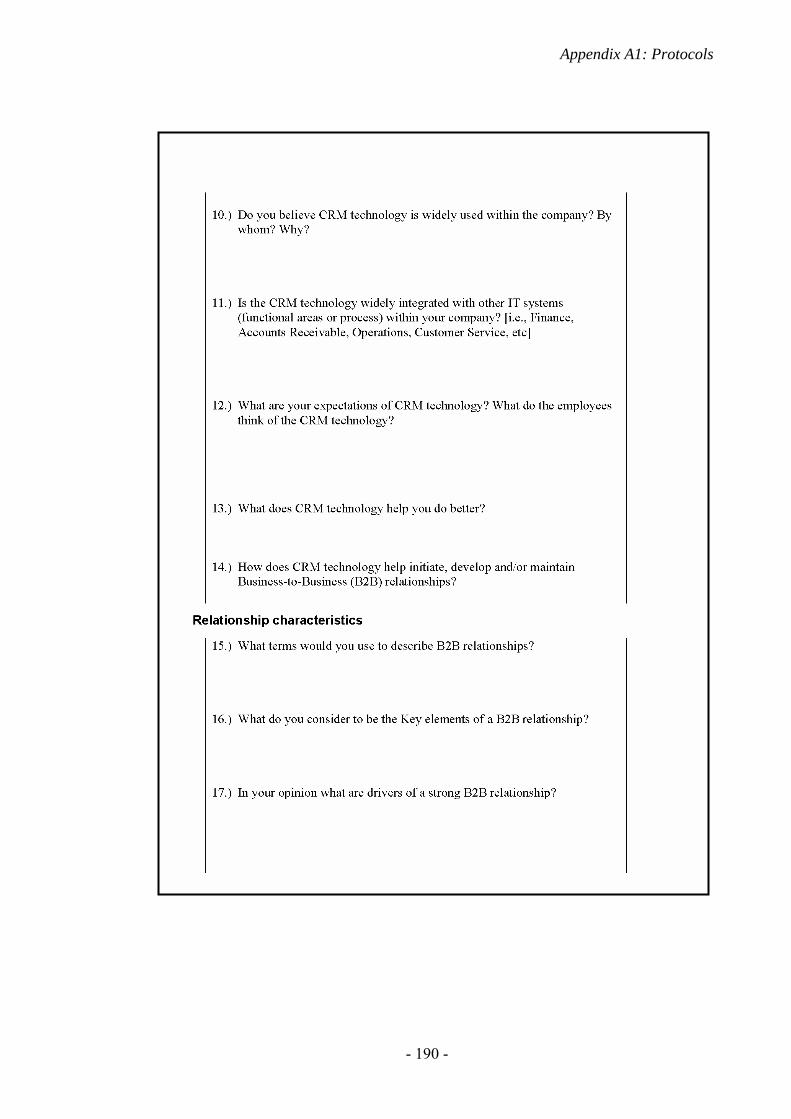
Appendix A1: Protocols
- 190 -
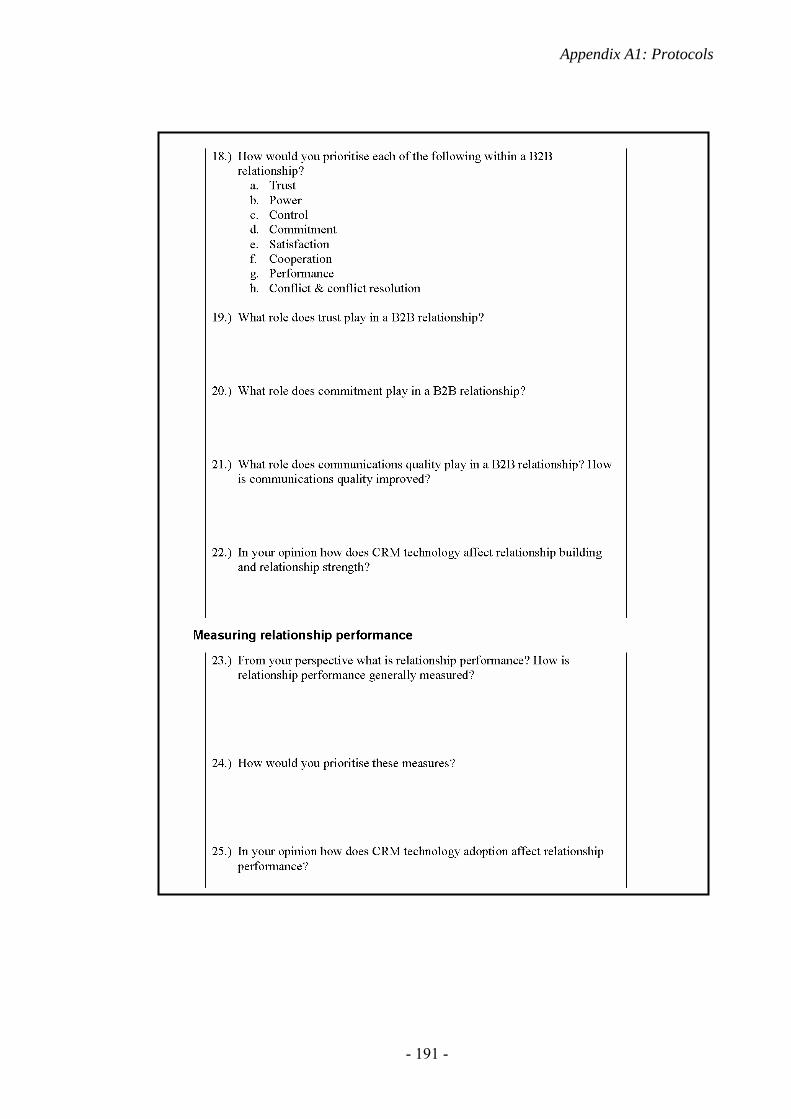
Appendix A1: Protocols
- 191 -
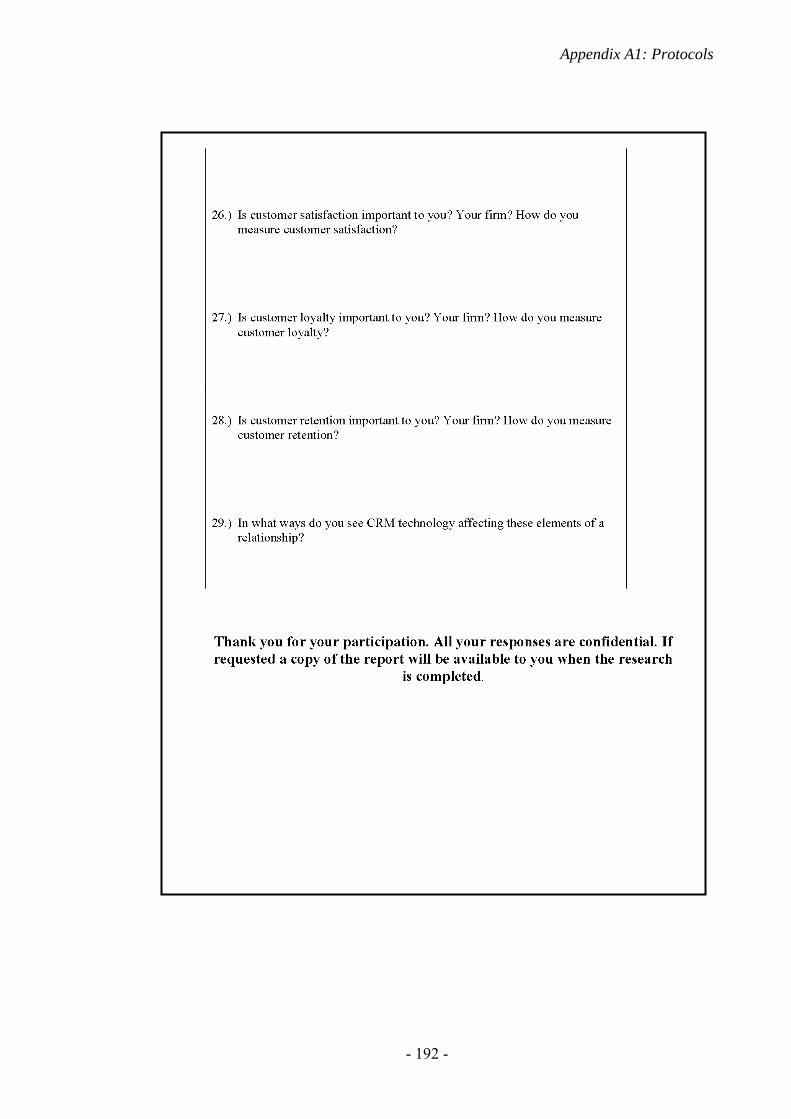
Appendix A1: Protocols
- 192 -
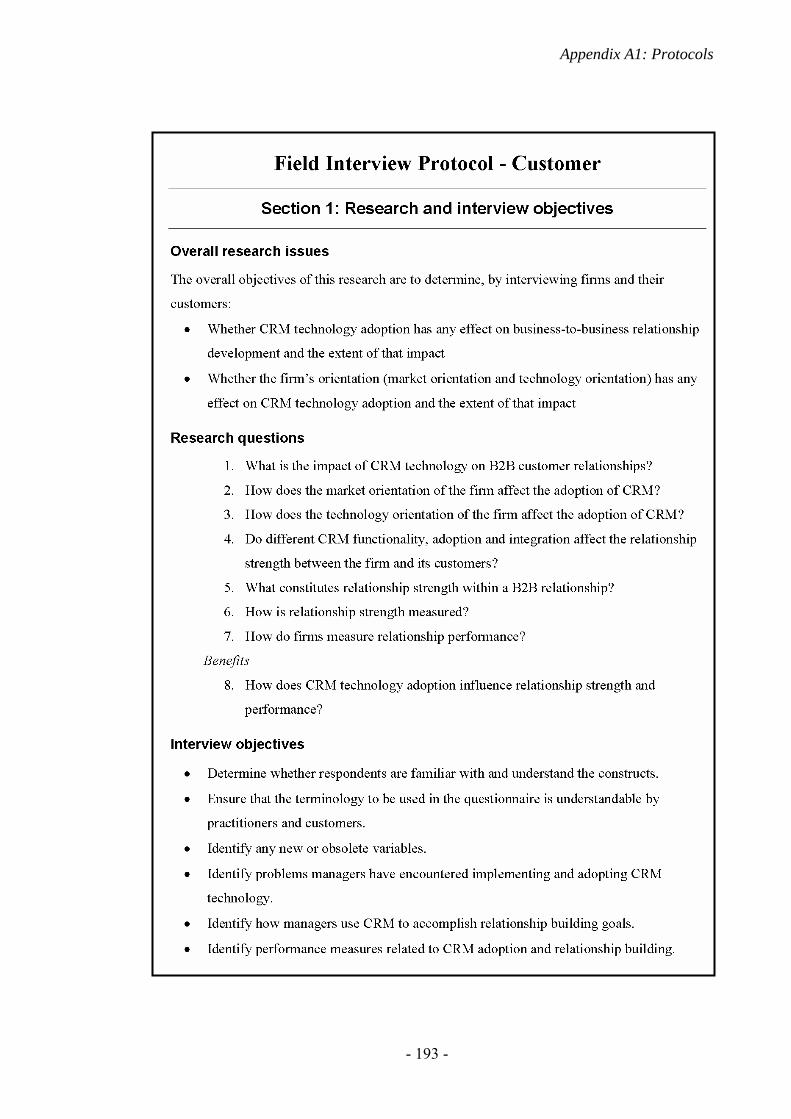
Appendix A1: Protocols
- 193 -
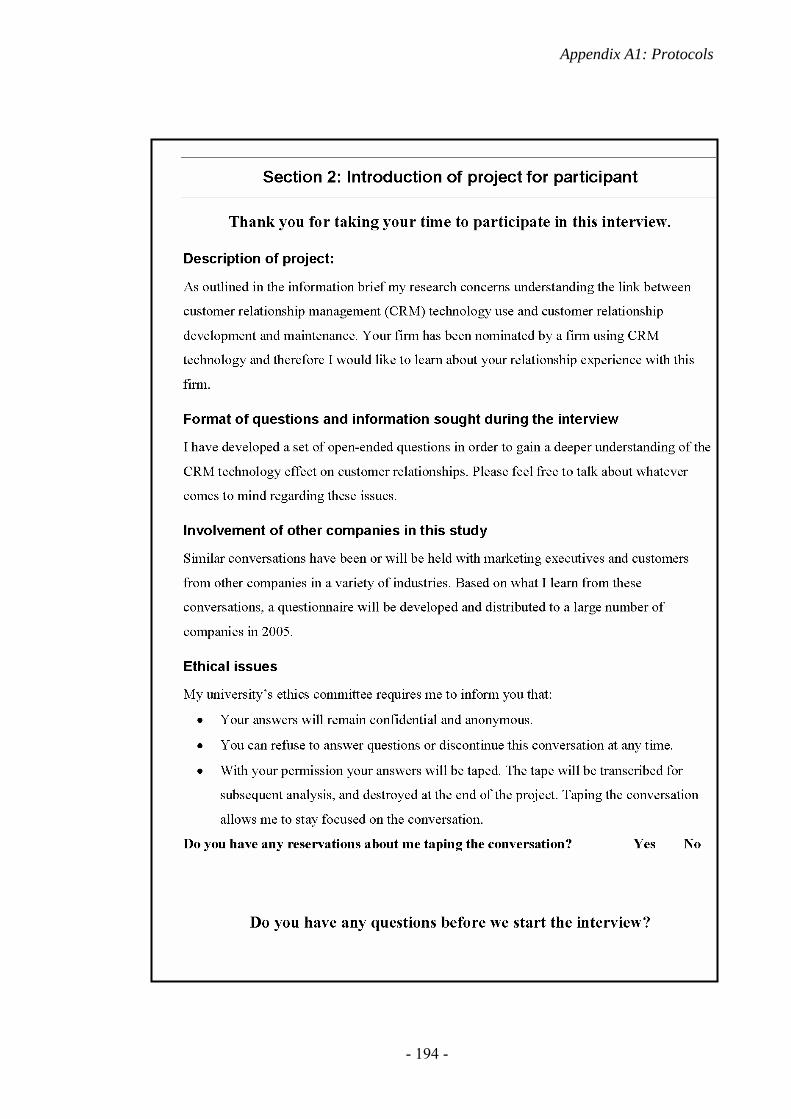
Appendix A1: Protocols
- 194 -
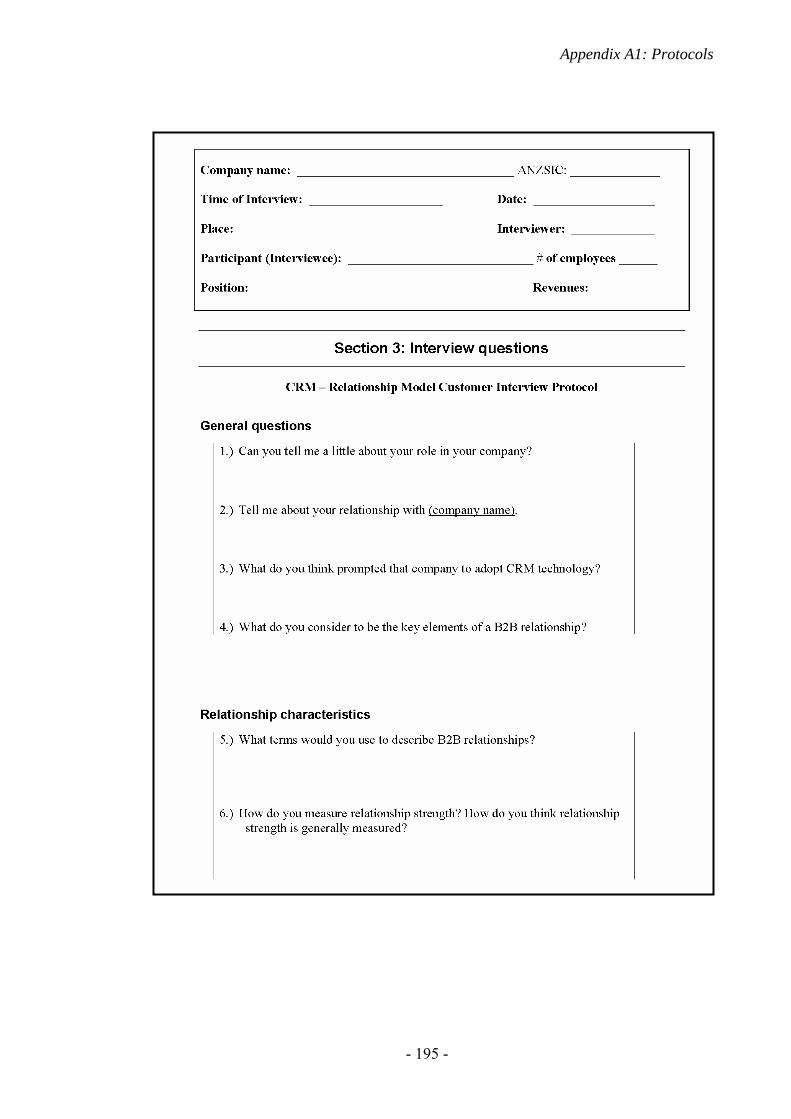
Appendix A1: Protocols
- 195 -
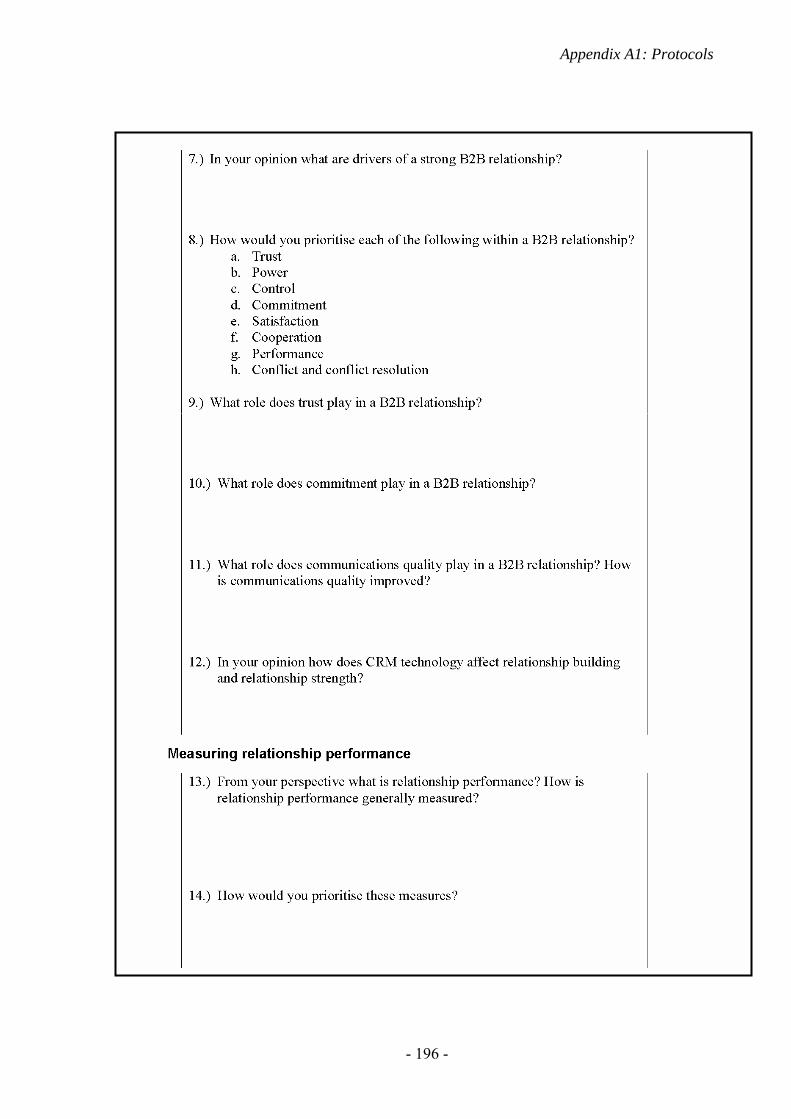
Appendix A1: Protocols
- 196 -
Appendix A1: Protocols
- 197 -
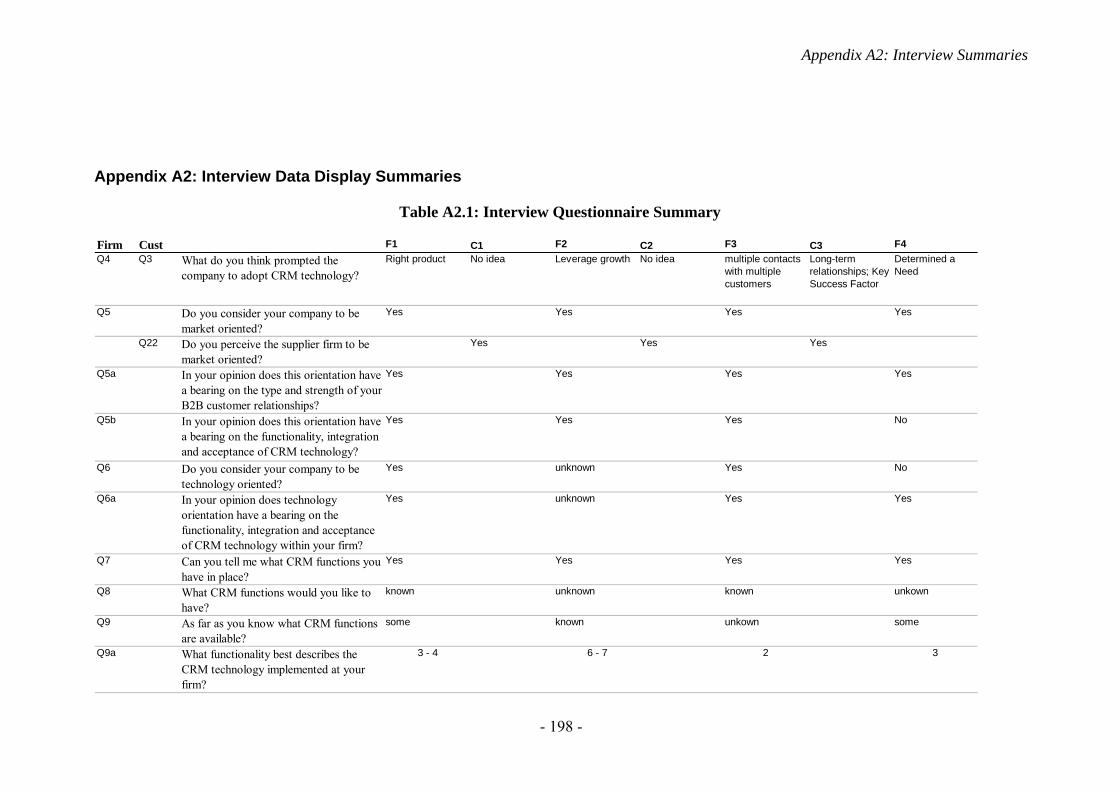
Appendix A2: Interview Summaries
- 198 -
Appendix A2: Interview Data Display Summaries
Table A2.1: Interview Questionnaire Summary
Firm Cust F1 C1 F2 C2 F3 C3 F4Q4 Q3 What do you think prompted the
company to adopt CRM technology? Right product No idea Leverage growth No idea multiple contacts
with multiple customers
Long-term relationships; Key Success Factor
Determined a Need
Q5 Do you consider your company to be market oriented?
Yes Yes Yes Yes
Q22 Do you perceive the supplier firm to be market oriented?
Yes Yes Yes
Q5a In your opinion does this orientation have a bearing on the type and strength of your B2B customer relationships?
Yes Yes Yes Yes
Q5b In your opinion does this orientation have a bearing on the functionality, integration and acceptance of CRM technology?
Yes Yes Yes No
Q6 Do you consider your company to be technology oriented?
Yes unknown Yes No
Q6a In your opinion does technology orientation have a bearing on the functionality, integration and acceptance of CRM technology within your firm?
Yes unknown Yes Yes
Q7 Can you tell me what CRM functions you have in place?
Yes Yes Yes Yes
Q8 What CRM functions would you like to have?
known unknown known unkown
Q9 As far as you know what CRM functions are available?
some known unkown some
Q9a What functionality best describes the CRM technology implemented at your firm?
3 - 4 6 - 7 2 3
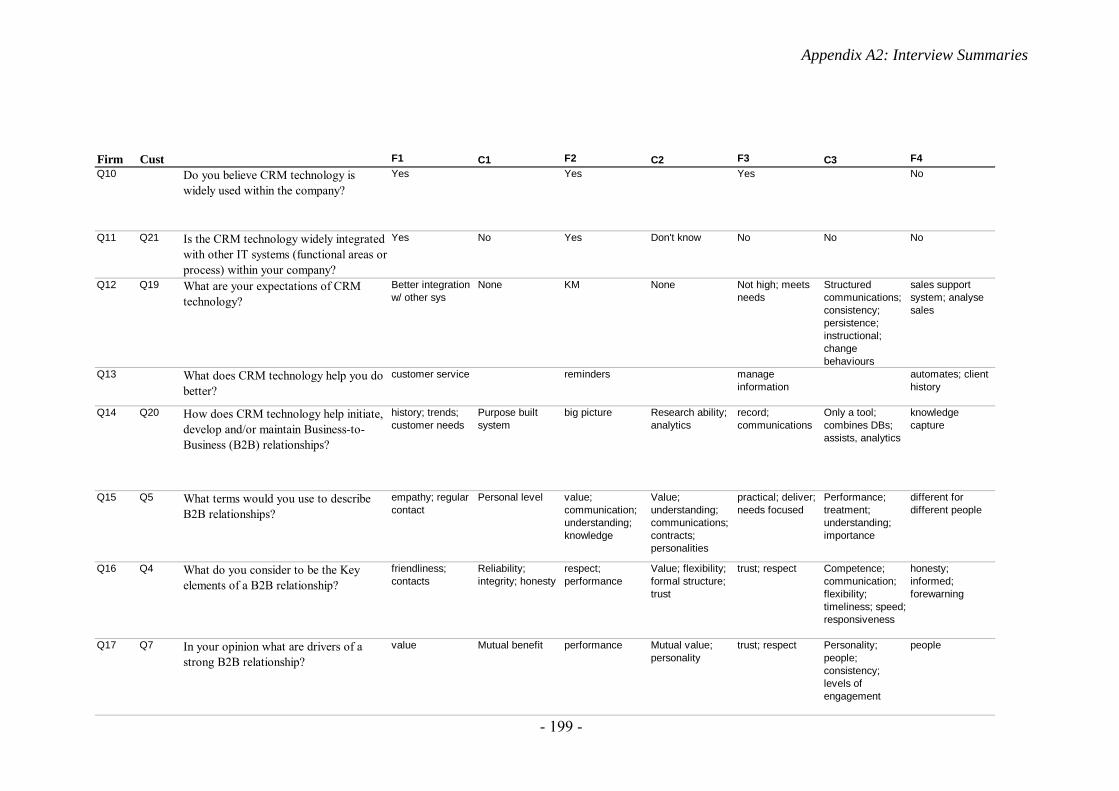
Appendix A2: Interview Summaries
- 199 -
Firm Cust F1 C1 F2 C2 F3 C3 F4Q10 Do you believe CRM technology is
widely used within the company?Yes Yes Yes No
Q11 Q21 Is the CRM technology widely integrated with other IT systems (functional areas or process) within your company?
Yes No Yes Don't know No No No
Q12 Q19 What are your expectations of CRM technology?
Better integration w/ other sys
None KM None Not high; meets needs
Structured communications; consistency; persistence; instructional; change behaviours
sales support system; analyse sales
Q13 What does CRM technology help you do better?
customer service reminders manage information
automates; client history
Q14 Q20 How does CRM technology help initiate, develop and/or maintain Business-to-Business (B2B) relationships?
history; trends; customer needs
Purpose built system
big picture Research ability; analytics
record; communications
Only a tool; combines DBs; assists, analytics
knowledge capture
Q15 Q5 What terms would you use to describe B2B relationships?
empathy; regular contact
Personal level value; communication; understanding; knowledge
Value; understanding; communications; contracts; personalities
practical; deliver; needs focused
Performance; treatment; understanding; importance
different for different people
Q16 Q4 What do you consider to be the Key elements of a B2B relationship?
friendliness; contacts
Reliability; integrity; honesty
respect; performance
Value; flexibility; formal structure; trust
trust; respect Competence; communication; flexibility; timeliness; speed; responsiveness
honesty; informed; forewarning
Q17 Q7 In your opinion what are drivers of a strong B2B relationship?
value Mutual benefit performance Mutual value; personality
trust; respect Personality; people; consistency; levels of engagement
people
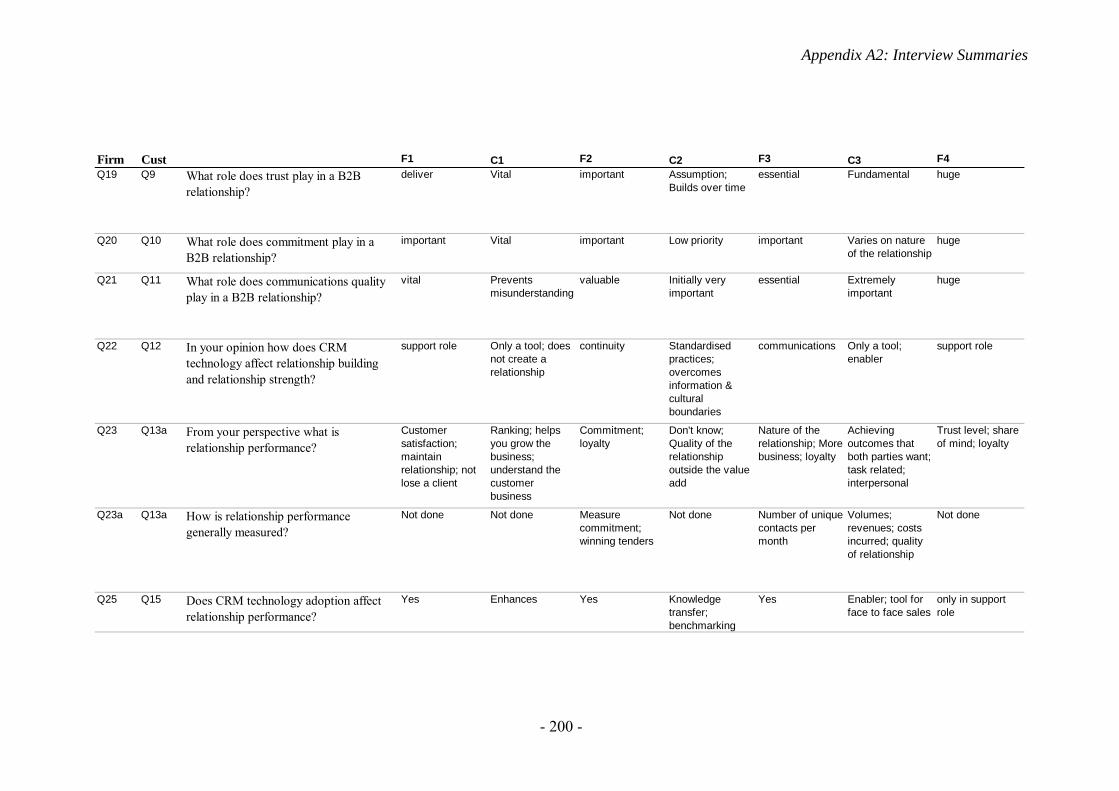
Appendix A2: Interview Summaries
- 200 -
Firm Cust F1 C1 F2 C2 F3 C3 F4Q19 Q9 What role does trust play in a B2B
relationship?deliver Vital important Assumption;
Builds over timeessential Fundamental huge
Q20 Q10 What role does commitment play in a B2B relationship?
important Vital important Low priority important Varies on nature of the relationship
huge
Q21 Q11 What role does communications quality play in a B2B relationship?
vital Prevents misunderstanding
valuable Initially very important
essential Extremely important
huge
Q22 Q12 In your opinion how does CRM technology affect relationship building and relationship strength?
support role Only a tool; does not create a relationship
continuity Standardised practices; overcomes information & cultural boundaries
communications Only a tool; enabler
support role
Q23 Q13a From your perspective what is relationship performance?
Customer satisfaction; maintain relationship; not lose a client
Ranking; helps you grow the business; understand the customer business
Commitment; loyalty
Don't know; Quality of the relationship outside the value add
Nature of the relationship; More business; loyalty
Achieving outcomes that both parties want; task related; interpersonal
Trust level; share of mind; loyalty
Q23a Q13a How is relationship performance generally measured?
Not done Not done Measure commitment; winning tenders
Not done Number of unique contacts per month
Volumes; revenues; costs incurred; quality of relationship
Not done
Q25 Q15 Does CRM technology adoption affect relationship performance?
Yes Enhances Yes Knowledge transfer; benchmarking
Yes Enabler; tool for face to face sales
only in support role
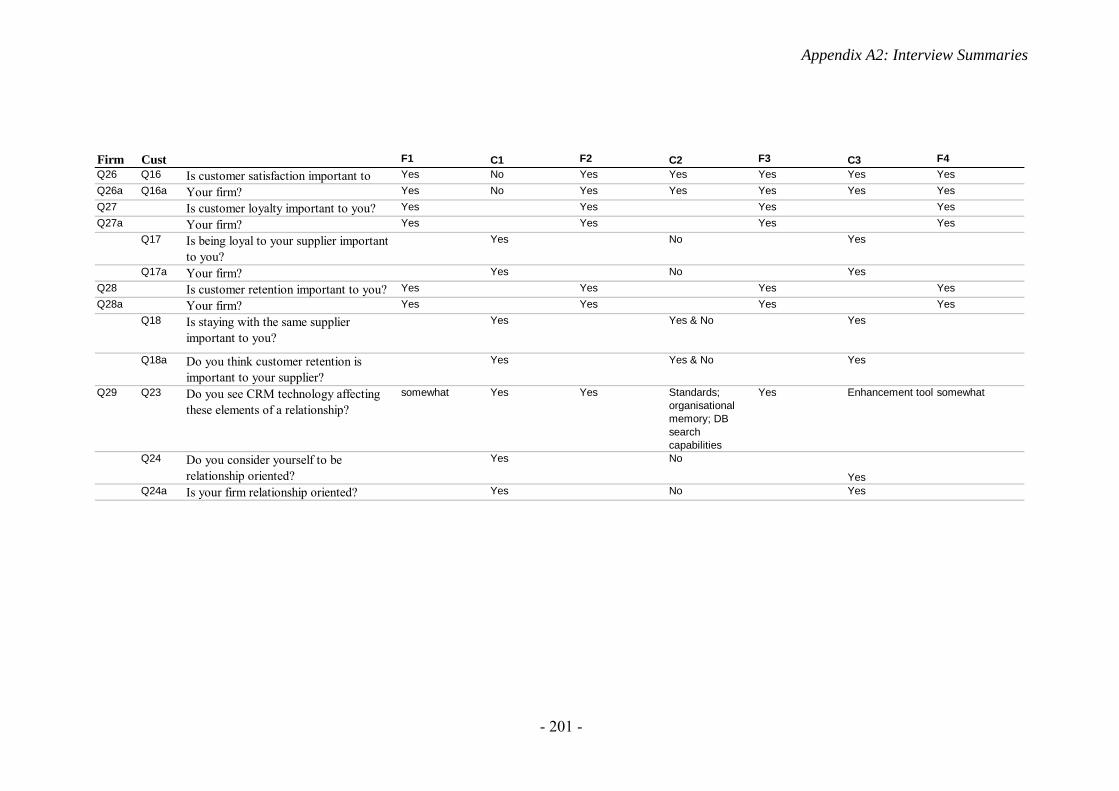
Appendix A2: Interview Summaries
- 201 -
Firm Cust F1 C1 F2 C2 F3 C3 F4Q26 Q16 Is customer satisfaction important to Yes No Yes Yes Yes Yes YesQ26a Q16a Your firm? Yes No Yes Yes Yes Yes YesQ27 Is customer loyalty important to you? Yes Yes Yes YesQ27a Your firm? Yes Yes Yes Yes
Q17 Is being loyal to your supplier important to you?
Yes No Yes
Q17a Your firm? Yes No YesQ28 Is customer retention important to you? Yes Yes Yes YesQ28a Your firm? Yes Yes Yes Yes
Q18 Is staying with the same supplier important to you?
Yes Yes & No Yes
Q18a Do you think customer retention is important to your supplier?
Yes Yes & No Yes
Q29 Q23 Do you see CRM technology affecting these elements of a relationship?
somewhat Yes Yes Standards; organisational memory; DB search capabilities
Yes Enhancement tool somewhat
Q24 Do you consider yourself to be relationship oriented?
Yes No
YesQ24a Is your firm relationship oriented? Yes No Yes
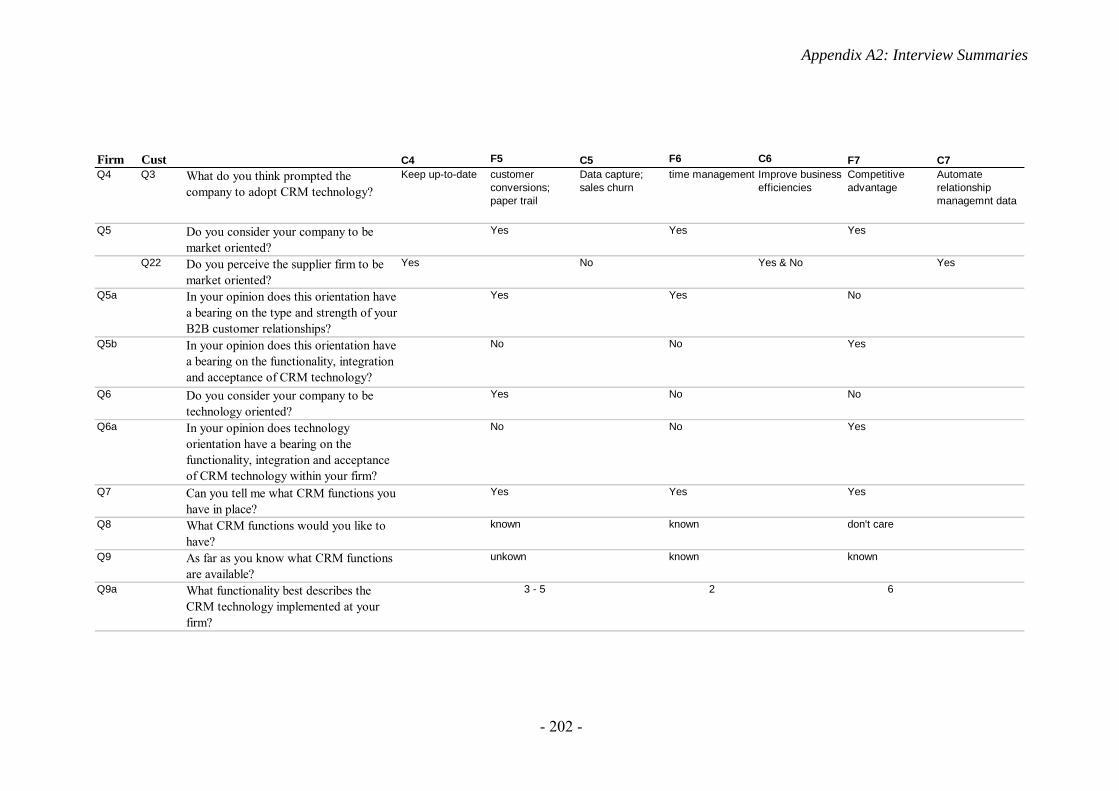
Appendix A2: Interview Summaries
- 202 -
Firm Cust C4 F5 C5 F6 C6 F7 C7Q4 Q3 What do you think prompted the
company to adopt CRM technology? Keep up-to-date customer
conversions; paper trail
Data capture; sales churn
time management Improve business efficiencies
Competitive advantage
Automate relationship managemnt data
Q5 Do you consider your company to be market oriented?
Yes Yes Yes
Q22 Do you perceive the supplier firm to be market oriented?
Yes No Yes & No Yes
Q5a In your opinion does this orientation have a bearing on the type and strength of your B2B customer relationships?
Yes Yes No
Q5b In your opinion does this orientation have a bearing on the functionality, integration and acceptance of CRM technology?
No No Yes
Q6 Do you consider your company to be technology oriented?
Yes No No
Q6a In your opinion does technology orientation have a bearing on the functionality, integration and acceptance of CRM technology within your firm?
No No Yes
Q7 Can you tell me what CRM functions you have in place?
Yes Yes Yes
Q8 What CRM functions would you like to have?
known known don't care
Q9 As far as you know what CRM functions are available?
unkown known known
Q9a What functionality best describes the CRM technology implemented at your firm?
3 - 5 2 6
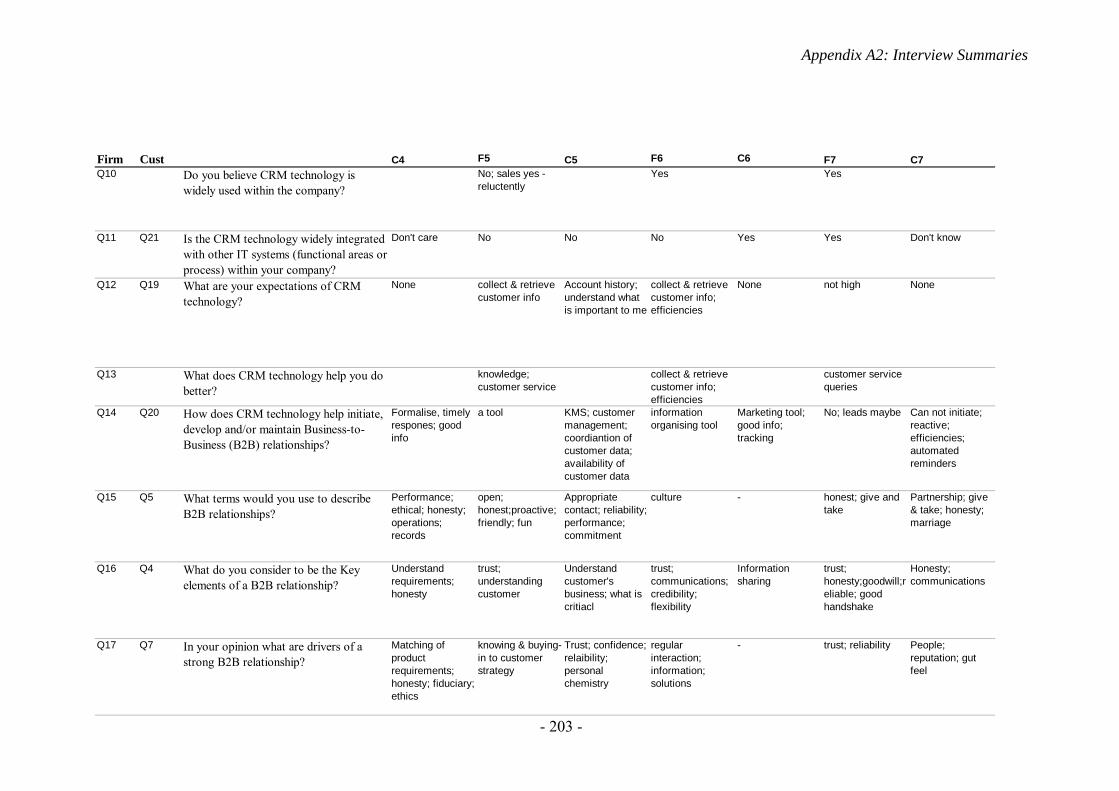
Appendix A2: Interview Summaries
- 203 -
Firm Cust C4 F5 C5 F6 C6 F7 C7Q10 Do you believe CRM technology is
widely used within the company?No; sales yes - reluctently
Yes Yes
Q11 Q21 Is the CRM technology widely integrated with other IT systems (functional areas or process) within your company?
Don't care No No No Yes Yes Don't know
Q12 Q19 What are your expectations of CRM technology?
None collect & retrieve customer info
Account history; understand what is important to me
collect & retrieve customer info; efficiencies
None not high None
Q13 What does CRM technology help you do better?
knowledge; customer service
collect & retrieve customer info; efficiencies
customer service queries
Q14 Q20 How does CRM technology help initiate, develop and/or maintain Business-to-Business (B2B) relationships?
Formalise, timely respones; good info
a tool KMS; customer management; coordiantion of customer data; availability of customer data
information organising tool
Marketing tool; good info; tracking
No; leads maybe Can not initiate; reactive; efficiencies; automated reminders
Q15 Q5 What terms would you use to describe B2B relationships?
Performance; ethical; honesty; operations; records
open; honest;proactive; friendly; fun
Appropriate contact; reliability; performance; commitment
culture - honest; give and take
Partnership; give & take; honesty; marriage
Q16 Q4 What do you consider to be the Key elements of a B2B relationship?
Understand requirements; honesty
trust; understanding customer
Understand customer's business; what is critiacl
trust; communications; credibility; flexibility
Information sharing
trust; honesty;goodwill;reliable; good handshake
Honesty; communications
Q17 Q7 In your opinion what are drivers of a strong B2B relationship?
Matching of product requirements; honesty; fiduciary; ethics
knowing & buying-in to customer strategy
Trust; confidence; relaibility; personal chemistry
regular interaction; information; solutions
- trust; reliability People; reputation; gut feel
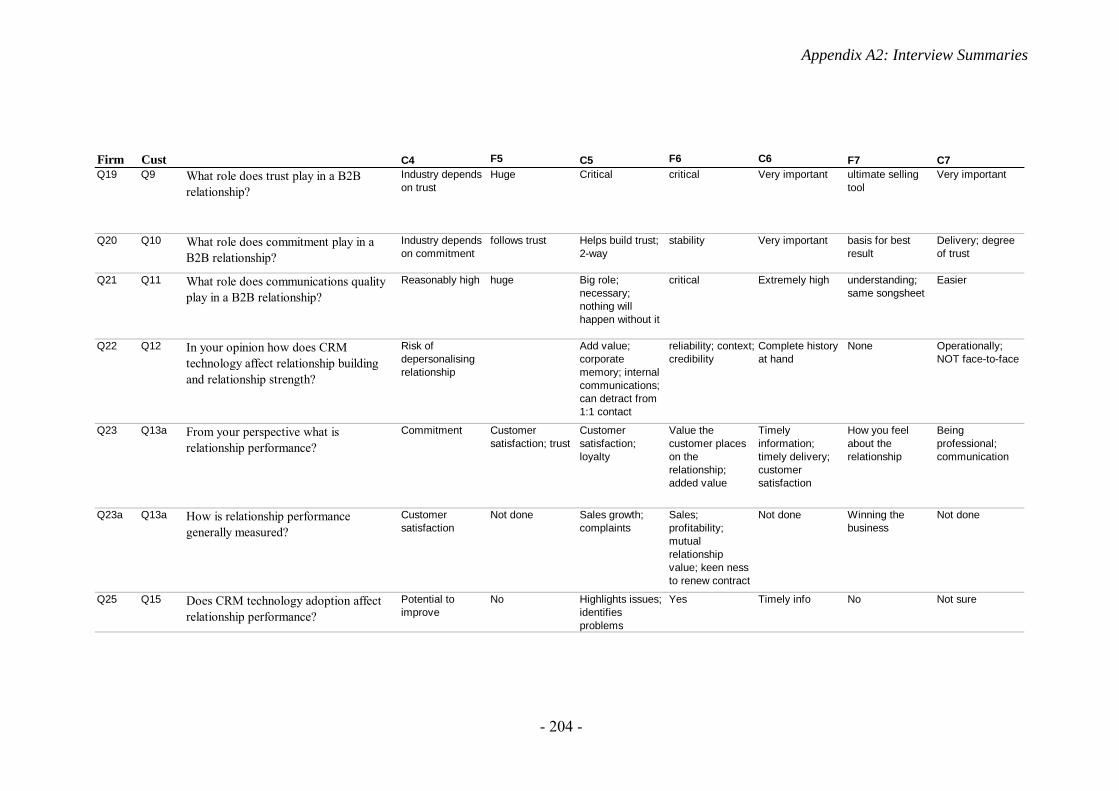
Appendix A2: Interview Summaries
- 204 -
Firm Cust C4 F5 C5 F6 C6 F7 C7Q19 Q9 What role does trust play in a B2B
relationship?Industry depends on trust
Huge Critical critical Very important ultimate selling tool
Very important
Q20 Q10 What role does commitment play in a B2B relationship?
Industry depends on commitment
follows trust Helps build trust; 2-way
stability Very important basis for best result
Delivery; degree of trust
Q21 Q11 What role does communications quality play in a B2B relationship?
Reasonably high huge Big role; necessary; nothing will happen without it
critical Extremely high understanding; same songsheet
Easier
Q22 Q12 In your opinion how does CRM technology affect relationship building and relationship strength?
Risk of depersonalising relationship
Add value; corporate memory; internal communications; can detract from 1:1 contact
reliability; context; credibility
Complete history at hand
None Operationally; NOT face-to-face
Q23 Q13a From your perspective what is relationship performance?
Commitment Customer satisfaction; trust
Customer satisfaction; loyalty
Value the customer places on the relationship; added value
Timely information; timely delivery; customer satisfaction
How you feel about the relationship
Being professional; communication
Q23a Q13a How is relationship performance generally measured?
Customer satisfaction
Not done Sales growth; complaints
Sales; profitability; mutual relationship value; keen ness to renew contract
Not done Winning the business
Not done
Q25 Q15 Does CRM technology adoption affect relationship performance?
Potential to improve
No Highlights issues; identifies problems
Yes Timely info No Not sure
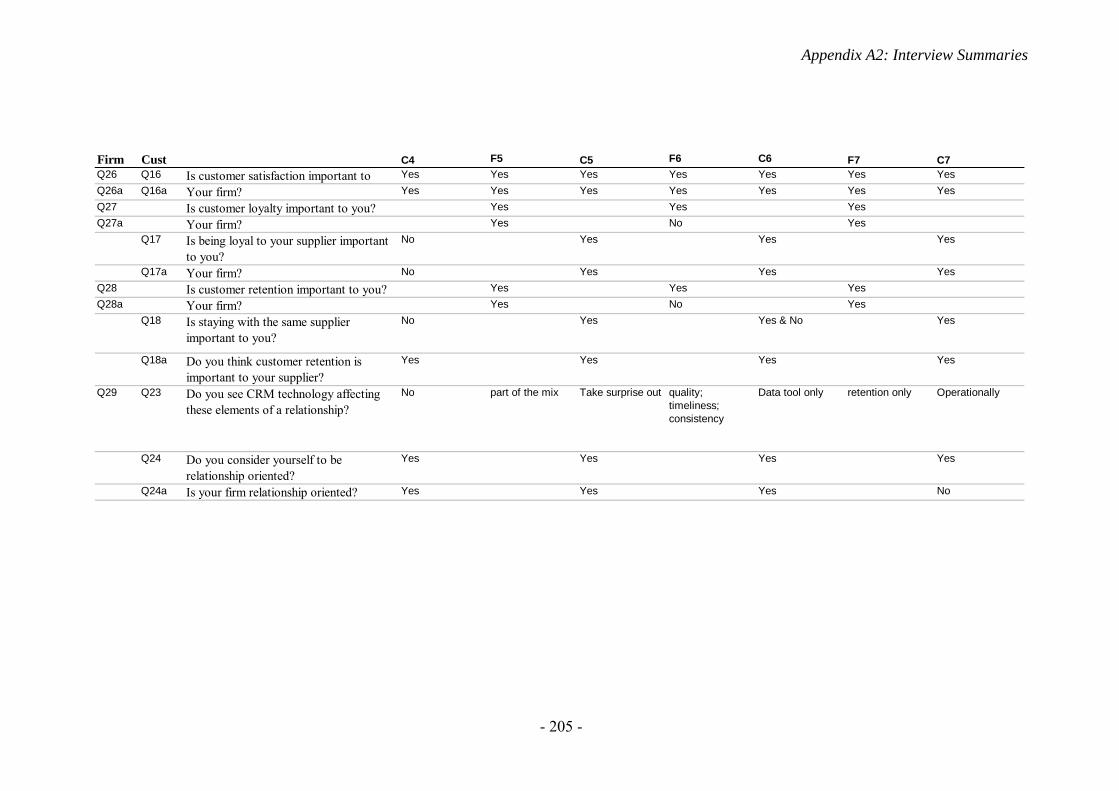
Appendix A2: Interview Summaries
- 205 -
Firm Cust C4 F5 C5 F6 C6 F7 C7Q26 Q16 Is customer satisfaction important to Yes Yes Yes Yes Yes Yes YesQ26a Q16a Your firm? Yes Yes Yes Yes Yes Yes YesQ27 Is customer loyalty important to you? Yes Yes YesQ27a Your firm? Yes No Yes
Q17 Is being loyal to your supplier important to you?
No Yes Yes Yes
Q17a Your firm? No Yes Yes YesQ28 Is customer retention important to you? Yes Yes YesQ28a Your firm? Yes No Yes
Q18 Is staying with the same supplier important to you?
No Yes Yes & No Yes
Q18a Do you think customer retention is important to your supplier?
Yes Yes Yes Yes
Q29 Q23 Do you see CRM technology affecting these elements of a relationship?
No part of the mix Take surprise out quality; timeliness; consistency
Data tool only retention only Operationally
Q24 Do you consider yourself to be relationship oriented?
Yes Yes Yes Yes
Q24a Is your firm relationship oriented? Yes Yes Yes No
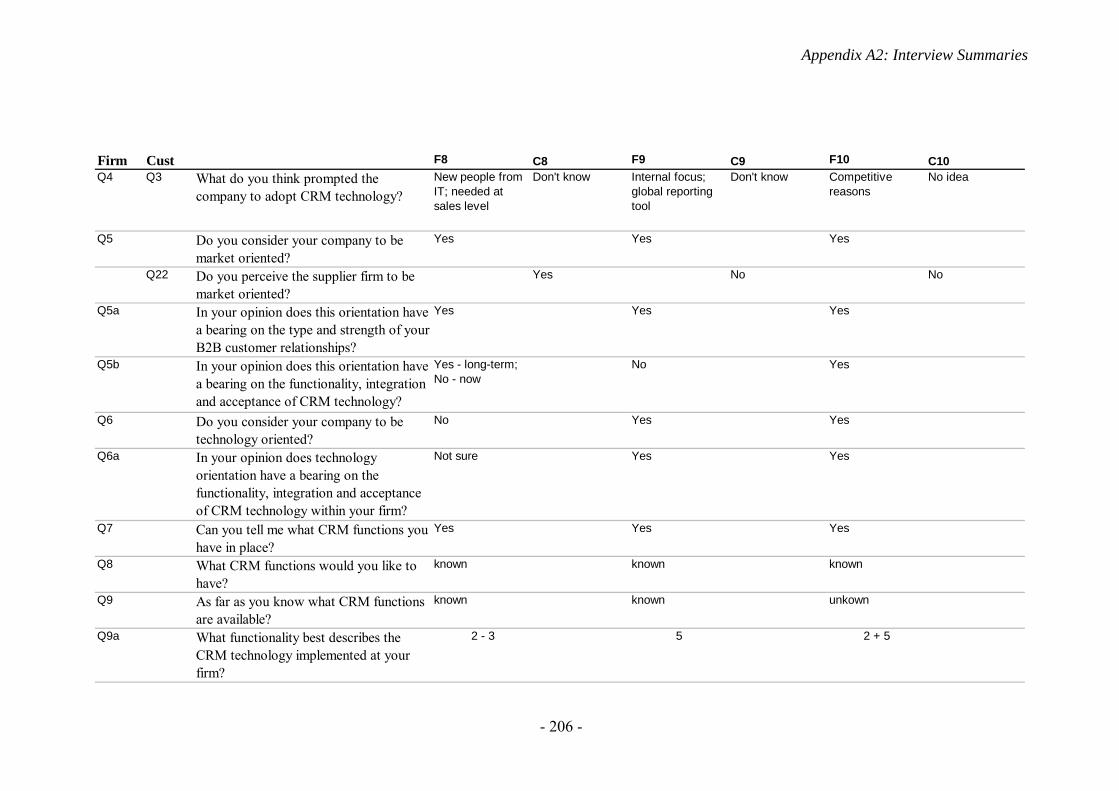
Appendix A2: Interview Summaries
- 206 -
Firm Cust F8 C8 F9 C9 F10 C10Q4 Q3 What do you think prompted the
company to adopt CRM technology? New people from IT; needed at sales level
Don't know Internal focus; global reporting tool
Don't know Competitive reasons
No idea
Q5 Do you consider your company to be market oriented?
Yes Yes Yes
Q22 Do you perceive the supplier firm to be market oriented?
Yes No No
Q5a In your opinion does this orientation have a bearing on the type and strength of your B2B customer relationships?
Yes Yes Yes
Q5b In your opinion does this orientation have a bearing on the functionality, integration and acceptance of CRM technology?
Yes - long-term; No - now
No Yes
Q6 Do you consider your company to be technology oriented?
No Yes Yes
Q6a In your opinion does technology orientation have a bearing on the functionality, integration and acceptance of CRM technology within your firm?
Not sure Yes Yes
Q7 Can you tell me what CRM functions you have in place?
Yes Yes Yes
Q8 What CRM functions would you like to have?
known known known
Q9 As far as you know what CRM functions are available?
known known unkown
Q9a What functionality best describes the CRM technology implemented at your firm?
2 - 3 5 2 + 5
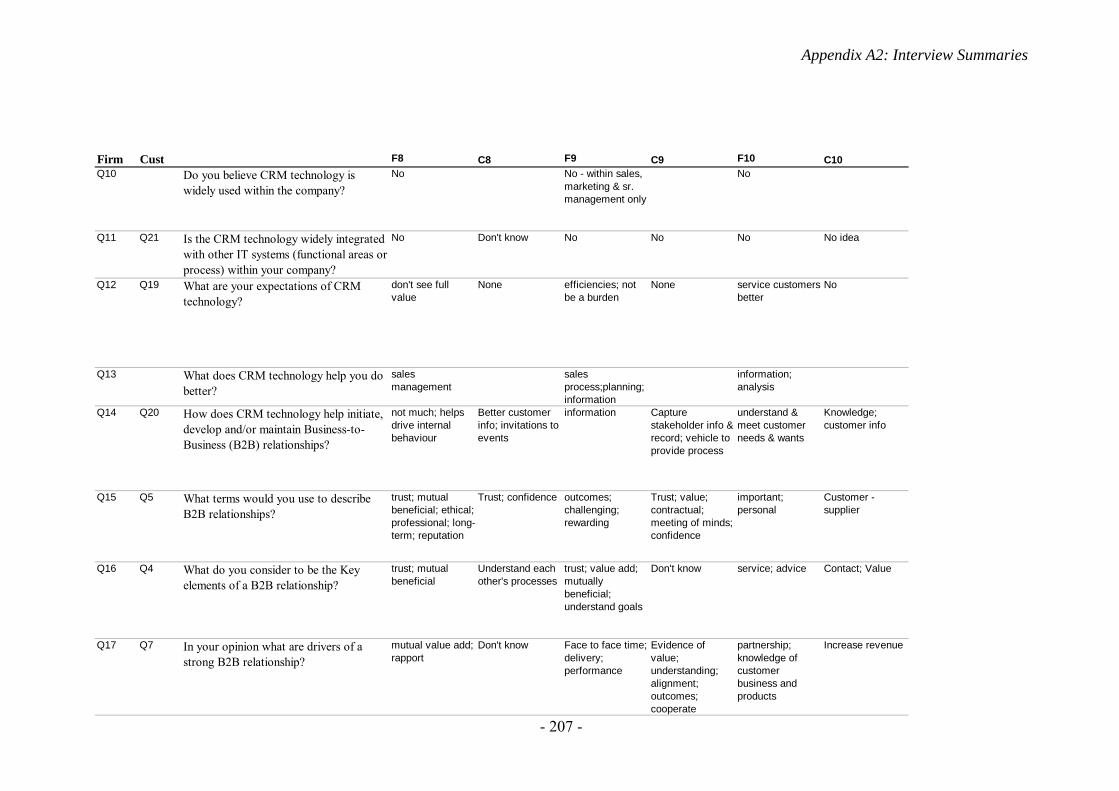
Appendix A2: Interview Summaries
- 207 -
Firm Cust F8 C8 F9 C9 F10 C10Q10 Do you believe CRM technology is
widely used within the company?No No - within sales,
marketing & sr. management only
No
Q11 Q21 Is the CRM technology widely integrated with other IT systems (functional areas or process) within your company?
No Don't know No No No No idea
Q12 Q19 What are your expectations of CRM technology?
don't see full value
None efficiencies; not be a burden
None service customers better
No
Q13 What does CRM technology help you do better?
sales management
sales process;planning; information
information; analysis
Q14 Q20 How does CRM technology help initiate, develop and/or maintain Business-to-Business (B2B) relationships?
not much; helps drive internal behaviour
Better customer info; invitations to events
information Capture stakeholder info & record; vehicle to provide process
understand & meet customer needs & wants
Knowledge; customer info
Q15 Q5 What terms would you use to describe B2B relationships?
trust; mutual beneficial; ethical; professional; long-term; reputation
Trust; confidence outcomes; challenging; rewarding
Trust; value; contractual; meeting of minds; confidence
important; personal
Customer - supplier
Q16 Q4 What do you consider to be the Key elements of a B2B relationship?
trust; mutual beneficial
Understand each other's processes
trust; value add; mutually beneficial; understand goals
Don't know service; advice Contact; Value
Q17 Q7 In your opinion what are drivers of a strong B2B relationship?
mutual value add; rapport
Don't know Face to face time; delivery; performance
Evidence of value; understanding; alignment; outcomes; cooperate
partnership; knowledge of customer business and products
Increase revenue
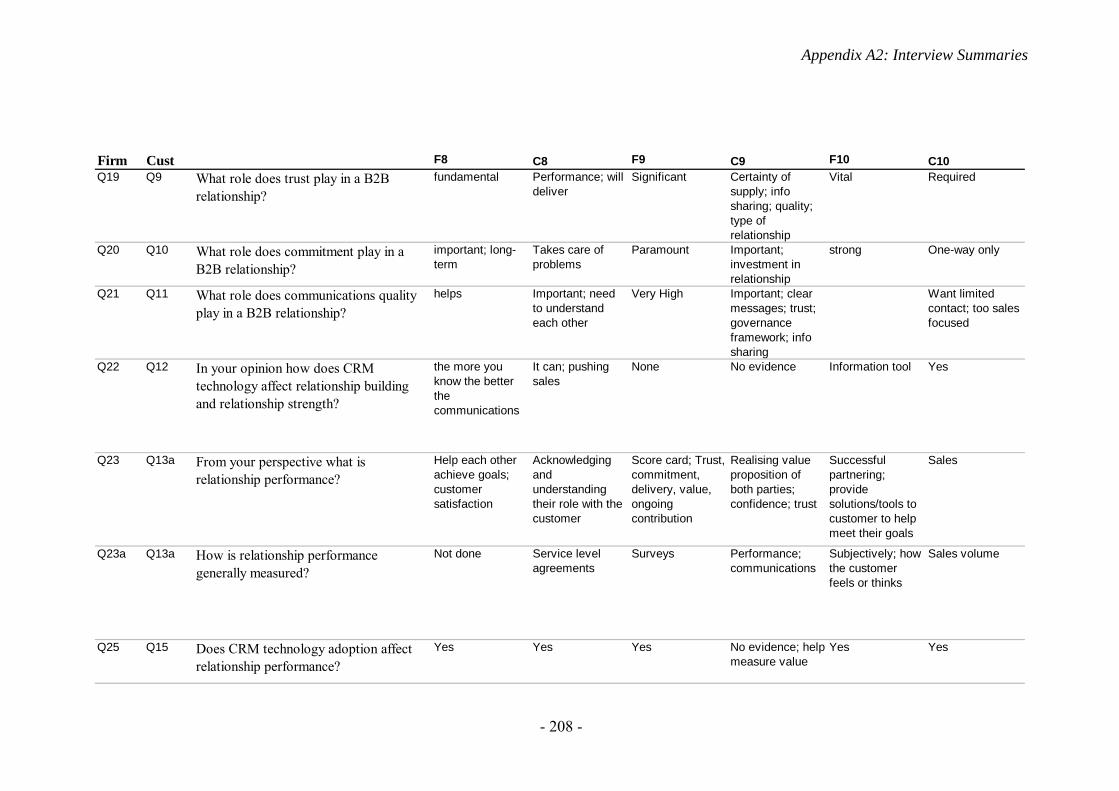
Appendix A2: Interview Summaries
- 208 -
Firm Cust F8 C8 F9 C9 F10 C10Q19 Q9 What role does trust play in a B2B
relationship?fundamental Performance; will
deliverSignificant Certainty of
supply; info sharing; quality; type of relationship
Vital Required
Q20 Q10 What role does commitment play in a B2B relationship?
important; long-term
Takes care of problems
Paramount Important; investment in relationship
strong One-way only
Q21 Q11 What role does communications quality play in a B2B relationship?
helps Important; need to understand each other
Very High Important; clear messages; trust; governance framework; info sharing
Want limited contact; too sales focused
Q22 Q12 In your opinion how does CRM technology affect relationship building and relationship strength?
the more you know the better the communications
It can; pushing sales
None No evidence Information tool Yes
Q23 Q13a From your perspective what is relationship performance?
Help each other achieve goals; customer satisfaction
Acknowledging and understanding their role with the customer
Score card; Trust, commitment, delivery, value, ongoing contribution
Realising value proposition of both parties; confidence; trust
Successful partnering; provide solutions/tools to customer to help meet their goals
Sales
Q23a Q13a How is relationship performance generally measured?
Not done Service level agreements
Surveys Performance; communications
Subjectively; how the customer feels or thinks
Sales volume
Q25 Q15 Does CRM technology adoption affect relationship performance?
Yes Yes Yes No evidence; help measure value
Yes Yes
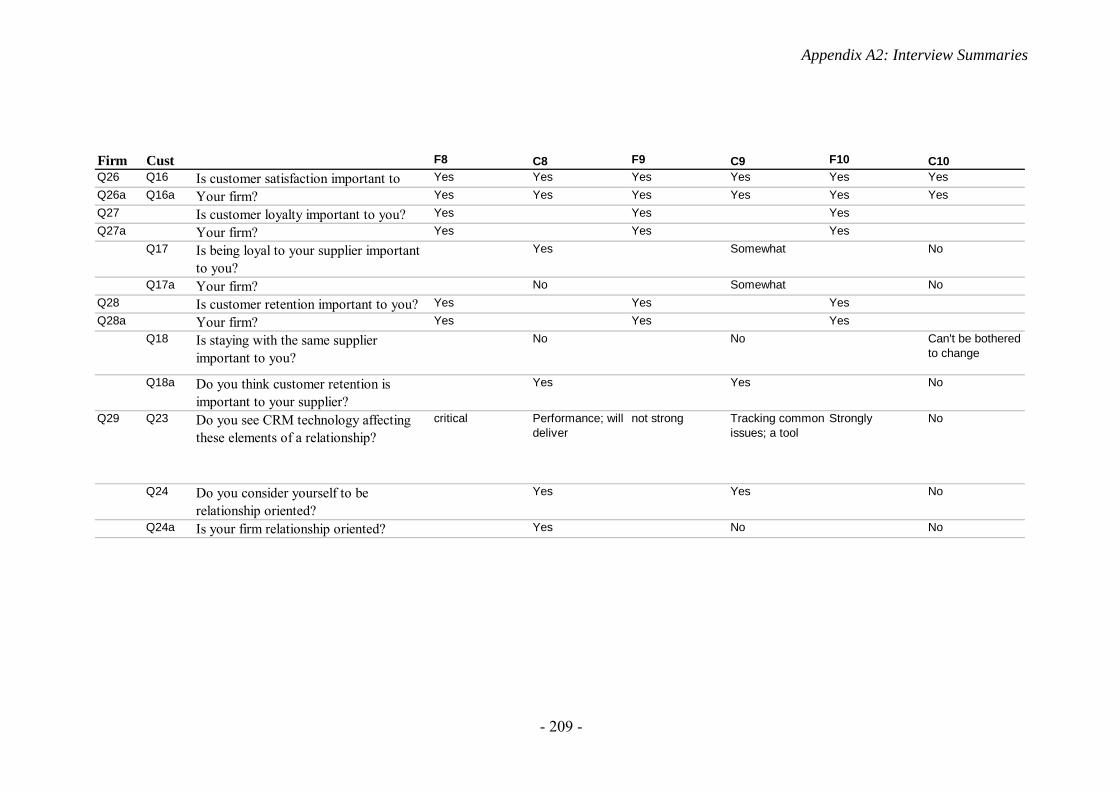
Appendix A2: Interview Summaries
- 209 -
Firm Cust F8 C8 F9 C9 F10 C10Q26 Q16 Is customer satisfaction important to Yes Yes Yes Yes Yes YesQ26a Q16a Your firm? Yes Yes Yes Yes Yes YesQ27 Is customer loyalty important to you? Yes Yes YesQ27a Your firm? Yes Yes Yes
Q17 Is being loyal to your supplier important to you?
Yes Somewhat No
Q17a Your firm? No Somewhat NoQ28 Is customer retention important to you? Yes Yes YesQ28a Your firm? Yes Yes Yes
Q18 Is staying with the same supplier important to you?
No No Can't be bothered to change
Q18a Do you think customer retention is important to your supplier?
Yes Yes No
Q29 Q23 Do you see CRM technology affecting these elements of a relationship?
critical Performance; will deliver
not strong Tracking common issues; a tool
Strongly No
Q24 Do you consider yourself to be relationship oriented?
Yes Yes No
Q24a Is your firm relationship oriented? Yes No No
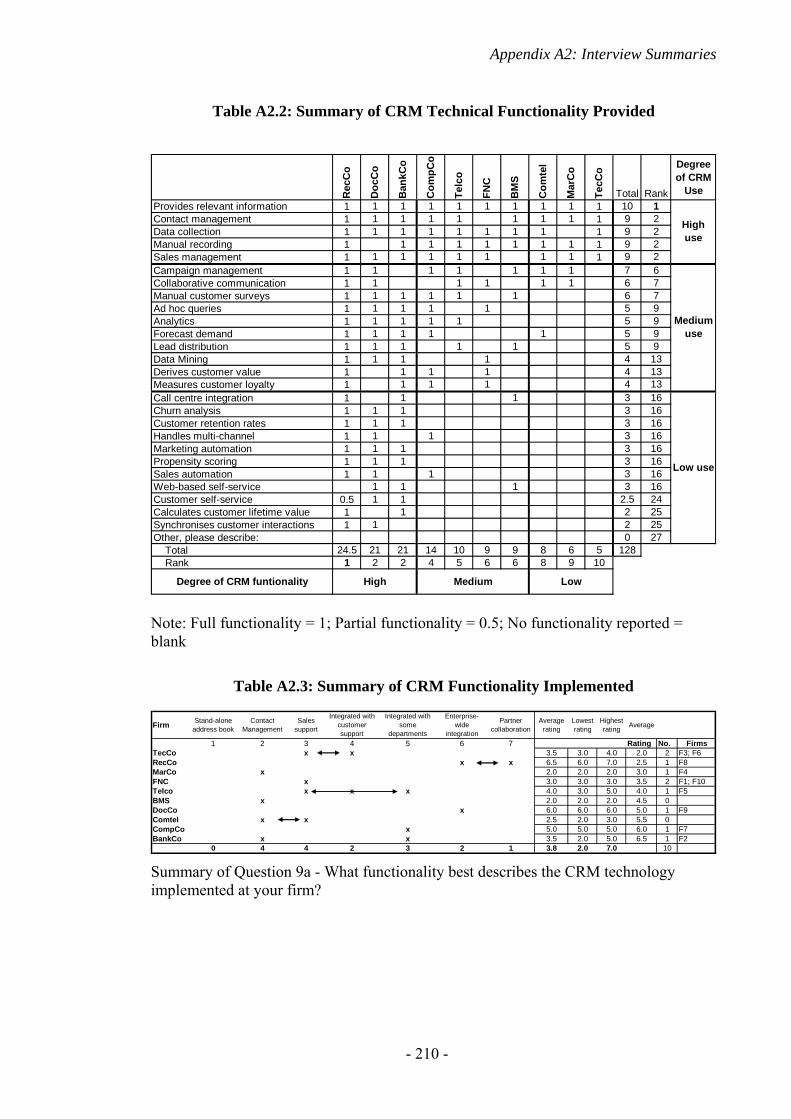
Appendix A2: Interview Summaries
- 210 -
Table A2.2: Summary of CRM Technical Functionality Provided
Rec
Co
Doc
Co
Ban
kCo
Com
pCo
Telc
o
FNC
BM
S
Com
tel
Mar
Co
TecC
o
Total Rank
Degree of CRM
UseProvides relevant information 1 1 1 1 1 1 1 1 1 1 10 1Contact management 1 1 1 1 1 1 1 1 1 9 2Data collection 1 1 1 1 1 1 1 1 1 9 2Manual recording 1 1 1 1 1 1 1 1 1 9 2Sales management 1 1 1 1 1 1 1 1 1 9 2Campaign management 1 1 1 1 1 1 1 7 6Collaborative communication 1 1 1 1 1 1 6 7Manual customer surveys 1 1 1 1 1 1 6 7Ad hoc queries 1 1 1 1 1 5 9Analytics 1 1 1 1 1 5 9Forecast demand 1 1 1 1 1 5 9Lead distribution 1 1 1 1 1 5 9Data Mining 1 1 1 1 4 13Derives customer value 1 1 1 1 4 13Measures customer loyalty 1 1 1 1 4 13Call centre integration 1 1 1 3 16Churn analysis 1 1 1 3 16Customer retention rates 1 1 1 3 16Handles multi-channel 1 1 1 3 16Marketing automation 1 1 1 3 16Propensity scoring 1 1 1 3 16Sales automation 1 1 1 3 16Web-based self-service 1 1 1 3 16Customer self-service 0.5 1 1 2.5 24Calculates customer lifetime value 1 1 2 25Synchronises customer interactions 1 1 2 25Other, please describe: 0 27 Total 24.5 21 21 14 10 9 9 8 6 5 128 Rank 1 2 2 4 5 6 6 8 9 10
High MediumDegree of CRM funtionality
Low use
High use
Medium use
Low Note: Full functionality = 1; Partial functionality = 0.5; No functionality reported = blank
Table A2.3: Summary of CRM Functionality Implemented
Firm Stand-alone address book
Contact Management
Sales support
Integrated with customer support
Integrated with some
departments
Enterprise-wide
integration
Partner collaboration
Average rating
Lowest rating
Highest rating Average
1 2 3 4 5 6 7 Rating No. FirmsTecCo x x 3.5 3.0 4.0 2.0 2 F3; F6RecCo x x 6.5 6.0 7.0 2.5 1 F8MarCo x 2.0 2.0 2.0 3.0 1 F4FNC x 3.0 3.0 3.0 3.5 2 F1; F10Telco x x x 4.0 3.0 5.0 4.0 1 F5BMS x 2.0 2.0 2.0 4.5 0DocCo x 6.0 6.0 6.0 5.0 1 F9Comtel x x 2.5 2.0 3.0 5.5 0CompCo x 5.0 5.0 5.0 6.0 1 F7BankCo x x 3.5 2.0 5.0 6.5 1 F2
0 4 4 2 3 2 1 3.8 2.0 7.0 10 Summary of Question 9a - What functionality best describes the CRM technology implemented at your firm?
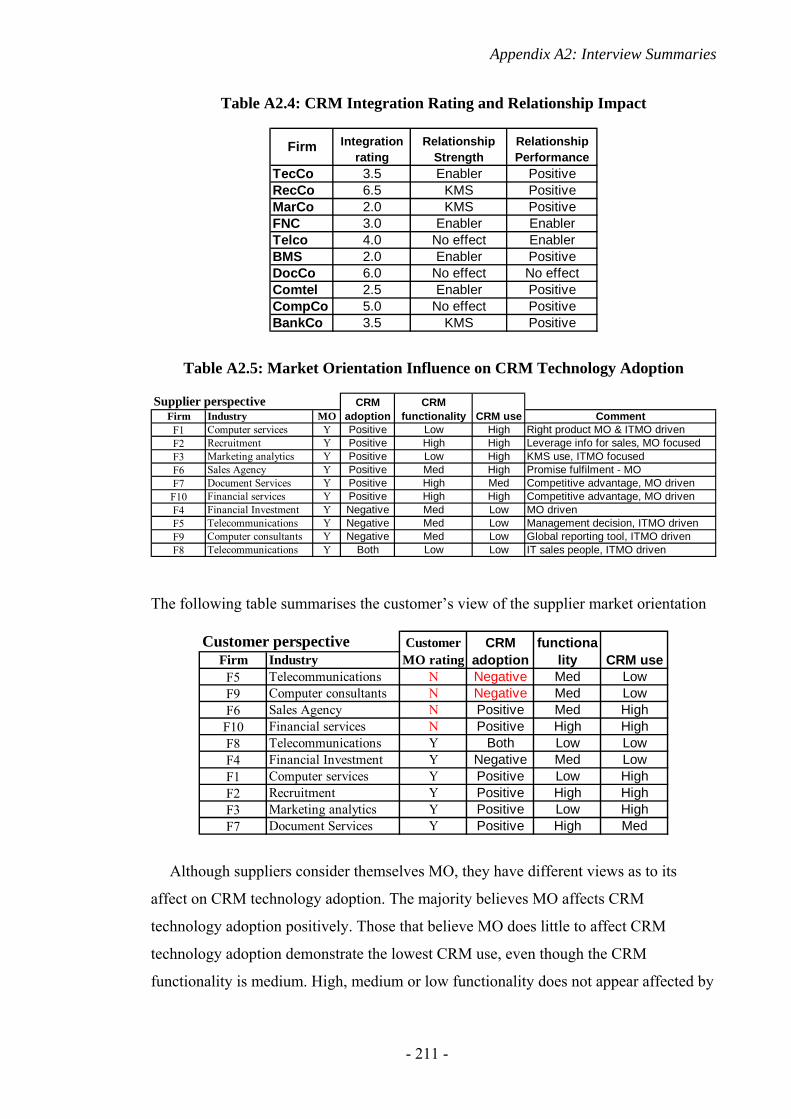
Appendix A2: Interview Summaries
- 211 -
Table A2.4: CRM Integration Rating and Relationship Impact
TecCo 3.5 Enabler PositiveRecCo 6.5 KMS PositiveMarCo 2.0 KMS PositiveFNC 3.0 Enabler EnablerTelco 4.0 No effect EnablerBMS 2.0 Enabler PositiveDocCo 6.0 No effect No effectComtel 2.5 Enabler PositiveCompCo 5.0 No effect PositiveBankCo 3.5 KMS Positive
Integration rating
Relationship Strength
Relationship Performance
Firm
Table A2.5: Market Orientation Influence on CRM Technology Adoption
The following table summarises the customer’s view of the supplier market orientation
Although suppliers consider themselves MO, they have different views as to its
affect on CRM technology adoption. The majority believes MO affects CRM
technology adoption positively. Those that believe MO does little to affect CRM
technology adoption demonstrate the lowest CRM use, even though the CRM
functionality is medium. High, medium or low functionality does not appear affected by
Firm IndustryF5 Telecommunications N Negative Med LowF9 Computer consultants N Negative Med LowF6 Sales Agency N Positive Med HighF10 Financial services N Positive High HighF8 Telecommunications Y Both Low LowF4 Financial Investment Y Negative Med LowF1 Computer services Y Positive Low HighF2 Recruitment Y Positive High HighF3 Marketing analytics Y Positive Low HighF7 Document Services Y Positive High Med
functionality CRM use
Customer perspective Customer MO rating
CRM adoption
Firm Industry MOF1 Computer services Y Positive Low HighF2 Recruitment Y Positive High HighF3 Marketing analytics Y Positive Low HighF6 Sales Agency Y Positive Med HighF7 Document Services Y Positive High MedF10 Financial services Y Positive High HighF4 Financial Investment Y Negative Med LowF5 Telecommunications Y Negative Med LowF9 Computer consultants Y Negative Med LowF8 Telecommunications Y Both Low Low
CRM functionality CRM use
Leverage info for sales, MO focused
CRM adoption
Right product MO & ITMO driven
Supplier perspective
IT sales people, ITMO driven
Comment
MO drivenManagement decision, ITMO drivenGlobal reporting tool, ITMO driven
KMS use, ITMO focusedPromise fulfilment - MOCompetitive advantage, MO drivenCompetitive advantage, MO driven
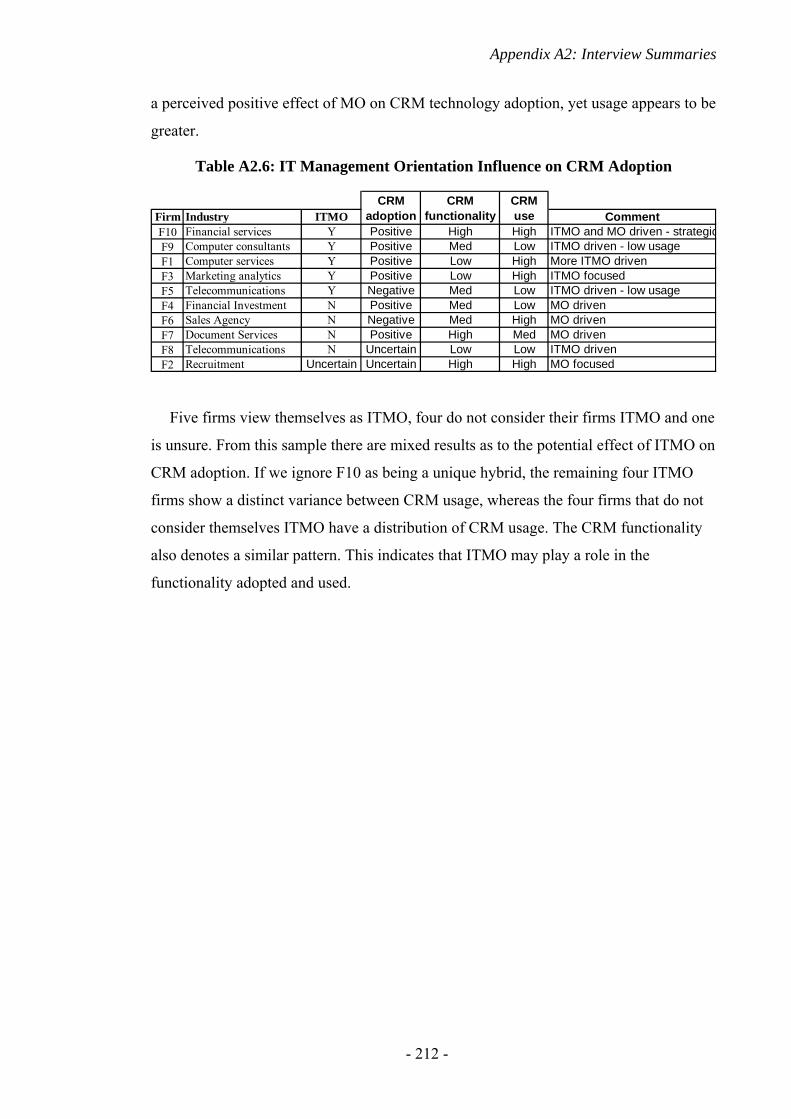
Appendix A2: Interview Summaries
- 212 -
a perceived positive effect of MO on CRM technology adoption, yet usage appears to be
greater.
Table A2.6: IT Management Orientation Influence on CRM Adoption
Five firms view themselves as ITMO, four do not consider their firms ITMO and one
is unsure. From this sample there are mixed results as to the potential effect of ITMO on
CRM adoption. If we ignore F10 as being a unique hybrid, the remaining four ITMO
firms show a distinct variance between CRM usage, whereas the four firms that do not
consider themselves ITMO have a distribution of CRM usage. The CRM functionality
also denotes a similar pattern. This indicates that ITMO may play a role in the
functionality adopted and used.
Firm Industry ITMOF10 Financial services Y Positive High HighF9 Computer consultants Y Positive Med LowF1 Computer services Y Positive Low HighF3 Marketing analytics Y Positive Low HighF5 Telecommunications Y Negative Med LowF4 Financial Investment N Positive Med LowF6 Sales Agency N Negative Med HighF7 Document Services N Positive High MedF8 Telecommunications N Uncertain Low LowF2 Recruitment Uncertain Uncertain High High
CRM adoption
CRM functionality
CRM use Comment
MO drivenITMO driven
ITMO driven - low usage
MO focused
ITMO driven - low usageITMO and MO driven - strategic
MO drivenMO driven
More ITMO drivenITMO focused
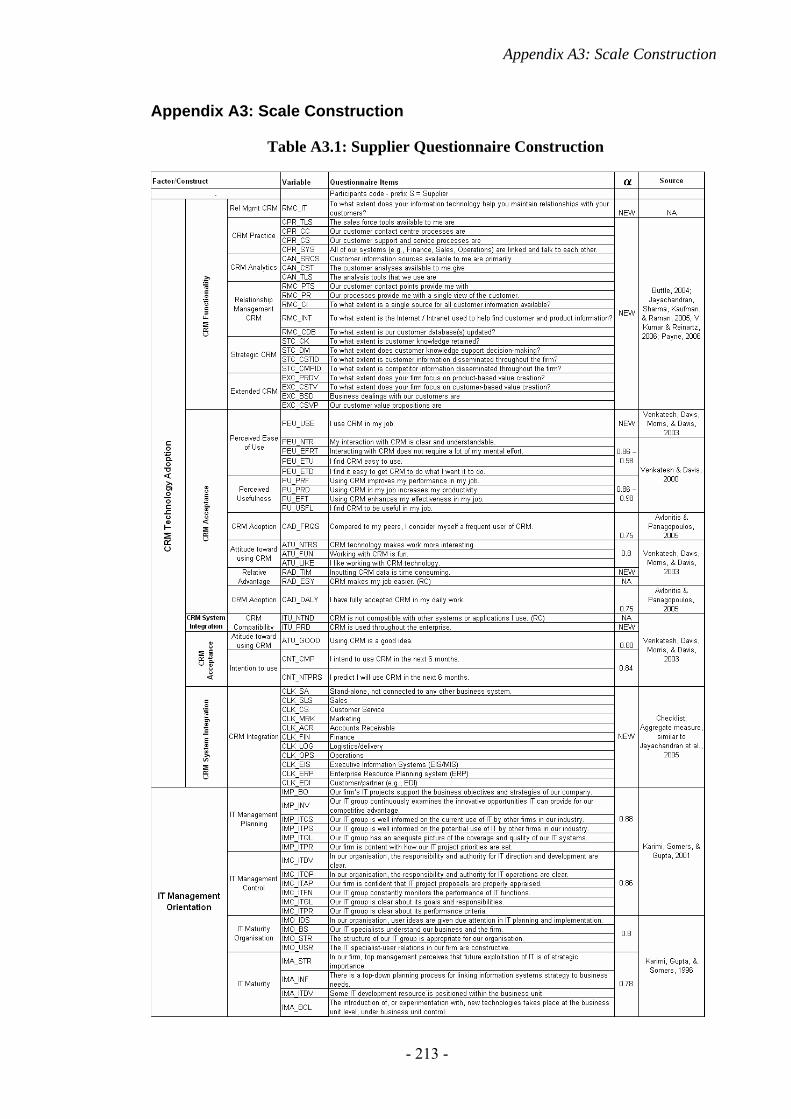
Appendix A3: Scale Construction
- 213 -
Appendix A3: Scale Construction
Table A3.1: Supplier Questionnaire Construction
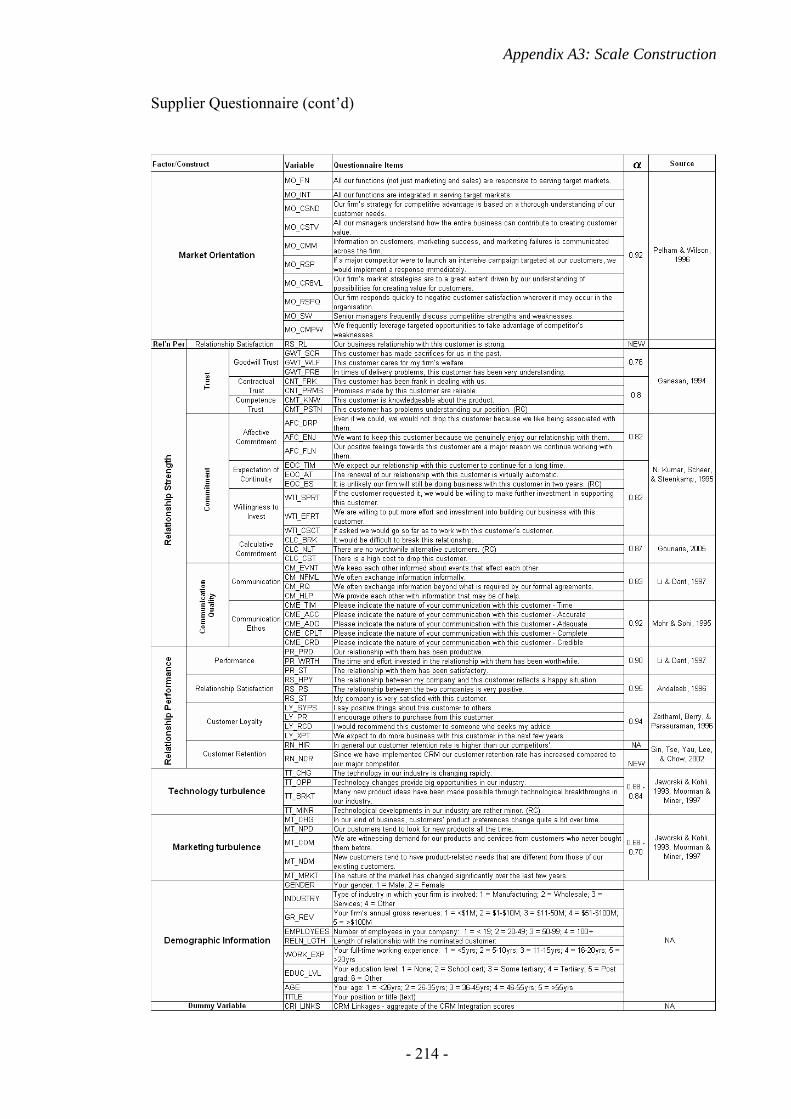
Appendix A3: Scale Construction
- 214 -
Supplier Questionnaire (cont’d)
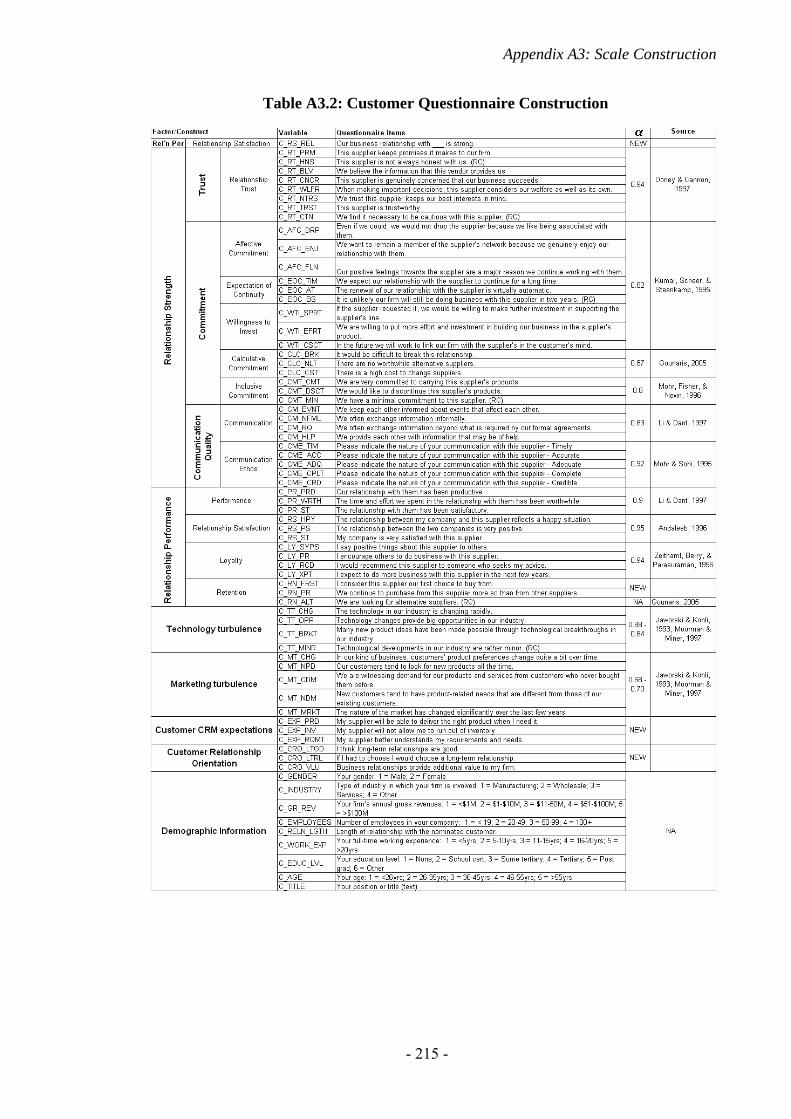
Appendix A3: Scale Construction
- 215 -
Table A3.2: Customer Questionnaire Construction
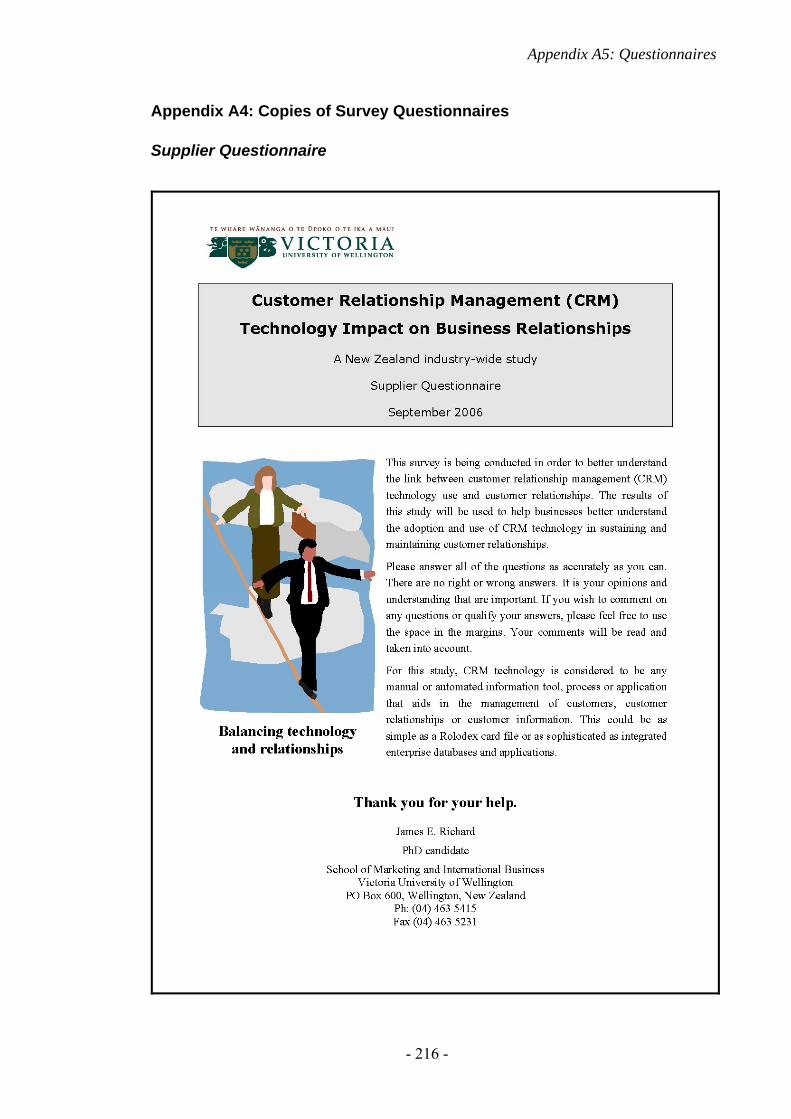
Appendix A5: Questionnaires
- 216 -
Appendix A4: Copies of Survey Questionnaires
Supplier Questionnaire
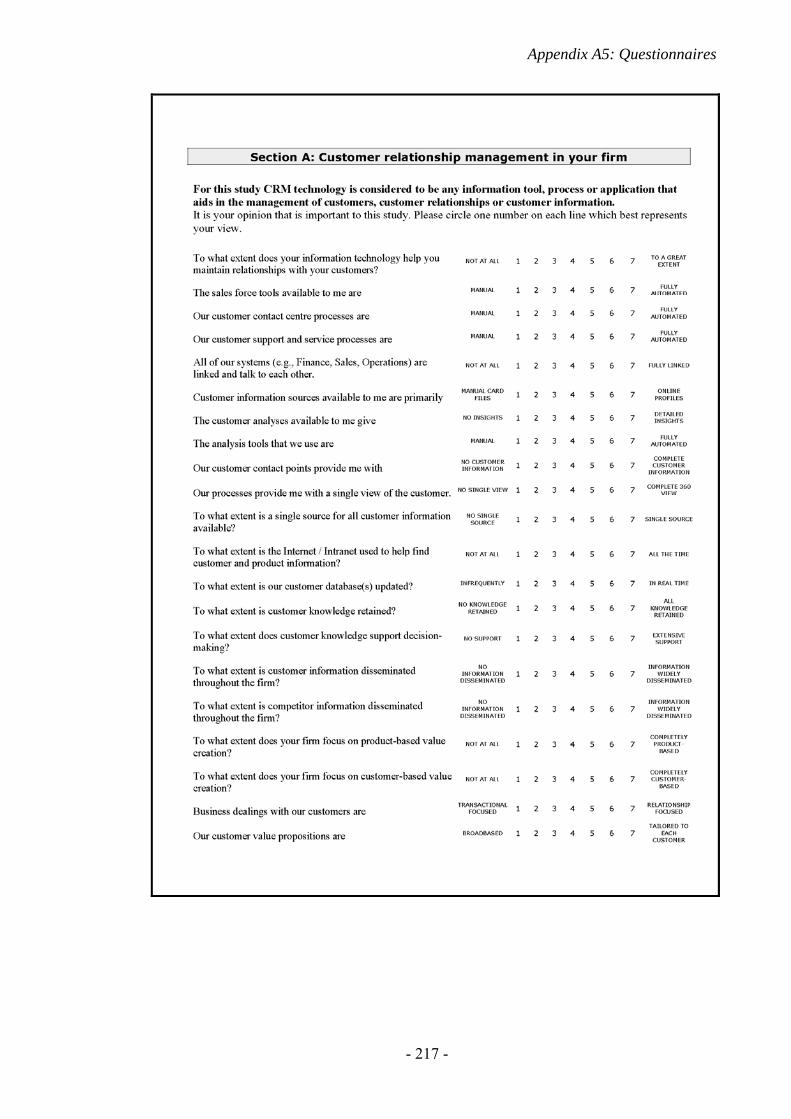
Appendix A5: Questionnaires
- 217 -
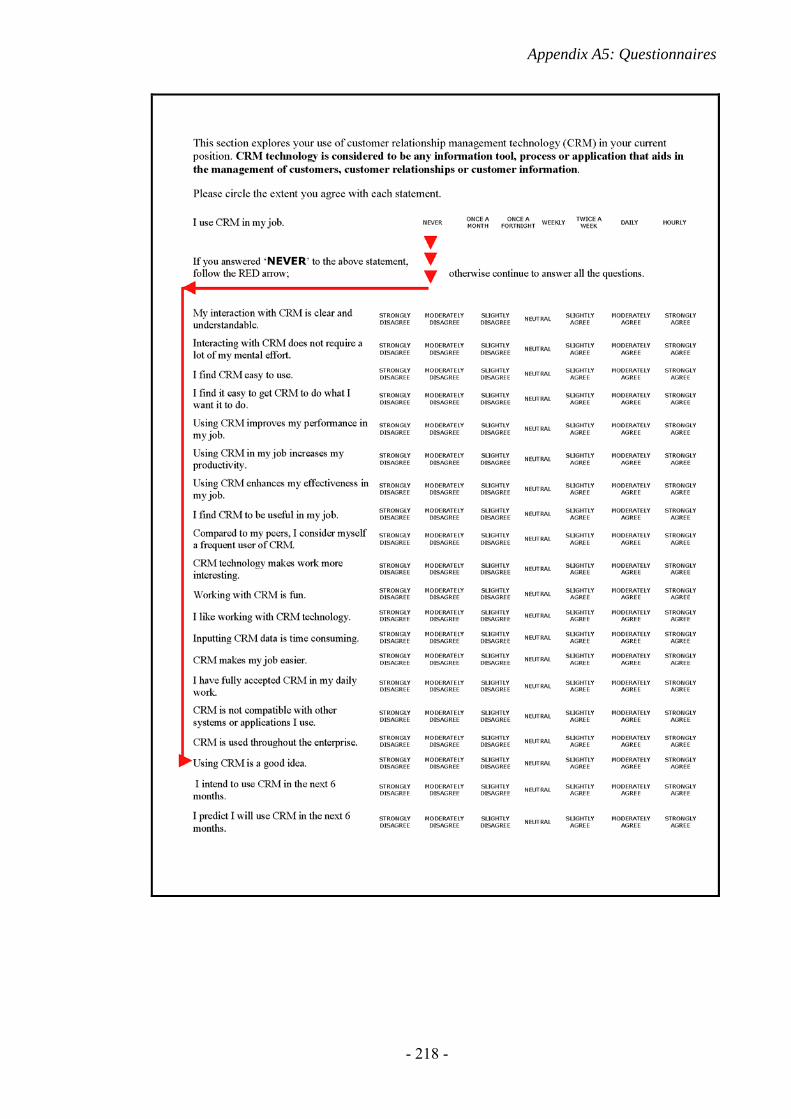
Appendix A5: Questionnaires
- 218 -
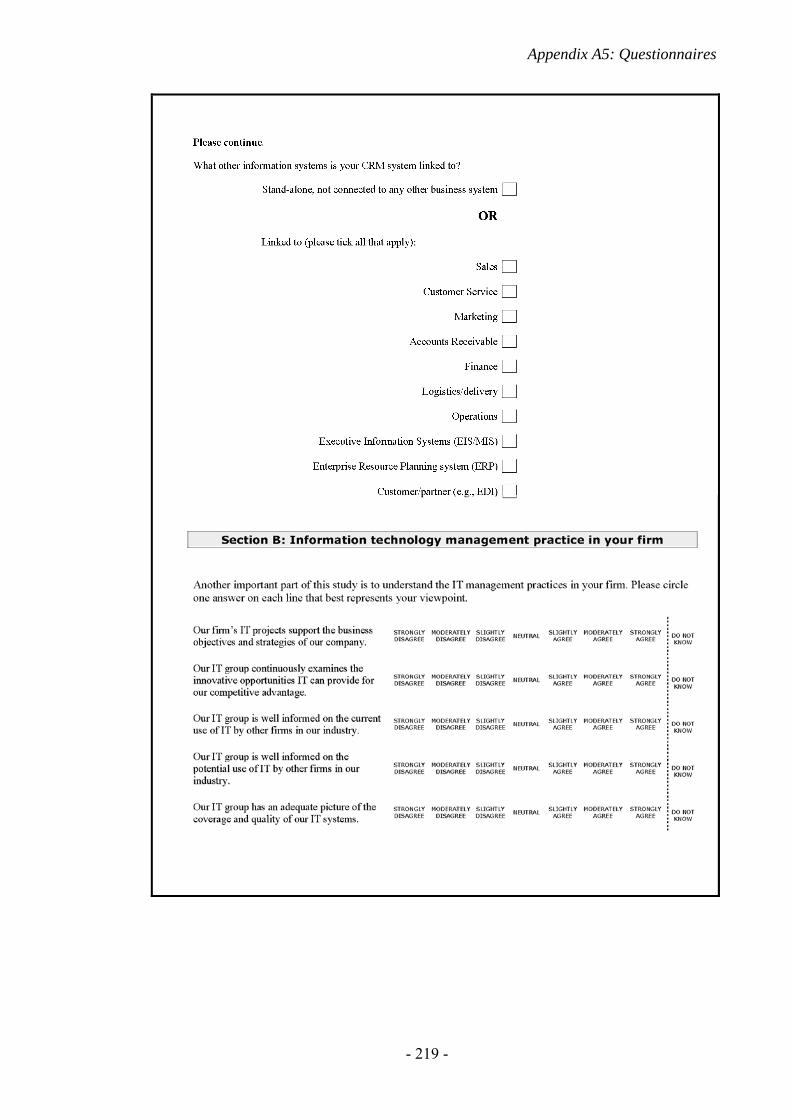
Appendix A5: Questionnaires
- 219 -
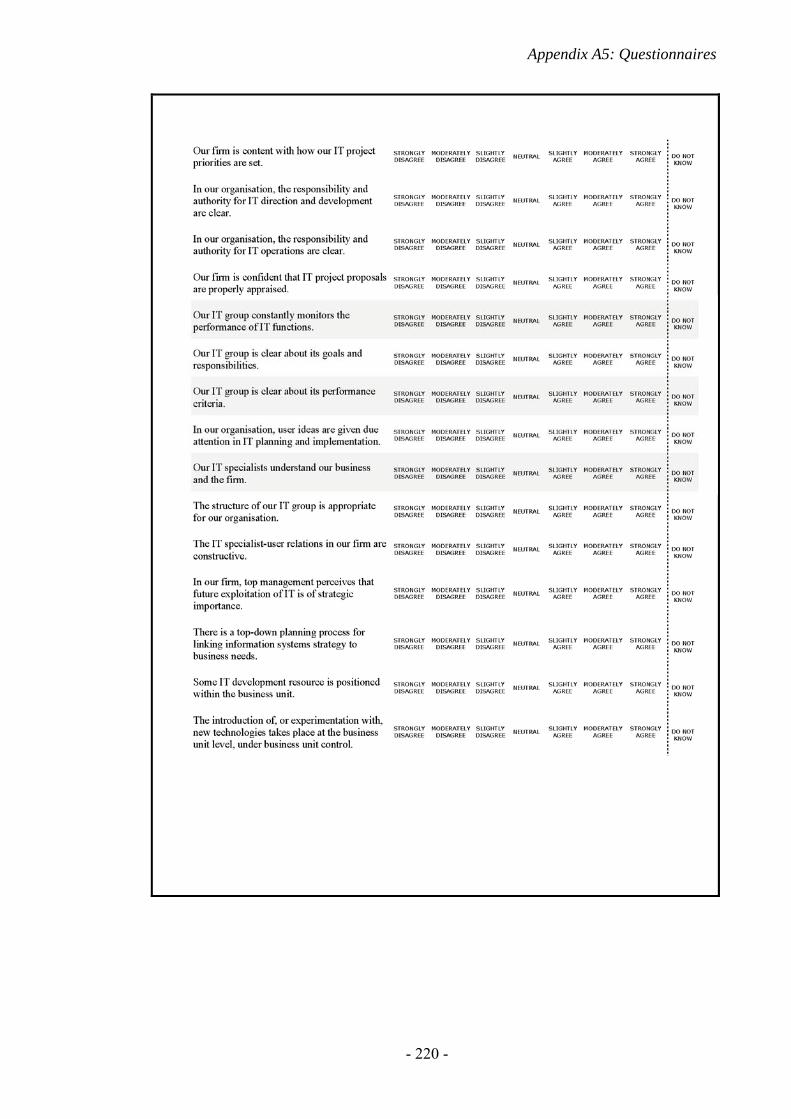
Appendix A5: Questionnaires
- 220 -
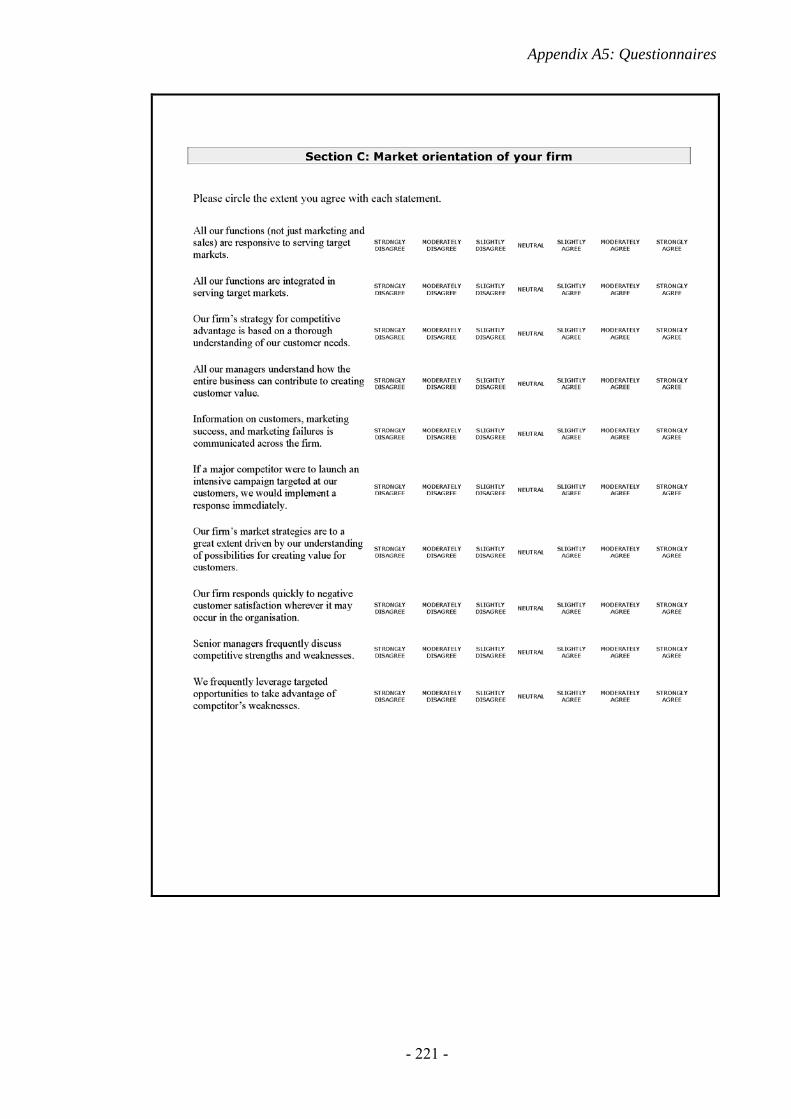
Appendix A5: Questionnaires
- 221 -
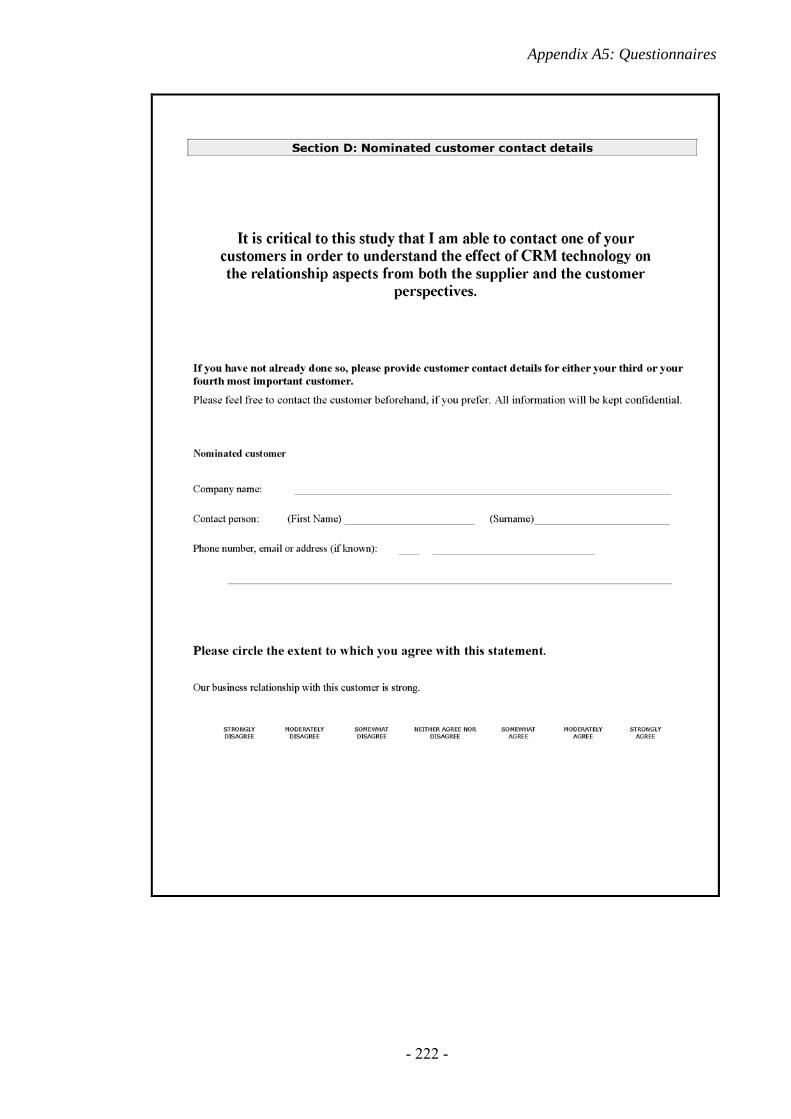
Appendix A5: Questionnaires
- 222 -
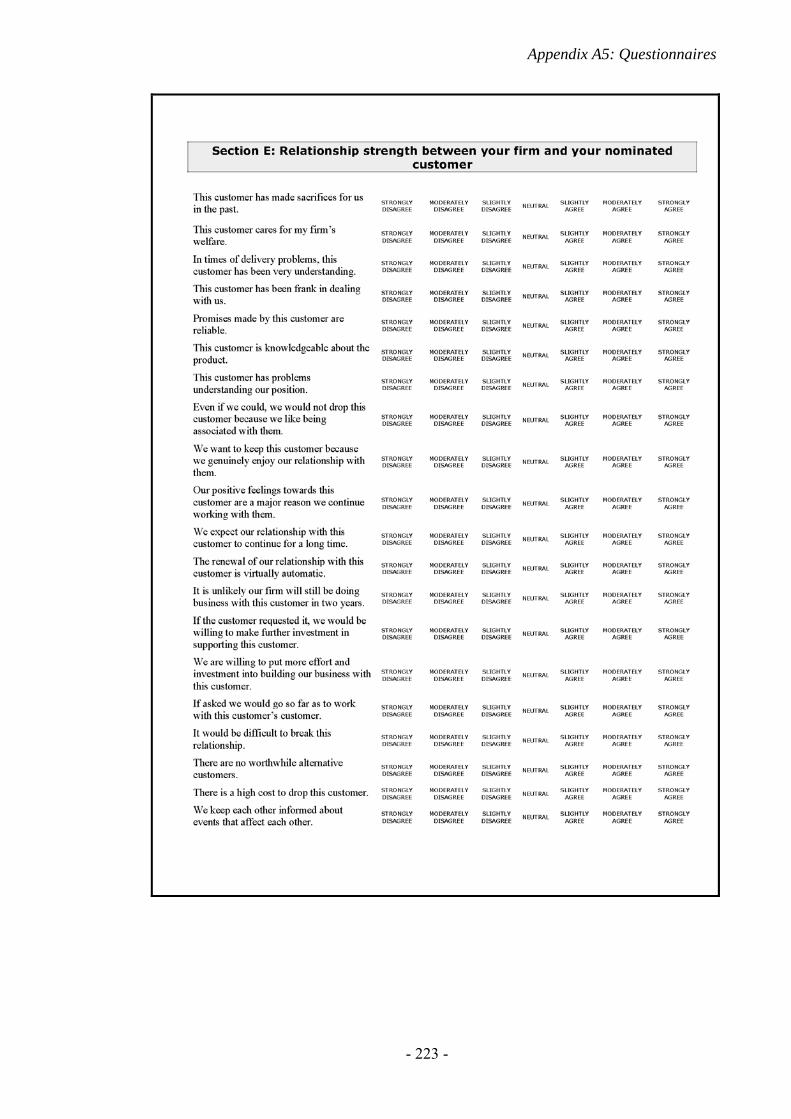
Appendix A5: Questionnaires
- 223 -
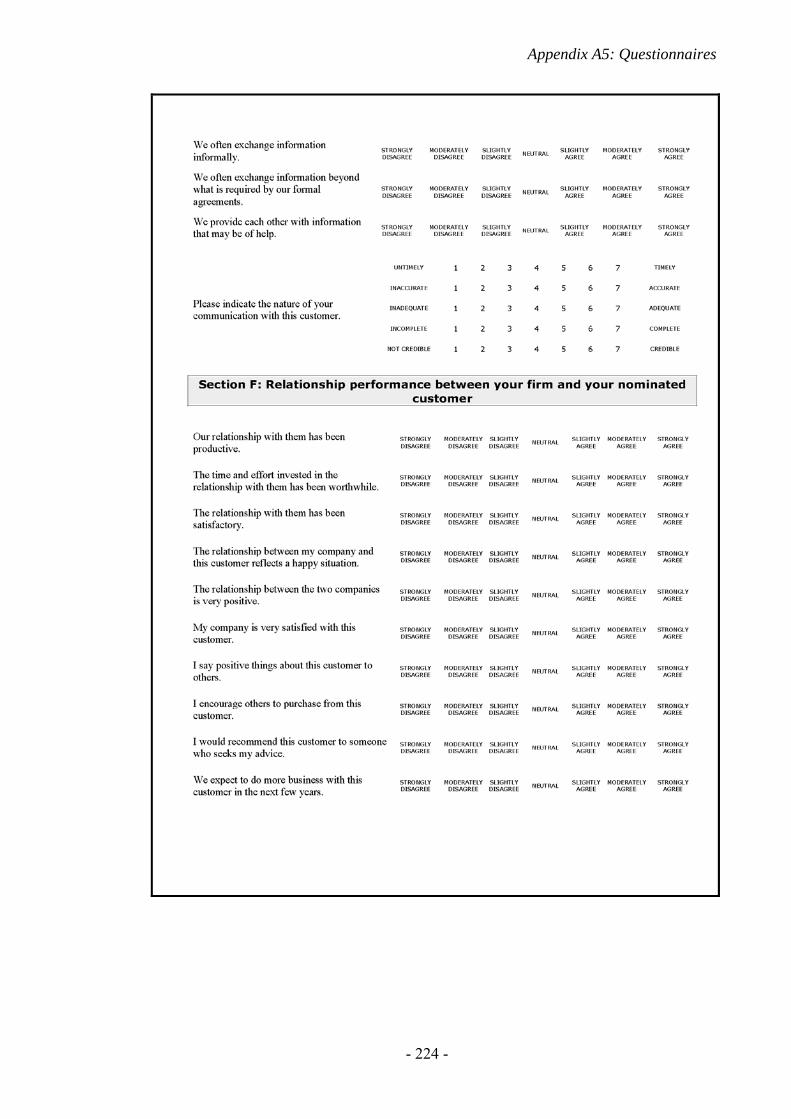
Appendix A5: Questionnaires
- 224 -
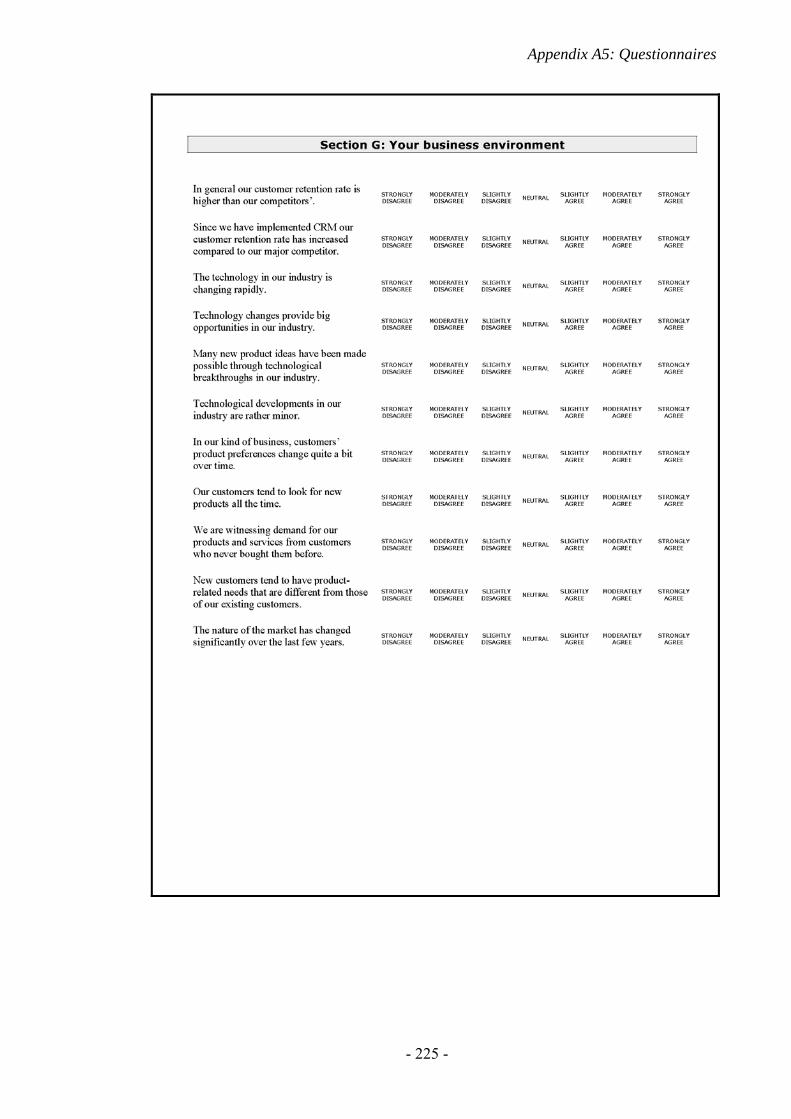
Appendix A5: Questionnaires
- 225 -

Appendix A5: Questionnaires
- 226 -
Appendix A5: Questionnaires
- 227 -
Appendix A5: Questionnaires
- 228 -
Customer Questionnaire
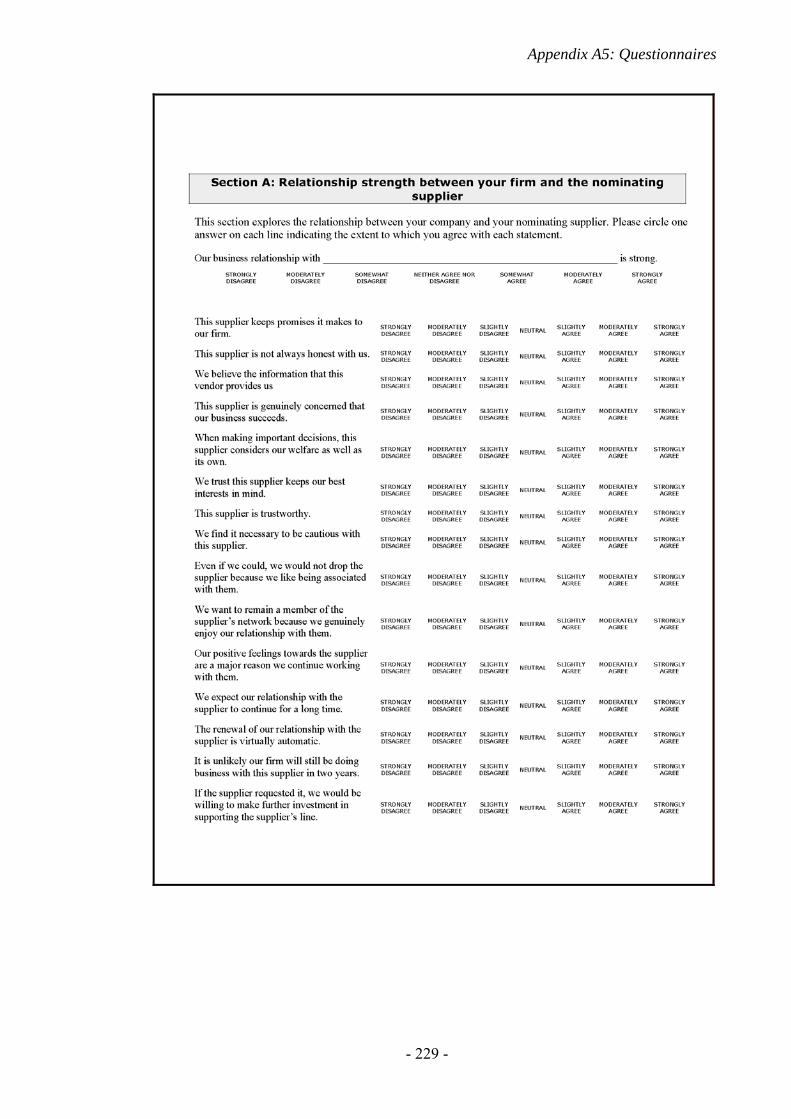
Appendix A5: Questionnaires
- 229 -
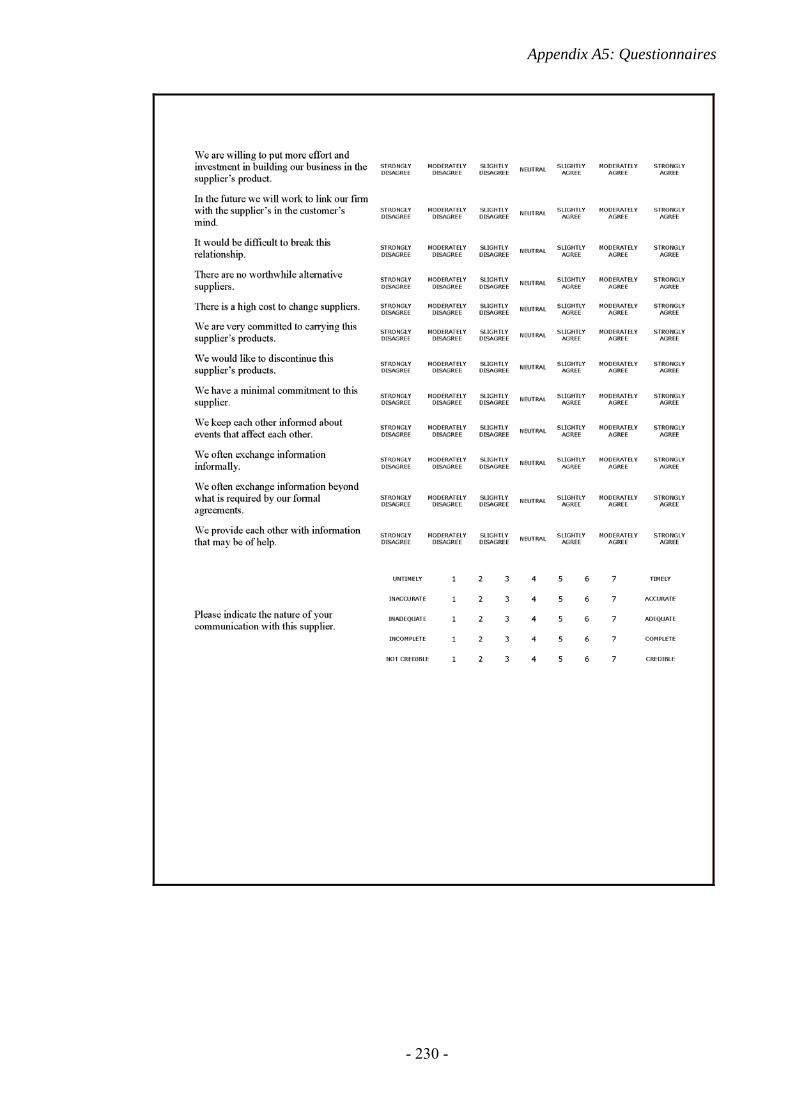
Appendix A5: Questionnaires
- 230 -
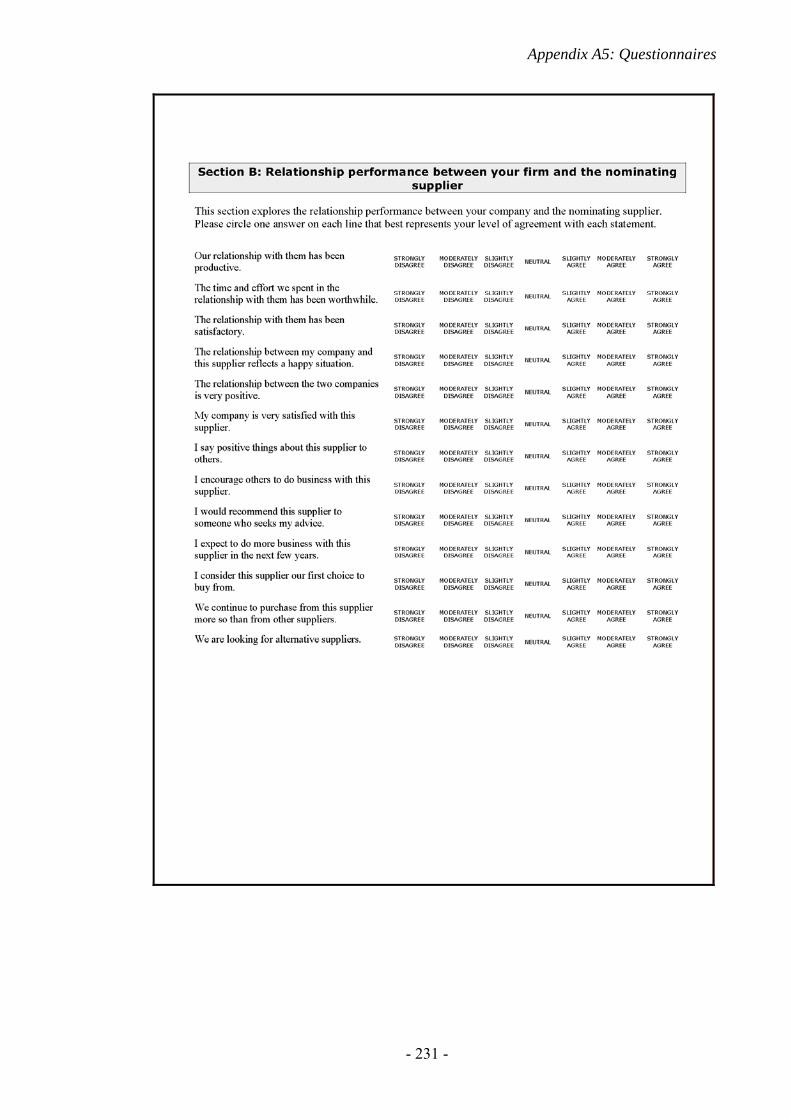
Appendix A5: Questionnaires
- 231 -
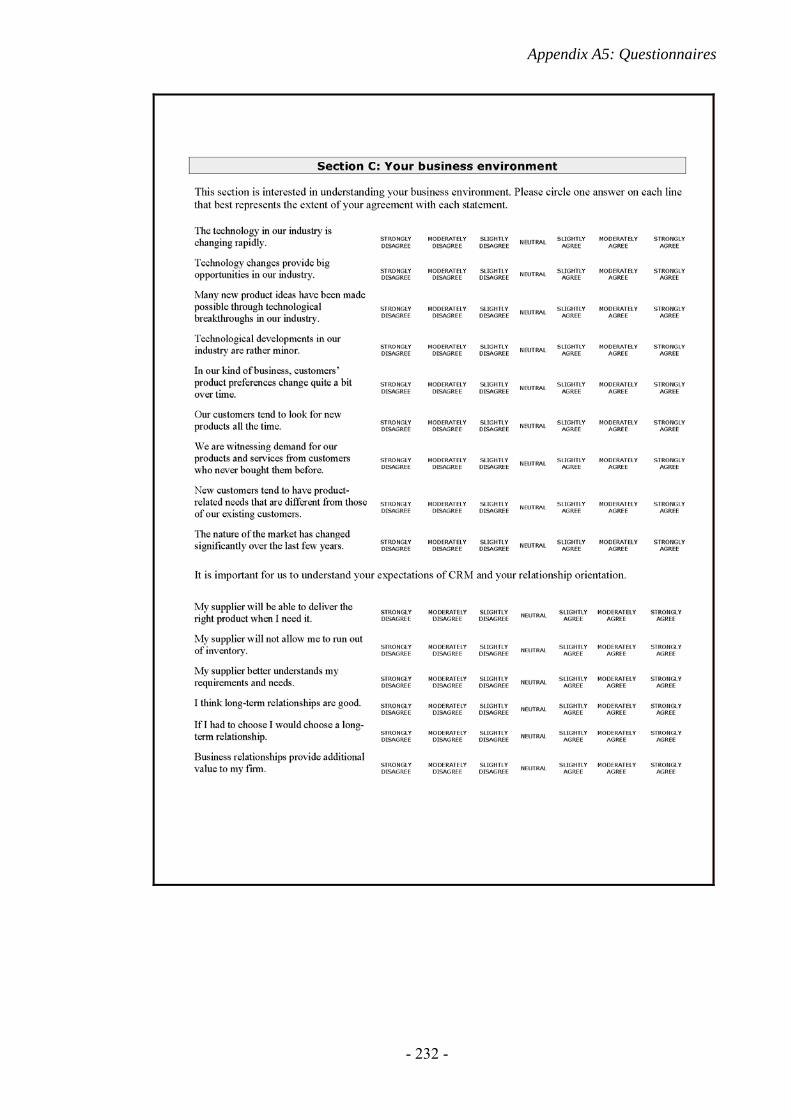
Appendix A5: Questionnaires
- 232 -
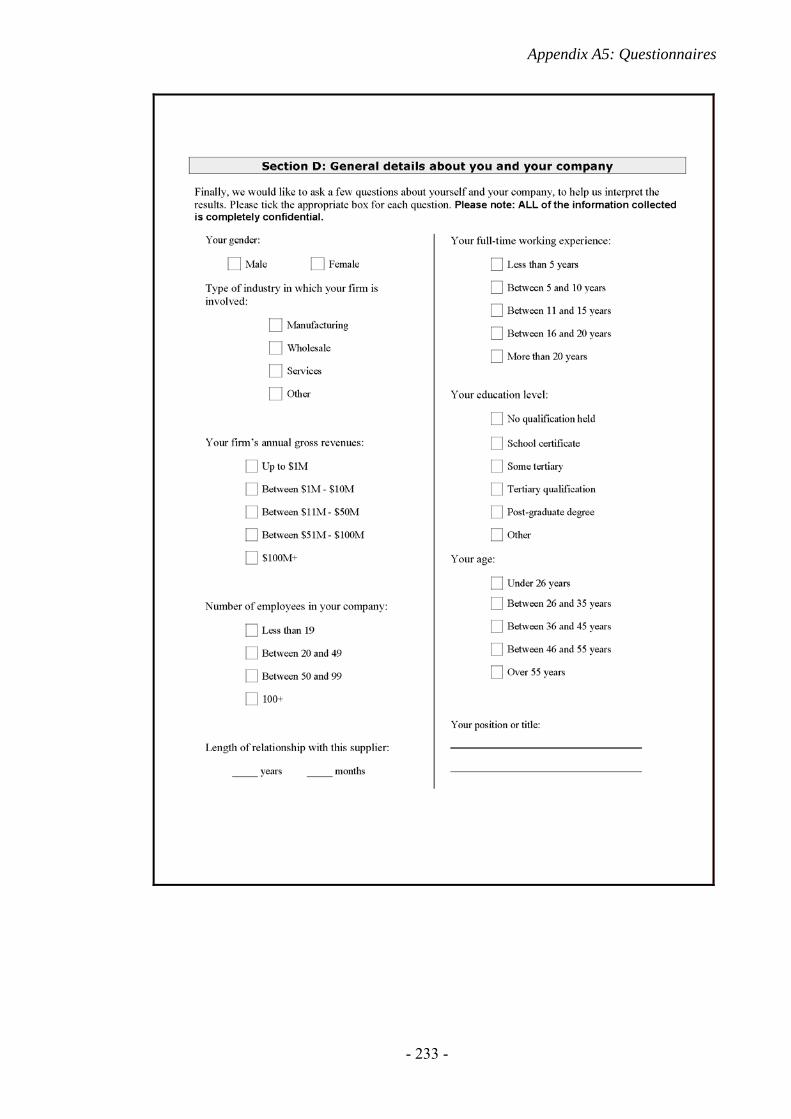
Appendix A5: Questionnaires
- 233 -
Appendix A5: Questionnaires
- 234 -
Appendix A5: Questionnaires
- 235 -
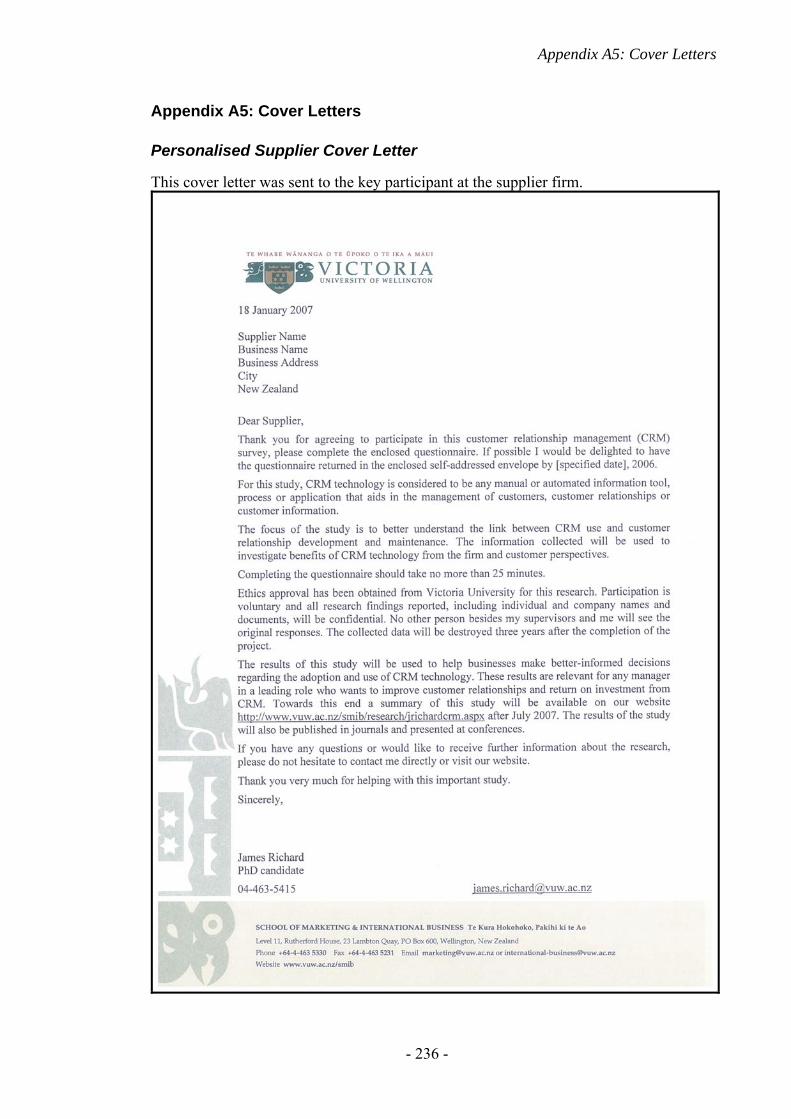
Appendix A5: Cover Letters
- 236 -
Appendix A5: Cover Letters
Personalised Supplier Cover Letter
This cover letter was sent to the key participant at the supplier firm.
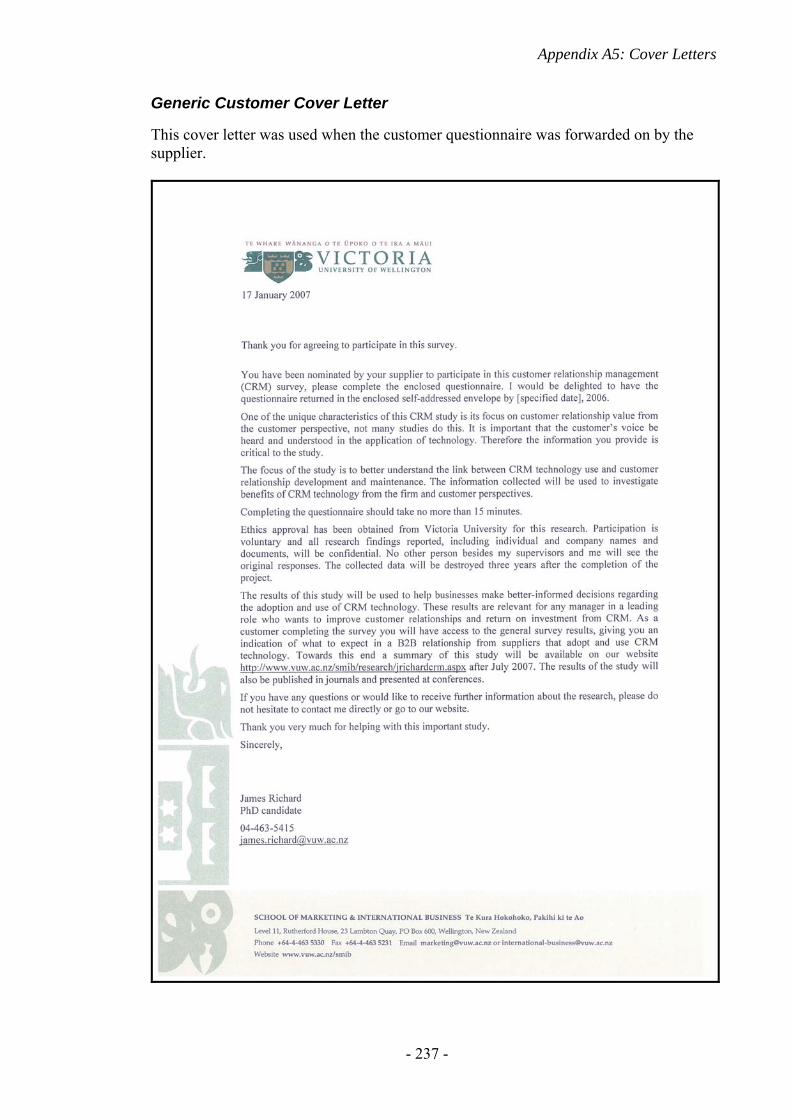
Appendix A5: Cover Letters
- 237 -
Generic Customer Cover Letter
This cover letter was used when the customer questionnaire was forwarded on by the supplier.
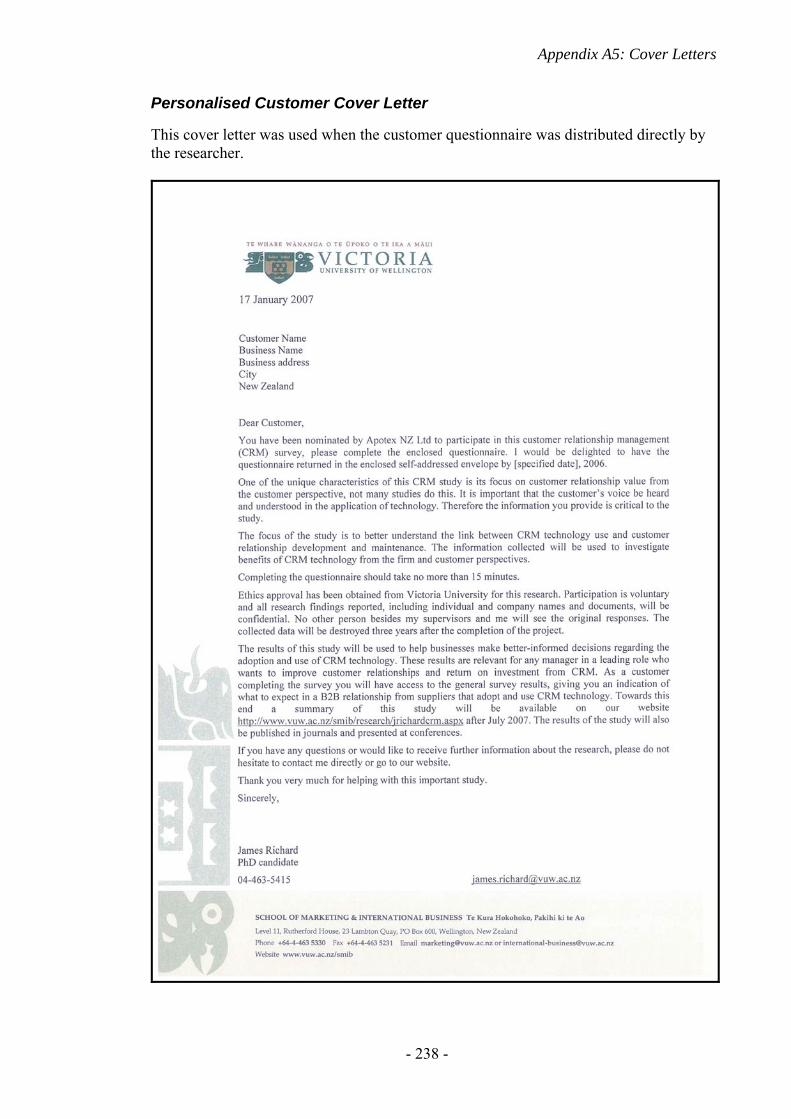
Appendix A5: Cover Letters
- 238 -
Personalised Customer Cover Letter
This cover letter was used when the customer questionnaire was distributed directly by the researcher.
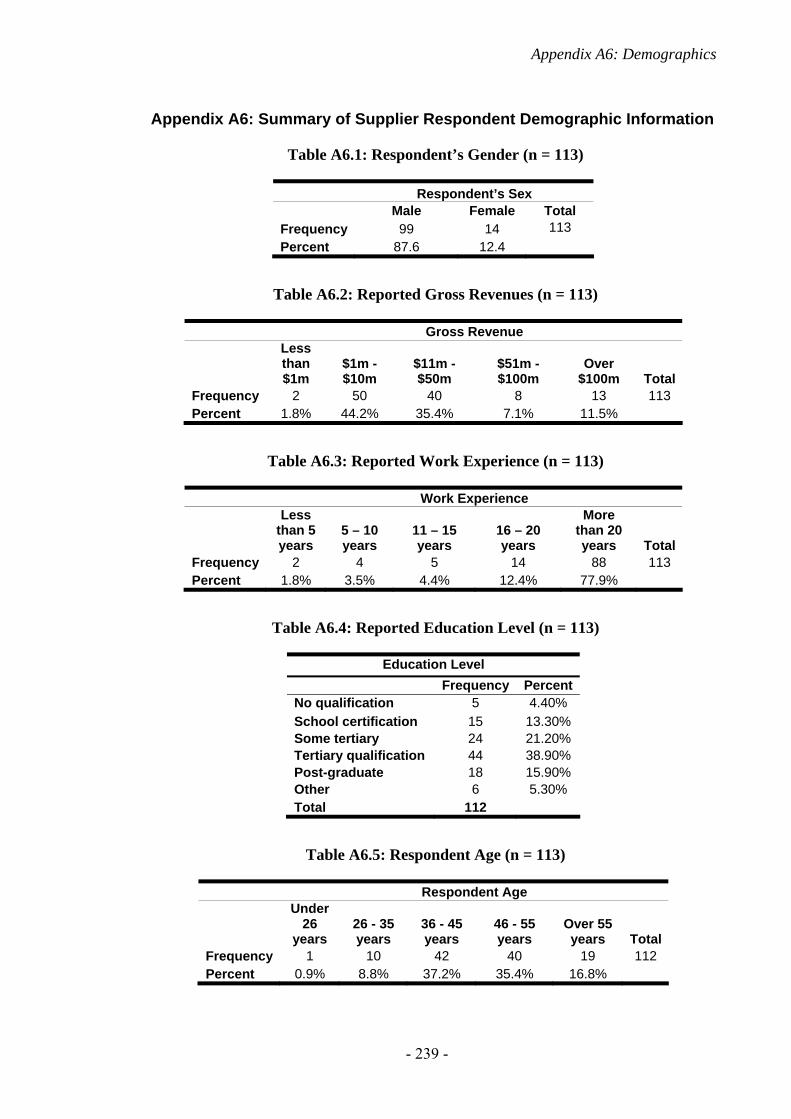
Appendix A6: Demographics
- 239 -
Appendix A6: Summary of Supplier Respondent Demographic Information
Table A6.1: Respondent’s Gender (n = 113)
Respondent’s Sex Male Female Total Frequency 99 14 113 Percent 87.6 12.4
Table A6.2: Reported Gross Revenues (n = 113)
Gross Revenue
Less than $1m
$1m - $10m
$11m - $50m
$51m - $100m
Over $100m Total
Frequency 2 50 40 8 13 113 Percent 1.8% 44.2% 35.4% 7.1% 11.5%
Table A6.3: Reported Work Experience (n = 113)
Work Experience
Less than 5 years
5 – 10 years
11 – 15 years
16 – 20 years
More than 20 years Total
Frequency 2 4 5 14 88 113 Percent 1.8% 3.5% 4.4% 12.4% 77.9%
Table A6.4: Reported Education Level (n = 113)
Education Level Frequency Percent
No qualification 5 4.40% School certification 15 13.30% Some tertiary 24 21.20% Tertiary qualification 44 38.90% Post-graduate 18 15.90% Other 6 5.30% Total 112
Table A6.5: Respondent Age (n = 113)
Respondent Age
Under 26
years 26 - 35 years
36 - 45 years
46 - 55 years
Over 55 years Total
Frequency 1 10 42 40 19 112 Percent 0.9% 8.8% 37.2% 35.4% 16.8%
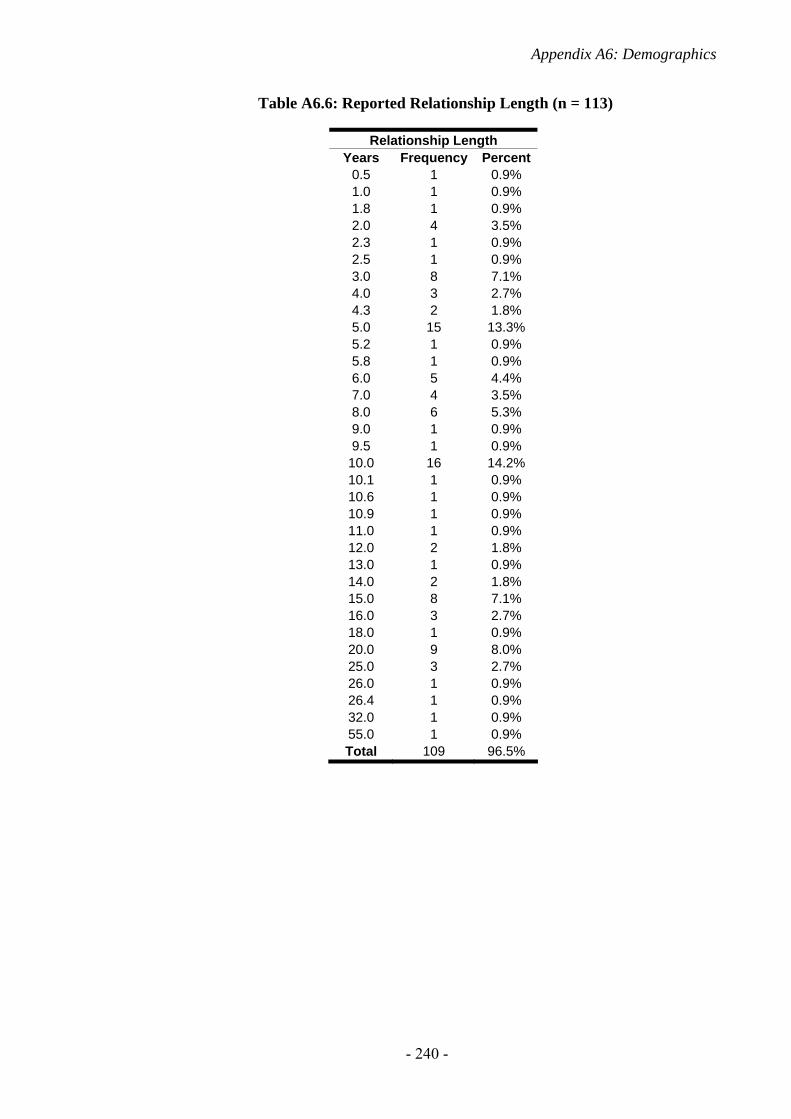
Appendix A6: Demographics
- 240 -
Table A6.6: Reported Relationship Length (n = 113)
Relationship Length Years Frequency Percent
0.5 1 0.9% 1.0 1 0.9% 1.8 1 0.9% 2.0 4 3.5% 2.3 1 0.9% 2.5 1 0.9% 3.0 8 7.1% 4.0 3 2.7% 4.3 2 1.8% 5.0 15 13.3% 5.2 1 0.9% 5.8 1 0.9% 6.0 5 4.4% 7.0 4 3.5% 8.0 6 5.3% 9.0 1 0.9% 9.5 1 0.9%
10.0 16 14.2% 10.1 1 0.9% 10.6 1 0.9% 10.9 1 0.9% 11.0 1 0.9% 12.0 2 1.8% 13.0 1 0.9% 14.0 2 1.8% 15.0 8 7.1% 16.0 3 2.7% 18.0 1 0.9% 20.0 9 8.0% 25.0 3 2.7% 26.0 1 0.9% 26.4 1 0.9% 32.0 1 0.9% 55.0 1 0.9% Total 109 96.5%
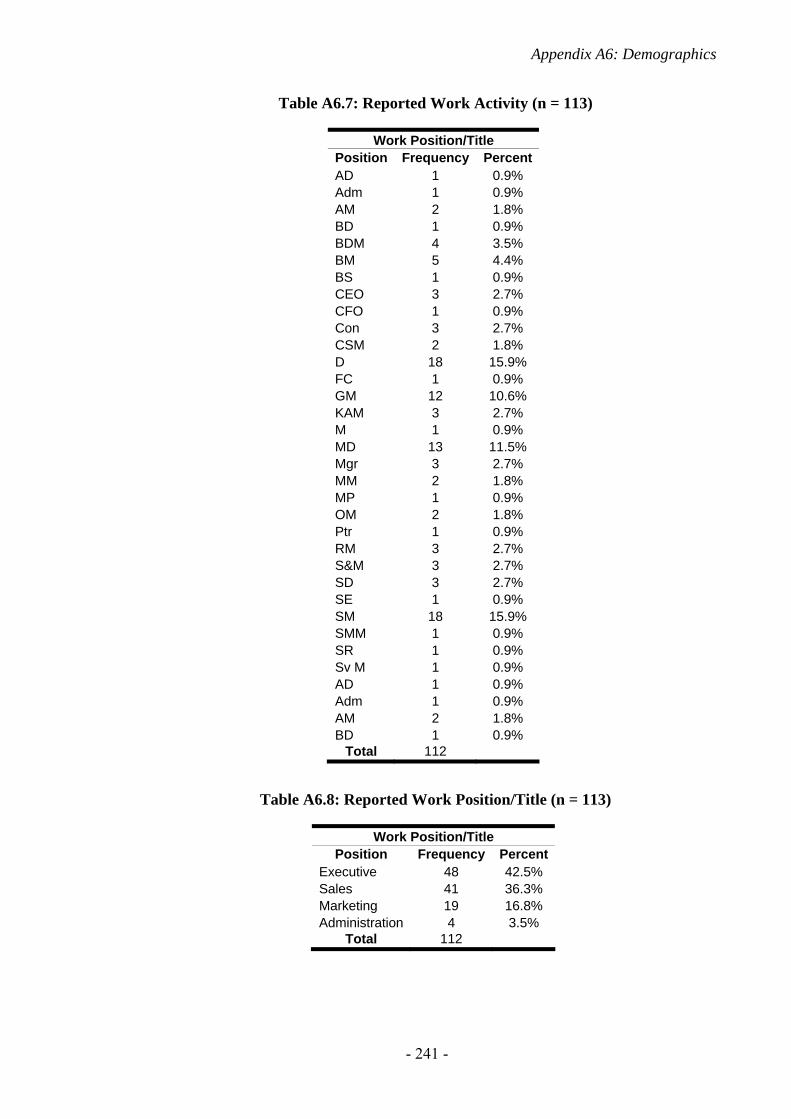
Appendix A6: Demographics
- 241 -
Table A6.7: Reported Work Activity (n = 113)
Work Position/Title Position Frequency PercentAD 1 0.9% Adm 1 0.9% AM 2 1.8% BD 1 0.9% BDM 4 3.5% BM 5 4.4% BS 1 0.9% CEO 3 2.7% CFO 1 0.9% Con 3 2.7% CSM 2 1.8% D 18 15.9% FC 1 0.9% GM 12 10.6% KAM 3 2.7% M 1 0.9% MD 13 11.5% Mgr 3 2.7% MM 2 1.8% MP 1 0.9% OM 2 1.8% Ptr 1 0.9% RM 3 2.7% S&M 3 2.7% SD 3 2.7% SE 1 0.9% SM 18 15.9% SMM 1 0.9% SR 1 0.9% Sv M 1 0.9% AD 1 0.9% Adm 1 0.9% AM 2 1.8% BD 1 0.9%
Total 112
Table A6.8: Reported Work Position/Title (n = 113)
Work Position/Title Position Frequency Percent
Executive 48 42.5% Sales 41 36.3% Marketing 19 16.8% Administration 4 3.5%
Total 112
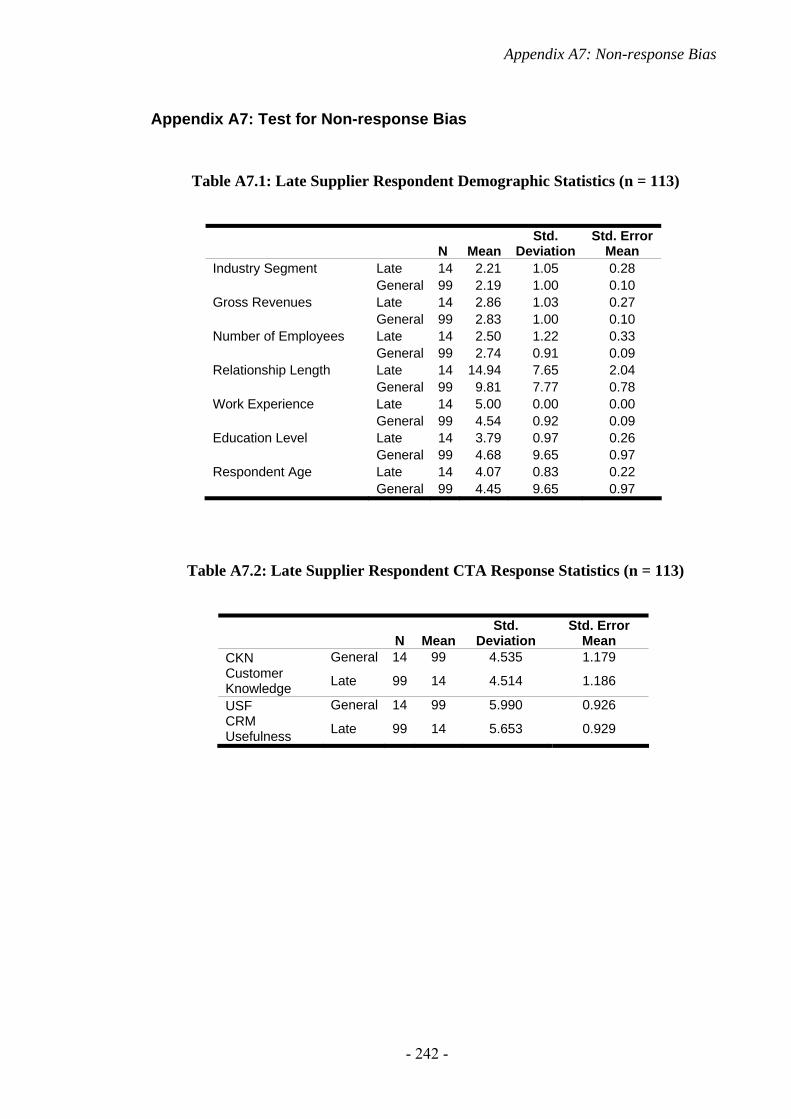
Appendix A7: Non-response Bias
- 242 -
Appendix A7: Test for Non-response Bias
Table A7.1: Late Supplier Respondent Demographic Statistics (n = 113)
N MeanStd.
Deviation Std. Error
Mean Industry Segment Late 14 2.21 1.05 0.28 General 99 2.19 1.00 0.10 Gross Revenues Late 14 2.86 1.03 0.27 General 99 2.83 1.00 0.10 Number of Employees Late 14 2.50 1.22 0.33 General 99 2.74 0.91 0.09 Relationship Length Late 14 14.94 7.65 2.04 General 99 9.81 7.77 0.78 Work Experience Late 14 5.00 0.00 0.00 General 99 4.54 0.92 0.09 Education Level Late 14 3.79 0.97 0.26 General 99 4.68 9.65 0.97 Respondent Age Late 14 4.07 0.83 0.22 General 99 4.45 9.65 0.97
Table A7.2: Late Supplier Respondent CTA Response Statistics (n = 113)
N MeanStd.
Deviation Std. Error
Mean CKN General 14 99 4.535 1.179 Customer Knowledge Late 99 14 4.514 1.186
USF General 14 99 5.990 0.926 CRM Usefulness Late 99 14 5.653 0.929

Appendix A7: Non-response Bias
- 243 -
Table A7.3: Comparing Late Supplier Respondent Demographics (n = 113)
Levene's Test for
Equality of Variances t-test for Equality of Means
F Sig. t df Sig. (2-tailed)
Mean Difference
Std. Error Difference
95% Confidence Interval of the Difference
Lower Upper Industry Segment Equal variances assumed 0.00 0.99 0.08 111.00 0.94 0.02 0.29 -0.55 0.59
Equal variances not assumed 0.08 16.48 0.94 0.02 0.30 -0.61 0.65
Gross Revenues Equal variances assumed 0.18 0.67 0.10 111.00 0.92 0.03 0.29 -0.54 0.60
Equal variances not assumed 0.10 16.68 0.92 0.03 0.29 -0.59 0.65
Number of Employees Equal variances assumed 4.72 0.03 -0.87 111.00 0.38 -0.24 0.27 -0.78 0.30
Equal variances not assumed -0.70 15.10 0.50 -0.24 0.34 -0.96 0.49
Relationship Length Equal variances assumed 0.25 0.62 2.32 111.00 0.02* 5.13 2.21 0.74 9.52
Equal variances not assumed 2.34 17.02 0.03 5.13 2.19 0.51 9.75
Work Experience Equal variances assumed 17.69 0.00 1.89 111.00 0.06 0.46 0.25 -0.02 0.95
Equal variances not assumed 5.03 98.00 0.00** 0.46 0.09 0.28 0.65
Education Level Equal variances assumed 0.33 0.57 -0.34 111.00 0.73 -0.89 2.59 -6.02 4.24
Equal variances not assumed -0.89 108.40 0.38 -0.89 1.00 -2.88 1.10
Respondent Age Equal variances assumed 0.31 0.58 -0.15 111.00 0.88 -0.38 2.59 -5.51 4.75
Equal variances not assumed -0.39 106.32 0.70 -0.38 0.99 -2.35 1.59
* Significant at p < .05 ** Significant at p < .001
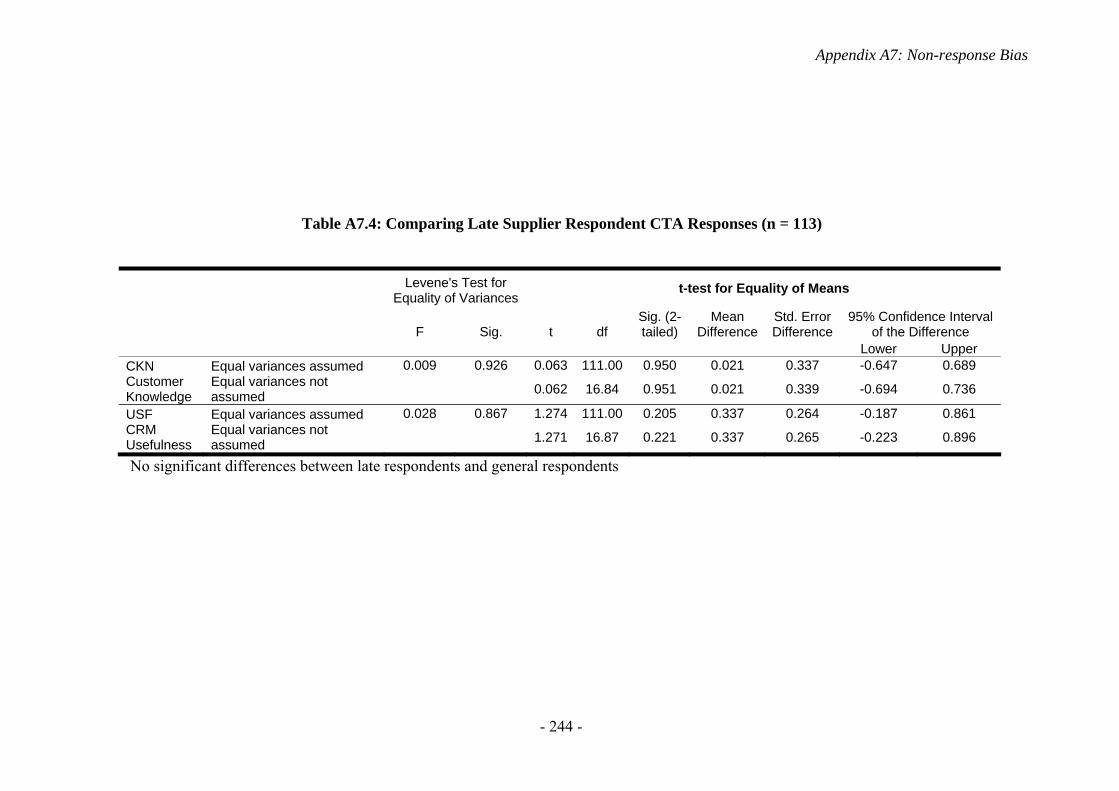
Appendix A7: Non-response Bias
- 244 -
Table A7.4: Comparing Late Supplier Respondent CTA Responses (n = 113)
Levene's Test for
Equality of Variances t-test for Equality of Means
F Sig. t df Sig. (2-tailed)
Mean Difference
Std. Error Difference
95% Confidence Interval of the Difference
Lower Upper CKN Equal variances assumed 0.009 0.926 0.063 111.00 0.950 0.021 0.337 -0.647 0.689 Customer Knowledge
Equal variances not assumed 0.062 16.84 0.951 0.021 0.339 -0.694 0.736
USF Equal variances assumed 0.028 0.867 1.274 111.00 0.205 0.337 0.264 -0.187 0.861 CRM Usefulness
Equal variances not assumed 1.271 16.87 0.221 0.337 0.265 -0.223 0.896
No significant differences between late respondents and general respondents

Appendix A8: DNK Analysis
- 245 -
Appendix A8: Analysis of Supplier “Do Not Know” Answers
Table A8.1: Supplier “Do Not Know” Response Statistics (n = 150)
CODE NAME
IMP _BO
IMP_INV
IMP_ ITCS
IMP_ ITPS
IMP_ ITQL
IMP_ ITPR
IMC_ ITDV
IMC_ ITOP
IMC_ ITAP
IMC_ ITFN
IMC_ ITGL
IMC_ ITPR
IMO_ IDS
IMO_ BS
IMO_ STR
IMO_USR
IMA_ STR
IMA_ INF
IMA_ ITDV
IMA_ BCL "DNK" % "DNK"
1 1006 7 5 5 5 6 1 2 2 1 3 2 5 3 2 1 3 8 3 2 6 1 5.0% 2 3113 7 6 6 6 6 4 6 7 5 6 6 4 6 5 3 5 7 6 6 8 1 5.0% 3 3278 5 3 2 2 3 8 1 1 1 1 1 1 1 1 5 1 2 2 2 2 1 5.0% 4 3322 5 2 2 3 3 8 2 5 4 3 4 4 5 3 2 3 6 3 4 3 1 5.0% 5 B2120 5 4 6 6 6 6 6 6 8 4 4 4 6 7 6 6 4 3 3 2 1 5.0% 6 B3153 6 3 4 3 5 3 4 4 3 8 3 5 2 4 4 5 6 6 2 3 1 5.0% 7 3189 7 7 6 6 7 6 7 7 5 6 6 6 6 7 7 7 7 8 7 8 2 10.0% 8 3035 5 3 4 4 6 6 6 6 5 6 8 8 5 6 7 7 4 4 5 8 3 15.0% 9 3121 6 1 5 5 7 8 6 7 8 7 7 7 2 6 2 7 8 7 1 2 3 15.0% 10 B1232 4 5 7 7 8 6 6 6 5 6 6 5 4 4 4 5 6 6 8 8 3 15.0% 11 B1064 6 6 7 8 6 8 6 6 7 8 6 6 7 7 7 7 7 8 7 7 4 20.0% 12 B1205 6 6 6 4 6 3 4 6 6 4 5 6 6 6 8 8 7 8 6 8 4 20.0% 13 1043 3 8 8 8 3 4 4 3 8 8 8 8 5 5 5 3 3 8 2 2 8 40.0% 14 3147 6 8 8 5 6 3 2 2 2 8 8 8 4 4 8 8 6 8 8 8 10 50.0% 15 1111 7 7 8 8 8 8 8 8 8 8 7 7 8 6 6 8 8 8 8 8 14 70.0% 16 B2022 8 8 8 8 8 8 8 8 8 8 8 8 8 8 8 8 8 8 8 8 20 100.0%
Table 5C.1 shows the frequency (16) and occurrence of “Do Not Know” responses from the Supplier survey (10.7%). Case numbers 1111 and
B2022 (1.3%) were deleted from the final analysis due to the high number of DNK item responses.
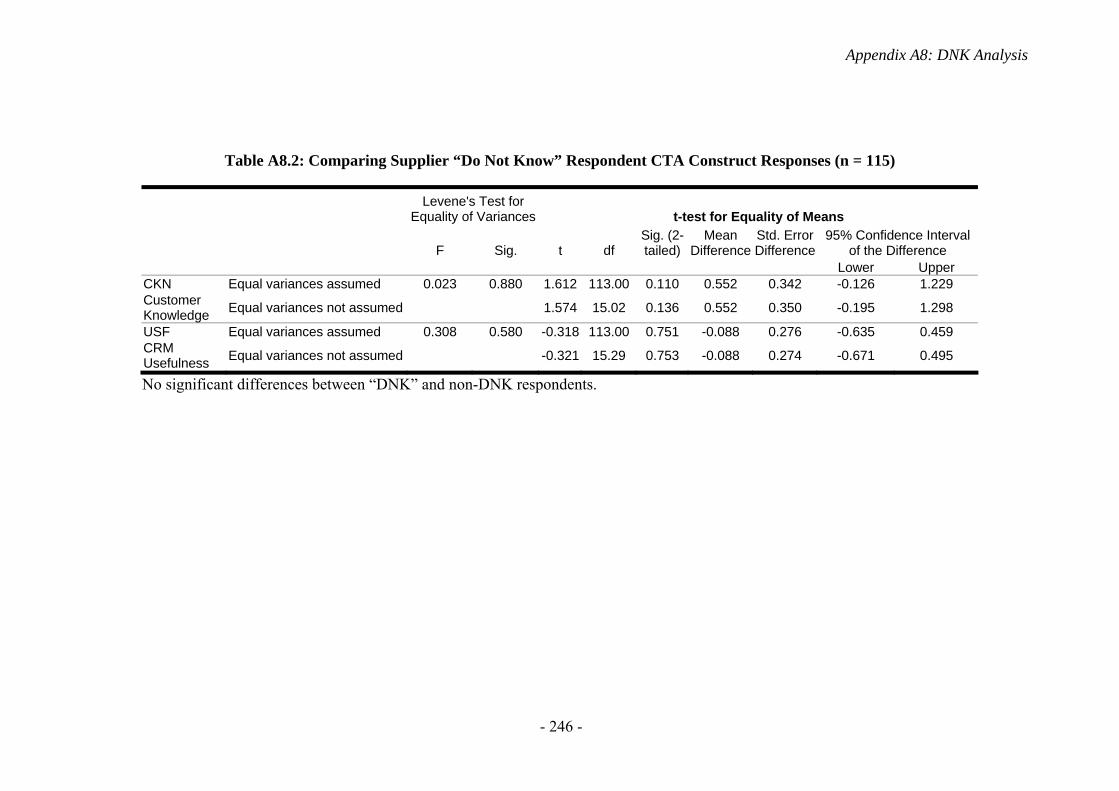
Appendix A8: DNK Analysis
- 246 -
Table A8.2: Comparing Supplier “Do Not Know” Respondent CTA Construct Responses (n = 115)
Levene's Test for
Equality of Variances t-test for Equality of Means
F Sig. t df Sig. (2-tailed)
Mean Difference
Std. Error Difference
95% Confidence Interval of the Difference
Lower Upper CKN Equal variances assumed 0.023 0.880 1.612 113.00 0.110 0.552 0.342 -0.126 1.229 Customer Knowledge Equal variances not assumed 1.574 15.02 0.136 0.552 0.350 -0.195 1.298
USF Equal variances assumed 0.308 0.580 -0.318 113.00 0.751 -0.088 0.276 -0.635 0.459 CRM Usefulness Equal variances not assumed -0.321 15.29 0.753 -0.088 0.274 -0.671 0.495
No significant differences between “DNK” and non-DNK respondents.
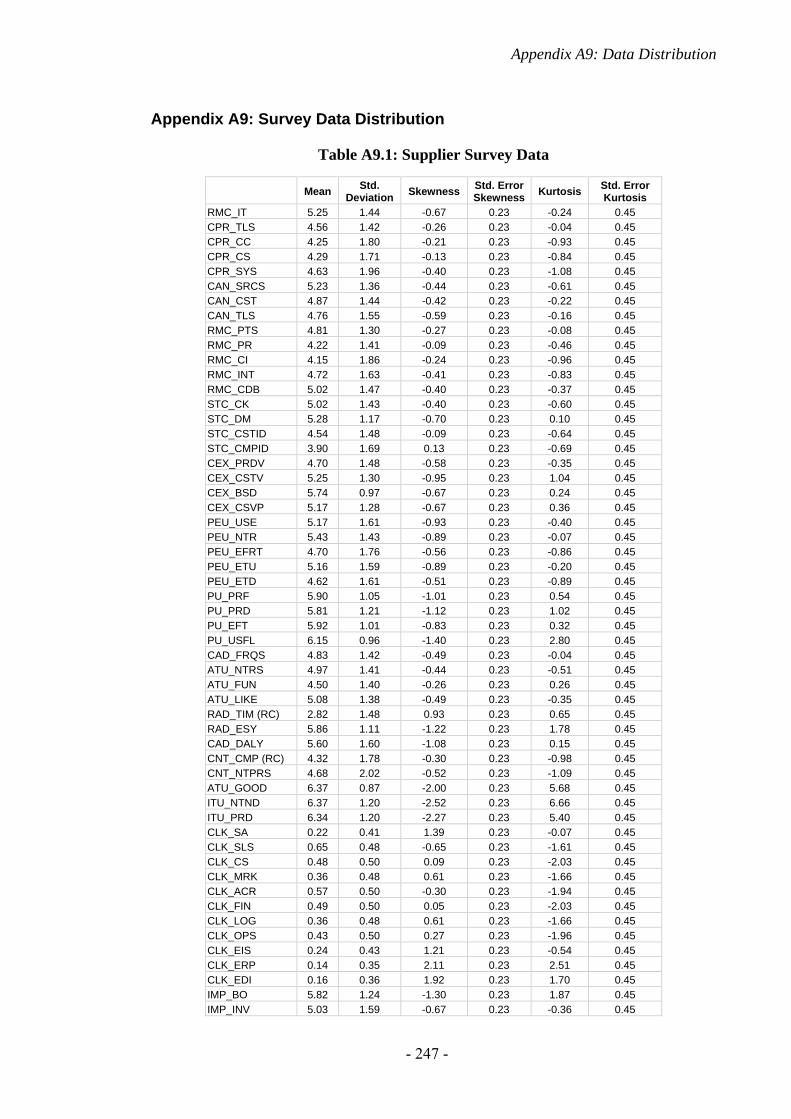
Appendix A9: Data Distribution
- 247 -
Appendix A9: Survey Data Distribution
Table A9.1: Supplier Survey Data
Mean Std. Deviation Skewness Std. Error
Skewness Kurtosis Std. Error Kurtosis
RMC_IT 5.25 1.44 -0.67 0.23 -0.24 0.45 CPR_TLS 4.56 1.42 -0.26 0.23 -0.04 0.45 CPR_CC 4.25 1.80 -0.21 0.23 -0.93 0.45 CPR_CS 4.29 1.71 -0.13 0.23 -0.84 0.45 CPR_SYS 4.63 1.96 -0.40 0.23 -1.08 0.45 CAN_SRCS 5.23 1.36 -0.44 0.23 -0.61 0.45 CAN_CST 4.87 1.44 -0.42 0.23 -0.22 0.45 CAN_TLS 4.76 1.55 -0.59 0.23 -0.16 0.45 RMC_PTS 4.81 1.30 -0.27 0.23 -0.08 0.45 RMC_PR 4.22 1.41 -0.09 0.23 -0.46 0.45 RMC_CI 4.15 1.86 -0.24 0.23 -0.96 0.45 RMC_INT 4.72 1.63 -0.41 0.23 -0.83 0.45 RMC_CDB 5.02 1.47 -0.40 0.23 -0.37 0.45 STC_CK 5.02 1.43 -0.40 0.23 -0.60 0.45 STC_DM 5.28 1.17 -0.70 0.23 0.10 0.45 STC_CSTID 4.54 1.48 -0.09 0.23 -0.64 0.45 STC_CMPID 3.90 1.69 0.13 0.23 -0.69 0.45 CEX_PRDV 4.70 1.48 -0.58 0.23 -0.35 0.45 CEX_CSTV 5.25 1.30 -0.95 0.23 1.04 0.45 CEX_BSD 5.74 0.97 -0.67 0.23 0.24 0.45 CEX_CSVP 5.17 1.28 -0.67 0.23 0.36 0.45 PEU_USE 5.17 1.61 -0.93 0.23 -0.40 0.45 PEU_NTR 5.43 1.43 -0.89 0.23 -0.07 0.45 PEU_EFRT 4.70 1.76 -0.56 0.23 -0.86 0.45 PEU_ETU 5.16 1.59 -0.89 0.23 -0.20 0.45 PEU_ETD 4.62 1.61 -0.51 0.23 -0.89 0.45 PU_PRF 5.90 1.05 -1.01 0.23 0.54 0.45 PU_PRD 5.81 1.21 -1.12 0.23 1.02 0.45 PU_EFT 5.92 1.01 -0.83 0.23 0.32 0.45 PU_USFL 6.15 0.96 -1.40 0.23 2.80 0.45 CAD_FRQS 4.83 1.42 -0.49 0.23 -0.04 0.45 ATU_NTRS 4.97 1.41 -0.44 0.23 -0.51 0.45 ATU_FUN 4.50 1.40 -0.26 0.23 0.26 0.45 ATU_LIKE 5.08 1.38 -0.49 0.23 -0.35 0.45 RAD_TIM (RC) 2.82 1.48 0.93 0.23 0.65 0.45 RAD_ESY 5.86 1.11 -1.22 0.23 1.78 0.45 CAD_DALY 5.60 1.60 -1.08 0.23 0.15 0.45 CNT_CMP (RC) 4.32 1.78 -0.30 0.23 -0.98 0.45 CNT_NTPRS 4.68 2.02 -0.52 0.23 -1.09 0.45 ATU_GOOD 6.37 0.87 -2.00 0.23 5.68 0.45 ITU_NTND 6.37 1.20 -2.52 0.23 6.66 0.45 ITU_PRD 6.34 1.20 -2.27 0.23 5.40 0.45 CLK_SA 0.22 0.41 1.39 0.23 -0.07 0.45 CLK_SLS 0.65 0.48 -0.65 0.23 -1.61 0.45 CLK_CS 0.48 0.50 0.09 0.23 -2.03 0.45 CLK_MRK 0.36 0.48 0.61 0.23 -1.66 0.45 CLK_ACR 0.57 0.50 -0.30 0.23 -1.94 0.45 CLK_FIN 0.49 0.50 0.05 0.23 -2.03 0.45 CLK_LOG 0.36 0.48 0.61 0.23 -1.66 0.45 CLK_OPS 0.43 0.50 0.27 0.23 -1.96 0.45 CLK_EIS 0.24 0.43 1.21 0.23 -0.54 0.45 CLK_ERP 0.14 0.35 2.11 0.23 2.51 0.45 CLK_EDI 0.16 0.36 1.92 0.23 1.70 0.45 IMP_BO 5.82 1.24 -1.30 0.23 1.87 0.45 IMP_INV 5.03 1.59 -0.67 0.23 -0.36 0.45
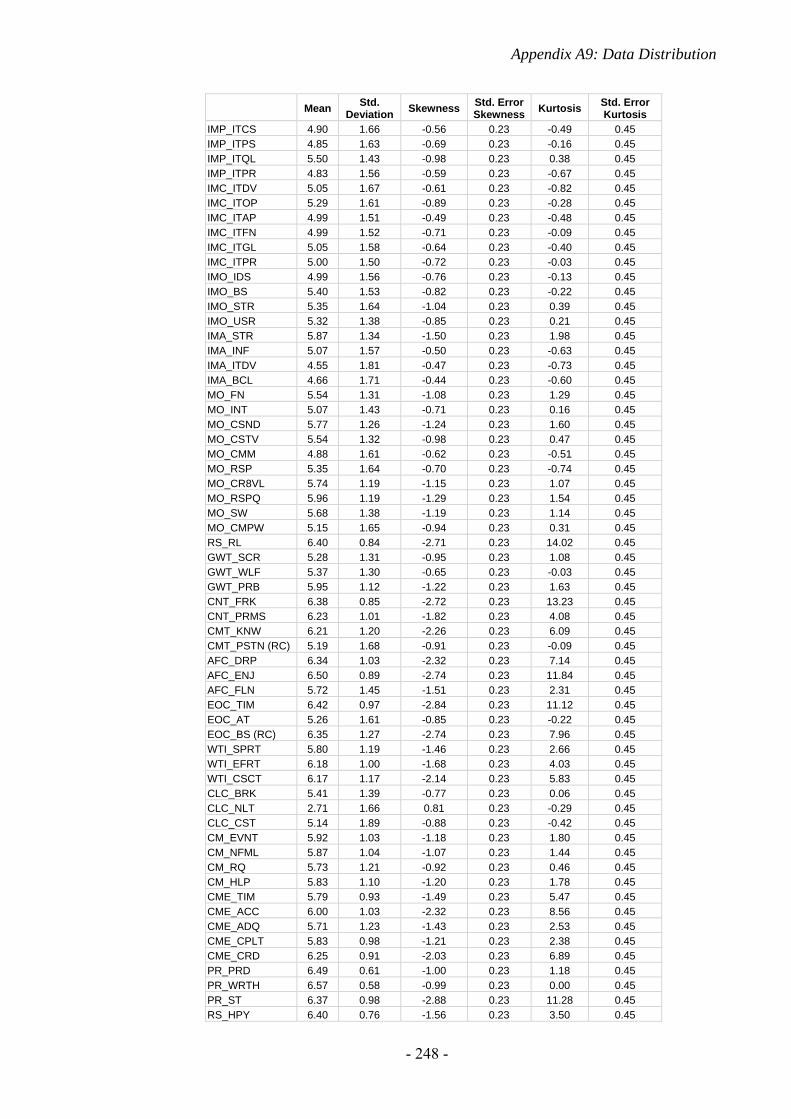
Appendix A9: Data Distribution
- 248 -
Mean Std. Deviation Skewness Std. Error
Skewness Kurtosis Std. Error Kurtosis
IMP_ITCS 4.90 1.66 -0.56 0.23 -0.49 0.45 IMP_ITPS 4.85 1.63 -0.69 0.23 -0.16 0.45 IMP_ITQL 5.50 1.43 -0.98 0.23 0.38 0.45 IMP_ITPR 4.83 1.56 -0.59 0.23 -0.67 0.45 IMC_ITDV 5.05 1.67 -0.61 0.23 -0.82 0.45 IMC_ITOP 5.29 1.61 -0.89 0.23 -0.28 0.45 IMC_ITAP 4.99 1.51 -0.49 0.23 -0.48 0.45 IMC_ITFN 4.99 1.52 -0.71 0.23 -0.09 0.45 IMC_ITGL 5.05 1.58 -0.64 0.23 -0.40 0.45 IMC_ITPR 5.00 1.50 -0.72 0.23 -0.03 0.45 IMO_IDS 4.99 1.56 -0.76 0.23 -0.13 0.45 IMO_BS 5.40 1.53 -0.82 0.23 -0.22 0.45 IMO_STR 5.35 1.64 -1.04 0.23 0.39 0.45 IMO_USR 5.32 1.38 -0.85 0.23 0.21 0.45 IMA_STR 5.87 1.34 -1.50 0.23 1.98 0.45 IMA_INF 5.07 1.57 -0.50 0.23 -0.63 0.45 IMA_ITDV 4.55 1.81 -0.47 0.23 -0.73 0.45 IMA_BCL 4.66 1.71 -0.44 0.23 -0.60 0.45 MO_FN 5.54 1.31 -1.08 0.23 1.29 0.45 MO_INT 5.07 1.43 -0.71 0.23 0.16 0.45 MO_CSND 5.77 1.26 -1.24 0.23 1.60 0.45 MO_CSTV 5.54 1.32 -0.98 0.23 0.47 0.45 MO_CMM 4.88 1.61 -0.62 0.23 -0.51 0.45 MO_RSP 5.35 1.64 -0.70 0.23 -0.74 0.45 MO_CR8VL 5.74 1.19 -1.15 0.23 1.07 0.45 MO_RSPQ 5.96 1.19 -1.29 0.23 1.54 0.45 MO_SW 5.68 1.38 -1.19 0.23 1.14 0.45 MO_CMPW 5.15 1.65 -0.94 0.23 0.31 0.45 RS_RL 6.40 0.84 -2.71 0.23 14.02 0.45 GWT_SCR 5.28 1.31 -0.95 0.23 1.08 0.45 GWT_WLF 5.37 1.30 -0.65 0.23 -0.03 0.45 GWT_PRB 5.95 1.12 -1.22 0.23 1.63 0.45 CNT_FRK 6.38 0.85 -2.72 0.23 13.23 0.45 CNT_PRMS 6.23 1.01 -1.82 0.23 4.08 0.45 CMT_KNW 6.21 1.20 -2.26 0.23 6.09 0.45 CMT_PSTN (RC) 5.19 1.68 -0.91 0.23 -0.09 0.45 AFC_DRP 6.34 1.03 -2.32 0.23 7.14 0.45 AFC_ENJ 6.50 0.89 -2.74 0.23 11.84 0.45 AFC_FLN 5.72 1.45 -1.51 0.23 2.31 0.45 EOC_TIM 6.42 0.97 -2.84 0.23 11.12 0.45 EOC_AT 5.26 1.61 -0.85 0.23 -0.22 0.45 EOC_BS (RC) 6.35 1.27 -2.74 0.23 7.96 0.45 WTI_SPRT 5.80 1.19 -1.46 0.23 2.66 0.45 WTI_EFRT 6.18 1.00 -1.68 0.23 4.03 0.45 WTI_CSCT 6.17 1.17 -2.14 0.23 5.83 0.45 CLC_BRK 5.41 1.39 -0.77 0.23 0.06 0.45 CLC_NLT 2.71 1.66 0.81 0.23 -0.29 0.45 CLC_CST 5.14 1.89 -0.88 0.23 -0.42 0.45 CM_EVNT 5.92 1.03 -1.18 0.23 1.80 0.45 CM_NFML 5.87 1.04 -1.07 0.23 1.44 0.45 CM_RQ 5.73 1.21 -0.92 0.23 0.46 0.45 CM_HLP 5.83 1.10 -1.20 0.23 1.78 0.45 CME_TIM 5.79 0.93 -1.49 0.23 5.47 0.45 CME_ACC 6.00 1.03 -2.32 0.23 8.56 0.45 CME_ADQ 5.71 1.23 -1.43 0.23 2.53 0.45 CME_CPLT 5.83 0.98 -1.21 0.23 2.38 0.45 CME_CRD 6.25 0.91 -2.03 0.23 6.89 0.45 PR_PRD 6.49 0.61 -1.00 0.23 1.18 0.45 PR_WRTH 6.57 0.58 -0.99 0.23 0.00 0.45 PR_ST 6.37 0.98 -2.88 0.23 11.28 0.45 RS_HPY 6.40 0.76 -1.56 0.23 3.50 0.45
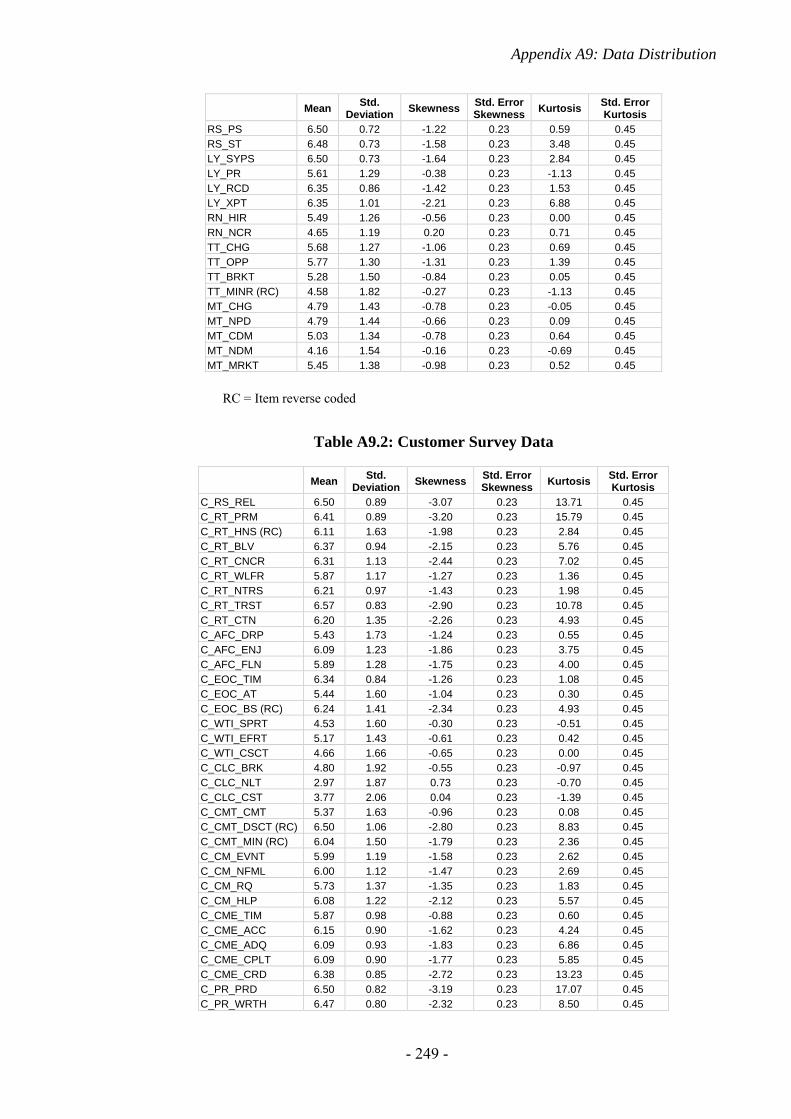
Appendix A9: Data Distribution
- 249 -
Mean Std. Deviation Skewness Std. Error
Skewness Kurtosis Std. Error Kurtosis
RS_PS 6.50 0.72 -1.22 0.23 0.59 0.45 RS_ST 6.48 0.73 -1.58 0.23 3.48 0.45 LY_SYPS 6.50 0.73 -1.64 0.23 2.84 0.45 LY_PR 5.61 1.29 -0.38 0.23 -1.13 0.45 LY_RCD 6.35 0.86 -1.42 0.23 1.53 0.45 LY_XPT 6.35 1.01 -2.21 0.23 6.88 0.45 RN_HIR 5.49 1.26 -0.56 0.23 0.00 0.45 RN_NCR 4.65 1.19 0.20 0.23 0.71 0.45 TT_CHG 5.68 1.27 -1.06 0.23 0.69 0.45 TT_OPP 5.77 1.30 -1.31 0.23 1.39 0.45 TT_BRKT 5.28 1.50 -0.84 0.23 0.05 0.45 TT_MINR (RC) 4.58 1.82 -0.27 0.23 -1.13 0.45 MT_CHG 4.79 1.43 -0.78 0.23 -0.05 0.45 MT_NPD 4.79 1.44 -0.66 0.23 0.09 0.45 MT_CDM 5.03 1.34 -0.78 0.23 0.64 0.45 MT_NDM 4.16 1.54 -0.16 0.23 -0.69 0.45 MT_MRKT 5.45 1.38 -0.98 0.23 0.52 0.45
RC = Item reverse coded
Table A9.2: Customer Survey Data
Mean Std. Deviation Skewness Std. Error
Skewness Kurtosis Std. Error Kurtosis
C_RS_REL 6.50 0.89 -3.07 0.23 13.71 0.45 C_RT_PRM 6.41 0.89 -3.20 0.23 15.79 0.45 C_RT_HNS (RC) 6.11 1.63 -1.98 0.23 2.84 0.45 C_RT_BLV 6.37 0.94 -2.15 0.23 5.76 0.45 C_RT_CNCR 6.31 1.13 -2.44 0.23 7.02 0.45 C_RT_WLFR 5.87 1.17 -1.27 0.23 1.36 0.45 C_RT_NTRS 6.21 0.97 -1.43 0.23 1.98 0.45 C_RT_TRST 6.57 0.83 -2.90 0.23 10.78 0.45 C_RT_CTN 6.20 1.35 -2.26 0.23 4.93 0.45 C_AFC_DRP 5.43 1.73 -1.24 0.23 0.55 0.45 C_AFC_ENJ 6.09 1.23 -1.86 0.23 3.75 0.45 C_AFC_FLN 5.89 1.28 -1.75 0.23 4.00 0.45 C_EOC_TIM 6.34 0.84 -1.26 0.23 1.08 0.45 C_EOC_AT 5.44 1.60 -1.04 0.23 0.30 0.45 C_EOC_BS (RC) 6.24 1.41 -2.34 0.23 4.93 0.45 C_WTI_SPRT 4.53 1.60 -0.30 0.23 -0.51 0.45 C_WTI_EFRT 5.17 1.43 -0.61 0.23 0.42 0.45 C_WTI_CSCT 4.66 1.66 -0.65 0.23 0.00 0.45 C_CLC_BRK 4.80 1.92 -0.55 0.23 -0.97 0.45 C_CLC_NLT 2.97 1.87 0.73 0.23 -0.70 0.45 C_CLC_CST 3.77 2.06 0.04 0.23 -1.39 0.45 C_CMT_CMT 5.37 1.63 -0.96 0.23 0.08 0.45 C_CMT_DSCT (RC) 6.50 1.06 -2.80 0.23 8.83 0.45 C_CMT_MIN (RC) 6.04 1.50 -1.79 0.23 2.36 0.45 C_CM_EVNT 5.99 1.19 -1.58 0.23 2.62 0.45 C_CM_NFML 6.00 1.12 -1.47 0.23 2.69 0.45 C_CM_RQ 5.73 1.37 -1.35 0.23 1.83 0.45 C_CM_HLP 6.08 1.22 -2.12 0.23 5.57 0.45 C_CME_TIM 5.87 0.98 -0.88 0.23 0.60 0.45 C_CME_ACC 6.15 0.90 -1.62 0.23 4.24 0.45 C_CME_ADQ 6.09 0.93 -1.83 0.23 6.86 0.45 C_CME_CPLT 6.09 0.90 -1.77 0.23 5.85 0.45 C_CME_CRD 6.38 0.85 -2.72 0.23 13.23 0.45 C_PR_PRD 6.50 0.82 -3.19 0.23 17.07 0.45 C_PR_WRTH 6.47 0.80 -2.32 0.23 8.50 0.45
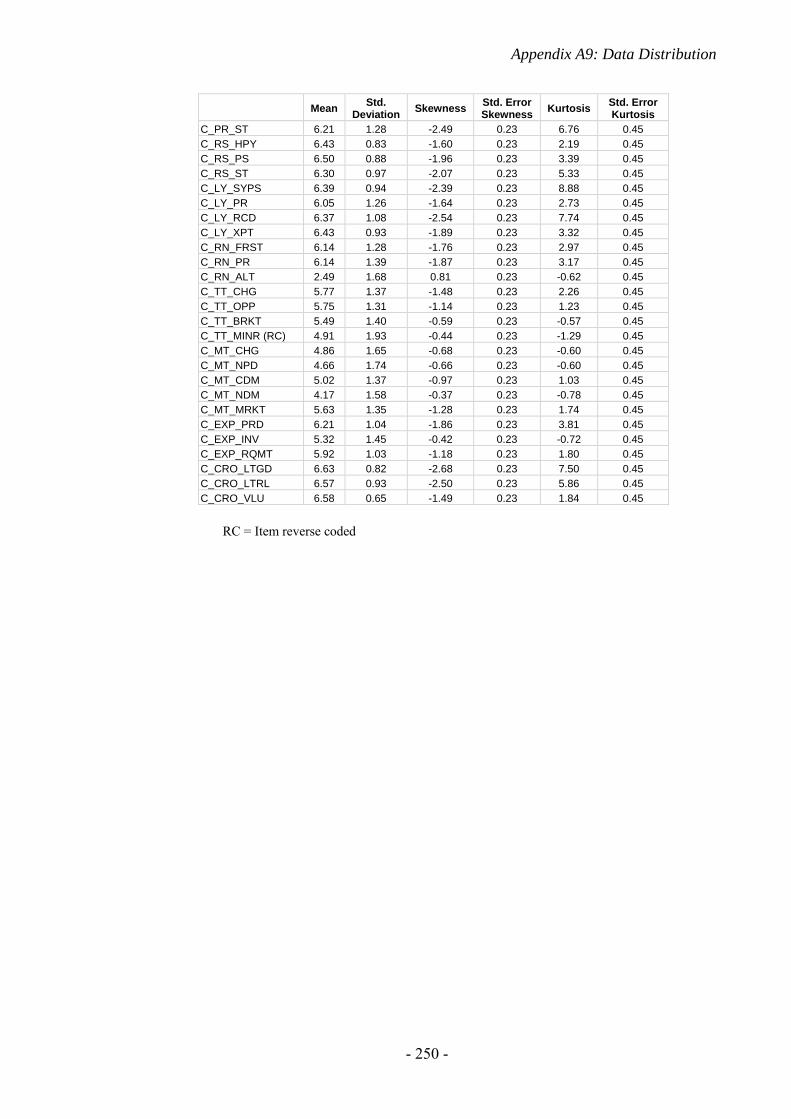
Appendix A9: Data Distribution
- 250 -
Mean Std. Deviation Skewness Std. Error
Skewness Kurtosis Std. Error Kurtosis
C_PR_ST 6.21 1.28 -2.49 0.23 6.76 0.45 C_RS_HPY 6.43 0.83 -1.60 0.23 2.19 0.45 C_RS_PS 6.50 0.88 -1.96 0.23 3.39 0.45 C_RS_ST 6.30 0.97 -2.07 0.23 5.33 0.45 C_LY_SYPS 6.39 0.94 -2.39 0.23 8.88 0.45 C_LY_PR 6.05 1.26 -1.64 0.23 2.73 0.45 C_LY_RCD 6.37 1.08 -2.54 0.23 7.74 0.45 C_LY_XPT 6.43 0.93 -1.89 0.23 3.32 0.45 C_RN_FRST 6.14 1.28 -1.76 0.23 2.97 0.45 C_RN_PR 6.14 1.39 -1.87 0.23 3.17 0.45 C_RN_ALT 2.49 1.68 0.81 0.23 -0.62 0.45 C_TT_CHG 5.77 1.37 -1.48 0.23 2.26 0.45 C_TT_OPP 5.75 1.31 -1.14 0.23 1.23 0.45 C_TT_BRKT 5.49 1.40 -0.59 0.23 -0.57 0.45 C_TT_MINR (RC) 4.91 1.93 -0.44 0.23 -1.29 0.45 C_MT_CHG 4.86 1.65 -0.68 0.23 -0.60 0.45 C_MT_NPD 4.66 1.74 -0.66 0.23 -0.60 0.45 C_MT_CDM 5.02 1.37 -0.97 0.23 1.03 0.45 C_MT_NDM 4.17 1.58 -0.37 0.23 -0.78 0.45 C_MT_MRKT 5.63 1.35 -1.28 0.23 1.74 0.45 C_EXP_PRD 6.21 1.04 -1.86 0.23 3.81 0.45 C_EXP_INV 5.32 1.45 -0.42 0.23 -0.72 0.45 C_EXP_RQMT 5.92 1.03 -1.18 0.23 1.80 0.45 C_CRO_LTGD 6.63 0.82 -2.68 0.23 7.50 0.45 C_CRO_LTRL 6.57 0.93 -2.50 0.23 5.86 0.45 C_CRO_VLU 6.58 0.65 -1.49 0.23 1.84 0.45
RC = Item reverse coded

Appendix A10: Composite Indicator Loadings
- 251 -
Appendix A10: Measurement Item Loading on Composite Indicator Scales
CKN_SSC
C_CMESSC
C_CM_SSC
C_LY_SSC
C_RN_SSC
C_RSASSC
C_RTSSC
IMC_SSC
IMI_SSC
IMO_SSC
IMP_SSC
MO1_SSC
MO2_SSC
MO3_SSC
USF1SSC
USF2SSC
ATU GOOD 0.850 0.629CAD DALY 0.850 0.650CPR TLS 0.784 C CME ACC 0.846 C CME CPLT 0.892 0.503 0.565 0.506 C CME CRD 0.894 0.634 0.606 C CM EVNT 0.574 0.933 0.525 0.569 C CM HLP 0.902 C LY PR 0.866 C LY RCD 0.881 0.635 0.573 C LY XPT 0.797 0.642 C RN ALT 0.608 C RN FRST 0.620 0.919 C RN PR 0.510 0.860 C RS HPY 0.577 0.515 0.590 0.538 0.939 0.590 C RS ST 0.601 0.534 0.927 0.633 C RT NTRS 0.594 0.549 0.533 0.617 0.911 C RT TRST 0.547 0.619 0.832 C RT WLFR 0.846 IMA BCL 0.782 IMA INF 0.596 0.807 0.572 0.560 IMA ITDV 0.746 0.532 0.537 0.536 IMA STR 0.741 IMC ITAP 0.821 0.581 0.736 0.568 IMC ITDV 0.874 0.709 0.652 IMC ITFN 0.832 0.575 0.646 0.622 IMC ITGL 0.891 0.536 0.671 0.653 IMC ITOP 0.854 0.657 0.572 IMC ITPR 0.870 0.673 0.606 IMO BS 0.720 0.561 0.889 0.638 IMO IDS 0.673 0.576 0.858 0.603 IMO STR 0.651 0.522 0.884 0.678 IMO USR 0.762 0.553 0.900 0.673 IMP BO 0.508 0.671 IMP INV 0.626 0.587 0.804 IMP ITCS 0.569 0.523 0.547 0.849 IMP ITPR 0.630 0.599 0.620 IMP ITPS 0.794 IMP ITQL 0.644 0.566 0.650 0.818 MO CMM 0.852 0.622 0.566MO CR8VL 0.851 0.572 0.607MO CSND 0.665 0.917 MO CSTV 0.622 0.919 0.534MO FN 0.634 0.874MO INT 0.553 0.859MO RSPQ 0.691PU EFT 0.712 0.948PU PRD 0.693 0.912PU PRF 0.699 0.918PU USFL 0.723 0.901RAD ESY 0.882 0.702RMC PR 0.864 RMC_PTS 0.833
* only loadings => 0.50 are shown
- 252 -
REFERENCES
Aaker, D. A., Kumar, V., & Day, G. S. (2004). Marketing research (8th ed.). New York: John Wiley & Sons.
Abbott, J., Stone, M., & Buttle, F. (2001). Customer relationship management in practice - a qualitative study. Journal of Database Marketing, 9(1), 24-34.
ACT! (2004). ACT! Products. Retrieved 25 November, 2004, from http://www.act.com/
Adamson, I., Chan, K.-M., & Handford, D. (2003). Relationship marketing: Customer commitment and trust as a strategy for the smaller Hong Kong corporate banking sector. The International Journal of Bank Marketing, 21(6/7), 347-358.
Adebanjo, D. (2003). Classifying and selecting e-CRM applications: An analysis-based proposal. Management Decision, 41(5/6), 570-577.
Ahn, J. Y., Kim, S. K., & Han, K. S. (2003). On the design concepts for CRM system. Industrial Management + Data Systems, 103(5/6), 324-331.
Aijo, T. S. (1996). The theoretical and philosophical underpinnings of relationship marketing: Environmental factors behind the changing marketing paradigm. European Journal of Marketing, 30(2), 8-18.
Alavi, M., & Leidner, D. E. (2001). Review: Knowledge management and knowledge management systems: Conceptual foundations and research issues. MIS Quarterly, 25(1), 107-136.
Alderson, W., & Cox, R. (1948). Towards a theory of marketing. Journal of Marketing, 13(2), 137-152.
Almquist, E., Heaton, C., & Hall, N. (2002). Making CRM make money. Marketing Management, 11(3), 16-21.
Alreck, P., L., & Settle, R. B. (2004). The survey research handbook (3rd ed.). Boston: McGraw-Hill Irwin.
Álvarez, L. S., Martín, A. M. D., & Casielles, R. V. (2007). Relationship marketing and information and communication technologies: Analysis of retail travel agencies. Journal of Travel Research, 45(4), 453-463.
Andaleeb, S. S. (1996). An experimental investigation of satisfaction and commitment in marketing channels: The role of trust and dependence. Journal of Retailing, 72(1), 77-93.
Anderson, E., Lodish, L. M., & Weitz, B. A. (1987). Resource allocation behavior in conventional channels. Journal of Marketing Research, 24(1), 85-97.
References
- 253 -
Anderson, E., & Weitz, B. (1989). Determinants of continuity in conventional industrial channel dyads. Marketing Science, 8(4), 310-323.
Anderson, E., & Weitz, B. (1992). The use of pledges to build and sustain commitment in distribution channels. Journal of Marketing Research, 29(1), 18-34.
Anderson, E. W., Fornell, C., & Lehmann, D. R. (1994). Customer satisfaction, market share, and profitability: Findings from Sweden. Journal of Marketing, 58(3), 53-66.
Anderson, E. W., Fornell, C., & Rust, R. T. (1997). Customer satisfaction, productivity, and profitability: Differences between goods and services. Marketing Science, 16(2), 129-145.
Anderson, J. C. (1995). Relationships in business markets: Exchange episodes, value creation, and their empirical assessment. Journal of the Academy of Marketing Science, 23(4), 346-350.
Anderson, J. C., & Gerbing, D. W. (1988). Structural equation modeling in practice: A review and recommended two-step approach. Psychological Bulletin, 103(3), 411-423.
Anderson, J. C., & Narus, J. A. (1984). A model of the distributor's perspective of distributor-manufacturer working relationships. Journal of Marketing, 48(4), 62-74.
Anderson, J. C., & Narus, J. A. (1990). A model of distributor firm and manufacturer firm working partnerships. Journal of Marketing, 54(1), 42-58.
Ang, L., & Buttle, F. (2002). ROI on CRM: A customer-journey approach. Paper presented at the IMP-conference.
Ang, L., & Buttle, F. (2006). CRM software applications and business performance. Journal of Database Marketing & Customer Strategy Management, 14(1), 4-16.
Ansari, A., & Mela, C. F. (2003). E-customization. Journal of Marketing Research, 40(2), 131-145.
Appiah-Adu, K. (1997). Market orientation and performance: Do the findings established in large firms hold in the small business sector? Journal of Euro - Marketing, 6(3), 1-26.
Appiah-Adu, K., & Singh, S. (1999). Marketing culture and performance in UK service firms. The Service Industries Journal, 19(1), 152-170.
Applegate, L. M., & Elam, J. J. (1992). New information systems leaders: A changing role in a changing world. MIS Quarterly, 16(4), 469-490.
Armstrong, J. S., & Overton, T. S. (1977). Estimating nonresponse bias in mail surveys. Journal of Marketing Research, 14(3), 396-402.
References
- 254 -
Arnett, D. B., Laverie, D. A., & Meiers, A. (2003). Developing parsimonious retailer equity indexes using partial least squares analysis: A method and applications. Journal of Retailing, 79(3), 161-170.
Arnold, C. (2002). So much for CRM. Marketing News, 36(25), 14.
Ashill, N. J., Carruthers, J., & Krisjanous, J. (2005). Antecedents and outcomes of service recovery performance in a public health-care environment. Journal of Services Marketing, 19(5), 293-308.
Ashill, N. J., Carruthers, J., & Krisjanous, J. (2006). The effect of management commitment to service quality on frontline employees' affective and performance outcomes: an empirical investigation of the New Zealand public healthcare sector. International Journal of Nonprofit and Voluntary Sector Marketing, 11(4), 271-287.
Aspinall, E., Nancarrow, C., & Stone, M. (2001). The meaning and measurement of customer retention. Journal of Targeting, Measurement and Analysis for Marketing, 10(1), 79-87.
Assael, H., & Keon, J. (1982). Nonsampling vs. sampling errors in survey research. Journal of Marketing, 46(2), 114-123.
Aulakh, P. S., Kotabe, M., & Sahay, A. (1996). Trust and performance in cross-border marketing partnerships: A behavioral approach. Journal of International Business Studies, 27(5), 1005-1032.
Avlonitis, G. J., & Panagopoulos, N. G. (2005). Antecedents and consequences of CRM technology acceptance in the sales force. Industrial Marketing Management, 34(4), 355-368.
Bagozzi, R. P. (1977). Structural equation models in experimental research. Journal of Marketing Research, 14(2), 209-226.
Bagozzi, R. P. (1994a). Measurement in marketing research: Basic principles of questionnaire design. In R. P. Bagozzi (Ed.), Principles of marketing research (pp. 1-49). Cambridge, MA: Blackwell.
Bagozzi, R. P. (1994b). Structural equation models in marketing research: Basic principles. In R. P. Bagozzi (Ed.), Principles of marketing research (pp. 317-385). Cambridge, MA: Blackwell.
Bagozzi, R. P., & Baumgartner, H. (1994). The evaluation of structural equation models and hypothesis testing. In R. P. Bagozzi (Ed.), Principles of marketing research (pp. 386-422). Cambridge, MA: Blackwell.
Bagozzi, R. P., Gopinath, M., & Nyer, P. U. (1999). The role of emotions in marketing. Journal of the Academy of Marketing Science, 27(2), 184-206.

References
- 255 -
Bagozzi, R. P., & Heatherton, T. F. (1994). A general approach to representing multifaceted personality constructs: Application to state self-esteem. Structural Equation Modeling, 1(1), 35-67.
Bagozzi, R. P., & Yi, Y. (1991). Multitrait-multimethod matrices in consumer research. Journal of Consumer Research, 17(4), 426-439.
Baldauf, A., Reisinger, H., & Moncrief, W. C. (1999). Examining motivations to refuse in industrial mail surveys. Journal of the Market Research Society, 41(3), 345-348.
Barclay, D. W. (1991). Interdepartmental conflict in organizational buying: The impact of the organizational context. Journal of Marketing Research, 28(2), 145-159.
Baxter, R., & Matear, S. (2004). Measuring intangible value in business-to-business buyer-seller relationships: An intellectual capital perspective. Industrial Marketing Management, 33(6), 491-500.
Beath, C. M. (1991). Supporting the information technology champion. MIS Quarterly, 15(3), 355-372.
Beckett-Camarata, E. J., Camarata, M. R., & Barker, R. T. (1998). Integrating internal and external customer relationships through relationship management: A strategic response to a changing global environment. Journal of Business Research, 41(1), 71-81.
Beckett, A., Hewer, P., & Howcroft, B. (2000). An exposition of consumer behaviour in the financial services industry. The International Journal of Bank Marketing, 18(1), 15-26.
Bentler, P. M. (2005). EQS 6 structural equations program manual. Encino, CA: Multivariate Software.
Bernieri, F. J., Gillis, J. S., Davis, J. M., & Grahe, J. E. (1996). Dyad rapport and the accuracy of its judgment across situations: A lens model analysis. Journal of Personality and Social Psychology, 71(1), 110-129.
Berry, L. L. (1983). Relationship marketing. In L. L. Berry, G. L. Shostack & G. D. Upah (Eds.), Emerging perspectives on services marketing (pp. 25-28). Chicago: American Marketing Association.
Berry, L. L. (1995). Relationship marketing of services - Growing interest, emerging perspectives. Journal of the Academy of Marketing Science, 23(4), 236-245.
Bharadwaj, S. G., Varadarajan, P. R., & Fahy, J. (1993). Sustainable competitive advantage in service industries: A conceptual model and research propositions. Journal of Marketing, 57(4), 83-99.
Bhattacherjee, A. (2002). Individual trust in online firms: Scale development and initial test. Journal of Management Information Systems, 19(1), 211-241.
References
- 256 -
Birkinshaw, J., Morrison, A., & Hulland, J. (1995). Structural and competitive determinants of a global integration strategy. Strategic Management Journal, 16(8), 637-655.
Bitner, M. J. (1995). Building service relationships: It's all about promises. Journal of the Academy of Marketing Science, 23(4), 246-251.
Blois, K. J. (1999). Trust in business to business relationships: An evaluation of its status. The Journal of Management Studies, 36(2), 197-215.
Bohling, T., Bowman, D., LaValle, S., Mittal, V., Narayandas, D., Ramani, G., et al. (2006). CRM Implementation: Effectiveness issues and insights. Journal of Service Research, 9(2), 184-194.
Bollen, K. A. (1989). Structural equations with latent variables. New York: John Wiley & Sons.
Bolton, R. N. (1998). A dynamic model of the duration of the customer's relationship with a continuous service provider: The role of satisfaction. Marketing Science, 17(1), 45-65.
Bolton, R. N., & Lemon, K. N. (1999). A dynamic model of customers' usage of services: Usage as an antecedent and consequence of satisfaction. Journal of Marketing Research, 36(2), 171-186.
Boone, D. S., & Roehm, M. (2002). Retail segmentation using artificial neural networks. International Journal of Research in Marketing, 19(3), 287-301.
Bordia, P. (1997). Face-to-face versus computer-mediated communication: A synthesis of the experimental literature. The Journal of Business Communication, 34(1), 99-120.
Bos, N., Olson, J., Gergle, D., Olson, G., & Wright, Z. (2002, 20 - 25 April). Effects of four computer-mediated communications channels on trust development. Paper presented at the SIGCHI Conference on Human Factors in Computing Systems, Minneapolis, Minnesota.
Bose, R. (2002). Customer relationship management: Key components for IT success. Industrial Management & Data Systems, 102(1-2), 89-97.
Bose, R., & Sugumaran, V. (2003). Application of knowledge management technology in customer relationship management. Knowledge and Process Management, 10(1), 3-17.
Boulding, W., Staelin, R., Ehret, M., & Johnston, W. (2005). A customer relationship management roadmap: What is known, potential pitfalls, and where to go. Journal of Marketing, 69(4), 155-166.
Bowen, H. P., & Wiersema, M. F. (1999). Matching method to paradigm in strategy research: Limitations of cross-sectional analysis and some methodological alternatives. Strategic Management Journal, 20(7), 625-636.
References
- 257 -
Brennan, D. R., Turnbull, P. W., & Wilson, D. T. (2003). Dyadic adaptation in business-to-business markets. European Journal of Marketing, 37(11/12), 1636-1665.
Brown, C. V., & Vessey, I. (2003). Managing the next wave of enterprise systems: Leveraging lessons from ERP. MIS Quarterly Executive, 2(1), 65-77.
Bueren, A., Schierholz, R., Kolbe, L. M., & Brenner, W. (2005). Improving performance of customer-processes with knowledge management. Business Process Management Journal, 11(5), 573-588.
Bull, C. (2003). Strategic issues in customer relationship management (CRM) implementation. Business Process Management Journal, 9(5), 592-602.
Burnett, K. (2001). The handbook of key customer relationship management: The definitive guide to winning, managing and developing key account business. London: Pearson Education.
Bush, A. J., Moore, J. B., & Rocco, R. (2005). Understanding sales force automation outcomes: A managerial perspective. Industrial Marketing Management, 34(4), 369-377.
Buttle, F. (2004). Customer relationship management: Concepts and tools. Sydney: Elsevier.
Byrne, B. M. (2001). Structural Equation Modeling with AMOS: Basic concepts, applications, and programming. Mahwah, NJ: Lawrence Erlbaum Associates.
Byrne, B. M. (2006). Structural Equation Modeling with EQS: Basic concepts, applications, and programming (2nd ed.). Mahwah, NJ: Lawrence Erlbaum Associates.
Campbell, A. J. (1998). Cooperation in international value chains: Comparing an exporter's supplier versus customer relationships. The Journal of Business & Industrial Marketing, 13(1), 22-39.
Campbell, D. T. (1955). The informant in quantitative research. The American Journal of Sociology, 60(4), 339-342.
Cannon, J. P., Achrol, R. S., & Gundlach, G. T. (2000). Contracts, norms, and plural form governance. Journal of the Academy of Marketing Science, 28(2), 180-194.
Cannon, J. P., & Homburg, C. (2001). Buyers-supplier relationships and customer firm costs. Journal of Marketing, 65(1), 29-43.
Cano, C. R., Carrillat, F. A., & Jaramillo, F. (2004). A meta-analysis of the relationship between market orientation and business performance: Evidence from five continents. International Journal of Research in Marketing, 21(2), 179-200.
Carver, R. H., & Nash, J. G. (2005). Doing data analysis with SPSS version 12. Southbank, Victoria, Australia: Thomson Learning.
References
- 258 -
Cass, K., & Lauer, T. (2002, 9-11 August). What is the relationship in customer relationship management? Paper presented at the Eighth Americas Conference on Information Systems (AMCIS), Dallas, Texas.
Casselman, G. (2003). Has the ship sailed for CRM projects? Computing Canada, 29(1), 18-19.
Cassels, J. M. (1936). The significance of early economic thought on marketing. Journal of Marketing, 1(2), 129-133.
Chalmeta, R. (2006). Methodology for customer relationship management. The Journal of Systems and Software, 79(7), 1015-1024.
Chan, Y. E., Huff, S. L., Barclay, D. W., & Copeland, D. G. (1997). Business strategic orientation, information systems strategic orientation, and strategic alignment. Information Systems Research, 8(2), 125-150.
Chang, J., Yen, D. C., Young, D., & Ku, C.-Y. (2002). Critical issues in CRM adoption and implementation. International Journal of Services Technology and Management, 3(3), 311-324.
Chau, P. Y. K. (1997). Reexamining a model for evaluating information center success using a structural equation modeling approach. Decision Sciences, 28(2), 309-334.
Chen, I. J., & Popovich, K. (2003). Understanding customer relationship management (CRM): People, process and technology. Business Process Management Journal, 9(5), 672-688.
Chen, J.-S., & Ching, R. K. H. (2004, 5-8 August). An examination of the effects of information and communication technology on customer relationship management and customer lock-in. Paper presented at the Tenth Americas Conference on Information Systems (AMCIS), New York, NY.
Chin, W. W. (1995). Partial least squares is to Lisrel as principal components analysis is to common factor analysis [Electronic Version], 1-6. Retrieved 16 February 2007 from http://disc-nt.cba.uh.edu/chin/technologystudies.pdf.
Chin, W. W. (1998a). Issues and opinion on structural equation modeling. MIS Quarterly, 22(1), vii-xv.
Chin, W. W. (1998b). The partial least squares approach for structural equation modeling. In G. A. Marcoulides (Ed.), Modern methods for business research (pp. 295-336). Mahwah, NJ: Lawrence Erlbaum Associates.
Chin, W. W. (2000). Partial least squares for researchers: An overview and presentation of recent advances using the PLS approach. Retrieved 24 April, 2007, from http://disc-nt.cba.uh.edu/chin/icis2000plstalk.pdf
Chin, W. W., Marcolin, B. L., & Newsted, P. R. (1996, 16-18 December). A partial least squares latent variable modeling approach for measuring interaction
References
- 259 -
effects: Results from a Monte Carlo simulations study and voice mail emotion/adoption study. Paper presented at the Seventeenth International Conference on Information Systems (ICIS) 1996, Cleveland, OH.
Chong, I. E. M., & Dick, G. N. (2004, 6 - 8 August). An empirical investigation into the influence of predictable and timely communication on cognition-based trust. Paper presented at the Tenth Americas Conference on Information Systems (AMCIS), New York, NY.
Christiaanse, E., & Venkatraman, N. (2002). Beyond Sabre: An empirical test of expertise exploitation in electronic channels. MIS Quarterly, 26(1), 15-38.
Chung, E., & Alagaratnam, S. (2001). "Teach ten thousand stars how not to dance": A survey of alternative ontologies in marketing research. Qualitative Market Research, 4(4), 224-234.
Churchill, G. A., Jr. (1979). A paradigm for developing better measures of marketing constructs. Journal of Marketing Research, 16(1), 64-73.
Churchill, G. A., Jr., & Brown, T. J. (2004). Basic marketing research (5th ed.). Sydney: South-Western College.
Churchill, G. A., Jr., & Iacobucci, D. (2005). Marketing research: Methodological foundations (9th ed.). Sydney: South-Western College.
Churchill, G. A., Jr., & Peter, J. P. (1984). Research design effects on the reliability of rating scales: A meta-analysis. Journal of Marketing Research, 21(4), 360-375.
Cochran, J. (2004, 5-8 August). Increasing customer intimacy through customer relationship management. Paper presented at the Tenth Americas Conference on Information Systems (AMCIS), New York, NY.
Cohen, J. (1988). Statistical power analysis for the behavioral sciences. Hillsdale, HJ: Erlbaum.
Cohen, J. (1992). A power primer. Psychological Bulletin, 112(1), 155-159.
Colgate, M. (1998). Creating sustainable competitive advantage through marketing information system technology: A triangulation methodology within the banking industry. The International Journal of Bank Marketing, 16(2), 80-89.
Compeau, D. R., & Higgins, C. A. (1995). Computer self-efficacy: Development of a measure and initial test. MIS Quarterly, 19(2), 189-211.
Compeau, D. R., Higgins, C. A., & Huff, S. (1999). Social cognitive theory and individual reactions to computing technology: A longitudinal study. MIS Quarterly, 23(2), 145-158.
Computerworld. (2004). CRM buyer's guide. Retrieved 25 November, 2004, from http://www.computerworld.com/services/buyersguide/subcat/0,4846,KEY51_SUB6,00.html
References
- 260 -
Cool, K., Dierickx, I., & Jemison, D. (1989). Business strategy, market structure and risk-return relationships: A structural approach. Strategic Management Journal, 10(6), 507-522.
Cooper, B. L., Watson, H. J., Wixom, B. H., & Goodhue, D. L. (2000). Data warehousing supports corporate strategy at First American Corporation. MIS Quarterly, 24(4), 547-567.
Corner, B. A. (2002). Measuring customer relationships. Marketing Management, 11(3), 10-11.
Corner, I., & Hinton, M. (2002). Customer relationship management systems: implementation risks and relationship dynamics. Qualitative Market Research, 5(4), 239-251.
Couper, M. P., Kapteya, A., Schonlau, M., & Winter, J. (2007). Noncoverage and nonresponse in an Internet survey. Social Science Research, 36(1), 131-148.
Coupey, E. (2005). Digital business: Concepts and strategy (2nd ed.). Upper Saddle River, NJ: Pearson-Prentice Hall.
Coviello, N. E., & Brodie, R. J. (2001). Contemporary marketing practices of consumer and business-to-business firms: How different are they? The Journal of Business & Industrial Marketing, 16(5), 382-400.
Coviello, N. E., Brodie, R. J., Danaher, P. J., & Johnston, W. J. (2002). How firms relate to their markets: An empirical examination of contemporary marketing practices. Journal of Marketing, 66(3), 33-46.
Cox, E. P., III. (1980). The optimal number of response alternatives for a scale: A review. Journal of Marketing Research, 17(4), 407-422.
Creswell, J. W. (1998). Qualitative inquiry and research design: Choosing among five traditions. Thousand Oaks: Sage.
Creswell, J. W. (2003). Research design: Qualitative, quantitative, and mixed methods approaches (2nd ed.). Thousand Oaks: Sage.
Crosby, L. A., Evans, K. R., & Cowles, D. (1990). Relationship quality in services selling: An interpersonal influence perspective. Journal of Marketing, 54(3), 68-81.
Crosby, L. A., & Johnson, S. L. (2001). High performance marketing in the CRM era. Marketing Management, 10(3), 10-11.
Crosby, L. A., & Stephens, N. (1987). Effects of relationship marketing on satisfaction, retention, and prices in the life insurance industry. Journal of Marketing Research, 24(4), 404-411.
Croteau, A.-M., & Li, P. (2003). Critical success factors of CRM technological initiatives. Canadian Journal of Administrative Sciences, 20(1), 21-34.
References
- 261 -
Davenport, T. H., & Klahr, P. (1998). Managing customer support knowledge. California Management Review, 40(3), 195-208.
Davids, M. (1999). How to avoid the 10 biggest mistakes in CRM. The Journal of Business Strategy, 20(6), 22-26.
Davis, F. D. (1989). Perceived usefulness, perceived ease of use, and user acceptance of information technology. MIS Quarterly, 13(3), 318-339.
Davis, F. D., Bagozzi, R. P., & Warshaw, P. R. (1989). User acceptance of computer technology: A comparison of two theoretical models. Management Science, 35(8), 982-1003.
Davis, R. (2002). The Wizard of Oz in CRMland: CRM's need for business process management. Information Systems Management, 19(4), 43-48.
Day, G. S. (1994). The capabilities of market-driven organizations. Journal of Marketing, 58(4), 37-52.
Day, G. S. (2000). Managing market relationships. Journal of the Academy of Marketing Science, 28(1), 24-30.
Day, G. S. (2003). Creating a superior customer-relating capability. Sloan Management Review, 44(3), 77-82.
Day, G. S., Deighton, J., Narayandas, D., Gummesson, E., Hunt, S. D., Prahalad, C. K., et al. (2004). Invited commentaries on "Evolving to a new dominant logic for marketing". Journal of Marketing, 68(1), 18-27.
Day, G. S., & Montgomery, D. B. (1999). Charting new directions for marketing. Journal of Marketing, 63(Special Issue), 3-13.
De Wulf, K., Odekerken-Schroder, G., & Iacobucci, D. (2001). Investments in consumer relationships: A cross-country and cross-industry exploration. Journal of Marketing, 65(4), 33-50.
DeJarnett, L., Laskey, R., & Trainor, H. E. (2004). From the CIO point of view: The “IT Doesn’t Matter” debate. Communications of the Association for Information Systems, 13, 443-455.
Delios, A., & Beamish, P., W. (1999). Geographic scope, product diversification, and the corporate performance of Japanese firms. Strategic Management Journal, 20(8), 711-727.
DeLone, W. H., & McLean, E. R. (1992). Information systems success: The quest for the dependent variable. Information Systems Journal, 3(1), 60-95.
DeLone, W. H., & McLean, E. R. (2003). The DeLone and McLean model of information systems success: A ten-year update. Journal of Management Information Systems, 19(4), 9-30.
References
- 262 -
Demirdjian, Z. S. (2003). Marketing research and information systems: The unholy separation of the Siamese twins. Journal of American Academy of Business, Cambridge, 3(1/2), 218-223.
Deng, S., & Dart, J. (1994). Measuring market orientation: A multi-factor, multi-item approach. Journal of Marketing Management, 10(8), 725-742.
Denzin, N. K., & Lincoln, Y. S. (2000). Introduction: The discipline and practice of qualitative research. In N. K. Denzin & Y. S. Lincoln (Eds.), Handbook of qualitative research (2nd ed., pp. 1-28). Thousand Oaks: Sage.
Deshpandé, R. (1983). "Paradigms Lost": On theory and method in research in marketing. Journal of Marketing, 47(4), 101-110.
Deshpandé, R., Farley, J. U., & Webster Jr., F. E. (1993). Corporate culture, customer orientation, and innovativeness in Japanese firms: A quadrad analysis. Journal of Marketing, 57(1), 23-27.
Dess, G. G., & Robinson, R. B., Jr. (1984). Measuring organizational performance in the absence of objective measures: The case of the privately-held firm and conglomerate business unit. Strategic Management Journal, 5(3), 265-273.
destinationCRM. (2002, 21 February). What is CRM? Retrieved 1 September, 2004, from http://www.destinationcrm.com/articles/default.asp?articleid=1747
DeVellis, R. F. (2003). Scale development: Theory and applications (2 ed. Vol. 26). Thousand Oaks, CA: Sage Publications.
DeWitt, T., & Brady, M. K. (2003). Rethinking service recovery strategies. Journal of Service Research, 6(2), 193-207.
Diamantopoulos, A., Reynolds, N., & Schlegelmilch, B. (1994). Pretesting in questionnaire design: The impact of respondent characteristics on error detection. Journal of the Market Research Society, 36(4), 295-311.
Dibb, S. (2001). Banks, customer relationship management and barriers to the segment of one. Journal of Financial Services Marketing, 6(1), 10-23.
Dillman, D. A. (1978). Mail and telephone surveys: The total design method. New York: John Wiley & Sons.
Dillman, D. A. (1998). Mail and other self-administered surveys in the 21st century: The beginning of a new era (pp. 24). Pullman, WA: Washington State University.
Dillman, D. A. (2000). Mail and Internet surveys: The tailored design method (2nd ed.). New York: John Wiley & Sons.
Dillman, D. A., Sinclair, M. D., & Clark, J. R. (1993). Effects of questionnaire length, respondent-friendly design, and a difficult question on response rates for occupant-addressed census mail surveys. Public Opinion Quarterly, 57(3), 289-304.
References
- 263 -
Dishaw, M. T., & Strong, D. M. (1999). Extending the technology acceptance model with task-technology fit constructs. Information & Management, 36(1), 9-21.
Doherty, N. F., & Lockett, N. J. (2007). Closing the gap between the expectations of relationship marketing and the reality of e-CRM. International Journal of E-Business Research, 3(2), i-vi.
Doney, P. M., & Cannon, J. P. (1997). An examination of the nature of trust in buyer-seller relationships. Journal of Marketing, 61(2), 35-51.
Dorsch, M. J., Swanson, S. R., & Kelley, S. W. (1998). The role of relationship quality in the stratification of vendors as perceived by customers. Journal of the Academy of Marketing Science, 26(2), 128-142.
Droege, S. B., & Hoobler, J. M. (2003). Employee turnover and tacit knowledge diffusion: A network perspective. Journal of Managerial Issues, 15(1), 50-64.
Duncan, T., & Moriarty, S. E. (1998). A communication-based marketing model for managing relationships. Journal of Marketing, 62(2), 1-13.
Durand, R. M., & Lambert, Z. V. (1988). Don't know responses in surveys: Analyses and interpretational consequences. Journal of Business Research, 16(2), 169-188.
Dwyer, F. R., Schurr, P. H., & Oh, S. (1987). Developing buyer-seller relationships. Journal of Marketing, 51(2), 11-27.
Dyché, J. (2002). The CRM handbook: A business guide to customer relationship management. Boston: Addison-Wesley.
Easton, G., Easton, A., & Belch, M. (2003). An experimental investigation of electronic focus groups. Information & Management, 40(8), 717-727.
Efron, B., & Gong, G. (1983). A leisurely look at the bootstrap, the jackknife, and cross-validation. The American Statistician, 37(1), 36-48.
Eisenhardt, K. M. (1989). Building theories from case study research. Academy of Management Review, 14(4), 532-550.
Enns, H. G., Huff, S. L., & Higgins, C. A. (2003). CIO lateral influence behaviors: Gaining peers' commitment to strategic information systems. MIS Quarterly, 27(1), 155-176.
Epiphany. (2004). Epiphany products. Retrieved 25 November, 2004, from http://www.epiphany.com/products/
Eunson, B. (2005). Communicating in the 21st Century. Singapore: John Wiley & Sons.
Falk, R. F., & Miller, N. B. (1992). A primer for soft modeling. Akron, OH, USA: The University of Akron Press.
References
- 264 -
Farrell, M. A., & Oczkowski, E. (2002). Are market orientation and learning orientation necessary for superior organizational performance? Journal of Market - Focused Management, 5(3), 197-217.
Farrelly, F., & Quester, P. (2003). The effects of market orientation on trust and commitment: The case of the sponsorship business-to-business relationship. European Journal of Marketing, 37(3/4), 530-553.
Feeny, D. F., Edwards, B. R., & Simpson, K. M. (1992). Understanding the CEO/CIO relationship. MIS Quarterly, 16(4), 435-448.
Fink, A. (1995). The survey handbook (Vol. 1). Thousand Oaks, CA: Sage Publications.
Firth, D. R. (2001, 2-5 August). The organizing vision for customer relationship management. Paper presented at the Seventh Americas Conference on Information Systems (AMCIS), Boston, MA.
Fish, K. E., & Segall, R. S. (2004). A visual analysis of learning rule effects and variable importance for neural networks in data mining operations. Kybernetes, 33(7/8), 1127-1142.
Fjermestad, J., & Hiltz, S. R. (2000). Group support systems: A descriptive evaluation of case and field studies. Journal of Management Information Systems, 17(3), 115-159.
Fjermestad, J., & Romano, N. C., Jr. (2003). Electronic customer relationship management: Revisiting the general principles of usability and resistance--an integrative implementation framework. Business Process Management Journal, 9(5), 572-591.
Fleischer, J. (2002). The scope of CRM. Call Center Magazine, 15(12), 10.
Fontana, A., & Frey, J. H. (1994). Interviewing: The art of science. In N. K. Denzin & Y. S. Lincoln (Eds.), Handbook of qualitative research (pp. 361-376). Thousand Oaks: Sage.
Fontenot, R. J., & Wilson, E. J. (1997). Relational exchange: A review of selected models for a prediction matrix of relationship activities. Journal of Business Research, 39(1), 5-12.
Fornell, C. (1982). A second generation of multivariate analysis - An overview. In C. Fornell (Ed.), A second generation of multivariate analysis: Methods (Vol. 1, pp. 1-21). New York: Praeger.
Fornell, C., & Bookstein, F. L. (1982). Two structural equation models: LISREL and PLS applied to consumer exit-voice theory. Journal of Marketing Research, 19(4), 440-452.
Fornell, C., & Cha, J. (1994). Partial least squares. In R. P. Bagozzi (Ed.), Advanced methods in marketing research (pp. 52-78). Malden, MA: Blackwell Publishers.
References
- 265 -
Fornell, C., & Larcker, D. F. (1981). Evaluating structural equation models with unobservable variables and measurement error. Journal of Marketing Research, 18(1), 39-50.
Fornell, C., Lorange, P., & Roos, J. (1990). The cooperative venture formation process: A latent variable structural modeling approach. Management Science, 36(10), 1246-1255.
Fornell, C., & Yi, Y. (1992). Assumptions of the two-step approach to latent variable modeling. Sociological Methods and Research, 20(3), 291-320.
Fournier, S., Dobscha, S., & Mick, D. G. (1998). Preventing the premature death of relationship marketing. Harvard Business Review, 76(1), 42-49.
Frambach, R. T. (1993). An integrated model of organizational adoption and diffusion of innovations. European Journal of Marketing, 27(5), 22-41.
Freeland, J. G. (Ed.). (2003). The ultimate CRM handbook: Strategies and concepts for building enduring customer loyalty and profitability. New York: McGraw-Hill.
French, M. (2001). CRM fails to deliver. Marketing & eBusiness, August, 42-43.
Frey, J. H. (1983). Survey research by telephone (Vol. 150). Beverly Hills: Sage Publications.
Friedman, B., Khan, P. H., Jr., & Howe, D. C. (2000). Trust online. Communications of the ACM, 43(12), 34-40.
Friman, M., Garling, T., Millett, B., Mattsson, J., & Johnston, R. (2002). An analysis of international business-to-business relationships based on the commitment-trust theory. Industrial Marketing Management, 31(5), 403-409.
Gallivan, M. J. (2001). Organizational adoption and assimilation of complex technological innovations: Development and application of a new framework. Database for Advances in Information Systems, 32(3), 51-81.
Ganesan, S. (1994). Determinants of long-term orientation in buyer-seller relationships. Journal of Marketing, 58(2), 1-19.
Garbarino, E., & Johnson, M. S. (1999). The different roles of satisfaction, trust, and commitment in customer relationships. Journal of Marketing, 63(2), 70-87.
Gefen, D., Karahanna, E., & Straub, D. W. (2003). Trust and TAM in online shopping: An integrated model. MIS Quarterly, 27(1), 51-90.
Gefen, D., & Ridings, C. M. (2002). Implementation team responsiveness and user evaluation of customer relationship management: A quasi-experimental design study of social exchange theory. Journal of Management Information Systems, 19(1), 47-69.
References
- 266 -
Gefen, D., Straub, D. W., & Boudreau, M.-C. (2000). Structural equation modeling and regression: Guidelines for research practice. Communications of the Association for Information Systems, 4, 1-76.
Geisser, S. (1975). The predictive sample reuse method with applications. Journal of the American Statistical Association, 70(350), 320-328.
Geissler, G. L. (2001). Building customer relationships online: The Web site designers' perspective. Journal of Consumer Marketing, 18(6), 488-502.
Gendall, P., Hoek, J., & Esslemont, D. (1995). The effect of appeal, complexity and tone in a mail survey covering letter. Journal of the Market Research Society, 37(3), 251-268.
Gerbing, D. W., & Anderson, J. C. (1988). An updated paradigm for scale development incorporating unidimensionality and its assessment. Journal of Marketing Research, 25(2), 186-192.
Geyskens, I., & Steenkamp, J.-B. E. M. (2000). Economic and social satisfaction: Measurement and relevance to marketing channel relationships. Journal of Retailing, 76(1), 11-32.
Geyskens, I., Steenkamp, J.-B. E. M., & Kumar, N. (1998). Generalizations about trust in marketing channel relationships using meta-analysis. International Journal of Research in Marketing, 15(3), 223-248.
Geyskens, I., Steenkamp, J.-B. E. M., & Kumar, N. (1999). A meta-analysis of satisfaction in marketing channel relationships. Journal of Marketing Research, 36(2), 223-238.
Geyskens, I., Steenkamp, J.-B. E. M., Scheer, L. K., & Kumar, N. (1996). The effects of trust and interdependence on relationship commitment: A trans-Atlantic study. International Journal of Research in Marketing, 13(4), 303-317.
Gfeller, J. D., Lynn, S. J., & Pribble, W. E. (1987). Enhancing hypnotic susceptibility: Interpersonal and rapport factors. Journal of Personality and Social Psychology, 52(3), 586-595.
Goodhue, D. L. (1995). Understanding user evaluations of information systems. Management Science, 41(12), 1827-1844.
Goodhue, D. L., & Thompson, R. L. (1995). Task-technology fit and individual performance. MIS Quarterly, 19(2), 213-236.
Goodhue, D. L., Wixom, B. H., & Watson, H. J. (2002). Realizing business benefits through CRM: Hitting the right target in the right way. MIS Quarterly Executive, 1(2), 79-94.
Gopal, A., Bostrom, R. P., & Chin, W. W. (1992). Applying adaptive structuration theory to investigate the process of group support systems use. Journal of Management Information Systems, 9(3), 45-69.
References
- 267 -
Gounaris, S. P. (2005). Trust and commitment influences on customer retention: Insights from business-to-business services. Journal of Business Research, 58(2), 126-140.
Gray, B. J., Matear, S., Boshoff, C., & Matheson, P. (1998). Developing a better measure of market orientation. European Journal of Marketing, 32(9/10), 884-903.
Gray, B. J., Matear, S., & Matheson, P. K. (2002). Improving service firm performance. Journal of Services Marketing, 16(2/3), 186-200.
Grayson, K., & Ambler, T. (1999). The dark side of long-term relationships in marketing services. Journal of Marketing Research, 36(1), 132-141.
Green, P. E., & Rao, V. R. (1970). Rating scales and information recovery. How many scales and response categories to use? Journal of Marketing, 34(3), 33-39.
Greenberg, P. (2002). CRM at the speed of light: Capturing and keeping customers in Internet real time (2nd ed.). Sydney: McGraw-Hill.
Grégoire, Y., & Fisher, R. J. (2006). The effects of relationship quality on customer retaliation. Marketing Letters, 17(1), 31-46.
Gremler, D. D., & Gwinner, K. P. (1998). Connecting with customers: An examination of rapport in service industries. American Marketing Association. Conference Proceedings, 9, 161-162.
Gremler, D. D., & Gwinner, K. P. (2000). Customer-employee rapport in service relationships. Journal of Service Research, 3(1), 82-104.
Grönroos, C. (1989). Defining marketing: A market-oriented approach. European Journal of Marketing, 23(1), 52-60.
Grönroos, C. (1990). Relationship approach to marketing in service contexts: The marketing and organizational behavior interface. Journal of Business Research, 20(1), 3-11.
Grönroos, C. (1991). The marketing strategy continuum: Towards a marketing concept for the 1990s. Management Decision, 29(1), 7-13.
Grönroos, C. (1994a). From marketing mix to relationship marketing: Towards a paradigm shift in marketing. Australasian Marketing Journal, 2(1), 9-29.
Grönroos, C. (1994b). Quo vadis, marketing? - Toward a relationship marketing paradigm. Journal of Marketing Management, 10(5), 347-360.
Grönroos, C. (1995). Relationship marketing: The strategy continuum. Journal of the Academy of Marketing Science, 23(4), 252-254.
Grönroos, C. (1996). Relationship marketing: Strategic and tactical implications. Management Decision, 34(3), 5-14.
References
- 268 -
Grönroos, C. (2000). Service management and marketing: A customer relationship management approach (2nd ed.). Chichester, England: John Wiley & Sons.
Groves, R. M., & Lyberg, L. E. (1988). An overview of nonresponse issues in telephone surveys. In R. M. Groves, P. P. Biemer, L. E. Lyberg, J. T. Massey, W. L. Nicholls II & J. Waksberg (Eds.), Telephone survey methodology (pp. 191-211). New York: John Wiley & Sons.
Gruen, T. W., Summers, J. O., & Acito, F. (2000). Relationship marketing activities, commitment, and membership behaviors in professional associations. Journal of Marketing, 64(3), 34-49.
Gummesson, E. (1994a). Broadening and specifying relationship marketing. Australasian Marketing Journal, 2(1), 31-43.
Gummesson, E. (1994b). Making relationship marketing operational. International Journal of Service Industry Management, 5(5), 5-20.
Gummesson, E. (2002). Relationship marketing and a new economy: It's time for de-programming. Journal of Services Marketing, 16(7), 585-589.
Gummesson, E. (2003). All research is interpretive! The Journal of Business & Industrial Marketing, 18(6/7), 482-492.
Gummesson, E. (2004). Return on relationships (ROR): The value of relationship marketing and CRM in business-to-business contexts. The Journal of Business and Industrial Marketing, 19(2), 136-148.
Gundlach, G. T., Achrol, R. S., & Mentzer, J. T. (1995). The structure of commitment in exchange. Journal of Marketing, 59(1), 78-92.
Guo, C. (2002). Market orientation and business performance: A framework for service organizations. European Journal of Marketing, 36(9/10), 1154-1163.
Hair, J. F., Jr., Black, W. C., Babin, B. J., Andersen, R. E., & Tatham, R. L. (2006). Mutilvariate data analysis (6th ed.). Upper Saddle River, NJ: Pearson Prentice Hall.
Hair, J. F., Jr., Bush, R. P., & Ortinau, D. J. (2003). Marketing research: Within a changing information environment. Boston: McGraw-Hill Irwin.
Han, J. K., Kim, N., & Srivastava, R. K. (1998). Market orientation and organizational performance: Is innovation a missing link? Journal of Marketing, 62(4), 30-45.
Hansotia, B. (2002). Gearing up for CRM: Antecedents to successful implementation. Journal of Database Marketing, 10(2), 121-132.
Harker, M. J. (1999). Relationship marketing defined? An examination of current relationship marketing definitions. Marketing Intelligence & Planning, 17(1), 13-20.
References
- 269 -
Hau, K.-T., & Marsh, H. W. (2004). The use of item parcels in structural equation modelling: Non-normal data and small sample sizes. British Journal of Mathematical & Statistical Psychology, 57, 327-351.
Häubl, G. (1996). A cross-national investigation of the effects of country of origin and brand name on the evaluation of a new car. International Marketing Review, 13(5), 76-97.
Hausman, A. (2001). Variations in relationship strength and its impact on performance and satisfaction in business relationships. The Journal of Business & Industrial Marketing, 16(6/7), 600-616.
Heck, R. H. (1998). Factor analysis: Exploratory and confirmatory approaches. In G. A. Marcoulides (Ed.), Modern methods for business research (pp. 177-215). Mahwah, NJ: Lawrence Erlbaum Associates.
Heckmann, P., Shorten, D., & Engel, H. (2003). Capturing the value of supply chain management. Retrieved 18 November, 2004, from http://www.strategy-business.com/press/enewsarticle/22165?pg=0
Heide, J. B., & John, G. (1992). Do norms matter in marketing relationships? Journal of Marketing, 56(2), 32-44.
Helfert, G., Ritter, T., & Walter, A. (2002). Redefining market orientation from a relationship perspective: Theoretical considerations and empirical results. European Journal of Marketing, 36(9/10), 1119-1139.
Henderson, J. C., & Venkatraman, H. (1999). Strategic alignment: Leveraging information technology for transforming organizations. IBM Systems Journal, 38(2/3), 472-484.
Henderson, S. (1998). No such thing as market orientation - a call for no more papers. Management Decision, 36(9), 598-609.
Hess, R. L., Rubin, R. S., & West, L. A., Jr. (2004). Geographic information systems as a marketing information system technology. Decision Support Systems, 38(2), 197-212.
Hirschman, E. C. (1986). Humanistic inquiry in marketing research: Philosophy, method, and criteria. Journal of Marketing Research, 23(3), 237-249.
Hirschowitz, A. (2001). Closing the CRM loop: The 21st century marketer's challenge: Transforming customer insight into customer value. Journal of Targeting, Measurement and Analysis for Marketing, 10(2), 168-178.
Hoffman, D. L., Novak, T. P., & Peralta, M. (1999). Building consumer trust online. Association for Computing Machinery. Communications of the ACM, 42(4), 80-85.
References
- 270 -
Howell, J. M., & Higgins, C. A. (1990). Champions of change: Identifying, understanding, and supporting champions of technological innovations. Organizational Dynamics, 19(1), 40-55.
Hoyle, R. H. (1995). The structural equation modeling approach: Basic concepts and fundamental issues. In R. H. Hoyle (Ed.), Structural equation modeling: Concepts, issues, and applications (pp. 1-15). Thousand Oaks, CA: Sage Publications.
Hu, L.-T., & Bentler, P. M. (1995). Evaluating model fit. In R. H. Hoyle (Ed.), Structural equation modeling: Concepts, issues, and applications (pp. 76-99). Thousand Oaks, CA: Sage Publications.
Huber, G. P., & Power, D. J. (1985). Retrospective reports of strategic-level managers: Guidelines for increasing their accuracy. Strategic Management Journal, 6(2), 171-180.
Hughes, A. M. (2002). Editorial: The mirage of CRM. Journal of Database Marketing, 9(2), 102-104.
Hulland, J. (1999). Use of partial least squares (PLS) in strategic management research: A review of four recent studies. Strategic Management Journal, 20(2), 195-204.
Hulland, J., Chow, Y. H., & Lam, S. (1996). Use of causal models in marketing research: A review. International Journal of Research in Marketing, 13(2), 181-197.
Hunt, S. D. (1990). Truth in marketing theory and research. Journal of Marketing, 54(3), 1-15.
Hunt, S. D., & Morgan, R. M. (1995). The comparative advantage theory of competition. Journal of Marketing, 59(2), 1-14.
Hwang, Y. (2005). Investigating enterprise systems adoption: Uncertainty avoidance, intrinsic motivation, and the technology acceptance model. European Journal of Information Systems, 14(2), 150-161.
Iacobucci, D., & Ostrom, A. (1996). Commercial and interpersonal relationships; Using the structure of interpersonal relationships to understand individual-to-individual, individual-to-firm, and firm-to-firm relationships in commerce. International Journal of Research in Marketing, 13(1), 53-72.
Iacovou, C. L., Benbasat, I., & Dexter, A. S. (1995). Electronic data interchange and small organizations: Adoption and impact of technology. MIS Quarterly, 19(4), 465-485.
IDC. (2002, March). Moving beyond the traditional front office: CRM as a strategic enabler. An IDC Executive Brief Retrieved 10 October, 2003, from http://www.idc.com/getdoc.jhtml?containerId=CA015CRH
References
- 271 -
IDC. (2004). Worldwide customer relationship management applications market expected to surpass $11 billion by 2008, according to IDC. Retrieved 3 August, 2004, from http://www.idcresearch.com/getdoc.jsp?containerId=pr2004_07_26_122025
Jaworski, B. J., & Kohli, A. K. (1993). Market orientation: Antecedents and consequences. Journal of Marketing, 57(3), 53-70.
Jayachandran, S., Sharma, S., Kaufman, P., & Raman, P. (2005). The role of relational information processes and technology use in customer relationship management. Journal of Marketing, 69(4), 177-192.
Jobber, D. (1986). Improving response rates in industrial mail surveys. Industrial Marketing Management, 15(3), 183-195.
Jobber, D. (1989). An examination of the effects of questionnaire factors on response to an industrial mail survey. International Journal of Research in Marketing, 6(2), 129-140.
Jobber, D., Allen, N., & Oakland, J. (1985). The impact of telephone notification strategies on response to an industrial mail survey. International Journal of Research in Marketing, 2(4), 291-296.
Jobber, D., Mirza, H., & Wee, K. H. (1991). Incentives and response rates to cross-national business surveys: A logit model analysis. Journal of International Business Studies, 22(4), 711-721.
Jobber, D., & O'Reilly, D. (1996). Industrial mail surveys: techniques for inducing response. Marketing Intelligence & Planning, 14(1), 29-34.
Jobber, D., & O'Reilly, D. (1998). Industrial mail surveys: A methodological update. Industrial Marketing Management, 27, 95-107.
Jobber, D., & Saunders, J. (1993). A note on the applicability of the Bruvold-Comer model of mail survey response rates to commercial populations. Journal of Business Research, 26(3), 223-236.
Jobber, D., Saunders, J., & Mitchell, V.-W. (2004). Prepaid monetary incentive effects on mail survey response. Journal of Business Research, 57(4), 347-350.
Joereskog, K. G., & Soerbom, D. (1982). Recent developments in structural equation modeling. Journal of Marketing Research, 19(4), 404-416.
Johansson, J. K., & Yip, G. S. (1994). Exploiting globalization potential: U.S. and Japanese strategies. Strategic Management Journal, 15(8), 579-601.
John, G., & Reve, T. (1982). The reliability and validity of key informant data from dyadic relationships in marketing channels. Journal of Marketing Research, 19(4), 517-524.
Johnston, H. R., & Carrico, S. R. (1988). Developing capabilities to use information strategically. MIS Quarterly, 12(1), 37-47.
References
- 272 -
Jöreskog, K. G. (1993). Testing structural equation models. In K. A. Bollen & J. S. Long (Eds.), Testing structural equation models (pp. 294-316). Newbury Park, CA: Sage Publications.
Jutla, D., Craig, J., & Bodorik, P. (2001, 3 - 6 January). Enabling and measuring electronic customer relationship management readiness. Paper presented at the 34th Hawaii International Conference on System Sciences (HICSS), Maui, Hawaii.
Kale, S. H. (2004). CRM failure and the seven deadly sins. Marketing Management, 13(5), 42-46.
Kamakura, W. A., Mela, C. F., Ansari, A., Bodapati, A., Fader, P., Iyengar, R., et al. (2005). Choice models and customer relationship management. Marketing Letters, 16(3-4), 279-291.
Kamakura, W. A., Mittal, V., Rosa, F. d., & Mazzon, J. A. (2002). Assessing the service-profit chain. Marketing Science, 21(3), 294-317.
Kamakura, W. A., Ramaswami, S. N., & Srivastava, R. K. (1991). Applying latent trait analysis in the evaluation of prospects for cross-selling of financial services. International Journal of Research in Marketing, 8(4), 329-349.
Kamakura, W. A., Wedel, M., de Rosa, F., & Mazzon, J. A. (2003). Cross-selling through database marketing: A mixed data factor analyzer for data augmentation and prediction. International Journal of Research in Marketing, 20(1), 45-65.
Kapoulas, A., Ellis, N., & Murphy, W. (2004). The voice of the customer in e-banking relationships. Journal of Customer Behaviour, 3(1), 27-51.
Karimi, J., Bhattacherjee, A., Gupta, Y. P., & Somers, T. M. (2000). The effects of MIS steering committees on information technology management sophistication. Journal of Management Information Systems, 17(2), 207-230.
Karimi, J., Gupta, Y. P., & Somers, T. M. (1996a). The congruence between a firm's competitive strategy and information technology leader's rank and role. Journal of Management Information Systems, 13(1), 63-88.
Karimi, J., Gupta, Y. P., & Somers, T. M. (1996b). Impact of competitive strategy and information technology maturity on firms' strategic response to globalization. Journal of Management Information Systems, 12(4), 55-88.
Karimi, J., Somers, T. M., & Gupta, Y. P. (2001). Impact of information technology management practices on customer service. Journal of Management Information Systems, 17(4), 125-158.
Karimi, J., Somers, T. M., & Gupta, Y. P. (2004). Impact of environmental uncertainty and task characteristics on user satisfaction with data. Information Systems Research, 15(2), 175-193.
References
- 273 -
Kaufmann, P. J., & Dant, R. P. (1992). The dimensions of commercial exchange. Marketing Letters, 3(2), 171-185.
Kelloway, E. K. (1998). Using LISREL for structural equation modeling : A researcher's guide. Thousand Oaks: Sage.
Kennedy, A., Kelleher, C., & Quigley, M. (2006). CRM best practice: Getting it right first time at ESB International (ESBI). Irish Journal of Management, 27(1), 255-272.
Kerin, R. A., Berkowitz, E. N., Hartley, S. W., & Rudelius, W. (2003). Marketing (7th ed.). Boston: McGraw-Hill Irwin.
Kim, E., & Tadisina, S. (2003, 4-6 August). Customers' initial trust in e-business: How to measure customers' initial trust. Paper presented at the Ninth Americas Conference on Information Systems (AMCIS), Tampa, Florida.
Kim, H.-W., Lee, G.-H., & Pan, S.-L. (2002, 15-18 December). Exploring the critical success factors for customer relationship management and electronic customer relationship management systems. Paper presented at the Twenty-Third International Conference on Information Systems (ICIS), Barcelona, Spain.
Kim, J., Suh, E., & Hwang, H. (2003). A model for evaluating the effectiveness of CRM using the balanced scorecard. Journal of Interactive Marketing, 17(2), 5-19.
Kim, J. W., Choi, J., Qualls, W., & Park, J. (2004). The impact of CRM on firm - and relationship - level performance in distribution networks. Communications of the Association for Information Systems, 14, 632-652.
Kim, K. (2000). On interfirm power, channel climate, and solidarity in industrial distributor-supplier dyads. Journal of the Academy of Marketing Science, 28(3), 388-405.
Kim, K., & Frazier, G. L. (1997). On distributor commitment in industrial channels of distribution: A multicomponent approach. Psychology & Marketing, 14(8), 847-877.
Kincaid, J. W. (2003). Customer relationship management: Getting it right! Upper Saddle River, NJ: Prentice Hall.
King, M. P. (2001). Cross-sectional and longitudinal research designs issues in the studies of human development [Electronic Version]. Graduate research in Nursing, 3, 1-4. Retrieved 13 January 2007 from http://www.graduateresearch.com/King.htm.
Kingshott, R. P. J. (2004). The impact of psychological contracts upon trust and commitment within supplier-buyer relationships: A social exchange view. Paper presented at the 20th IMP-conference.
References
- 274 -
Kirca, A. H., Jayachandran, S., & Bearden, W. O. (2005). Market orientation: A meta-analytic review and assessment of its antecedents and impact on performance. Journal of Marketing, 69(2), 24-41.
Kirk-Smith, M. (1998). Psychological issues in questionaire-based research. Journal of the Market Research Society, 40(3), 223-236.
Klemz, B. R., Boshoff, C., & Mazibuko, N.-E. (2006). Emerging markets in black South African townships. European Journal of Marketing, 40(5/6), 590-610.
Kline, R. B. (2005). Principles and practice of structural equation modeling (2nd ed.). New York: The Guilford Press.
Klopping, I. M., & McKinney, E. (2004). Extending the technology acceptance model and the task-technology fir model to consumer e-commerce. Information Technology, Learning, and Performance Journal, 22(1), 35-48.
Kohli, A. K., & Jaworski, B. J. (1990). Market orientation: The construct, research propositions, and managerial implications. Journal of Marketing, 54(2), 1-18.
Kohli, A. K., Jaworski, B. J., & Kumar, A. (1993). MARKOR: A measure of market orientation. Journal of Marketing Research, 30(4), 467-478.
Kompass New Zealand. (2007). Kompass NZ Portal. Retrieved 3 September, 2007
Kong, R., & Mayo, M. C. (1993). Measuring service quality in the business-to-business context. The Journal of Business & Industrial Marketing, 8(2), 5-15.
Kotler, P. (1966). A design for the firm's marketing nerve center. Business Horizons, 9(3), 63-74.
Kotler, P. (1970). The future of the computer in marketing. Journal of Marketing, 34(1), 11-14.
Kotler, P. (1989). From mass marketing to mass customization. Planning Review, 17(5), 10-47.
Kotler, P. (1992). Marketing's new paradigm: What's really happening out there. Planning Review, 20(5), 50-52.
Kotler, P. (2003). Marketing management (11th ed.). Upper Saddle River, NJ: Pearson Education.
Krapfel, R. E., Jr., Salmond, D., & Spekman, R. (1991). A strategic approach to managing buyer-seller relationships. European Journal of Marketing, 25(9), 22-37.
Kreiner, K. (2002). Tacit knowledge management: The role of artifacts. Journal of Knowledge Management, 6(2), 112-123.
Kuhn, T. S. (1996). The structure of scientific revolutions (3rd ed.). Chicago: University of Chicago Press.
References
- 275 -
Kumar, N., Scheer, L. K., & Steenkamp, J.-B. E. M. (1995). The effects of perceived interdependence on dealer attitudes. Journal of Marketing Research, 32(3), 348-356.
Kumar, V., & Reinartz, W. J. (2006). Customer relationship management: A databased approach. Hoboken, NJ: John Wiley & Sons.
Lages, C., Lages, C. R., & Lages, L. F. (2005). The RELQUAL scale: A measure of relationship quality in export market ventures. Journal of Business Research, 58, 1040-1048.
Lang, B., & Colgate, M. (2003). Relationship quality, on-line banking and the information technology gap. The International Journal of Bank Marketing, 21(1), 29-37.
Langerak, F. (2003). An appraisal of research on the predictive power of market orientation. European Management Journal, 21(4), 447-464.
Lastovicka, J. L., & Thamodaran, K. (1991). Common factor score estimates in multiple regression problems. Journal of Marketing Research, 28(1), 105-112.
Le Pla, R. (2002, October). Seven breakthrough CRM strategies. NZ Marketing Magazine, 8-17.
Lee, C.-S. (2001). An analytical framework for evaluating e-commerce business models and strategies. Internet Research: Electronic Networking Applications and Policy, 11(4), 349-359.
Lee, E., Hu, M. Y., & Toh, R. S. (2004). Respondent non-cooperation in surveys and diaries: an analysis of item non-response and panel attrition. International Journal of Market Research, 46, 311-326.
Lee, H., & Choi, B. (2003). Knowledge management enablers, processes, and organizational performance: An integrative view and empirical examination. Journal of Management Information Systems, 20(1), 179-228.
Lee, J. (2004). Discriminant anaysis of technology adoption behavior: A case of Internet technologies in small business. The Journal of Computer Information Systems, 44(4), 57-66.
Lee, J., & Runge, J. (2001). Adoption of information technology in small business: Testing drivers of adoption for entrepreneurs. The Journal of Computer Information Systems, 42(1), 44-57.
Lee, T. W. (1999). Using qualitative methods in organizational research. Thousand Oaks: Sage.
Leek, S., Turnbull, P. W., & Naude, P. (2003). How is information technology affecting business relationships? Results from a UK survey. Industrial Marketing Management, 32(2), 119-126.
References
- 276 -
Leigh, J. H., & Martin, C. R., Jr. (1987). 'Don't know' item nonresponse in a telephone survey: Effects of question form and respondent characteristics. Journal of Marketing Research, 24(4), 418-424.
Lemon, K. N., White, T. B., & Winer, R. S. (2002). Dynamic customer relationship management: Incorporating future considerations into the service retention decision. Journal of Marketing, 66(1), 1-14.
Lendrum, T. (2003). The strategic partnering handbook: The practitioners' guide to partnerships and alliances (4th ed.). Sydney: McGraw-Hill.
Leuthesser, L., & Kohli, A. K. (1995). Rational behavior in business markets: Implications for relationship management. Journal of Business Research, 34(3), 221-233.
Levasseur, R. E. (2002). People skills: Change management tools--ideal state analysis. Interfaces, 32(4), 84-85.
Levitt, T. (1983). After the sale is over ... Harvard Business Review, 61(5), 87-93.
Lewin, J. E., & Johnston, W. J. (1997). Relationship marketing theory in practice: A case study. Journal of Business Research, 39(1), 23-31.
Li, E. Y., McLeod, R., Jr., & Rogers, J. C. (2001). Marketing information systems in Fortune 500 companies: A longitudinal analysis of 1980, 1990, and 2000. Information & Management, 38(5), 307-322.
Li, S., Davies, B., Edwards, J., Kinman, R., & Duan, Y. (2002). Integrating group Delphi, fuzzy logic and expert systems for marketing strategy development: The hybridisation and its effectiveness. Marketing Intelligence & Planning, 20(4/5), 273-284.
Li, Z. G., & Dant, R. P. (1997). An exploratory study of exclusive dealing in channel relationships. Journal of the Academy of Marketing Science, 25(3), 201-213.
Lincoln, Y. S., & Guba, E. G. (2000). Paradigmatic controversies, contradictions, and emerging confluences. In N. K. Denzin & Y. S. Lincoln (Eds.), Handbook of qualitative research (2nd ed., pp. 163-188). Thousand Oaks: Sage.
Lind, D. A., Marchal, W. G., & Mason, R. D. (2001). Statistical techniques in business & economics (11th ed.). Boston, MA: McGraw-Hill.
Ling, R., & Yen, D. C. (2001). Customer relationship management: An analysis framework and implementation strategies. The Journal of Computer Information Systems, 41(3), 82-97.
Lissitz, R. W., & Green, S. B. (1975). Effect of the number of scale points on reliability: A Monte Carlo approach. Journal of Applied Psychology, 60(1), 10-13.
Liu, H.-Y. (2007). Development of a framework for customer relationship management (CRM) in the banking industry. International Journal of Management, 24(1), 15.
References
- 277 -
Lloyd, G. O., Scullin, S., Allora, J., & Fjermestad, J. (2001, 2-5 August). Electronic customer relationship management: Benefits and pre-implementation considerations. Paper presented at the Seventh Americas Conference on Information Systems (AMCIS), Boston, MA.
Locander, W. B., Hamilton, F., Ladik, D., & Stuart, J. (2002). Developing a leadership-rich culture: The missing link to creating a market-focused organization. Journal of Market - Focused Management, 5(2), 149-163.
Locke, S. (2004). ICT adoption and SME growth in New Zealand. Journal of American Academy of Business, Cambridge, 4(1/2), 93-102.
Low, B. K. H. (1996). Long-term relationship in industrial marketing: Reality or rhetoric? Industrial Marketing Management, 25(1), 23-35.
MacCallum, R. C., & Austin, J. T. (2000). Applications of structural equation modeling in psychological research. Annual Review of Psychology, 51(1), 201-226.
MacDonald, J. B., & Smith, K. (2004). The effects of technology-mediated communication on industrial buyer behavior. Industrial Marketing Management, 33(2), 107-116.
MacKenzie, S. B., Podsakoff, P. M., & Ahearne, M. (1998). Some possible antecedents and consequences of in-role and extra-role salesperson performance. Journal of Marketing, 62(3), 87-98.
Mahmood, M. A., & Mann, G. J. (1993). Measuring the organizational impact of information technology investment: An exploratory study. Journal of Management Information Systems, 10(1), 97-122.
Malhotra, N. K. (1999). Marketing research: An applied orientation (3rd ed.). Upper Saddle River, NJ: Prentice Hall.
Malhotra, N. K. (2007). Marketing research: An applied orientation (5th ed.). Upper Saddle River, NJ: Pearson Prentice Hall.
Malhotra, N. K., Hall, J., Shaw, M., & Oppenheim, P. (2006). Marketing research: An applied orientation (3rd ed.). Frenchs Forest: Prentice Hall.
Markowitz, E. (2002, June 01). Craig Conway: Up close. Retrieved 14 April, 2003, from http://www.destinationcrm.com/articles/default.asp?ArticleID=2321
Markus, M. L. (1983). Power, politics, and MIS implementation. Communications of the ACM, 26(6), 430-444.
Marsden, D., & Littler, D. (1996). Evaluating alternative research paradigms: A market-oriented framework. Journal of Marketing Management, 12(7), 645-655.
Maruyama, G. M. (1998). Basics of structural equation modeling. Thousand Oaks: Sage.
References
- 278 -
Massey, A. P., Montoya-Weiss, M. M., & Holcom, K. (2001). Re-engineering the customer relationship: Leveraging knowledge assets at IBM. Decision Support Systems, 32(2), 155-170.
Matear, S., Osborne, P., Garrett, T., & Gray, B. J. (2002). How does market orientation contribute to service firm performance? An examination of alternative mechanisms. European Journal of Marketing, 36(9/10), 1058-1075.
Mayer, C. S., & Piper, C. (1982). A note on the importance of layout in self-administered questionnaires. Journal of Marketing Research, 19(3), 390-391.
McDaniel, C., Jr., & Gates, R. (2005). Marketing research (6th ed.). Hoboken, NJ: John Wiley & Sons.
McKnight, D. H., & Chervany, N. L. (1996). The meanings of trust. Retrieved 15 September, 2004, from http://misrc.umn.edu/wpaper/WorkingPapers/9604.pdf
McKnight, D. H., & Chervany, N. L. (2000, 10-13 August). What is Trust? A conceptual analysis and an interdisciplinary model. Paper presented at the Sixth Americas Conference on Information Systems (AMCIS), Long Beach, CA.
McNamara, C. P. (1972). The present status of the marketing concept. Journal of Marketing, 36(1-7), 50-57.
McQuillen, J. S. (2003). The influence of technology on the initiation of interpersonal relationships. Education, 123(3), 616-623.
Medlin, C. J. (2003). Relationship performance: A relationship level construct. Paper presented at the 19th IMP-conference.
Medlin, C. J., Aurifeille, J.-M., & Quester, P. G. (2005). A collaborative interest model of relational coordination and empirical results. Journal of Business Research, 58(2), 214-222.
Meehl, P. E. (1990). Why summaries of research on psychological theories are often uninterpretable. Psychological Reports, 66(1), 195-244.
Menon, A., Bharadwaj, S. G., Adidam, P. T., & Edison, S. W. (1999). Antecedents and consequences of marketing strategy making: A model and a test. Journal of Marketing, 63(2), 18-40.
Meyer, J. P., Allen, N. J., & Topolnytsky, L. (1998). Commitment in a changing world of work. Canadian Psychology, 39(1/2), 83-93.
Meyer, M., & Kolbe, L. M. (2005). Integration of customer relationship management: Status quo and implications for research and practice. Journal of Strategic Marketing, 13(3), 175-198.
Michaelidou, N., & Dibb, S. (2006). Using email questionnaires for research: Good practice in tackling non-response. Journal of Targeting, Measurement and Analysis for Marketing, 14(4), 289-296.
References
- 279 -
Microsoft. (2004). Microsoft Business Solutions CRM. Retrieved 25 November, 2004, from http://www.microsoft.com/businesssolutions/crm/crm_productoverview.aspx
Miles, M. B., & Huberman, A. M. (1994). Qualitative data analysis: An expanded sourcebook (2nd ed.). Thousand Oaks: Sage.
Miller, G. A. (1956). The magical number seven, plus or minus two: some limits on our capacity for processing information. Psychological Review, 63(2), 81-97.
Mirchandani, D. A., & Motwani, J. (2001). Understanding small business electronic commerce adoption: An empirical analysis. The Journal of Computer Information Systems, 41(3), 70-73.
Mithas, S., Krishnan, M. S., & Fornell, C. (2005). Why do customer relationship management applications affect customer satisfaction? Journal of Marketing, 69(4), 201-209.
Mitra, S., & Chaya, A. K. (1996). Analyzing cost-effectiveness of organizations: The impact of information technology spending. Journal of Management Information Systems, 13(2), 29-57.
Mitussis, D., O'Malley, L., & Patterson, M. (2006). Mapping the re-engagement of CRM with relationship marketing. European Journal of Marketing, 40(5/6), 572-589.
Moghrabi, C., & Eid, M. S. (1998). Modeling users through an expert system and a neural network. Computers & Industrial Engineering, 35(3,4), 583-586.
Mohr, J. J., Fisher, R. J., & Nevin, J. R. (1996). Collaborative communication in interfirm relationships: Moderating effects of integration and control. Journal of Marketing, 60(3), 103-115.
Mohr, J. J., & Nevin, J. R. (1990). Communication strategies in marketing channels: A theoretical perspective. Journal of Marketing, 54(4), 36-51.
Mohr, J. J., & Sohi, R. S. (1995). Communication flows in distribution channels: Impact on assessments of communication quality and satisfaction. Journal of Retailing, 71(4), 393-416.
Mohr, J. J., & Spekman, R. (1994). Characteristics of partnership success: Partnership attributes, communication behavior, and conflict resolution techniques. Strategic Management Journal, 15(2), 135-152.
Mohrman, S. A., Gibson, C. B., & Mohrman Jr., A. M. (2001). Doing research that is useful to practice: A model and empirical exploration. Academy of Management Journal, 44(2), 357-375.
Moore, G. C., & Benbasat, I. (1991). Development of an Instrument to Measure the Perceptions of Adopting an Information Technology Innovation. Information Systems Research, 2(3), 192-222.
References
- 280 -
Moorman, C., Deshpandé, R., & Zaltman, G. (1993). Factors affecting trust in market research relationships. Journal of Marketing, 57(1), 81-101.
Moorman, C., & Miner, A. S. (1997). The impact of organizational memory on new product performance and creativity. Journal of Marketing Research, 34(1), 91-106.
Moorman, C., & Rust, R. T. (1999). The role of marketing. Journal of Marketing, 63(Special Issue), 180-197.
Moorman, C., Zaltman, G., & Deshpandé, R. (1992). Relationships between providers and users of market research: The dynamics of trust within and between organizations. Journal of Marketing Research, 29(3), 314-328.
Morgan, R. M., & Hunt, S. D. (1994). The commitment-trust theory of relationship marketing. Journal of Marketing, 58(3), 20-38.
Muthén, B., & Kaplan, D. (1985). A comparison of some methodologies for the factor analysis of non-normal Likert variables: a note on the size of the model. British Journal of Mathematical and Statistical Psychology, 38, 171-189.
Nairn, A. (2002). CRM: Helpful or full of hype? Journal of Database Marketing, 9(4), 376-382.
Nakata, C., & Zhu, Z. (2006). Information technology and customer orientation: A study of direct, mediated, and interactive linkages. Journal of Marketing Management, 22(3/4), 319-354.
Narayandas, D., & Rangan, V. K. (2004). Building and sustaining buyer-seller relationships in mature industrial markets. Journal of Marketing, 68(3), 63-77.
Narver, J. C., & Slater, S. F. (1990). The effect of a market orientation on business profitability. Journal of Marketing, 54(4), 20-35.
Natovich, J. (2002, 9-11 August). IT project failure and vendor related risks: Is outsourcing an solution or a problem? Paper presented at the Eighth Americas Conference on Information Systems (AMCIS), Dallas, Texas.
Netemeyer, R. G., Bearden, W. O., & Sharma, S. (2003). Scaling procedures: Issues and applications. Thousand Oaks: Sage.
Ngai, E. W. T. (2005). Customer relationship management research (1992-2002): An academic literature review and classification. Marketing Intelligence & Planning, 23(6/7), 582-605.
Nguyen, T. H., Sherif, J. S., & Newby, M. (2007). Strategies for successful CRM implementation. Information Management & Computer Security, 15(2), 102-115.
Nielson, C. C. (1998). An empirical examination of the role of "closeness" in industrial buyer-seller relationships. European Journal of Marketing, 32(5/6), 441-463.

References
- 281 -
Niraj, R., Gupta, M., & Narasimhan, C. (2001). Customer profitability in a supply chain. Journal of Marketing, 65(3), 1-16.
Noble, C. H., Sinha, R. K., & Kumar, A. (2002). Market orientation and alternative strategic orientations: A longitudinal assessment of performance implications. Journal of Marketing, 66(4), 25-39.
Nunnally, J. C. (1959). Tests and Measurements: Assessment and prediction. New York: McGraw-Hill Book Co.
Nunnally, J. C., & Bernstein, I. H. (1994). Psychometric theory (3rd ed.). New York: McGraw-Hill.
O'Brien, J. A. (2004). Management information systems: Managing information technology in the business enterprise (6th ed.). Boston: McGraw-Hill/Irwin.
O'Cass, A. (2002). Political advertising believability and information source value during elections. Journal of Advertising, 31(1), 63-74.
O'Loughlin, C., & Coenders, G. (2004). Estimation of the European Customer Satisfaction Index: Maximum likelihood versus partial least squares. Application to postal services. Total Quality Management & Business Excellence, 15(9,10), 1231-1255.
O'Malley, L., & Tynan, C. (1997). A reappraisal of the relationship marketing constructs of commitment and trust. Paper presented at the American Marketing Association: Special Conferences: New and Evolving Paradigms: The emerging future of marketing, Dublin, Ireland.
O'Malley, L., & Tynan, C. (2000). Relationship marketing in consumer markets - Rhetoric or reality? European Journal of Marketing, 34(7), 797-815.
Odekerken-Schroder, G., De Wulf, K., & Schumacher, P. (2003). Strengthening outcomes of retailer-consumer relationships: The dual impact of relationship marketing tactics and consumer personality. Journal of Business Research, 56(3), 177-190.
Oliver, R. L. (1993). Cognitive, affective, and attribute bases of the satisfaction response. Journal of Consumer Research, 20(3), 418-430.
Oliver, R. L. (1999). Whence consumer loyalty? Journal of Marketing, 63, 33-44.
Oracle. (2004). Oracle Customer Relationship Management. Retrieved 27 April, 2004, from http://www.oracle.com/applications/customermgmt/Oracle_CRM.pdf
Oracle. (2005, August 2005). Oracle Marketing 11i - Data Sheet. Retrieved 7 April, 2006, from http://www.oracle.com/applications/marketing/11i10_mktg_ds.pdf
Palmatier, R. W., Dant, R. P., & Grewal, D. (2007). A comparative longitudinal analysis of theoretical perspectives of interorganizational relationship performance. Journal of Marketing, 71(4), 172-194.
References
- 282 -
Palmatier, R. W., Gopalakrishna, S., & Houston, M. B. (2006). Returns on business-to-business relationship marketing investments: Strategies for leveraging profits. Marketing Science, 25(5), 477-493.
Palmatier, R. W., Scheer, L. K., Houston, M. B., Evans, K. R., & Gopalakrishna, S. (2007). Use of relationship marketing programs in building customer-salesperson and customer-firm relationships: Differential influences on financial outcomes. International Journal of Research in Marketing, 24(3), 210-223.
Palmer, R. (2007). The transaction-relational continuum: Conceptually elegant but empirically denied. The Journal of Business & Industrial Marketing, 22(7), 439-451.
Palvia, S. C., & Chervany, N. L. (1995). An experimental investigation of factors influencing predicted success in DSS implementation. Information & Management, 29(1), 43-53.
Pan, S. L., & Lee, J.-N. (2003). Using e-CRM for a unified view of the customer. Association for Computing Machinery. Communications of the ACM, 46(4), 95-99.
Parasuraman, A., Grewal, D., & Krishnan, R. (2004). Marketing Research. Boston: Houghton Mifflin.
Park, C.-H., & Kim, Y.-G. (2003). A framework of dynamic CRM: Linking marketing with information strategy. Business Process Management Journal, 9(5), 652-671.
Parvatiyar, A., & Sheth, J. N. (2000). The domain and conceptual foundations of relationship marketing. In J. N. Sheth & A. Parvatiyar (Eds.), Handbook of relationship marketing (pp. 3-37). Thousand Oaks: Sage.
Payne, A. (2006). Handbook of CRM: Achieving excellence in customer management. Amsterdam: Butterworth-Heinemann.
Payne, A., & Frow, P. (2004). The role of multichannel integration in customer relationship management. Industrial Marketing Management, 33(6), 527-538.
Payne, A., & Frow, P. (2005). A strategic framework for customer relationship management. Journal of Marketing, 69(4), 167-176.
Payne, A., & Frow, P. (2006). Customer relationship management: From strategy to implementation. Journal of Marketing Management, 22(1,2), 135-168.
Payton, F. C., & Zahay, D. (2005). Why doesn't marketing use the corporate data warehouse? The role of trust and quality in adoption of data-warehousing technology for CRM applications. The Journal of Business & Industrial Marketing, 20(4/5), 237-244.
Pearson, S. (1994). Relationship management: Generating business in the diverse markets of Europe. European Business Journal, 6(4), 28-38.
References
- 283 -
Pedhazur, E. J. (1982). Multiple regression in behavioral research: Explanation and prediction (2nd ed.). New York: Holt, Rinehart and Winston.
Pelham, A. M. (1997). Mediating influences on the relationship between market orientation and profitability in small industrial firms. Journal of Marketing Theory and Practice, 5(3), 55-76.
Pelham, A. M. (1999). Influence of environment, strategy, and market orientation on performance in small manufacturing firms. Journal of Business Research, 45(1), 33-46.
Pelham, A. M., & Wilson, D. T. (1996). A longitudinal study of the impact of market structure, firm structure, strategy, and market orientation culture on dimensions of small-firm performance. Journal of the Academy of Marketing Science, 24(1), 27-43.
Pels, J., Coviello, N. E., & Brodie, R. J. (2000). Integrating transactional and relational marketing exchange: A pluralistic perspective. Journal of Marketing Theory and Practice, 8(3), 11-20.
Pennington, R., Wilcox, H. D., & Grover, V. (2004). The role of system trust in business-to-consumer transactions. Journal of Management Information Systems, 20(3), 197-226.
PeopleSoft. (2003, June 2003). PeopleSoft Customer Relationship Management. Retrieved 27 April, 2004, from http://www.peoplesoft.com/corp/en/doc_archive/brochure/ent_crm.jsp
Peppard, J. (2000). Customer relationship management (CRM) in financial services. European Management Journal, 18(3), 312-327.
Peppers, D., & Rogers, M. (1993). The one to one future: Building relationships one customer at a time. New York: Doubleday.
Peppers, D., Rogers, M., & Dorf, B. (1999). Is your company ready for one-to-one marketing? Harvard Business Review, 77(1), 151-160.
Periatt, J. A., LeMay, S. A., & Chakrabarty, S. (2004). The selling orientation-customer orientation (SOCO) scale: Cross-validation of the revised version. Journal of Personal Selling & Sales Management, 24(1), 49-54.
Perry, C. (1998). Processes of a case study methodology for postgraduate research in marketing. European Journal of Marketing, 32(9/10), 785-802.
Perry, C., Riege, A., & Brown, L. (1999). Realism's role among scientific paradigms in marketing research. Irish Marketing Review, 12(2), 16-23.
Peter, J. P. (1979). Reliability: A review of psychometric basics and recent marketing practices. Journal of Marketing Research, 16(1), 6-17.
Peters, L. D., & Fletcher, K. P. (2004a). Communication strategies and marketing performance: An application of the Mohr and Nevin framework to intra-
References
- 284 -
organisational cross-functional teams. Journal of Marketing Management, 20(7,8), 741-770.
Peters, L. D., & Fletcher, K. P. (2004b). They love me, they love me not: Consumer relationship orientation and CRM. Journal of Customer Behaviour, 3(1), 53-80.
Peterson, R. A. (1995). Relationship marketing and the consumer. Journal of the Academy of Marketing Science, 23(4), 278-281.
Pinsonneault, A., & Kraemer, K. L. (1993). Survey research methodology in management information systems: An assessment. Journal of Management Information Systems, 10(2), 75-105.
Plakoyiannaki, E., & Tzokas, N. (2002). Customer relationship management: A capabilities portfolio perspective. Journal of Database Marketing, 9(3), 228-237.
Podasakoff, P. M., MacKenzie, S. B., Lee, J.-Y., & Podsakoff, N. P. (2003). Common method biases in behavioral research: A critical review of the literature and recommended remedies. Journal of Applied Psychology, 88(5), 879-903.
Poe, G. S., Seeman, I., McLaughlin, J., Mehl, E., & Dietz, M. (1988). 'Don't Know' boxes in factual questions in a mail questionnaire. Public Opinion Quarterly, 52(2), 212-222.
Postma, O. J., & Brokke, M. (2002). Personalisation in practice: The proven effects of personalisation. Journal of Database Marketing, 9(2), 137-142.
Pressey, A. D., & Mathews, B. P. (2004). Patterns of trust in buyer-seller relationships: Motives for formation, drivers, outcomes and temporal relationships. Journal of Customer Behaviour, 3(1), 81-100.
Preston, C. C., & Colman, A. M. (2000). Optimal number of response categories in rating scales: Reliability, validity, discriminating power, and respondent preferences. Acta Psychologica 104, 1-15.
Proctor, T. (2005). Essentials of marketing research (4th ed.). Harlow, England: Prentice Hall.
Puccinelli, N. M., Tickle-Degnen, L., & Rosenthal, R. (2003). Effect of dyadic context on judgments of rapport: Dyad task and partner presence. Journal of Nonverbal Behavior, 27(4), 211-236.
Pulendran, S., Speed, R., & Widing, R. E., II. (2003). Marketing planning, market orientation and business performance. European Journal of Marketing, 37(3/4), 476-497.
Ragowsky, A., & Somers, T. M. (2002). Special section: Enterprise resource planning. Journal of Management Information Systems, 19(1), 11-15.
References
- 285 -
Raman, P., & Pashupati, K. (2004). Is CRM really doomed to fail? An exploratory study of the barriers to CRM implementation. Journal of Customer Behaviour, 3(1), 5-26.
Raman, P., Wittmann, C. M., & Rauseo, N. A. (2006). Leveraging CRM for sales: The role of organizational capabilities in successful CRM implementation. Journal of Personal Selling & Sales Management, 26(1), 39-53.
Ranchhod, A., & Zhou, F. (2001). Comparing respondents of e-mail and mail surveys: Understanding the implications of technology. Marketing Intelligence & Planning, 19(4), 254-262.
Ravald, A., & Grönroos, C. (1996). The value concept and relationship marketing. European Journal of Marketing, 30(2), 19-30.
Ravichandran, T., & Rai, A. (2000). Quality management in systems development: An organizational system perspective. MIS Quarterly, 24(3), 381-415.
Reichheld, F. F. (1996). The loyalty effect: The hidden force behind growth, profits, and lasting value. Cambridge, MA: Harvard Business School Press.
Reichheld, F. F., & Sasser, W. E., Jr. (1990). Zero defections: Quality comes to services. Harvard Business Review, 68(5), 105-111.
Reinartz, W. J., Krafft, M., & Hoyer, W. D. (2004). The customer relationship management process: Its measurement and impact on performance. Journal of Marketing Research, 41(3), 293-305.
Reinartz, W. J., & Kumar, V. (2000). On the profitability of long-life customers in a noncontractual setting: An empirical investigation and implications for marketing. Journal of Marketing, 64(4), 17-35.
Reinartz, W. J., & Kumar, V. (2002). The mismanagement of customer loyalty. Harvard Business Review, 80(7), 86-94.
Reinartz, W. J., & Kumar, V. (2003). The impact of customer relationship characteristics on profitable lifetime duration. Journal of Marketing, 67(1), 77-99.
Reynolds, K. E., & Beatty, S. E. (1999). Customer benefits and company consequences of customer-salesperson relationships in retailing. Journal of Retailing, 75(1), 11-32.
Rheault, D., & Sheridan, S. (2002). Reconstruct your business around customers. The Journal of Business Strategy, 23(2), 38-42.
Richard, J. E. (2003). Customer relationship management (CRM) implementation: An exploratory study. Unpublished Honours thesis, Victoria University of Wellington, New Zealand.
Richard, J. E., Thirkell, P. C., & Huff, S. L. (2007). An examination of customer relationship management (CRM) technology adoption and its impact on
References
- 286 -
business-to-business customer relationships. Total Quality Management & Business Excellence, 18(8), 927-945.
Rigby, D. K., & Ledingham, D. (2004). CRM done right. Harvard Business Review, 82(11), 118-133.
Rigby, D. K., Reichheld, F. F., & Schefter, P. (2002a). Avoid the four perils of CRM. Harvard Business Review, 80(2), 101-109.
Rigby, D. K., Reichheld, F. F., & Schefter, P. (2002b). Start with customer strategy. Harvard Business Review, 80(2), 103.
Rindfleisch, A., & Heide, J. B. (1997). Transaction cost analysis: Past, present, and future applications. Journal of Marketing, 61(4), 30-54.
Ringle, C. M., Wende, S., & Will, A. (2005). SmartPLS (Version 2.0 beta). Hamburg, Germany: University of Hamburg.
Rivard, S., & Huff, S. L. (1988). Factors of success for end-user computing. Communications of the ACM, 31(5), 552-561.
Rix, P., Buss, J., & Herford, G. (2001). Selling: A consultative approach (2nd ed.). Sydney: McGraw-Hill.
Roberts, F. S. (1994). Limitations on conclusions using scales of measurement. In S. M. Pollock, M. H. Rothkopf & A. Barnett (Eds.), Operations research and the public sector (Vol. 6, pp. 621-671). Amsterdam: North-Holland.
Roberts, K., Varki, S., & Brodie, R. (2003). Measuring the quality of relationships in consumer services: An empirical study. European Journal of Marketing, 37(1/2), 169-196.
Roberts, M. L. (2003). Internet marketing: Integrating online and offline strategies. Boston: McGraw-Hill Irwin.
Roberts, M. L., Liu, R. R., & Hazard, K. (2005). Strategy, technology and organisational alignment: Key components of CRM success. Journal of Database Marketing & Customer Strategy Management, 12(4), 315-326.
Robinson, L., Jr., Marshall, G. W., & Stamps, M. B. (2005). An empirical investigation of technology acceptance in a field sales force setting. Industrial Marketing Management, 34(4), 407-415.
Rogers, E. M., & Albritton, M. M. (1995). Interactive communication technologies in business organizations. The Journal of Business Communication, 32(2), 177-195.
Rokkan, A. I., Heide, J. B., & Wathne, K. H. (2003). Specific investments in marketing relationships: Expropriation and bonding effects. Journal of Marketing Research, 60(2), 210-224.

References
- 287 -
Romano, N. C., Jr. (2000, 10-13 August). Customer relations management in information systems research. Paper presented at the Sixth America's Conference on Information Systems (AMCIS), Long Beach, CA.
Romano, N. C., Jr., & Fjermestad, J. (2001, 2-5 August). An agenda for electronic commerce customer relationship management research. Paper presented at the Seventh America's Conference on Information Systems (AMCIS), Boston, MA.
Romano, N. C., Jr., & Fjermestad, J. (2003). Electronic commerce customer relationship management: A research agenda. Information Technology and Management, 4(2-3), 233-258.
Rosenbaum, H., & Huang, B.-Y. (2002, 9-11 August). A framework for web-based e-commerce customer relationship management. Paper presented at the Eighth Americas Conference on Information Systems (AMCIS), Dallas, Texas.
Rossiter, J. R. (2002). The C-OAR-SE procedure for scale development in marketing. International Journal of Research in Marketing, 19(4), 305-335.
Rowley, J. E. (2002). Reflections on customer knowledge management in e-business. Qualitative Market Research, 5(4), 268-280.
Rummel, R. J. (1970). Applied factor analysis. Evanston: Northwestern University Press.
Rust, R. T., & Chung, T. S. (2006). Marketing models of service and relationships. Marketing Science, 25(6), 560-580.
Rust, R. T., & Espinoza, F. (2006). How technology advances influence business research and marketing strategy. Journal of Business Research, 59(10-11), 1072-1078.
Ryals, L. (2005). Making customer relationship management work: The measurement and profitable management of customer relationships. Journal of Marketing, 69(4), 252-261.
Ryals, L., & Knox, S. (2001). Cross-functional issues in the implementation of relationship marketing through customer relationship management. European Management Journal, 19(5), 534-542.
Ryan, G. W., & Bernard, H. R. (2000). Data management and analysis methods. In N. K. Denzin & Y. S. Lincoln (Eds.), Handbook of qualitative research (2nd ed., pp. 769-802). Thousand Oaks: Sage.
Sabherwal, R., & Kirs, P. (1994). The alignment between organizational critical success factors and information technology capability in academic institutions. Decision Sciences, 25(2), 301-330.
Sako, M. (1992). Prices, quality and trust: Inter-firm relations in Britain and Japan. Cambridge: Cambridge University Press.
References
- 288 -
Sambamurthy, V., & Chin, W. W. (1994). The effects of group attitudes toward alternative GDSS designs on the decision-making performance of computer-supported groups. Decision Sciences, 25(2), 215-241.
Sanchez, M. E. (1992). Effects of questionnaire design on the quality of survey data. Public Opinion Quarterly, 56(2), 206-217.
Sanzo, M. J., Santos, M. L., Vázquez, R., & Álvarez, L. I. (2003). The effect of market orientation on buyer-seller relationship satisfaction. Industrial Marketing Management, 32(4), 327-345.
SAP. (2004). mySAP Customer Relationship Management: Features & functions. Retrieved 25 November, 2004, from http://www.sap.com/solutions/business-suite/crm/featuresfunctions/index.aspx
SAP. (2006). mySAP Customer Relationship Management: Features & Functions. Retrieved 7 April, 2006, from http://www.sap.com/solutions/business-suite/crm/featuresfunctions/index.epx
SAS. (2004). SAS customer intelligence. Retrieved 25 November, 2004, from http://www.sas.com/solutions/crm/index.html
Sathish, S., Pan, S. L., & Raman, K. S. (2002, 9-11 August). Customer relationship management (CRM) network: A new approach to studying CRM. Paper presented at the Eighth Americas Conference on Information Systems (AMCIS), Dallas, TX.
Saxe, R., & Weitz, B. A. (1982). The SOCO scale: A measure of the customer orientation of salespeople. Journal of Marketing Research, 19(3), 343-351.
Scandura, T. A., & Williams, E. A. (2000). Research methodology in management: Current practices, trends, and implications for future research. Academy of Management Journal, 43(6), 1248-1264.
Schlegelmilch, B. B., & Diamantopoulos, A. (1991). Prenotification and mail survey response rates: A quantitative integration of the literature. Journal of the Market Research Society, 33(3), 243-255.
Schumacker, R. E., & Lomax, R. G. (2004). A beginner's guide to structural equation modeling (2nd ed.). Mahwah, NJ: Lawrence Erlbaum Associates.
Sekaran, U. (2003). Research methods for business: A skill building approach (4th ed.). New York: John Wiley & Sons.
Seligman, M. (2002). Avoid money down the drain: Shift from CRM to CMR. New Zealand Management, 49(4), 59-64.
Selnes, F. (1998). Antecedents and consequences of trust and satisfaction in buyer-seller relationships. European Journal of Marketing, 32(3/4), 305-322.
Selnes, F., & Sallis, J. (2003). Promoting relationship learning. Journal of Marketing, 67(3), 80-95.
References
- 289 -
Seybold, P. B. (2001). Get inside the lives of your customers. Harvard Business Review, 79(5), 80-89.
Shani, D., & Chalasani, S. (1992). Exploiting niches using relationship marketing. Journal of Services Marketing, 6(4), 43-52.
Shapiro, B. P. (1974). Manage the customer, not just the sales-force. Harvard Business Review, 52(5), 127-134.
Sharma, N., & Patterson, P. G. (1999). The impact of communication effectiveness and service quality on relationship commitment in consumer, professional services. Journal of Services Marketing, 13(2), 151-170.
Sharma, S., Durvasula, S., & Dillon, W. R. (1989). Some results on the behavior of alternate covariance structure estimation procedures in the presence of non-normal data. Journal of Marketing Research, 26(2), 214-221.
Shelby, A. N. (1998). Communication quality revisited: Exploring the link with persuasive effects. The Journal of Business Communication, 35(3), 387-404.
Sheng, Y. P. (2002, 9-11 August). A business model and framework for electronic customer relationship management. Paper presented at the Eighth Americas Conference on Information Systems (AMCIS), Dallas, TX.
Sheppard, B. H., Hartwick, J., & Warshaw, P. R. (1988). The theory of reasoned action: A meta-analysis of past research with recommendations for modifications and future research. Journal of Consumer Research, 15(3), 325-343.
Sheth, J. N. (2002). The future of relationship marketing. Journal of Services Marketing, 16(7), 590-592.
Sheth, J. N., & Parvatiyar, A. (2000). The evolution of relationship marketing. In J. N. Sheth & A. Parvatiyar (Eds.), Handbook of relationship marketing (pp. 119-145). Thousand Oaks: Sage.
Shoemaker, M. E. (2001). A framework for examining IT-enabled market relationships. Journal of Personal Selling & Sales Management, 21(2), 177-185.
Shook, C. L., Ketchen, D. J., Jr., Hult, G. T. M., & Kacmar, K. M. (2004). An assessment of the use of structural equation modeling in strategic management research. Strategic Management Journal, 25(4), 397-404.
Shrivastava, S., & Kale, S. H. (2003). Philosophising on the elusiveness of relationship marketing theory in consumer markets: A case for reassessing ontological and epistemological assumptions. Australasian Marketing Journal, 11(3), 61-71.
Siebel. (2004). What is CRM? Retrieved 25 November, 2004, from http://www.siebel.com/what-is-crm/software-solutions.shtm
Siguaw, J. A., Simpson, P., M., & Baker, T., L. (1998). Effects of supplier market orientation on distributor market orientation and the channel relationship: The distributor perspective. Journal of Marketing, 62(3), 99-111.
References
- 290 -
Simsek, Z., & Veiga, J. F. (2001). A primer on Internet organizational surveys. Organizational Research Methods, 4(3), 218-235.
Sin, L. Y. M., Tse, A. C. B., Yau, O. H. M., Lee, J. S. Y., & Chow, R. P. M. (2002). The effect of relationship marketing orientation on business performance in a service-oriented economy. Journal of Services Marketing, 16(7), 656-676.
Sin, L. Y. M., Tse, A. C. B., & Yim, F. H. K. (2005). CRM: Conceptualization and scale development. European Journal of Marketing, 39(11/12), 1264-1290.
Singh, S., & Ranchod, A. (2004). Market orientation and customer satisfaction: Evidence from British machine tool industry. Industrial Marketing Management, 33(2), 135-144.
Sirdeshmukh, D., Singh, J., & Sabol, B. (2002). Consumer trust, value, and loyalty in relational exchanges. Journal of Marketing, 66(1), 15-37.
Slater, S. F., & Narver, J. C. (1995). Market orientation and the learning organization. Journal of Marketing, 59(3), 63-74.
Smith, A. E. (2005). Leximancer Manual, version 2.2. Retrieved 18 July, 2006, from http://www.leximancer.com/cms//index.php?option=com_content&task=view&id=53&Itemid=85
Smith, A. E., & Humphreys, M., S. (2006). Evaluation of unsupervised semantic mapping of natural language with Leximancer concept mapping. Behavior Research Methods, 38(2), 262-279.
Smith, J. B., & Barclay, D. W. (1997). The effects of organizational differences and trust on the effectiveness of selling partner relationships. Journal of Marketing, 61(1), 3-21.
Songini, M. L. (2002). Siebel, SAP push CRM upgrades. Computerworld, 36(37), 1.
Spector, P. E. (1992). Summated rating scale construction: An introduction (Vol. 07-082). Newbury Park, CA: Sage.
Speier, C., & Venkatesh, V. (2002). The hidden minefields in the adoption of sales force automation technologies. Journal of Marketing, 66(3), 98-111.
Srinivasan, R., & Moorman, C. (2005). Strategic firm commitments and rewards for customer relationship management in online retailing. Journal of Marketing, 69(4), 193-200.
Srivastava, R. K., Shervani, T. A., & Fahey, L. (1999). Marketing, business processes, and shareholder value: An organizationally embedded view of marketing activities and the discipline of marketing. Journal of Marketing, 63(Special Issue), 168-179.
Stake, R. E. (1994). Case studies. In N. K. Denzin & Y. S. Lincoln (Eds.), Handbook of qualitative research (pp. 236-247). Thousand Oaks: Sage.
References
- 291 -
Stake, R. E. (1995). The art of case study research. Thousand Oaks: Sage.
Stake, R. E. (2000). Case studies. In N. K. Denzin & Y. S. Lincoln (Eds.), Handbook of qualitative research (2nd ed., pp. 435-454). Thousand Oaks: Sage.
Statistics New Zealand. (2005, February 2004). New Zealand Business Demographic Statistics. Retrieved 13 January, 2005, from http://www2.stats.govt.nz/domino/external/pasfull/pasfull.nsf/7cf46ae26dcb6800cc256a62000a2248/4c2567ef00247c6acc256f6b000db788?OpenDocument
Stefanou, C. J., Sarmaniotis, C., & Stafyla, A. (2003). CRM and customer-centric knowledge management: An empirical research. Business Process Management Journal, 9(5), 617-634.
Stephens, C. S., Ledbetter, W. N., Mitra, A., & Ford, F. N. (1992). Executive or functional manager? The nature of the CIO's job. MIS Quarterly, 16(4), 449-467.
Stern, B. B. (1997). Advertising intimacy: Relationship marketing and the services consumer. Journal of Advertising, 26(4), 7-19.
Stone, M. (1974). Cross-validatory choice and assessment of statistical predictions. Journal of the Royal Statistical Society. Series B (Methodological), 36(2), 111-147.
Stone, R. W., & Good, D. J. (1995). Expert systems in the marketing organization. Industrial Management + Data Systems, 95(4), 3-7.
Storbacka, K., Strandvik, T., & Grönroos, C. (1994). Managing customer relationships for profit: The dynamics of relationship quality. International Journal of Service Industry Management, 5(5), 21-38.
Subramanian, R., & Gopalakrishna, P. (2001). The market orientation-performance relationship in the context of a developing economy: An empirical analysis. Journal of Business Research, 53(1), 1-13.
Sudman, S., & Bradburn, N. M. (1982). Asking questions. San Francisco: Jossey-Bass Publishers.
Suppes, P., & Zinnes, J. L. (1963). Basic measurement theory. In D. R. Luce, R. R. Bush & E. Galanter (Eds.), Handbook of mathematical psychology (Vol. 1, pp. 1-76). New York: John Wiley and Sons.
Sweat, J., & Hibbard, J. (1999, June 21). Customer disservice. InformationWeek, 65-78.
Tallon, P. P., Kraemer, K. L., & Gurbaxani, V. (2000). Executives' perceptions of the business value of information technology: A process-oriented approach. Journal of Management Information Systems, 16(4), 145-173.
Talvinen, J. M. (1995). Information systems in marketing: Identifying opportunities. European Journal of Marketing, 29(1), 8-26.
References
- 292 -
Tapp, A. (2005). Principles of direct and database marketing (3rd ed.). Harlow, England: Prentice Hall.
Tellefsena, T., & Thomas, G. P. (2005). The antecedents and consequences of organizational and personal commitment in business service relationships. Industrial Marketing Management, 34(1 ), 23- 37.
The Data Warehousing Institute. (2000). TDWI industry study 2000 executive summary: Harnessing customer information for strategic advantage: Technical challenges and business solutions (www.dw-institute.com). Seattle, WA: The Data Warehousing Institute.
Thomas, J. S., Blattberg, R. C., & Fox, E. J. (2004). Recapturing lost customers. Journal of Marketing Research, 41(1), 31-45.
Thomas, R. W., Soutar, G. N., & Ryan, M. M. (2001). The selling orientation-customer orientation (S.O.C.O.) scale: A proposed short form. Journal of Personal Selling & Sales Management, 21(1), 63-69.
Thorbjornsen, H., Supphellen, M., Nysveen, H., & Pedersen, P. E. (2002). Building brand relationships online: A comparison of two interactive applications. Journal of Interactive Marketing, 16(3), 17-34.
Tobias, R. D. (1995). An introduction to partial least squares regression [Electronic Version]. SUGI 20: Proceedings, 1-8. Retrieved 16 February 2007 from http://www.ats.ucla.edu/STAT/SAS/library/pls.pdf.
Too, L. H. Y., Souchon, A. L., & Thirkell, P. C. (2001). Relationship marketing and customer loyalty in a retail setting: A dyadic exploration. Journal of Marketing Management, 17(3/4), 287-319.
Tourangeau, R., Rips, L. J., & Rasinski, K. (2000). The psychology of survey response. Cambridge: Cambridge University Press.
Traylor, M. (1983). Ordinal and interval scaling. Journal of the Market Research Society, 25(4), 297-303.
Tuominen, M., Rajala, A., & Möller, K. (2004). Market-driving versus market-driven: Divergent roles of market orientation in business relationships. Industrial Marketing Management, 33(3), 207-217.
Turban, E., McLean, E., & Wetherbe, J. (2003). Information technology for management: Transforming organizations in the digital economy (4th ed.). Hoboken, NJ: John Wiley & Sons.
Turban, E., Rainer, R. K., Jr., & Potter, R. E. (2003). Introduction to information technology (2nd ed.). New York: John Wiley & Sons.
Ullman, J. B. (2006). Structural equation modeling: Reviewing the basics and moving forward. Journal of Personality Assessment, 87(1), 35-50.
References
- 293 -
van Bentum, R., & Stone, M. (2005). Customer relationship management and the impact of corporate culture - A European study. Journal of Database Marketing & Customer Strategy Management, 13(1), 28-54.
Varela, J. A., & del Río, M. (2003). Market orientation behavior: An empirical investigation using MARKOR. Marketing Intelligence & Planning, 21(1), 6-15.
Vargo, S. L., & Lusch, R. (2004). Evolving to a new dominant logic for marketing. Journal of Marketing, 68(1), 1-17.
Venkatesan, R., & Kumar, V. (2004). A customer lifetime value framework for customer selection and resource allocation strategy. Journal of Marketing, 68(4), 106-125.
Venkatesh, V., & Davis, F. D. (1996). A model of the antecedents of perceived ease of use: Development and test. Decision Sciences, 27(3), 451-481.
Venkatesh, V., & Davis, F. D. (2000). A theoretical extension of the technology acceptance model: Four longitudinal field studies. Management Science, 46(2), 186-204.
Venkatesh, V., Davis, F. D., Morris, M. G., & Davis, G. B. (2003). User acceptance of information technology: Toward a unified view. MIS Quarterly, 27(3), 425-477.
Venkatraman, N., & Ramanujam, V. (1986). Measurement of business performance in strategy research: A comparison of approaches. Academy of Management. The Academy of Management Review, 11(4), 801-814.
Venugopal, V., & Baets, W. (1994). Neural networks & their applications in marketing management. Journal of Systems Management, 45(9), 16-21.
Verhoef, P. C. (2003). Understanding the effect of customer relationship management efforts on customer retention and customer share development. Journal of Marketing, 67(4), 30-45.
Verhoef, P. C., Franses, P. H., & Hoekstra, J. C. (2001). The impact of satisfaction and payment equity on cross-buying: A dynamic model for a multi-service provider. Journal of Retailing, 77(3), 359-378.
Viswanathan, M. (2005). Measurement error and research design. Thousand Oaks, CA: Sage Publications.
Webb, D., Webster, C., & Krepapa, A. (2000). An exploration of the meaning and outcomes of a customer-defined market orientation. Journal of Business Research, 48(2), 101-112.
Webster, F. E., Jr. (1992). The changing role of marketing in the corporation. Journal of Marketing, 56(4), 1-17.
Webster, F. E., Jr. (2000). Understanding the relationships among brands, consumers, and resellers. Journal of the Academy of Marketing Science, 28(1), 17-23.

References
- 294 -
Wells, J. D., & Hess, T. J. (2002). Understanding decision-making in data warehousing and related decision support systems: An explanatory study of a customer relationship management application. Information Resources Management Journal, 15(4), 16-32.
Wilcox, R. R. (1998). How many discoveries have been lost by ignoring modern statistical methods? The American Psychologist, 53(3), 300-314.
Wilkinson, I., & Wiley, J. (2000, 28 Nov - 1 Dec). The impact of connected relations on relationship performance: A comparison of European and Chinese results using the IMP Data Base. Paper presented at the ANZMAC 2000, Gold Coast, Queensland, Australia.
Wilson, D. T. (1995). An integrated model of buyer-seller relationships. Journal of the Academy of Marketing Science, 23(4), 335-345.
Wilson, D. T., & Vlosky, R. P. (1998). Interorganizational information system technology and buyer-seller relationships. The Journal of Business & Industrial Marketing, 13(3), 215-234.
Winer, R. S. (2001). A framework for customer relationship management. California Management Review, 43(4), 89-105.
Wixom, B. H., & Watson, H. J. (2001). An empirical investigation of the factors affecting data warehousing success. MIS Quarterly, 25(1), 17-41.
Wold, H. (1982). Systems under indirect observation using PLS. In C. Fornell (Ed.), A second generation of multivariate analysis: Methods (Vol. 1, pp. 325-347). New York: Praeger.
Wold, H. (1985). Systems analysis by partial least squares. In P. Nijkamp, H. Leitner & N. Wrigley (Eds.), Measuring the unmeasurable (pp. 221-251). Dordrecht, The Netherlands: Martinus Nijhoff Publishers.
Wong, A., & Sohal, A. (2002). An examination of the relationship between trust, commitment and relationship quality. International Journal of Retail & Distribution Management, 30(1), 34-50.
Woodcock, N., & Starkey, M. (2001). 'I wouldn't start from here': Finding a way in CRM projects. Journal of Database Marketing, 9(1), 61-74.
Wright, L. T., Stone, M., & Abbott, J. (2002). The CRM imperative - Practice vs theory in the telecommunications industry. Journal of Database Marketing, 9(4), 339-349.
Wu, I.-L., & Wu, K.-W. (2005). A hybrid technology acceptance approach for exploring e-CRM adoption in organizations. Behaviour & Information Technology, 24(4), 303 - 316.
Wyner, G. A. (1999). Customer relationship measurement. Marketing Research, 11(2), 39-41.
References
- 295 -
Yanagihara, H., & Yuan, K.-H. (2005). Four improved statistics for contrasting means by correcting skewness and kurtosis. British Journal of Mathematical & Statistical Psychology, 58, 209-237.
Yau, O. H. M., McFetridge, P. R., Chow, R. P. M., Lee, J. S. Y., Sin, L. Y. M., & Tse, A. C. B. (2000). Is relationship marketing for everyone? European Journal of Marketing, 34(9/10), 1111-1127.
Yeung, M. C. H., Ging, L. C., & Ennew, C. T. (2002). Customer satisfaction and profitability: A reappraisal of the nature of the relationship. Journal of Targeting, Measurement and Analysis for Marketing, 11(1), 24-33.
Yin, R. K. (2003). Case study research: Design and methods (3rd ed. Vol. 5). Thousand Oaks: Sage.
Young, L. C., & Wilkinson, I. F. (1989). The role of trust and co-operation in marketing channels: A preliminary study. European Journal of Marketing, 23(2), 109-122.
Yu, L. (2001). Successful customer-relationship management. Sloan Management Review, 42(4), 18-19.
Zablah, A. R., Bellenger, D. N., & Johnston, W. J. (2004). An evaluation of divergent perspectives on customer relationship management: Towards a common understanding of an emerging phenomenon. Industrial Marketing Management, 33(6), 475-489.
Zahra, S. A., & Covin, J. G. (1993). Business strategy, technology policy and firm performance. Strategic Management Journal, 14(6), 451-478.
Zeithaml, V. A., Berry, L. L., & Parasuraman, A. (1993). The nature and determinants of customer expectations of service. Journal of the Academy of Marketing Science, 21(1), 1-12.
Zeithaml, V. A., Berry, L. L., & Parasuraman, A. (1996). The behavioral consequences of service quality. Journal of Marketing, 60(2), 31-46.
Zeithaml, V. A., Rust, R. T., & Lemon, K. N. (2001). The customer pyramid: Creating and serving profitable customers. California Management Review, 43(4), 118-142.
Zeng, Y. E., Wen, H. J., & Yen, D. C. (2003). Customer relationship management (CRM) in business-to-business (B2B) e-commerce. Information Management & Computer Security, 11(1), 39-44.
Zikmund, W. G., McLeod, R. J., & Gilbert, F. W. (2003). Customer relationship management: Integrating marketing strategy and information technology. Hoboken, NJ: John Wiley & Sons.
Zinkhan, G. M., Joachimsthaler, E. A., & Kinnear, T. C. (1987). Individual differences and marketing decision support system usage and satisfaction. Journal of Marketing Research, 24(2), 208-214.