crop harvest in denmark and central europe contributes to the local
TRANSCRIPT

Atmos. Chem. Phys., 12, 11107–11123, 2012www.atmos-chem-phys.net/12/11107/2012/doi:10.5194/acp-12-11107-2012© Author(s) 2012. CC Attribution 3.0 License.
AtmosphericChemistry
and Physics
Crop harvest in Denmark and Central Europe contributes tothe local load of airborneAlternaria spore concentrations inCopenhagen
C. A. Skjøth1,2, J. Sommer3, L. Frederiksen1, and U. Gosewinkel Karlson1
1Department of Environmental Science, Aarhus University, Frederiksborgvej 399, 4000 Roskilde, Denmark2Department of Earth and Ecosystem Sciences, Solvegatan 12, Lund University, 223 62 Lund, Sweden3Asthma-Allergy Denmark, Universitetsparken 4, 4000 Roskilde, Denmark
Correspondence to:U. Gosewinkel Karlson ([email protected])
Received: 1 May 2012 – Published in Atmos. Chem. Phys. Discuss.: 7 June 2012Revised: 5 October 2012 – Accepted: 26 October 2012 – Published: 22 November 2012
Abstract. This study examines the hypothesis that Danishagricultural areas are the main source of airborneAlternariaspores in Copenhagen, Denmark. We suggest that the contri-bution to the overall load is mainly local or regional, but withintermittent long distance transport (LDT) from more remoteagricultural areas. This hypothesis is supported by investigat-ing a 10 yr bi-hourly record ofAlternaria spores in the airfrom Copenhagen. This record shows 232 clinically relevantepisodes (daily average spore concentration above 100 m−3)with a distinct daily profile. The data analysis also revealedpotential LDT episodes almost every year. A source map andanalysis of atmospheric transport suggest that LDT alwaysoriginates from the main agricultural areas in Central Europe.A dedicated emission study in cereal crops under harvest dur-ing 2010 also supports our hypothesis. The emission studyshowed that although the fields had been treated against fun-gal infections, harvesting still produced large amounts of air-borne fungal spores. It is likely that such harvesting periodscan cause clinically relevant levels of fungal spores in theatmosphere. Our findings suggest that crop harvest in Cen-tral Europe causes episodes of high airborneAlternariasporeconcentrations in Copenhagen as well as other urban areas inthis region. It is likely that such episodes could be simulatedusing atmospheric transport models.
1 Introduction
The importance of understanding the spatial and temporaldistribution of fungal spores has recently been highlightedby Lang-Yona et al. (2012) by presenting seasonal variationsof airborne fungal spore concentrations in 2009 at a site inIsrael, based on quantitative real time polymerase chain re-action (qPCR) analysis (Lang-Yona et al., 2012). Similarly,studies from the same group in Israel suggest that fungalspore concentrations peak during spring and autumn (Bur-shtein et al., 2011). The authors discuss whether these peakscould be related to spring blooms and autumn decompositionof the vegetation.
Fungal spore concentrations can also be obtained usingvolumetric spore traps of the Hirst design (Hirst, 1952). Theadvantage of the Hirst trap is that it provides a daily or bi-hourly record of fungal spore concentrations that may beused to construct actual calendars of bioaerosols (e.g. Ceteret al., 2012; Melgar et al., 2012; Skjøth and Sommer, 2010).The disadvantage of the Hirst trap is that the associatedmethod for counting of the spores in microscopes only pro-vides observations of fungal spores at the genus level (e.g.Ceter et al., 2012; Skjøth and Sommer, 2010), whereas qPCRcan quantify fungal spores at the species level. This disad-vantage is outweighed by the long time series with high tem-poral resolution, often covering several years with bi-hourlyrecords (Oliveira et al., 2009; Stepalska et al., 1999; Stepal-ska and Wolek, 2009) or even up to 10 yr or more (Aira etal., 2008; Hjelmroos, 1993; Skjøth and Sommer, 2010). De-spite these advantages with data from the Hirst trap, data of
Published by Copernicus Publications on behalf of the European Geosciences Union.
11108 C. A. Skjøth et al.: Crop harvest in Denmark and Central Europe
fungal spores are rare in comparison to pollen data. This iseven more pronounced when the numbers of studies on datafrom Hirst traps are compared to studies on atmospheric tracegasses such as ozone. This lack of scientific attention hasbeen recognized for a number of years, e.g. by an editorialin The Lancet (2008) and by the recommendation in Allergyby Cecchi et al. (2010); as such they both suggested furtherstudies in aerobiology. Studies on bio-aerosols such as air-borne fungal spores are therefore highly needed.
The first long term study on fungal spores in the air ofCopenhagen by Skjøth and Sommer (2010) showed that thegeneraCladosporiumandAlternaria both have their maxi-mum concentrations during summer, but thatCladosporiumhas a much longer season. This suggests that the source ofthese two important genera of fungal spores can be different.
Observations from Hirst traps for the last 5–10 yr havebeen used to improve knowledge of aeroallergens, espe-cially concerning possible source locations of these aeroal-lergens. These studies include source-receptor studies onpollen fromFagus(Belmonte et al., 2008),Betula(Mahuraet al., 2007; Skjøth et al., 2007; Veriankaite et al., 2010),Poaceae (Smith et al., 2005), Olea (Hernandez-Ceballos etal., 2011b),Ambrosia artemisiifolia(Cecchi et al., 2007;Fernandez-Llamazares et al., 2012; Sikoparija et al., 2009)andQuercus(Hernandez-Ceballos et al., 2011a). This sug-gests that similar analysis on fungal spore observations (e.g.Alternaria) from the Hirst trap also can identify sources ofthe most important genera of fungal spores.
Fungal spores that are among the most often observedgenera areAspergillus, Pennicillium, CladosporiumandAl-ternaria (Lang-Yona et al., 2012; Larsen, 1981). The genusAlternaria includes numerous plant pathogens (Gravesen etal., 1994) andAlternaria spores are considered an impor-tant part of the total fungal spectrum in, e.g. potato crops(e.g. Escuredo et al., 2011; Iglesias et al., 2007).Alternariaspores of the speciesAlternaria alternatacan also threatenhuman health (Damato and Spieksma, 1995) and cause al-lergic symptoms in sensitized individuals when the atmo-spheric concentrations are high (Gravesen, 1979). The ob-servational methods in the Danish and the European moni-toring programme rely on visual identification of pollen andfungal spores. This means that this method cannot identifyAlternaria alternatafrom the genusAlternaria. The thresh-old of 100 spores m−3 is based on the methods that includeboth a slit sampler (for growing colonies and subsequentidentification) and a Hirst trap for providing atmosphericconcentrations (Gravesen, 1979). As such, the threshold of100 spores m−3 includes both allergenic and non-allergenicfungal spores from the genusAlternaria. The sources of air-borneAlternaria spores are considered to be mainly vegeta-tion such as forest and agricultural land (e.g. Stepalska etal., 1999) during the drying and decomposition of above-ground plant tissues (Escuredo et al., 2011; Iglesias et al.,2007). The studies by Skjøth and Sommer (2010) showedthat in Denmark theAlternaiaseason ends in the middle of
September, which is about a month before leaf fall in theforests. Similar studies from Poland showed that the peak ofthe Alternaria spore season is found in July–August, whileOctober–November has a relatively small load ofAlternariaspores (Stepalska et al., 1999). This suggests that decompo-sition of tree leaves does not contribute to the overallAl-ternaria load in Northern and Central Europe. In the UK,agricultural areas near Cardiff and Derby have been sug-gested as potential sources of highAlternariaconcentrations(Corden et al., 2003), and studies from northern Portugal andPoland have shown that rural areas have a higher load ofAlternaria than nearby urban areas (Oliveira et al., 2009).Wheat harvesting has previously been shown to release largenumbers of spores into the air (Friesen et al., 2001), exposingharvesters to large amounts of viable fungi (Hill et al., 1984).Vegetation in agricultural areas is therefore a likely mainsource ofAlternaria spores in many parts of Europe. Stud-ies from the USA have shown that spores from agriculturalareas that are infected with soybean rust (P. meibomiaeandP. pachyrhizi) have the potential to be transported more than1000 km under favourable weather conditions (Isard et al.,2005, 2007). European studies on other aeroallergens haveshown that the overall load in a region is typically due to localsources with intermittent long distance transport from remoteregions (Skjøth et al., 2009; Smith et al., 2008).Alternariaspores vary in size (10–40 µm× 10–220 µm), have cylindricforms and fall speeds between 0.4 and 4 cm s−1 (McCart-ney et al., 1993).Alternaria alternatais among the smallestamong this group of fungal spores, with an aerodynamic di-ameter of 19 µm. It is therefore likely thatAlternaria spores,including Alternaria alternata, have a similar potential foratmospheric transport as other aeroallergens. This suggeststhat the temporal and spatial variation ofAlternaria sporesis mainly dependent on the proximity of local sources andonly secondarily dependent on long distance transport (LDT)from areas with a high load ofAlternaria.
In this study we hypothesize that Danish agricultural areasare the main source of airborneAlternaria spores in Den-mark, and that the contribution to the overall load is mainlylocal but with intermittent LDT from non-Danish areas withboth a high density of agricultural areas and a potentiallyhigh load ofAlternaria due to harvest. We have adapted aprotocol that has been used in several similar European stud-ies on allergenic pollen since 2007 (Hernandez-Ceballos etal., 2011b; Sikoparija et al., 2009; Stach et al., 2007) anduse the definitions of local regional and long distance trans-port as given by Orlanski (1975). Here we investigate our hy-pothesis by analysing a 10 yr record of bi-hourlyAlternariaspore observations from Copenhagen with respect to season-ality, overall daily pattern and potential source areas to LDT,combined with a dedicated field study on potential emissionsources in agricultural areas.
Atmos. Chem. Phys., 12, 11107–11123, 2012 www.atmos-chem-phys.net/12/11107/2012/

C. A. Skjøth et al.: Crop harvest in Denmark and Central Europe 11109
Table 1.Seasonal spore index, day of season start, day of season end, and day of maximum spore concentration and its value. Sum of sporesduring season, sum on low days and sum on high days and number of days above the critical threshold of 100 spores as a daily mean value.The sum of low days and high days correspond to the total accumulated catch during the season (the days that cover 95 % of the entire catch)and not the entire year.
Year SeasonalSporeIndex
Day ofseasonstart
Day ofseasonend
Day of maxi-mum concen-tration
maximumvaluespores m−3
Sum ofspores inseason
Sum, lowdays inseason
Sum,high daysin season
Days above100 (high)spores m−3
2001 9431 6 Jul 20 Sep 17 Aug 1016 8966 1875 7091 232002 7046 5 Jul 12 Sep 29 Jul 567 6686 1877 4809 212003 4488 18 Jul 18 Sep 19 Jul 279 4257 1291 2966 172004 5651 2 Jul 8 Sep 6 Aug 607 5321 1266 4055 182005 8141 21 Jun 20 Sep 10 Aug 468 7565 1600 5965 202006 10 781 1 Jul 21 Sep 11 Aug 682 10 251 2164 8087 272007 7813 20 Jun 28 Aug 17 Jul 588 7386 1735 5651 222008 5276 26 Jun 11 Sep 31 Aug 313 5006 2208 2798 172009 10 511 1 Jul 15 Sep 9 Aug 595 9989 1780 8209 312010 7519 8 Jul 8 Sep 3 Aug 689 7178 1651 5527 27Mean 7946 1 Jul 12 Sep 6 Aug 580 7261 1745 5516 23SD 2239 7 days 7 days 13 days 208 2044 315 1917 5
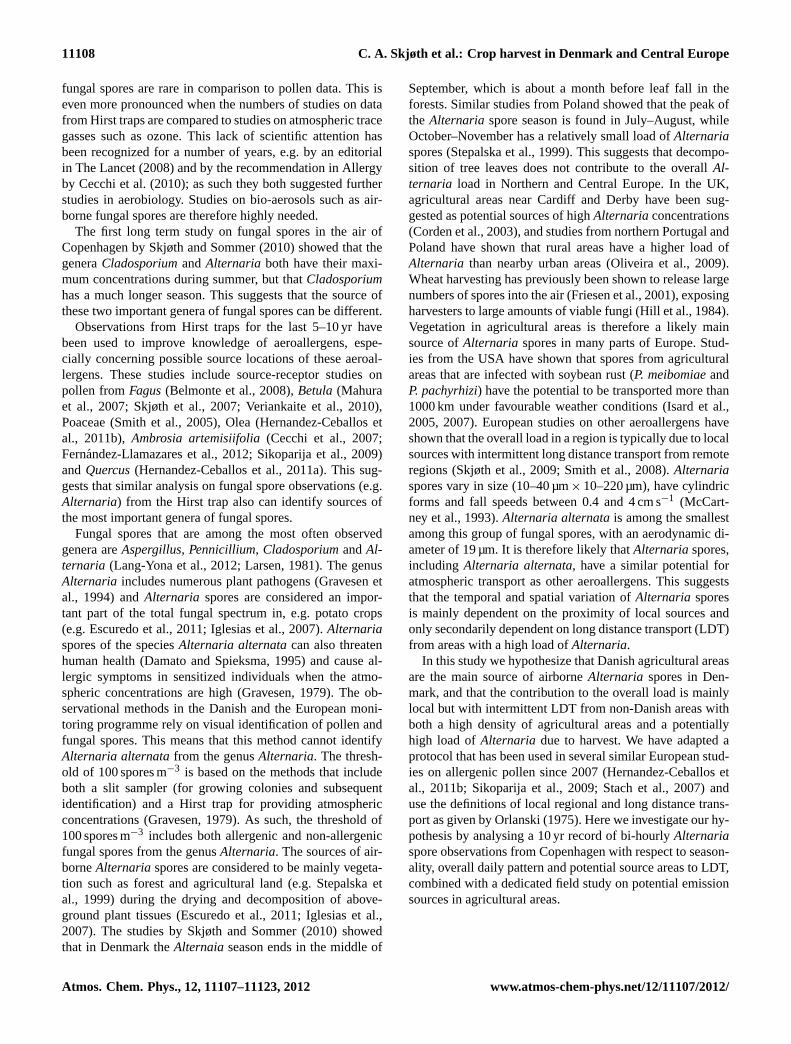
Fig. 1.Mean diurnalAlternariaspore concentration for days above100 spores m−3, n = 232. The error bar for each mean value corre-sponds to 1 standard deviation.
2 Methodology
2.1 Spore trap data and analysis of episodes
Measurements from Copenhagen obtained within the Danishpollen and spore program (Skjøth and Sommer, 2010; Som-mer and Rasmussen, 2009) have been analysed for 2001–2010 with respect toAlternaria spores. In the monitoringprogramme,Alternaria spores are identified at genus leveland counted at 640× magnification on 12 transverse stripsfor every two hours. The total area of investigation cor-responds to 9.75 % of the total sample. This area and theflow rate of the fungal spore trap can be used to convertthe spore count into bi-hourly concentrations or daily meanconcentrations. The trap was located on the roof of the Dan-
ish Meteorological Institute (55◦43′ N, 12◦34′ E) in the cen-tre of Copenhagen at a height of 15 m above sea level.The near surroundings to the trap in Copenhagen are ur-ban, while nearby areas within a distance of≥ 30 km aremainly agricultural in both southern Sweden and Denmark,as described by Skjøth et al. (2008). Summaries of the datafor the 10 years are organised in two tables in a simi-lar way as Kasperzyk et al. (2011) with respect to the an-nual spore index (the summation of daily mean values),day with maximum concentration and start of season (Ta-ble 1). The annual spore index is dimensionless by conven-tion in aerobiology (Mandrioli et al., 1998), although Buterset al. (2012) recently have argued that the unit of the asso-ciated equation must be
∑grains m−3. TheAlternaria sea-
sons were defined using the 95 % method (Goldberg et al.,1988), as this is the standard analytical method in the Dan-ish pollen and spore program (Skjøth and Sommer, 2010;Sommer and Rasmussen, 2009). Each of the 10 yr are there-fore investigated during that period, when the accumulatednumber of fungal spores are between 2.5 % and 97.5 % ofthe total annual catch. The daily average concentration of100 Alternaria spores m−3 has been reported as a clinicalthreshold for allergic symptoms (Gravesen, 1979; Ricci etal., 1995). Therefore, days with daily average concentrationabove 100 spores m−3 were investigated for the mean diurnalvariation (Fig. 1).Alternaria episodes (> 100 spores m−3)
that showed diurnal patterns that were markedly differentfrom the mean daily cycle (Table 2) were investigated fur-ther using back trajectory analysis, in a similar way asin related studies onBetula (Skjøth et al., 2009),Quer-cus (Hernandez-Ceballos et al., 2011a),Olea (Fernandez-Rodrıguez et al., 2012; Hernandez-Ceballos et al., 2011b)
www.atmos-chem-phys.net/12/11107/2012/ Atmos. Chem. Phys., 12, 11107–11123, 2012

11110 C. A. Skjøth et al.: Crop harvest in Denmark and Central Europe
Table 2.Days with episodes (above 100 spores m−3) of fungal spores with a markedly different daily pattern compared to the overall dailypattern of the 232 episodes recorded in Copenhagen during 2001–2010.
Date/hour 1 3 5 7 9 11 13 15 17 19 21 23
22 Jul 2001 264 276 384 216 300 216 36 132 84 156 192 18021 Jul 2003 84 156 204 252 336 384 192 24 48 24 84 1226 Jul 2003 168 564 432 156 24 0 0 36 0 12 0 605 Sep 2004 408 384 204 228 132 228 180 120 144 84 36 025 Aug 2005 348 324 300 492 216 84 0 48 0 24 0 3610 Aug 2006 1452 876 840 600 504 36 96 420 228 420 384 19225 Aug 2006 384 456 168 288 312 180 168 216 120 180 108 12026 Aug 2006 168 144 192 84 132 180 108 180 60 12 0 1205 Aug 2007 708 540 540 732 444 492 480 288 420 444 96 3611 Aug 2007 216 324 264 252 252 252 444 60 0 48 48 1231 Aug 2008 660 420 540 480 228 600 336 180 84 144 72 1222 Jul 2009 312 264 444 264 168 216 360 192 24 36 12 4827 Jul 2009 48 48 156 348 276 36 96 12 12 132 48 846 Aug 2010 468 420 420 276 324 168 396 228 312 204 72 10811 Aug 2010 216 360 336 336 228 24 12 0 0 24 12 1216 Aug 2010 1344 1428 300 312 204 420 204 504 312 12 0 48
and Ambrosia artemisiifolia(Fernandez-Llamazares et al.,2012; Kasprzyk et al., 2011; Sikoparija et al., 2009).
2.2 Field observations and emission estimates
Emission estimates ofAlternariaspores during harvest wereobtained at four locations around Tune, Roskilde, Denmark.Samples were obtained from wheat and barley fields between18 August and 16 September 2011. The measurements weretaken as grab samples (i.e. a small but representative sam-ple) from the exhaust airstream of the harvesting machine.The grab samples were allowed to immediately sedimentonto glass slides for later microscopic counting of spores.Visual inspection of the fields revealed that none of the cropsdisplayed signs of fungal infection. The barley fields hadbeen treated against fungal infections by spraying with pyr-aclostrobin and tebuconazole on 15 June 2011. The wheatfields had been treated against fungal infections by sprayingwith propiconazole on 18 April 2011, with pyraclostrobin,epoxiconazole and boscalide on 25 May 2011, and again withepoxiconazole and boscalide on 16 June 2011. All applica-tions were according to manufacturers’ and agricultural ad-visors’ recommendations, targeting the fungicide resistancespectra of local fungal pathogens. The fungicides used wereneither targeted at, nor are claimed active againstAlternariaspp., although it cannot be excluded that the fungicides usedin the study fields initially had an inhibitory effect onAl-ternaria spp. Even thoughAlternaria triticina has been re-ported to cause fungal infections in wheat in India (Singhet al., 1998) and Argentina (Perello and Sisterna, 2005), inEurope the economic effect ofAlternaria spp. is consideredinsignificant in barley (Gannibal, 2008) and rare in wheat(Gultyaeva, 2008), making their chemical control unneces-
sary. During maturing and senescence of crop plants, priorto harvest the earlier applied systemic fungicides will ceaseto have an effect, which indeed is a regulatory condition fortheir use. Therefore, asAlternaria spp. are common to theenvironment, having a role in the decay of organic matter(Kirk et al., 2008), anyAlternaria spores found in this studymost likely will reflect the normal course of fungal invasionof grain crops during early summer, occurring in most or allfields of Central and Northern Europe where moist condi-tions occur intermittently during the weeks prior to harvest.
The harvester was a CASE-IH Agriculture model 7120Axialflow combine with a type 3050 cutter table (width915 cm). During sampling of emission estimates, the har-vester advanced at ca. 4 km h−1, with its air throughput beingset to ca. 950 (unitless machine value, corresponding to ca.570 m3 min−1). The straw shredder was running on two sam-pling dates, on the two others it was turned off.
Samples of emissions were obtained by manually direct-ing the harvester’s exhaust air stream through a 155 cmlong piece of ventilation pipe (polished steel; inner diame-ter, 20 cm) and abruptly closing the input end with a paddednylon-covered lid. Immediately after closure, the pipe waspositioned upright, with the lid on the upper end. The bottomend was maintained open for 10 s to allow coarse particles toescape. Then the bottom was sealed using a standard venti-lation pipe stopper (polished steel, with a rubber seal aroundthe edge). The stopper had a glass slide centred on the flat in-ner side. The effective sedimentation distance, from the sur-face of the padded lid to the surface of the glass slide, was155.5 cm. Samples of emissions were produced by allowingparticles to sediment onto the glass slide from the air col-umn inside the pipe for 9 min. After sedimentation, the slidewas removed and archived for later microscopic analysis. In
Atmos. Chem. Phys., 12, 11107–11123, 2012 www.atmos-chem-phys.net/12/11107/2012/

C. A. Skjøth et al.: Crop harvest in Denmark and Central Europe 11111
several cases, residual control samples were taken by con-tinuing the sedimentation for another 9 min on a fresh glassslide and maintaining the pipe firmly in an upright position.Negative control samples included environmental air fromthe middle and from the upwind end of each field. Prior toeach sampling, the inside of the pipe was cleaned with astream of clean air.
The glass slides for emission estimates were identical tothose slides that are used in the Danish pollen and spore pro-gram (Skjøth and Sommer, 2010; Sommer and Rasmussen,2009). The surfaces of the slides were inspected forAltenariaspores by using the spore counting method forAlternaria inthe Danish pollen and spore program (Skjøth and Sommer,2010). The microscopic counts were then converted to sporesper volume of air in the exhaust air of the harvesting ma-chine by using the area that has been investigated on the slidewith the microscope (0.00006552 m2), and the sedimenta-tion distance inside the pipe (1.55 m) for the third dimension.The spore concentrations were converted to estimates ofAl-ternariaspores per ha of harvested field by using the width ofthe cutting table (9 m) and the driving speed (4 km h−1) of theharvesting machine, and by assuming that the grab samplewas representative for the exhaust air stream (570 m3 min−1)of the harvesting machine. Microscopic counts and calcu-lated fungal spore densities for each sample, along with es-timated emission factors for the fields, are presented in Ta-ble A1.
2.3 Model calculations and potential source map
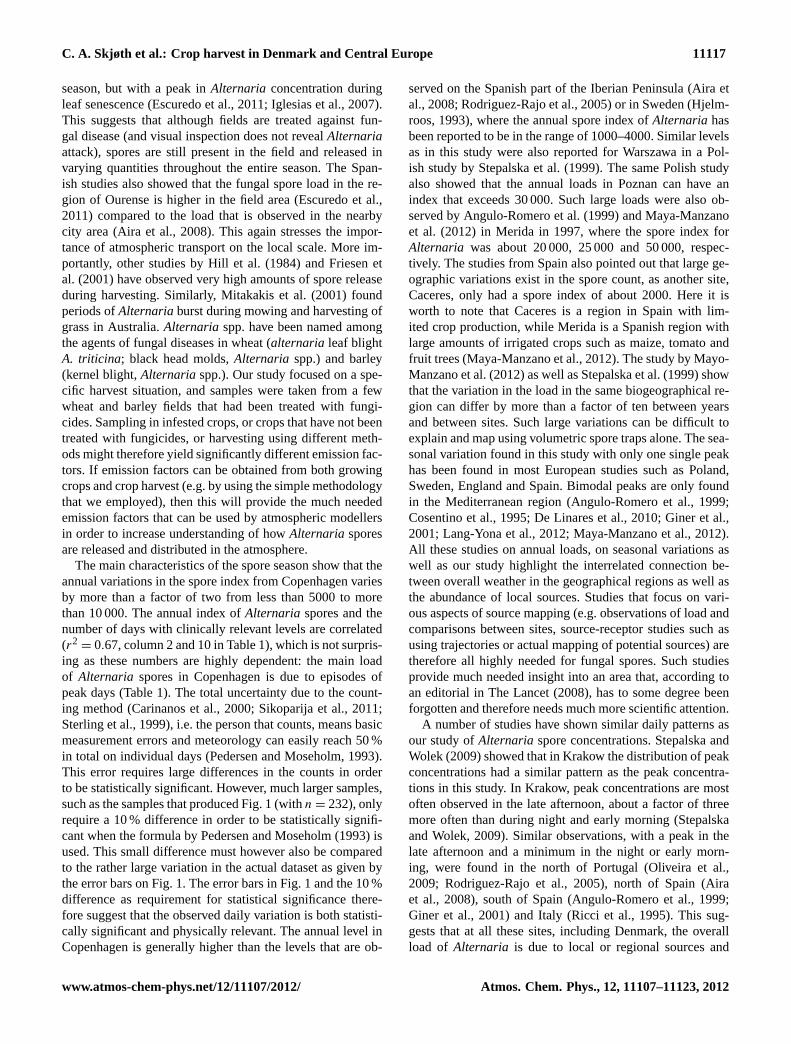
Agricultural areas under rotation and with mechanical har-vesting methods have been identified in the CLC2000 dataset(European Commission, 2005) to consist of the followingthree land cover types: non-irrigated arable land (code 211),permanently irrigated land (code 212), and pastures (code231). The land cover data have been extracted for Cen-tral and Northern Europe (Fig. 2) and gridded to a tenth ofthe EMEP50 grid (http://www.emep.int/grid/griddescr.html)using a similar methodology as Skjøth et al. (2010) andFernandez-Rodrıguez (2012). The EMEP grid is commonlyused for inventories in European air quality studies includ-ing the use of the chemistry transport models EMEP (Fagerliand Aas, 2008; Simpson et al., 2012), the EMEP4UK (Vienoet al., 2010) and DEHM (Brandt et al., 2012; Skjøth et al.,2011). This procedure allows easy comparison of density ofrelevant emission areas throughout the region and analysis inrelation to atmospheric transport (e.g. Fernandez-Rodrıguezet al., 2012).
Back trajectories were computed using the Hybrid SingleParticle Lagrangian Integrated Trajectory (HYSPLIT) model(Draxler et al., 2007). Trajectories were calculated using theGDAS (Global Data Analysis System) meteorological filesmaintained by ARL, with a temporal resolution of 3 h anda spatial resolution of 1 degree× 1 degree. Air mass trajec-tories were calculated at Copenhagen during the identified
Fig. 2. Site map including the location of the spore trap in Copen-hagen, the used precipitation stations (Table A2) and the density ofagricultural areas under rotation – the potential source ofAlternariaspores during harvest.
episodes with a receiving height of 500 m, which in gen-eral is representative for this kind of aerobiological studies(e.g. Hernandez-Ceballos et al., 2011a). Air mass trajecto-ries were plotted 48 h back in time with 2 h steps betweeneach trajectory, corresponding to the time step of the fun-gal spore observations – following the method described byStach et al. (2007) and later used by Skjøth et al. (2008,2009), Smith et al. (2008), Sikoparija et al. (2009), andHernandez-Ceballos et al. (2011a, b) – by using either theACDEP (Skjøth et al., 2002) in the matrix style (Skjøth et al.,2007) or the HYSPLIT (Draxler et al., 2007) models. Mea-sured precipitation from weather and climate stations havebeen used as an estimate for potentialAlternaria spore re-lease due to harvest in the potential source regions (Fig. 2and Table A2) by assuming that dry weather and dry fieldsare required for intense harvesting. Local meteorological ob-servations of wind speeds during the episodes (Table A3)have been obtained from one meteorological mast locatedapprox. 1500 m south of the pollen trap (Skjøth et al., 2008),which is operated by Aarhus University for use in the so-called integrated monitoring of air quality in Denmark (Her-tel et al., 2007).
www.atmos-chem-phys.net/12/11107/2012/ Atmos. Chem. Phys., 12, 11107–11123, 2012

11112 C. A. Skjøth et al.: Crop harvest in Denmark and Central Europe
3 Results
3.1 Seasonal and daily variations ofAlternariain Copenhagen
The annual spore index ofAlternaria in Copenhagen var-ied by more than a factor of two in the spore index from4488 in 2003 to 10 781 in 2006 (Table 1). The mean of theseason start was day number 182, while the mean maxi-mum day during the season was number 218, with a stan-dard deviation of 7 and 13 days, respectively. The highestdaily concentration was 1016 spores m−3 on 17 August 2001(the second largest was 853 spores m−3 on the following day,not shown). The highest observed bi-hourly concentrationwas 2727 spores m−3 (not shown). A total 232 days duringthe 10 yr period had high concentrations above the clinicalthreshold of 100 spores m−3. The contribution from individ-ual years ranged from 17 high days in 2003 (of 70 days intotal within the spore season) and 2008 (of 60 days in total)to 31 days in 2009 (of 76 days in total). The contribution ofthe high days to the total seasonal load varied from about55 % in 2008 to more than 82 % in 2009. The analysis of bi-hourly Alternaria spore concentrations at high days shows atypical daily pattern (Fig. 1), with high concentrations in thelate afternoon reaching 378 spores m−3 and a minimum at112 spores m−3 early in the morning. Sixteen (16) of the 232high days had a very different pattern compared to the typicaldaily pattern (Table 2). These non-typical daily patterns wereidentified by both visual inspection of each individual dayand correlation analysis of the individual days with the meanpattern. Additionally, an inspection of the day before and theday after the period was also carried out in a similar method-ology as given in other studies (Sikoparija et al., 2009; Skjøthet al., 2009). Except for the year 2002, each year had oneor more of these 16 non-typical high days. Trajectory cal-culations show that all of the 16 non-typical high days hadair masses arriving from main agricultural areas in southernScania (Sweden), Denmark, Poland or Germany. The threemost outstanding episodes with respect to both load and pat-tern are discussed in detail in Sect. 3.3 using trajectories andthe source map (Figs. 3–5).
3.2 Alternaria emission sources in local agriculturalfields
Analysis of the field data revealed between 106 and 107 Al-ternariaspores m−3 in the exhaust air of the harvesting com-bine (Table A1). These have been converted into emission be-tween 1.2×10¹⁰ and 6.7×10¹⁰ Alternariaspores ha−1 duringharvest. Residual control slides from a second sedimentationperiod gave 10–15 % of the initial slide. This suggests thatthe sedimentation efficiency in the pipe was 85–90 % forAl-ternariaspores when using 9 min sedimentation time. Nega-tive controls always counted as zero (data not shown). In ad-dition, when the farmer let the machine run idle (the machine
not advancing, i.e. no grain being harvested, but the motorsrunning at normal speed), we were unable to find spores inthe exhaust of the machine.
3.3 Trajectory calculations, potential source map andlong distance transport
The inventory of potential sources toAlternaria spores inCentral and Northern Europe (Fig. 2) reflects the density ofmanaged agricultural areas that are under rotation. The in-ventory shows that the potential sources toAlternariasporesare found in many parts of the studied area. The highestdensities (70–100 %) are found in western Denmark, centraland northern Germany, southern Scania (Sweden) and cen-tral Poland. Much lower densities (0–20 %) are found in mostof southern Sweden, southern Germany, along the border be-tween Germany and Poland, the southern parts of Poland andthe Baltic countries.
In Sects. 3.3.1–3.3.3, the three most outstanding episodeswith respect to both load and pattern are discussed in de-tail, using trajectories and the source maps and the overallweather pattern, including measured accumulated precipita-tion in the potential source region.
3.3.1 Episode 1: 30–31 August 2008
Daily averageAlternaria spore concentrations observed on30 and 31 August 2008 in Copenhagen were 161 and313 spores m−3, respectively. HourlyAlternaria spore con-centrations were low in the beginning of the period and in-creased quickly to above 700 spores m−3 late in the eveningof the 30th and remained at a level of around 600 spores m−3
until midday the 31st (Fig. 3a). From midday the 31st and un-til late in the evening, the concentrations gradually decreasedbelow 100 spores m−3. The weather in the study region had ahigh pressure ridge extending from Iceland (1029 hPa) overScandinavia (∼ 1020 hPa) to northern Germany and cen-tral Poland (1022–1023 hPa). This caused air masses to bepushed from the north towards Copenhagen. Around mid-day of the 30th, wind speeds decreased (by investigating thedistance between the trajectory points) and the air masses re-mained for a number of hours over Denmark and Scania, thesouthernmost province of Sweden, before arriving in Copen-hagen. Similar situations with low wind speeds were alsopresent the 31st (Fig. 3b and c). This was also reflected bymeasured wind speeds down to about 1 m s−1 at nighttimeduring the episode (Table A3). A few mm of precipitationwere recorded on the 29th in the entire region, and the mosteastern parts of Denmark and Sweden also recorded precipi-tation on the 28th and 27th (Table A2). This suggests harvest-ing possibilities in Denmark and Sweden starting the 30thand good harvesting possibilities on 31 August.
Atmos. Chem. Phys., 12, 11107–11123, 2012 www.atmos-chem-phys.net/12/11107/2012/

C. A. Skjøth et al.: Crop harvest in Denmark and Central Europe 11113
(a)
(b) (c)
Fig. 3. (a) Bi-hourly variation inAlternaria spore concentrations (spores m−3) obtained in Copenhagen 30 and 31 August 2008. Back-trajectories arriving at the spore trap in Copenhagen:(b) 30 August;(c) 31 August. The distance between two dots on a trajectory correspondsto one hour of atmospheric transport.
3.3.2 Episode 2: 10–11 August 2010
Daily averageAlternaria spore concentrations observed on10 and 11 August 2010 in Copenhagen were 153 and130 spores m−3, respectively. HourlyAlternaria spore con-centrations had a number of peaks (200–400 spores m−3)
from the beginning of the period until midday 11 August(Fig. 4a). After that the concentrations remained low. Theweather in the study region was dominated by a high pressuresystem (1018–1019 hPa) over central Germany and Poland,which during most of the period pushed air masses fromthe south and southwest towards Copenhagen, passing eitherDanish or German land areas including water areas (Fig. 4band c). Measured wind speeds ranged from about 2 m s−1 to
more than 6 m s−1, where the highest wind speeds were ob-served in the afternoon of the 11th (Table A3). Heavy precip-itation was recorded over eastern parts of Denmark and Sca-nia on 9 August (Table A2). The eastern, western and south-ern parts of Denmark recorded almost no precipitation from5 to 11 August 2010, suggesting generally good harvestingpossibilities in most of Denmark and northern Germany un-til at least 10 and partly 11 August.
3.3.3 Episode 3: 15–16 August 2010
Daily averageAlternaria spore concentrations observed on15 and 16 August 2010 in Copenhagen were 262 and424 spores m−3, respectively. HourlyAlternaria spore con-centrations were low until around midday of the 15th
www.atmos-chem-phys.net/12/11107/2012/ Atmos. Chem. Phys., 12, 11107–11123, 2012

11114 C. A. Skjøth et al.: Crop harvest in Denmark and Central Europe
(a)
(b) (c)
Fig. 4. (a) Bi-hourly variation inAlternaria spore concentrations (spores m−3) obtained in Copenhagen 10 and 11 August 2010. Back-trajectories arriving at the spore trap in Copenhagen:(b) 10 August;(c) 11 August. The distance between two dots on a trajectory correspondsto one hour of atmospheric transport.
and then had two distinct peaks exceeding 1000 and1400 spores m−3 late in the evening the 15th and duringearly morning the 16th (Fig. 5a). Hereafter concentrationsremained high at between 200 and 400 spores m−3 until latein the evening of the 16th, when concentrations dropped tonear zero. The weather in the study region had a high pres-sure area (∼ 1010–1021 hPa) covering most of Poland, theBaltic countries, Russia and reaching down to the Balkan re-gion. At the same time, minor low pressure centres (1006–1013 hPa) were located over southern Sweden and Germany.This caused air masses from the Eastern and the Baltic statesto be pushed towards Denmark in the beginning of the pe-riod. These air masses arrived in Copenhagen from the north-west, passing over northern parts of Scania. Around midday
of the 15th, winds veered to the south so that the air massesoriginated from either Germany or Poland. These air massescrossed the Baltic Sea and arrived in Copenhagen either di-rectly from the sea or by crossing the southern parts of Sca-nia in Sweden. Measured wind speeds ranged from about1 m s−1 to more than 6 m s−1, where the highest wind speedsoccurred on the first half of the 16th (Table A3). Heavy pre-cipitation was recorded over Denmark and Scania the 13thand 15th (Table A2). Medium precipitation was recorded atWielkopolski 13, 14 and 15 August, while the remaining 6Polish stations recorded limited or no precipitation. This sug-gests that during the episode there were limited harvestingpossibilities in Denmark/Sweden and good harvesting possi-bilities in Poland.
Atmos. Chem. Phys., 12, 11107–11123, 2012 www.atmos-chem-phys.net/12/11107/2012/

C. A. Skjøth et al.: Crop harvest in Denmark and Central Europe 11115
(a)
(b) (c)
Fig. 5. (a) Bi-hourly variation inAlternaria spore concentrations (spores m−3) obtained in Copenhagen 15 and 16 August 2010. Back-trajectories arriving at the spore trap in Copenhagen:(b) 15 August;(c) 16 August. The distance between two dots on a trajectory correspondsto one hour of atmospheric transport.
4 Discussion
The measured airborne concentrations ofAlternaria sporesin Copenhagen show that the majority of the 232 high dayshave a strong diurnal pattern with a maximum in the lateafternoon and a minimum during night or early morning(Fig. 1). If the main source ofAlternariaspores were remotesources, then this daily pattern could have been either non-existent or peaked at any time of the day, as the big plumes ofLDT of aeroallergens can arrive in Copenhagen at any timeof the day or night (Mahura et al., 2007; Skjøth et al., 2007,2008). The number of high days are outnumbered by lowdays (Table 1), but every year the total load during the sea-son has been dominated by the high days, which contributedup to 82 % of the entireAlternaria load during the season
(Table 1). Here we have investigated all 232 high days indi-vidually. Only 16 (Table 2) of the 232 high days have a diur-nal pattern that deviates from the overall pattern (Fig. 2). Thepotential source map (Fig. 2) shows that Denmark is domi-nated by land cover types that can be a strong source ofAl-ternariaspores. Additionally, the emission study from a typi-cal land cover with agricultural production in rotation showsthat emission during harvest releases a large amount ofAl-ternaria spores, even when the fields have been treated withfungicides. Finally, the small fraction of high days, whichshow a diurnal pattern that differs from the overall pattern,have been analysed with respect to air mass transport (us-ing HYSPLIT and the reanalysis meteorological dataset). Inall cases, the air masses came from more remote areas that
www.atmos-chem-phys.net/12/11107/2012/ Atmos. Chem. Phys., 12, 11107–11123, 2012

11116 C. A. Skjøth et al.: Crop harvest in Denmark and Central Europe
are also dominated by land cover types containing poten-tial sources toAlternaria spores. Such episodes were iden-tified almost every year during the study period (Table 2).Additionally, it was shown that even if a region such aseastern Denmark and southern Sweden had obtained verylarge amounts of rain, making harvest very difficult, more re-mote regions, e.g. Poland, could have contributed with largeamounts ofAlternaria spores (Fig. 5). Overall, these studiessuggest that the daily load ofAlternaria spores is dominatedby local or regional sources with intermittent LDT from moreremote sources, in e.g. Germany and Poland, and that theseLDT episodes can happen almost every year.
Recently, a number of source receptor studies on aeroal-lergens have been carried out by combining measured con-centrations from the Hirst traps with trajectory calculations.These studies have identified both local sources and intermit-tent long distance transport from regions with high sourcedensities. Common to all of these source-receptor studies isthat they focus on pollen such asBetula(Mahura et al., 2007;Skjøth et al., 2007, 2008; Veriankaite et al., 2010),Quer-cus (Hernandez-Ceballos et al., 2011a)Olea (Fernandez-Rodrıguez et al., 2012; Hernandez-Ceballos et al., 2011b)and Ambrosia artemisiifolia(Fernandez-Llamazares et al.,2012; Kasprzyk et al., 2011; Sikoparija et al., 2009). Ourstudy suggests that the methodology used for allergenicpollen can be extended to fungal spores and that agriculturalfields are a potential source of elevatedAlternariaspore con-centrations.
TheAlternaria spore emissions we have measured duringharvest may be considered average for state-of-the-art agri-cultural practice. Fungal disease was not observed in eitherwheat or barley fields that were harvested. Despite this, fun-gal spore concentrations were recorded during harvest us-ing grab samples from the exhaust to estimate emissionsfrom the harvesting machine. The grab samples were takenon four different days from different fields containing bar-ley and wheat. These emission estimates from measurementsin the Danish fields gave surprisingly uniform results, about5× 1010 spores ha−1 during harvest. With this emission fac-tor, a simple Eulerian box model calculation suggests that if2 % of the entire surface area in a region is harvested, thethreshold of 100 spores m−3 would be exceeded in the har-vested region. Here it is assumed that spores are kept air-borne the entire day, that spores are well mixed in the at-mosphere up to 1000 m, that all fungal spores are kept inthe local region and that all harvested areas have an emis-sion factor similar to the Danish areas that were treated withfungicides. Thus, our emission factor could be related to thegeographical location or could be a function of agriculturalmanagement, such as the use of machinery or application offungicides. How the real distribution in the atmosphere willbe in case the emission factor varies between fields, and whenatmospheric transport and deposition is taken into account,are not known. However, it is known that the concentrationsin rural areas typically are larger than in nearby urban areas
(Kasprzyk and Worek, 2006). This suggests the importanceof atmospheric transport from nearby agricultural sources.Furthermore, the low variation in the samples suggests thatthe experimental method is robust for estimating emissionestimates, despite the crude sampling technique, and that itonly requires a small number of samples. Surprisingly, fun-gal spore emissions were not increased after the rain periodbetween 21 August and 10 September 2011, which one couldhave expected, as wet periods are known as periods of fun-gal growth. Instead, harvesting over moist soil after the rainperiod appeared to result in lower spore emissions. Obser-vations similar to ours have been made for other agricul-tural fungal spores (Friesen et al., 2001) and for pollutants,such as ammonia. Here the local emission depends stronglyon both climate as well as agricultural production methods(Gyldenkærne et al., 2005; Sommer et al., 2003, 2006). Ourestimated emission of spores during harvest was of the sameorder of magnitude as in the study by Friesen et al. (2001),but using a much simpler approach. The simplicity of ourmethod may therefore make it applicable to different areas.
The map produced in this study (Fig. 2) suggests that mostof Denmark, southern Scania (Sweden), the northern andcentral parts of Poland and Germany, in contrast to southernPoland, have a high density of potentialAlternariasource ar-eas. Previously, the southern parts of Poland have been iden-tified as having a lowerAlternaria load compared to cen-tral Poland, especially Poznan (Stepalska et al., 1999). Thislower load stood in contrast to the longer vegetation periodin southern Poland compared to central Poland (Stepalska etal., 1999). The study by Stepalska et al. (1999) therefore in-dicates that there must be a higher density of sources in cen-tral Poland, thus supporting our map. If agricultural areas arethe main source ofAlternaria spores in Denmark, then it islikely that the fungal spore concentration is higher in westernDenmark than eastern Denmark (Copenhagen). In our map ofpotential source areas, western Denmark has a considerablyhigher proportion of potential source areas than eastern Den-mark. Similar relationships have previously been suggestedby Corden et al. (2003), as Corden et al. (2003) found a highAlternaria spore load in Derby with high agricultural pro-duction and a low annual spore load at the coastal site inCardiff, which had very limited cereal production. Also insouthern Poland, results from the operational trap in Rzes-zow were compared with results from a rural trap 10 km away(Kasprzyk and Worek, 2006). In the year 2001, the load wasabout the same at the two Polish sites, while theAlternariaload in the rural area was more than double the urban loadin 2002 and with a markedly different seasonal pattern. ForDenmark, such relationships remain to be investigated us-ing more than one spore trap. Such studies would providevaluable information about western Denmark and can alsobe used to test the hypothesis in this paper as well as investi-gating the robustness of the proposed source map.
In a Spanish potato crop treated with fungicides,Al-ternaria spores were recorded during the entire growth
Atmos. Chem. Phys., 12, 11107–11123, 2012 www.atmos-chem-phys.net/12/11107/2012/
C. A. Skjøth et al.: Crop harvest in Denmark and Central Europe 11117
season, but with a peak inAlternaria concentration duringleaf senescence (Escuredo et al., 2011; Iglesias et al., 2007).This suggests that although fields are treated against fun-gal disease (and visual inspection does not revealAlternariaattack), spores are still present in the field and released invarying quantities throughout the entire season. The Span-ish studies also showed that the fungal spore load in the re-gion of Ourense is higher in the field area (Escuredo et al.,2011) compared to the load that is observed in the nearbycity area (Aira et al., 2008). This again stresses the impor-tance of atmospheric transport on the local scale. More im-portantly, other studies by Hill et al. (1984) and Friesen etal. (2001) have observed very high amounts of spore releaseduring harvesting. Similarly, Mitakakis et al. (2001) foundperiods ofAlternariaburst during mowing and harvesting ofgrass in Australia.Alternaria spp. have been named amongthe agents of fungal diseases in wheat (alternaria leaf blightA. triticina; black head molds,Alternaria spp.) and barley(kernel blight,Alternaria spp.). Our study focused on a spe-cific harvest situation, and samples were taken from a fewwheat and barley fields that had been treated with fungi-cides. Sampling in infested crops, or crops that have not beentreated with fungicides, or harvesting using different meth-ods might therefore yield significantly different emission fac-tors. If emission factors can be obtained from both growingcrops and crop harvest (e.g. by using the simple methodologythat we employed), then this will provide the much neededemission factors that can be used by atmospheric modellersin order to increase understanding of howAlternaria sporesare released and distributed in the atmosphere.
The main characteristics of the spore season show that theannual variations in the spore index from Copenhagen variesby more than a factor of two from less than 5000 to morethan 10 000. The annual index ofAlternaria spores and thenumber of days with clinically relevant levels are correlated(r2
= 0.67, column 2 and 10 in Table 1), which is not surpris-ing as these numbers are highly dependent: the main loadof Alternaria spores in Copenhagen is due to episodes ofpeak days (Table 1). The total uncertainty due to the count-ing method (Carinanos et al., 2000; Sikoparija et al., 2011;Sterling et al., 1999), i.e. the person that counts, means basicmeasurement errors and meteorology can easily reach 50 %in total on individual days (Pedersen and Moseholm, 1993).This error requires large differences in the counts in orderto be statistically significant. However, much larger samples,such as the samples that produced Fig. 1 (withn = 232), onlyrequire a 10 % difference in order to be statistically signifi-cant when the formula by Pedersen and Moseholm (1993) isused. This small difference must however also be comparedto the rather large variation in the actual dataset as given bythe error bars on Fig. 1. The error bars in Fig. 1 and the 10 %difference as requirement for statistical significance there-fore suggest that the observed daily variation is both statisti-cally significant and physically relevant. The annual level inCopenhagen is generally higher than the levels that are ob-
served on the Spanish part of the Iberian Peninsula (Aira etal., 2008; Rodriguez-Rajo et al., 2005) or in Sweden (Hjelm-roos, 1993), where the annual spore index ofAlternaria hasbeen reported to be in the range of 1000–4000. Similar levelsas in this study were also reported for Warszawa in a Pol-ish study by Stepalska et al. (1999). The same Polish studyalso showed that the annual loads in Poznan can have anindex that exceeds 30 000. Such large loads were also ob-served by Angulo-Romero et al. (1999) and Maya-Manzanoet al. (2012) in Merida in 1997, where the spore index forAlternaria was about 20 000, 25 000 and 50 000, respec-tively. The studies from Spain also pointed out that large ge-ographic variations exist in the spore count, as another site,Caceres, only had a spore index of about 2000. Here it isworth to note that Caceres is a region in Spain with lim-ited crop production, while Merida is a Spanish region withlarge amounts of irrigated crops such as maize, tomato andfruit trees (Maya-Manzano et al., 2012). The study by Mayo-Manzano et al. (2012) as well as Stepalska et al. (1999) showthat the variation in the load in the same biogeographical re-gion can differ by more than a factor of ten between yearsand between sites. Such large variations can be difficult toexplain and map using volumetric spore traps alone. The sea-sonal variation found in this study with only one single peakhas been found in most European studies such as Poland,Sweden, England and Spain. Bimodal peaks are only foundin the Mediterranean region (Angulo-Romero et al., 1999;Cosentino et al., 1995; De Linares et al., 2010; Giner et al.,2001; Lang-Yona et al., 2012; Maya-Manzano et al., 2012).All these studies on annual loads, on seasonal variations aswell as our study highlight the interrelated connection be-tween overall weather in the geographical regions as well asthe abundance of local sources. Studies that focus on vari-ous aspects of source mapping (e.g. observations of load andcomparisons between sites, source-receptor studies such asusing trajectories or actual mapping of potential sources) aretherefore all highly needed for fungal spores. Such studiesprovide much needed insight into an area that, according toan editorial in The Lancet (2008), has to some degree beenforgotten and therefore needs much more scientific attention.
A number of studies have shown similar daily patterns asour study ofAlternaria spore concentrations. Stepalska andWolek (2009) showed that in Krakow the distribution of peakconcentrations had a similar pattern as the peak concentra-tions in this study. In Krakow, peak concentrations are mostoften observed in the late afternoon, about a factor of threemore often than during night and early morning (Stepalskaand Wolek, 2009). Similar observations, with a peak in thelate afternoon and a minimum in the night or early morn-ing, were found in the north of Portugal (Oliveira et al.,2009; Rodriguez-Rajo et al., 2005), north of Spain (Airaet al., 2008), south of Spain (Angulo-Romero et al., 1999;Giner et al., 2001) and Italy (Ricci et al., 1995). This sug-gests that at all these sites, including Denmark, the overallload of Alternaria is due to local or regional sources and
www.atmos-chem-phys.net/12/11107/2012/ Atmos. Chem. Phys., 12, 11107–11123, 2012

11118 C. A. Skjøth et al.: Crop harvest in Denmark and Central Europe
Table A1. ObservedAlternaria spores in grab samples from the harvesting machine, the calculated concentration of spores m−3 in theexhaust air and the corresponding emission factor from harvested fields.
Date Crop Remarks Spores on slide(0.6552 cm2)
Concentration(spores m−3)
Emission factorper ha
18 Aug 2011 Wheat 721 4.0E+07 6.7E+1018 Aug 2011 . . . Residual control
of previoussample
106 – –
21 Aug 2011 Barley 630 3.5E+07 5.9E+1021 Aug 2011 Barley 592 3.3E+07 5.5E+1021 Aug 2011 Barley 662 3.7E+07 6.2E+1021 Aug 2011 . . . Residual control
of previoussample
76 – –
10 Sep 2011 Wheat 376 2.1E+07 3.5E+1010 Sep 2011 Wheat 172 9.6E+06 1.6E+1016 Sep 2011 Barley Soil very wet. 131 7.3E+06 1.2E+1016 Sep 2011 Barley Soil very wet. 186 1.0E+07 1.7E+10
local dispersion. It is not known if LDT is a contributingfactor at locations other than Copenhagen. This again callsfor dedicated source-receptor studies on fungal spores fromsites other than Copenhagen. Such studies can also be con-sidered an answer to both the editorial in The Lancet (2008)as well as the overall recommendations given by Cecchi etal. (2010).
In Denmark,CladosporiumandAlternaria dominate theatmospheric fungal spore flora by 68.9 % and 9.4 % of thetotal fungal spore catch, respectively (Larsen, 1981). Highseason for fungal spores is June until October, but externalmeteorological factors affect the fluctuation from day to dayand year to year (Larsen, 1981). Our studies suggest thatthe Alternaria concentrations can be explained by combin-ing source maps with atmospheric transport. Such informa-tion can be relevant for both agriculture as well as patientsthat are sensitized to fungal spores. The number of patientsthat are sensitive to fungal spores is usually much lower thanto pollen (Damato and Spieksma, 1995). A recent study esti-mates that 2.4 % of the entire population is sensitized to fun-gal spores (Elholm et al., 2010). However, the same data (El-holm et al., 2010) showed that asthmatics had a significantlyhigher prevalence of fungal spore sensitisation compared tonon-asthmatics: 6.6 % vs. 2.0 % in the two genera, respec-tively. For sensitisation toAlternaria, the corresponding fig-ures were 6.1 % vs. 1.7 %, and it has also been observed thatthe clinical reaction to fungal spores is often stronger thanthe reaction towards pollen (Sigsgaard personal communica-tion). This calls for additional efforts in research, diagnosisand treatment of allergy, which would be a direct response tothe editorial in The Lancet (2008), as well as the overall rec-ommendations on aerobiological research as given by Cecchiet al. (2010), such as collection and analysis of aerobiologi-cal data on large spatial scales.
5 Conclusions
The present study supports the hypothesis that Danish agri-cultural areas are the main source of airborneAlternariaspores in Denmark, meaning that the source of the overallload is mainly local or regional, but with intermittent LDTfrom more remote agricultural areas. These LDT episodescontributed to a large degree to the total annual load ofAl-ternaria spores. In fact, the high days dominate the overallAlternaria load, although high days are always outnumberedby low days. The hypothesis is supported by the analyseddata of the 10 yr bi-hourly record ofAlternaria in Copen-hagen that shows a distinct daily profile of 232 clinically rel-evant episodes (Fig. 1) and the identification of potential longdistance transport episodes (Table 2) from areas that couldbe potential source regions (Figs. 3, 4 and 5, respectively).The emission studies in cereal crops under harvest also sup-port our hypothesis. The results showed that although thefields had been treated against fungal infections, harvestingstill produced large amounts of airborne fungal spores. Thefindings agree well with related studies that show highAl-ternaria spore load in agricultural areas in Central Europe.This supports the hypothesis that crop harvest in Central Eu-rope causes episodes of high airborneAlternaria spore con-centrations in Copenhagen as well as other urban areas in thisregion.
Our findings have several implications. Firstly, forecastingof fungal spore quantities relevant to allergy patients in Den-mark must take into account long distance transport, and can-not be based on measured concentrations in Denmark alone.Secondly, allergy patients need a warning several days aheadto plan their medical intake. This information is not avail-able for fungal spores, as the Danish information system onfungal spores is very simplistic and is based on information
Atmos. Chem. Phys., 12, 11107–11123, 2012 www.atmos-chem-phys.net/12/11107/2012/

C. A. Skjøth et al.: Crop harvest in Denmark and Central Europe 11119
Table A2a.Daily measured precipitation in mm day−1 in the poten-tial source region to the episodes ofAlternariaspore concentrations(spores m−3) that were measured 30–31 August 2008. The last 7days of recorded precipitation until the potential episode is used asan indicator of good harvesting possibilities. “–” usually means noprecipitation was recorded, but could potentially also mean techni-cal problems.
Station/Date 31 30 29 28 27 26 25
061800 – Kastrup 0.0 0.0 3.3 3.8 6.6 0.0 0.0061490 – Gedser 0.0 0.0 2.0 0.0 0.8 0.0 0.3061200 – Beldringe 0.0 0.0 – 0.0 0.0 0.0 0.3061410 – Abed – 0.0 3.0 0.0 2.3 0.0 0.0061700 – Roskilde/Tune 0.0 0.0 1.8 2.8 7.1 0.0 0.5026230 – Horby 0.0 0.0 2.8 8.1 3.8 0.0 0.8026110 – Helsingborg 0.0 0.0 1.5 4.8 5.8 0.0 2.8Berlin Tegel 0.0 0.0 0.1 0.8 0.0 0.0 0.0Hamburg 0.0 0.0 0.0 0.0 0.0 0.7 0.0Hannover 0.0 0.0 0.0 0.5 0.0 0.0 0.0
Table A2b.Daily measured precipitation in mm day−1 in the poten-tial source region to the episodes ofAlternariaspore concentrations(spores m−3) that were measured 10–11 August 2010. The last 7days of recorded precipitation until the potential episode is used asan indicator of good harvesting possibilities. “–” usually means noprecipitation was recorded, but could potentially also mean techni-cal problems.
Station/Date 11 10 9 8 7 6 5
Kastrup 0.3 0.0 28.4 0.3 0.0 1.8 2.8Skrydstrup 3.0 0.0 2.0 0.3 0.0 0.0 2.0Gedser 0.5 0.0 0.3 0.0 0.0 1.0 2.0Beldringe 0.0 0.0 0.0 0.0 0.0 0.0 –Abed 0.3 0.0 0.0 0.3 0.0 – 0.0Roskilde/Tune 0.0 0.0 0.0 0.0 0.0 0.0 1.8Horby 0.0 0.3 21.3 1.8 1.0 0.0 0.0Helsingborg 0.0 0.0 24.6 0.0 0.0 0.0 1.8Berlin Tegel 0.0 0.0 0.3 0.3 0.0 11.6 0.0Hamburg 2.1 0.7 0.7 0.1 0.0 0.0 4.5Hannover 0.8 3.4 0.0 0.2 0.1 0.0 0.1
from Copenhagen alone (Skjøth and Sommer, 2010). An ex-tension of the spore monitoring programme by using severalspore traps would most likely be very useful, as our studysuggests that the fungal spore load might be higher in otherparts of the country. An alternative is to supplement the cur-rent information system with the mathematical model sys-tems from chemical weather forecasting (e.g. Kukkonen etal., 2012) and extend these to include the spore productionand emission from countries such as Germany and Poland,as well as the agricultural production in Denmark. This ap-proach might however be very difficult as all relevantAl-ternaria sources remain to be identified. Furthermore, thisas well as other studies suggest that the emission pattern isrelated to both biology and agricultural production methods.
Table A2c.Daily measured precipitation in mm day−1 in the poten-tial source region to the episodes ofAlternariaspore concentrations(spores m−3) that were measured 15–16 August 2010. The last 7days of recorded precipitation until the potential episode is used asan indicator of good harvesting possibilities. “–” usually means noprecipitation was recorded, but could potentially also mean techni-cal problems.
Station/Date 16 15 14 13 12 11 10
Kastrup 0.5 49.3 0.0 25.4 1.8 0.3 0.0Roskilde/Tune 0.3 36.8 0.0 29.7 3.0 0.0 0.0Horby 5.3 8.1 0.0 22.9 0.0 0.0 0.3Helsingborg 0.0 19.8 0.0 22.9 0.8 0.0 0.0Poznan 0.0 0.0 3.0 0.0 0.3 0.0 0.0Plock 0.0 0.0 0.0 0.0 0.0 36.6 0.0Warszawa 1.5 0.0 0.0 2.0 0.0 0.0 15.0Kolo 6.1 0.0 4.1 0.0 0.0 0.0 4.1Wielkopolski 0.0 12.7 7.9 8.4 0.0 0.0 1.8Olsztyn 1.0 0.0 5.1 0.0 0.0 0.0 20.3Elblag 1.5 0.0 0.0 0.0 0.0 4.1 0.0
Table A2d. Geographical coordinates of precipitation stations ob-tained from National Centre for Environmental Prediction (NCEP)and Deutscher Wetterdienst (only German stations).
ID Name Lat (◦) Lon (◦)
061800 Kastrup 55.617 12.650061700 Roskilde/Tune 55.583 12.133026230 Horby 55.867 13.667026110 Helsingborg 56.033 12.767123300 Poznan 52.417 16.850123600 Plock 52.583 19.733123750 Warszawa 52.167 20.967123450 Kolo 52.200 18.667123000 Wielkopolski 52.750 15.283122720 Olsztyn 53.767 20.417121600 Elblag 54.167 19.433061100 Skrydstrup 55.233 9.267061490 Gedser 54.567 11.967061200 Beldringe 55.483 10.333061410 Abed 54.833 11.33303313 BerlinTegel 52.550 13.30001459 Hamburg 53.633 9.98301538 Hannover 52.450 9.667
In our study we have identified possible LDT episodes, sug-gested a gridded inventory of potential source areas, verifiedpotential sources to local emission peaks from harvesting andfound the typical daily pattern in the observed load ofAl-ternaria spores. Each of these pieces of information will bevery useful in the daily information to the public as well as inforecasting. The episodes that we analysed in detail showedthat it is possible to have high days that follow each other andthat the change from low to high load ofAlternaria is relatedto both a change in weather and potential source area. Such
www.atmos-chem-phys.net/12/11107/2012/ Atmos. Chem. Phys., 12, 11107–11123, 2012

11120 C. A. Skjøth et al.: Crop harvest in Denmark and Central Europe
Table A3.Observed wind speed (m s−1) on the days with episodes (above 100 spores m−3) of fungal spores that were selected and presentedin Table 2.
Date/hour 1 3 5 7 9 11 13 15 17 19 21 23
22 Jul 2001 2.2 3.5 3.1 3.3 3.8 3.8 5.5 5.2 3.9 4.0 3.3 2.221 Jul 2003 3.0 2.8 4.2 3.9 3.9 4.3 1.3 1.5 1.8 1.6 1.1 1.526 Jul 2003 2.8 2.8 3.7 5.4 3.2 4.1 4.7 5.2 2.5 2.9 2.6 2.65 Sep 2004 1.7 2.0 2.3 2.5 2.7 3.3 3.2 2.9 3.2 2.6 2.7 3.325 Aug 2005 3.2 3.7 4.0 4.3 4.9 5.1 5.2 7.8 5.7 4.3 3.0 3.510 Aug 2006 1.8 1.2 1.2 2.4 4.2 5.1 4.4 5.2 4.1 2.0 1.3 0.925 Aug 2006 1.3 1.2 0.7 1.7 2.2 2.6 2.7 2.0 1.4 1.6 1.3 1.526 Aug 2006 1.5 1.7 0.7 1.6 1.4 2.8 2.6 3.1 2.4 1.6 1.4 1.45 Aug 2007 2.7 2.2 1.9 1.0 2.3 3.4 3.8 4.0 3.6 3.4 3.1 1.811 Aug 2007 3.2 2.0 2.3 1.9 2.6 3.4 2.1 5.2 3.1 2.1 1.0 3.231 Aug 2008 2.1 1.1 0.6 0.9 2.5 3.5 3.3 4.1 4.3 4.0 4.6 5.122 Jul 2009 1.3 1.7 2.0 2.3 4.4 4.4 2.9 4.0 4.1 4.0 3.3 2.727 Jul 2009 2.7 4.0 3.0 3.5 4.4 3.8 4.0 4.4 3.8 2.9 2.3 3.96 Aug 2010 1.4 0.8 1.9 3.9 3.6 4.1 2.8 3.7 3.5 3.4 1.8 2.111 Aug 2010 4.2 2.6 2.5 3.3 4.2 5.3 6.0 6.4 5.0 3.8 3.0 1.916 Aug 2010 5.5 5.7 5.4 5.7 6.0 5.5 5.5 3.4 3.1 2.4 0.9 1.2
patterns can be simulated with atmospheric transport models.Furthermore, development of emission models and invento-ries makes it possible to use source-based models such asDEHM (Brandt et al., 2012), SILAM (Sofiev et al., 2006)and COSMO-ART (Zink et al., 2012) for improved under-standing of aeroallergens and ultimately better informationto the public.
Acknowledgements.This work received funding from a postdoc grant (to Carsten Ambelas Skjøth) provided by the VillumKann Rasmussen foundation. We thank Finn Kristiansen, Tune,for his cooperation and active support during our measurementson his fields. The authors would like to thank the NationalCentre for Environmental Prediction (NCEP) and DeutscherWetterdienst for providing meteorological observations exchangedunder the World Meteorological Organization (WMO) WorldWeather Watch Programme. Finally the work includes measuredmeteorological observations that are performed within the nation-wide Air Quality Monitoring Programme for the Urban Areas(LMP) and especially Thomas Ellermann is highly acknowl-edged for providing access to quality controlled data (on-linedata and description of the programme can be obtained here:http://www.dmu.dk/en/air/monitoring/).
Edited by: C. Hoose
References
Aira, M. J., Rodriguez-Rajo, F. J., and Jato, V.: 47 annual records ofallergenic fungi spore: Predictive models from the NW IberianPeninsula, Ann. Agr. Env. Med., 15, 91–98, 2008.
Angulo-Romero, J., Mediavilla-Molina, A., and Domınguez-Vilches, E.: Conidia ofAlternaria in the atmosphere of the city
of Cordoba, Spain in relation to meteorological parameters, Int.J. Biometeorol., 43, 45–49, 1999.
Belmonte, J., Alarcon, M., Avila, A., Scialabba, E., and Pino, D.:Long-range transport of beech (Fagus sylvaticaL.) pollen to Cat-alonia (north-eastern Spain), Int. J. Biometeorol., 52, 675–687,2008.
Brandt, J., Silver, J. D., Frohn, L. M., Geels, C., Gross, A., Hansen,A. B., Hansen, K. M., Hedegaard, G. B., Skjøth, C. A., Villad-sen, H., Zare, A., and Christensen, J. H.: An integrated modelstudy for Europe and North America using the Danish EulerianHemispheric Model with focus on intercontinental transport ofair pollution, 2012, Atmos. Environ., 53, 156–176, 2012.
Burshtein, N., Lang-Yona, N., and Rudich, Y.: Ergosterol, ara-bitol and mannitol as tracers for biogenic aerosols in theeastern Mediterranean, Atmos. Chem. Phys., 11, 829–839,doi:10.5194/acp-11-829-2011, 2011.
Buters, J. T. M., Thibaudon, M., Smith, M., Kennedy, R., Rantio-Lehtimaki, A., Albertini, R., Reese, G., Weber, B., Galan, C.,Brandao, R., Antunes, C. M., Jager, S., Berger, U., Celenk,S., Grewling, L., Jackowiak, B., Sauliene, I., Weichenmeier, I.,Pusch, G., Sarioglu, H., Ueffing, M., Behrendt, H., Prank, M.,Sofiev, M., and Cecchi, L.: Release of Bet v 1 from birch pollenfrom 5 European countries. Results from the HIALINE study,Atmos. Environ., 55, 496–505, 2012.
Carinanos, P., Emberlin, J., Galan, C., and Dominguez-Vilches, E.:Comparison of two pollen counting methods of slides from ahirst type volumetric trap, Aerobiologia, 16, 339–346, 2000.
Cecchi, L., Malaspina, T., Albertini, R., Zanca, M., Ridolo, E., Us-berti, I., Morabito, M., Dall’Aglio, P., and Orlandini, S.: The con-tribution of long-distance transport to the presence of Ambrosiapollen in central northern Italy, Aerobiologia, 23, 145–151, 2007.
Cecchi, L., D’amato, G., Ayres, J. G., Galan, C., Forastiere, F., Fors-berg, B., Gerritsen, J., Nunes, C., Behrendt, H., Akdis, C., Dahl,R., and Annesi-Maesano, I.: Projections of the effects of climatechange on allergic asthma: the contribution of aerobiology, Al-lergy, 65, 1073–1081, 2010.
Atmos. Chem. Phys., 12, 11107–11123, 2012 www.atmos-chem-phys.net/12/11107/2012/

C. A. Skjøth et al.: Crop harvest in Denmark and Central Europe 11121
Ceter, T., Pinar, N., Guney, K., Yildiz, A., Asci, B., and Smith, M.:A 2-year aeropalynological survey of allergenic pollen in theatmosphere of Kastamonu, Turkey, Aerobiologia, 28, 355–366,2012.
Corden, J. M., Millington, W. M., and Mullins, J.: Long-term trendsand regional variation in the aeroallergenAlternaria in Cardiffand Derby UK – are differences in climate and cereal productionhaving an effect?, Aerobiologia, 19, 191–199, 2003.
Cosentino, S., Fadda, M. E., and Palmas, F.: Pollen and mould al-lergy in Southern Sardinia (Italy): Comparison of skin-test fre-quencies and air sampling data, Grana, 34, 338–344, 1995.
Damato, G. and Spieksma, F. T. M.: Aerobiologic and Clinical As-pects of Mold Allergy in Europe, Allergy, 50, 870–877, 1995.
De Linares, C., Belmonte, J., Canela, M., de la Guardia, C. D., Alba-Sanchez, F., Sabariego, S., and Alonso-Perez, S.: Dispersal pat-terns of Alternaria conidia in Spain, Agr. Forest Meteorol., 150,1491–1500, 2010.
Draxler, R., Stunder, B., Rolph, G., and Taylor, A.: Hysplit4 usersguide – Version 4.8, 198 pp., 2007.
Elholm, G., Omland, Ø., Schlunssen, V., Hjort, C., Basinas, I., andSigsgaard, T.: The cohort of young Danish farmers – A longi-tudinal study of the health effects of farming exposure, ClinicalEpidemiology, 2010, 45–50, 2010.
Escuredo, O., Seijo, M., Fernandez-Gonzalez, M., and Iglesias,I.: Effects of meteorological factors on the levels ofAlternariaspores on a potato crop, Int. J. Biometeorol., 55, 243–252, 2011.
European Commission: Image2000 and CLC2000 Products andMethods European Commission, Joint Research Center (DGJRC), Institute for Environment and Sustainability, Land Man-agement Unit, I-21020 Ispra (VA), Italy, 2005.
Fagerli, H. and Aas, W.: Trends of nitrogen in air and precipitation:Model results and observations at EMEP sites in Europe, 1980–2003, Environ. Pollut., 154, 448–461, 2008.
Fernandez-Llamazares,A., Belmonte, J., Alarcon, M., and Lopez-Pacheco, M.:Ambrosia L.in Catalonia (NE Spain): expansionand aerobiology of a new bioinvader, Aerobiologia, 28, 435–451,2012.
Fernandez-Rodrıguez, S., Skjøth, C. A., Tormo-Molina, R., Bran-dao, R., Caeiro, E., Silva-Palacios, I., Gonzalo-Garijo, A., andSmith, M.: Identification of potential sources of airborne Oleapollen in the Southwest Iberian Peninsula, Int. J. Biometeorol.,accepted, 2012.
Friesen, T. L., De Wolf, E. D., and Francl, L. J.: Source strengthof wheat pathogens during combine harvest, Aerobiologia, 17,293–299, 2001.
Gannibal, Ph. B. (A.A. Jaczewski Laboratory of Mycology and Phy-topathology, All-Russian Institute of Plant Protection, St. Pe-tersburg, Russia):Alternaria alternata(Fr.) Keissl., Cladospo-rium herbarum (Pers.) Link., Epicoccum purpurascens Ehrenb.,Botrytis cinerea Pers. – Black Ear of wheat, edited by: Afonin,A. N., Greene, S. L., Dzyubenko, N. I., and Frolov, A. N., In-teractive Agricultural Ecological Atlas of Russia and Neighbor-ing Countries, in: Economic Plants and their Diseases, Pests andWeeds [Online], available at:http://www.agroatlas.ru/en/content/diseases/Hordei/HordeiAlternariaalternata/, 2008.
Giner, M. M., Garcıa, J. C., and Camacho, C. N.: AirborneAl-ternaria spores in SE Spain (1993–98), Grana, 40, 111–118,2001.
Goldberg, C., Buch, H., Moseholm, L., and Weeke, E. R.: AirbornePollen Records in Denmark, 1977–1986, Grana, 27, 209–217,1988.
Gravesen, S.: Fungi as a Cause of Allergic Disease, Allergy, 34,135–154, 1979.
Gravesen, S., Frisvad, J. C., and Samson, R. A.: Microfungi,Munksgaard, ISBN: 9788716114365, 168 pp., 1994.
Gultyaeva, E. I. (A.A. Jaczewski Laboratory of Mycology and Phy-topathology, All-Russian Institute of Plant Protection, St. Pe-tersburg, Russia):Alternaria alternata(Fr.) Keissl., Cladospo-rium herbarum (Pers.) Link., Epicoccum purpurascens Ehrenb.,Botrytis cinerea Pers. – Black Ear of wheat, edited by: Afonin,A. N., Greene, S. L., Dzyubenko, N. I., and Frolov, A. N., in:Interactive Agricultural Ecological Atlas of Russia and Neigh-boring Countries. Economic Plants and their Diseases, Pests andWeeds [Online], available at:http://www.agroatlas.ru/en/content/diseases/Tritici/TriticiAlternariaalternata/, 2008.
Gyldenkærne, S., Ambelas Skjøth, C., Hertel, O., and Ellermann,T.: A dynamical ammonia emission parameterization for use inair pollution models, J. Geophys. Res.-Atmos., 110, D07108,doi:10.1029/2004JD005459, 2005.
Hernandez-Ceballos, M. A., Garcia-Mozo, H., Adame, J. A.,Dominguez-Vilches, E., Bolivar, J. P., De la Morena, B. A.,Perez-Badia, R., and Galan, C.: Determination of potentialsources of Quercus airborne pollen in Crdoba city (southernSpain) using back-trajectory analysis, Aerobiologia, 27, 261–276, 2011a.
Hernandez-Ceballos, M. A., Garcia-Mozo, H., Adame, J. A.,Dominguez-Vilches, E., De la Morena, B. A., Bolivar, J. P., andGalan, C.: Synoptic and meteorological characterisation of olivepollen transport in Cordoba province (south-western Spain), Int.J. Biometeorol., 55, 17–34, 2011b.
Hertel, O., Ellermann, T., Palmgren, F., Berkowicz, R., Løfstrom,P., Frohn, L. M., Geels, C., Skjøth, C. A., Brandt, J., Christensen,J., Kemp, K., and Ketzel, M.: Integrated air-quality monitoring –combined use of measurements and models in monitoring pro-grammes, Environ. Chem., 4, 65–74, 2007.
Hill, R. A., Wilson, D. M., Burg, W. R., and Shotwell, O. L., ViableFungi in Corn Dust, Appl. Environ. Microbiol., 47, 84–87, 1984.
Hirst, J. M.: An automatic volumetric spore trap, Ann. Appl. Biol.,39, 257–265, 1952.
Hjelmroos, M.: Relationship between airborne fungal spore pres-ence and weather variables: Cladosporium and Alternaria, Grana,32, 40–47, 1993.
Iglesias, I., Rodrıguez-Rajo, F., and Mendez, J., Evaluation of thedifferent Alternaria prediction models on a potato crop in ALimia (NW of Spain), Aerobiologia, 23, 27–34, 2007.
Isard, S., Russo, J., and Ariatti, A.: The Integrated AerobiologyModeling System applied to the spread of soybean rust intothe Ohio River valley during September 2006, Aerobiologia, 23,271–282, 2007.
Isard, S. A., Gage, S. H., Comtois, P., and Russo, J. M.: Principles ofthe atmospheric pathway for invasive species applied to soybeanrust, Bioscience, 55, 851–861, 2005.
Kasprzyk, I. and Worek, M.: Airborne fungal spores in urban andrural environments in Poland, Aerobiologia, 22, 169–176, 2006.
Kasprzyk, I., Myszkowska, D., Grewling, L., Stach, A., Sikoparija,B., Skjøth, C. A., and Smith, M.: The occurrence of Ambrosiapollen in Rzeszow, Krakow and Poznan, Poland: investigation of
www.atmos-chem-phys.net/12/11107/2012/ Atmos. Chem. Phys., 12, 11107–11123, 2012

11122 C. A. Skjøth et al.: Crop harvest in Denmark and Central Europe
trends and possible transport ofAmbrosiapollen from Ukraine,Int. J. Biometeorol., 55, 633–644, 2011.
Kirk, P. M., Cannon, P. F., Minter, D. W., and Stalpers, J. A.: Dic-tionary of the Fungi, 10th Edn., Wallingford, CABI, p. 22, 2008.
Kukkonen, J., Olsson, T., Schultz, D. M., Baklanov, A., Klein, T.,Miranda, A. I., Monteiro, A., Hirtl, M., Tarvainen, V., Boy, M.,Peuch, V.-H., Poupkou, A., Kioutsioukis, I., Finardi, S., Sofiev,M., Sokhi, R., Lehtinen, K. E. J., Karatzas, K., San Jose, R.,Astitha, M., Kallos, G., Schaap, M., Reimer, E., Jakobs, H.,and Eben, K.: A review of operational, regional-scale, chemicalweather forecasting models in Europe, Atmos. Chem. Phys., 12,1–87,doi:10.5194/acp-12-1-2012, 2012.
Lang-Yona, N., Dannemiller, K., Yamamoto, N., Burshtein, N., Pec-cia, J., Yarden, O., and Rudich, Y.: Annual distribution of aller-genic fungal spores in atmospheric particulate matter in the East-ern Mediterranean; a comparative study between ergosterol andquantitative PCR analysis, Atmos. Chem. Phys., 12, 2681–2690,doi:10.5194/acp-12-2681-2012, 2012.
Larsen, L. S.: A 3-Year-Survey of Micro-Fungi in the Air of Copen-hagen 1977–79, Allergy, 36, 15–22, 1981.
Mahura, A., Korsholm, U., Baklanov, A., and Rasmussen, A.: Ele-vated birch pollen episodes in Denmark: contributions from re-mote sources, Aerobiologia, 23, 171–179, 2007.
Mandrioli, P., Comtois, P., and Levizzani, V.: Methods in Aerobiol-ogy: Pitagora Editrice, Bologna, ISBN 88-371-1043-X, 262 pp.,1998.
Maya-Manzano, J., Fernandez-Rodriguez, S., Hernandez-Trejo, F.,Dıaz-Peres, G., Gonzalo-Garijo,A., Silva-Palacios, I., Munoz-Rodriguez, A., and Tormo-Molina, R.: Seasonal Mediterraneanpattern for airborne spores ofAlternaria, Aerobiologia, 28, 515–525, 2012.
McCartney, H. A., Schmechel, D., and Lacey, M. E.: AerodynamicDiameter of Conidia of Alternaria Species, Plant Pathol., 42,280–286, 1993.
Melgar, M., Trigo, M., Recio, M., Docampo, S., Garcıa-Sanchez,J., and Cabezudo, B.: Atmospheric pollen dynamics in Munster,north-western Germany: a three-year study (2004–2006), Aero-biologia, 28, 423–434, 2012.
Mitakakis, T. Z., Clift, A., and McGee, P. A.: The effect of localcropping activities and weather on the airborne concentration ofallergenicAlternaria spores in rural Australia, Grana, 40, 230–239, 2001.
Oliveira, M., Ribeiro, H., Delgado, J., and Abreu, I.: Seasonal andintradiurnal variation of allergenic fungal spores in urban andrural areas of the North of Portugal, Aerobiologia, 25, 85–98,2009.
Orlanski, I.: A rational subdivision of scales for atmospheric pro-cesses, B. Am. Meteorol. Soc., 56, 527–530, 1975.
Pedersen, B. V. and Moseholm, L.: Precision of the daily pollencount. Identifying sources of variation using variance componentmodels, Aerobiologia, 9, 15–26, 1993.
Perello, A. E. and Sisterna, M. N.: Leaf blight of wheat caused byAlternaria triticina in Argentina, New Disease Reports, 11, 24–28, 2005.
Ricci, S., Bruni, M., Meriggi, A., and Corsico, R.: AerobiologicalmonitoringAlternaria fungal spores: a comparison between sur-veys in 1992 and 1993 and local meteorological conditions, Aer-obiologia, 11, 195–199, 1995.
Rodriguez-Rajo, F. J., Iglesias, I., and Jato, V.: Variation assessmentof airborne Alternaria and Cladosporium spores at different bio-climatical conditions, Mycol. Res., 109, 497–507, 2005.
Sikoparija, B., Smith, M., Skjøth, C. A., Radisic, P., Milkovska, S.,Simic, S., and Brandt, J.: The Pannonian plain as a source ofAmbrosiapollen in the Balkans, Int. J. Biometeorol., 53, 263–272, 2009.
Sikoparija, B., Pejak-Sikoparija, T., Radisic, P., Smith, M., and Sol-devilla, C. G.: The effect of changes to the method of estimatingthe pollen count from aerobiological samples, J. Environ. Monit.,13, 384–390, 2011.
Simpson, D., Benedictow, A., Berge, H., Bergstrom, R., Emberson,L. D., Fagerli, H., Flechard, C. R., Hayman, G. D., Gauss, M.,Jonson, J. E., Jenkin, M. E., Nyıri, A., Richter, C., Semeena, V.S., Tsyro, S., Tuovinen, J.-P., Valdebenito,A., and Wind, P.: TheEMEP MSC-W chemical transport model – technical descrip-tion, Atmos. Chem. Phys., 12, 7825–7865,doi:10.5194/acp-12-7825-2012, 2012.
Singh, R. V., Singh, A. K., and Singh, S. P.: Distribution ofpathogens causing foliar blight of wheat in India and neighboringcountries, in: Helminthosporium Blights of Wheat: Spot Blotchand Tan Spot, edited by: Duveiller, E., Dubin, H. J., Reeves, J.,and McNab, A., Mexico, D.F., CIMMYT, 59–62, 1998.
Skjøth, C. A. and Sommer, J.: Two extended pollen and fungalspore calendars for Denmark, their representativeness and cross-reactivity between pollen and food products, Presented at the9th international Congress on Aerobiology, Buenos Aires, Ar-gentina, 23–27 August, Abstract and Poster, 2010.
Skjøth, C. A., Hertel, O., and Ellermann, T.: Use of the ACDEP tra-jectory model in the Danish nation-wide Background MonitoringProgramme, Phys. Chem. Earth, 27, 1469–1477, 2002.
Skjøth, C. A., Sommer, J., Stach, A., Smith, M., and Brandt, J.: Thelong range transport of birch (Betula) pollen from Poland andGermany causes significant pre-season concentrations in Den-mark, Clin. Exp. Allergy, 37, 1204–1212, 2007.
Skjøth, C. A., Sommer, J., Brandt, J., Hvidberg, M., Geels, C.,Hansen, K., Hertel, O., Frohn, L., and Christensen, J.: Copen-hagen – a significant source of birch (Betula ) pollen?, Int. J.Biometeorol., 52, 453–462, 2008.
Skjøth, C. A., Smith, M., Brandt, J., and Emberlin, J.: Are the birchtrees in Southern England a source of Betula pollen for NorthLondon?, Int. J. Biometeorol., 53, 75–86, 2009.
Skjøth, C. A., Smith, M., Sikoparija, B., Stach, A., Myszkowska,D., Kasprzyk, I., Radisic, P., Stjepanovic, B., Hrga, I., Apatini,D., Magyar, D., Paldy, A., and Ianovici, N.: A method for pro-ducing airborne pollen source inventories: An example ofAm-brosia(ragweed) on the Pannonian Plain, Agr. Forest Meteorol.,150, 1203–1210, 2010.
Skjøth, C. A., Geels, C., Berge, H., Gyldenkærne, S., Fagerli, H.,Ellermann, T., Frohn, L. M., Christensen, J., Hansen, K. M.,Hansen, K., and Hertel, O.: Spatial and temporal variations inammonia emissions – a freely accessible model code for Europe,Atmos. Chem. Phys., 11, 5221–5236,doi:10.5194/acp-11-5221-2011, 2011.
Smith, M., Emberlin, J., and Kress, A.: Examining high magnitudegrass pollen episodes at Worcester, United Kingdom, using back-trajectory analysis, Aerobiologia, 21, 85–94, 2005.
Smith, M., Skjøth, C. A., Myszkowska, D., Uruska, A., Malgo-rzata, P., Stach, A., Balwierzg, Z., Chlopek, K., Piotrowska, K.,
Atmos. Chem. Phys., 12, 11107–11123, 2012 www.atmos-chem-phys.net/12/11107/2012/

C. A. Skjøth et al.: Crop harvest in Denmark and Central Europe 11123
Kasprzyk, I., and Brandt, J.: Long-range transport ofAmbrosiapollen to Poland, Agr. Forest Meteorol., 148, 1402–1411, 2008.
Sofiev, M., Siljamo, P., Ranta, H., and Rantio-Lehtimaki, A.: To-wards numerical forecasting of long-range air transport of birchpollen: theoretical considerations and a feasibility study, Int. J.Biometeorol., 50, 392–402, 2006.
Sommer, J. and Rasmussen, A.: Measurements of pollen and sporesin Denmark 2009 (in Danish: Pollen- og sporemalinger i Dan-mark sæsonen 2009): The Astma-Allergy Association, Univer-sitetsparken 4, 4000 Roskilde, Denmark, 45 pp., 2009.
Sommer, S. G., Genermont, S., Cellier, P., Hutchings, N. J., Olesen,J. E., and Morvan, T.: Processes controlling ammonia emissionfrom livestock slurry in the field, Eur. J. Agron., 19, 465–486,2003.
Sommer, S. G., Zhang, G. Q., Bannink, A., Chadwick, D., Missel-brook, T., Harrison, R., Hutchings, N. J., Menzi, H., Monteny, G.J., Ni, J. Q., Oenema, O., and Webb, J.: Algorithms determiningammonia emission from buildings housing cattle and pigs andfrom manure stores, Elsevier Academic Press Inc, San Diego,335 pp., 2006.
Stach, A., Smith, M., Skjøth, C. A., and Brandt, J.: ExaminingAm-brosiapollen episodes at Poznan (Poland) using back-trajectoryanalysis, Int. J. Biometeorol., 51, 275–286, 2007.
Stepalska, D. and Wolek, J.: Intradiurnal periodicity of fungal sporeconcentrations (Alternaria, Botrytis, Cladosporium, Didymella,Ganoderma) in Cracow, Poland, Aerobiologia, 25, 333–340,2009.
Stepalska, D., Harmata, K., Kasprzyk, I., Myszkowska, D., andStach, A.: Occurrence of airborneCladosporiumandAlternariaspores in Southern and Central Poland in 1995–1996, Aerobiolo-gia, 15, 39–47, 1999.
Sterling, M., Rogers, C., and Levetin, E.: An evaluation of twomethods used for microscopic analysis of airborne fungal sporeconcentrations from the Burkard Spore Trap, Aerobiologia, 15,9–18, 1999.
The Lancet: Allergic rhinitis: common, costly, and neglected, TheLancet, 371, p. 2057, 2008.
Veriankaite, L., Siljamo, P., Sofiev, M., Sauliene, I., and Kukko-nen, J.: Modelling analysis of source regions of long-range trans-ported birch pollen that influences allergenic seasons in Lithua-nia, Aerobiologia, 26, 47–62, 2010.
Vieno, M., Dore, A. J., Bealey, W. J., Stevenson, D. S., and Sutton,M. A.: The importance of source configuration in quantifyingfootprints of regional atmospheric sulphur deposition, Sci. TotalEnviron., 408, 985–995, 2010.
Zink, K., Vogel, H., Vogel, B., Magyar, D., and Kottmeier, C.: Mod-eling the dispersion ofAmbrosia artemisiifoliaL. pollen with themodel system COSMO-ART, Int. J. Biometeorol, 56, 669–680,doi:10.1007/s00484-011-0468-8, 2012.
www.atmos-chem-phys.net/12/11107/2012/ Atmos. Chem. Phys., 12, 11107–11123, 2012