crop production 09/12/2018 - nass.usda.gov · crop production issn: 1936-3737 released september...
TRANSCRIPT

Crop Production
ISSN: 1936-3737
Released September 12, 2018, by the National Agricultural Statistics Service (NASS), Agricultural Statistics Board, United States
Department of Agriculture (USDA).
Corn Production Up 2 Percent from August Forecast Soybean Production Up 2 Percent Cotton Production Up 2 Percent
Corn production is forecast at 14.8 billion bushels, up 2 percent from August and up 2 percent from last year. Based on
conditions as of September 1, yields are expected to average 181.3 bushels per acre, up 2.9 bushels from the August
forecast and up 4.7 bushels from 2017. If realized, this will be the highest yield on record for the United States. Area
harvested for grain is forecast at 81.8 million acres, unchanged from the August forecast, but down 1 percent from 2017.
Soybean production is forecast at a record 4.69 billion bushels, up 2 percent from August and up 7 percent from last year.
Based on September 1 conditions, yields are expected to average a record high 52.8 bushels per acre, up 1.2 bushels from
last month and up 3.7 bushels from last year. Area for harvest in the United States is forecast at 88.9 million acres,
unchanged from August but down 1 percent from 2017.
All cotton production is forecast at 19.7 million 480-pound bales, up 2 percent from August but down 6 percent from last
year. Yield is expected to average 895 pounds per harvested acre, down 16 pounds from last month and down 10 pounds
from last year. Harvested area for all cotton is expected to total 10.6 million acres, down 5 percent from 2017.
Upland cotton production is forecast at 18.9 million 480-pound bales, down 6 percent from 2017. Upland harvested area is
expected to total 10.3 million acres, down 5 percent from last year. Pima cotton production, forecast at 771,000 bales, is
up 10 percent from last year. Pima cotton harvested area, at 245,400 acres, is down 2 percent from 2017.
California Navel orange production, for the 2018-2019 season, is forecast at 1.60 million tons (40.0 million boxes),
up 11 percent from last season. This initial forecast is based on an objective measurement survey conducted in
California’s Central Valley from June (due to a larger sample size) to the beginning of September. The objective
measurement survey indicated that fruit set was above last year but the average fruit size was below last year. Harvest is
expected to begin in October.
2 Crop Production (September 2018) USDA, National Agricultural Statistics Service
This report was approved on September 12, 2018.
Secretary of Agriculture
Designate
Stephen L. Censky
Agricultural Statistics Board
Chairperson
Joseph L. Parsons

Crop Production (September 2018) 3 USDA, National Agricultural Statistics Service
Contents
Cotton and Peanuts Area Planted and Harvested – States and United States: 2018 ............................................................... 6
Rice Area Planted and Harvested – States and United States: 2018 ....................................................................................... 7
Lentils, Dry Edible Peas, and Austrian Winter Peas Area Planted and Harvested – States and United States: 2018 ............ 7
Corn for Grain Area Harvested, Yield, and Production – States and United States: 2017 and Forecasted
September 1, 2018 .................................................................................................................................................................. 8
Corn Production – United States Chart ................................................................................................................................... 9
Sorghum for Grain Area Harvested, Yield, and Production – States and United States: 2017 and Forecasted
September 1, 2018 .................................................................................................................................................................. 9
Rice Area Harvested, Yield, and Production – States and United States: 2017 and Forecasted September 1, 2018 ........... 10
Rice Production by Class – United States: 2017 and Forecasted September 1, 2018 ........................................................... 10
Soybeans for Beans Area Harvested, Yield, and Production – States and United States: 2017 and Forecasted
September 1, 2018 ................................................................................................................................................................ 11
Soybean Production – United States Chart ........................................................................................................................... 12
Peanut Area Harvested, Yield, and Production – States and United States: 2017 and Forecasted
September 1, 2018 ................................................................................................................................................................ 12
Cotton Area Harvested, Yield, and Production by Type – States and United States: 2017 and Forecasted
September 1, 2018 ................................................................................................................................................................ 13
Cottonseed Production – United States: 2017 and Forecasted September 1, 2018 ............................................................... 14
Cotton Production – United States Chart .............................................................................................................................. 14
Sugarbeet for Sugar Area Harvested, Yield, and Production – States and United States: 2017 and Forecasted
September 1, 2018 ................................................................................................................................................................ 15
Sugarcane for Sugar and Seed Area Harvested, Yield, and Production – States and United States: 2017 and
Forecasted September 1, 2018 .............................................................................................................................................. 15
Tobacco Area Harvested, Yield, and Production – States and United States: 2017 and Forecasted
September 1, 2018 ................................................................................................................................................................ 15
Tobacco Area Harvested, Yield, and Production by Class and Type – States and United States: 2017 and
Forecasted September 1, 2018 .............................................................................................................................................. 16
Lentil Area Harvested, Yield, and Production – States and United States: 2017 and Forecasted
September 1, 2018 ................................................................................................................................................................ 17
Dry Edible Pea Area Harvested, Yield, and Production – States and United States: 2017 and Forecasted
September 1, 2018 ................................................................................................................................................................ 17

4 Crop Production (September 2018) USDA, National Agricultural Statistics Service
Austrian Winter Pea Area Harvested, Yield, and Production – States and United States: 2017 and Forecasted
September 1, 2018 ................................................................................................................................................................. 17
Potato Area Planted and Harvested, Yield, and Production – States and United States: 2017 and 2018 ............................. 18
Utilized Production of Nuts by Crop – States and United States: 2017 and Forecasted September 1, 2018 ........................ 19
Utilized Production of Oranges by Crop – States and United States: 2017-2018 and Forecasted
September 1, 2018 ................................................................................................................................................................. 19
Crop Area Planted and Harvested, Yield, and Production in Domestic Units – United States: 2017 and 2018 ................... 20
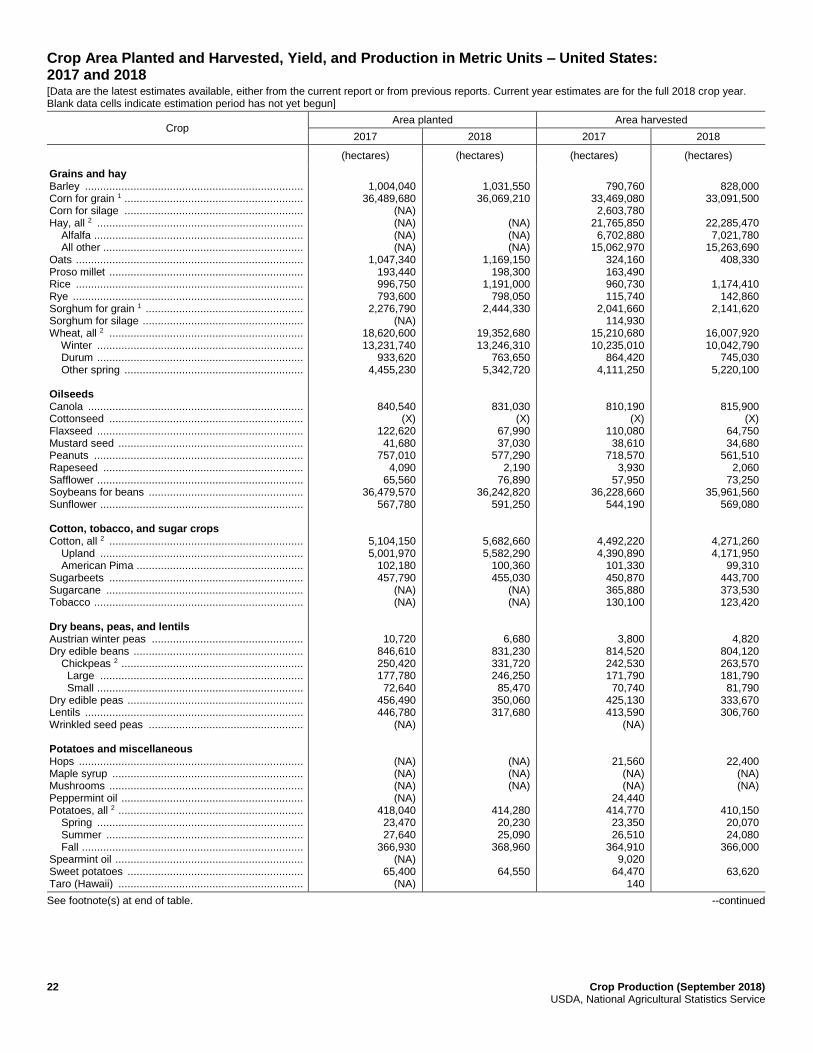
Crop Area Planted and Harvested, Yield, and Production in Metric Units – United States: 2017 and 2018 ........................ 22
Fruits and Nuts Production in Domestic Units – United States: 2017 and 2018................................................................... 24
Fruits and Nuts Production in Metric Units – United States: 2017 and 2018 ....................................................................... 25
Corn for Grain Plant Population per Acre – Selected States: 2014-2018 ............................................................................. 26
Corn for Grain Number of Ears per Acre – Selected States: 2014-2018 .............................................................................. 27
Soybean Pods with Beans per 18 Square Feet – Selected States: 2014-2018 ....................................................................... 28
Cotton Cumulative Boll Counts – Selected States: 2014-2018 ............................................................................................. 29
Percent of Fall Potatoes Planted to Major Varieties – Selected States: 2018 Crop ............................................................... 30
Percent of Fall Potatoes Planted to Major Varieties – Seven-State Total: 2018 Crop .......................................................... 31
Percent of Normal Precipitation Map .................................................................................................................................... 32
Departure from Normal Temperature Map ........................................................................................................................... 32
August Weather Summary .................................................................................................................................................... 33
August Agricultural Summary .............................................................................................................................................. 33
Crop Comments .................................................................................................................................................................... 35
Statistical Methodology ......................................................................................................................................................... 41
Reliability of September 1 Crop Production Forecasts ......................................................................................................... 42
Information Contacts ............................................................................................................................................................. 43

Crop Production (September 2018) 5 USDA, National Agricultural Statistics Service
This page intentionally left blank.

6 Crop Production (September 2018) USDA, National Agricultural Statistics Service
Cotton and Peanuts Area Planted and Harvested – States and United States: 2018 [Includes updates to planted and harvested area previously published]
State
Cotton Peanuts
Upland Pima All
Planted Harvested Planted Harvested Planted Harvested Planted Harvested
(1,000 acres) (1,000 acres) (1,000 acres) (1,000 acres) (1,000 acres) (1,000 acres) (1,000 acres) (1,000 acres)
Alabama ...................... Arizona ........................ Arkansas ...................... California ..................... Colorado ...................... Connecticut .................. Delaware ..................... Florida .......................... Georgia ........................ Idaho ............................ Illinois ........................... Indiana ......................... Iowa ............................. Kansas ......................... Kentucky ...................... Louisiana ..................... Maine ........................... Maryland ...................... Massachusetts ............. Michigan ...................... Minnesota .................... Mississippi ................... Missouri ....................... Montana ....................... Nebraska ..................... Nevada ........................ New Hampshire ........... New Jersey .................. New Mexico ................. New York ..................... North Carolina .............. North Dakota ................ Ohio ............................. Oklahoma .................... Oregon ......................... Pennsylvania ............... Rhode Island ................ South Carolina ............. South Dakota ............... Tennessee ................... Texas ........................... Utah ............................. Vermont ....................... Virginia ......................... Washington .................. West Virginia ................ Wisconsin .................... Wyoming ...................... United States ...............
510.0 150.0 485.0 50.0
118.0 1,430.0
165.0
195.0
620.0 325.0
78.0
430.0
780.0
300.0
360.0
7,700.0
98.0
13,794.0
505.0 149.0 480.0 49.0
116.0 1,420.0
160.0
190.0
615.0 320.0
65.0
420.0
570.0
298.0
355.0
4,500.0
97.0
10,309.0
- 14.0
- 210.0
- -
-
-
- -
7.0
-
-
-
-
17.0
-
248.0
- 13.5
- 209.0
- -
-
-
- -
6.9
-
-
-
-
16.0
-
245.4
510.0 164.0 485.0 260.0
118.0 1,430.0
165.0
195.0
620.0 325.0
85.0
430.0
780.0
300.0
360.0
7,717.0
98.0
14,042.0
505.0 162.5 480.0 258.0
116.0 1,420.0
160.0
190.0
615.0 320.0
71.9
420.0
570.0
298.0
355.0
4,516.0
97.0
10,554.4
165.0
27.0
155.0 665.0
25.0
5.5
102.0
16.0
87.0
155.0
24.0
1,426.5
163.0
26.0
146.0 655.0
24.0
5.5
100.0
15.0
84.0
145.0
24.0
1,387.5
- Represents zero.

Crop Production (September 2018) 7 USDA, National Agricultural Statistics Service
Rice Area Planted and Harvested – States and United States: 2018 [Includes updates to harvested area previously published]
State
Rice
Long Medium Short 1 All
Planted Harvested Planted Harvested Planted Harvested Planted Harvested
(1,000 acres) (1,000 acres) (1,000 acres) (1,000 acres) (1,000 acres) (1,000 acres) (1,000 acres) (1,000 acres)
Arkansas ..................... California ..................... Louisiana ..................... Mississippi ................... Missouri ....................... Texas .......................... United States ...............
1,250 10
395 140 215 190
2,200
1,240 10
390 139 210 185
2,174
190 450 45
- 9 8
702
181 446 44
- 9 7
687
1 40
- - - -
41
1 40
- - - -
41
1,441 500 440 140 224 198
2,943
1,422 496 434 139 219 192
2,902
- Represents zero. 1 Sweet rice acreage included with short grain.
Lentils, Dry Edible Peas, and Austrian Winter Peas Area Planted and Harvested – States and United States: 2018 [Includes updates to planted and harvested area previously published]
State Lentils Dry Edible Peas Austrian Winter Peas
Planted Harvested Planted Harvested Planted Harvested
(1,000 acres) (1,000 acres) (1,000 acres) (1,000 acres) (1,000 acres) (1,000 acres)
Idaho ................................... Montana .............................. Nebraska ............................. North Dakota ....................... Oregon ................................ South Dakota ....................... Washington ......................... United States .......................
35.0 500.0 (NA)
190.0 (NA) (NA) 60.0
785.0
34.0 480.0 (NA)
185.0 (NA) (NA) 59.0
758.0
11.0 340.0 58.0
375.0 7.0
22.0 52.0
865.0
10.0 320.0 52.0
365.0 6.5
20.0 51.0
824.5
2.0 12.0 (NA) (NA)
2.5 (NA) (NA)
16.5
1.7 8.0
(NA) (NA)
2.2 (NA) (NA)
11.9
(NA) Not available.

8 Crop Production (September 2018) USDA, National Agricultural Statistics Service
Corn for Grain Area Harvested, Yield, and Production – States and United States: 2017 and Forecasted September 1, 2018
State
Area harvested Yield per acre Production
2017 2018 2017 2018
2017 2018 August 1 September 1
(1,000 acres) (1,000 acres) (bushels) (bushels) (bushels) (1,000 bushels) (1,000 bushels)
Alabama ......................... Arkansas ......................... California ........................ Colorado ......................... Delaware ........................ Georgia ........................... Idaho ............................... Illinois .............................. Indiana ............................ Iowa ................................ Kansas ............................ Kentucky ......................... Louisiana ........................ Maryland ......................... Michigan ......................... Minnesota ....................... Mississippi ...................... Missouri .......................... Nebraska ........................ New York ........................ North Carolina ................. North Dakota ................... Ohio ................................ Oklahoma ....................... Pennsylvania .................. South Carolina ................ South Dakota .................. Tennessee ...................... Texas .............................. Virginia ............................ Washington ..................... Wisconsin ....................... Other States 1 ................. United States ..................
235 595 80
1,300 171 245 115
10,950 5,190
12,900
5,200 1,220
490 420
1,890 7,630
500 3,250 9,300
485
840 3,230 3,130
305 920 325
5,080 710
2,240 340 80
2,930
407
82,703
235 640 75
1,340 140 305 125
10,850 4,920
12,850
5,100 1,210
420 410
1,850 7,400
470 3,250 9,350
630
870 3,100 3,310
270 920 310
4,850 730
2,000 330 80
3,000
430
81,770
167.0 183.0 167.0 143.0 189.0 176.0 203.0 201.0 180.0 202.0
132.0 178.0 184.0 172.0 159.0 194.0 189.0 170.0 181.0 161.0
142.0 139.0 177.0 126.0 161.0 136.0 145.0 171.0 140.0 140.0 225.0 174.0
151.9
176.6
170.0 182.0 182.0 133.0 186.0 173.0 190.0 207.0 186.0 202.0
129.0 175.0 174.0 168.0 158.0 191.0 185.0 131.0 196.0 158.0
120.0 148.0 180.0 120.0 154.0 127.0 170.0 174.0 115.0 148.0 210.0 177.0
153.7
178.4
173.0 182.0 175.0 130.0 175.0 170.0 195.0 214.0 192.0 206.0
131.0 177.0 170.0 175.0 165.0 191.0 185.0 138.0 198.0 163.0
122.0 142.0 188.0 125.0 160.0 124.0 173.0 174.0 105.0 148.0 225.0 179.0
154.5
181.3
39,245 108,885 13,360
185,900 32,319 43,120 23,345
2,200,950 934,200
2,605,800
686,400 217,160 90,160 72,240
300,510 1,480,220
94,500 552,500
1,683,300 78,085
119,280 448,970 554,010 38,430
148,120 44,200
736,600 121,410 313,600 47,600 18,000
509,820
61,828
14,604,067
40,655 116,480 13,125
174,200 24,500 51,850 24,375
2,321,900 944,640
2,647,100
668,100 214,170 71,400 71,750
305,250 1,413,400
86,950 448,500
1,851,300 102,690
106,140 440,200 622,280 33,750
147,200 38,440
839,050 127,020 210,000 48,840 18,000
537,000
66,435
14,826,690
1 Other States include Arizona, Florida, Montana, New Jersey, New Mexico, Oregon, Utah, West Virginia, and Wyoming. Individual State level estimates will be published in the Crop Production 2018 Summary.

Crop Production (September 2018) 9 USDA, National Agricultural Statistics Service
Sorghum for Grain Area Harvested, Yield, and Production – States and United States: 2017 and Forecasted September 1, 2018
State
Area harvested Yield per acre Production
2017 2018 2017 2018
2017 2018 August 1 September 1
(1,000 acres) (1,000 acres) (bushels) (bushels) (bushels) (1,000 bushels) (1,000 bushels)
Arkansas ....................... Colorado ........................ Kansas .......................... Louisiana ....................... Mississippi ..................... Missouri ......................... Nebraska ....................... Oklahoma ...................... South Dakota ................. Texas ............................ Other States 1 ................ United States .................
7 360
2,450 13 4
23 135 295 170
1,500
88
5,045
8 350
2,650 9 4
55 155 350 215
1,400
96
5,292
76.0 57.0 82.0 91.0 72.0
108.0 89.0 53.0 68.0 63.0
47.9
72.1
80.0 40.0 87.0 90.0 80.0
105.0 102.0 44.0 85.0 49.0
54.2
70.9
80.0 39.0 87.0 95.0 80.0
109.0 102.0 43.0 80.0 51.0
51.7
71.1
532 20,520
200,900 1,183
288 2,484
12,015 15,635 11,560 94,500
4,215
363,832
640 13,650
230,550 855 320
5,995 15,810 15,050 17,200 71,400
4,965
376,435
1 Other States include Georgia, Illinois, New Mexico, and North Carolina. Individual State level estimates will be published in the Crop Production 2018 Summary.
8.0
9.0
10.0
11.0
12.0
13.0
14.0
15.0
16.0
2008 2009 2010 2011 2012 2013 2014 2015 2016 2017 2018
Billion bushels
Corn Production – United States

10 Crop Production (September 2018) USDA, National Agricultural Statistics Service
Rice Area Harvested, Yield, and Production – States and United States: 2017 and Forecasted September 1, 2018
State
Area harvested Yield per acre Production 1
2017 2018 2017 2018
2017 2018 August 1 September 1
(1,000 acres) (1,000 acres) (pounds) (pounds) (pounds) (1,000 cwt) (1,000 cwt)
Arkansas ................ California ............... Louisiana ............... Mississippi ............. Missouri ................. Texas ..................... United States .........
1,104 443 395 114 160 158
2,374
1,422 496 434 139 219 192
2,902
7,490 8,410 6,710 7,400 7,440 7,260
7,507
7,500 8,600 6,900 7,300 7,000 7,000
7,523
7,500 8,700 7,000 7,300 7,000 7,200
7,563
82,644 37,277 26,503 8,436
11,900 11,468
178,228
106,650 43,152 30,380 10,147 15,330 13,824
219,483
1 Includes sweet rice production.
Rice Production by Class – United States: 2017 and Forecasted September 1, 2018
Year Long grain Medium grain Short grain 1 All
(1,000 cwt) (1,000 cwt) (1,000 cwt) (1,000 cwt)
2017 ........................ 2018 2 ......................
127,850 159,465
47,867 57,216
2,511 2,802
178,228 219,483
1 Sweet rice production included with short grain. 2 The 2018 rice production by class forecasts are based on class harvested acreage estimates and the 5-year average class yield compared to the all
rice yield.

Crop Production (September 2018) 11 USDA, National Agricultural Statistics Service
Soybeans for Beans Area Harvested, Yield, and Production – States and United States: 2017 and Forecasted September 1, 2018
State
Area harvested Yield per acre Production
2017 2018 2017 2018
2017 2018 August 1 September 1
(1,000 acres) (1,000 acres) (bushels) (bushels) (bushels) (1,000 bushels) (1,000 bushels)
Alabama ........................... Arkansas .......................... Delaware .......................... Georgia ............................ Illinois ............................... Indiana ............................. Iowa .................................. Kansas ............................. Kentucky ........................... Louisiana .......................... Maryland ........................... Michigan ........................... Minnesota ......................... Mississippi ........................ Missouri ............................ Nebraska .......................... New Jersey ....................... New York .......................... North Carolina .................. North Dakota .................... Ohio .................................. Oklahoma ......................... Pennsylvania .................... South Carolina .................. South Dakota .................... Tennessee ........................ Texas ............................... Virginia ............................. Wisconsin ......................... Other States 1 ................... United States ....................
345 3,500
158 150
10,550 5,940 9,940 5,110 1,940 1,250
495
2,270 8,090 2,170 5,910 5,670
99 265
1,690 7,050
5,090
640 585 390
5,610 1,660
185 590
2,140
40
89,522
355 3,570
153 190
10,850 6,180 9,840 4,810 2,090 1,370
495
2,290 7,740 2,180 5,730 5,450
118 266
1,590 6,550
4,940
640 595 410
5,660 1,720
140 610
2,290
40
88,862
46.0 51.0 51.0 42.0 58.0 54.0 56.5 37.0 53.0 54.0
51.0 42.5 47.0 53.0 49.0 57.5 45.0 45.0 40.0 34.0
49.5 29.0 48.0 38.0 43.0 50.0 37.0 44.0 47.0
47.0
49.1
48.0 50.0 49.0 38.0 64.0 58.0 59.0 36.0 53.0 50.0
48.0 46.0 49.0 53.0 45.0 61.0 40.0 47.0 38.0 38.0
56.0 30.0 49.0 37.0 49.0 49.0 33.0 43.0 50.0
48.8
51.6
44.0 50.0 45.0 40.0 66.0 60.0 60.0 41.0 57.0 50.0
50.0 49.0 50.0 53.0 47.0 62.0 40.0 49.0 38.0 36.0
58.0 31.0 50.0 32.0 49.0 51.0 34.0 43.0 50.0
48.2
52.8
15,870 178,500
8,058 6,300
611,900 320,760 561,610 189,070 102,820 67,500
25,245 96,475
380,230 115,010 289,590 326,025
4,455 11,925 67,600
239,700
251,955 18,560 28,080 14,820
241,230 83,000 6,845
25,960 100,580
1,880
4,391,553
15,620 178,500
6,885 7,600
716,100 370,800 590,400 197,210 119,130 68,500
24,750
112,210 387,000 115,540 269,310 337,900
4,720 13,034 60,420
235,800
286,520 19,840 29,750 13,120
277,340 87,720 4,760
26,230 114,500
1,926
4,693,135
1 Other States include Florida and West Virginia. Individual State level estimates will be published in the Crop Production 2018 Summary.

12 Crop Production (September 2018) USDA, National Agricultural Statistics Service
Peanut Area Harvested, Yield, and Production – States and United States: 2017 and Forecasted September 1, 2018
State
Area harvested Yield per acre Production
2017 2018 2017 2018
2017 2018 August 1 September 1
(1,000 acres) (1,000 acres) (pounds) (pounds) (pounds) (1,000 pounds) (1,000 pounds)
Alabama .......................... Florida .............................. Georgia ............................ Mississippi ....................... North Carolina .................. Oklahoma ........................ South Carolina ................. Texas ............................... Virginia ............................. Other States 1 .................. United States ...................
193.0 186.0 825.0 43.0
117.0 20.0
118.0 210.0 27.0
36.6
1,775.6
163.0 146.0 655.0 24.0
100.0 15.0 84.0
145.0 24.0
31.5
1,387.5
3,650 3,550 4,380 4,100 4,100 3,700 4,000 3,600 4,550
4,768
4,074
4,000 4,000 4,500 4,100 4,100 3,200 3,800 3,300 4,200
4,676
4,167
4,000 4,100 4,500 4,000 3,900 3,000 3,800 3,200 4,100
4,738
4,151
704,450 660,300
3,613,500 176,300 479,700 74,000
472,000 756,000 122,850
174,500
7,233,600
652,000 598,600
2,947,500 96,000
390,000 45,000
319,200 464,000 98,400
149,250
5,759,950
1 Other States include Arkansas and New Mexico.
2.4
2.9
3.4
3.9
4.4
4.9
2008 2009 2010 2011 2012 2013 2014 2015 2016 2017 2018
Billion bushels
Soybean Production – United States

Crop Production (September 2018) 13 USDA, National Agricultural Statistics Service
Cotton Area Harvested, Yield, and Production by Type – States and United States: 2017 and Forecasted September 1, 2018
Type and State
Area harvested Yield per acre Production 1
2017 2018 2017 2018
2017 2018 August 1 September 1
(1,000 acres) (1,000 acres) (pounds) (pounds) (pounds) (1,000 bales) 2 (1,000 bales) 2
Upland Alabama .......................... Arizona ............................ Arkansas ......................... California ......................... Florida ............................. Georgia ........................... Kansas ............................ Louisiana ......................... Mississippi ....................... Missouri ........................... New Mexico ..................... North Carolina ................. Oklahoma ........................ South Carolina ................. Tennessee ....................... Texas .............................. Virginia ............................ United States ................... American Pima Arizona ............................ California ......................... New Mexico ..................... Texas .............................. United States ................... All Alabama .......................... Arizona ............................ Arkansas ......................... California ......................... Florida ............................. Georgia ........................... Kansas ............................ Louisiana ......................... Mississippi ....................... Missouri ........................... New Mexico ..................... North Carolina ................. Oklahoma ........................ South Carolina ................. Tennessee ....................... Texas .............................. Virginia ............................ United States ...................
430.0 159.0 438.0 87.0 98.0
1,270.0 90.0
217.0 625.0 297.0
46.0
367.0 555.0 248.0 340.0
5,500.0 83.0
10,850.0
15.0 215.0
7.4 13.0
250.4
430.0 174.0 438.0 302.0 98.0
1,270.0 90.0
217.0 625.0 297.0
53.4
367.0 555.0 248.0 340.0
5,513.0 83.0
11,100.4
505.0 149.0 480.0 49.0
116.0 1,420.0
160.0 190.0 615.0 320.0
65.0
420.0 570.0 298.0 355.0
4,500.0 97.0
10,309.0
13.5 209.0
6.9 16.0
245.4
505.0 162.5 480.0 258.0 116.0
1,420.0 160.0 190.0 615.0 320.0
71.9
420.0 570.0 298.0 355.0
4,516.0 97.0
10,554.4
902
1,464 1,177 1,297
759 841
1,051 894
1,038 1,212
1,179
969 882 912
1,033 809
1,110
895
966 1,407
863 960
1,341
902 1,421 1,177 1,375
759 841
1,051 894
1,038 1,212
1,135
969 882 912
1,033 809
1,110
905
1,000 1,466 1,112 1,861
935 967
1,034 1,070 1,211 1,200
1,182
849 766 930
1,050 726
1,057
895
924 1,654
765 960
1,555
1,000 1,421 1,112 1,693
935 967
1,034 1,070 1,211 1,200
1,142
849 766 930
1,050 726
1,057
911
1,041 1,498 1,150 1,763
910 946
1,005 1,061 1,132 1,230
1,108
921 800 886
1,082 693
1,089
881
889 1,610
904 960
1,508
1,041 1,447 1,150 1,639
910 946
1,005 1,061 1,132 1,230
1,088
921 800 886
1,082 694
1,089
895
808.0 485.0
1,074.0 235.0 155.0
2,225.0 197.0 404.0
1,351.0 750.0
113.0 741.0
1,020.0 471.0 732.0
9,270.0 192.0
20,223.0
30.2 630.0 13.3 26.0
699.5
808.0 515.2
1,074.0 865.0 155.0
2,225.0 197.0 404.0
1,351.0 750.0
126.3 741.0
1,020.0 471.0 732.0
9,296.0 192.0
20,922.5
1,095.0
465.0 1,150.0
180.0 220.0
2,800.0 335.0 420.0
1,450.0 820.0
150.0 806.0 950.0 550.0 800.0
6,500.0 220.0
18,911.0
25.0 701.0 13.0 32.0
771.0
1,095.0 490.0
1,150.0 881.0 220.0
2,800.0 335.0 420.0
1,450.0 820.0
163.0 806.0 950.0 550.0 800.0
6,532.0 220.0
19,682.0
1 Production ginned and to be ginned. 2 480-pound net weight bale.

14 Crop Production (September 2018) USDA, National Agricultural Statistics Service
Cottonseed Production – United States: 2017 and Forecasted September 1, 2018
State Production
2017 2018 1
(1,000 tons) (1,000 tons)
United States ........................... 6,422.0 6,156.0
1 Based on a 3-year average lint-seed ratio.
10.0
12.0
14.0
16.0
18.0
20.0
22.0
2008 2009 2010 2011 2012 2013 2014 2015 2016 2017 2018
Million bales
Cotton Production - United States

Crop Production (September 2018) 15 USDA, National Agricultural Statistics Service
Sugarbeet for Sugar Area Harvested, Yield, and Production – States and United States: 2017 and Forecasted September 1, 2018 [Relates to year of intended harvest in all States except California]
State
Area harvested Yield per acre Production
2017 2018 2017 2018
2017 2018 August 1 September 1
(1,000 acres) (1,000 acres) (tons) (tons) (tons) (1,000 tons) (1,000 tons)
California 1 ................ Colorado ................... Idaho ........................ Michigan ................... Minnesota ................. Montana ................... Nebraska .................. North Dakota ............ Oregon ..................... Washington .............. Wyoming .................. United States ............
24.7 29.0
166.0 143.0 409.0 42.7 45.2
212.0 9.1 1.8
31.6
1,114.1
23.3 25.4
162.0 148.3 399.0 42.7 44.4
209.0 9.6 1.8
30.9
1,096.4
43.5 35.7 39.2 25.2 30.6 32.7 31.8 30.4 36.7 48.2 28.2
31.7
42.8 37.0 41.2 30.0 29.3 33.3 33.9 31.1 39.3 48.6 32.3
32.5
44.0 35.1 41.1 30.4 30.1 34.3 34.3 30.9 38.5 49.2 32.4
32.8
1,074 1,035 6,507 3,604
12,515 1,396 1,437 6,445
334 87
891
35,325
1,025 892
6,658 4,508
12,010 1,465 1,523 6,458
370 89
1,001
35,999
1 Relates to year of intended harvest for fall planted beets in central California and to year of planting for overwintered beets in central and southern California.
Sugarcane for Sugar and Seed Area Harvested, Yield, and Production – States and United States: 2017 and Forecasted September 1, 2018
State
Area harvested Yield per acre 1 Production 1
2017 2018 2017 2018
2017 2018 August 1 September 1
(1,000 acres) (1,000 acres) (tons) (tons) (tons) (1,000 tons) (1,000 tons)
Florida ...................... Louisiana .................. Texas ....................... United States ............
412.7 449.6 41.8
904.1
413.0 470.0 40.0
923.0
41.1 32.8 37.1
36.8
41.4 30.9 36.5
35.8
40.8 30.8 35.5
35.5
16,942 14,744 1,552
33,238
16,850 14,476 1,420
32,746
1 Net tons.
Tobacco Area Harvested, Yield, and Production – States and United States: 2017 and Forecasted September 1, 2018
State
Area harvested Yield per acre Production
2017 2018 2017 2018
2017 2018 August 1 September 1
(acres) (acres) (pounds) (pounds) (pounds) (1,000 pounds) (1,000 pounds)
Georgia ........................... Kentucky .......................... North Carolina ................. Pennsylvania ................... South Carolina ................. Tennessee ....................... Virginia ............................ United States ...................
12,500 80,500
163,900 8,100
12,000 21,100 23,370
321,470
12,500 71,200
161,800 7,800
12,000 16,400 23,280
304,980
2,100 2,277 2,197 2,344 2,100 2,038 2,284
2,209
2,100 2,165 2,098 2,451 1,800 2,184 2,274
2,130
1,800 2,256 1,999 2,433 1,800 2,376 2,179
2,088
26,250 183,300 360,040 18,990 25,200 43,000 53,381
710,161
22,500 160,640 323,360 18,980 21,600 38,960 50,732
636,772

16 Crop Production (September 2018) USDA, National Agricultural Statistics Service
Tobacco Area Harvested, Yield, and Production by Class and Type – States and United States: 2017 and Forecasted September 1, 2018 [Blank data cells indicate estimation period had not yet begun]
Class, type, and State
Area harvested Yield per acre Production
2017 2018 2017 2018
2017 2018 August 1 September 1
(acres) (acres) (pounds) (pounds) (pounds) (1,000
pounds) (1,000
pounds)
Class 1, Flue-cured (11-14) Georgia ............................................................. North Carolina ................................................... South Carolina .................................................. Virginia .............................................................. United States .................................................... Class 2, Fire-cured (21-23) Kentucky ........................................................... Tennessee ........................................................ Virginia .............................................................. United States .................................................... Class 3A, Light air-cured Type 31, Burley Kentucky ....................................................... North Carolina ............................................... Pennsylvania ................................................. Tennessee .................................................... Virginia .......................................................... United States ................................................ Type 32, Southern Maryland Belt Pennsylvania ................................................. United States ................................................ Total light air-cured (31-32) ............................ Class 3B, Dark air-cured (35-37) Kentucky ........................................................... Tennessee ........................................................ United States .................................................... Class 4, Cigar filler Type 41, Pennsylvania Seedleaf Pennsylvania ................................................. United States ................................................ All tobacco United States ....................................................
12,500
163,000 12,000 22,000
209,500
11,500 7,500
270
19,270
63,000 900
4,500 12,000 1,100
81,500
1,800
1,800
83,300
6,000 1,600
7,600
1,800
1,800
321,470
12,500
161,000 12,000 22,000
207,500
11,000 7,600
280
18,880
53,000 800
4,000 6,000 1,000
64,800
1,400
1,400
66,200
7,200 2,800
10,000
2,400
2,400
304,980
2,100 2,200 2,100 2,300
2,199
3,300 2,800 2,150
3,089
2,050 1,600 2,300 1,500 2,000
1,977
2,400
2,400
1,986
2,700 2,500
2,658
2,400
2,400
2,209
2,100 2,100 1,800 2,300
2,104
3,200 2,800 1,900
3,029
1,900 1,700 2,500 1,700 1,800
1,905
2,400
2,400
1,915
2,700 2,300
2,620
2,400
2,400
2,130
1,800 2,000 1,800 2,200
1,998
3,200 2,900 1,900
3,060
2,000 1,700 2,500 1,700 1,800
1,996
2,300
2,300
2,003
2,700 2,400
2,616
2,400
2,400
2,088
26,250
358,600 25,200 50,600
460,650
37,950 21,000
581
59,531
129,150 1,440
10,350 18,000 2,200
161,140
4,320
4,320
165,460
16,200 4,000
20,200
4,320
4,320
710,161
22,500
322,000 21,600 48,400
414,500
35,200 22,040
532
57,772
106,000 1,360
10,000 10,200 1,800
129,360
3,220
3,220
132,580
19,440 6,720
26,160
5,760
5,760
636,772

Crop Production (September 2018) 17 USDA, National Agricultural Statistics Service
Lentil Area Harvested, Yield, and Production – States and United States: 2017 and Forecasted September 1, 2018
State Area harvested Yield per acre Production
2017 2018 2017 2018 2017 2018
(1,000 acres) (1,000 acres) (pounds) (pounds) (1,000 cwt) (1,000 cwt)
Idaho ................ Montana ........... North Dakota .... Washington ...... United States ....
35.0 670.0 250.0 67.0
1,022.0
34.0 480.0 185.0 59.0
758.0
900 650 870 950
732
1,200 1,020 1,500 1,200
1,159
315 4,355 2,175
637
7,482
408 4,896 2,775
708
8,787
Dry Edible Pea Area Harvested, Yield, and Production – States and United States: 2017 and Forecasted September 1, 2018 [Excludes both wrinkled seed peas and Austrian winter peas]
State Area harvested Yield per acre Production
2017 2018 2017 2018 2017 2018
(1,000 acres) (1,000 acres) (pounds) (pounds) (1,000 cwt) (1,000 cwt)
Idaho .................... Montana ............... Nebraska .............. North Dakota ........ Oregon ................. South Dakota ........ Washington .......... United States ........
13.0 470.0 56.0
410.0 6.5
35.0 60.0
1,050.5
10.0 320.0 52.0
365.0 6.5
20.0 51.0
824.5
1,800 820
1,420 1,800 2,900 1,500 2,000
1,350
1,900 1,200 2,200 1,900 2,500 2,400 2,200
1,683
234 3,854
795 7,380
189 525
1,200
14,177
190 3,840 1,144 6,935
163 480
1,122
13,874
Austrian Winter Pea Area Harvested, Yield, and Production – States and United States: 2017 and Forecasted September 1, 2018
State Area harvested Yield per acre Production
2017 2018 2017 2018 2017 2018
(1,000 acres) (1,000 acres) (pounds) (pounds) (1,000 cwt) (1,000 cwt)
Idaho ................ Montana ........... Oregon ............. United States ....
3.4 4.0 2.0
9.4
1.7 8.0 2.2
11.9
1,600 630
2,300
1,330
1,500 900
2,200
1,227
54 25 46
125
26 72 48
146

18 Crop Production (September 2018) USDA, National Agricultural Statistics Service
Potato Area Planted and Harvested, Yield, and Production – States and United States: 2017 and 2018 [Data are the latest estimates available, either from the current report or from previous reports. Estimates for current year carried forward from earlier forecast. Current year estimates are for the full 2017 crop year. Blank data cells indicate estimation period has not yet begun]
Seasonal group and State
Area planted Area harvested Yield per acre Production
2017 2018 2017 2018 2017 2018 2017 2018
(1,000 acres)
(1,000 acres)
(1,000 acres)
(1,000 acres)
(cwt) (cwt) (1,000 cwt) (1,000 cwt)
Spring California ............................................... Florida .................................................... United States ......................................... Summer Illinois ..................................................... Kansas ................................................... Maryland ................................................ Missouri ................................................. New Jersey ............................................ North Carolina ........................................ Texas ..................................................... Virginia ................................................... United States ......................................... Fall 1 Alaska 2 .................................................. California ............................................... Colorado ................................................ San Luis Valley .................................... All other areas ...................................... Idaho ...................................................... Maine ..................................................... Michigan ................................................ Minnesota .............................................. Montana ................................................. Nebraska ............................................... New York ............................................... North Dakota .......................................... Oregon ................................................... Washington ............................................ Wisconsin .............................................. United States 3 ....................................... All United States 3 .......................................
29.0 29.0
58.0
8.1 4.1 2.6 8.8 1.7
16.0 22.0 5.0
68.3
(X) 8.2
55.9 51.7 4.2
310.0 48.0 47.0 46.0 11.1
19.0 14.5 75.0 39.0
165.0 68.0
906.7
1,033.0
26.0 24.0
50.0
7.7 3.5 2.2 7.8 1.8
14.0 20.0 5.0
62.0
0.4 7.5
55.3 51.8 3.5
315.0 52.0 48.0 44.0 11.0
19.5 15.0 74.0 38.0
165.0 67.0
911.7
1,023.7
29.0 28.7
57.7
7.6 4.1 2.5 8.5 1.7
15.1 21.5 4.5
65.5
(X) 8.2
55.6 51.5 4.1
310.0 47.5 46.5 45.5 11.1
19.0 14.4 74.0 38.9
164.0 67.0
901.7
1,024.9
26.0 23.6
49.6
7.5 3.4 2.2 7.4 1.8
13.3 19.0 4.9
59.5
0.4 7.5
55.0 51.6 3.4
314.0 51.5 47.0 43.0 10.9
19.3 14.9 72.0 37.9
165.0 66.0
904.4
1,013.5
435 250
343
410 380 365 285 300 230 395 265
331
(X) 405 382 375 465 435 320 370 405 340
475 280 330 550 605 425
444
431
430 270
354
400 400 340 265 280 170 460 240
332
12,615 7,175
19,790
3,116 1,558
913 2,423
510 3,473 8,493 1,193
21,679
(X) 3,321
21,220 19,313 1,907
134,850 15,200 17,205 18,428 3,774
9,025 4,032
24,420 21,395 99,220 28,475
400,565
442,034
11,180 6,372
17,552
3,000 1,360
748 1,961
504 2,261 8,740 1,176
19,750
(X) Not applicable. 1 Estimates for current year carried forward from an earlier forecast. 2 Previously included in the Alaska table. 3 Beginning in 2018, United States total includes data for Alaska.

Crop Production (September 2018) 19 USDA, National Agricultural Statistics Service
Utilized Production of Nuts by Crop – States and United States: 2017 and Forecasted September 1, 2018
Crop and State Utilized Production
2017 2018
(tons) (tons)
Hazelnuts in-shell basis Oregon ...................................................................................... United States ............................................................................. Walnuts in-shell basis California ................................................................................... United States .............................................................................
32,000
32,000
630,000
630,000
52,000
52,000
690,000
690,000
Utilized Production of Oranges by Crop – States and United States: 2017-2018 and Forecasted September 1, 2018 [The crop year begins with the bloom of the first year shown and ends with the completion of harvest the following year. Blank data cells indicate estimation period has not yet begun]
Crop and State Utilized production boxes 1 Utilized production ton equivalent
2017-2018 2018-2019 2017-2018 2018-2019
(1,000 boxes) (1,000 boxes) (1,000 tons) (1,000 tons)
California, all ........................................... Early, mid, and Navel 2 ........................ Valencia .............................................. Florida, all ............................................... Early, mid, and Navel 2 ........................ Valencia .............................................. Texas ..................................................... Early, mid, and Navel 2 ........................ Valencia .............................................. United States, all .................................... Early, mid, and Navel 2 ........................ Valencia ..............................................
45,400 35,900 9,500
44,950 18,950 26,000
1,880 1,530
350
92,230 56,380 35,850
40,000
1,816 1,436
380
2,023 853
1,170
80 65 15
3,919 2,354 1,565
1,600
1 Net pounds per box: California-80, Florida-90, Texas-85. 2 Navel and miscellaneous varieties in California. Early (including Navel) and midseason varieties in Florida and Texas.

20 Crop Production (September 2018) USDA, National Agricultural Statistics Service
Crop Area Planted and Harvested, Yield, and Production in Domestic Units – United States: 2017 and 2018 [Data are the latest estimates available, either from the current report or from previous reports. Current year estimates are for the full 2018 crop year. Blank data cells indicate estimation period has not yet begun]
Crop Area planted Area harvested
2017 2018 2017 2018
(1,000 acres) (1,000 acres) (1,000 acres) (1,000 acres)
Grains and hay Barley ..................................................................................... Corn for grain 1 ........................................................................ Corn for silage ........................................................................ Hay, all .................................................................................... Alfalfa .................................................................................. All other ............................................................................... Oats ........................................................................................ Proso millet ............................................................................. Rice ........................................................................................ Rye ......................................................................................... Sorghum for grain 1 ................................................................. Sorghum for silage .................................................................. Wheat, all ................................................................................ Winter ................................................................................. Durum ................................................................................. Other spring ........................................................................ Oilseeds Canola .................................................................................... Cottonseed ............................................................................. Flaxseed ................................................................................. Mustard seed .......................................................................... Peanuts .................................................................................. Rapeseed ............................................................................... Safflower ................................................................................. Soybeans for beans ................................................................ Sunflower ................................................................................ Cotton, tobacco, and sugar crops Cotton, all ............................................................................... Upland ................................................................................ American Pima .................................................................... Sugarbeets ............................................................................. Sugarcane .............................................................................. Tobacco .................................................................................. Dry beans, peas, and lentils Austrian winter peas ............................................................... Dry edible beans ..................................................................... Chickpeas, all ...................................................................... Large ................................................................................ Small ................................................................................. Dry edible peas ....................................................................... Lentils ..................................................................................... Wrinkled seed peas ................................................................ Potatoes and miscellaneous Hops ....................................................................................... Maple syrup ............................................................................ Mushrooms ............................................................................. Peppermint oil ......................................................................... Potatoes, all ............................................................................ Spring ................................................................................. Summer .............................................................................. Fall ...................................................................................... Spearmint oil ........................................................................... Sweet potatoes ....................................................................... Taro (Hawaii) ..........................................................................
2,481
90,167 (NA) (NA) (NA) (NA)
2,588 478
2,463 1,961 5,626 (NA)
46,012 32,696 2,307
11,009
2,077.0 (X)
303 103.0
1,870.6 10.1
162.0 90,142 1,403.0
12,612.5 12,360.0
252.5 1,131.2
(NA) (NA)
26.5 2,092.0
618.8 439.3 179.5
1,128.0 1,104.0
(NA)
(NA) (NA) (NA) (NA)
1,033.0 58.0 68.3
906.7 (NA)
161.6 (NA)
2,549
89,128
(NA) (NA) (NA)
2,889 490
2,943 1,972 6,040
47,821 32,732 1,887
13,202
2,053.5 (X)
168 91.5
1,426.5 5.4
190.0 89,557 1,461.0
14,042.0 13,794.0
248.0 1,124.4
(NA) (NA)
16.5 2,054.0
819.7 608.5 211.2 865.0 785.0
(NA) (NA) (NA)
1,023.7
50.0 62.0
911.7
159.5
1,954
82,703 6,434
53,784 16,563 37,221
801 404
2,374 286
5,045 284
37,586 25,291 2,136
10,159
2,002.0 (X)
272 95.4
1,775.6 9.7
143.2 89,522 1,344.7
11,100.4 10,850.0
250.4 1,114.1
904.1 321.5
9.4 2,012.7
599.3 424.5 174.8
1,050.5 1,022.0
(NA)
53.3 (NA) (NA) 60.4
1,024.9 57.7 65.5
901.7 22.3
159.3 0.4
2,046
81,770
55,068 17,351 37,717 1,009
2,902
353 5,292
39,556 24,816 1,841
12,899
2,016.1 (X)
160 85.7
1,387.5 5.1
181.0 88,862 1,406.2
10,554.4 10,309.0
245.4 1,096.4
923.0 305.0
11.9 1,987.0
651.3 449.2 202.1 824.5 758.0
55.3 (NA) (NA)
1,013.5
49.6 59.5
904.4
157.2
See footnote(s) at end of table. --continued

Crop Production (September 2018) 21 USDA, National Agricultural Statistics Service
Crop Area Planted and Harvested, Yield, and Production in Domestic Units – United States: 2017 and 2018 (continued) [Data are the latest estimates available, either from the current report or from previous reports. Current year estimates are for the full 2018 crop year. Blank data cells indicate estimation period has not yet begun]
Crop Yield per acre Production
2017 2018 2017 2018
(1,000) (1,000)
Grains and hay Barley ......................................................................... bushels Corn for grain .............................................................. bushels Corn for silage .................................................................. tons Hay, all ............................................................................. tons Alfalfa ........................................................................... tons All other ........................................................................ tons Oats ............................................................................ bushels Proso millet ................................................................. bushels Rice 2 ................................................................................. cwt Rye ............................................................................. bushels Sorghum for grain ....................................................... bushels Sorghum for silage ............................................................ tons Wheat, all ................................................................... bushels Winter ..................................................................... bushels Durum ..................................................................... bushels Other spring ............................................................ bushels Oilseeds Canola ......................................................................... pounds Cottonseed ....................................................................... tons Flaxseed ..................................................................... bushels Mustard seed ............................................................... pounds Peanuts ....................................................................... pounds Rapeseed .................................................................... pounds Safflower ..................................................................... pounds Soybeans for beans .................................................... bushels Sunflower .................................................................... pounds Cotton, tobacco, and sugar crops Cotton, all 2 ..................................................................... bales Upland 2 ...................................................................... bales American Pima 2 ......................................................... bales Sugarbeets ....................................................................... tons Sugarcane ........................................................................ tons Tobacco ....................................................................... pounds Dry beans, peas, and lentils Austrian winter peas 2 ........................................................ cwt Dry edible beans 2 ............................................................. cwt Chickpeas, all 2 .............................................................. cwt Large 2 ......................................................................... cwt Small 2 ......................................................................... cwt Dry edible peas 2 ............................................................... cwt Lentils 2 .............................................................................. cwt Wrinkled seed peas ........................................................... cwt Potatoes and miscellaneous Hops ............................................................................ pounds Maple syrup ................................................................. gallons Mushrooms .................................................................. pounds Peppermint oil .............................................................. pounds Potatoes, all ....................................................................... cwt Spring ............................................................................ cwt Summer ......................................................................... cwt Fall ................................................................................ cwt Spearmint oil ............................................................... pounds Sweet potatoes .................................................................. cwt Taro (Hawaii) ............................................................... pounds
72.6
176.6 19.9 2.44 3.32 2.05 61.7 36.1
7,507 33.9 72.1 13.3 46.3 50.2 25.7 41.0
1,558 (X)
14.1 632
4,074 2,139 1,256 49.1
1,613
905 895
1,341 31.7 36.8
2,209
1,330 1,781 1,152 1,165 1,121 1,350
732 (NA)
1,959 (NA) (NA)
96 431 343 331 444 125 224
10,530
76.3
181.3
2.33 3.33 1.88 65.1
7,563
71.1
47.4 47.9 39.9 47.6
(X)
4,151
52.8
895 881
1,508 32.8 35.5
2,088
1,227 1,809
1,683 1,159
1,910 (NA) (NA)
354 332
141,923
14,604,067 128,356 131,455 55,068 76,387 49,391 14,567
178,228 9,696
363,832 3,772
1,740,582 1,269,437
54,909 416,236
3,118,680 6,422.0
3,842 60,250
7,233,600 20,750
179,896 4,391,553 2,168,737
20,922.5 20,223.0
699.5 35,325 33,238
710,161
125 35,845 6,905 4,945 1,960
14,177 7,482
357
104,366.0 4,271
933,355 5,778
442,034 19,790 21,679
400,565 2,796
35,646 3,686
156,176
14,826,690
128,504 57,778 70,726 65,668
219,483
376,435
1,876,785 1,189,199
73,432 614,154
6,156.0
5,759,950
4,693,135
19,682.0 18,911.0
771.0 35,999 32,746
636,772
146 35,938
13,874 8,787
105,683.6 4,159
917,235
17,552 19,750
(NA) Not available. (X) Not applicable. 1 Area planted for all purposes. 2 Yield in pounds.
22 Crop Production (September 2018) USDA, National Agricultural Statistics Service
Crop Area Planted and Harvested, Yield, and Production in Metric Units – United States: 2017 and 2018 [Data are the latest estimates available, either from the current report or from previous reports. Current year estimates are for the full 2018 crop year. Blank data cells indicate estimation period has not yet begun]
Crop Area planted Area harvested
2017 2018 2017 2018
(hectares) (hectares) (hectares) (hectares)
Grains and hay Barley ........................................................................ Corn for grain 1 ........................................................... Corn for silage ........................................................... Hay, all 2 .................................................................... Alfalfa ..................................................................... All other .................................................................. Oats ........................................................................... Proso millet ................................................................ Rice ........................................................................... Rye ............................................................................ Sorghum for grain 1 .................................................... Sorghum for silage ..................................................... Wheat, all 2 ................................................................ Winter .................................................................... Durum .................................................................... Other spring ........................................................... Oilseeds Canola ....................................................................... Cottonseed ................................................................ Flaxseed .................................................................... Mustard seed ............................................................. Peanuts ..................................................................... Rapeseed .................................................................. Safflower .................................................................... Soybeans for beans ................................................... Sunflower ................................................................... Cotton, tobacco, and sugar crops Cotton, all 2 ................................................................ Upland ................................................................... American Pima ....................................................... Sugarbeets ................................................................ Sugarcane ................................................................. Tobacco ..................................................................... Dry beans, peas, and lentils Austrian winter peas .................................................. Dry edible beans ........................................................ Chickpeas 2 ............................................................ Large ................................................................... Small .................................................................... Dry edible peas .......................................................... Lentils ........................................................................ Wrinkled seed peas ................................................... Potatoes and miscellaneous Hops .......................................................................... Maple syrup ............................................................... Mushrooms ................................................................ Peppermint oil ............................................................ Potatoes, all 2 ............................................................. Spring .................................................................... Summer ................................................................. Fall ......................................................................... Spearmint oil .............................................................. Sweet potatoes .......................................................... Taro (Hawaii) .............................................................
1,004,040
36,489,680 (NA) (NA) (NA) (NA)
1,047,340 193,440 996,750 793,600
2,276,790 (NA)
18,620,600 13,231,740
933,620 4,455,230
840,540 (X)
122,620 41,680
757,010 4,090
65,560 36,479,570
567,780
5,104,150 5,001,970
102,180 457,790
(NA) (NA)
10,720 846,610 250,420 177,780 72,640
456,490 446,780
(NA)
(NA) (NA) (NA) (NA)
418,040 23,470 27,640
366,930 (NA)
65,400 (NA)
1,031,550
36,069,210
(NA) (NA) (NA)
1,169,150 198,300
1,191,000 798,050
2,444,330
19,352,680 13,246,310
763,650 5,342,720
831,030 (X)
67,990 37,030
577,290 2,190
76,890 36,242,820
591,250
5,682,660 5,582,290
100,360 455,030
(NA) (NA)
6,680 831,230 331,720 246,250 85,470
350,060 317,680
(NA) (NA) (NA)
414,280 20,230 25,090
368,960
64,550
790,760
33,469,080 2,603,780
21,765,850 6,702,880
15,062,970 324,160 163,490 960,730 115,740
2,041,660 114,930
15,210,680 10,235,010
864,420 4,111,250
810,190 (X)
110,080 38,610
718,570 3,930
57,950 36,228,660
544,190
4,492,220 4,390,890
101,330 450,870 365,880 130,100
3,800 814,520 242,530 171,790 70,740
425,130 413,590
(NA)
21,560 (NA) (NA)
24,440 414,770 23,350 26,510
364,910 9,020
64,470 140
828,000
33,091,500
22,285,470 7,021,780
15,263,690 408,330
1,174,410
142,860 2,141,620
16,007,920 10,042,790
745,030 5,220,100
815,900 (X)
64,750 34,680
561,510 2,060
73,250 35,961,560
569,080
4,271,260 4,171,950
99,310 443,700 373,530 123,420
4,820 804,120 263,570 181,790 81,790
333,670 306,760
22,400 (NA) (NA)
410,150 20,070 24,080
366,000
63,620
See footnote(s) at end of table. --continued

Crop Production (September 2018) 23 USDA, National Agricultural Statistics Service
Crop Area Planted and Harvested, Yield, and Production in Metric Units – United States: 2017 and 2018 (continued) [Data are the latest estimates available, either from the current report or from previous reports. Current year estimates are for the full 2018 crop year. Blank data cells indicate estimation period has not yet begun]
Crop Yield per hectare Production
2017 2018 2017 2018
(metric tons) (metric tons) (metric tons) (metric tons)
Grains and hay Barley ..................................................................................... Corn for grain .......................................................................... Corn for silage ........................................................................ Hay, all 2 ................................................................................. Alfalfa ................................................................................. All other .............................................................................. Oats ........................................................................................ Proso millet ............................................................................. Rice ........................................................................................ Rye ......................................................................................... Sorghum for grain ................................................................... Sorghum for silage .................................................................. Wheat, all 2 ............................................................................. Winter ................................................................................. Durum ................................................................................. Other spring ........................................................................ Oilseeds Canola .................................................................................... Cottonseed ............................................................................. Flaxseed ................................................................................. Mustard seed .......................................................................... Peanuts .................................................................................. Rapeseed ............................................................................... Safflower ................................................................................ Soybeans for beans ................................................................ Sunflower ............................................................................... Cotton, tobacco, and sugar crops Cotton, all 2 ............................................................................. Upland ................................................................................ American Pima ................................................................... Sugarbeets ............................................................................. Sugarcane .............................................................................. Tobacco .................................................................................. Dry beans, peas, and lentils Austrian winter peas ............................................................... Dry edible beans ..................................................................... Chickpeas, all 2 ................................................................... Large ................................................................................ Small ................................................................................ Dry edible peas ....................................................................... Lentils ..................................................................................... Wrinkled seed peas ................................................................ Potatoes and miscellaneous Hops ....................................................................................... Maple syrup ............................................................................ Mushrooms ............................................................................. Peppermint oil ......................................................................... Potatoes, all 2 ......................................................................... Spring ................................................................................. Summer .............................................................................. Fall ..................................................................................... Spearmint oil .......................................................................... Sweet potatoes ....................................................................... Taro (Hawaii) ..........................................................................
3.91
11.08 44.72 5.48 7.45 4.60 2.21 2.02 8.41 2.13 4.53
29.77 3.11 3.38 1.73 2.76
1.75 (X)
0.89 0.71 4.57 2.40 1.41 3.30 1.81
1.01 1.00 1.50
71.08 82.41 2.48
1.49 2.00 1.29 1.31 1.26 1.51 0.82 (NA)
2.20 (NA) (NA) 0.11
48.34 38.44 37.10 49.79 0.14
25.08 11.80
4.11
11.38
5.23 7.46 4.20 2.33
8.48
4.46
3.19 3.22 2.68 3.20
(X)
4.65
3.55
1.00 0.99 1.69
73.60 79.53 2.34
1.38 2.03
1.89 1.30
2.14 (NA) (NA)
39.66 37.20
3,090,010
370,960,390 116,442,600 119,253,970 49,956,850 69,297,120
716,910 330,370
8,084,290 246,290
9,241,760 3,421,900
47,370,880 34,548,410
1,494,380 11,328,090
1,414,610 5,825,940
97,590 27,330
3,281,110 9,410
81,600 119,518,490
983,720
4,555,340 4,403,040
152,300 32,046,300 30,153,010
322,120
5,670 1,625,900
313,210 224,300 88,900
643,060 339,380 16,190
47,340 21,360
423,360 2,620
20,050,330 897,660 983,340
18,169,320 1,270
1,616,880 1,670
3,400,330
376,615,270
116,576,870 52,415,320 64,161,550
953,170
9,955,580
9,561,890
51,077,720 32,364,690 1,998,490
16,714,530
5,584,630
2,612,670
127,726,200
4,285,250 4,117,390
167,870 32,657,740 29,706,670
288,830
6,620 1,630,120
629,310 398,570
47,940 20,800
416,050
796,150 895,840
(NA) Not available. (X) Not applicable. 1 Area planted for all purposes. 2 Total may not add due to rounding.

24 Crop Production (September 2018) USDA, National Agricultural Statistics Service
Fruits and Nuts Production in Domestic Units – United States: 2017 and 2018 [Data are the latest estimates available, either from the current report or from previous reports. Current year estimates are for the full 2018 crop year, except citrus which is for the 2017-2018 season. Blank data cells indicate estimation period has not yet begun]
Crop Production
2017 2018
Citrus 1 Grapefruit .............................................................................................. 1,000 tons Lemons ................................................................................................. 1,000 tons Oranges ................................................................................................ 1,000 tons Tangerines and mandarins .................................................................... 1,000 tons Noncitrus Apples, commercial ......................................................................... million pounds Apricots .......................................................................................................... tons Avocados ....................................................................................................... tons Bananas (Hawaii) ............................................................................. 1,000 pounds Blackberries (Oregon) ...................................................................... 1,000 pounds Blueberries, Cultivated ..................................................................... 1,000 pounds Blueberries, Wild (Maine) ................................................................. 1,000 pounds Boysenberries (Oregon) ................................................................... 1,000 pounds Cherries, Sweet ............................................................................................. tons Cherries, Tart .................................................................................. million pounds Coffee (Hawaii) ................................................................................ 1,000 pounds Cranberries .................................................................................................. barrel Dates ............................................................................................................. tons Figs (California) .............................................................................................. tons Grapes ........................................................................................................... tons Kiwifruit (California) ........................................................................................ tons Nectarines ...................................................................................................... tons Olives (California) .......................................................................................... tons Papayas (Hawaii) ............................................................................. 1,000 pounds Peaches ......................................................................................................... tons Pears ............................................................................................................. tons Plums (California) .......................................................................................... tons Prunes (California) ......................................................................................... tons Raspberries, all ............................................................................... 1,000 pounds Strawberries ........................................................................................... 1,000 cwt Nuts and miscellaneous Almonds, shelled (California) ........................................................... 1,000 pounds Hazelnuts, in-shell (Oregon) ........................................................................... tons Macadamias (Hawaii) ....................................................................... 1,000 pounds Pecans, in-shell ................................................................................ 1,000 pounds Pistachios (California) ...................................................................... 1,000 pounds Walnuts, in-shell (California) .......................................................................... tons
698 882
5,088 1,029
11,406.0 45,650
146,310 6,660
40,250 521,660 67,800 1,640
437,550
259.5 25,416
8,371,950 43,320 31,200
7,363,260 33,600
157,850 192,300 25,600
696,650 737,450 141,000 105,000 233,910
31,991.5
2,270,000 32,000 49,000
293,850 600,300 630,000
517 888
3,919 804
11,452.2 39,800
319,900
352.7
8,634,000
7,659,000
732,050 739,200
80,000
31,764.9
2,450,000 52,000
690,000
1 Production years are 2016-2017 and 2017-2018.

Crop Production (September 2018) 25 USDA, National Agricultural Statistics Service
Fruits and Nuts Production in Metric Units – United States: 2017 and 2018 [Data are the latest estimates available, either from the current report or from previous reports. Current year estimates are for the full 2018 crop year, except citrus which is for the 2017-2018 season. Blank data cells indicate estimation period has not yet begun]
Crop Production
2017 2018
(metric tons) (metric tons)
Citrus 1 Grapefruit ............................................................................................................. Lemons ................................................................................................................ Oranges ................................................................................................................ Tangerines and mandarins ................................................................................... Noncitrus Apples, commercial .............................................................................................. Apricots ................................................................................................................ Avocados .............................................................................................................. Bananas (Hawaii) ................................................................................................. Blackberries (Oregon) ........................................................................................... Blueberries, Cultivated .......................................................................................... Blueberries, Wild (Maine) ...................................................................................... Boysenberries (Oregon) ........................................................................................ Cherries, Sweet .................................................................................................... Cherries, Tart ........................................................................................................ Coffee (Hawaii) ..................................................................................................... Cranberries ........................................................................................................... Dates .................................................................................................................... Figs (California) .................................................................................................... Grapes ................................................................................................................. Kiwifruit (California) ............................................................................................... Nectarines ............................................................................................................ Olives (California) ................................................................................................. Papayas (Hawaii) ................................................................................................. Peaches ............................................................................................................... Pears .................................................................................................................... Plums (California) ................................................................................................. Prunes (California) ................................................................................................ Raspberries, all ..................................................................................................... Strawberries ......................................................................................................... Nuts and miscellaneous Almonds, shelled (California) ................................................................................ Hazelnuts, in-shell (Oregon) ................................................................................. Macadamias (Hawaii) ........................................................................................... Pecans, in-shell .................................................................................................... Pistachios (California) ........................................................................................... Walnuts, in-shell (California) .................................................................................
633,210 800,140
4,615,760 933,490
5,173,670 41,410
132,730 3,020
18,260 236,620 30,750
740 396,940
117,710 11,530
379,750 39,300 28,300
6,679,840 30,480
143,200 174,450 11,610
631,990 669,000 127,910 95,250
106,100 1,451,110
1,029,650 29,030 22,230
133,290 272,290 571,530
469,010 805,580
3,555,260 729,380
5,194,630 36,110
290,210
159,980
391,630
6,948,130
664,100 670,590
72,570
1,440,830
1,111,300 47,170
625,960
1 Production years are 2016-2017 and 2017-2018.

26 Crop Production (September 2018) USDA, National Agricultural Statistics Service
Corn for Grain Objective Yield Data
The National Agricultural Statistics Service is conducting objective yield surveys in 10 corn-producing States during
2018. Randomly selected plots in corn for grain fields are visited monthly from August through harvest to obtain specific
counts and measurements. Data in these tables are rounded actual field counts from this survey.
Corn for Grain Plant Population per Acre – Selected States: 2014-2018 [Blank data cells indicate estimation period has not yet begun]
State and month
2014 2015 2016 2017 2018 State
and month 2014 2015 2016 2017 2018
(number) (number) (number) (number) (number) (number) (number) (number) (number) (number)
Illinois September ...... October ........... November ....... Final ................ Indiana September ...... October ........... November ....... Final ................ Iowa September ...... October ........... November ....... Final ................ Kansas September ...... October ........... November ....... Final ................ Minnesota September ...... October ........... November ....... Final ................ Missouri September ...... October ........... November ....... Final ................
30,900 30,800 30,700 30,700
31,200 31,000 30,850 30,850
30,850 30,800 30,800 30,800
23,750 23,550 23,550 23,550
31,400 31,350 31,150 31,250
27,650 27,400 27,500 27,500
31,800 31,750 31,750 31,750
30,400 30,100 30,000 29,950
31,500 31,450 31,450 31,450
23,400 23,750 23,800 23,800
30,650 30,750 30,750 30,750
27,900 27,600 27,600 27,600
31,100 31,100 31,100 31,100
30,200 29,950 29,800 29,800
31,250 31,050 31,050 31,050
22,550 22,550 22,550 22,550
30,800 30,700 30,550 30,550
27,300 27,750 27,800 27,800
30,800 30,900 30,950 30,950
29,550 29,350 29,200 29,200
31,300 31,150 31,150 31,150
22,050 22,100 22,300 22,300
30,750 30,550 30,600 30,600
27,850 27,850 27,950 27,950
32,000
30,450
31,350
22,600
30,950
28,500
Nebraska All corn September ... October ........ November .... Final ............. Irrigated September ... October ........ November .... Final ............. Non-irrigated September ... October ........ November .... Final ............. Ohio September ..... October .......... November ...... Final ............... South Dakota September ..... October .......... November ...... Final ............... Wisconsin September ..... October .......... November ...... Final ............... 10 State September ..... October .......... November ...... Final ...............
26,450 26,450 26,200 26,200
28,850 28,850 28,700 28,700
22,650 22,550 22,250 22,250
29,600 29,700 29,600 29,600
24,550 24,250 24,150 24,150
30,000 29,900 30,000 30,050
29,200 29,100 29,000 29,050
26,650 26,750 26,700 26,700
29,100 29,300 29,250 29,250
23,500 23,550 23,550 23,550
30,000 30,000 29,950 29,950
26,350 26,250 26,200 26,200
29,900 29,700 29,450 29,450
29,550 29,500 29,450 29,450
25,900 25,950 26,000 26,000
28,200 28,200 28,300 28,300
22,900 23,000 23,000 23,000
30,250 30,100 30,250 30,250
26,200 26,100 26,000 26,000
30,100 29,900 29,800 29,800
29,050 28,950 28,950 28,950
25,950 25,800 25,700 25,700
29,050 29,000 28,750 28,750
22,500 22,200 22,250 22,250
29,250 29,150 29,100 29,100
26,250 26,200 26,200 26,200
29,450 29,100 29,150 29,100
28,800 28,700 28,700 28,700
27,100
30,300
23,350
30,550
27,000
31,000
29,500
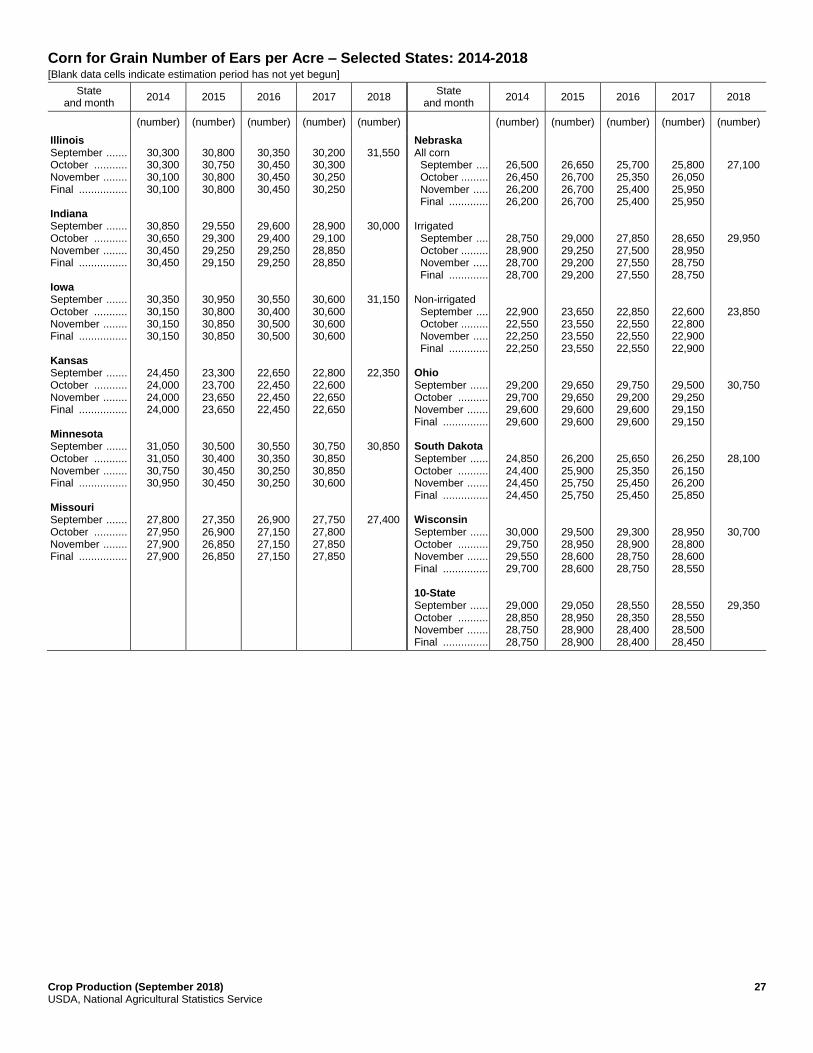
Crop Production (September 2018) 27 USDA, National Agricultural Statistics Service
Corn for Grain Number of Ears per Acre – Selected States: 2014-2018 [Blank data cells indicate estimation period has not yet begun]
State and month
2014 2015 2016 2017 2018 State
and month 2014 2015 2016 2017 2018
(number) (number) (number) (number) (number) (number) (number) (number) (number) (number)
Illinois September ....... October ........... November ........ Final ................ Indiana September ....... October ........... November ........ Final ................ Iowa September ....... October ........... November ........ Final ................ Kansas September ....... October ........... November ........ Final ................ Minnesota September ....... October ........... November ........ Final ................ Missouri September ....... October ........... November ........ Final ................
30,300 30,300 30,100 30,100
30,850 30,650 30,450 30,450
30,350 30,150 30,150 30,150
24,450 24,000 24,000 24,000
31,050 31,050 30,750 30,950
27,800 27,950 27,900 27,900
30,800 30,750 30,800 30,800
29,550 29,300 29,250 29,150
30,950 30,800 30,850 30,850
23,300 23,700 23,650 23,650
30,500 30,400 30,450 30,450
27,350 26,900 26,850 26,850
30,350 30,450 30,450 30,450
29,600 29,400 29,250 29,250
30,550 30,400 30,500 30,500
22,650 22,450 22,450 22,450
30,550 30,350 30,250 30,250
26,900 27,150 27,150 27,150
30,200 30,300 30,250 30,250
28,900 29,100 28,850 28,850
30,600 30,600 30,600 30,600
22,800 22,600 22,650 22,650
30,750 30,850 30,850 30,600
27,750 27,800 27,850 27,850
31,550
30,000
31,150
22,350
30,850
27,400
Nebraska All corn September .... October ......... November ..... Final ............. Irrigated September .... October ......... November ..... Final ............. Non-irrigated September .... October ......... November ..... Final ............. Ohio September ...... October .......... November ....... Final ............... South Dakota September ...... October .......... November ....... Final ............... Wisconsin September ...... October .......... November ....... Final ............... 10-State September ...... October .......... November ....... Final ...............
26,500 26,450 26,200 26,200
28,750 28,900 28,700 28,700
22,900 22,550 22,250 22,250
29,200 29,700 29,600 29,600
24,850 24,400 24,450 24,450
30,000 29,750 29,550 29,700
29,000 28,850 28,750 28,750
26,650 26,700 26,700 26,700
29,000 29,250 29,200 29,200
23,650 23,550 23,550 23,550
29,650 29,650 29,600 29,600
26,200 25,900 25,750 25,750
29,500 28,950 28,600 28,600
29,050 28,950 28,900 28,900
25,700 25,350 25,400 25,400
27,850 27,500 27,550 27,550
22,850 22,550 22,550 22,550
29,750 29,200 29,600 29,600
25,650 25,350 25,450 25,450
29,300 28,900 28,750 28,750
28,550 28,350 28,400 28,400
25,800 26,050 25,950 25,950
28,650 28,950 28,750 28,750
22,600 22,800 22,900 22,900
29,500 29,250 29,150 29,150
26,250 26,150 26,200 25,850
28,950 28,800 28,600 28,550
28,550 28,550 28,500 28,450
27,100
29,950
23,850
30,750
28,100
30,700
29,350

28 Crop Production (September 2018) USDA, National Agricultural Statistics Service
Soybean Objective Yield Data
The National Agricultural Statistics Service is conducting objective yield surveys in 11 soybean-producing States during
2018. Randomly selected plots in soybean fields are visited monthly from August through harvest to obtain specific
counts and measurements. Data in these tables are actual field counts from this survey.
Soybean Pods with Beans per 18 Square Feet – Selected States: 2014-2018 [Blank data cells indicate estimation period has not yet begun]
State and month
2014 2015 2016 2017 2018 State
and month 2014 2015 2016 2017 2018
(number) (number) (number) (number) (number) (number) (number) (number) (number) (number)
Arkansas September ...... October ........... November ....... Final ................ Illinois September ...... October ........... November ....... Final ................ Indiana September ...... October ........... November ....... Final ................ Iowa September ...... October ........... November ....... Final ................ Kansas September ...... October ........... November ....... Final ................ Minnesota September ...... October ........... November ....... Final ................
1,925 1,960 1,999 1,999
1,922 1,913 1,964 1,968
1,518 1,634 1,661 1,660
1,621 1,690 1,772 1,768
1,303 1,384 1,428 1,453
1,414 1,431 1,434 1,434
1,729 1,737 1,813 1,818
1,980 2,052 2,086 2,079
1,641 1,703 1,691 1,691
1,779 1,805 1,834 1,834
1,285 1,602 1,715 1,715
1,637 1,644 1,612 1,612
1,884 1,805 1,820 1,826
1,969 2,109 2,193 2,197
1,683 1,775 1,873 1,873
1,808 1,801 1,861 1,890
1,467 1,643 1,720 1,737
1,614 1,625 1,658 1,658
1,992 1,898 2,039 2,075
1,917 1,886 1,947 1,947
1,795 1,772 1,774 1,774
1,644 1,670 1,717 1,735
1,487 1,472 1,561 1,561
1,359 1,407 1,480 1,480
1,841
2,132
1,880
1,823
1,552
1,605
Missouri September ..... October .......... November ...... Final ............... Nebraska September ..... October .......... November ...... Final ............... North Dakota September ..... October .......... November ...... Final ............... Ohio September ..... October .......... November ...... Final ............... South Dakota September ..... October .......... November ...... Final ............... 11-State September ..... October .......... November ...... Final ...............
2,050 1,969 2,055 2,043
1,634 1,707 1,743 1,743
1,281 1,266 1,454 1,459
1,882 1,835 1,796 1,796
1,533 1,485 1,498 1,501
1,651 1,667 1,719 1,720
1,612 1,755 1,869 1,899
1,816 1,863 1,884 1,884
1,321 1,330 1,337 1,337
1,621 1,691 1,776 1,776
1,541 1,557 1,563 1,563
1,672 1,731 1,763 1,764
1,881 2,006 2,123 2,164
1,947 2,036 2,074 2,074
1,395 1,444 1,442 1,470
1,773 1,715 1,782 1,782
1,561 1,639 1,709 1,665
1,741 1,800 1,862 1,870
2,041 2,172 2,253 2,239
1,653 1,795 1,853 1,853
1,406 1,430 1,465 1,451
1,765 1,714 1,828 1,823
1,511 1,472 1,457 1,457
1,678 1,692 1,751 1,752
1,777
1,736
1,418
2,019
1,649
1,786

Crop Production (September 2018) 29 USDA, National Agricultural Statistics Service
Cotton Objective Yield Data
The National Agricultural Statistics Service conducted objective yield surveys in six cotton-producing States during 2018.
Randomly selected plots in cotton fields were visited monthly from August through harvest to obtain specific counts and
measurements. Data in this table are actual field counts from this survey.
Cotton Cumulative Boll Counts – Selected States: 2014-2018 [Includes small bolls (less than one inch in diameter), large unopened bolls (at least one inch in diameter), open bolls, partially opened bolls, and burrs per 40 feet of row. November, December, and Final exclude small bolls. Blank data cells indicate estimation period has not yet begun]
State and month 2014 2015 2016 2017 2018
(number) (number) (number) (number) (number)
Arkansas September ....................................... October ........................................... November ........................................ December ........................................ Final ................................................ Georgia September ....................................... October ........................................... November ........................................ December ........................................ Final ................................................ Louisiana September ....................................... October ........................................... November ........................................ December ........................................ Final ................................................ Mississippi September ....................................... October ........................................... November ........................................ December ........................................ Final ................................................ North Carolina September ....................................... October ........................................... November ........................................ December ........................................ Final ................................................ Texas September ....................................... October ........................................... November ........................................ December ........................................ Final ................................................ 6-State September ....................................... October ........................................... November ........................................ December ........................................ Final ................................................
910 741 771 773 773
660 660 717 718 719
745 876 877 877 877
843 808 861 861 861
604 629 765 764 764
485 373 453 461 482
564 487 561 566 587
763 769 856 856 856
645 630 748 759 759
676 776 794 793 793
887 839 898 898 898
551 620 624 632 632
566 442 481 492 495
601 518 571 581 583
800 769 779 779 779
562 668 719 725 725
654 760 784 784 784
953 942 974 974 974
558 599 660 660 660
467 474 528 547 546
532 554 604 618 618
911 839 825 825 825
593 608 680 684 684
648 667 665 665 665
904 810 804 797 797
637 705 769 769 769
592 602 603 615 614
633 635 649 656 656
891
605
759
871
601
570
627
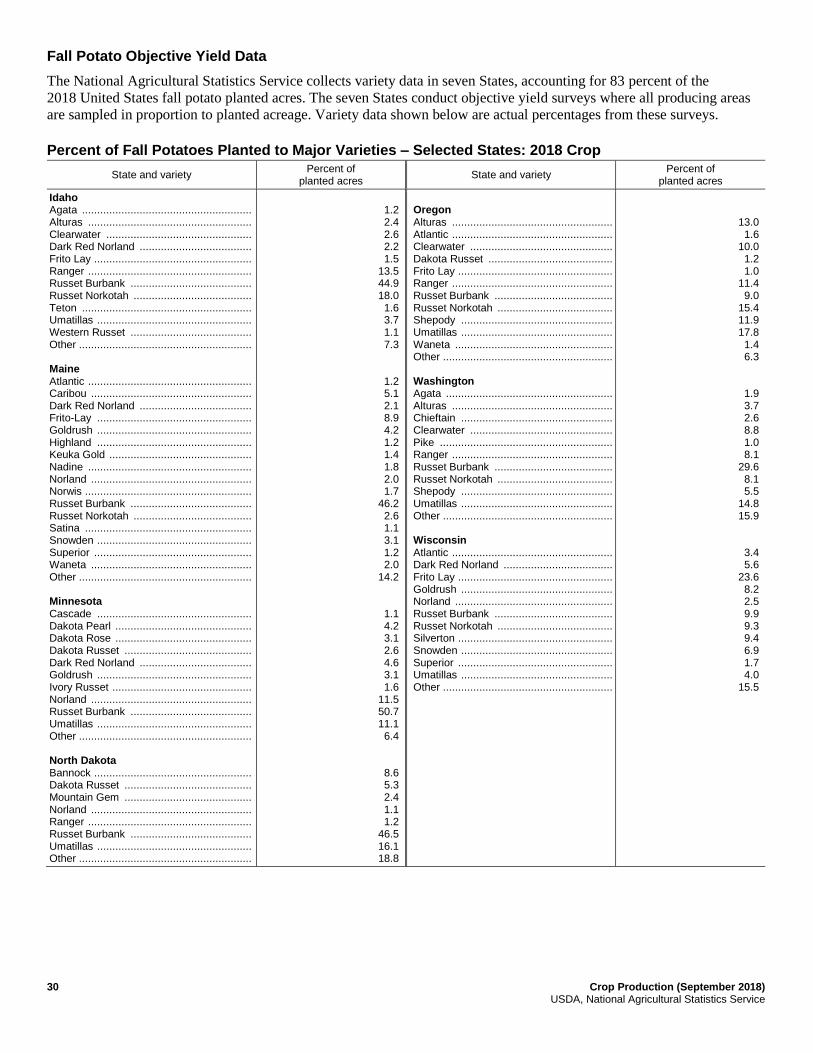
30 Crop Production (September 2018) USDA, National Agricultural Statistics Service
Fall Potato Objective Yield Data The National Agricultural Statistics Service collects variety data in seven States, accounting for 83 percent of the
2018 United States fall potato planted acres. The seven States conduct objective yield surveys where all producing areas
are sampled in proportion to planted acreage. Variety data shown below are actual percentages from these surveys.
Percent of Fall Potatoes Planted to Major Varieties – Selected States: 2018 Crop
State and variety Percent of
planted acres State and variety
Percent of planted acres
Idaho Agata ........................................................ Alturas ...................................................... Clearwater ................................................ Dark Red Norland ..................................... Frito Lay .................................................... Ranger ...................................................... Russet Burbank ........................................ Russet Norkotah ....................................... Teton ........................................................ Umatillas ................................................... Western Russet ........................................ Other ......................................................... Maine Atlantic ...................................................... Caribou ..................................................... Dark Red Norland ..................................... Frito-Lay ................................................... Goldrush ................................................... Highland ................................................... Keuka Gold ............................................... Nadine ...................................................... Norland ..................................................... Norwis ....................................................... Russet Burbank ........................................ Russet Norkotah ....................................... Satina ....................................................... Snowden ................................................... Superior .................................................... Waneta ..................................................... Other ......................................................... Minnesota Cascade ................................................... Dakota Pearl ............................................. Dakota Rose ............................................. Dakota Russet .......................................... Dark Red Norland ..................................... Goldrush ................................................... Ivory Russet .............................................. Norland ..................................................... Russet Burbank ........................................ Umatillas ................................................... Other ......................................................... North Dakota Bannock .................................................... Dakota Russet .......................................... Mountain Gem .......................................... Norland ..................................................... Ranger ...................................................... Russet Burbank ........................................ Umatillas ................................................... Other .........................................................
1.2 2.4 2.6 2.2 1.5
13.5 44.9 18.0 1.6 3.7 1.1 7.3
1.2 5.1 2.1 8.9 4.2 1.2 1.4 1.8 2.0 1.7
46.2 2.6 1.1 3.1 1.2 2.0
14.2
1.1 4.2 3.1 2.6 4.6 3.1 1.6
11.5 50.7 11.1 6.4
8.6 5.3 2.4 1.1 1.2
46.5 16.1 18.8
Oregon Alturas ..................................................... Atlantic ..................................................... Clearwater ............................................... Dakota Russet ......................................... Frito Lay ................................................... Ranger ..................................................... Russet Burbank ....................................... Russet Norkotah ...................................... Shepody .................................................. Umatillas .................................................. Waneta .................................................... Other ........................................................ Washington Agata ....................................................... Alturas ..................................................... Chieftain .................................................. Clearwater ............................................... Pike ......................................................... Ranger ..................................................... Russet Burbank ....................................... Russet Norkotah ...................................... Shepody .................................................. Umatillas .................................................. Other ........................................................ Wisconsin Atlantic ..................................................... Dark Red Norland .................................... Frito Lay ................................................... Goldrush .................................................. Norland .................................................... Russet Burbank ....................................... Russet Norkotah ...................................... Silverton ................................................... Snowden .................................................. Superior ................................................... Umatillas .................................................. Other ........................................................
13.0 1.6
10.0 1.2 1.0
11.4 9.0
15.4 11.9 17.8 1.4 6.3
1.9 3.7 2.6 8.8 1.0 8.1
29.6 8.1 5.5
14.8 15.9
3.4 5.6
23.6 8.2 2.5 9.9 9.3 9.4 6.9 1.7 4.0
15.5

Crop Production (September 2018) 31 USDA, National Agricultural Statistics Service
Percent of Fall Potatoes Planted to Major Varieties – Seven-State Total: 2018 Crop [The Seven State total includes Idaho, Maine, Minnesota, North Dakota, Oregon, Washington, and Wisconsin]
Variety Percent of
planted acres Variety
Percent of planted acres
Agata ..................................................... Alturas ................................................... Atlantic .................................................. Bannock ................................................ Bintje ..................................................... Blushing Belle ........................................ Caribou .................................................. Cascade ................................................ Challenger ............................................. Chieftain ................................................ Ciklamen ............................................... Classic ................................................... Clearwater ............................................. Colorado Rose ....................................... Dakota Pearl .......................................... Dakota Rose .......................................... Dakota Russet ....................................... Dark Red Norland .................................. Frito Lay ................................................ Goldrush ................................................ Highland ................................................ Innate .................................................... Ivory Russet .......................................... Kennebec .............................................. Keuka Gold ............................................
0.9 2.3 0.6 1.3 0.2 0.1 0.5 0.1 0.1 0.7 0.3 0.1 3.3 0.1 0.3 0.2 0.8 1.9 3.5 1.3 0.1 0.2 0.3 0.1 0.1
Milva ..................................................... Mountain Gem ...................................... Nadine .................................................. Natascha .............................................. Norland ................................................. Norwis .................................................. Payette Russet ..................................... Pike ...................................................... Ranger ................................................. Red La Soda ........................................ Rosara .................................................. Russet Burbank .................................... Russet Norkotah ................................... Sangre .................................................. Satina ................................................... Shepody ............................................... Silverton ............................................... Snowden .............................................. Superior ................................................ Teton .................................................... Umatillas ............................................... Waneta ................................................. Western Russet .................................... Yukon Gold ........................................... Other ....................................................
0.1 0.5 0.2 0.1 1.1 0.2 0.1 0.3 7.9 0.1 0.1
37.8 10.8 0.1 0.3 1.7 0.8 1.0 0.3 0.6 8.1 0.2 0.4 0.1 7.7

32 Crop Production (September 2018) USDA, National Agricultural Statistics Service

Crop Production (September 2018) 33 USDA, National Agricultural Statistics Service
August Weather Summary
Nearly all of the central and eastern United States received abundant August rainfall, generally benefiting rangeland,
pastures, and immature summer crops. Excessive rain fell, however, in parts of the upper Midwest, triggering some
late-month flooding. By September 2, approximately two-thirds of the Nation’s corn (67 percent) and soybeans
(66 percent) were rated in good to excellent condition. However, rain arrived too late to significantly benefit corn in the
drought-affected southwestern Corn Belt, where Missouri’s crop was rated just 29 percent good to excellent (and
40 percent very poor to poor).
Meanwhile, August rain largely bypassed a few areas, including Deep South Texas, parts of the southern Atlantic States,
northern New England, and the northernmost Plains. On September 2, topsoil moisture was rated 90 percent very short to
short in Maine. Other Central and Eastern States reporting substantial topsoil moisture shortages in early September
included Texas (68 percent very short to short), Vermont (65 percent), and South Carolina (54 percent).
Dryness was much more widespread across the West, leaving topsoil moisture at least two-thirds very short to short by
September 2 in Oregon (98 percent), Utah (76 percent), Idaho (74 percent), California (70 percent), and Washington
(68 percent). The surface dryness, accompanied by late-summer heat, contributed to the spread of dozens of Western
wildfires, which burned more than 2 million acreage of vegetation in August alone. Through the end of August, wildfires
had charred more than 6.8 million acres nationally, nearly 130 percent of the 10-year average.
Western heat contrasted with near- or below-normal August temperatures from the northern and central Plains into the
mid-South and Southeast. Near- or slightly above-normal Midwestern temperatures promoted rapid crop development and
generally favored corn and soybeans during their respective grain- and pod-filling stages. By September 2, more than
one-fifth (22 percent) of the Nation’s corn was fully mature, twice the 5-year average. At the same time, 16 percent of the
soybeans were dropping leaves, versus 9 percent on average. Elsewhere, much of Texas experienced above-normal
August temperatures, while unusually hot weather gripped the Northeast.
August Agricultural Summary August was cooler than average for parts of the Nation, especially in the Great Plains, where average temperatures for the
month were 2°F or more below normal. Temperatures were also cooler than normal in the Northern Rocky Mountains and
Southeast for nearly all of the month. However, parts of the Southwest and New England were warmer than average for
the month with temperatures 4°F or more above normal. Precipitation fell heaviest in the eastern half of the Nation, with
some areas receiving 4 inches of rain or more. In contrast, much of the Pacific Coast and Southwest remained moderately
to extremely dry, receiving less than 2 inches of rain.
By August 5, ninety-six percent of the corn acreage was at or beyond the silking stage, 4 percentage points ahead of both
last year and the 5-year average. Fifty-seven percent of the Nation’s corn acreage was at or beyond the dough stage by
August 5, eighteen percentage points ahead of last year and 20 percentage points ahead of the 5-year average. By
August 5, denting was evident in 12 percent of this year’s acreage, 6 percentage points ahead of both last year and the
5-year average. Forty-four percent of this year’s acreage was at or beyond the denting stage by August 19,
seventeen percentage points ahead of last year and 18 percentage points ahead of the 5-year average. All of the estimating
States, except Colorado and North Carolina, were ahead of their 5-year average pace in denting progress.
Ninety-six percent of the Nation’s corn acreage was at or beyond the dough stage by September 2, five percentage points
ahead of both last year and the 5-year average. Seventy-five percent of this year’s acreage was at or beyond the denting
stage by September 2, seventeen percentage points ahead of last year and 15 percentage points ahead of the 5-year
average. Twenty-two percent of the Nation’s corn acreage was mature by September 2, eleven percentage points ahead of
both last year and the 5-year average. Overall, 67 percent of the corn acreage was reported in good to excellent condition
on September 2, six percentage points higher than at the same time last year.
By August 5, ninety-two percent of the Nation’s soybean acreage was at or beyond the blooming stage, 3 percentage
points ahead of last year and 6 percentage points ahead of the 5-year average. Nationally, 75 percent of the Nation’s
soybean acreage was setting pods, 12 percentage points ahead of last year and 17 percentage points ahead of the 5-year
average. The percentage of the crop in the pod setting stage was at or ahead of the 5-year average in all estimating States,

34 Crop Production (September 2018) USDA, National Agricultural Statistics Service
except Michigan. By August 19, ninety-one percent of the Nation’s soybean acreage was at or beyond the pod setting
stage, 5 percentage points ahead of last year and 8 percentage points ahead of the 5-year average. Sixteen percent of the
Nation’s soybean acreage was at or beyond the leaf dropping stage by September 2, six percentage points ahead of last
year and 7 percentage points ahead of the 5-year average. As of September 2, sixty-six percent of the Nation’s soybean
acreage was rated in good to excellent condition, 5 percentage points above the same time last year.
Ninety percent of the 2018 winter wheat acreage was harvested by August 5, three percentage points behind last year and
2 percentage points behind the 5-year average. Winter Wheat harvest progressed quickly in Idaho, Montana, Oregon, and
Washington, advancing 21 percentage points or more during the week ending August 5. Only 4 of the 18 estimating States
had harvested less than 90 percent of the winter wheat acreage by August 5. Ninety-four percent of the 2018 winter wheat
acreage was harvested by August 12, three percentage points behind last year and 2 percentage points behind the 5-year
average. Winter Wheat harvest was complete or nearing completion in all estimating States, except Idaho, Montana, and
Washington. Ninety-seven percent of the 2018 winter wheat acreage was harvested by August 19, one percentage point
behind both last year and the 5-year average. Winter wheat harvest was nearing completion in all States, except Montana
and Washington. These two States were behind their 5-year average pace by 6 and 5 percentage points, respectively.
Ninety-two percent of the Nation’s cotton acreage had reached the squaring stage by August 5, identical to last year but
2 percentage points behind the 5-year average. By August 5, sixty percent of this year’s cotton acreage was setting bolls,
4 percentage points ahead of last year but 2 percentage points behind the 5-year average. By August 5, nine percent of the
Nation’s cotton had open bolls, 1 percentage point ahead of last year and 3 percentage points ahead of the 5-year average.
Boll setting was 86 percent complete by August 19, one percentage point behind last year but equal to the 5-year average.
By August 19, bolls were opening in 17 percent of the Nation’s cotton fields, 5 percentage points ahead of both last year
and the 5-year average. By September 2, boll setting was 96 percent complete, equal to both last year and the 5-year
average. Bolls were opening in 29 percent of the Nation’s cotton fields by September 2, five percentage points ahead of
last year and 3 percentage points ahead of the 5-year average. Overall, 41 percent of the cotton acreage was rated in good
to excellent condition as of September 2, twenty-four percentage points below the same time last year.
By August 5, sixty-nine percent of the Nation’s sorghum acreage was at or beyond the heading stage, 9 percentage points
ahead of last year and 7 percentage points ahead of the 5-year average. Heading development was nearing completion in
the Delta at that time. Thirty-one percent of the Nation’s sorghum acreage was at or beyond the coloring stage by
August 5, five percentage points ahead of last year but equal to the 5-year average. Coloring advanced by 24 percentage
points in Arkansas during the week ending August 5. By August 19, twenty-three percent of the Nation’s sorghum
acreage was considered mature, 2 percentage points behind last year and 4 percentage points behind the 5-year average. In
Arkansas, 83 percent of the 2018 sorghum acreage was mature at that time, 18 percentage points ahead of last year and
36 percentage points ahead of the 5-year average. Heading of this year’s sorghum acreage was 96 percent complete by
September 2, one percentage point ahead of both last year and the 5-year average. Sixty-nine percent of the Nation’s
sorghum acreage was at or beyond the coloring stage, 9 percentage points ahead of last year and 7 percentage points ahead
of the 5-year average. By September 2, thirty percent of the Nation’s sorghum acreage was considered mature,
1 percentage point behind last year and 3 percentage points behind the 5-year average. Progress was most advanced in the
Delta with 95 percent of the acreage mature in Arkansas and 100 percent mature in Louisiana, both ahead of the State’s
5-year average pace. By September 2, producers had harvested 22 percent of the Nation’s acreage, 1 percentage point
behind both last year and the 5-year average. Fifty-two percent of the Nation’s sorghum acreage was rated in good to
excellent condition as of September 2, eleven percentage points below the same time last year.
By August 5, eighty-two percent of the Nation’s rice acreage had reached the heading stage, 1 percentage point ahead of
last year and 12 percentage points ahead of the 5-year average at that time. Heading progress was ahead of the 5-year
average in all of the major rice-producing States, except California. By August 5, six percent of the Nation’s rice acreage
was harvested, 2 percentage points behind last year but 1 percentage point ahead of the 5-year average.
Ninety-five percent of the Nation’s rice acreage was headed by August 19, equal to last year but 4 percentage points ahead
of the 5-year average. Nationally, 15 percent of the rice acreage was harvested by August 19, equal to last year but
2 percentage point ahead of the 5-year average. Good weather conditions at that time in Louisiana and Texas allowed for
rice harvest to advance 10 percentage points and 16 percentage points, respectively. By September 2, thirty-one percent of
the Nation’s rice acreage was harvested, 3 percentage points ahead of last year and 5 percentage points ahead of the 5-year

Crop Production (September 2018) 35 USDA, National Agricultural Statistics Service
average. Overall, 75 percent of the Nation’s rice acreage was rated in good to excellent condition as of September 2,
four percentage points above the same time last year.
By August 5, fifty-one percent of the Nation’s oat acreage had been harvested, 3 percentage points ahead of last year and
2 percentage points ahead of the 5-year average. At that time, the percentage of oats harvested was at or ahead of the
5-year average in all estimating States, except Minnesota, North Dakota, and Pennsylvania. On August 5,
seventy-one percent of the Nation’s oat acreage was rated in good to excellent condition, 20 percentage points above the
same time last year. By August 19, eighty percent of the Nation’s oat acreage had been harvested, 4 percentage points
ahead of last year and 3 percentage points ahead of the 5-year average. Ninety-four percent of the Nation’s oat acreage
had been harvested by September 2, four percentage points ahead of last year and 3 percentage points ahead of the
5-year average. Harvesting of oats was complete or nearing completion in 6 of the 9 estimating States at that time.
Sixteen percent of the Nation’s barley acreage was harvested by August 5, six percentage points behind last year and
2 percentage points behind the 5-year average. Harvest progress in Minnesota was 18 percentage points ahead of the
5-year average at that time. Sixty-six percent of the Nation’s barley acreage was harvested by August 19, one percentage
point behind last year but 10 percentage points ahead of the 5-year average. Overall, 78 percent of the barley was reported
in good to excellent condition as of August 19, twenty-nine percentage points above the same time last year. By
September 2, barley producers had harvested 84 percent of the Nation’s barley acreage, 7 percentage points behind last
year but 1 percentage point ahead of the 5-year average. Progress was most advanced in Minnesota, with 99 percent of the
acreage harvested, and in North Dakota, with 94 percent of the acreage harvested, both ahead of the 5-year average pace.
By August 5, thirteen percent of the spring wheat was harvested, 9 percentage points behind last year and 1 percentage
point behind the 5-year average. By August 19, sixty percent of the Nation’s spring wheat acreage was harvested,
5 percentage points ahead of last year and 16 percentage points ahead of the 5-year average. Seventy-four percent of the
spring wheat acreage was reported in good to excellent condition as of August 19, forty percentage points above the same
time last year. As of September 2, eighty-seven percent of the Nation’s spring wheat acreage was harvested, equal to last
year but 12 percentage points ahead of the 5-year average.
Ninety percent of the Nation’s peanut acreage had reached the pegging stage by August 5, identical to last year but
1 percentage point behind the 5-year average. Ninety-four percent of the Nation’s peanut acreage was pegging by
August 12, with pegging nearing completion in 5 of the 8 estimating States. By August 19, ninety-seven percent of the
Nation’s peanut acreage was at or beyond pegging, 1 percentage point ahead of last year but equal to the 5-year average.
Overall, 75 percent of the peanut acreage was reported in good to excellent condition as of September 2, five percentage
points below the same time last year.
Crop Comments
Corn: The 2018 area harvested for grain is forecast at 81.8 million acres, unchanged from August but down 1 percent
from last year.
The September 1 corn objective yield data indicate the highest number of ears on record for the combined 10 objective
yield States (Illinois, Indiana, Iowa, Kansas, Minnesota, Missouri, Nebraska, Ohio, South Dakota, and Wisconsin).
At 14.8 billion bushels, 2018 corn production is forecast to be the second highest production on record for the
United States. The forecasted yield, at 181.3 bushels per acre is forecast to be the highest yield on record for the
United States. Record high yields are forecast for Alabama, Illinois, Indiana, Iowa, Maryland, Michigan, Nebraska,
New York, Ohio, South Dakota, Tennessee, and Wisconsin.
By August 5, ninety-six percent of the corn acreage was at or beyond the silking stage, 4 percentage points ahead of both
last year and the 5-year average. Fifty-seven percent of the Nation’s corn was at or beyond the dough stage, 18 percentage
points ahead of last year and 20 percentage points ahead of average. By August 5, denting was evident in 12 percent of
this year’s acreage, 6 percentage points ahead of both last year and the 5-year average. Overall, 71 percent of the corn was
reported in good to excellent condition as of August 5, eleven percentage points higher than at the same time last year.

36 Crop Production (September 2018) USDA, National Agricultural Statistics Service
By August 12, seventy-three percent of the Nation’s corn acreage was at or beyond the dough stage, 15 percentage points
ahead of last year and 17 percentage points ahead of the 5-year average. For the week ending August 12, advances of
17 percentage points or more were made in 11 of the 18 estimating States published in the weekly Crop Progress report.
By August 12, twenty-six percent of this year’s crop was denting, 11 percentage points ahead of last year and
13 percentage points ahead of the 5-year average.
Eighty-five percent of the Nation’s corn acreage was at or beyond the dough stage by August 19, eleven percentage points
ahead of last year and 13 percentage points ahead of the 5-year average. By August 19, forty-four percent of this year’s
acreage was at or beyond the denting stage, 17 percentage points ahead of last year and 18 percentage points ahead of the
5-year average. All of the estimating States published in the weekly Crop Progress report, except Colorado and
North Carolina, were ahead of their average pace in denting progress at that time. Overall, 68 percent of the corn was
reported in good to excellent condition, 6 percentage points higher than at the same time last year.
Ninety-two percent of the Nation’s corn acreage was at or beyond the dough stage by August 26, seven percentage points
ahead of last year and 8 percentage points ahead of the 5-year average. By August 26, sixty-one percent of this year’s
acreage was at or beyond the denting stage, 19 percentage points ahead of both last year and the 5-year average. Iowa,
Michigan, Nebraska, and Ohio had denting advances of 20 percentage points or more for the week ending August 26.
Ten percent of the Nation’s corn crop was mature by August 26, five percentage points ahead of both last year and the
5-year average. Kentucky, Missouri, North Carolina, and Tennessee had maturation advances of 20 percentage points or
more for the week ending August 26.
Ninety-six percent of the Nation’s corn acreage was at or beyond the dough stage by September 2, five percentage points
ahead of both last year and the 5-year average. By September 2, seventy-five percent of this year’s acreage was at or
beyond the denting stage, 17 percentage points ahead of last year and 15 percentage points ahead of the 5-year average.
Twenty-two percent of the Nation’s corn acreage was mature by September 2, eleven percentage points ahead of both last
year and the 5-year average. Illinois, Missouri, and Tennessee each had advances of 19 percentage points or more for the
week ending September 2. Overall, 67 percent of the corn acreage was reported in good to excellent condition as of
September 2, six percentage points higher than at the same time last year.
Sorghum: Production is forecast at 376 million bushels, up less than 1 percent from the August forecast and up 3 percent
from last year. Area harvested for grain is forecast at 5.29 million acres, unchanged from the previous forecast but up
5 percent from 2017. Based on September 1 conditions, the yield is forecast at 71.1 bushels per acre, 0.2 bushel higher
than the August forecast but 1.0 bushel below the 2017 yield of 72.1 bushels per acre. If realized, the expected yield in
Missouri and Nebraska will be a record high.
As of September 2, virtually all of the acreage was headed and 69 percent had reached the coloring stage, 9 percentage
points ahead of last year and 7 percentage points ahead of the 5-year average. Thirty percent of the acreage was
considered mature at that time, 1 percentage point behind last year and 3 percentage points behind the
5-year average. Twenty-two percent of the acreage was harvested by September 2, one percentage point behind both last
year and the 5-year average. Harvest was mainly limited to the three States of Arkansas, Louisiana, and Texas, but also
underway in Kansas, Missouri, and Oklahoma. Fifty-two percent of the acreage was rated in good to excellent condition
on September 2, eleven percentage points below the same time last year.
Rice: Production is forecast at 219 million cwt, up 4 percent from the August forecast and up 23 percent from 2017.
Based on a thorough review of all available data, planted area is now estimated at 2.94 million acres, up 4 percent from
the June estimate and up 19 percent from last year. Area for harvest is expected to total 2.90 million acres, up 4 percent
from the August forecast and up 22 percent from last year. Based on conditions as of September 1, the average
United States yield is forecast at 7,563 pounds per acre, up 40 pounds per acre from the August forecast and 56 pounds
per acre higher than the 2017 average yield of 7,507 pounds per acre.
As of September 2, thirty-one percent of the rice acreage was harvested, 3 percentage points ahead of last year and
5 percentage points ahead of the five-year average pace. Seventy-five percent of the rice crop was reported in good to
excellent condition on September 2, compared with 71 percent at the same time last year.

Crop Production (September 2018) 37 USDA, National Agricultural Statistics Service
Soybeans: Area for harvest in the United States is forecast at 88.9 million acres, unchanged from August but down
1 percent from 2017.
The September objective yield data for the combined 11 major soybean-producing States (Arkansas, Illinois, Indiana,
Iowa, Kansas, Minnesota, Missouri, Nebraska, North Dakota, Ohio, and South Dakota) indicate a higher pod count
compared with the previous year. Compared with final counts for 2017, pod counts are up in 6 of the 11 published States.
Ohio showed the greatest increase, up 196 pods per 18 square feet from the previous year. The largest decrease from the
2017 final pod count is expected in Missouri, down 462 pods per 18 square feet.
As of August 5, seventy-five percent of the soybean acreage was setting pods, 12 percentage points ahead of last year and
17 percentage points ahead of the 5-year average. Ninety-one percent of the acreage was at or beyond the pod setting
stage on August 19, five percentage points ahead of last year and 8 percentage points ahead of the 5-year average. By
September 2, sixteen percent of the soybean acreage was at or beyond the leaf dropping stage, 6 percentage points ahead
of last year and 7 percentage points ahead of the 5-year average.
As of September 2, sixty-six percent of the United States soybean acreage was rated in good to excellent condition,
5 percentage points above the same time in 2017. During the month of August, 9 of the 18 estimating States published in
the weekly Crop Progress report showed an increase in the percent of the acreage rated in the good to excellent
categories. However, lack of rain in North Dakota led to a decline of 21 percentage points in the good to excellent
categories during the month.
If realized, the forecasted yield will be a record high in Illinois, Indiana, Iowa, Kentucky, Mississippi, Nebraska,
New York, Ohio, Pennsylvania, and Tennessee.
Peanuts: Production is forecast at 5.76 billion pounds, down 5 percent from August and down 20 percent from 2017.
Acreage updates were made in several States based on a thorough review of all available data. Planted area, at
1.43 million acres, is down 5 percent from the June estimate and is 24 percent lower than the 2017 planted area. Harvested
area is expected to total 1.39 million acres, down 5 percent from the August forecast and down 22 percent from 2017.
Based on conditions as of September 1, the average yield for the United States is forecast at 4,151 pounds per acre, down
16 pounds per acre from August but 77 pounds per acre above the 2017 average yield. The largest yield increases from
last year are expected in Alabama, Florida, and Georgia. Record high yields are forecast in Alabama and Florida.
As of September 2, seventy-five percent of the United States acreage was rated in good to excellent condition, compared
with 80 percent at the same time last year.
Cotton: Acreage updates were made in several States based on a thorough review of all available data. Area planted to
Upland cotton is estimated at 13.8 million acres, up 4 percent from the June estimate and up 12 percent from 2017.
Upland planted area in Oklahoma will be highest since 1956 and Kansas planted area will be the highest on record.
Harvested area for the Nation is expected to total 10.3 million acres, down 5 percent from last year. Pima cotton planted
area is estimated at 248,000 acres, up 2 percent from June but down 2 percent from 2017. Expected harvested area, at
245,400 acres, is down 2 percent from the previous year.
As of September 2, ninety-six percent of the cotton acreage was setting bolls, equal to both last year and the 5-year
average. Bands of rain brought much needed precipitation to Texas during the month of August; however, drought
conditions remained in the High Plains. The Delta and Southeast regions received little to no rain during the month of
August. As of September 2, twenty-nine percent of the cotton acreage had bolls opening, 5 percentage points ahead of last
year and 3 percentage points ahead of the 5-year average. At that time, 41 percent of the cotton acreage was rated in good
to excellent condition, compared with 65 percent at the same time last year.
If realized, the forecasted yield for Upland cotton in Alabama and Missouri will be a record high.
Ginnings totaled 489,100 running bales prior to September 1, compared with 570,650 running bales ginned prior to the
same date last year.

38 Crop Production (September 2018) USDA, National Agricultural Statistics Service
Tobacco: The 2018 United States all tobacco production is forecast at 637 million pounds, down 10 percent from 2017.
Area harvested, at 304,980 acres, is 5 percent below last year. Yield for the 2018 crop year is forecast at 2,088 pounds per
acre, 121 pounds below last year.
Flue-cured tobacco production is expected to total 415 million pounds, down 10 percent from the 2017 crop.
North Carolina growers reported mostly good to fair crop conditions as of September 2, with some parts of the State
having received too much rain, while others were very dry.
Burley tobacco production is expected to total 129 million pounds, down 20 percent from last year. Industry experts
anticipate burley contract volume to be down with several tobacco warehouses not operating this year. As of September 2,
the burley crop in Kentucky was rated in mostly good to fair condition.
Lentils: Production of lentils is forecast at 8.79 million cwt, up 17 percent from a year ago. Planted area, at 785,000 acres,
is down 29 percent from last year, while harvested acreage, at 758,000 acres, is down 26 percent from 2017. The average
yield is expected to be 1,159 pounds per acre, up 427 pounds from last year’s drought-stricken crop.
In Montana, by June 3, ninety-six percent of the crop was planted. By the week ending September 2, eighty-seven percent
was harvested. In North Dakota, harvest was 28 percent complete by August 5, and by September 2, seventy-six percent
was harvested.
Dry edible peas: Production of dry edible peas is forecast at 13.9 million cwt, down 2 percent from last year. Planted
area, at 865,000 acres, and harvested area, at 824,500 acres, decreased by 23 percent and 22 percent, respectively. The
average United States yield is expected to be 1,683 pounds per acre, up 333 pounds from 2017.
In Montana, plantings began late as spring precipitation persisted and many fields had standing water until the final week
of May. The crop was 96 percent planted by the week ending June 3. By the week ending September 2, the crop was
49 percent harvested, compared with 85 percent last year. In North Dakota, by September 2, ninety-seven percent of the
crop was harvested, ahead of last year’s pace of 91 percent.
Austrian winter peas: United States Austrian winter pea production is forecast at 146,000 cwt, up 17 percent from last
year. Planted area is estimated at 16,500 acres, down 38 percent from a year ago. This is the lowest planted area since
2001. Area harvested is expected to total 11,900 acres, up 27 percent from 2017. United States yield, at 1,227 pounds per
acre, is down 103 pounds from a year ago.
Fall potatoes, 2017: Production of 2017 fall potatoes is finalized at 401 million cwt, down 1 percent from the 2016 crop.
Area harvested, at 902 thousand acres, is down 1 percent from 2016. The average yield, at 444 cwt per acre, is down 3 cwt
from 2016.
All potatoes, 2017: Final production of potatoes from all seasons in 2017 totaled 442 million cwt, a slight increase from
2016. Area harvested is estimated at 1.02 million acres, up 1 percent from a year earlier. The average yield, at 431 cwt per
acre, is down 2 cwt from 2016.
Sugarbeets: Production of sugarbeets, for the 2018 crop year, is forecast at 36.0 million tons, up 2 percent from last year.
Producers expect to harvest 1.10 million acres, down 2 percent from last year. Expected yield is forecast at 32.8 tons per
acre, an increase of 1.1 tons from last year.
No major disease issues were reported in Idaho, Oregon, and Washington. Growers were hopeful of a better root yield
with favorable weather in the near term forecast.
Sugarcane: Production of sugarcane for sugar and seed in 2018 is forecast at 32.7 million tons, down 2 percent from last
year. Producers intend to harvest 923,000 acres for sugar and seed during the 2018 crop year, up 2 percent from last year.
Expected yield for sugar and seed is forecast at 35.5 tons per acre, down 1.3 tons from 2017.

Crop Production (September 2018) 39 USDA, National Agricultural Statistics Service
Louisiana cane growers reported that they are expecting an above average crop, but not up to the yield level from the
2017 crop. Cane planting began in mid-August, slightly ahead of normal, but excess rains have delayed growers from
finishing planting.
Florida citrus: In the citrus growing region, daily temperatures were average all month. Daily highs ranged from the
mid-80s to mid-90s, with the majority of days reaching 91 degrees Fahrenheit or above. Rain fell on several days during
the month. Over half of the monitored citrus stations received 6 inches of rainfall or more during the month of August. In
the Central citrus producing area, Lake Alfred (Polk County) received 10.74 inches of rainfall, and in the Western citrus
producing area, Dover (Hillsborough County) received 10.31 inches. The Indian River District area received the least
rainfall, with St. Lucie West (St. Lucie County) recording the most on the east coast at 6.47 inches. According to the
August 30, 2018 U.S. Drought Monitor, the complete citrus growing region was drought free.
Care takers maintained normal spray schedules, consisting of applying summer oils, treating for greening and fertilizing,
while also applying herbicides, mowing, and conducting general grove maintenance. Fruit was sizing nicely in most areas.
Field workers reporting early oranges almost tennis ball size and grapefruit about baseball size. Irrigation was seen
running two to three days a week in the majority of counties. Some interior and western area counties that have had excess
rain reduced the irrigation frequency. Growing conditions have been ideal and reports on the health of the trees and
progress of the fruit has been positive in well cared for groves.
California citrus: Valencia oranges were harvested. Citrus packers were color sorting as citrus greening was exacerbated
by high temperatures. Valencia harvest was wrapping up due to the high temperatures and lack of harvestable fruit. Citrus
harvest was completed in Fresno County and orchards were treated with herbicides, foliar fungicides, and sunscreen. By
mid-month, the Valencia orange harvest continued with light volumes reported. Citrus groves were skirted, hedge rowed,
and irrigated. Pushed out citrus groves were prepared for planting. Navel orange fruit thinning began in Tulare County the
last week of the month. Lemons and limes were harvested.
California noncitrus fruits and nuts: Grape vineyards were irrigated. Table grape harvest was ongoing. Insecticide
treatments of grapes continued to control mites and hoppers. Mechanical and manual pruning and thinning of grapevines
continued. Peaches, nectarines, apricots, figs, table grapes, pears, and plums were harvested. Stone fruit orchards were
sprayed, irrigated, and fertilized. Summer pruning and topping of harvested stone fruit orchards continued. A few stone
fruit growers reported increased damage and fruit drop from the summer’s extreme weather. Some old orchards were torn
out for replacement with new trees. Pomegranates were irrigated. Persimmon fruit was showing some color towards the
end of the month. Almonds, walnuts, and pistachio orchard irrigation continued. Sunburn protection was applied to some
walnut groves. Some early walnuts were harvested in Tulare County around the middle of the month. Orchard floors were
prepared for harvest. Almond hull split was underway. Almond groves were treated with pesticides and fungicides. Early
almond and pistachio harvest began mid-month. Walnut orchard maintenance continued throughout the month.
Hazelnuts: Production in Oregon is forecast at a record high 52,000 tons, up 63 percent from last year’s final utilized
production of 32,000 tons. The September forecast is based on the hazelnut objective measurement survey.
Survey data indicated the percentage of good nuts analyzed in the laboratory was 89.7 percent. The average dry weight,
per good nut, was 2.80 grams, down from 3.03 grams in 2017. The number of nuts picked per tree was 291 in 2018, up
from 201 nuts the previous year. Hazelnut brown stain was found in 0.04 percent of the samples processed in 2018.
The complete report is available at:
https://www.nass.usda.gov/Statistics_by_State/Oregon/Publications/Fruits_Nuts_and_Berries/2018/HZ0818_1.pdf.
Walnuts: The 2018 California walnut production is forecast at a record high 690,000 tons, up 10 percent from last year’s
630,000 tons. The September forecast is based on the walnut objective measurement survey conducted August 1 through
August 21, 2018.
Survey data indicated an average nut set of 1,176 per tree, up 3 percent from 2017’s average of 1,141. Percent of sound
kernels in-shell was 98.8 percent Statewide. In-shell weight, per nut, was 22.3 grams, while the average in-shell suture
measurement was 32.3 millimeters. The in-shell cross-width measurement was 33.1 and the average length in-shell was

40 Crop Production (September 2018) USDA, National Agricultural Statistics Service
38.1 millimeters. All of the sizing measurements were below the previous year’s levels.
Late Spring rains provided cool conditions which increased kernel size and quality. Insect pressure was lower than the
previous season. Harvest is expected to begin during the middle of September.
The complete report is available at:
https://www.nass.usda.gov/Statistics_by_State/California/Publications/Specialty_and_Other_Releases/Walnut/Objective-
Measurement/201808walom.pdf.

Crop Production (September 2018) 41 USDA, National Agricultural Statistics Service
Statistical Methodology
Survey procedures: Objective yield and farm operator surveys were conducted between August 25 and September 7 to
gather information on expected yield as of September 1. The objective yield surveys for corn, cotton, and soybeans were
conducted in the major producing States that usually account for about 75 percent of the United States production. Farm
operators were interviewed to update previously reported acreage data and seek permission to randomly locate two sample
plots in selected fields for the objective yield survey (corn, cotton, and soybeans). The counts made within each sample
plot depend on the crop and the maturity of that crop. In all cases, number of plants is recorded along with other
measurements that provide information to forecast the number of ears, bolls, or pods and their weight. The counts are used
with similar data from previous years to develop a projected biological yield. The average harvesting loss is subtracted to
obtain a net yield. The plots are revisited each month until crop maturity when the fruit is harvested and weighed. After
the farm operator has harvested the sample field, another plot is sampled to obtain current year harvesting loss.
The farm operator survey was conducted primarily by telephone with some use of mail, internet, and personal interviews.
Approximately 9,800 producers were interviewed during the survey period and asked questions about probable yield.
These growers will continue to be surveyed throughout the growing season to provide indications of average yields.
Estimating procedures: National and State level objective yield and grower reported data were reviewed for
reasonableness and consistency with historical estimates. The survey data were also reviewed considering weather
patterns and crop progress compared to previous months and previous years. Each Regional Field Office submits an
analysis of the current situation to the Agricultural Statistics Board (ASB). The ASB uses the survey data and the State
analyses to prepare the published September 1 forecasts.
Revision policy: The September 1 production forecast will not be revised; instead, a new forecast will be made each
month throughout the growing season. End-of-season estimates are made after harvest. At the end of the marketing
season, a balance sheet is calculated using carryover stocks, production, exports, millings, feeding, and ending stocks.
Revisions are then made if the balance sheet relationships or other administrative data warrant changes. Estimates of
planted acres for spring planted crops are subject to revision in the August Crop Production report if conditions altered
the planting intentions since the mid-year survey. Planted acres may also be revised for Austrian winter peas, cotton, dry
edible peas, lentils, peanuts, and rice in the September Crop Production report each year; spring wheat, Durum wheat,
barley, and oats only in the Small Grains Annual report at the end of September; and all other spring planted crops in the
October Crop Production report. Revisions to planted acres will only be made when special survey data, administrative
data, such as Farm Service Agency program “sign up” data, or remote sensing data are available. Harvested acres may be
revised any time a production forecast is made if there is strong evidence that the intended harvested area has changed
since the last forecast.
Reliability: To assist users in evaluating the reliability of the September 1 production forecast, the "Root Mean Square
Error," a statistical measure based on past performance, is computed. The deviation between the September 1 production
forecast and the final estimate is expressed as a percentage of the final estimate. The average of the squared percentage
deviations for the latest 20-year period is computed. The square root of the average becomes statistically the “Root Mean
Square Error.” Probability statements can be made concerning expected differences in the current forecast relative to the
final end-of-season estimate, assuming that factors affecting this year's forecast are not different from those influencing
recent years. For example, the "Root Mean Square Error" for the September 1 corn for grain production forecast is
3.0 percent. This means that chances are 2 out of 3 that the current production forecast will not be above or below the final
estimate by more than 3.0 percent. Chances are 9 out of 10 (90 percent confidence level) that the difference will not
exceed 5.3 percent.
Also, shown in the following table is a 20-year record for selected crops of the differences between the September 1
forecast and the final estimate. Using corn again as an example, changes between the September 1 forecast and the final
estimate during the last 20 years have averaged 249 million bushels, ranging from 14 million bushels to 845 million
bushels. The September 1 forecast has been below the final estimate 12 times and above 8 times. This does not imply that
the September 1 corn forecast this year is likely to understate or overstate final production.

42 Crop Production (September 2018) USDA, National Agricultural Statistics Service
Reliability of September 1 Crop Production Forecasts [Based on data for the past twenty years]
Crop Root mean
square error
90 percent confidence
interval
Difference between forecast and final estimate
Production Years
Average Smallest Largest Below final
Above final
(percent) (percent) (millions) (millions) (millions) (number) (number)
Corn for grain ..................................... bushels Rice .......................................................... cwt Sorghum for grain .............................. bushels Soybeans for beans ........................... bushels Upland cotton 1 ...................................... bales
3.0 2.9 6.0 5.3 6.1
5.3 4.9
10.4 9.2
10.5
249 5
17 126 898
14 1 1 9 2
845 13 50
408 2,320
12 12 7
13 10
8 8
13 7
10
1 Quantity is in thousands of units.

Crop Production (September 2018) 43 USDA, National Agricultural Statistics Service
USDA, National Agricultural Statistics Service Information Contacts
Listed below are the commodity statisticians in the Crops Branch of the National Agricultural Statistics Service to contact
for additional information. E-mail inquiries may be sent to [email protected]
Lance Honig, Chief, Crops Branch ....................................................................................................... (202) 720-2127
Anthony Prillaman, Head, Field Crops Section .................................................................................... (202) 720-2127
Natasha Bruton – Current Agricultural Industrial Reports .............................................................. (202) 401-0034
David Colwell – Current Agricultural Industrial Reports ................................................................ (202) 720-3338
Chris Hawthorn – Corn, Flaxseed, Proso Millet .............................................................................. (202) 720-9526
James Johanson – County Estimates, Hay ....................................................................................... (202) 690-8533
Jeff Lemmons – Oats, Soybeans ...................................................................................................... (202) 690-3234
Sammy Neal – Peanuts, Rice ........................................................................................................... (202) 720-7688
Jannety Mosley – Crop Weather, Barley ......................................................................................... (202) 720-7621
Jean Porter – Rye, Wheat ................................................................................................................. (202) 720-8068
Bianca Pruneda – Cotton, Cotton Ginnings, Sorghum .................................................................... (202) 720-5944
Travis Thorson – Sunflower, Other Oilseeds ................................................................................... (202) 720-7369
Jorge Garcia-Pratts, Head, Fruits, Vegetables and Special Crops Section............................................ (202) 720-2127
Vincent Davis – Apricots, Bananas, Cherries, Garlic, Lettuce, Mint, Papaya,
Pears, Strawberries, Tomatoes ................................................................................................... (202) 720-2157
Fleming Gibson – Avocados, Cauliflower, Celery, Citrus, Coffee, Dates,
Figs, Kiwifruit, Nectarines, Olives, Green Peas, Taro, Watermelons ....................................... (202) 720-5412
Greg Lemmons – Blackberries, Blueberries, Boysenberries, Cranberries,
Cucumbers, Potatoes, Pumpkins, Raspberries, Squash, Sugarbeets,
Sugarcane, Sweet Potatoes ........................................................................................................ (202) 720-4285
Dan Norris – Artichokes, Austrian Winter Peas, Cantaloupes, Dry Beans,
Dry Edible Peas, Honeydews, Lentils, Mushrooms, Peaches, Snap Beans ............................... (202) 720-3250
Daphne Schauber – Bell Peppers, Broccoli, Cabbage, Chile Peppers,
Floriculture, Grapes, Hops, Maple Syrup, Tree Nuts, Spinach ................................................. (202) 720-4215
Chris Singh – Apples, Asparagus, Carrots, Lima Beans, Onions,
Plums, Prunes, Sweet Corn, Tobacco ........................................................................................ (202) 720-4288

Access to NASS Reports For your convenience, you may access NASS reports and products the following ways:
All reports are available electronically, at no cost, on the NASS web site: www.nass.usda.gov
Both national and state specific reports are available via a free e-mail subscription. To set-up this free
subscription, visit www.nass.usda.gov and click on “National” or “State” in upper right corner above “search”
box to create an account and select the reports you would like to receive.
For more information on NASS surveys and reports, call the NASS Agricultural Statistics Hotline at (800) 727-9540,
7:30 a.m. to 4:00 p.m. ET, or e-mail: [email protected].
The U.S. Department of Agriculture (USDA) prohibits discrimination against its customers, employees, and applicants for
employment on the basis of race, color, national origin, age, disability, sex, gender identity, religion, reprisal, and where
applicable, political beliefs, marital status, familial or parental status, sexual orientation, or all or part of an individual's
income is derived from any public assistance program, or protected genetic information in employment or in any program
or activity conducted or funded by the Department. (Not all prohibited bases will apply to all programs and/or
employment activities.)
If you wish to file a Civil Rights program complaint of discrimination, complete the USDA Program Discrimination
Complaint Form (PDF), found online at www.ascr.usda.gov/filing-program-discrimination-complaint-usda-customer, or
at any USDA office, or call (866) 632-9992 to request the form. You may also write a letter containing all of the
information requested in the form. Send your completed complaint form or letter to us by mail at U.S. Department of
Agriculture, Director, Office of Adjudication, 1400 Independence Avenue, S.W., Washington, D.C. 20250-9410, by fax
(202) 690-7442 or email at [email protected].