crop report #19 - august 31 to september 6, 2021
TRANSCRIPT

Crop Report For the Period August 13 to September 6, 2021 Published by the Ministry of Agriculture ISSN 0701 7085 Report number 19, September 9, 2021
For further information, contact Matthew Struthers, AAg, Crops Extension Specialist, Regional Services Branch,
Toll Free: 1-866-457-2377 or 306-694-3714, Email: [email protected]. Also available on the Ministry of Agriculture website at saskatchewan.ca/crop-report.
Producers have made tremendous progress as 56 per cent of the crop is now in the bin, up from 36 per cent last week, ahead of the five-year (2016-2020) average of 35 per cent. An additional 24 per cent of the crop is swathed or ready to straight-cut. There were several areas affected by rain delays but the majority of the province was able to continue their harvest operations without issue. The southwest region has made the most progress with 75 per cent of the crop now combined. The southeast has 67 per cent combined, the west-central 58 per cent, the east-central 38 per cent, the northeast 47 per cent and the northwest 37 per cent. Ninety-six per cent of the field peas, 93 per cent of the lentils, 74 per cent of the mustard, 66 per cent of the barley, 75 per cent of the durum, 58 per cent of the spring wheat and 31 per cent of the canola has now been combined. An additional 44 per cent of the canola is swathed or ready to straight-cut.
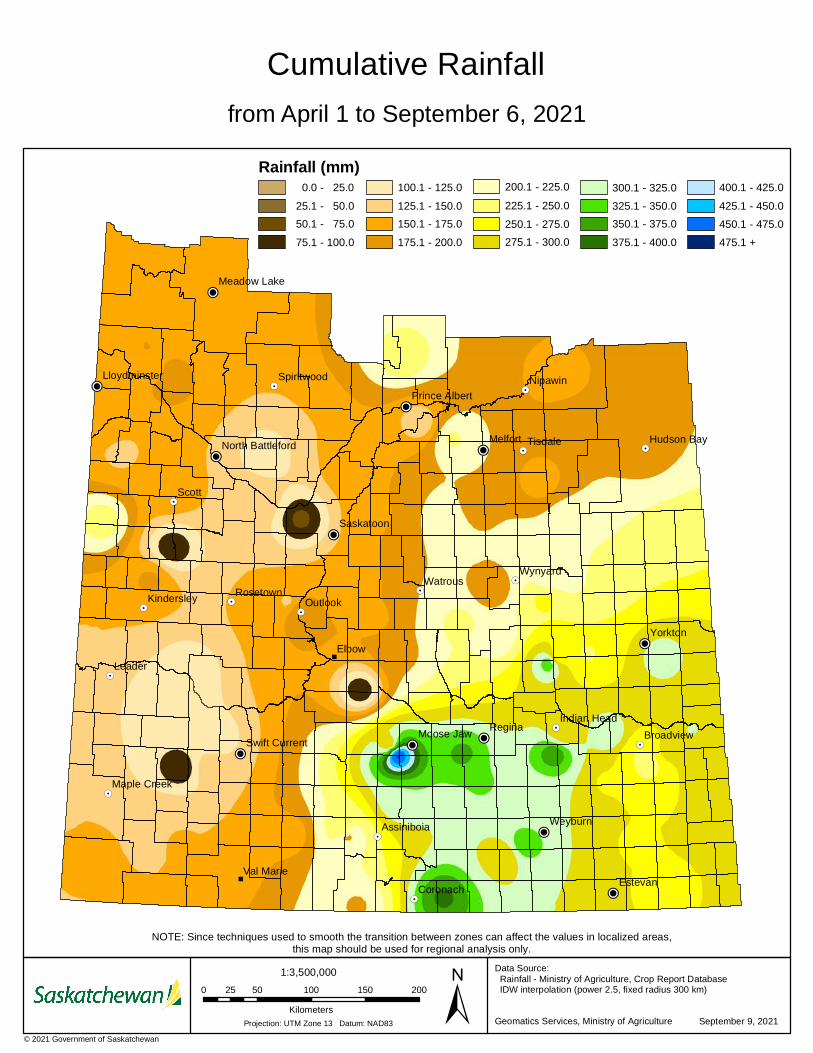
Estimated average crop yields at this time are 27 bushels per acre for hard red spring wheat, 19 bushels per acre for durum, 38 bushels per acre for barley, 20 bushels per acre for canola, 21 bushels per acre for field peas and 817 pounds per acre for lentils. Crop yields were greatly affected by drought conditions during critical growing stages this season and yields are far lower in some areas than anticipated. Rainfall last week ranged from trace amounts to 102 mm in the Rhein area which resulted in flooding and standing water in fields. Provincial cropland topsoil moisture conditions deteriorated slightly with recent strong winds even though rainfall was received in many parts of the province. Cropland topsoil moisture is rated as one per cent surplus, 38 per cent adequate, 38 per cent short and 23 per cent very short. Hay and
One year ago Cool and rainy weather
delayed harvest progress in the northern and eastside of the province. Forty-three per
cent of the 2020 crop had been combined and 29 per cent was
swathed or ready to straight cut. Producers continued to
report sprouting and bleaching in many crops.
Follow the 2021 Crop Report on Twitter @SKAgriculture
Harvest Progress in SK Per cent Combined
All Crops 5-year avg. (2015-2019)
35
Sept 7/20 43 Sept 9/19 18 Sept 3/18 39 Sept 4/17 45 Sept 5/16 32
10-year avg. (2011-2020)
33
Saskatchewan Harvest September 6, 2021 Per cent combined
Winter wheat 100 Fall rye* 100
Spring wheat 58 Durum 75 Oats** 45
Barley*** 66 Canaryseed 36
Flax 10 Canola 31 Mustard 74
Soybeans 53 Lentils 93 Peas 96
Chickpeas 65 *includes 10 per cent or more ‘other’ **includes five per cent ‘other’ ***includes one per cent ‘other’

pasture land topsoil moisture improved this week and is rated as one per cent surplus, 25 per cent adequate, 39 per cent short and 35 per cent very short.
The majority of crop damage this past week was due to strong winds, drought and hail. Areas that received precipitation over the past few weeks have reported that standing crops such as cereals and lentils have experienced severe weathering and are being downgraded at the elevator. Some fields are in such poor condition that some producers have indicated they will not be harvested.
Producers are busy combining, swathing, baling straw and hauling bales. Livestock producers are busy moving cattle, hauling water and trying to take inventory of their winter feed supplies.
As of Sept. 1, the AgriRecovery program, now referred to as the 2021 Canada-Saskatchewan Drought Response Initiative, is accepting producer applications. The initiative will consist of two payments totaling up to $200/head for cattle, with adjustments based on animal unit equivalents for other livestock. The initial payment will provide producers with $100 per breeding female equivalent in inventory as of Aug. 1, 2021. Secondary payments of up to $100 per breeding female in inventory as of Dec. 31, 2021, will be made to producers who have incurred additional costs to retain the animals. Producers with questions can call the initiative's dedicated toll-free number at 1-844-723-1211 or directly email [email protected].
We want to remind producers to exercise caution and remain safe. We ask motorists to remain vigilant and to exercise patience when traveling around or near farm equipment on the highway.
Saskatchewan Harvest by Crop District September 6, 2021
Crop District
Per cent combined
Crop District
Per cent combined
Crop District
Per cent combined
1A 77 4A 80 7A 541B 57 4B 83 7B 582A 72 5A 33 8A 492B 59 5B 25 8B 47
3ASE 79 6A 55 9AE 403ASW 56 6B 60 9AW 353AN 74 9B 393BS 823BN 76

Provincial Estimated Crop Yields - September 6, 2021
Winter wheat
Fall rye
HRSW Other wheat*
Durum Oat Barley Canary‐ seed
Southeast 35 29 34 34 31 63 52 1152
Southwest 12 13 14 9 15 20 36 259
East Central 30 29 29 29 25 47 37 575
West Central 15 15 18 17 15 24 21 438
Northeast 40 28 33 35 25 62 44 571
Northwest 0 0 31 50 0 83 39 0
Provincial 26 22 27 29 19 55 38 723
Flax Canola Mustard Soybean Pea Lentil Chick‐ pea
Southeast 19 26 684 27 34 1267 1191
Southwest 10 14 376 0 14 704 675
East Central 16 22 464 22 25 785 600
West Central 12 13 418 12 17 821 800
Northeast 19 19 750 15 25 1200 900
Northwest 20 20 0 0 20 1800 0
Provincial 15 20 414 25 21 817 797 * 'Other wheat' includes all wheat classes other than Hard Red Spring Wheat ** Crop yield predictions at this point in time. Please keep in mind these are regional averages, and yields can vary greatly across an area. *** canaryseed, mustard, lentil and chickpea in lbs./ac. All other crops in bu./ac.
Southeastern Saskatchewan:
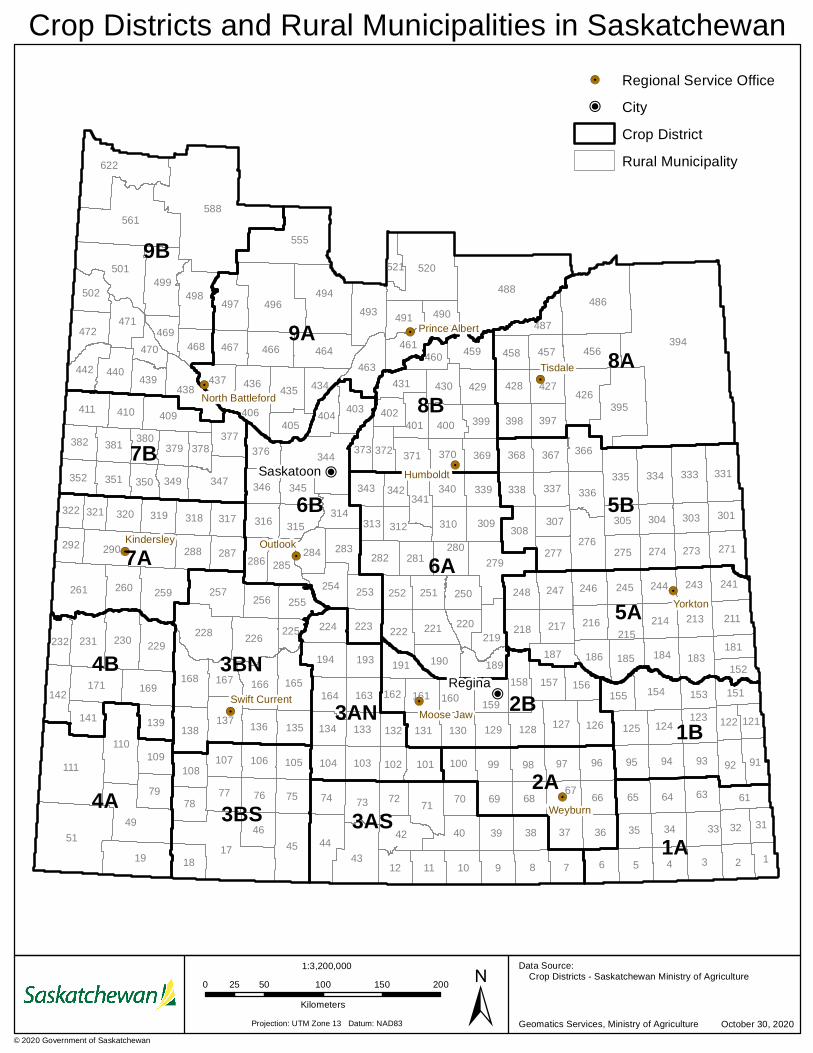
Crop District 1 – Carnduff, Estevan, Redvers, Moosomin and Kipling areas Crop District 2 – Weyburn, Milestone, Moose Jaw, Regina and Qu’Appelle areas Crop District 3ASE – Radville, Minton and Lake Alma areas
Harvest continues to quickly progress quickly in the region as 67 per cent of the crop is now in the bin. This is up significantly from 42 per cent last week and remains well ahead of the five-year (2016-2020) average of 49 per cent for this time of year. An additional 17 per cent of the crops are swathed or ready to straight-cut.
Rainfall last week ranged from trace amounts to 25 mm in the Moose Jaw area. The Tantallon area received 19 mm of rain, the Glenavon area 12 mm and the Odessa area two mm.
Fields and pastures in many parts of the region remain dry and are in need of a significant rain to help replenish both the topsoil and subsoil moisture for next year once harvest is completed. Cropland topsoil moisture is rated as 48 per cent adequate, 45 per cent short and seven per cent very short. Hay and pasture land topsoil moisture is rated as 31 per cent adequate, 46 per cent short and 23 per cent very short.

Crops are coming off dry and are poor quality overall. Reported yields are below average with some areas reporting less than anticipated yields due to the drought conditions and extremely hot weather during critical stages of the growing season. Yields for several crops, however, are higher in this region than others, mainly due to timely rains throughout the summer.
Crop damage was minimal this past week besides some strong winds blowing swaths around and some weathering of standing crops that will lead to downgrading. Due to the dry soil conditions there may be a reduction in winter cereals being seeded this fall as many producers are concerned about their soil moisture reserves for next spring.
Producers are busy combining, baling straw, moving cattle and hauling bales.
Southwestern Saskatchewan:
Crop District 3ASW – Coronach, Assiniboia and Ogema areas Crop District 3AN – Gravelbourg, Mossbank, Mortlach and Central Butte areas Crop District 3B – Kyle, Swift Current, Shaunavon and Ponteix areas Crop District 4 – Consul, Maple Creek and Leader areas
Producers took advantage of a warm, dry week and were able to spend long days inside their combines as 75 per cent of the crop is now combined. This is significantly up from 47 per cent last week and remains well ahead of the five-year (2016-2020) average of 55 per cent for this time of year. An additional nine per cent is swathed or ready to straight-cut.
Much of the region received very little rainfall last week with the Limerick area reporting 15 mm, the Mossbank area reporting 6 mm and the Mortlach and Eyebrow areas reporting 13 mm.
Topsoil moisture conditions are slowly deteriorating in the region now that is has been several weeks since a real substantial rainfall. After harvest is completed this region needs a large wide spread rain to replenish both the topsoil and subsoil moisture in fields and pastures. Cropland topsoil moisture is rated as 19 per cent adequate, 35 per cent short and 46 per cent very short. Hay and pasture land topsoil moisture is rated as 13 per cent adequate, 32 per cent short and 55 per cent very short. Crop District 3BS is reporting that 43 per cent of the cropland and 50 per cent of the hay and pasture land is very short topsoil moisture at this time.
Crops coming off are in very poor quality overall with well below average yields reported. This region struggled the worst throughout the drought and many crops did not have enough moisture to set or fill seed. The rain from previous weeks is causing some bleaching issues in the durum while strong winds have blown swaths around and have shelled out some standing crops. There are indications that there will be less winter cereals seeded this fall than normal due to the dry field conditions.
Producers are busy combining, swathing and moving bales and cattle.

East-Central Saskatchewan:
Crop District 5 – Melville, Yorkton, Cupar, Kamsack, Foam Lake, Preeceville and Kelvington areas
Crop District 6A – Lumsden, Craik, Watrous and Clavet areas
Regardless of recent rain in much of the region, producers continue to make good harvest progress. Thirty-eight per cent of the crop is now in the bin, up from 25 per cent last week and ahead of the five-year (2016-2020) average of 26 per cent for this time of year. An additional 35 per cent of the crop is swathed or ready to straight-cut. Warm and dry weather would be appreciated so that producers can return to the field.
Rainfall ranged from nil to 102 mm in the Rhein area, with most areas reporting over an inch of rain. The Langenburg area reported 46 mm, the Saltcoats area 36 mm, the Kenaston area 33 mm, the Craik area 32 mm, the Allan area 28 mm and the Esterhazy and Kelliher areas 20 mm.
Topsoil moisture conditions have improved slightly thanks to the recent rain. A large amount of moisture will be needed this fall to replenish both the topsoil and subsoil moisture for next year. Cropland topsoil moisture is rated as four per cent surplus, 58 per cent adequate, 28 per cent short and ten per cent very short. Hay and pasture land topsoil moisture is rated as three per cent surplus, 45 per cent adequate, 36 per cent short and 16 per cent very short.
Most crops in the region are coming off tough or damp and are being placed into aeration bins and dryers to reach an optimum moisture content for storage. The moisture has also caused a large amount of downgrading for several crops in the region. Yields are below average in areas that were drier throughout the summer but areas that received timely rains are reporting yields closer to normal. Second growth in crops such as canola is making combining very difficult as the green plant material can plug up the sieves.
Producers are busy combining, swathing, moving cattle and hauling bales.
West-Central Saskatchewan:
Crop District 6B – Hanley, Outlook, Loreburn, Saskatoon and Arelee areas Crop District 7A – Rosetown, Kindersley, Eston and Major areas Crop District 7B – Kerrobert, Macklin, Wilkie and Biggar areas
Producers in the west-central region made significant harvest progress thanks to relatively warm and dry conditions. Fifty-eight per cent of the crop is now in the bin, up from 36 per cent last week and is well ahead of the five-year (2016-2020) average of 31 per cent for this time of year. An additional 26 per cent of the crop is swathed or ready to straight-cut. Upon harvest completion, producers would like to see several days of steady showers in order to replenish the soil moisture content.

Rainfall last week ranged from trace amounts to 19 mm in the Hanley area. The Outlook area reported 18 mm of rain, the Langham and Rosthern areas six mm, the Harris area four mm and the Biggar and Kerrobert areas three mm.
Topsoil moisture conditions have slightly deteriorated even with the recent rain. The region will need significant moisture this fall to replenish both the topsoil and subsoil moisture in field and pastures. Cropland topsoil moisture is rated as 31 per cent adequate, 43 per cent short and 26 per cent very short. Hay and pasture land topsoil moisture is rated as 17 per cent adequate, 51 per cent short and 32 per cent very short.
Most crops are coming off dry but are in very poor shape. Reported yields for the region are well below average and some producers are describing the crops in their area as “horrid”. Canola regrowth has created issues when straight combining and producers are acting quickly to dry it down in order to resume their harvest. Crop damage was minimal this week but grass hoppers are reported to still be a problem across the region.
Producers are busy combining, swathing, moving cattle and hauling grain.
Northeastern Saskatchewan:
Crop District 8 – Hudson Bay, Tisdale, Melfort, Carrot River, Humboldt, Kinistino, Cudworth and Aberdeen areas
Crop District 9AE – Prince Albert, Choiceland and Paddockwood areas
Recent rainfall is delaying harvest progress for some areas in the region while others hardly slowed down. Forty-seven per cent of the crop is now in the bin, up from 34 per cent last week and well ahead of the five-year (2016-2020) average of 15 per cent for this time of year. An additional 37 per cent of the crop is swathed or ready to straight-cut. The region could use some warm weather to dry fields up and allow for crops to mature.
Rainfall ranged from trace amounts to 69 mm in the Humboldt area. The Lake Lenore area reported 50 mm of rain, the Kinistino area 38 mm and the Garrick area 21 mm. The rain pushed thinner swaths to the ground, making it hard to pick up and raised the potential for sprouting.
Cropland topsoil moisture is rated as 46 per cent adequate and 54 per cent short. Hay and pasture land topsoil moisture is rated as 27 per cent adequate and 73 per cent short. Soil moisture for the region has greatly improved and is on track to return to normal.
Crops are coming off tough or damp and many are being placed into aeration bins and dryers. Reported yields so far are less than average overall; some producers are estimating yields to be 20-50 per cent of normal. Most crop damage this week was caused by heavy rain showers that produced hail resulting in shelled out seed or downgraded crops, some fields were completely written off.
Producers are busy combining, swathing, desiccating and hauling bales.

Northwestern Saskatchewan:
Crop District 9AW – Shellbrook, North Battleford, Big River and Hafford areas Crop District 9B – Meadow Lake, Turtleford, Pierceland, Maidstone and
Lloydminster areas
Warm and relatively dry weather conditions have allowed many producers to get into the field to continue with harvest operations. Thirty-seven per cent of the crop is now combined, up from 21 per cent last week but remaining well ahead the five-year (2016-2020) average of 11 per cent for this time of year. An additional 38 per cent of the crop is swathed or ready to straight cut. Producers hope the rain will hold off and they will be able to complete harvest without too many future delays.
Rainfall last week ranged from nil to 18 mm in the Meadow Lake area. The Duck Lake area reported 13 mm of rain, the Turtleford area nine mm, the Glaslyn area three mm and the Nielburg area two mm.
Cropland topsoil moisture conditions are rated as 35 per cent adequate, 44 per cent short and 21 per cent very short. Hay and pasture land topsoil moisture is rated as 18 per cent adequate, 41 per cent short and 41 per cent very short.
Crops are coming off tough or damp and many are being placed into aeration bins and dryers. Many crops are being silaged in order to provide winter feed for cattle. Most crop damage this past week was due to strong winds that have blown swaths around and shelled out some standing crops. Reported yields so far are below average and many crops are being cut and baled for cattle feed.
Producers are busy combining, swathing and moving cattle and bales.
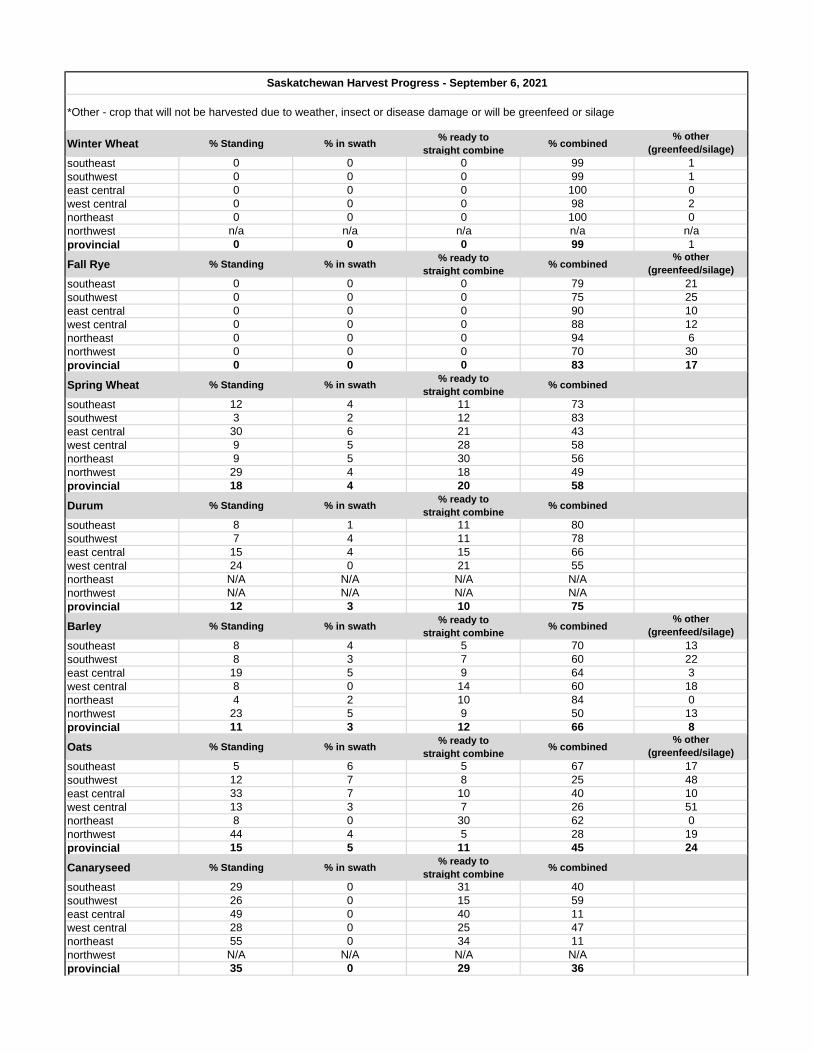
Winter Wheat % Standing % in swath% ready to
straight combine% combined
% other(greenfeed/silage)
southeast 0 0 0 99 1southwest 0 0 0 99 1east central 0 0 0 100 0west central 0 0 0 98 2northeast 0 0 0 100 0northwest n/a n/a n/a n/a n/aprovincial 0 0 0 99 1
Fall Rye % Standing % in swath% ready to
straight combine% combined
% other(greenfeed/silage)
southeast 0 0 0 79 21southwest 0 0 0 75 25east central 0 0 0 90 10west central 0 0 0 88 12northeast 0 0 0 94 6northwest 0 0 0 70 30provincial 0 0 0 83 17
Spring Wheat % Standing % in swath% ready to
straight combine% combined
southeast 12 4 11 73southwest 3 2 12 83east central 30 6 21 43west central 9 5 28 58northeast 9 5 30 56northwest 29 4 18 49provincial 18 4 20 58
Durum % Standing % in swath% ready to
straight combine% combined
southeast 8 1 11 80southwest 7 4 11 78east central 15 4 15 66west central 24 0 21 55northeast N/A N/A N/A N/Anorthwest N/A N/A N/A N/Aprovincial 12 3 10 75
Barley % Standing % in swath% ready to
straight combine% combined
% other(greenfeed/silage)
southeast 8 4 5 70 13southwest 8 3 7 60 22east central 19 5 9 64 3west central 8 0 14 60 18northeast 4 2 10 84 0northwest 23 5 9 50 13provincial 11 3 12 66 8
Oats % Standing % in swath% ready to
straight combine% combined
% other(greenfeed/silage)
southeast 5 6 5 67 17southwest 12 7 8 25 48east central 33 7 10 40 10west central 13 3 7 26 51northeast 8 0 30 62 0northwest 44 4 5 28 19provincial 15 5 11 45 24
Canaryseed % Standing % in swath% ready to
straight combine% combined
southeast 29 0 31 40southwest 26 0 15 59east central 49 0 40 11west central 28 0 25 47northeast 55 0 34 11northwest N/A N/A N/A N/Aprovincial 35 0 29 36
Saskatchewan Harvest Progress - September 6, 2021
*Other - crop that will not be harvested due to weather, insect or disease damage or will be greenfeed or silage

Flax % Standing % in swath% ready to
straight combine% combined
southeast 66 2 20 12southwest 72 0 17 11east central 76 3 13 8west central 56 0 33 11northeast 85 1 1 13northwest 76 0 12 12provincial 70 2 18 10
Canola % Standing % in swath% ready to
straight combine% combined
southeast 20 14 14 52southwest 37 2 9 52east central 26 40 18 16west central 21 18 23 38northeast 25 32 24 19northwest 21 43 20 16provincial 25 26 18 31
Mustard % Standing % in swath% ready to
straight combine% combined
southeast 10 0 26 64southwest 3 0 17 80east central 11 0 12 77west central 13 0 27 60northeast N/A N/A N/A N/Anorthwest N/A N/A N/A N/Aprovincial 8 0 18 74
Soybeans % Standing % in swath% ready to
straight combine% combined
southeast 49 0 0 51southwest 40 0 0 60east central 52 0 7 41west central 28 0 13 59northeast N/A N/A N/A N/Anorthwest N/A N/A N/A N/Aprovincial 45 0 2 53
Field Peas % Standing % in swath% ready to
straight combine% combined
southeast 0 0 1 99southwest 0 0 2 98east central 5 2 4 89west central 0 0 5 95northeast 1 0 1 98northwest 1 1 1 97provincial 1 1 2 96
Lentils % Standing % in swath% ready to
straight combine% combined
southeast 0 0 4 96southwest 5 0 2 93east central 0 2 2 96west central 4 0 2 94northeast 13 1 11 75northwest 0 0 41 59provincial 5 0 2 93
Chickpeas % Standing % in swath% ready to
straight combine% combined
southeast 6 0 17 77southwest 17 0 26 57east central 0 0 40 60west central N/A N/A N/A N/Anortheast N/A N/A N/A N/Anorthwest N/A N/A N/A N/Aprovincial 12 0 23 65
!P
!P
!. !.
!.
!.
!.
!.
!.
!.
!.
!.
261
411
442
502
49
229
349
18
77
168
228
347
437
468
45
286
435
282
402
10
100
280
370
219
189
218
309
487
67
37
66
36
246
457
125
274
93
121
183
151
321
380
78
496
75
434
43
72
162
252
222
343
372
403
11
130
251
342
461
400
491
9 8
38
129
368
488
6
96
157 156
336
367
456
154
92
153
152
243 241
301
331
1
232
382
110
381
350
409
107
287
555
44
76
316 315
464
12
73
42
134 132
161
281
490
428
398
216
366
426
4
185
275
335
32
122
213 211
31
322
352
501
561
109
230
438
470
588
17
138
377
498497
165
345
494
191
283
40
190
250
312
340
460
99
308
97
187
307
337
397
35
244
394
61
123
51
141
171
292
351
79
139
410
499
137
406
467
46
74
376
133
221
341
371
401
459
159
429
399
277
486
124
215
142
440
472
622
260
439
471
108
167 166
257
288
317
135
194
256 255
224
284
346
466
102
164
223
313
463
431
71
430
521
128
338
127
427
5
64
95 94
245
304
3
63
33
181
333
111
231
290
19
169
259
319
379
436
136
105 104
225
254
405404
163
253
314
373
70
131
520
39
68
98
158
279
7
126
186 184
214
2
91
320
469
226
318
378
106
285
344
103
193
493
101
160
220
310
69
248
369
339
458
247
217
276
395
65
34
155
305
334
303
273 271
Regina
Saskatoon
7A
3BN
3BS
3AN
6B
4B
7B
3AS
5B
1A
5A
2A
6A
9A8A
2B
4A
8B
1B
9B
Kindersley Outlook
Tisdale
Weyburn
Moose Jaw
Prince Albert
Swift Current
North Battleford
Yorkton
Humboldt
Geomatics Services, Ministry of Agriculture
Data Source: Crop Districts - Saskatchewan Ministry of Agriculture
© 2020 Government of Saskatchewan
Crop Districts and Rural Municipalities in Saskatchewan
± October 30, 2020Projection: UTM Zone 13 Datum: NAD83
0 50 100 150 20025
Kilometers
1:3,200,000
!. Regional Service Office
!P City
Crop District
Rural Municipality

!P
!P
!P
!P
!.
!.
!.
!.
!P
!.
!.
!.
!.
"
!P
!P
!P
!.
!P!P
!P
!.
!P
!.
"
!.
!P
!.
!.
!.
Scott
Elbow
Leader
Regina
Outlook
Weyburn
Melfort
Nipawin
Tisdale
Wynyard
Yorkton
Estevan
Humboldt
Coronach
Rosetown
Moose Jaw
Val Marie
Broadview
Saskatoon
Hudson Bay
Spiritwood
Kindersley
Assiniboia
Maple Creek
Indian Head
Meadow Lake
Lloydminster
Swift Current
Prince Albert
North Battleford
Geomatics Services, Ministry of Agriculture
Data Source: Rainfall - Ministry of Agriculture, Crop Report Database IDW interpolation (power 2.5, fixed radius 300 km)
© 2021 Government of Saskatchewan
Projection: UTM Zone 13 Datum: NAD83 ±0 50 100 150 20025
Kilometers
Weekly Rainfall
Rainfall (mm)20.1 - 30.030.1 - 40.040.1 - 50.050.1 +
Trace 1.0 - 5.0 5.1 - 10.010.1 - 20.0
NOTE: Since techniques used to smooth the transition between zones can affect the values in localized areas,this map should be used for regional analysis only.
September 8, 2021
from August 31 to September 6, 2021
1:3,500,000

(in millimeters) 1 inch = 25 mm
Crop R.M. Past Since Crop R.M. Past Since Crop R.M. Past Since Dist. No. Name Week 1-Apr Dist. No. Name Week 1-Apr Dist. No. Name Week 1-Apr
1A 2 Mount Pleasant NIL 201 4A 51 Reno TR 154.4 7A 287 St. Andrews 1 693 Enniskillen NIL 268 79 A Arlington NIL 153 288 Pleasant Valley N/A 108
32 Reciprocity TR 172 79 B Arlington NIL 135 290 Kindersley 2 137.961 Antler N/A 340 109 Carmichael N/A 78.6 292 Milton N/A 17464 Brock NIL 273 110 Piapot NIL 69 317 Marriott 4 14565 Tecumseh N/A 234 111 Maple Creek NIL 90 320 A Oakdale 2 179
1B 95 Golden West N/A 56 4B 139 Gull Lake NIL 81 320 B Oakdale 1 127122 Martin TR 289 229 Miry Creek N/A 103 321 Prairiedale NIL 168123 Silverwood 7 283 231 Happyland N/A 105 7B 347 Biggar 3 193124 Kingsley 12 235 5A 181 Langenburg N/A 132 350 Mariposa 3 82125 A Chester N/A 295 183 A Fertile Belt 8 303 351 Progress 1 195125 B Chester TR 273 183 B Fertile Belt 20 135 377 Glenside 2.5 195151 Rocanville 19 301 211 Churchbridge 16 286 378 Rosemount 2 238154 A Elcapo TR 249 213 Saltcoats 46 314 382 Eye Hill 2.5 239154 B Elcapo N/A 38 217 Lipton 36 341 409 A Buffalo N/A 111155 Wolseley NIL 314 241 Calder 17 295 409 B Buffalo 22 173
2A 67 Weyburn N/A 230.2 243 Wallace N/A 257 410 Round Valley N/A 102.368 Brokenshell NIL 340.5 245 A Garry N/A 196 8A 394 Hudson Bay 6 18297 Wellington TR 308 245 B Garry 10 248 395 Porcupine N/A 194
100 Elmsthorpe NIL 275.8 246 A Ituna Bon Accord 8 254 397 Barrier Valley 3.2 159.62B 127 A Francis 2 368.5 246 B Ituna Bon Accord 14.7 210.7 428 Star City N/A 116
127 B Francis N/A 194 247 Kellross 20 257.1 456 Arborfield 9 185129 Bratt's Lake 8 328 248 Touchwood 13 200 457 Connaught N/A 92.7131 Baildon 24 330 5B 273 Sliding Hills 102 361.5 486 Moose Range 8 170156 A Indian Head 0.2 275.4 277 Emerald 2 257 487 Nipawin N/A 88156 B Indian Head NIL 388 301 St.Philips N/A 160.6 8B 369 St. Peter 43 229159 Sherwood 3 242 305 Invermay 10 248 370 A Humboldt 69 223160 Pense 25 294 307 Elfros 8 214 370 B Humboldt N/A 61161 A Moose Jaw 38 357 308 A Big Quill 10 176 371 Bayne 39 214161 B Moose Jaw N/A 408 308 B Big Quill TR 95 372 Grant 20.4 173.1162 A Caron 5,1 278.2 331 Livingston 12 248.3 400 Three Lakes 50 193162 B Caron 3 262 334 Preeceville N/A 87 429 Flett's Springs 38 181191 Marquis N/A 144 336 Sasman 6 204 430 Invergordon 40 227
3ASE 38 A Laurier 2 181.4 337 Lakeview N/A 138 459 Kinistino 38 22838 B Laurier TR 281 366 Kelvington TR 248.5 460 Birch Hills 29.5 134.3
3ASW 10 Happy Valley NIL 379 367 Ponass Lake N/A 231 9AE 461 Prince Albert N/A 16643 Old Post NIL 198 6A 190 A Dufferin NIL 271 488 Torch River 21 15373 A Stonehenge NIL 186 190 B Dufferin N/A 181 491 Buckland 10 16273 B Stonehenge NIL 219.5 190 C Dufferin NIL 332 520 Paddockwood N/A 24174 Wood River 15 260.5 190 D Dufferin TR 84 521 Lakeland N/A 216
3AN 102 Lake Johnston 6 319.7 219 A Longlaketon 9 235 9AW 405 Great Bend N/A 44103 Sutton NIL 117 219 B Longlaketon N/A 247.2 435 Redberry 5 166132 A Hillsborough 2 256.5 220 McKillop 3 275 436 Douglas NIL 106132 B Hillsborough 13 481 221 Sarnia 13 137.6 437 North Battleford TR 158.4193 Eyebrow 13 190 222 Craik 32 237 463 Duck Lake 13 205
3BS 75 Pinto Creek NIL 160.5 251 Big Arm 20 148 466 Meeting Lake N/A 16477 Wise Creek NIL 151 252 Arm River N/A 195 467 A Round Hill N/A 15278 Grassy Creek NIL 150.5 279 Mount Hope 7 232 467 B Round Hill N/A 164
106 Whiska Creek NIL 146 282 McCraney 33 169.8 493 Shellbrook N/A 100107 Lac Pelletier N/A 100 339 Leroy 9.4 200.2 496 Spiritwood TR 175108 Bone Creek N/A 151 340 Wolverine N/A 114.3 497 Medstead N/A 76
3BN 138 Webb 0.5 142 341 Viscount 24 147 9B 440 Hillsdale 2 144.5165 Morse N/A 165.8 343 Blucher 28 187 442 Manitou Lake 1.3 155.2168 A Riverside NIL 109 6B 223 A Huron 16 164 498 Parkdale 3 138.5168 B Riverside N/A 93.5 223 B Huron 5 197.5 499 Mervin 7 182.9226 Victory N/A 73 223 C Huron N/A 91.4 501 A Frenchman Butte 1 175.2228 Lacadena TR 108 284 A Rudy TR 107 501 B Frenchman Butte 9 173257 Monet N/A 84.5 284 B Rudy 18 82 501 C Frenchman Butte NIL 124
285 Fertile Valley 3.5 146 502 Britannia NIL 58.5286 Milden 4 103 561 Loon Lake N/A 158314 Dundurn 19 157 588 Meadow Lake 18 182344 Corman Park 6 68 622 Beaver River N/A 117.5376 Eagle Creek 3 136403 Rosthern 6 161
Weekly Rainfall Summary
These precipitation amounts represent point locations within each municipality and do not necessarily reflect the whole R. M.Municipality No: A, B, C and D - more than one reporter
for the period from August 31 to Sept 6, 2021
!P
!P
!P
!P
!.
!.
!.
!.
!P
!.
!.
!.
!.
"
!P
!P
!.
!P!P
!P
!.
!P
!.
"
!.
!.
!P
!.
!.
!.
Scott
Elbow
Leader
Regina
Watrous
Outlook
Weyburn
Melfort
Nipawin
Tisdale
Wynyard
Yorkton
EstevanCoronach
Rosetown
Moose Jaw
Val Marie
Broadview
Saskatoon
Hudson Bay
Spiritwood
Kindersley
Assiniboia
Maple Creek
Indian Head
Meadow Lake
Lloydminster
Swift Current
Prince Albert
North Battleford
Geomatics Services, Ministry of Agriculture
Data Source: Rainfall - Ministry of Agriculture, Crop Report Database IDW interpolation (power 2.5, fixed radius 300 km)
© 2021 Government of Saskatchewan
Projection: UTM Zone 13 Datum: NAD83 ±0 50 100 150 20025
Kilometers
Cumulative Rainfall
NOTE: Since techniques used to smooth the transition between zones can affect the values in localized areas,this map should be used for regional analysis only.
from April 1 to September 6, 2021
September 9, 2021
Rainfall (mm) 0.0 - 25.0
25.1 - 50.0
50.1 - 75.0
75.1 - 100.0
325.1 - 350.0
350.1 - 375.0
300.1 - 325.0
375.1 - 400.0
125.1 - 150.0
150.1 - 175.0
175.1 - 200.0 475.1 +
450.1 - 475.0
425.1 - 450.0
400.1 - 425.0200.1 - 225.0
225.1 - 250.0
250.1 - 275.0
275.1 - 300.0
100.1 - 125.0
1:3,500,000

!P
!P
!P
!P
!.
!.
!.
!.
!P
!.
!.
!.
!.
"
!P
!P
!P
!.
!P!P
!P
!.
!P
!.
"
!.
!P
!.
!.
!.
Scott
Elbow
Leader
Regina
Outlook
Weyburn
Melfort
Nipawin
Tisdale
Wynyard
Yorkton
Estevan
Humboldt
Coronach
Rosetown
Moose Jaw
Val Marie
Broadview
Saskatoon
Hudson Bay
Spiritwood
Kindersley
Assiniboia
Maple Creek
Indian Head
Meadow Lake
Lloydminster
Swift Current
Prince Albert
North Battleford
Geomatics Services, Ministry of Agriculture
Data Source: Moisture - Ministry of Agriculture, Crop Report Database IDW interpolation (power 2.5, fixed radius 300 km)
© 2021 Government of Saskatchewan
Projection: UTM Zone 13 Datum: NAD83 ±0 50 100 150 20025
Kilometers
Cropland Topsoil Moisture Conditions
NOTE: Since techniques used to smooth the transition between zones can affect the values in localized areas,this map should be used for regional analysis only.
September 8, 2021
September 6, 2021
Moisture Conditions
Very Short
Short
AdequateSurplus
1:3,500,000

!P
!P
!P
!P
!.
!.
!.
!.
!P
!.
!.
!.
!.
"
!P
!P
!P
!.
!P!P
!P
!.
!P
!.
"
!.
!P
!.
!.
!.
Scott
Elbow
Leader
Regina
Outlook
Weyburn
Melfort
Nipawin
Tisdale
Wynyard
Yorkton
Estevan
Humboldt
Coronach
Rosetown
Moose Jaw
Val Marie
Broadview
Saskatoon
Hudson Bay
Spiritwood
Kindersley
Assiniboia
Maple Creek
Indian Head
Meadow Lake
Lloydminster
Swift Current
Prince Albert
North Battleford
Geomatics Services, Ministry of Agriculture
Data Source: Moisture - Ministry of Agriculture, Crop Report Database IDW interpolation (power 2.5, fixed radius 300 km)
© 2021 Government of Saskatchewan
Projection: UTM Zone 13 Datum: NAD83 ±0 50 100 150 20025
Kilometers
Hay and Pasture Topsoil Moisture Conditions
NOTE: Since techniques used to smooth the transition between zones can affect the values in localized areas,this map should be used for regional analysis only.
September 8, 2021
September 6, 2021
Moisture Conditions
Very Short
Short
AdequateSurplus
1:3,500,000

!P
!P
!P
!P
!.
!.
!.
!.
!P
!.
!.
!.
!.
"
!P
!P
!P
!.
!P!P
!P
!.
!P
!.
"
!.
!P
!.
!.
!.
Scott
Elbow
Leader
Regina
Outlook
Weyburn
Melfort
Nipawin
Tisdale
Wynyard
Yorkton
Estevan
Humboldt
Coronach
Rosetown
Moose Jaw
Val Marie
Broadview
Saskatoon
Hudson Bay
Spiritwood
Kindersley
Assiniboia
Maple Creek
Indian Head
Meadow Lake
Lloydminster
Swift Current
Prince Albert
North Battleford
Geomatics Services, Ministry of Agriculture
Data Sources: Temperature data - Saskatchewan Ministry of Environment (Wildfire Management Branch) and Environment Canada. Temperature data compiled and quality controlled by Agriculture and Agri-Food Canada IDW interpolation (power 3.5, fixed radius 300 km)
© 2021 Government of Saskatchewan
Projection: UTM Zone 13 Datum: NAD83 ±0 50 100 150 20025
Kilometers
Minimum Temperature
NOTE: Since techniques used to smooth the transition between zones can affect the values in localized areas,this map should be used for regional analysis only.
September 8, 2021
from August 31 to September 6, 2021
Temperature (°C) < 0.0
0.1 to 2.0
2.1 to 4.0
4.1 to 6.0
6.1 <
1:3,500,000

!P
!P
!P
!P
!.
!.
!.
!.
!P
!.
!.
!.
!.
"
!P
!P
!P
!.
!P!P
!P
!.
!P
!.
"
!.
!P
!.
!.
!.
Scott
Elbow
Leader
Regina
Outlook
Weyburn
Melfort
Nipawin
Tisdale
Wynyard
Yorkton
Estevan
Humboldt
Coronach
Rosetown
Moose Jaw
Val Marie
Broadview
Saskatoon
Hudson Bay
Spiritwood
Kindersley
Assiniboia
Maple Creek
Indian Head
Meadow Lake
Lloydminster
Swift Current
Prince Albert
North Battleford
Geomatics Services, Ministry of Agriculture
Data Sources: Temperature data - Saskatchewan Ministry of Environment (Wildfire Management Branch) and Environment Canada. Temperature data compiled and quality controlled by Agriculture and Agri-Food Canada IDW interpolation (power 3.5, fixed radius 300 km)
© 2021 Government of Saskatchewan
Projection: UTM Zone 13 Datum: NAD83 ±0 50 100 150 20025
Kilometers
Maximum Temperature
NOTE: Since techniques used to smooth the transition between zones can affect the values in localized areas,this map should be used for regional analysis only.
September 8, 2021
from August 31 to September 6, 2021
Temperature (°C) < 24.0
24.1 to 26.0
26.1 to 28.0
28.1 to 30.0
30.1 <
1:3,500,000