cross country differences in venture capital financing
TRANSCRIPT
1 | Page
CROSS-COUNTRY DIFFERNECES IN VENTURE CAPITAL FINANCING
APRIL 2013
MASTER THESIS
Author: Christian Scheel Tost – 221086-1109 Study program: MSc. Applied Economics and Finance Course: Master Thesis Supervisor: Jens Frøslev Christensen Date of submission: 2013-04-19 Page count: 88 Word count: 36.404 Character count (with spaces): 226.329
Can a well-functioning venture capital industry spur innovation within local economies – an empirical comparison of the US, UK, IL and DK venture capital markets and investment approach?
2 | Page
Contents
Contents ......................................................................................................................................................................................... 2
Executive Summary ................................................................................................................................................................... 6
1. Introduction ............................................................................................................................................................................. 7
1.2 Research Objective ......................................................................................................................................................... 9
1.3 Research Method .......................................................................................................................................................... 10
1.4 Research Design ............................................................................................................................................................ 12
2. Introduction: Venture Capital Financing of Start-Ups in Business Administration Theory ........................ 13
2.1 Definition of Venture Capital ................................................................................................................................... 13
2.2 Equity Financing: Venture Capital Financing ...................................................................................................... 13
2.2.1 Crowd Funding ....................................................................................................................................... 14
2.2.2 Institutional Venture Capital ................................................................................................................ 15
2.2.3 Independent Venture Capital (IVC) .................................................................................................... 16
2.3. Stages in the Financing Life Cycle of a Start-up ................................................................................................ 17
2.3.1 Venture Characteristics in the Different Stages ................................................................................. 18
2.3.2 Structure of Independent Venture Capital Firms .............................................................................. 19
2.3.3 Role of Independent Venture Capital Firms in Start-ups ................................................................ 20
2.4 Theoretical Foundation for Explanation of the Behavior of Venture Capital Firms ............................. 21
2.4.1 Agency Theory Model: Asymmetric Information, Moral Hazard and Adverse Selection .......... 22
2.4.2 Mitigation of Agency Risk ..................................................................................................................... 23
2.5 Typical Venture Capital Investment Process: VC Investment Cycle ........................................................... 24
2.5.1 Contact Phase ......................................................................................................................................... 24
2.5.2 Screening Investment Ideas .................................................................................................................. 25
2.5.3 Due Diligence ......................................................................................................................................... 26
2.5.4 Management Phase (Value Adding Services) ..................................................................................... 30
2.5.5. Exit Phase ............................................................................................................................................... 32
3. Empirical Study on Explaining the Venture Capital Impact on Innovation and Economic Growth ...... 34
3 | Page
3.1 Empirical Study and Definition of Innovation ................................................................................................... 34
3.1.1 What is Innovation? ............................................................................................................................... 34
3.1.2 How to Measure Innovation ................................................................................................................ 35
3.2 Economic Growth With Innovation ...................................................................................................................... 37
3.2.1 Managing and Facilitating Quality Innovations ................................................................................. 38
3.3 Literature Review: Does Venture Capital Spur Innovation? ........................................................................... 41
3.2.1 Does Venture Capital Create Innovative Incentive? ......................................................................... 41
3.2.1 Does Venture Capital Spur Sustainable Innovation? ........................................................................ 42
4. National Innovation Systems: Macroeconomic Environment of the Venture Capital Industry in the US,
UK, IL and DK ......................................................................................................................................................................... 44
4.1 General Demographic, Economic Data and the Venture Capital Markets ................................................ 44
4.2 Macroeconomic Attractiveness of VC Markets .................................................................................................. 46
4.2.1 Capital Availability.................................................................................................................................. 47
4.2.2 Entrepreneurial Capital ......................................................................................................................... 48
4.2.3 Entrepreneurial Culture ......................................................................................................................... 49
4.2.4 Nation Infrastructure ............................................................................................................................. 50
4.2.5 Regulative Environment........................................................................................................................ 51
4.3 Overview of attractiveness of DK, IL, UK, and US ......................................................................................... 51
5. Research Framework Model and Hypotheses Development ................................................................................. 55
5.1 Average Size of Investment ....................................................................................................................................... 55
5.1.1 Hypotheses Development: HA, HB, and HC ................................................................................... 56
5.2 Venture Capital Investment Risk Strategy ............................................................................................................ 57
5.2.1 Percentage of Start-ups in Pre-Revenue Phase (Had no Revenue) at Time of Investment ........ 57
5.2.2 Me-Too Ventures, Risk Strategy and Level of Risk .......................................................................... 58
5.2.3 Portfolio Structure ................................................................................................................................. 59
5.3 Due Diligence ................................................................................................................................................................ 60
5.3.1 Management Team Due Diligence ...................................................................................................... 60
5.3.2 Market and Product/Service Due Diligence ...................................................................................... 61
4 | Page
5.4 Management Phase (Value Adding Phase) ........................................................................................................... 63
5.5 Exit Phase........................................................................................................................................................................ 65
6. Analysis and Comparison of Findings ........................................................................................................................... 67
6.1 Average Size of Investment: Investment Strategy .............................................................................................. 67
6.1.1 Average Size of Investment: Seed Stage ............................................................................................. 67
6.1.2 Average Size of investment: Startup Stage ......................................................................................... 69
6.1.3 Average Size of Investment: Growth Stage ....................................................................................... 71
6.1.4 Conclusion on Investment Strategy ..................................................................................................... 73
6.2 Investment Risk Strategy: Risk Strategy ................................................................................................................ 73
6.2.1 Pre-Revenue Investments ..................................................................................................................... 74
6.2.2 Investment in Proven Business Models .............................................................................................. 75
6.2.3 Investment Strategy ............................................................................................................................... 76
6.2.4 Level of Risk ........................................................................................................................................... 77
6.2.5 Portfolio Structure ................................................................................................................................. 78
6.2.6 Conclusion on Differences in Risk Strategy ....................................................................................... 79
6.3 Due Diligence: Limitation of Risk and Maturity of Market ............................................................................ 80
6.3.1 Replacement of CEO – Management Team ...................................................................................... 80
6.3.2 Differences in Market Due Diligence Approach ............................................................................... 81
6.3.3 Difference in Product Due Diligence Approach ............................................................................... 82
6.3.4 Differences in Due Diligence Approach Conclusion ....................................................................... 82
6.4 Management Phase: Value Adding Strategy ......................................................................................................... 83
6.4.1 Employee Mix ......................................................................................................................................... 84
6.4.2 Number of board seats per partner ..................................................................................................... 84
6.4.3 Time Used on Portfolio Companies ................................................................................................... 85
6.4.4 Contact with Portfolio Companies (Non-Executive Level) ............................................................ 85
6.4.5 Conclusion: Differences in Value Adding Services ........................................................................... 86
6.5 Exit Phase........................................................................................................................................................................ 87
6.5.1 Exit Strategy: Channel and Geography ............................................................................................... 87

5 | Page
6.5.2 Conclusion: Differences in Exit Strategy ............................................................................................ 88
7. Discussion of the analysis and the impact on the impact on the innovation .................................................... 89
7.1. Investment Strategy, Risk Strategy, Due Diligence & Exit Phase (Spurring Innovation) .................... 89
7.2. Management Phase (Creating Sustainable Innovation) ................................................................................... 90
7.3. Concluding remarks on innovation differences ................................................................................................. 91
8. Conclusion .............................................................................................................................................................................. 92
8.1. Summary of the Results ............................................................................................................................................. 92
8.2. Concluding remarks: Implication of the differences and their impact on sustainable innovation .... 94
8.2. Limitation and critique ............................................................................................................................................... 94
8.3. Further Research .......................................................................................................................................................... 96
9. Bibliography ........................................................................................................................................................................... 97
10. Appendix ........................................................................................................................................................................... 106
6 | Page
Executive Summary The literature on venture capital and the finance of innovation is vast. Much of it focuses upon the existence and
extent of non-financial value added to new ventures, through active ownership also known from the private equity
industry.
This thesis develops a framework to identify cross-country differences within the investment strategies and value-
adding activities, and see if some of these differences could cause a better functioning venture capital industry.
Similar frameworks have often been used to investigate which activities add most value to ventures and also in
determining differences between different venture capitalists like private and public sector venture capitalists. The
framework developed in this thesis is founded in venture capital and innovation theory, which provides the insights
necessary to investigate how the venture capital approach can or cannot spur innovation, and hereby identify
perception perceptions of the value added from their venture capitalist and their network. The purpose of the
investigation is to uncover cross-country difference of how venture capitalists invest in Denmark, Israel, United
Kingdom and in the Unites States, and see if some of these differences can be traced back to whether some
countries have a better innovative eco-system than other countries.
The empirical data is mainly collected through a survey sent out to 60 venture firms, in Israel and Denmark, as well
as previous data points of 67 VCs in the United States and 15 in the United Kingdom. In addition, the hypothesis
development tested in this paper has been developed through 11 interviews of different venture capitalists,
entrepreneurs and business angels in Europe and the US.
Overall the research shows that the differences found between the four venture capital markets have limited
influence on the overall value adding services, and therefore there is no sufficient evidence that the U.S ventures are
capable of adding more value and should be copied into the European ventures' way of doing business. There are
however, significant differences in the way VCs invest in the four markets, and especially the DK market, which
seems more risk averse than the US, IL and UK venture markets and with a lower average amount of investment
throughout the lifecycle. Even though the above results are not conclusive, the research has clearly identified
differences between the four countries that could limit the innovative ideas and the development of healthy
ventures, and therefore create a less attractive ecosystem for startups.
7 | Page
1. Introduction Venture Capital refers to a specialized form of industrial finance that can be used to prove a business concept, help
set up a business or allow it to expand (Cumming D. , 2010). In the last century, venture capital has developed as an
important intermediary in financial markets, providing capital to firms that might otherwise have difficulties
locating capital towards expansion of their venture, such as biotechnology, IT, software, etc. In addition, venture
capital is often appealing for young companies with inadequate operating history that are too small to raise capital
in public markets and have yet to reach the point where they are able to obtain a bank loan or complete a debt
offering. The high risk that venture capitalists take on, by investing in smaller and less mature companies, venture
capitalists in exchange usually get significant control over company decisions, in addition to a significant portion of
the company's ownership (and consequently future value). (Privco, 2011)
The origins of the term "venture capital" are unknown, and there is no standard definition of it. It is, however,
generally agreed that the traditional venture capital era began in 1946, when General Georges Doriot, Ralph
Flanders, Karl Compton, Merrill Griswold, and others organized American Research & Development (AR&D), the
first (and, after it went public, for many years the only) public corporation specializing in investing in illiquid
securities of early stage issuers (Ante, 2008). In the 1960’s the US venture capital industry for technology firms got
consecrated when Silicon Valley laid the fundament for an inspiring environment for the information technology
industry to grow, whereas we today see London and Berlin as the new technology hubs of Europe, (Malik, 2011)
and (Johnson, 2012)
During the 1980’s and 1990’s, there was a tremendous boom in the American Venture Capital industry. The pool
of US venture funds – partnerships specializing in early stage equity or equity-linked investments in young or
growing firms – has grown from just over USD 1 billion in 1980 to about USD 29.4 billion in 2011. (NVCA, 2012)
Much of this growth seems to have bypassed Europe. European VC’s have long been overshadowed by the funds
specializing in buy-outs and other later-stage transactions: not only has the level of such activities been far lower
than elsewhere, but so have the returns. While there was a brief surge of European venture capital activity in the
late 1990s, it proved short lived and many of the new entrants collapsed early in the next decade. Many of the
policy initiatives of that era, such as the creation of the pan-European EAASDAW market for young growth
companies, and the First North market in the Nordic countries, have been written off as failures.
The European Venture Capital emerged about 20 years after the US emerged in the 1960’s in Boston,
Massachusetts investing in young technology firms. In the early 1980’s, the European Venture Capital invested
around 1/8 of the equivalent of their US counterparts. (Roure, Keeley, & van der Heyden, 1990) Furthermore, this
gap seems to be widening, especially within the information technology sector, proven with data from Jeng, Wright,
Mason, Sapienza, Friend and Manigart, that suggests that the rate of success of venture capital-backed startups in
Europe is far less than that of the U.S. (Jeng, 2000), (Wright, Robbie, Albrighton, Mason, & Harrison, 1998)
(Sapienza et al.; Burton), (Friend and Manigart) The scope and sophistication of the venture capital industry in the
US is one reason for the exceptional ability of the US to continually nurture new global and trailblazing information
8 | Page
technology gazelles, as well as other industries, such as Cleantech and Biotech. According to Jeng and Well, in
comparison to European venture capitalists, the propensity and frequency at which high growth information
technology start-ups which are developed by US venture capitalist are much higher.
Venture capitalists are today regarded as key actors in well-integrated innovation systems. (Cooke et al., 1997;
Florida and Kenney, 1988; Kenney, 2011; Powell et al., 2002; Samila and Sorenson, 2010) Persuaded by the belief
that venture capital firms are the ideal partners for financing corporate research and development, many OECD
governments have sought to promote innovation by channeling public funds to venture capital firms, securing
favorable fiscal and regulatory frameworks and directly mobilizing venture capital firms in support of small,
innovative firms. (EVCA, 2012; OECD, 1997)
To maximize the effectiveness of these policies it is important to understand exactly where in the product
development process venture capital firms (VCs) are most likely to enter (research or development) and how this
affects invention and contributes to create sustainable businesses that will grow with the economy. Theoretically
public agencies might find themselves in one of the following three scenarios:
- First, VCs might target their funding and managerial efforts both to research and development
- Second, VCs might focus only on ventures in the developed stage
- Third, VCs might focus exclusively on the commercialization of preexisting inventions, leaving both
research and development out of their boundaries
Denmark has frequently been seen as one of the biggest knowledge hubs, with a high educational level and an
entrepreneurial mindset, compared with similar Nordic and European countries (European Commision, 2012).
However, the Danish knowledge society has for many years been less superior when it comes to innovative
ventures and their success rate. Historic numbers show that the number of ventures who have succeeded has long
been overtaken by other Nordic and European counterparts, and so has the perceived number of discontinued
ventures (Zephyr, 2012). More so, there have been fewer successful tech firms in Denmark compared with other
European countries, and in many cases it has proven that “Danish” ventures in foreign countries have been more
successful. (TV2, 2012) Especially the US venture capital industry has carried out many successful startups, such as
Google, Instagram, Facebook, Etsy, Zoosk, Xirrus, etc. which and hereby helped innovative initiative to grow
within the US, and also creating economic value in the end, especially through job creation.
This research study deals specifically with the differences in the financing of start-ups within the technology
ecosystem in US, UK, Israel and Denmark. The study will map the difference between these countries and the end
discuss will focus on what could be done in the Danish Venture Capital Industry to make a better ecosystem for
innovative ideas in the future.
9 | Page
The thesis is structured as follows: The first three sections present the theoretical review on both innovation and
venture capital theory, which ends up in a theoretical discussion on the venture capital impact on innovation and
economic growth. In section four a short macroeconomic analysis is made on the four countries in the peer group,
which will be include in the hypotheses development. The fifth section gives an introduction on the research
framework and the hypotheses developments followed by a sixth section that analysis the above findings. A
discussion based on the previous section will be made based on what can be done within the Danish venture
Capital environment to enhance the spur of innovation within the tech industry. The paper will summarize with a
selection with a conclusion, limitation and further research based on the findings within this paper
1.2 Research Objective Differences in Venture Capital markets are well documented and argued for in various articles and papers, as well
as new stories on electronic platforms such as Techcrunch and Gigaom. (PWC, 2012), (Nesta, 2010) and
(Lindström, 2006) Differences on different continents, countries, regions and even cities have been enlighten the
last couple of decades (European Venture Capital, Financial Systems, Corporate Investment in innovation, and
Venture Capital), where the majority of the research projects have had the objective to show the differences from
an European and US perspective. This research acknowledges that there are differences on multiple levels within
venture capital and also internal differences within a country itself, such as, Boston to New York, London to
Birmingham and even Copenhagen to Aarhus. These differences, with some of them of notable significance, have
been neglected within this research paper and each country (UK, US, DK, IL) is seen as homogeneous clusters.
Therefore, the assumption of this empirical research study is:
There is a U.S. way of venture capital financing of startups, which is homogenous and there are
therefore no regional differences
There is a UK way of venture capital financing of startups, which is homogenous and there are
therefore no regional differences
There is a DK way of venture capital financing of startups, which is homogenous and there are
therefore no regional differences
There is a IL way of venture capital financing of startups, which is homogenous and there are
therefore no regional differences
With the above definition of the homogenous clusters per country in place, we therefore have a comparison of four
different countries. The study is both a descriptive, and a comparative analysis of each country and the goal is to
identify differences between the four countries, and hereby analyze the differences with an innovative perspective,
and identify some of the reasons why the US venture capital market has been and still is superior to the European
markets.
The differences are to be analyzed for the from the due-diligence phase until the exit phase within the venture
capital investment cycle: due diligence phase, investment stage, deal structuring and negotiation phase, management
10 | Page
phase – value adding services, and exit phase. The thesis will therefore not look into the differences in the contact
and investment criteria phase, but these phases will also be mentioned in short in the introduction to the venture
capital industry. In regard to the venture capital investment process, this empirical research aspire to answer the
following research question, propositions’ and phenomena:
What are the differences in the way US start-ups are financed with venture capital compared with the UK,
IL and DK way, and to what extent can these countries learn from the differences to help spur more
innovation within these countries?
More accurately, the thesis attempts to compare, highlight and answer the following questions:
Is the average size of investment in start-ups in the seed, start-up and growth stage in the US Post
Exchange rate adjustments larger than in UK, IL, and DK?
Is the risk strategy of the venture capital firms in the US more aggressive, and less risk averse than
in the UK, IL, and DK?
Is the percentage of due diligence (market, product, financial and team) analysis that is done
informal in the US bigger than in the UK, IL, and DK?
Do US venture capital firms add more value to their portfolio companies than their UK, IL and
DK counterparts?
Are the exit-channels different in the US compared with the UK, IL and DK counterparts?
This paper should be seen as an outline of the differences of the venture scenes in the United States, United
Kingdom, Israel and Denmark, with the purpose to show the main differences that spur innovation from a Venture
Capital perspective. In addition, the paper will manly take part in the microeconomic perspective, and only in short
discuss the macroeconomic take on the differences.
1.3 Research Method This thesis aims to answer the stated research question by employing three complementary research methods:
Literature review
Qualitative study
Quantitative study
First, the most relevant academic literature about venture capital, innovation and economic growth is reviewed. The
main focus is upon papers studying the differences in the venture capital financing in different countries, as well as
how venture capital spurs innovation. The purpose of the literature study is to give an overall picture of the
academic research in the domain of the research question and to obtain a theoretical framework on which the
empirical part of the thesis can be built. The literature review is also utilized to identify the best and most recent

11 | Page
methods for the quantitative part of this thesis. In addition, the empirical review of the literature within the topic of
Venture Capital to spur innovation looks to show that a better Venture Capital industry within an economy will
spur the national innovation and therefore create economic growth. The reviewed materials include articles in
scientific journals, textbooks, publications from venture capital industry associations, and other academic materials.
The empirical part of this thesis starts with an interview study based on 11 interviews with business angels,
entrepreneurs, venture fund managers, and other industry experts, from the UK, IL and DK. The objective of
these interviews where to obtain a better understanding of how venture capital companies are managed, what kind
of criteria they use in their investment decisions, and how they interact with their portfolio companies. This also
offers us an idea of what entrepreneurs and business angels see as the biggest challenges and differences between
the different countries. By interviewing experts in the field of venture capital, it is possible to ensure that all relevant
theories and hypotheses for the determinants of venture capital returns have been identified in the literature review
part of this thesis. Otherwise, there would be a risk that the academic literature on the subject has not identified all
relevant performance determinants. This might be true since, there are currently surprisingly few academic papers
concentrating purely on venture capital and its connection with innovation. The literature reviews, as well as the
qualitative study, have helped to develop the hypotheses in the thesis, which is to be analyzed from the quantitative
date study.
The most important part of this thesis is the quantitative study, which aims to analyze the differences in the
approach of the venture capital funds in different regions of the world. The findings and insights from the previous
research methods are used as inputs in the form of hypotheses development and therefore the groundwork for the
analysis. The objective of the analysis is to explain, at least partially, the observed differences between the four
different countries and their way of investing within young ventures, by finding statistically significant explanatory
variables. The research study employs secondary data collected from previous research for data on the US and UK
venture capitalist, as well new data collected from a question guide similar to the one used in the afore-mentioned
data research for the DK and IL venture capitalist. The quantitative study is done through 69 data points from the
US, 17 in the UK, 19 in the IL and 11 in DK. The collected data is in some cases analyzed statistically using
econometric methods, and some is compared by a simple average mean.
After the main differences have been identified, the study aims to give some practical suggestions on further
research in order to improve the Danish venture capital scene, given the findings in the US, UK and IL venture
capital markets.
12 | Page
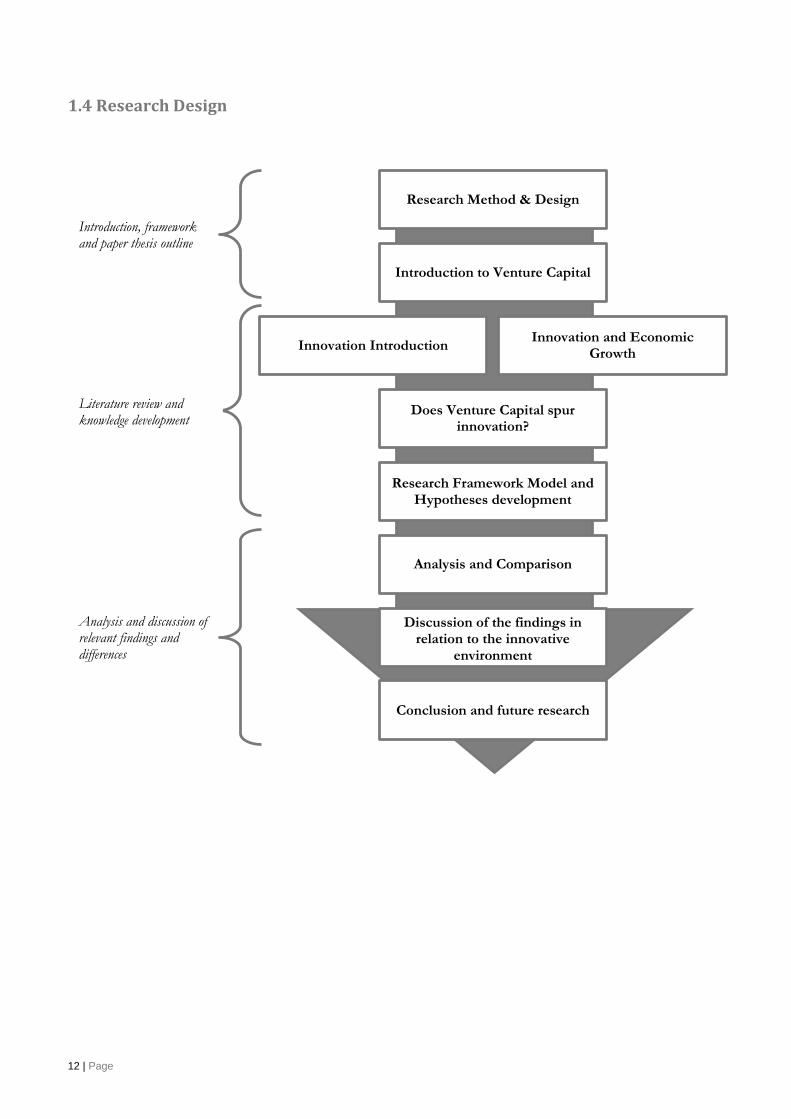
1.4 Research Design
Research Method & Design
Introduction to Venture Capital
Does Venture Capital spur innovation?
Introduction, framework and paper thesis outline
Literature review and knowledge development
Analysis and discussion of relevant findings and differences
Research Framework Model and Hypotheses development
Analysis and Comparison
Discussion of the findings in relation to the innovative
environment
Conclusion and future research
Innovation and Economic Growth
Innovation Introduction
13 | Page
2. Introduction: Venture Capital Financing of Start-Ups in Business Administration Theory
2.1 Definition of Venture Capital Though Venture Capital has been a term used extensively, “venture capital” has yet to be defined in business
literature, thus several researchers in the field have come up with their own definition: Venture capital is a segment
of the private equity industry, which focuses on investing in nascent young firms with high growth rates, and large
market potential (Haeming, 2003). Private equity includes all equity invested in corporations that are not listed on
stock exchanges, whereas venture capital is a private or institutional investment limited to relatively early-stage
companies (Arundale, 2007).
Many people have given their own definition of what venture capital is; common between them all is that they see
private capital invested in young risky assets, often very early in the business cycle of a start-up. In the next section
some basic terms within venture capital will be introduced, which are important for understanding the purpose and
the background of the main problem in this paper.
2.2 Equity Financing: Venture Capital Financing A start-up or innovation requires capital during the formation of the idea. One of the main problems many start-
ups have realized today in the process of starting a new venture/innovation is raising capital. Within the idea
generation (innovation process) start-ups need capital to finance cash flow needs long before demand and revenue
materialize. (Sherman, 2005) Typical characteristics of the financial needs of start-ups can be described as following:
Start-ups often have little history and thus possess no fundamental customer base and financial data, which
would make it difficult to create a reliable financial valuation
Start-ups are often considered by a high level of uncertainty and risk both internally and externally -
management team risk, product development risk, market risk, and exit risk
Start-ups are more likely to seize up in the market compared with established businesses are
They often do business in dynamic and perpetually evolving markets with extensive growth rates, such as
IT, BIO, Pharma, Cleantech, etc.
They often have a negative cash flow the first couple of years and are not expected to make any profits in
the forthcoming years
Business decisions are predominantly made by founders with industry knowledge but lack of management
and established business administration
The start-up is provided equity funding by early stage investors, such as venture capitalist and business
angels, who in return obtain equity share, voting and control rights
Start-ups often have a strong technology orientation
14 | Page
With no or limited operating history, missing hard-knock financial data and no collaterals, start-ups cannot raise
funds by taking loans or issuing debt securities – at least not at any favorable interest rates. Therefore, start-ups
often rely mainly on equity capital in financing entrepreneurial venture or through crowd funding.
As a result, venture capitalist and other early stage investors, make the decision whether to fund a project often
based on the perceived strength of an idea, capabilities, scalability, originality, skills and quality of the management
team. Venture capital have often been the preferred financing path for many start-ups due to the reason that start-
ups have no or limited access to debt financing.
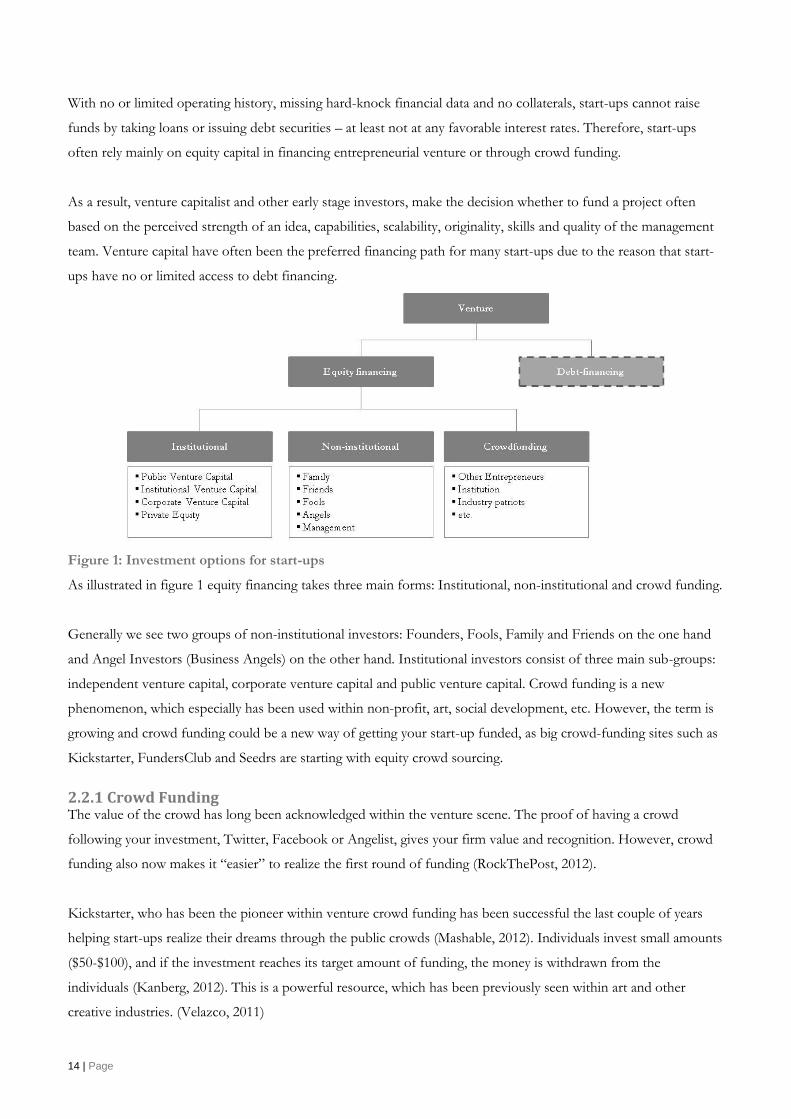
Figure 1: Investment options for start-ups
As illustrated in figure 1 equity financing takes three main forms: Institutional, non-institutional and crowd funding.
Generally we see two groups of non-institutional investors: Founders, Fools, Family and Friends on the one hand
and Angel Investors (Business Angels) on the other hand. Institutional investors consist of three main sub-groups:
independent venture capital, corporate venture capital and public venture capital. Crowd funding is a new
phenomenon, which especially has been used within non-profit, art, social development, etc. However, the term is
growing and crowd funding could be a new way of getting your start-up funded, as big crowd-funding sites such as
Kickstarter, FundersClub and Seedrs are starting with equity crowd sourcing.
2.2.1 Crowd Funding The value of the crowd has long been acknowledged within the venture scene. The proof of having a crowd
following your investment, Twitter, Facebook or Angelist, gives your firm value and recognition. However, crowd
funding also now makes it “easier” to realize the first round of funding (RockThePost, 2012).
Kickstarter, who has been the pioneer within venture crowd funding has been successful the last couple of years
helping start-ups realize their dreams through the public crowds (Mashable, 2012). Individuals invest small amounts
($50-$100), and if the investment reaches its target amount of funding, the money is withdrawn from the
individuals (Kanberg, 2012). This is a powerful resource, which has been previously seen within art and other
creative industries. (Velazco, 2011)
15 | Page
Today there are several crowd funding sites as Kickstarter, GrowVC, Fundrs, RockThe Post, Seedups, RocketHub,
FoundersClub etc. Crowd funding platforms have already revolutionized the funding of new ventures. However,
the management of all the new shareholders is a new issue raised by many experts. People who have either donated
or invested in your firm all have the right to be informed in decision making as other shareholders, which can bear
costs on the firm such as limiting the innovativeness of the ventures. Research on this field is still to be carried out,
and the results are going to be interesting. In addition, the value adding aspect of expert and knowledge of the
market will often not be part of the equity financing, within crowd funding.
Even so, crowd funding could be a new aspect of Venture Capital, and engage more start-ups and maybe even spur
innovation even more. However, this paper is not focused on crowd funding, and its importance for the future of
venture capital, even though it might have some important aspects. In addition, the aspect of comparing different
nations’ innovative process is limited as the crowd sourcing is global and therefore all start-ups are given the same
opportunity to become successful.
2.2.2 Institutional Venture Capital “Institutional Venture Capital” used as a term can be traced back to the year 1946. General Georges Doriot, Ralph
Flanders, Karl Compton, Merrill Griswold, and other angel investors with interest in investing in start-ups or other
early stage actives, established the first institutional venture capital firm “American Research & Development” in
Boston. (Bygrave & Timmons, 1986) In recent years, Haeming defines institutional venture capital as equity or
equity-linked investment in young companies, where the investor is a financial intermediary, who typically acts as an
active director or advisor in the young company. (Haeming, 2003)
National Venture Capital Association (NVCA) defines institutional venture capital as private, corporate or public
funds that focus on investments in early stage technology companies. (NVCA, 2012) Institutional venture capital
firms are financial intermediaries, who specialize in raising funds from private, corporate or public sources and
investing it in young innovative technology companies with high risk and growth potential. (Bygrave & Timmons,
1986)
Institutional investors often invest when the start-up has established some kind of “proof-of-concept”, and thereby
lower the risk of the investment significantly. As a result, institutional venture capitalists invest in start-ups after
they have been funded with non-institutional venture capital or crowd funding scenarios. In contrast to the latter,
institutional venture capitalists are very formal, highly professional and do not invest their own funds. They are
fund-managers who are employed to invest and manage custodial money, i.e. funds from third parties such as
wealthy individuals, banks, insurance, university endowments, and pension funds. As depicted in fig 2.2, there are
three main types of institutional venture capital: corporate venture capital public venture capital and independent
venture capital. The source of funds, investment objectives, organizational structure, investment behavior, range of
16 | Page
non-financial value – added services and legal forms vary across all three types of institutional venture capital firms.
(Landström, 2007)
The most common way of financing start-ups around the world is still venture capital financing. Even though
crowd funding seems to be very popular, especially in the US, crowd funding is only a small amount of the total
invested capital in start-ups (CrunchBase). This thesis will therefore continue to look at independent venture
capital, which is often referred to as “traditional capital” and also seen as the majority of capital for start-ups in the
countries of DK, UK, IS and US (Lumme, Mason, & Suomi, 1998)
2.2.3 Independent Venture Capital (IVC)
2.2.3.1 Definition and Characteristics of IVC Financing IVCs are neither a subsidiary of a corporation nor do they exist to fulfill government economic policy tasks, but act
as stand-alone venture capital firms. They are normally representative of a small team of administration and
industry experts and therefore also flexible, which allows them to make quick decisions. Furthermore, IVCs are
often set up as limited partnerships in which the venture capital manager is the general partner who invests money
contributed by limited partners. Consequently, IVCs have large investment capacities and monitor start-ups
through formal control. (Nesta, 2010)
IVCs do not invest the whole amount that they raise into start-ups. Often there is a management fee of 1-3% of the
capital raised, to cover up the overhead costs of running a venture capital firm over the life of the fund. For
example, if the IVC raises 800 MDKK of a fund over 10 years, with a 2% management fee, the IVC charges 2% of
the 800 MDKK every year, which amounts to 160 MDKK (20% of 800 MDKK) over the life of the fund.
Therefore the total amount invested would only be 80% of the total amount raised. (Sbietiati, 2012) (VCIC DK,
2012)
Some cases of IVC have a management fee for the total amount raised and thereafter the management fee changes
for the percentage of the total amount invested. Often you see more deals in the end of a fund, since this will affect
the wage of the management in the IVC in active period of the fund. (Sbietiati, 2012) (VCIC DK, 2012)
In addition, if an IVC at the end of the life of a venture capital fund returns more money to limited partners than it
raised, the IVC receives a percentage of the profit. This part of the profit allocated to an IVC is called carried
interest (carry). Carried interest ranges from 20-30% of capital gain in the VC industry. (Sbietiati, 2012) (VCIC DK,
2012)
IVC have some certain criteria they look at before investing: (VCIC DK, 2012)
- High Return (Potential Revenue): IVCs are focused purely on financial gains and making big exits
17 | Page
- Market Size: To realize a high return the potential market has to follow the business ideas well augmented
revenue stream, otherwise VCs would not see any reason for investment
- Team: IVCs place enormous emphasis on the management team, much more than the business idea itself
– placing a bet on the jockey, not the horse
- Innovative ideas: IVCs look at the frontier of today’s technology for ideas and scientific advances that
will create tomorrow’s technologies. From there they try to identify start-ups that fit into that framework
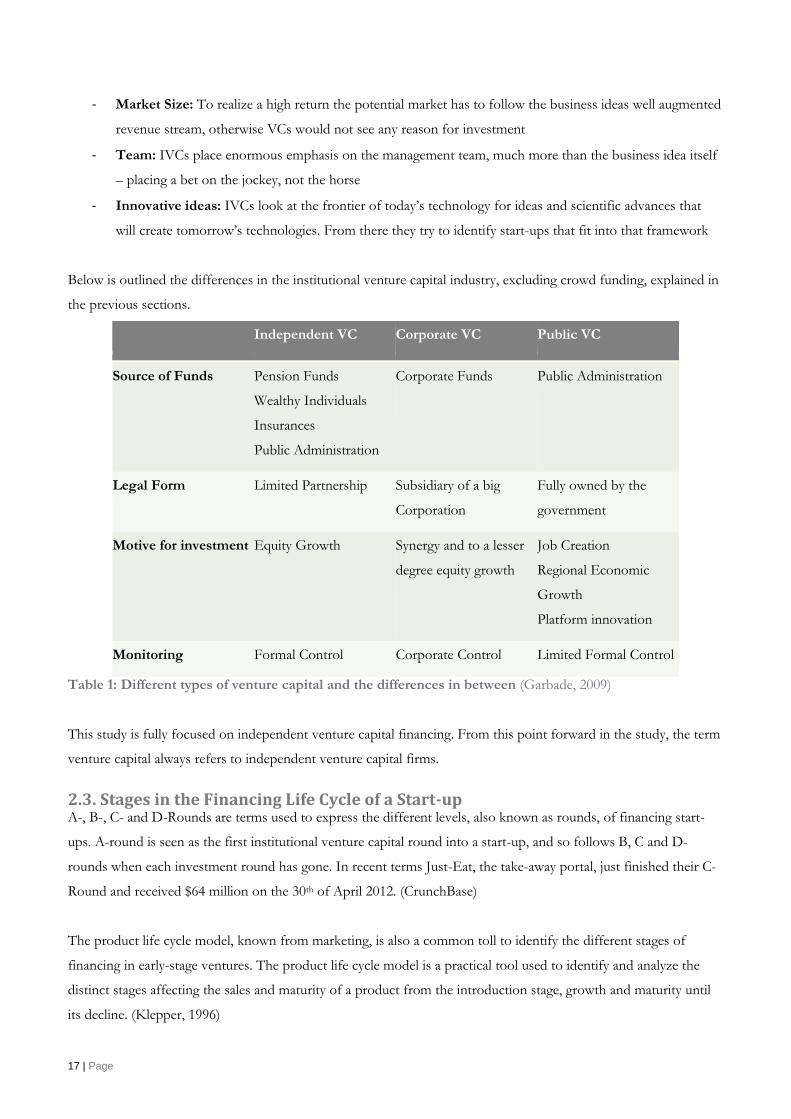
Below is outlined the differences in the institutional venture capital industry, excluding crowd funding, explained in
the previous sections.
Independent VC Corporate VC Public VC
Source of Funds Pension Funds
Wealthy Individuals
Insurances
Public Administration
Corporate Funds Public Administration
Legal Form Limited Partnership Subsidiary of a big
Corporation
Fully owned by the
government
Motive for investment Equity Growth Synergy and to a lesser
degree equity growth
Job Creation
Regional Economic
Growth
Platform innovation
Monitoring Formal Control Corporate Control Limited Formal Control
Table 1: Different types of venture capital and the differences in between (Garbade, 2009)
This study is fully focused on independent venture capital financing. From this point forward in the study, the term
venture capital always refers to independent venture capital firms.
2.3. Stages in the Financing Life Cycle of a Start-up A-, B-, C- and D-Rounds are terms used to express the different levels, also known as rounds, of financing start-
ups. A-round is seen as the first institutional venture capital round into a start-up, and so follows B, C and D-
rounds when each investment round has gone. In recent terms Just-Eat, the take-away portal, just finished their C-
Round and received $64 million on the 30th of April 2012. (CrunchBase)
The product life cycle model, known from marketing, is also a common toll to identify the different stages of
financing in early-stage ventures. The product life cycle model is a practical tool used to identify and analyze the
distinct stages affecting the sales and maturity of a product from the introduction stage, growth and maturity until
its decline. (Klepper, 1996)
18 | Page
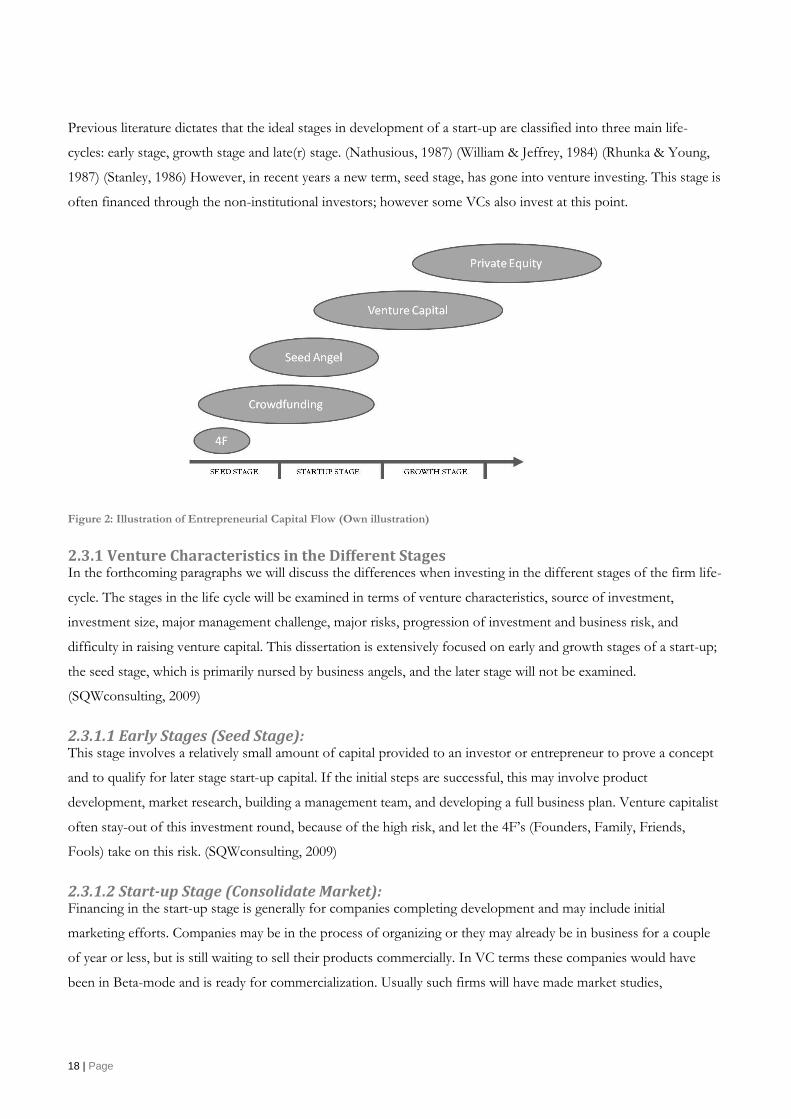
Previous literature dictates that the ideal stages in development of a start-up are classified into three main life-
cycles: early stage, growth stage and late(r) stage. (Nathusious, 1987) (William & Jeffrey, 1984) (Rhunka & Young,
1987) (Stanley, 1986) However, in recent years a new term, seed stage, has gone into venture investing. This stage is
often financed through the non-institutional investors; however some VCs also invest at this point.
Figure 2: Illustration of Entrepreneurial Capital Flow (Own illustration)
2.3.1 Venture Characteristics in the Different Stages In the forthcoming paragraphs we will discuss the differences when investing in the different stages of the firm life-
cycle. The stages in the life cycle will be examined in terms of venture characteristics, source of investment,
investment size, major management challenge, major risks, progression of investment and business risk, and
difficulty in raising venture capital. This dissertation is extensively focused on early and growth stages of a start-up;
the seed stage, which is primarily nursed by business angels, and the later stage will not be examined.
(SQWconsulting, 2009)
2.3.1.1 Early Stages (Seed Stage): This stage involves a relatively small amount of capital provided to an investor or entrepreneur to prove a concept
and to qualify for later stage start-up capital. If the initial steps are successful, this may involve product
development, market research, building a management team, and developing a full business plan. Venture capitalist
often stay-out of this investment round, because of the high risk, and let the 4F’s (Founders, Family, Friends,
Fools) take on this risk. (SQWconsulting, 2009)
2.3.1.2 Start-up Stage (Consolidate Market): Financing in the start-up stage is generally for companies completing development and may include initial
marketing efforts. Companies may be in the process of organizing or they may already be in business for a couple
of year or less, but is still waiting to sell their products commercially. In VC terms these companies would have
been in Beta-mode and is ready for commercialization. Usually such firms will have made market studies,
19 | Page
assembled the key management, and developed a business plan – and are now ready to conduct business.
(SQWconsulting, 2009)
Furthermore, financing in the later phase of the start-up stage could also increase the valuation, total size and the
share price for companies whose products are either in development or are commercially available. Due to the stage
of the venture and the outlook to commercialize the products in the near future, this round of financing, would
often be the first sign of engagement of a venture capital fund. Seed and early start-up financing tend to involve
angel investors more than institutional investors. The networking capabilities of the venture capitalists are used
more here than in the more advanced stages. (SQWconsulting, 2009)
2.3.1.3 Growth Stage (Expansion Stages) This stage is mainly focused on applying working capital to the initial expansion of a company. The company is
now producing, shipping, and have growing accounts receivables and inventories. It may or may not be showing a
profit. Some of the usage of capital may include further plant expansion, marketing, or development of an
improved product. Other institutional investor is likely to be included along with initial investors from previous
rounds. The venture capital’s role in this stage involves a switch from a supporting role to a more strategic role.
(Metrick, 2006) and (SQWconsulting, 2009)
Throughout these stages several management challenges and risks are essential to overcome, before any success can
be achieved.
2.3.2 Structure of Independent Venture Capital Firms VCs are becoming more and more specialized, both within industry focus and investment stage. Thomas Knudsen
from NorthCap Partners states that VCs typically specialize by focusing on a particular stage of the business
lifecycle. (Knudsen, 2012) Looking further into the business cycle VCs can be assessed within two main criterion:
Stage of investment
Investment horizon
Based on Figure 2 of the capital flow of investment, VCs often invest in the Start-up and Growth Stage of the
development of the firm. There are however also venture capital firms that specialize in investing and managing
start-ups in the seed. These are VCs whose funds are not very big, but who invest a lot of time and huge personal
management resources in the start-ups they invest in.
Many venture capital firms fall into the class of growth venture capital. This is normally the ideal stage, where
venture capital firms can add maximum value, namely assisting a start-up strategically and operationally to expand
in their home markets and expand into new (international) markets. Even so, there are VCs who invest in all of the
above stages, because of their internal portfolio companies and external network, to help and improve the chance
of success of the start-up.
20 | Page
Depending on the prospect of the investment, VCs tend to have a long horizon to build up a strong business case
and make the start-up profitable. Of course, the horizon depends on the time of investment (what stage), which has
been clarified above. Many VCs plan to exit within 5-7 years, as the firm should have proven to take a certain
market share in that time. One thing to keep in mind is that the start-ups that VCs invest in should be highly
growth orientated and therefore also expand rapidly into new markets.
2.3.3 Role of Independent Venture Capital Firms in Start-ups The role of VCs in start-ups is focused upon the specific added-value that VCs add in each stage of the lifecycle.
This paper discusses this by looking at how VCs support and create success for the different start-ups, and thereby
create more value and improve the rate of success in each stage. The thesis will only look at the early stage up until
the growth stage, and the later stage is therefore completely excluded in this research.
“Venture capital is more than money – venture capitalists bring valued added” – this phrase is what many sees as
the big difference, compared to bank loans and other debt orientated loans. (Kølendorf P. , 2012) Today many
recognize this term as smart-money. Whereas, dumb money is simply money where capital is the only value added.
Haeming portends that it is important to draw upfront a distinction between founders and entrepreneurs; a founder
has a lot of analytical skills but little or no idea about the market, whereas an entrepreneur is a person with
knowledge in all aspects of technology, market, finance, and people skills. (Haeming, 2003) VCs are often well
suited to fulfill these gaps of start-up founders. They have money and expertise in commercializing business
models. VCs have good access to capital, are endowed with managerial experience and often have comprehensive
knowledge of the targeted industry, and count on a well-developed network of suppliers, customers and key
personnel. Seppa and Hsu even displayed in empirical research that entrepreneurs are willing to accept lower
valuations and face higher dilution, only due to the expectation that VCs will contribute more to the future value of
their venture. (Seppa, 2002) (Hsu, 2004)
All the professional assistance that VCs deliver to start-ups can be categorized into social capital and human capital.
Human capital refers to managerial and entrepreneurial experience, whereby social capital relates to professional
contact networks that VCs provide, through their long experience within the market. This paper's research did not
uncover a specific list of what value added services VCs provide, however through interviews and readings on the
topic we have listed the following as the most important features of a VC in terms of added value:
Monitor – VCs monitor start-ups through their voting and control rights. They act as strategic generators
of sound board members for strategic initiatives
Advisor – VCs role as an advisor/consultant is probably one of the most value-adding services to new
entrepreneurs/founders. The VCs have had an enormous experience within the industry and knows what
to do in certain cases; this will often mean that the VC will succeed instead of fail. Services could be:
21 | Page
Proactively consulting in important decisions, helping executing strategies, operational issued internal
disputes, financial management, marketing, public relations, etc.
Interim Manager – In certain situations (often in the seed-stage), VCs take the role of interim managers
carrying out day-to-day operational activities. VCs helps on executing ideas and tasks, which the current
management will or could not achieve
Contact Networker – On the same page as the advisor role, the VC network is one of the most valuable.
Young entrepreneurs often lack a strong business network, due to their limited time in the “market”.
(Kølendorf P. , 2012) VCs fill this void by making strategic introduction of start-ups to the extensive
networks they have cultivated over a long period of time: customer introduction, portfolio company
introduction, strategic alliances within the VC industry, etc.
Motivator – VCs automatically take the role of mentor and motivator of the entrepreneurial teams they
invest in. They teach young founders and inspire them to work harder and goal-orientated in making the
start-up a success
Proof-of-Concept (Reputation) – Often start-ups get a “boost-of-confidence” and recognition within
the industry, when they get backed by a VC. This proves that the start-up has gotten through the “keyhole”
and that your idea has a high potential (Watzenig, 2012)
Portfolio alliances – Portfolio alliances is also seen within Private Equity. VC has many portfolio firms,
and the potential of becoming customers and partners in-between are high. Therefore, start-ups can realize
a set of new customers from which they can learn from in both the alpha and beta stages.
In the growth stage the role of the VC is more on acting as monitors, operate as directors on the board, and having
an outside-in overview of the whole development of a start-up and advising on important legal agreements and
contracts. (Broomfield, 2005) In this phase VCs help in reshaping the start-up in building a professional
organizational structure as it grows. Within this stage, changing the management team could be necessary, since the
one who founded and made the company grow, is probably not the right individual to ensure that the start-up is a
success in the next phase. VCs therefore also helps hiring people with experience within the industry and stage of
the start-up.
Start-ups that are backed by top-tier VCs can cherry pick their local alliance partners because of the name
association with coveted VC firms. In the role of a mentor in the growth phase, VCs are the entrepreneur’s
confidants with whom founders share their personal entrepreneurial problems and thoughts.
2.4 Theoretical Foundation for Explanation of the Behavior of Venture Capital Firms Start-ups and VCs tie their specific knowledge, capabilities and resources together to build a start-up that, with
these combined aspects, will have an increased chance of success. In this relationship, the VC signs contracts with
the start-up and hereafter delegates the mandate to manage the employees and the daily operation to the founders.
22 | Page
Typically in such a deal, the start-up brings the business idea, product and the people to the negotiation table,
whereas the VC often brings capital and value-adding-services, explained earlier in this section.
VCs attain a large influence in the start-up, when buying the equity of the founders and the founders are in fear of
losing control over the firm. Hence, problematic issues and conflicts can arise, when the founders of the start-up
and the VC have diverging interests and goals. The relationship between the founders of the start-up and the VC
are complex. On the one hand they have engaged in a marriage often up to a decade long, and on the other hand
the VC needs to govern the founders, and make sure that the start-up is developing as expected. The founders
could become free-riders coasting on the investment of the VC, and seek other opportunities. Agency risk is a
significant hurdle to overcome for VCs and relies on good due diligence work and people skills.
2.4.1 Agency Theory Model: Asymmetric Information, Moral Hazard and Adverse Selection An agency relationship is a relationship in which one party (principal) delegates work to another party (the agent) to
perform a job as defined in a contract. (Eisenhardt, 1989) Looking at the VC/founders conflict with an agency
theory perspective of Eisenhardt, the VCs take the role as the principal and founders takes the role as the agent.
Because the contract of the VCs and the founders is not contractually well defined, the founders of the funded
start-up could act/behave reluctantly towards the VCs. The two most important appearances of agency risk within
early venture financing are information asymmetries and goal incongruences. Cable and Shane define information
asymmetry as all the hidden (private) information that a founder or VC holds which is not necessarily readily
available to the other transaction partner. Research has in addition shown that there is a perception from founders
that the relationship with BAs (Business Angels) is better than the one they meet within VCs. (Fairchild, 2011)
Through interviews and talks with both BAs and VCs they more or less all identified three main information
asymmetry aspects: Capabilities, Intention, and Actions:
Capabilities is often an aspect which VCs try to limit through thorough research in the due diligence
session. However, it is difficult to see if the founders have the characteristics and capabilities’ to make this
venture a success
Intention is also difficult to measure. VCs will not know the founders real intention with their venture
before they have worked together in a couple of months/years. Furthermore, this information asymmetric
goes both ways. VCs will also see their knowledge and intention hidden for the founders of the firm.
Actions (moral hazard) of the founders can lead to huge successes or dramatic losses from one day to
another. VCs will have a hard time governing and controlling founders on a daily basis, Founders of the
start-up will therefore have the space and opportunity to act against the strategy which the VCs have set
for the venture.
23 | Page
Both the VCs and founders need to limit the asymmetry of information to engage in a healthy relationship and
make the best of their future work. If the goals of the VC and the founders are aligned, all actions by the founders
will lead to a concomitant maximization of the utility of the principal and agent. Both parties therefore have some
basic tools to limit this asymmetry, which will be discussed in the next section of agency risk.
2.4.2 Mitigation of Agency Risk The more the interest of the VC and the founders are aligned, the higher the likelihood of cooperation in-between
the VC and the founders on a long-term, which will without a doubt increase the chances of a successful venture.
In mitigating agency risk, the following specific mechanisms and contractual provisions, which align the interests of
both transaction partners, can be deployed. (Kaplan, 2003)
1) Screening of founders and investment opportunity is the most important factor of limiting or mitigating
agency risk within a given investment opportunity. The ability to attract and screen the right people and
business plans is a difficult task, and the ability of recognizing untruthful founders is generated through
experience rather than haven a certain checklist etc. (Rasmussen, 2012)
2) “Hand-on-the-hob” is also a great way to make sure that both parties need to perform and create value.
Witteloostuijin argues that having a substantial stake of ownership in a firm, team members may have a
greater incentive and commitment to leverage their human capital to enhance organizational performance.
(Witteloostuijin & Wijbenga, 2006) This view is often also seen within a private equity perspective, where a
lot of knowledge within the top-management has to perform to create future value within the target firm
(Splid, 2007)
3) A suitable contract requires a venture capital contract designed to align the interests of both the VC and
founders – a contract which maximizes the value of both parties. This requires that the contract should
contain both legal and financial consequences in case of severe violation. (Cable & Shane)
4) Comparable with the private equity market performance-based allocation of stock options, or other
financial incentives, to founders has historically proven to be a effectual method of increasing the efforts of
the founders (Splid, 2007)
5) Milestone Financing of a start-up in stages induces founders to fulfill and behave honestly of the given
terms, because a VC can withdraw from an investment at the next milestone if not fulfilled (Wright &
Robbie, 1998)
6) Monitoring through board positions: Through board representations, which entails voting rights,
information and approval rights, VC can gain a strong control leverage of the founders of the start-up.
7) Post-investment involvement from the VCs with the founders will make a stronger commitment, and the
possibility of the founders to feel more connected with the VC, will increase. Also, the founders might find
it more difficult to “go-their-own-ways” if the VCs are actively present and involved in strategic decisions
(Cable & Shane)
24 | Page
There are several ways in which VCs and founders can mitigate the asymmetry information. If you go on top of the
seven options, you can extract two main characteristics you should take action upon when deciding to fund a
certain start-up. Contractual design and active involvement, will limit the asymmetry information significantly,
however, it will be impossible to eliminate all asymmetry. (Lerner & Schoar, 2004)
2.5 Typical Venture Capital Investment Process: VC Investment Cycle The investment process can vary from one VC firm to another; however it typically involves five aspects. The
process starts with the sourcing and screening of ideas, followed by due diligence, negotiating the terms of the
forward work, post-investment monitoring/involvement, and generating return (exit phase). Generally, as stated
previously, the most important, and also the most common deal breaker, is the lack of faith in the current
management team and their abilities to execute the business case. The next section will briefly discuss every step of
the venture capital investment cycle.
2.5.1 Contact Phase Time is limited and is one of the most valuable resources for both VCs and Business Angels. Often cold calls, e-
mails and letters are therefore seen as “spam”, and even though many proclaim that they try to answer all inquiries,
time is limited and often the answers are given without even looking at the business plan. (Kølendorf P. , 2012)
(Buch, 2012) The only qualified deal flow routes are through strategic referrals or direct contact with a VC at an
industry event, but the strategic referral is the primarily preferred source of deal flow. Angel.co is a platform
actually based on this approach, trying to connect start-ups through network of referrals and sponsors, where
getting the right sponsor/referral could mean the difference between finding capital or not. VC’s prefer to rely on
their intimate network for new investment opportunities.
“I have invested in five different businesses now, but they all have one thing in common: I trust and know the people who have
either referred me to the cases or they are involved within the case. In my experience this is the same for many VC’s I have
encountered with my work at Just Eat” (Buch, 2012)
Even though Angel.co and crowd sourcing platforms have changed the way start-ups can promote themselves and
get social proofing, the financing part is still done through referrals either virtually or in person, and the basic
investment are therefore often linked to the personal connection. Effective networking with sponsors and referrals
of a VC is therefore paramount to receive funding. Sponsors can be angels, attorneys, accountants, consultants, or
venture capital networks. The best sponsors would however always be the ones who are within the VCs’ inner
circle; an investor or some management from previous investments who have performed. (Cardis, 2001)
Generally there are four possible deal “flow-routes” to approach a VC with the investment opportunity.
1) Strategic referral or sponsorship contact
2) Direct contact with a VC at an industry event
3) IT platforms: (Angel.co, Angellist), crowd sourcing platforms (Kickstarter, Seedrs, Fundrs), etc.
25 | Page
4) Cold contact through, mail, telephone, or letter
If it is not possible to find a suitable sponsor and investor, the next step should be to attend industry events where
the target venture capital firm would likely show up – Web 2.0, Nexxt, Barcamp, Open coffee club, Web 2.0 Expo,
Techcrunch 50, Techcrunch Europa, Comed, Idealab, Web 2.0 Summit.
VCs has three purposes to visit these industry events:
To socialize with other VCs
To socialize with entrepreneurs
To experience the latest trends within a field
The main components of a business proposal are analyzed in a short meeting and industry experts are asked of
their opinion. The VC then sends out a prompt “no” or calls to ask specific questions and requests a business plan.
This is however more common and seen as a normal procedure in the US, compared to what is seen in the EU.
(Titus, 2011) If the business plan survives the rigid initial review, the VC invites the entrepreneur for a face-to-face
presentation of the business case.
2.5.2 Screening Investment Ideas It is important to elaborate that the choice of getting VC capital is an important choice for both the VC, but also
essential for the start-up. The right chemistry between the management team and the Limited Partners (LP) and/or
General partners (GP) within the VC is essential. It is thus important to have a certain analysis from both the VC
and the start-up, when starting their initial search and screening of candidates on either funding or receiving
funding. The VCs wants to take a glimpse at the members of the future management team of their investment, and
build a strong connection with them. Presentations to VCs should be like a sales pitch – a moment of personal
selling in which you sell yourself, your team and company.
Sherman and Arundale argue that the key questions any VC needs to have answered after the presentation and the
following Q&A are: (Garbade, 2009)
Is the product or service technically sound and commercially viable?
Is the business model understandable and does it make sense?
Is the management team experienced and do they have the ability to exploit the business potential, control
the company through the growth phase and make the business happen?
Which companies are the main competitors?
How proprietary or unique are the company’s products or services?
26 | Page
How valid are the financial and strategic assumptions that support the basis for future success of the start-
up?
How big is the size of the market?
Is there an effective strategy for getting to market and building a potentially sizable and market-leading
business quickly?
Who are the early customers? How are buying decisions made? Why do they want the product?
What investment amount is needed to finance the business to the next stage?
2.5.3 Due Diligence VCs often have different approaches towards the due diligence phase, as it also depends on the internal resources
and the maturity of the overall venture capital market. However, VCs often construct a detailed review and analysis
of an investment opportunity before an investment is made. In empirical research, it is found that the most VCs
prefer an investment opportunity which offers a good management team and acceptable product and market
characteristics. (Muyzka & Birley, 1996) This is also confirmed by both T. Knudsen and J. Buch from Miinto, who
have invested in several businesses in the last couple of years.
“I know it is starting to be a cliché, but it does not make it less true. I would rather invest in a A-management team and a B-
idea or business case, than investing in a A-business case and a B-management team. Basically I think the team means
everything for a case to succeed – you have to look into the eyes of the entrepreneur and you should see fire – if I don’t I will
not invest. The management team is the one who is going to carry the business case through its tough times, and you only do
this with passion and commitment” (Buch, 2012)
As stated above the management team seems to be recognized as the simple most important fact for a VC to
invest. However, this is also highly dependent on the investment stage of the VC. Investing in the growth and later
stages requires different capabilities, of both the VCs and the investment team. The idea has probably proven that it
has potential, and now the requirements to succeed are different, which implies that the management teams’
importance might be diluted with the development of the business/start-up.
Other parameters on which the VC make their decision whether to invest or not are: perceived strength of the idea,
capabilities, skills and past record of the founders. VCs have to cover three main types of risk within their due
diligence: management risk, which influences execution risk and agency risk, and market risk; competition risk,
new entrant risk, market growth risk and market size risk and product risk; product development risk, proprietary
risk and technology obsolescence risk. Due diligence can be defined as a rigorous assessment and evaluation of the
embedded factors that affect the likelihood of failure or success of a start-up.
There are many different approach of conducting a due diligence within the industry. Some VCs basically talk with
industry experts within their network, while others buy strategy and market reports from external consultants.
27 | Page
There are three parts of a due diligence, also known from the Private Equity market; Business, Financial and Legal.
This report will not take on the Legal perspective of the due diligence, even though this perspective is often also
very interesting within start-ups. In the next couple of sections the report will go through some of the most
important areas of the due diligence phase within the VC environment. Some of the most important investment
criteria’s and how VC tends to eliminate risk within the different areas will be described. Of course the way a VC
do their due diligence differs, however, this thesis will take some of the most normal and basic characteristics of the
due diligence and enlighten these. The next section will be structured as follows:
Management Team Due Diligence
Business Model (Product Due Diligence)
Market Analysis (Market Due Diligence)
Valuation (Financial due diligence)
2.5.3.1 Management Team In a correlation analysis, Tyebjee and Bruno find a negative correlation between the independent variable
“management capabilities” and subordinate variable “risk”, which fully validates the shift in weight of the key
investment decision criteria. VCs examine the business proposal and determine what skills and characteristics are
needed by the management team to make the start-up succeed. (Tyebjee & Bruno, 1984)
They evaluate every single member of the team and in addition the chemistry in-between the members of the team,
checking for passion, focus, vision, integrity, and profound dedication needed to run a successful start-up. The
basement of each founding member falls into two categories:
a) Individual characteristics – a founder/entrepreneur has to have a good business understanding, have a
good approach towards risk and good verbal ability.
b) Experience – VCs seek a track record of the founders, both success and failures, as you learn from every
single step within the entrepreneurial environment. Founders who have successfully managed business
before, including intrapreneurs. An experienced management team knows how to react when markets
change; therefore VCs often fancy founders with extensive experience in the relevant industry. Many VCs
even find it hard to invest in entrepreneurs who haven’t experienced failure of any kind. (Gladstone &
Gladstone, 2002)
2.5.3.2 Business Model: Product Due Diligence In the product due diligence phase, VCs primarily focus on five main areas (Tyebjee & Bruno, 1984):
Unique selling proposition of the product: describes a uniqueness yet not seen in the market, either
within the product, the go-to-market strategy or a new cost structure.

28 | Page
Stage of product development: It is important that the product is not to fare from market entry – as
penetration and scaling the products into new markets are initial to create the value for the shareholders
Proprietary product: VC’s are afraid of competition and the easiness of copying the investment.
Therefore it is essential that the product is difficult to copy and the barriers to entry and copy the product
is high
Technology obsolescence: The importance of having a product which technology is not going to
obsolescence for several years is important due to the long investment period of the VCs. Therefore a
thorough analysis of comparable technologies and their emergence have to be analyzed
Scalability: Is one of the most important factors for VCs. To get the desirable return, it is important that
the product can be launched in multiple markets without to many barriers.
2.5.3.3 Market Analysis VCs often carries out detailed and extensive market analysis to check the numbers given by the entrepreneurs, as
large markets are essential for achieving high exit value. The analysis are often done both through informal contacts
and external consultants, however this varies. Market due diligence covers three main fields:
a) Market size, growth rates and overall outlook is often seen as the number one reason for rejection if not
met. Generally many VCs will not consider investing in a small market as their future return would be
limited and not acceptable due to the high risk of the investment (Kølendorf P. , 2012)
b) Competitive environment is also an essential aspect of the overall market due diligence. A market with
fierce competition and low entry barriers would not be a perfect fit for a venture capital investment, as the
commercialization of a product often takes time (Rasmussen, 2012)
c) Clear targeted customer user is essential for any business. This includes a clear understanding of what type
of customer to target, and likelihood of the customer to purchase the product offering.
2.5.3.4 Financial Due Diligence (Valuation) Financial due diligence of start-ups, which is seen as the valuation of a start-up and the price of which the shares is
worth, is a difficult and almost impossible task for the external advisor/investor. There is no valuable or credible
forecast tools, such as financial models or excel sheets that creates an overview of what the venture have
historically performed and what they have forecasted in the future as seen within other M&A transactions.
Therefore the financial due diligence is often a close collaboration with the before mentioned due diligence
sesseion. Moreover, VCs do have other valuation methods than looking at the market, customer etc. such as virtual
valuation, comparable companies method, comparable transactions method and in the later stages, the discounted
cash flow method. (Weston, Mitchell, & Harold, 2004)
In the forthcoming sections the paper will in short outline the some of the valuation tools VCs use to value start-
ups: Virtual valuation, comparable companies’ method, and comparable transactions. These sections should not be
29 | Page
seen as a complete list of the valuation types used within venture capital. In addition, it is important to have in
mind that these tools are often only used in the later-stages of venture capital financing, and a more informal
valuation approach is often used in the previous valuation rounds.
2.5.3.2.1 Virtual Valuation Virtual valuation is often used within the seed stage of financing. It is therefore primarily used by founders,
business angels, 4Fs and private investors, in the early stage of the ventures life, where there is nothing other than a
business plan or prototype of the product or service. (Kølendorf P. , 2012) In virtual valuation, the valuation is not
based on the potential future value of the start-up, but basically just on the amount of funds the investor pledges to
the investment. The equity stake that an investor receives is freely negotiated between the founders and investors
without prior placement of a new valuation method. For example an angel investor might offer a start-up the
amount of $25.000 needed to get the product on market and finance the first six months for an equity stake of
10%. (Garbade, 2009) In addition, convertible debt method could be used instead of an equity stake.
2.5.3.2.2 Multiples: Comparable Companies and Comparable Transaction Method Within M&A a normal sanity check of a valuation is basically to look at transactions within the industry and
compare the multiples and value they have been sold for. It is often difficult to identify the exact same business,
however, it is used to identify a range of values (multiples) in which you would be able to identify a pattern. It is
therefore also essential that the peer group is homogeneous without too much variation.
The biggest problem is as stated to identify a good peer group – which is difficult within “normal” M&A, and
therefore almost impossible within the venture industry. The criteria that are used in selecting peer group members
are a) Market segment b) Target customers c) Size of start-up/firm d) Growth rate of a start-up e) Geographic
location and f) Capital structure. (Landström, 2007)
The most suitable multiple is the transaction multiple, which identifies the real value in the market of a series of
firms within the same peer group. Such an analysis can be made by using databases such as Thomson Reuters,
Orbis, Venture One, and Zephyr. However, a new database with knowledge from the Venture industry, which
should be used in the future are Angel.co and ChrunchBase. Both are US start-ups that facilitate information on
venture transactions and development of start-ups around the world. Angel.co is in essence an online founding
system used with the integration of the social aspect of your near associates. Whereas ChrunchBase is a more data
minded service, with a lot of data available to analyze and identify trends within the venture industry.
The comparable companies and comparable transaction methods are the dominant valuing methods in the early
stage of start-up. However, as mentioned previously, VCs need to check their valuation and interest through deeper
analysis and especially the execution of the business case is important. In some cases the DCF method would also
be suitable – however, this is often used at a later stage, since the credibility is even worse when evaluating a start-
up.
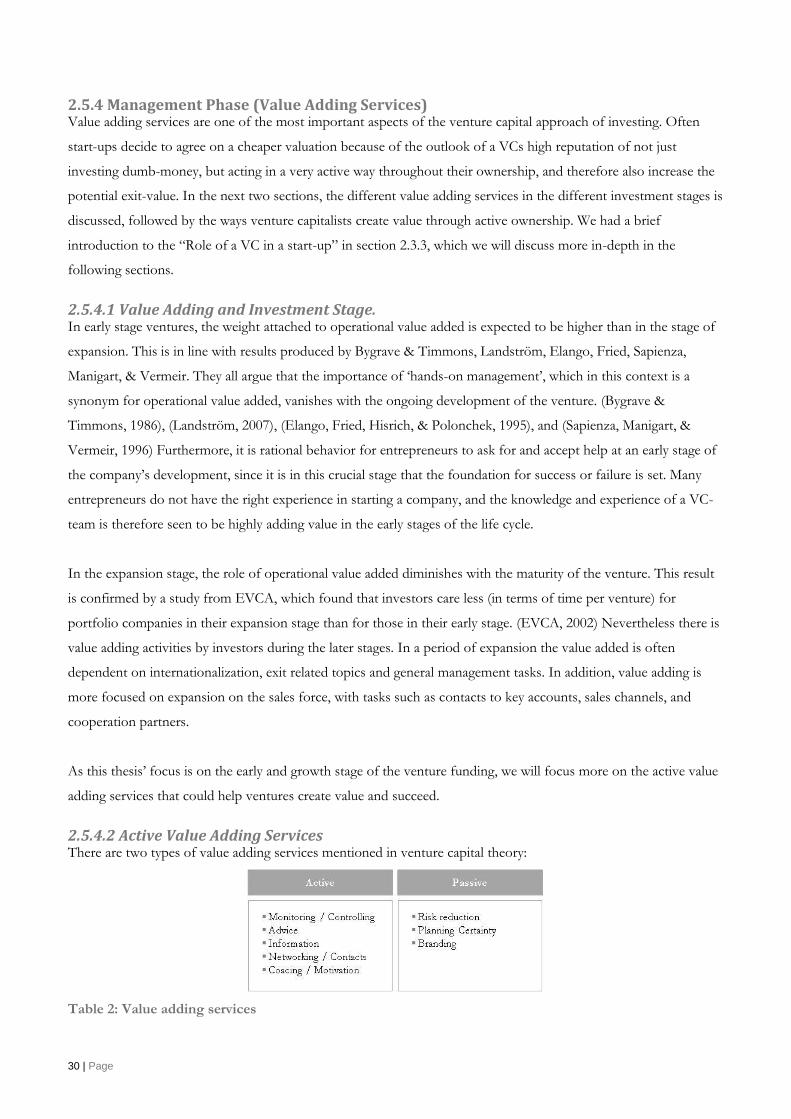
30 | Page
2.5.4 Management Phase (Value Adding Services) Value adding services are one of the most important aspects of the venture capital approach of investing. Often
start-ups decide to agree on a cheaper valuation because of the outlook of a VCs high reputation of not just
investing dumb-money, but acting in a very active way throughout their ownership, and therefore also increase the
potential exit-value. In the next two sections, the different value adding services in the different investment stages is
discussed, followed by the ways venture capitalists create value through active ownership. We had a brief
introduction to the “Role of a VC in a start-up” in section 2.3.3, which we will discuss more in-depth in the
following sections.
2.5.4.1 Value Adding and Investment Stage. In early stage ventures, the weight attached to operational value added is expected to be higher than in the stage of
expansion. This is in line with results produced by Bygrave & Timmons, Landström, Elango, Fried, Sapienza,
Manigart, & Vermeir. They all argue that the importance of ‘hands-on management’, which in this context is a
synonym for operational value added, vanishes with the ongoing development of the venture. (Bygrave &
Timmons, 1986), (Landström, 2007), (Elango, Fried, Hisrich, & Polonchek, 1995), and (Sapienza, Manigart, &
Vermeir, 1996) Furthermore, it is rational behavior for entrepreneurs to ask for and accept help at an early stage of
the company’s development, since it is in this crucial stage that the foundation for success or failure is set. Many
entrepreneurs do not have the right experience in starting a company, and the knowledge and experience of a VC-
team is therefore seen to be highly adding value in the early stages of the life cycle.
In the expansion stage, the role of operational value added diminishes with the maturity of the venture. This result
is confirmed by a study from EVCA, which found that investors care less (in terms of time per venture) for
portfolio companies in their expansion stage than for those in their early stage. (EVCA, 2002) Nevertheless there is
value adding activities by investors during the later stages. In a period of expansion the value added is often
dependent on internationalization, exit related topics and general management tasks. In addition, value adding is
more focused on expansion on the sales force, with tasks such as contacts to key accounts, sales channels, and
cooperation partners.
As this thesis’ focus is on the early and growth stage of the venture funding, we will focus more on the active value
adding services that could help ventures create value and succeed.
2.5.4.2 Active Value Adding Services There are two types of value adding services mentioned in venture capital theory:
Table 2: Value adding services
31 | Page
Below we will in short discuss the active value adding services, as the passive is not seen as a management tool, but
more as a cause-and-effect action of the investment. The above is a cluster of the total list, which has proven to be
the most important to create a successful start-up:
Monitoring/Controlling. Venture capital investors supervise their investments through regular
controlling and monitoring. Entrepreneurs know and expect this and adapt accordingly – or are forced to
do so by their investors. Regular monitoring and periodic controlling may cause entrepreneurs a lot of
work, but on the other hand they also lead to more professional work. This is so, since entrepreneurial
management needs the information obtained from proper controlling in order to back up its decisions. The
implementation of a reporting system at a comparably early stage of a company’s development results a
great improvement in the quality of management and an increase in efficiency, thereby creating ‘value
added’.
Advice. The classical way to add value is for a venture capital investor to advise entrepreneurs or provide
them or their employees with guidance. Almost all studies in the field of ‘value added’ from venture capital
companies view advising entrepreneurs as key to the creation of ‘value added’. This is due to the special
role of management in the development of a company. (Gorman & Salman 1989, Brüderl et al. 1992) The
advice can cover all functional areas or departments of a venture and is especially important for young or
inexperienced entrepreneurs. More mature entrepreneurs may also profit from the wide experience of
investors who may have been associated with and shaped several venture establishments before.
Information. Providing advisory services to entrepreneurs goes hand in hand with giving them support in
the form of information. The difference between the two is that advice is aimed at solving a potential or
concrete problem in the venture, while the provision of information is merely the starting point for
management decisions. Information of relevance will usually concern the development of markets, industry
sectors, or technology.
Networking/Contacts. Some of the terms most often mentioned in the context of ‘value added’ are
those of ‘network’ and ‘contacts’, which in the present context mean that the entrepreneur expects to
obtain access to the investor’s established network(s) of useful business contacts. These networks and
contacts differ from investor to investor and may be more or less extensive, and more or less useful, to the
entrepreneur. The ones most often mentioned during the course of this study were: potential customers
and suppliers, further or alternative venture capital investors, portfolio companies, holders of technological
knowledge, sales channels, key personnel (especially technology/R&D and management), press/media and
general contacts to consultants, etc. Where the investor is a corporate venture capital company, the most
important contacts it could facilitate were those to different departments of the corporate parent, such as
marketing/sales, technology/R&D and especially the corporate parent as a potential key account. ‘Value
added’ gained through networks and contacts can therefore add value in all functional departments of a
venture.
32 | Page
Coaching/Motivation/Sparring. During research interviews these terms were used synonymously to
describe value-adding activities that were focused on the entrepreneur as an individual. ‘Sparring’ is derived
from the sport of boxing. Transferred to the business world, ‘sparring’ means – besides ‘coaching’ – the
supervision, training and education of a manager or, as in our case, an entrepreneur. The aim of sparring is
to allow the entrepreneur to become skilled at solving motivational, leadership and organizational
problems, as well as personal difficulties and crises. This vehicle is perhaps the closest to a pure value
added activity of all. However, since the recipient of coaching is the entrepreneur and not the venture
itself, we have placed it among the vehicles by which value is added to the enterprise.
2.5.5. Exit Phase While it is important to locate the best start-ups, it is just as important to be able to exit your investments. Often a
Venture Capitalist's reputation is made on both being part of the right investments, but also on success stories of
great exit cases. (Siang, 2009) In essence, it all comes down to: “Do the VC see a potential and successful exit of the
current investment opportunity?”
When we talk of exit routes, we have identified five potential routes, when a VC decides to exit an investment:
Initial public offering
Strategic acquisition
Secondary purchase
Management buy-out
Write-off
The most common and preferred exit routes are IPO or trade sale, which often are preferred, however, there is no
real order and the exit often depends on the founders and the current investment team (different VC, Angels, etc.)
(Giot, 2004) and (Nesta, 2010)
- Initial public offering is an increasing trend within the start-up world, where in recent years, Google,
LinkedIn, Facebook etc. all have gone through venture financing to an IPO. One of the main reasons is
the previous mention shift in investment focus of many VCs which creates more money to develop and
mature the companies, which is required due to high huge registration requirements. In addition, the
management team within the venture must prepare a prospect for the stock market, with assistance of the
management of the VC. The amount and quality of information that is required within a prospectus can be
can be burdensome, and it is therefore often suitable to have VCs with experience in the forthcoming task.
An internal investor relations division must be created, the internal reporting systems must be prepared for
the stock market, and organizational structure of the firm reshaped to resemble that of a listed company.
(Grompers & Lerner, 2004)
33 | Page
The advantage of an IPO is that it could provide the venture with enough funds for future expansion,
enchanted “status” and public awareness. In addition, an IPO could ease the recruiting of senior employees
due to a conjured job security perception, and the before mentioned reputation. The disadvantage of an
IPO the increase cost due to reporting is the prospect drafting, underwriting, legal and accounting costs,
quarterly reporting pressure, constant need to propel earnings on a shorter basis without respite.
(Cumming D. J., 2002) and (Chemmanur & He, 2011)All of the above disadvantage gives an good
identification on the size a firm needs to be before they can maintain all of the above information and cost
related to an IPO.
Furthermore, in Canada a venture stock exchange has been created with less fees and requirements, which
creates an opportunity to have a more smooth transaction from private to public. (Carpentier & Suret,
2010)
- Strategic acquisition is the acquisition made by a larger player in a related industry. This is seen as the
dominant exit channel in venture capital financing. Strategic investors accentuate synergy and strategic fit
of a start-up into their existing business as the main impetus of an acquisition. In addition, they are often
willing to pay above the market price, due to the value of synergies. Strategic investors most often purchase
a whole firm instead of a minority interest, and in comparison with the IPO, a strategic acquisition is a
private transaction, associated with less stress and difficulty, fewer limitations, and faster capitalization of
your stock. (Hellmann T. , 2001)
- Secondary purchase or secondary sale is also a well-known phenomenon in the VC industry. Often one
VC agrees to sell their part of the company on to a new VC/PE fund. This is often seen as lifecycle of
investment, and if the first VC is specialized in the market the seed stage and the next VC is more evolved
in the later stages – it could be viewed as a transaction from one VC to another.
- In a management buy-out, the founders of the business decide to buy back their shares of the firm –
often at an agreed price in the current contract. The founders often found this investment through a bank
loan or other private resources.
- Write-off VCs are not always able to exit and cash out their investment. The prospect of a write-off hangs
over all start-ups, since about only 10 % of all start-ups invested in bye VCs survive after the first three
years. (Knudsen, 2012) The VC may consider it better to cut losses on the sport and put the start-up into
an orderly shutdown, rather than go through a messy traumatic process of forced receivership.
In the previous sections we have given a brief introduction to the venture capital industry, which should be used as
a fundament of understanding the remaining part of the thesis. In the following paragraph it will be discussed and
34 | Page
illustrated how venture capital contributes to innovation and economic growth, through examining the literature on
the subject.
3. Empirical Study on Explaining the Venture Capital Impact on Innovation and Economic Growth In the previous section, an introduction into the venture capital way of doing business, as well as the different
investment stages they go through when they engage and act both prior and post investment, was outlined. In the
following sections of the paper it will be discussed what impact venture capital can have on innovation and how it
can help create economic growth.
The first section will define innovation and economic growth, and discuss which factors that will be used as
innovative indicators. The next section will discuss theories and literature on the best way to manage innovation,
with focus on establishing a connection between the venture capital industry and the success of innovation, and to
see what matters to create successful ventures. In the last section the paper will discuss the current literature on the
topic and highlight the influence a well-structured venture capital industry can have on innovation.
3.1 Empirical Study and Definition of Innovation
3.1.1 What is Innovation? In 2000, the Lisbon European Council recognized that Europe’s future economic development would depend
crucially on its ability to create and develop high-quality, innovative and research-based sectors. (OECD, 2012)
The ability to develop new ideas and innovation has become a priority for many organizations and nations. Intense
global competition and technological development have made innovation to be a source of competitive advantage,
both on macro- and microeconomic levels. (OECD, 2012)
The shared method which most theorists study the development and implementation of new ideas is known as
Diffusion Theory (In some cases also known as Innovation Theory). In its fundamental outline, diffusion is defined
as the progression by which an innovation is adopted and gain acceptance by individuals or members of a certain
group (society). The diffusion theory has been present for many years and theorist have developed many sub-
theories that all support the collectively study of the processes of adoption. Perhaps the first famous account of
diffusion research was done in 1903 by French sociologist Gabriel Tarde, who outlined five ”stages” of successful
innovation:
1) First knowledge
2) Forming an attitude
3) A decision to adopt or reject
4) Implementation and use
5) Confirmation of the decision
35 | Page
Through these stages, Tarde recognize that innovation is full implementation and confirmation of the product, and
not just developing a new product. Similarly economist Joseph Schumpeter, who has added significantly to the
research on innovation, claimed that industries must revolutionize the economic organization from within, that is
to innovate with more effective processes and products, such as seen from the shift from the craft shop to the
industrialized factory. (Schumpeter, 1943) In addition, entrepreneurs continuously look for better ways to satisfy
their consumer/customer base with improved quality, durability, service, and price which often culminates in
innovative ideas within advanced technologies and organizational strategies. (Heyne, 2010)
This thesis focuses on sustainable innovation, which is created and managed so that it generates economic value to
the nation and its owners. This thesis looks at the venture capital industry’s influence on the innovation process -
throughout the life of the innovation, thus not limited to the creation of the innovative idea/product/service/etc.
Therefore focus will to see if venture capital has influence on innovation, within the five stages, introduced by
Gabriel Trade, since these show a formation, introduction and confirmation of the given innovative idea. (Robbins
& Beach, 2012) The influence of venture capital might however be limited to certain parts of the five stages,
however these thoughts will be analyzed in the following section on innovative input and output indicators as well
the section on how venture capital can spur innovation.
3.1.2 How to Measure Innovation For further analysis on how venture capital effects the innovative environment and show if venture capitalist has a
positive impact on innovations, we have to first discuss which parameters are used to measure innovation.
In the above section it is argued that an innovation has to, from an economist's point of view, create better or more
efficient products/services. In addition, the S-shaped diffusion curve from Tarde, argues that the innovation
process is not just a simple go-to-market, but defined by five parameters stated in the previous section.
Below different measurements of innovations is presented, on both input and output on a macro- and
microeconomic level that has been used in common innovation theory analysis. It is important to state that even
though theories have argued of both input and output indicators, there seems to be some areas in which you can
argue that the indicator could be a measure of both output and input on innovation.
3.1.2.1 Input Indicators Input indicators include science and engineering graduates, the population with tertiary education, broadband
penetration rates, public and private R&D, innovation expenditures, ICT expenditures, early-stage venture capital,
and small and medium-sized enterprises’ (SMEs) innovating in-house and co-operating on innovation.
Science and technology indicators need to measure a wider range of actors, such as universities, research institutes,
transfer platforms, start-ups, small innovative firms, multinationals and venture capital firms. Understanding what
drives their behavior is an important component in understanding the performance of the aggregate system. Hence,

36 | Page
more information is needed at the level of individual actors on relevant parameters (for instance competencies,
motives, performance) and relationships (financial, flow of personnel, strategic coordination and so on) to give a
good estimate of how to measure input indicators and what these mean. (OECD, 2010)
This report is however, more focused on the innovation output, since this is often where venture capitalists contact
the ventures, and therefore have the opportunity to create value to the innovation-value-chain. Whereas the input
indicators are primarily governmental efforts, universities and the national culture.
3.1.2.2 Output Indicators Often the output measure is valued from the relationship of R&D, high-technology employment, high-technology
exports, sales shares of new-to-market/firm products, and EPO/USPTO/Triadic (US, EU and Japanese) patents,
trademarks and designs (Kemp, Folkeringa, & Wubben, 2002) and (Brouwer & Kleinknecht, 1996). In the next
sections we will in short discuss some of the traditional innovation output indicators.
3.1.2.2.1 R&D Standard R&D data may give a good indication of the development of a firm, an industry or a country knowledge
base. However, straightforward inferences about the innovativeness of a firm (or sector) are less suitable. R&D is
an input and not an output measure; inputs can be used more or less efficiently, and there may be long time lags
between input and output. Moreover, R&D is quite an inhomogeneous activity; it can involve basic research (far
from the market), applied research and development. (Brouwer & Kleinknecht, 1996)
3.1.2.2.2 Patents Patents are an excellent instrument for studying the technological position of individual firms which may be
involved in a technology race in certain technology fields, which have a high propensity to patent (e.g. mechanical
engineering, Biotech, Medtech). On the other hand, given the unequal propensity to patent inventions,
comparisons across sectors or across firm size class may be misleading (Brouwer & Kleinknecht, 1996)
Engel & Keilbach have investigated the connection between venture capital and innovation in Germany, with the
focus on patents as an output indicator, and have found a weak evidence for the correlation between venture
capital and innovative behavior. Some studies agree with Engel and Keilbach and with their quality or consistency,
but are skeptical about the proxy used to measure innovation, that is the number of registered patents. This proxy
can have some limits as stated previously in this paper. (Engel & Keilbach, 2002) In sectors characterized by quick
technological development, companies tend to use patents for strategic reasons, even if, at the same time, they rely
on quality, leadership, and design to maximize the return on their R&D investments. Some theorists doubt that the
number of patents is a good proxy for innovation, especially in the venture capital context, because to reduce
expropriation risks, an entrepreneur who needs financial resources may register his invention even if he has not
fully developed it. (Anton & Yao, 1994)
3.1.2.2.2 Total Innovation Expenditure This measure gives insight into a larger variety of non-R&D activities which are required for innovation, and which
may have considerable weight. It is however, difficult to collect data on non-R&D, as open ended questions are
37 | Page
difficult to compare and make valid (accurately) analysis upon, since many firms do not keep such records. As a
consequence, item non-response rates are high and many firms give only rough estimates inclusion of this, which
could cause a lot of noise in econometric analysis. (Brouwer & Kleinknecht, 1996)
3.1.2.3 Thesis Innovation Measurement Approach Today when measuring innovation, most of this investment takes other forms than traditional scientific R&D, and
only some of the most technology- and research heavy industries, such as biotech and medicine, are good indicators
for this. Traditionally, R&D expenditure has been used as proxy for innovation investment. However, recent
research in the UK, shows that R&D represents only 11 per cent of the investment in innovation measured by the
index, and therefore also needs to include a range of complementary investments used to commercialize ideas,
including product design, training in new skills, organizational innovation, developing new customer offering and
brands, and copyrighting. This thesis will accept both patent and R&D as output indicators, however it is important
to acknowledge that the industry needs to be measured on more than those two output indicators. (NESTA, 2009)
3.2 Economic Growth With Innovation Several studies attempt to incorporate industrial innovation into models to explain economic growth. Romer
showed that knowledge with increasing marginal productivity could be an input in explaining long-run growth.
(Romer, 1986) In a competitive economic environment, intentional investments in innovation activities are
motivated by market incentives. (Aghion & Howitt, 1992) (Stokey, 1995), (Romer, 1986) Treating technological
changes as endogenous, Romer also presented a model of the growth rate being determined by the stock of human
capital, even though new technology is assumed to be no better than old (horizontal product innovation). (Romer,
1990)
Furthermore, various studies have been conducted at the level of individual firms, industries, as well as countries.
Cameron surveys the existing literature on this topic and concludes that the majority of these studies find a positive
link between innovation and some measures of economic growth. (Cameron, 1998) (Griliches & Mairesse, 1986)
and (Mansfield, 1980)
Meanwhile, other studies have attempted to investigate the spillover effects of innovation. For example, Bayoumi,
Coe and Helpman have documented that international trade can greatly raise a country’s total factor productivity.
(Coe & Helpman, 1995) and (Bayoumi, Coe, & Helpman, 1999) However, there is a limitation for such spillovers
across countries. Audretsch and Feldman, found that innovation spillovers tend to be localized, in the sense that
industries with a prevalence of knowledge spillovers have a high propensity to be clustered. (Audretsch & Feldman,
1996) For example, there may be important barriers to knowledge flow even between European countries, and it is
therefore important to have national innovative regulative and laws. (Maurseth & Verspagen, 2002); (Bottazzi &
Peri, 2003)
The above discussions all more or less favor the viewpoint that entrepreneurship and innovations do facilitate
economic growth within in a certain economy. However, the quality and the quantity of the innovative level has a
38 | Page
large influence on how great the impact is. This therefore raises an important question; how do you facilitate
innovation at a higher research level and thereby create economic growth within your economy.
3.2.1 Managing and Facilitating Quality Innovations The concept of an organizational life cycle (OLC) is used to explain changes in a firm over time.; Whether
entrepreneurial or conservative, life-cycle theorists believe that innovation tends to increase during the early stages
of a firm, then slowly decreases during the later stages, so that the importance of facilitating the most innovative
environment in the early stages of the life-cycle, is particularly significant for ventures. (Greiner, 1972) (Kazanjian,
1988); (Kimberly & Miles, 1980) and (Quinn & Cameron, 1983)
Research has shown that organizational attributes change over the different stages of a firm's existence and that
different management practices are needed at different stages. (Kazanjian, 1988) (Miller & Friesen, 1984) Structural
formalization, to give an example, is thought to facilitate organizational success during early stages of the
organizational life cycle but to hinder success during later stages (Walsh and Dewar 1987). Other research has
suggested that organizations, at different stages, should be assessed by different models of organizational
effectiveness. (Quinn & Cameron, 1983)
This thesis finds that a modified version of Kazanjian's four-stage model of growth in technology-driven ventures,
is an appropriate tool to measure the impact of innovation through the OLC. The steps can be explained as:
1) The first stage, termed conception and development, involves the invention and development of a product
or technology. The focus is on securing financial resources and developing a market. Structure and formal
procedures are virtually nonexistent, and all activities are decided by the entrepreneur, typically an owner or
founder.
2) To manufacture a new product and establish a market, a company at the commercialization stage must
create structures and task systems beyond product development.
3) A company at the growth stage is characterized by high growth in both sales and number of employees. As
it focuses on how to produce, sell, and distribute its products profitably, a hierarchy and functional
specialization develop, and personnel become more professional and experienced.
4) A company at the stability stage concentrates on developing next-generation products, establishing a
market position, and seeking other growth opportunities.
Miller and others, have questioned whether this “evolution” happens across the 4 stages. (Miller & Friesen, 1984)
This is however, demonstrated by Kazanjian who argue that firms progress in a specific sequence, although the
duration of the stages is unspecified and they may overlap. (Kazanjian, 1988) In addition, Kazanjian found that
whereas an organization's external relations and organizational systems changed only marginally between the
conception and development and commercialization stages and between the growth and stability stages, changes
between the first two stages and the latter two stages were significant. This could intuitively show that ventures are
39 | Page
more vulnerable in early stages of the life-cycle, since significant changes are needed, and the need for outside
advice, capital and network is essential for sustainable innovation growth.
In the forthcoming sections we will discuss some of the most important features in the different stages of business
development and creating quality innovation, through these “tools” and connect them with our previous section of
venture capital, and their approach to create successful ventures.
3.2.1.1 Environment (Capital) Life-cycle research suggests that environment, information processing, and structure are critical for the
development of a firm. (Miller & Friesen, A longitudinal study of the corporate life cycle, 1984) The environment
encompasses external resources (e.g. financial resources and trained and educated personnel) and dynamism (the
rate of product, market, and technological change in an industry). Life-cycle and new venture research suggest, that
early-stage firms lack financial and human resources - resources that are more critical in early phases of product
development than in later phases (Kazanjian, 1988) (Cameron, 1998). Also, in the early phases of the product life
cycle there is little specialized labor available. (Utterback & Abernathy, 1975) Later-stage firms can develop
extensive internal labor markets and train their own workers, and may therefore have less need for external
resources. (Schuler, 1989)
As section 2 states, one of the most important things of the venture capital industry is to provide sufficient capital
so that the firm can grow in the right tempo, and expand with both employees and sales. A strong venture capital
industry, within the national borders, would therefore help to create a better environment for the early-stage
ventures, and make it less vulnerable, and improve the chance of successful innovation.
3.2.1.2 Management Some research shows that organizations with large knowledge bases are more likely to develop and support varied
strategic actions and quality innovations. (Miller & Toulouse, 1986) Pursuing multiple competitive methods
simultaneously requires a broad knowledge base that nurtures the exploration and exploitation of different
opportunities. (March, 1991)
Given that new ventures usually face severe internal knowledge shortages (Sapienza et al., 2005; Zahra, 1996), they
can overcome this by gaining access to different sources of knowledge in their industry and elsewhere. Having
access to diverse knowledge sources makes it easier for new ventures to develop new products, goods and services
that attract and retain customers. (Kølendorf P. , 2012)
Gaining access to diverse external knowledge sources can give venture managers valuable information about the
different forms of rivalry and market needs. (Sapienza, Autio, George, & Zahra, 2006) But the knowledge received
from multiple sources may be incompatible. Therefore, managers need to reconcile the information, examine the
nature and use of the particular knowledge at hand, and explore ways to combine the different types of knowledge
and how to best use it to innovate. Often VCs, given their experience and active board members, offer a valuable
40 | Page
knowledge of the market, organizational structure and advice, through experience. This often gives the
entrepreneur more time to manage his/her firm, rather than doing other administrative work.
3.1.2.3 Structure Various structural devices, such as formalization, centralization, and incentives, can also facilitate innovation. An
empirical analysis of a national sample of 118 high-tech manufacturers, business developer and software
developers, for example, showed that small firms that were formalized made better choices of new products.
Formalization enables early-stage firms to focus limited resources and to concern trade efforts, thereby promoting
effectiveness, improving morale, and increasing innovation. (Walsh & Dewar, 1987)
To form a structure that on one hand is very agile and empowers innovative products and decisions, and on the
other hand creates an environment that can handle and grow the innovative ideas into successful products, services,
ventures etc. is complex.
In addition, as the organization/venture evolves as a part of the life-cycle development, it becomes more
formalized, primarily because of a need for increased efficiency, more complex organizational structure, and
external institutional influences. (Bodewes, 2002) Moreover, it becomes increasingly difficult for a firm to innovate
and adapt to a changing and expanding environment as it moves outside its core business. (Sykes & Block, 1989)
Through their experience and management tools, mentioned in previous section, such as structure documents,
internal reporting, employee database, etc. VCs can give the ventures more space to grow, since external
functionalities can guide and help it through the difficult early-stages.
3.1.2.4 Experience and Network Experience and network is an important area to establish successful innovation in today’s knowledge driven
economy. It has been proven in several industries, that knowledge sharing from experts within the industry is of
such a high value that it increases your chances of success with around 30%. (Ottenbacher & Harrington, 2008) In
addition, Bullinger, Auerhammer, & Gomeringer, argue that managing innovation, is as highly dependent on your
network as it is on your yourself, and that your network possesses the ability to adapt with new challenges.
(Bullinger, Auerhammer, & Gomeringer, 2004) Mancinelli and Mazzanti finds that networking can be a
complementary factor in situations where cooperation and networking are needed to achieve economies of scale
and/or to merge and integrate diverse skills, technologies and competencies. (Mancinelli & Mazzanti, 2008)
Hoegl go as far as to say that individuals’ knowledge networks are widely considered to contribute substantially to
the effectiveness and efficiency of organizations, which in the end supports that it is important to have the right
network and experience around you to succeed. (Hoegl, Parboteeah, & Munson, 2003)
In the previous section we have discussed literature within the innovation spectra. We have discussed different
types of innovation and enlighten different measures of innovation. Furthermore, we have had an empirical analysis
as well as expert opinion on the economic value creation from innovation, which has proven to be strong.

41 | Page
Especially, the variable of quality within innovations has been shown to have a large impact on economic growth,
which is one of the most important selling points of venture capitalist. In the next section we will discuss the
venture capital way of creating value even further, through a literature review on how Venture Capital can spur
innovation.
3.3 Literature Review: Does Venture Capital Spur Innovation? Governments around the world have been willing to duplicate the success of the fast-growing US venture capital
industry. All of these governments share a common rational behind this interest: the American venture capital
industry has spurred innovation in the US, and could do so elsewhere. The next section will discuss the literature
surrounding the impact of venture capital on economies around the world. The measurement of innovation has
been a debated topic in research and a lot of different proxies have been developed in order to solve the problem,
which are also discussed prior in the previous sections. Other than the US, the Israeli government initiated two
programs to encourage the formation of venture capital funds in 1991. Many analysts claim that the initiatives led
to not only an increase in venture capital under management (from $29 million in 1991 to over $550 million in the
2000’s), but to a high increase of investment by foreign technology companies in Israeli R&D and manufacturing
facilities. (Zephyr, 2012) and (IVCA, 2012)
The relationship between venture capital and the development of early stage ventures can be analyzed in several
ways. However, this section will center its discussion on the connection between venture capital and innovation,
and between venture capital and performance of start-ups, as this also indicates if it is seen as growth innovation or
not. Despite the recognized importance of venture capital by many governments, and its ability to withstand and
flourish the development of both individual early stage ventures and the whole economy, connections between this
financial instrument and the innovative behavior of entrepreneurs have only been studied for a short time.
(Aiginger, 2002), (Srinivan, 2003), and (Hall, 2003) The discussion have been divided into two sections, with the
first section concentrating on the venture capital ability to “Create innovative incentive” and the second section on
how venture capital can “Spur sustainable innovation”.
3.2.1 Does Venture Capital Create Innovative Incentive? Experts, professors and economic advisors have for a long time discussed if capital creates innovative environment,
or if innovative environment creates capital. These discussions are still on-going, and many different industry
experts have different point of views on these topics.
Kortum & Lerner have examined the effect of the American venture capital industry and its effect registered
patents, mainly using data from industrial companies from 1965 to 1992. Their main findings point out that venture
capital financed innovations are substantially more productive than projects financed by self-financed R&D funds.
(Kortum & Lerner, 1998) and (Kortum & Lerner, 2000). This is particular interesting as industrial companies are
not seen as the typical venture capital targets, why it could be expected that the importance of venture capital could
be even more noteworthy in other industries. In addition, their analysis suggest that a well-functioning venture
capital environment creates more innovative ideas and ventures. Ueda and Hirukawa released an updated version of
42 | Page
their report in September 2008, which contains a new analysis of patent filings. Their analysis confirms that, at the
industry level, VC investments did increase the overall patent filings. However, these did not translate into
increased productivity growth or innovation. (Wadhwa, 2008)
Nonetheless, Wadhwa argues that money comes after innovation, mainly due to high innovative environments
increase the venture capital level in a given country. (Wadhwa, 2008) This is more or less supported with the
development of the Israeli market, where we today around 75% of external capital in the market, after the
recognition of the high-tech innovative environment. (Invest In Israel, 2012)
Lerner affirms that while there are numerous reasons for believing, that on average venture capital has a powerful
impact on innovation, the impact is far from uniform. (Lerner, 2002) He in particular argues that venture capital
during boom periods will over-fund the market of specific industry sectors can lead to a sharp decline in terms of
the value of the venture capital invested. While a prolonged downturn of financial resources may ultimately lead to
high-potential companies going unfunded, many of the dire predictions seem overstated. (Caselli, Gatti, & Perrini,
2009)
3.2.1 Does Venture Capital Spur Sustainable Innovation? In contrast to the thin literature on the connection between venture capital and innovation, the connection between
venture capital and performance has been examined more thoroughly. Kini and Jain show that funded companies
that have been listed on a stock exchange, experience greater growth in cash flows and sales. (Kini & Jain, 1995)
Furthermore, Lerner studies this topic in depth, taking into consideration Small Business Innovation Research
(SBIR), an important American initiative to support high-tech firms. (Lerner, 1999) Looking at the success of firms
over the long period, for the whole sample, Lerner's research found that occupation and sales growth rates are
higher for SBIR funded firms than non-SBIR funded firms for the entire period between 1983 and 1995 – which
could drive parallels to greater success and of ventures that are backed by VCs.
However, in some empirical studies, the boosting power of venture capital is not as clear as previously reported.
Using a sample of 187 Belgian funded firms, Manigart and Hyfte conclude that the jobs growth rate is not as high
as expected, though funded firms have greater cash flows and asset growth rates. (Manigart & Hyfte, 1999)
This is confirmed by Grompers & Lerner, who underline the value of venture capital for young and high-tech
growth firms, both through value creation, capital and network. (Grompers & Lerner, 2001) They also highlight the
advantages and limits of this kind of financial institution. In particular, venture capital has an important role in the
overall financial markets, providing capital to early-stage ventures with none or limited financial background. Firms
that might have otherwise gone unfunded and with high probability not have created any feature value. One of the
reasons for venture capitalists taking on these high risks ventures, are that they have developed a variety of
mechanisms to overcome the problems that emerge at each stage within the investment and developing process.
43 | Page
Megginson and Tykvova provide support for the certification role of venture capitalists in IPOs. They find that
venture capitalists focus their investments in specific types of firms and industries, to provide intensive monitoring
services and engage their superior industry knowledge. (Megginson & Weiss, Venture capitalist certification in initial
public offerings, 1991) and (Tykvova, 2003) So, consistent with their monitoring role, venture capitalists take
considerable equity positions, maintain their investment beyond the IPO, and serve actively on the boards of their
portfolio firms. Furthermore, this presence can help lower the cost of going public and to maximize the net
proceeds to the offering firm, because of the stick and structured way of maturing a venture throughout the life-
cycle. Furthermore, recent analysis from PwC and E&Y, shows that the around 50 percent of the total IPO’s in the
US have at some point been venture backed. (PWC, 2012) (Ernest & Young, 2012) and (Ernest & Young, 2012)
This effect is however, not found by Rindermann, in a pan-European study. His overall findings suggest that
venture backed firms do not generally outperform those without venture-backing and confirm the heterogeneity of
venture capitalists in the European market. (Rindermann, 2003)
Furthermore, some authors try to enlarge the concept of performance, linking it to the idea of behavior. In other
words, they suggest that venture capital charisma could generate some changes in an entrepreneur’s activities or
market conduct. (Gans, Hsu, & Stern, 2002) This evidence states that the charisma of venture capitalist and their
presence, gives entrepreneurs more belief in their ventures, which in the end creates a more resilient venture, than
without the VC investment. This is often also known as the proof-of-concept, which both generates hype and gives
the idea/venture a more trustworthy substance to the “world”.
There does not seem to be a clear picture of venture capital spur innovation. Some argue that VCs need to rethink
this strategy. However, performance of the ventures moves to invest their funds where the best ideas are, where
others argue that the right amount of investment should spur the innovative process. Policymakers, whose
economic growth strategy centers on attracting do improve with the presence of venture capital funds, which has
been proven in Israel. Ventures become more successful, either because of charismas or because of the network,
which VCs also bring to the table while they invest, as stated in previous sections. Even though the research is not
clear on the topic, the American growth suggests that a successful venture capital eco-system does spur innovation
to some degree, and creates better and more sustainable ventures in the long run.

44 | Page
4. National Innovation Systems: Macroeconomic Environment of the Venture Capital Industry in the US, UK, IL and DK
4.1 General Demographic, Economic Data and the Venture Capital Markets The macroeconomic environment of the venture capital industry in a country sets the framework for the
microeconomic behavior of VCs. The macroeconomic behavioral difference between VC markets will influence
and also be able to explain certain market differences. In the end this will help to explain some of the reasons for
the behavior of, why some VCs act differently within countries. The macroeconomic analysis is based upon
previous research, as well as information from the questionnaire.
To set the scene and baseline of further comparison for the four countries outlined in this paper, I will introduce
some macroeconomic facts of each country, including population, GDP (per capita), VC invested capital as a
percentage of GDP, venture backed revenue as a percent of GDP and total VC deals in 2011 and YTD 2012.
Table 1: General Demographic and Economic Data
Source: (IHS Global Insight, 2011), (Zephyr, 2012), (Orbit, 2012) and (OECD, 2012)
There are significant differences in the population and size of economies between the four countries. The US
population is roughly 50 times larger than Israel and Denmark and 5 times larger than the UK, United States GDP
is USD 15.000 billion whereas the Danish GDP is USD 250 billion. The American economy is therefore estimated
to be around 50 times as large as the Danish and Israeli. (World Bank, 2012)
The Venture Capital invested in the country as a percentage of GDP is a general estimate of how much venture
capital each country is investing as a percentage of their GDP. This estimate gives an indication of the amount of
capital there is in the country, but not how the capital is used within the country. Looking at these four countries,
the smaller economies tend to have a higher percentage of capital invested in relation to their GDP. The Danish
and UK invest about 0.5 % of their GDP in ventures, whereas the US invests about 0.2 %. (NVCA, 2012) and
(EVCA, 2012)
The amount of VC deals per country shows a different picture of the capital invested in each country. In 2011 there
were only 13 deals in Denmark compared to 54 in Israel, 264 in UK and 2.097 in the US. These differences could
however be caused by several things:
1) Larger investments in DK per venture, compared to the rest of the world
2) DK VCs do invest – but mainly in international ventures
General Demographic and Economic Data DK US UK IL
Population in millions (2011) 6 315 62 8
Gross Domestic Product pr. capita (GDP) (2011) 40,983 48,442 35,494 27,835
VC invested capital as a percentage of GDP (2011) 0.52% 0.45% 0.3%
Venture-backed revenue as a percent of GDP (2011) 21%
VC Deals 2011) 14 2,097 264 54
VC Deals (28.11.2012YTD) 13 2,318 278 45
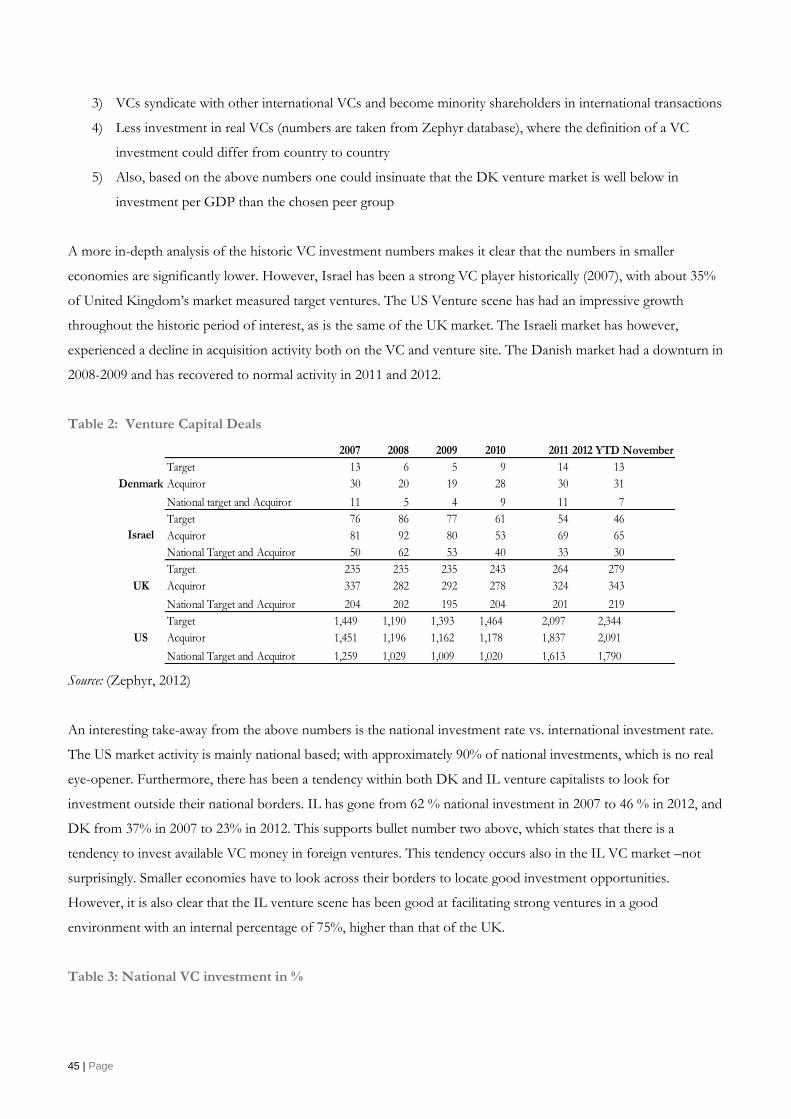
45 | Page
3) VCs syndicate with other international VCs and become minority shareholders in international transactions
4) Less investment in real VCs (numbers are taken from Zephyr database), where the definition of a VC
investment could differ from country to country
5) Also, based on the above numbers one could insinuate that the DK venture market is well below in
investment per GDP than the chosen peer group
A more in-depth analysis of the historic VC investment numbers makes it clear that the numbers in smaller
economies are significantly lower. However, Israel has been a strong VC player historically (2007), with about 35%
of United Kingdom’s market measured target ventures. The US Venture scene has had an impressive growth
throughout the historic period of interest, as is the same of the UK market. The Israeli market has however,
experienced a decline in acquisition activity both on the VC and venture site. The Danish market had a downturn in
2008-2009 and has recovered to normal activity in 2011 and 2012.
Table 2: Venture Capital Deals
Source: (Zephyr, 2012)
An interesting take-away from the above numbers is the national investment rate vs. international investment rate.
The US market activity is mainly national based; with approximately 90% of national investments, which is no real
eye-opener. Furthermore, there has been a tendency within both DK and IL venture capitalists to look for
investment outside their national borders. IL has gone from 62 % national investment in 2007 to 46 % in 2012, and
DK from 37% in 2007 to 23% in 2012. This supports bullet number two above, which states that there is a
tendency to invest available VC money in foreign ventures. This tendency occurs also in the IL VC market –not
surprisingly. Smaller economies have to look across their borders to locate good investment opportunities.
However, it is also clear that the IL venture scene has been good at facilitating strong ventures in a good
environment with an internal percentage of 75%, higher than that of the UK.
Table 3: National VC investment in %
2007 2008 2009 2010 2011 2012 YTD November
Target 13 6 5 9 14 13
Acquiror 30 20 19 28 30 31
National target and Acquiror 11 5 4 9 11 7
Target 76 86 77 61 54 46
Acquiror 81 92 80 53 69 65
National Target and Acquiror 50 62 53 40 33 30
Target 235 235 235 243 264 279
Acquiror 337 282 292 278 324 343
National Target and Acquiror 204 202 195 204 201 219
Target 1,449 1,190 1,393 1,464 2,097 2,344
Acquiror 1,451 1,196 1,162 1,178 1,837 2,091
National Target and Acquiror 1,259 1,029 1,009 1,020 1,613 1,790
Denmark
UK
Israel
US
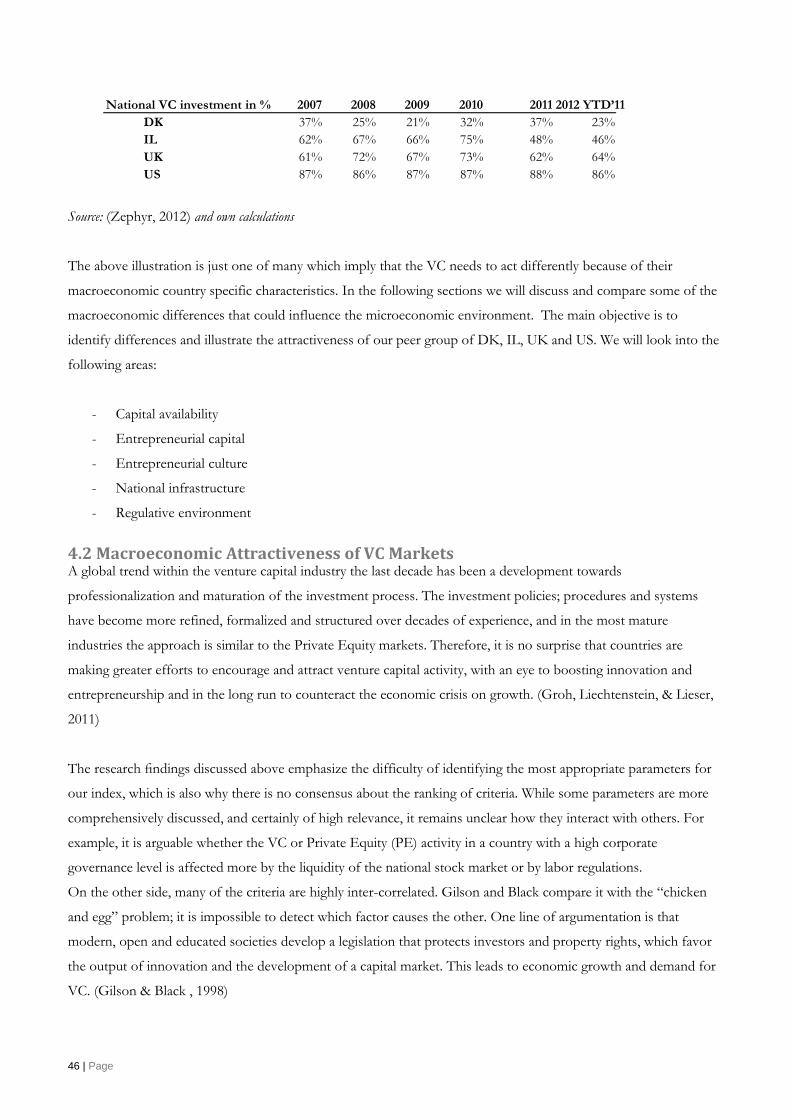
46 | Page
Source: (Zephyr, 2012) and own calculations
The above illustration is just one of many which imply that the VC needs to act differently because of their
macroeconomic country specific characteristics. In the following sections we will discuss and compare some of the
macroeconomic differences that could influence the microeconomic environment. The main objective is to
identify differences and illustrate the attractiveness of our peer group of DK, IL, UK and US. We will look into the
following areas:
- Capital availability
- Entrepreneurial capital
- Entrepreneurial culture
- National infrastructure
- Regulative environment
4.2 Macroeconomic Attractiveness of VC Markets A global trend within the venture capital industry the last decade has been a development towards
professionalization and maturation of the investment process. The investment policies; procedures and systems
have become more refined, formalized and structured over decades of experience, and in the most mature
industries the approach is similar to the Private Equity markets. Therefore, it is no surprise that countries are
making greater efforts to encourage and attract venture capital activity, with an eye to boosting innovation and
entrepreneurship and in the long run to counteract the economic crisis on growth. (Groh, Liechtenstein, & Lieser,
2011)
The research findings discussed above emphasize the difficulty of identifying the most appropriate parameters for
our index, which is also why there is no consensus about the ranking of criteria. While some parameters are more
comprehensively discussed, and certainly of high relevance, it remains unclear how they interact with others. For
example, it is arguable whether the VC or Private Equity (PE) activity in a country with a high corporate
governance level is affected more by the liquidity of the national stock market or by labor regulations.
On the other side, many of the criteria are highly inter-correlated. Gilson and Black compare it with the “chicken
and egg” problem; it is impossible to detect which factor causes the other. One line of argumentation is that
modern, open and educated societies develop a legislation that protects investors and property rights, which favor
the output of innovation and the development of a capital market. This leads to economic growth and demand for
VC. (Gilson & Black , 1998)
National VC investment in % 2007 2008 2009 2010 2011 2012 YTD’11 DK 37% 25% 21% 32% 37% 23% IL 62% 67% 66% 75% 48% 46% UK 61% 72% 67% 73% 62% 64% US 87% 86% 87% 87% 88% 86%
47 | Page
All lines of argument are reasonable and actually validated by the economic development of various selected
countries in different historic periods. Nevertheless, it seems to be the combination of all these factors which needs
to be improved in parallel to increase VC and PE attractiveness of countries and regions. For this reason, we do
not rely on a selection of a few parameters. For a country to receive a high index ranking it needs to achieve a high
score on all of the individual criteria. Therefore, the structure of the determinants is achieved with a more
comprehensive result and facilitates individual interpretation.
As venture capital commercializes innovation, a country’s VC market seems to become an even more important for
its international competitiveness. The commercialization of innovative products and ideas contributes to a
country’s quality employment, economic growth, and wealth, as discussed in section three. (Groh, Liechtenstein, &
Lieser, 2011)
4.2.1 Capital Availability Capital availability has been divided into three categories: Seed/Angel, Post Seed/VC and Exit opportunity (M&A).
To achieve a well-established venture market it is important to have a financial market that supports all three of the
mentioned categories. Seed and Post-Seed capital is important to generate capital in the most promising ventures,
however VCs need a market with strong M&A activity to sell their investments overtime.
Seed Angel and Post Seed Capital
Gilson and Black discuss the major differences between bank-centered and stock market-centered capital markets.
They argue that well-developed stock markets, which allow general partners to exit via IPOs, are crucial for the
establishment of vibrant VC/PE markets. Their main takeaways are that bankers’ conservative approach to lending
and investing, and the social and financial incentives that reward entrepreneurs less richly (and penalize failure more
severely), compromise entrepreneurial activity. (Gilson & Black , 1998) Alongside the disadvantages of bank
centered capital markets, Suda emphasizes that low availability of debt financing is an obstacle for start-ups in many
countries. (Groh, Liechtenstein, & Lieser, 2011) Entrepreneurs need to find backers — whether banks or VC/ PE
funds — who are willing to bear risk. Cetorelli and Gambera provide evidence that bank concentration promotes
the growth of those industrial sectors that have a higher need for external finance, by facilitating credit access to
younger companies. (Groh, Liechtenstein, & Lieser, 2009)
Market Activity: Exit potential
Exit potential is essential for VCs as many of them are using the business model of buy-and-sell, which has been
researched in-depth, e.g. Jeng stress that IPO activity is the main force behind cyclical swings because it directly
reflects the returns to the VC/PE funds. (Jeng, 2000) Similar Gompers and others points out that risk capital
flourishes in countries with deep and liquid stock markets. (Gilson & Black , 1998) Likewise, Schertler, sees markets
or the number of listed companies as a measure for stock market liquidity and finds that it has a significant impact
on VC and PE investments. (Schertler, 2003)
48 | Page
In addition, large corporations within technology industries such as Biotech, Medtech, or ICT are also creating a
more liquid venture market. M&A activity is also one of the biggest exit channels for the venture capitalist, and
having large corporations that can buy innovative solutions instead of having their own corporate venture capital
channel is beneficial for creating a more liquid venture market. This has proven to be especially important in the US
and UK where it has raised market liquidity. (Nesta, 2010) and (Groh, Liechtenstein, & Lieser, 2011)
4.2.2 Entrepreneurial Capital Lee and Peterson argue that cultures shape both individual orientation and environmental conditions, which may
lead to different levels of entrepreneurial activity, therefore “entrepreneurial capital” is an important aspect of the
potential of each country to be a successful venture hub. “Entrepreneurial capital” has been divided into four
minor subgroups: talent pool, talent affordability, English skills and mentors. (Gilson & Black , 1998) and (Lee &
Peterson)
Talent Pool
Megginson argues that, in order to foster a growing risk capital industry, the research culture (universities and
national laboratories) plays an important role. A strong educational program and high graduation rate is seen as
important factors to foster innovative ideas. (Megginson, 2004) In addition, often you see that graduates from Ivy-
league business schools have a higher success rate when deciding on starting a new venture and becoming
entrepreneurs. Furthermore, A-people often attract other A-people, which leads to synergies and networks that are
often stronger than would have been able to create outside of the university walls. (Groh, Liechtenstein, & Lieser,
2011)
Talent Affordability
Rigid labor market policies negatively affect the evolution of a VC market. Lazear discusses how protection of
workers can reduce employment and growth of any economy, and venture market. (Lazear, 1990) Gilson and Black
argue that labor market restrictions influence VC activity as well as expensive talent. (Gilson & Black , 1998) For
example, GoVirals CEO moved their core operations to the UK after they could get a UK graduate for 50% of the
salary of the same caliber graduate in Scandinavia, as he said
“Why should we create a company in a country where it is possible to get talent, but impossible to afford
it?” (Rechtmann, 2012)
English Skills
Communication across national borders is important to create a venture with some substance overtime, whereas
English is the most common language spoken in the world. Many would rightly argue that English skills are less
important in the Asian countries and to some extent Southern European countries. However, it is still an
49 | Page
undeniably important language. Megginson again discusses the quality of the educational system, and explains that
the ability to communicate is highly correlated with the success of any venture. (Megginson, 2004)
Mentors
Mentors, often-previous entrepreneurs, are important to help new entrepreneurs and ventures on the right track.
Silicon Valley is well known for their massive mentor network, and helpful mindset, that creates a whole new way
of getting information and advice. Other countries are starting to experience the same eco-system, even though it is
non-comparable with the American. Jesper Buch (Just-Eat) and Tommy Ahlers (Podio, Zyb) are some of those
who successfully have started their own eco-system and help new ventures to become more successful.
4.2.3 Entrepreneurial Culture Entrepreneurial culture within a given country is one of the most important aspects when you have to compare the
potential of a country’s entrepreneurial mindset. The culture within the country is often based on historic
credentials, and the development of the culture can take time. The American history is built on entrepreneurs
traveling to the country, with the goal of becoming rich.
Role Models
Role models is an extension of the before mentioned mentor society. The more successful entrepreneurs you hear
about, the more people will want to start their own company. Previously in our innovation theory, Kortum and
Lerner argued that R&D, as well as role models were crucial to create an ecosystem of ventures. (Kortum & Lerner,
2000)
Risk Taking
The willingness to start up a new venture, and maybe quit your existing job, is also an important factor of
innovation. There has been dividing research within this area, where Latham found that a strong social system is a
driver towards a more risk taking population. However, he has also shown that countries with a strong social
system tend to rely more on their government and are afraid of taking risks due to their growth around a strong
social network. Even so, a risk taking population is important to create a successful startup. (Latham, 2001)
Image of Failure
The probability of failure for any startup is 99 in 100. Therefore it is important that an entrepreneur has thought
about failure and realized that success will probably arrive after a couple of failures.
“If you haven’t experienced failure do not expect me invest in your startup” (Andreasen)
However, this is not a common perspective, many see failure as a negative term, with no positive reflection of it.
This reflects a fear of failure in some demographics, which often leads to the startup not happening.
50 | Page
Self-promotion skills
Promoting and selling the deal is all about how to market yourself, your idea, and your team. People naturally do
not have the ability to promote something that they are not a 100 % confident about.
Starting a business means dealing and talking with a lot of people who are focusing on the result and “what’s in it
for me”-mentality. You have to be self-promoting to show that you have what it takes to develop and execute your
business.
4.2.4 Nation Infrastructure Infrastructure, IT, logistics, payment etc. are all essential to be able to create a well-functioning business
environment, and at the moment it might be difficult to locate any western country that is not functioning well on
the logistics side. However, startup infrastructure is more than logistics and payment systems. The community and
legal services are also important aspects of a well-functioning startup environment. (Cumming D. , 2010)
Infrastructure: IT, Logistics and Payment
The ability to maneuver quickly around the world with well-functioning infrastructure aspects such as IT, logistics
and payment systems are important. These systems need to be both national international, integrated with
appropriate standards so that cross-border transaction is made possible. Often the Western part of the world is
highly integrated and does not experience any difficulty, whereas some BRIC and emerging countries may be
lacking a bit on these parameters. (OECD, 2011)
Community/Event
Angels have been seen as the most important facilitates of start-up in the history, to help develop and create the
startup (Governement of Canada, 2006) However, today start-up communities are evolving, and start-ups are
looking towards alternative routes to get their first “approval”. This is often done through incubators, accelerators
and boot camps, which both facilitate mentors and networks, but also office space and to some extent capital.
These are today seen as invaluable in the US startup scene and many countries are trying to adapt and create similar
communities. In addition, conferences, networking events, etc. are also important aspects of a well-functioning
start-up community.
Admin / Legal Services
Administrative and legal services are seen as a large roadblock for many young ventures due to the administrative
burden and cost of running a company. (OECD, 2011) Therefore the high cost of such services could limit the
willingness of starting your own firm. The legal advice is especially important, as the venture increases in size and
revenue, and this should not be a limitation towards growth.
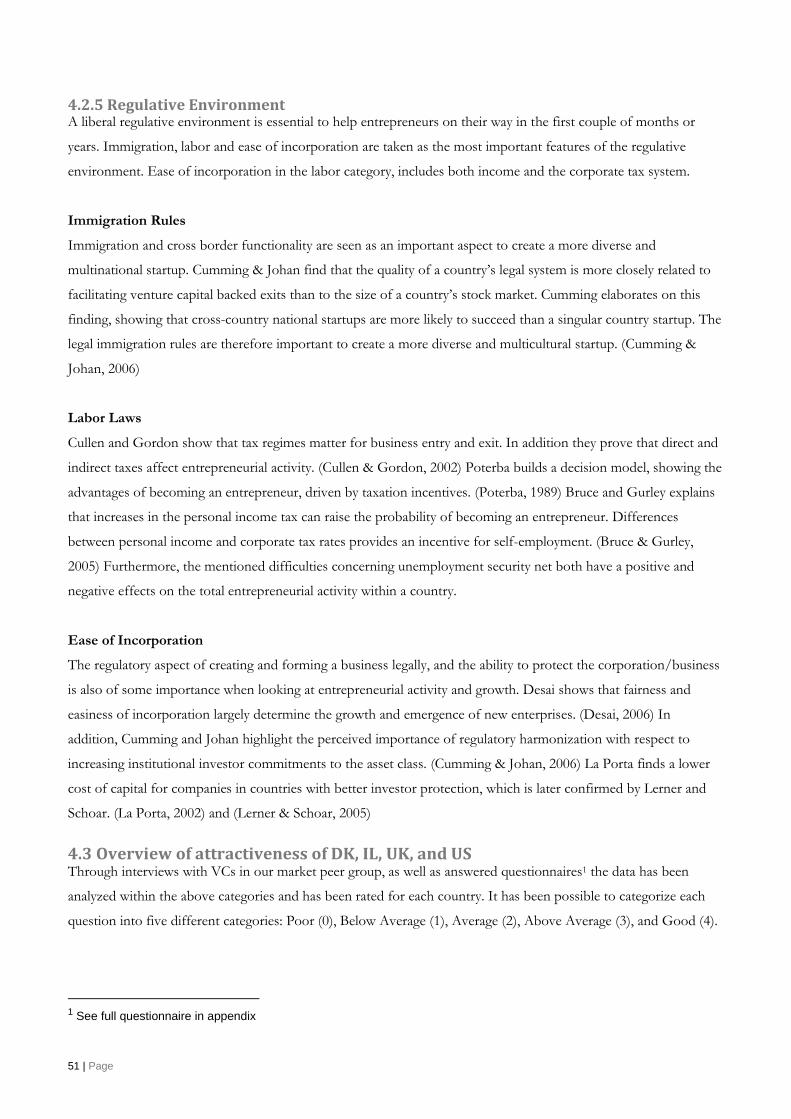
51 | Page
4.2.5 Regulative Environment A liberal regulative environment is essential to help entrepreneurs on their way in the first couple of months or
years. Immigration, labor and ease of incorporation are taken as the most important features of the regulative
environment. Ease of incorporation in the labor category, includes both income and the corporate tax system.
Immigration Rules
Immigration and cross border functionality are seen as an important aspect to create a more diverse and
multinational startup. Cumming & Johan find that the quality of a country’s legal system is more closely related to
facilitating venture capital backed exits than to the size of a country’s stock market. Cumming elaborates on this
finding, showing that cross-country national startups are more likely to succeed than a singular country startup. The
legal immigration rules are therefore important to create a more diverse and multicultural startup. (Cumming &
Johan, 2006)
Labor Laws
Cullen and Gordon show that tax regimes matter for business entry and exit. In addition they prove that direct and
indirect taxes affect entrepreneurial activity. (Cullen & Gordon, 2002) Poterba builds a decision model, showing the
advantages of becoming an entrepreneur, driven by taxation incentives. (Poterba, 1989) Bruce and Gurley explains
that increases in the personal income tax can raise the probability of becoming an entrepreneur. Differences
between personal income and corporate tax rates provides an incentive for self-employment. (Bruce & Gurley,
2005) Furthermore, the mentioned difficulties concerning unemployment security net both have a positive and
negative effects on the total entrepreneurial activity within a country.
Ease of Incorporation
The regulatory aspect of creating and forming a business legally, and the ability to protect the corporation/business
is also of some importance when looking at entrepreneurial activity and growth. Desai shows that fairness and
easiness of incorporation largely determine the growth and emergence of new enterprises. (Desai, 2006) In
addition, Cumming and Johan highlight the perceived importance of regulatory harmonization with respect to
increasing institutional investor commitments to the asset class. (Cumming & Johan, 2006) La Porta finds a lower
cost of capital for companies in countries with better investor protection, which is later confirmed by Lerner and
Schoar. (La Porta, 2002) and (Lerner & Schoar, 2005)
4.3 Overview of attractiveness of DK, IL, UK, and US Through interviews with VCs in our market peer group, as well as answered questionnaires1 the data has been
analyzed within the above categories and has been rated for each country. It has been possible to categorize each
question into five different categories: Poor (0), Below Average (1), Average (2), Above Average (3), and Good (4).
1 See full questionnaire in appendix

52 | Page
Each interviewee and questionnaire recipient has answered with his or her best knowledge their national VC market
understanding, and with the addition of national data regarding economic ratio our measurements have been
developed below. As stated in the beginning of this section, it has been difficult to narrow the characteristics down
to five categories. However, these five categories are substantial, and our ability to rank the countries on these
parameters seems reasonable as discussed previously.
In total the ranking of our peer group has been as followed:
US – 17.3
UK – 14.3
IL – 13.3
DK – 10.7
With the maximum score of 20 US scored 87 % of the possible, whereas DK only had a score of approximately 50
%. The areas where especially DK but also UK and IL score lower than the US are within the “Capital Availability”
and “Entrepreneurial Culture”. The exit opportunities in DK are more or less not present, and VCs have to look
for international exit opportunities, to realize their VC case.
The areas where the US are actually lower than the rest of the peer group is within the regulative environment,
where the US Labor system does not support entrepreneurial activity as much as the other countries. This is
actually surprising given the previous result of activity and size of the entrepreneurial market.
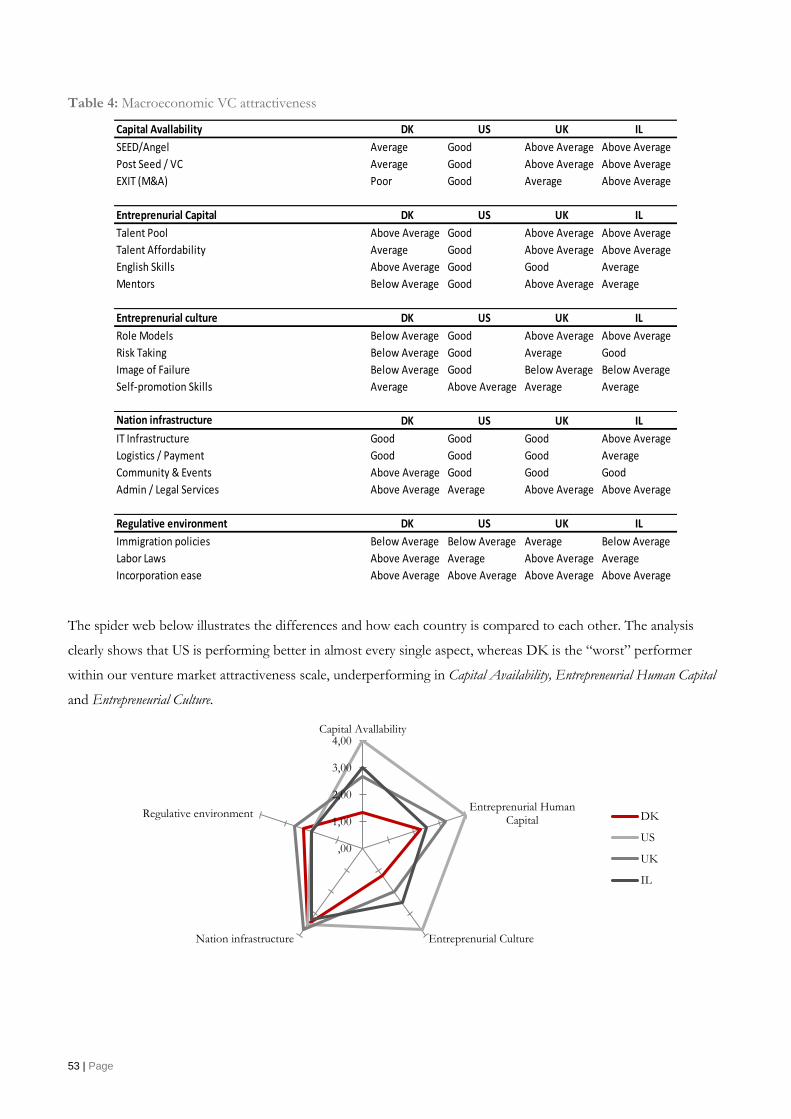
53 | Page
Table 4: Macroeconomic VC attractiveness
The spider web below illustrates the differences and how each country is compared to each other. The analysis
clearly shows that US is performing better in almost every single aspect, whereas DK is the “worst” performer
within our venture market attractiveness scale, underperforming in Capital Availability, Entrepreneurial Human Capital
and Entrepreneurial Culture.
Capital Avallability DK US UK IL
SEED/Angel Average Good Above Average Above Average
Post Seed / VC Average Good Above Average Above Average
EXIT (M&A) Poor Good Average Above Average
Entreprenurial Capital DK US UK IL
Talent Pool Above Average Good Above Average Above Average
Talent Affordability Average Good Above Average Above Average
English Skills Above Average Good Good Average
Mentors Below Average Good Above Average Average
Entreprenurial culture DK US UK IL
Role Models Below Average Good Above Average Above Average
Risk Taking Below Average Good Average Good
Image of Failure Below Average Good Below Average Below Average
Self-promotion Skills Average Above Average Average Average
Nation infrastructure DK US UK IL
IT Infrastructure Good Good Good Above Average
Logistics / Payment Good Good Good Average
Community & Events Above Average Good Good Good
Admin / Legal Services Above Average Average Above Average Above Average
Regulative environment DK US UK IL
Immigration policies Below Average Below Average Average Below Average
Labor Laws Above Average Average Above Average Average
Incorporation ease Above Average Above Average Above Average Above Average
,00
1,00
2,00
3,00
4,00Capital Avallability
Entreprenurial HumanCapital
Entreprenurial CultureNation infrastructure
Regulative environment DK
US
UK
IL

54 | Page
In the following section the hypothesis development will be explained and reasoned, based on the macroeconomic
level, as well as takeaways from the preliminary interview list.

55 | Page
5. Research Framework Model and Hypotheses Development The typical venture capital investment process has been analyzed and covered in section 2.4 of the thesis, in which
every step of the process has been evaluated and explained. The research problem of the thesis is to locate
differences within each of the chosen country’s venture capital financing approach and an opportunity to illustrate
which venture capital market best supports an innovative environment. Therefore, section 3 analyzed and discussed
which part of the venture capital process adds the most value to the innovative process of the economy. Through
the previous discussion and interviews with several experts on the value of venture capital in the economy, five
steps of the initial venture capital process had been chosen to represent the largest impact on spur of innovation in
a given country. These are: Average Size of Investment, Risk Strategy, Due Diligence, Management Phase and Exit
Phase. These five phases of the venture capital contact will be analyzed on each country and compared.
The research framework model functions are from the empirical research shown previously in the thesis. In
addition, the hypotheses have been developed through previous research and empirical findings, both through
preliminary interviews and research on National Innovation System in section 4.
.
5.1 Average Size of Investment “Average Size of Investment” is the research framework that deals with the different amount of money US, UK,
DK, and IL VC’s invest in portfolio companies at the seed, startup and growth stage. The analysis will show how
much, on average, each country’s VC’s will put in a similar startup, in three different stages of the life cycle.
Size of investment is an important area of interest when trying to found a new start-up and the importance of
getting capital in early stages is essential to spur the innovation. The size of investment says a lot about the
commitment and opportunity the VC sees in the business proposal, the potential for growth, and how they value
Venture Capital
US
Venture Capital
UK
Venture Capital
DK
Venture Capital
IL
Risk Strategy
Management Phase
Exit Phase
Average Size of
investment
Differences: US,
UK, IL and DKDue diligence
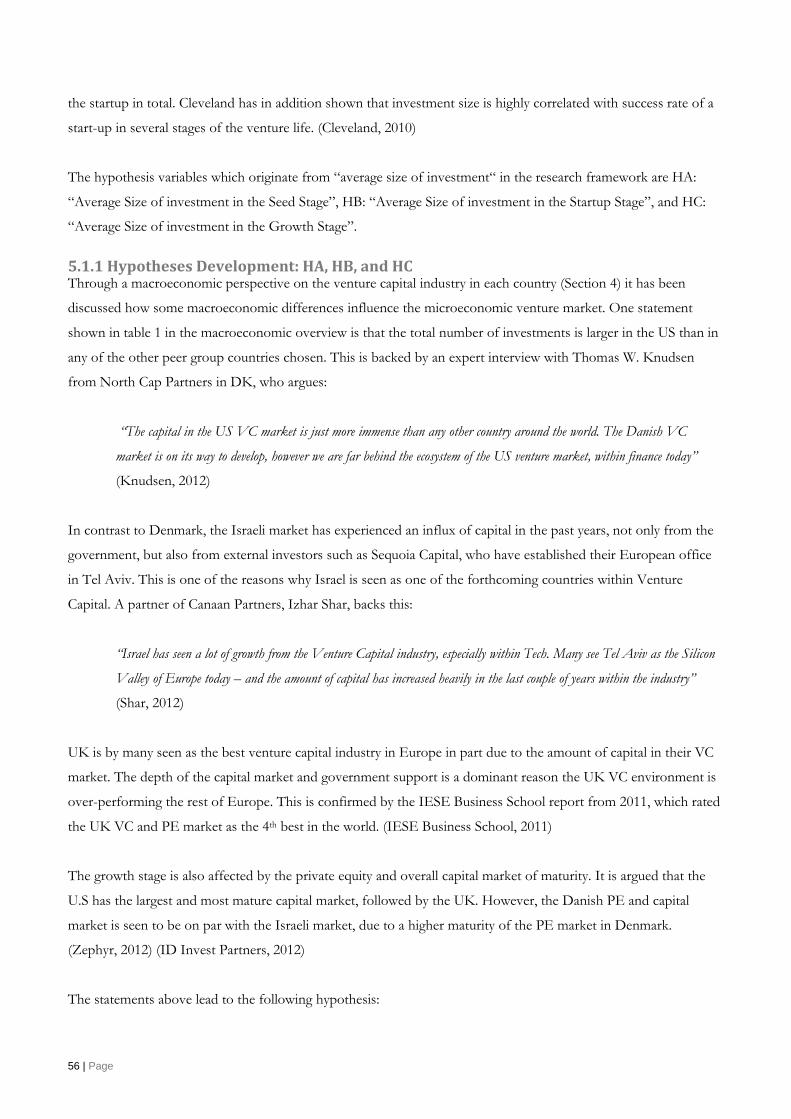
56 | Page
the startup in total. Cleveland has in addition shown that investment size is highly correlated with success rate of a
start-up in several stages of the venture life. (Cleveland, 2010)
The hypothesis variables which originate from “average size of investment“ in the research framework are HA:
“Average Size of investment in the Seed Stage”, HB: “Average Size of investment in the Startup Stage”, and HC:
“Average Size of investment in the Growth Stage”.
5.1.1 Hypotheses Development: HA, HB, and HC Through a macroeconomic perspective on the venture capital industry in each country (Section 4) it has been
discussed how some macroeconomic differences influence the microeconomic venture market. One statement
shown in table 1 in the macroeconomic overview is that the total number of investments is larger in the US than in
any of the other peer group countries chosen. This is backed by an expert interview with Thomas W. Knudsen
from North Cap Partners in DK, who argues:
“The capital in the US VC market is just more immense than any other country around the world. The Danish VC
market is on its way to develop, however we are far behind the ecosystem of the US venture market, within finance today”
(Knudsen, 2012)
In contrast to Denmark, the Israeli market has experienced an influx of capital in the past years, not only from the
government, but also from external investors such as Sequoia Capital, who have established their European office
in Tel Aviv. This is one of the reasons why Israel is seen as one of the forthcoming countries within Venture
Capital. A partner of Canaan Partners, Izhar Shar, backs this:
“Israel has seen a lot of growth from the Venture Capital industry, especially within Tech. Many see Tel Aviv as the Silicon
Valley of Europe today – and the amount of capital has increased heavily in the last couple of years within the industry”
(Shar, 2012)
UK is by many seen as the best venture capital industry in Europe in part due to the amount of capital in their VC
market. The depth of the capital market and government support is a dominant reason the UK VC environment is
over-performing the rest of Europe. This is confirmed by the IESE Business School report from 2011, which rated
the UK VC and PE market as the 4th best in the world. (IESE Business School, 2011)
The growth stage is also affected by the private equity and overall capital market of maturity. It is argued that the
U.S has the largest and most mature capital market, followed by the UK. However, the Danish PE and capital
market is seen to be on par with the Israeli market, due to a higher maturity of the PE market in Denmark.
(Zephyr, 2012) (ID Invest Partners, 2012)
The statements above lead to the following hypothesis:
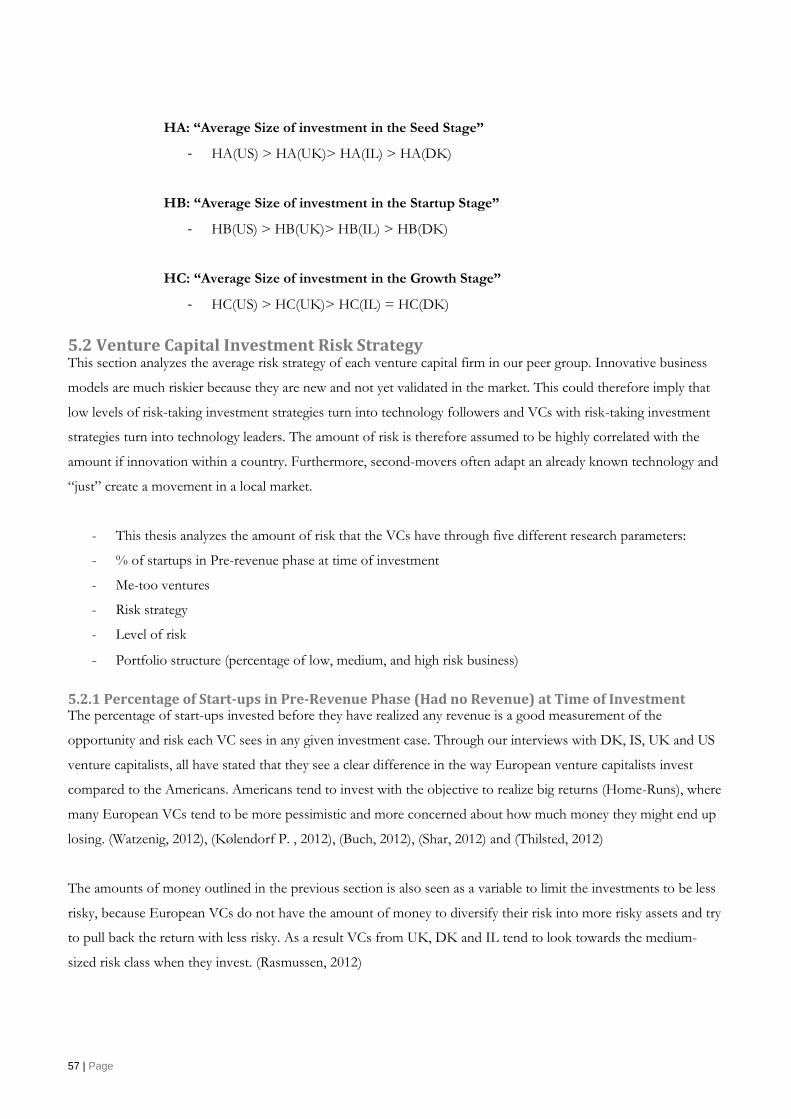
57 | Page
HA: “Average Size of investment in the Seed Stage”
- HA(US) > HA(UK)> HA(IL) > HA(DK)
HB: “Average Size of investment in the Startup Stage”
- HB(US) > HB(UK)> HB(IL) > HB(DK)
HC: “Average Size of investment in the Growth Stage”
- HC(US) > HC(UK)> HC(IL) = HC(DK)
5.2 Venture Capital Investment Risk Strategy This section analyzes the average risk strategy of each venture capital firm in our peer group. Innovative business
models are much riskier because they are new and not yet validated in the market. This could therefore imply that
low levels of risk-taking investment strategies turn into technology followers and VCs with risk-taking investment
strategies turn into technology leaders. The amount of risk is therefore assumed to be highly correlated with the
amount if innovation within a country. Furthermore, second-movers often adapt an already known technology and
“just” create a movement in a local market.
- This thesis analyzes the amount of risk that the VCs have through five different research parameters:
- % of startups in Pre-revenue phase at time of investment
- Me-too ventures
- Risk strategy
- Level of risk
- Portfolio structure (percentage of low, medium, and high risk business)
5.2.1 Percentage of Start-ups in Pre-Revenue Phase (Had no Revenue) at Time of Investment The percentage of start-ups invested before they have realized any revenue is a good measurement of the
opportunity and risk each VC sees in any given investment case. Through our interviews with DK, IS, UK and US
venture capitalists, all have stated that they see a clear difference in the way European venture capitalists invest
compared to the Americans. Americans tend to invest with the objective to realize big returns (Home-Runs), where
many European VCs tend to be more pessimistic and more concerned about how much money they might end up
losing. (Watzenig, 2012), (Kølendorf P. , 2012), (Buch, 2012), (Shar, 2012) and (Thilsted, 2012)
The amounts of money outlined in the previous section is also seen as a variable to limit the investments to be less
risky, because European VCs do not have the amount of money to diversify their risk into more risky assets and try
to pull back the return with less risky. As a result VCs from UK, DK and IL tend to look towards the medium-
sized risk class when they invest. (Rasmussen, 2012)
58 | Page
However, the Israeli financing round is starting to develop more like the American way of “doing-business”,
because of an increase capital inflow from external VC financing, as well as many American VC firms’ attraction
and local base in the capital – which have developed the VC culture towards the American less risk-averse
investment strategy.
The stated above leads to the following hypothesis:
HD: “Percentage of Startups in Pre-revenue Phase (Had no Revenue) at Time of
Investment”
- HD(US) > HD(IL) > HD(UK) = HD(DK)
5.2.2 Me-Too Ventures, Risk Strategy and Level of Risk Me-too investments are based on business model success in another market (in some cases, the business model has
also been seen in the same market), therefore the business model has already passed proof-of-concept and the risk
is limited to the execution and market understanding. The risk strategy is the risk which the individual VC is
persuading – what kind of business models, ventures, etc. they are seeking within their portfolio. The level of risk is
basically the VC’s own estimate on what percent they have allocated within low, medium and high risk ventures.
Me-too investment is a sign of seeking less risk and secure payoff, as long as you have the right management team
to execute the idea – which is actually proven to be more difficult than some VCs expect. (Leong, 2012) Overall,
European start-ups are predominantly not innovative on a worldwide perspective, but mainly innovative within the
local borders. Birdback CEO, Mr. Watzenig elaborates on this topic:
“Copycat mentality is high both in the US and Europe – and why not? It is easier to copy a success in your local area,
country or region, and in that way become a first mover locally. However, many Europeans travel home with several
“innovative ideas” from the US, while I have not heard of any American doing the same” (Watzenig, 2012)
The above quote is similarly backed by Rocket Internet – a German venture fund basically founded to copy tech
success from the US and create them in Europe.
The level of risk and the risk strategy of the VCs in DK, UK, IL and US is primarily based on the risk awareness
between the European countries and the US, and the level of capital that defines the degrees-of-freedom when a
VC is looking at potential business cases – can we afford to think big or should we allocate our investment towards
less risky investment cases.
“Europe’s Culture is deeply inhospitable to entrepreneurs; wanting to grow a startup into a behemoth is quite as counter
cultures piercings and performance art.” (The Economist, July 2012)
59 | Page
The European culture justifies less risky investments, which in this case results in less risky investments in the
venture capital industry. In addition, the argumentation within investments in pre-revenue stage will in a large
degree apply within Me-too investments, as the main argument is trying to limit their risk.
The reasoning above leads to the following hypothesis:
HE: “Percentage of Me-Too Investment”
HE(US) > HE(IL) > HE(UK) = HE(DK)
HF: “VCs Risk Strategy”
HF(US) > HF(IL) > HF(UK) = HF(DK)
HG: “VCs Level of Risk”
HG(US) > HG(IL) > HG(UK) = HG(DK)
5.2.3 Portfolio Structure The last parameter used to evaluate the risk strategy within the countries, is the history of venture performance in
each country. This analysis will to some extend be biased as the management phase of the VC has a lot of influence
on the development of the firm. Even so, the ratio will be able to estimate if the VCs in each region are more
focused on ventures that, outperform or die.
The ratio is highly correlated with the sections above. The evaluation of the risk awareness and the ability to have
more long-shots and less safe-bets is basically dependent on the amount of capital and the above mentioned risk
strategy, which is different from country to country.
To make the evaluation it has been necessary to divide the hypotheses up into four different tests, since the
hypotheses will vary dependent on the value.
The statements above lead to the following hypothesis:
HH1: “Portfolio Structure: Percentage of Ventures that Outperform”
o HH(US) = HH(IL) > HH(UK) = HH(DK)
HH2: “Portfolio Structure: Percentage of Ventures that Perform”
o HH(DK) = HH(UK) = HH(IL) = HH(US)
HH3: “Portfolio Structure: Percentage of Ventures that Survive”
o HH(DK) = HH(UK) > HH(IL) = HH(US)
60 | Page
HH4: “Portfolio Structure: Percentage of Ventures that Die”
o HH(US) = HH(IL) = HH(UK) = HH(DK)
5.3 Due Diligence The due diligence process is an important area of interest when VCs approach and evaluate a business idea. The
chosen approach both demonstrates professionalism and thoroughness, and a thorough due diligence will in the
end limit the risk and enlighten the understanding of the business case. Due diligence is often known from the PE
and M&A market, where companies use a lot of capital as well as hours, before deciding to acquire any given target.
(Jacobius, 2011) However, due diligence could also be less structured and be more of an informal approach of
understanding the market. This is highly dependent on network, and also a bit more risk-minded, since the due
diligence often will depend on individuals. The due diligence process is an important tool to screen the investments
that are truly innovative and have a potential of driving the economy from those who will not succeed in the future.
The due diligence research should try to show a pattern of resources used on due diligence and portfolio structure.
This thesis analyzes the way VCs differ in doing due diligence through three different aspects of our research:
- Management Team Due Diligence
- Product/Service Due Diligence
- Market Due Diligence
5.3.1 Management Team Due Diligence In the research framework, management team due diligence relates to the differences in the evaluation of
management teams in the US, UK, DK and IL. It analyzes the factors that VCs weigh in the assessment of each
member of the management team and what weight each factor carries in the overall assessment of a management
team. In essence, a due diligence on the management can be done just like any headhunting firm with screening and
researching their potential profiles for any specific job; LinkedIn, phone calls, interviews, etc. However, what you
are looking at is experience in executing and determination within the team. This is fairly seldom to find within a
start-up – especially as many has seen their future venture as their lifelong dream.
Therefore, a strong parameter to analyze is if the VCs have done a management team due diligence and has found
the right management team or decided to hire a new management team. Experienced CEOs have an extensive
background in previous professions and possess a lot of practical experience. In such circumstances, the
experienced manager spearheads the start-up and serves as a substitute for founders. The hypothesis variable which
is deduced from the research framework to statistically test the difference in the management team due diligence
style of US, UK, DK, and IL VCs is:
HJ: “Percentage of Startups Not Managed by Founders but Experienced Managers (CEO)
61 | Page
Typically founders are not always good at managing a startup from the seed to growth stage. They may have a
vision on how to launch and create a certain product or service, but lack business and people skills to run a
company of +20 employees.
Tommy Ahlers from Podio, who actually was reinstated as CEO of Podio after buying shares, due to his experience
of executing and exiting from previous startups, states:
“I think that it is more common in the US to find a certain experience manager, given the strategy of the firm – are we going
to exit in 3 years; then we need this guy. Grow like Google; then we have to hire this other guy” (Ahlers, 2012)
However, as Søren Steen Rasmussen from Vækstfonden also states:
“… this issue is interesting, but it is also about the amount of money we have to invest in these companies. Is there enough
capital to both have the firm growth at a certain level and to hire an experienced CEO” (Rasmussen, 2012)
The expectation within experienced managers across Europe is expected to be around the same level. Through our
macroeconomic analysis as well as the culture of venture capital we would therefore expect that the level of change
in managers would be more or less the same across Europe. The success of US venture capital backed start-ups
could be driven by higher percentages of experienced managers running start-ups compared to their UK, DK, and
IL counterparts. In regards to the percentage of start-ups not managed by founders but instead by an experienced
manager, the following hypotheses is tested:
HI: “Percentage of Startups Not Managed by Founders but Experienced
Managers (CEO)
- HI(US) > HJ(UK) = HI(IL) = HI(DK)
5.3.2 Market and Product/Service Due Diligence Market and product/service due diligence explores the differences in the way US, UK, DK and IL VCs validate the
product and market of the potential investment case. VCs can conduct their product and market due diligence in
four ways: Internal product due diligence, external product due diligence or a mix of internal and external, as well as
informal due diligence.
VCs with a large resource base of technical insights in the given product and market industry will often conduct
their own research and limit their external usage. This will often be some of the largest VCs who have technical and
industry knowledge. However, VCs with fewer resources, often smaller VC funds, will tend to seek external
resources to conduct analysis. (Sbietiati, 2012) and (Kølendorf P. , 2012)
62 | Page
In addition, many smaller funds often tend to conduct a product due diligence through competitor search and find
similar business models in different regions of the world – which proves the concept and product. This due
diligence is a “me-too” approach of investments, which is less innovative and less risky as well. (Sbietiati, 2012) and
(Kølendorf P. , 2012)
In a previous section we have already set up a hypothesis (HE) of the percentage of “me-too” investments, based
on the risk perspective. However, we will also set up a hypothesis on resources spent on external consultants:
HJ: “Percentage of External Reports Requested pr. Venture”
The percentage of external reports requested pr. venture is an estimate on how often VCs in US, UK, DK and IL
go to external consultants, investment bankers, or similar for advice and receive a written report.
As stated above, the main reason for getting external help is lack of internal resources within the VC firm.
However, some may also limit themselves because of limited capital and “just” do a short (quick and dirty) due
diligence without really understanding the product, and decide to go ahead with the investment.
Therefore the hypotheses are difficult to set up due to the many different aspects and factors that influence the
reason for external expert advice. In the end the following hypothesis has been developed, due to the above
statements:
HJ: “Percentage of External Product Reports Requested pr. Venture”
- HJ(DK) > HJ(IL) = HJ(UK) > HJ(US)
HK: “Percentage of Market Analysis Due Diligence Done Informal”
As explained in both section 2 and section 4 in the empirical analysis and in the National Innovation System, the
center of gravity of a market and maturity of a venture capital market determine the level of informality in market
analysis due diligence. In a matured venture capital market, partners have strong sector domain expertise and
networks to relevant market and technology mavens. Under such conditions, the main source of information for
market analysis is through informal network contacts.
In our macroeconomic research framework the maturity (ranking of each venture capital market), stated that the
US was by far the most superior venture capital market, followed by UK, IL and DK. Therefore the following
hypothesis of informal market due diligence is as follows:
63 | Page
HK: “Percentage of External Market Reports Requested pr. Venture”
- HK(US) > HK(UK) > HK(IL) > HK(DK)
5.4 Management Phase (Value Adding Phase) The management phase is as stated in several places in section 3 and 4 of this thesis, one of the areas where VCs
can generate the most value, and in that way create and spur innovation that without their presence would not have
been possible. This is done through nurturing portfolio companies and engagement with their experience when
difficult decisions need to be agreed upon. Some examples could be; budget planning, recruiting, expansion in the
domestic market, marketing & sales, introduction to customers (often internal in the portfolio) and strategic
players, business strategy, international expansion, e.g. The main goal of the management phase is to create the
most unrivaled environment for the venture, so that it will grow.
The forthcoming analysis therefore strives to conduct an analysis to determine where the most potential value is
created. The level and quality of value adding activities that a VC provides to a startup is something that is very
subjective and hard to measure. However, the analysis will be able to analyze where the best terms of value creating
would be. This is done through research in the following areas:
- Partner Ratio
o Partner/Analyst
o Partner/Associate
- Number of board seats per partner
- Time used on portfolio companies
- Contact of management of portfolio companies
All of the above is focusing on time and engagement of the VC on any specific portfolio firm – how much time
does each VC have for each portfolio firm and partner engagement that can create value on the top executive level.
In VC terms this is often referred to as dumb-money and smart-money, where smart-money often comes at a
higher price. This topic has however, been heavily discussed and at recent presentations at the VCIC DK at
Copenhagen Business School, Søren Sten Rasmussen was asked precisely about how they created value to their
investment in Iconfinder and how often they were talking with the management:
“We do not see any need at the moment to add any strategic value as the current CEO, Martin Leblanc is on top of the
strategy and execution, and in regards of management we have a policy of visiting our portfolio companies four times a year”
(VCIC DK, 2012)
This statement explains that Iconfinder in this specific case did not do any strategic operation, and are currently
letting the portfolio company run its own way. This of course, could be a one-off, and be influenced by a well-
functioning firm that at the moment is on the right track.

64 | Page
In a report made by Teten and others, analyzing how VCs can accelerate returns and create more value in their
portfolio companies, it is proven that size of VCs matter. (Teten, Bremer, Buslig, & Hussein, 2012) This therefore
is a well-argued argument that US VCs will have more resources, because of their size.
The above justification leads to the following hypothesis:
HL1: “Partner Ratio: Analyst and Associate”:
Shows how many partners pr. analyst and associate in different countries on average – the higher
the value the better, as partners will create more value through their experience within the venture
market. Through our previous statement of size the following hypothesis is made:
- HL1(US) > HL1(UK) > HL1(IL) > HL1(DK)
HL2: “Number of Board Sets pr. Partner”:
The research estimates how many board sets each partner has. Its good to have partners in boards,
however if each partner has +10 companies to administrate, the value of the time in the boards is
being diluted, therefore we have set up the following hypothesis from previous discussion on size
of firms:
- HL2(DK) = HL2(IL) > HL2(UK) > HL2(US)
HL3: “Time Used on Portfolio Companies”:
The research has asked each VC to give an estimate on how they spend their time. They could
choose three different aspects; deal sourcing, administrative work or portfolio company
management. Through previous statement of size the following hypothesis is made:
- HL3(US) > HL3(UK) > HL3(IL) > HL3(DK)
HL4: “Management Contact of Portfolio Companies”:
The research question asks how often any senior manager visits a portfolio company on average
per month. This analysis is a further extension of HL4, to evaluate how much time senior
managers spend in their portfolio firms. Through our previous statement of size the following
hypothesis is made:
- HL4(US) > HL4(UK) > HL4(IL) > HL4(DK)

65 | Page
5.5 Exit Phase The exit phase in the research framework analyzes the differences of the exit channels and behavior within the VCs
in US, UK, DK, and IL. The exit channels and behavior are essential for any VC as the business model for any
successful VC is to buy, build, and sell any venture they acquire. If VCs know at the time of commitment that their
abilities and possibilities of exiting the business case are limited, this could influence the investment criteria. Instead
of searching for innovative, risky business, they might have a tendency to look towards more revenue focused
ventures, with less risk and innovation. This will limit the innovation process throughout the value chain.
The research framework has built upon two important aspects of the exit phase, to identify the exit opportunities
within each region:
HM1: “What Have Been You’re Typical Exit Strategy the Last Five Years”
HM2: “Seen on a Geographic Perspective, What is Most Common When You Exit?
The exit strategy is closely discussed in previous section 4.2.1, where five different ways to exit are examined;
founders, venture capital firm, private equity firm, large strategic corporation and IPO. The more buyers, the higher
value you can get - supply and demand. However, often strategic corporation is the best for a M&A transaction,
due to their potential synergies within the same industry, therefore it is important to have the entire of the above
exit opportunities present within your country.
Within the US it is common to sell start-ups to both strategic corporations and engage in IPO transactions (
(Chrunch Base, 2011) However, this is not the same case in Europe. Sten Søren Rasmussen states:
“When we acquire a venture firm we know that we have to look into new geographies to exit our business cases. In addition,
we often hire external consultants such as Torch Partners to exit our investments” (Rasmussen, 2012)
Furthermore, the long history within the US venture capital market has created a mature market with mature
companies buying new ventures, e.g. Google have had 121 acquisitions since 2001, Microsoft, 101 since 2001,
Apple 28 since 2011, and Facebook 30 since 2010. (Chrunchbase, 2012). All this almost creates more activity than
the total acquisition statistics in Europe. Of course some of the above mentioned acquisition are from European
start-ups, e.g. Apple board C3 in 2010, which was a Swedish mapping company (Tech). (Zephyr, 2012)
We therefore expect that the maturity and size of the VCs firm is highly dependent on how often VCs exit to large
corporations, IPOs vs. founders, PE or VC firms, and in addition, also if they exit within their own boarders or exit
to different geographies.
66 | Page
We have therefore set up the following hypothesis to illustrate the differences within the exit strategy of the VC
firms:
HM: “What Have Been You’re Typical Exit Strategy the Last Five Years as a Percentage
of Large Corp. and IPOs vs. Founders, PE and VC firms”
- HM1(US) > HM1(UK) > HM1(IL) > HM1(DK)
The same assumptions are made within the differences in exits either within domestic or foreign channels. It is in
our discussion argued that the more mature as well as the history and size of development of corporation, the more
domestic exits it is expected to have. In addition, it is also important to look into the demographic of the country’s
economy, as done in section 4. The size of the population and GDP, are also important factors to analyze the
domestic and foreign exit strategy of each venture capitalist. Therefore the following hypothesis has been made:
HM2: “As a Percentage Have You Made More Exits Within or Outside Your Borders?”
- HM2(US) > HM2(UK) > HM2(IL) > HM2(DK)
Combining HM1 and HM2 will give a deep insight into comparing how exit channels in the peer group are formed,
and what the main differences are. This would be a valuable takeaway and maybe establish an insight into some of
the former hypothesis developed previously in this section.
67 | Page
6. Analysis and Comparison of Findings In the following section we will outline the results of the tested hypothesis stated in section 5. All data has been
collected through a questionnaire and placed in the appendix. Some data has been collected in previous research by
Garbade, whereas others has been added as a supplement to the analysis, as well as created an analysis that will give
some information on how the best practice VC market in Europe is compared with the US way of financing
startups. (Garbade, 2009)
In the following section we will go through the analysis, some will be done with an econometric approach, and
others will be analyzed from a top-down approach with simple comparison of the data from the quantitative
analysis. The following sections are to be analyzed and compared:
Average Size of Investment - Statistical Analyzes and Simple Comparison
Risk Strategy - Comparison
Due Diligence - Comparison
Management Phase - Comparison
Exit Phase - Comparison
6.1 Average Size of Investment: Investment Strategy Within the questionnaire, every VC was asked to state in what range of money their VC firm normally invested
within the seed, startup, and growth stage. Every VC therefore had to give an upper and lower limit, within each
stage. In order to analyze these numbers, a simple average of every VC’s investment range has been used to
illustrate the average amount of investment for the given VC in a given life-cycle stage.
VCs in Israel were asked to state their amount in millions ILS, Danish VCs in millions DKK, UK VCs in millions
GBP and US VCs in million USD. Every currency has been transferred into million USD with a five-year currency
rate average. (Oanda.com) The approach of analyzing the differences is done through an econometric as well as a
simple average mean comparison.2
6.1.1 Average Size of Investment: Seed Stage Comparing the means of the four markets, shows that they do not vary a lot. The US average investment size is the
lowest, in the areas of 0.47 million USD investment in the seed stage, whereas UK has the highest average
investment size on 0.61 million USD. DK and IL are around 0.5 million USD, which is just above the average of
the US. On a simple comparison of the mean average, it shows that UK has the highest investment size per venture
in the seed stage. However, the sample size is also lower and therefore less reliable than the one of the US.
Table 1: Average Investment Size - Seed Stage
2 All data in hard format is shown in appendix D

68 | Page
The above differences is analyzed from a simple average, however to test our hypotheses from section 5 we will
have to prove that the above differences are statistical significant, and that there therefore are significant differences
in the money VCs invest in the seed stage. The hypothesis was stated like this in section 5:
HA: “Average Size of Investment in the Seed Stage”
- HA(US) > HA(UK)> HA(IL) > HA(DK)
In the first part in the above “equation”, it is necessary to statistically prove that the average size of investment in
the seed stage in the US is larger than the UK.
HA1: HA(US) > HA(UK)
To analyze whether the above statement is statistically significant, it is worth discussing which significance interval
to test significance within; 99%, 97,5% or 95% - this paper will test on the 95% quartile interval, with a α of 0,05 on
a right tale basis.
It is possible to test if the results are significant through three different areas:
- T-value : The found T-value is above the t-value within the distribution chart of tables of statistician
(Gujarati & Porter, 2009)
- P-value: The found p-value is below the chosen α (Gujarati & Porter, 2009)
- Mean differences: A mean difference, that falls out of the confidence interval (Gujarati & Porter, 2009)
The above analysis found the following numbers:
- T-value : The found T-value is below the rejection region of 1.771, with a DF of 13 (Allwood, 2008)
- P-value: The found p of 0.1225 is higher than our chosen α of 0.05
- Mean differences: The mean differences of -0.140 is within the confidence interval
- It is therefore not possible to reject the H0 hypothesis that the average size of investment in the seed stage
in the UK is higher than the ones in the US. Hereby, it is not possible conclude HA1, where US > UK is
statistically significant, and higher than the UK average size of investment within the seed stage.
Average Investment Size: Seed Stage
US UK DK IL
Mean 0.47 0.6098 0.50 0.5156
VAR 0.100 0.094 0.078 0.035
N 36 9 9 13
N - 1 35 8 8 12
VAR / N 0.003 0.010 0.009 0.003
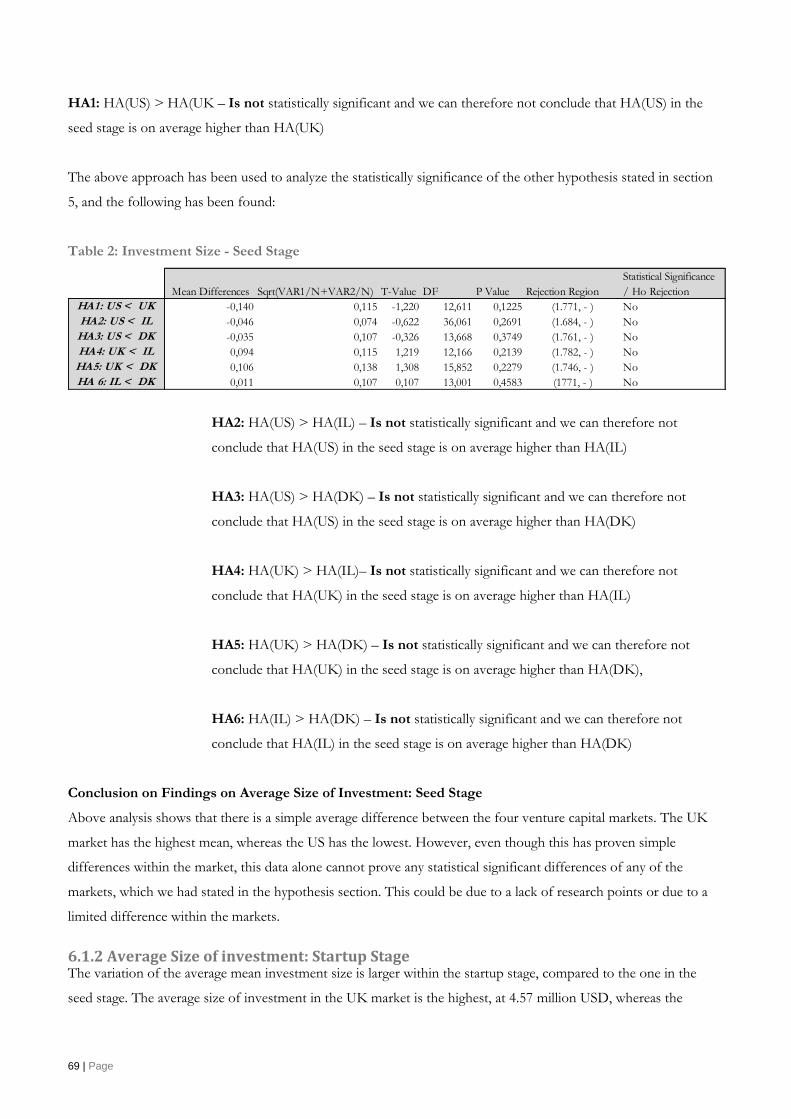
69 | Page
HA1: HA(US) > HA(UK – Is not statistically significant and we can therefore not conclude that HA(US) in the
seed stage is on average higher than HA(UK)
The above approach has been used to analyze the statistically significance of the other hypothesis stated in section
5, and the following has been found:
Table 2: Investment Size - Seed Stage
HA2: HA(US) > HA(IL) – Is not statistically significant and we can therefore not
conclude that HA(US) in the seed stage is on average higher than HA(IL)
HA3: HA(US) > HA(DK) – Is not statistically significant and we can therefore not
conclude that HA(US) in the seed stage is on average higher than HA(DK)
HA4: HA(UK) > HA(IL)– Is not statistically significant and we can therefore not
conclude that HA(UK) in the seed stage is on average higher than HA(IL)
HA5: HA(UK) > HA(DK) – Is not statistically significant and we can therefore not
conclude that HA(UK) in the seed stage is on average higher than HA(DK),
HA6: HA(IL) > HA(DK) – Is not statistically significant and we can therefore not
conclude that HA(IL) in the seed stage is on average higher than HA(DK)
Conclusion on Findings on Average Size of Investment: Seed Stage
Above analysis shows that there is a simple average difference between the four venture capital markets. The UK
market has the highest mean, whereas the US has the lowest. However, even though this has proven simple
differences within the market, this data alone cannot prove any statistical significant differences of any of the
markets, which we had stated in the hypothesis section. This could be due to a lack of research points or due to a
limited difference within the markets.
6.1.2 Average Size of investment: Startup Stage The variation of the average mean investment size is larger within the startup stage, compared to the one in the
seed stage. The average size of investment in the UK market is the highest, at 4.57 million USD, whereas the
Mean Differences Sqrt(VAR1/N+VAR2/N) T-Value DF P Value Rejection Region
Statistical Significance
/ Ho Rejection
HA1: US < UK -0,140 0,115 -1,220 12,611 0,1225 (1.771, - ) No
HA2: US < IL -0,046 0,074 -0,622 36,061 0,2691 (1.684, - ) No
HA3: US < DK -0,035 0,107 -0,326 13,668 0,3749 (1.761, - ) No
HA4: UK < IL 0,094 0,115 1,219 12,166 0,2139 (1.782, - ) No
HA5: UK < DK 0,106 0,138 1,308 15,852 0,2279 (1.746, - ) No
HA 6: IL < DK 0,011 0,107 0,107 13,001 0,4583 (1771, - ) No
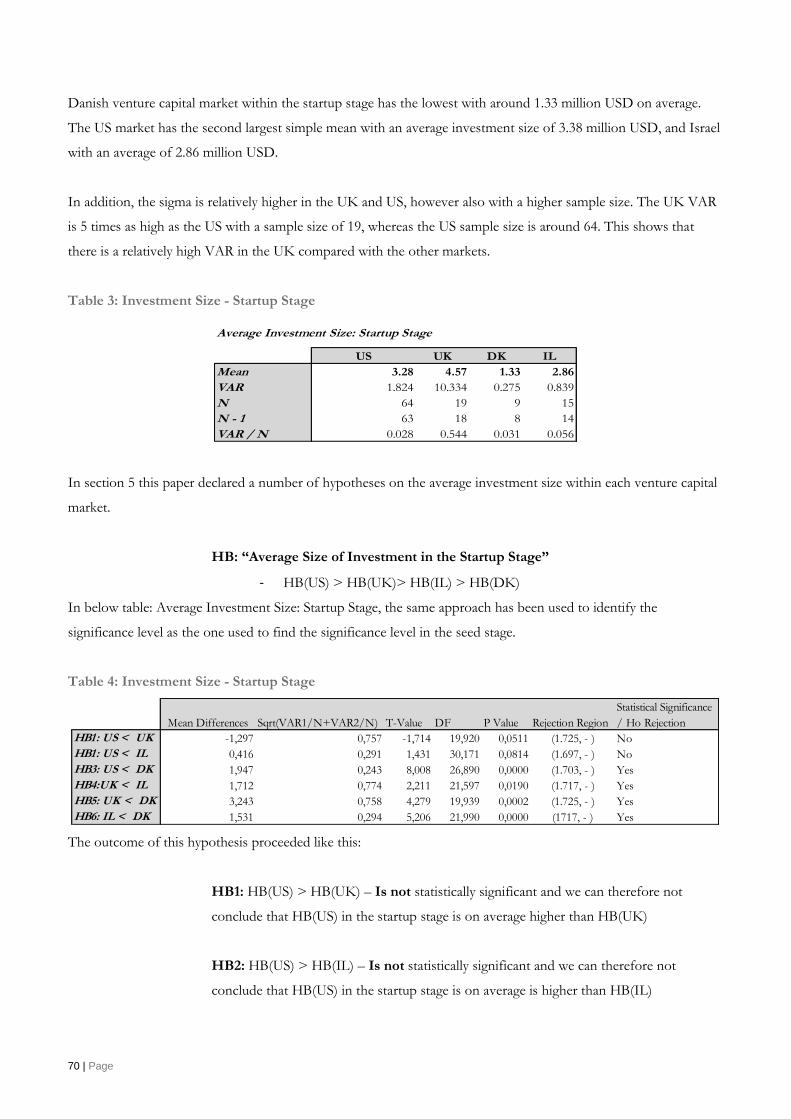
70 | Page
Danish venture capital market within the startup stage has the lowest with around 1.33 million USD on average.
The US market has the second largest simple mean with an average investment size of 3.38 million USD, and Israel
with an average of 2.86 million USD.
In addition, the sigma is relatively higher in the UK and US, however also with a higher sample size. The UK VAR
is 5 times as high as the US with a sample size of 19, whereas the US sample size is around 64. This shows that
there is a relatively high VAR in the UK compared with the other markets.
Table 3: Investment Size - Startup Stage
In section 5 this paper declared a number of hypotheses on the average investment size within each venture capital
market.
HB: “Average Size of Investment in the Startup Stage”
- HB(US) > HB(UK)> HB(IL) > HB(DK)
In below table: Average Investment Size: Startup Stage, the same approach has been used to identify the
significance level as the one used to find the significance level in the seed stage.
Table 4: Investment Size - Startup Stage
The outcome of this hypothesis proceeded like this:
HB1: HB(US) > HB(UK) – Is not statistically significant and we can therefore not
conclude that HB(US) in the startup stage is on average higher than HB(UK)
HB2: HB(US) > HB(IL) – Is not statistically significant and we can therefore not
conclude that HB(US) in the startup stage is on average is higher than HB(IL)
Average Investment Size: Startup Stage
US UK DK IL
Mean 3.28 4.57 1.33 2.86
VAR 1.824 10.334 0.275 0.839
N 64 19 9 15
N - 1 63 18 8 14
VAR / N 0.028 0.544 0.031 0.056
Mean Differences Sqrt(VAR1/N+VAR2/N) T-Value DF P Value Rejection Region
Statistical Significance
/ Ho Rejection
HB1: US < UK -1,297 0,757 -1,714 19,920 0,0511 (1.725, - ) No
HB1: US < IL 0,416 0,291 1,431 30,171 0,0814 (1.697, - ) No
HB3: US < DK 1,947 0,243 8,008 26,890 0,0000 (1.703, - ) Yes
HB4:UK < IL 1,712 0,774 2,211 21,597 0,0190 (1.717, - ) Yes
HB5: UK < DK 3,243 0,758 4,279 19,939 0,0002 (1.725, - ) Yes
HB6: IL < DK 1,531 0,294 5,206 21,990 0,0000 (1717, - ) Yes
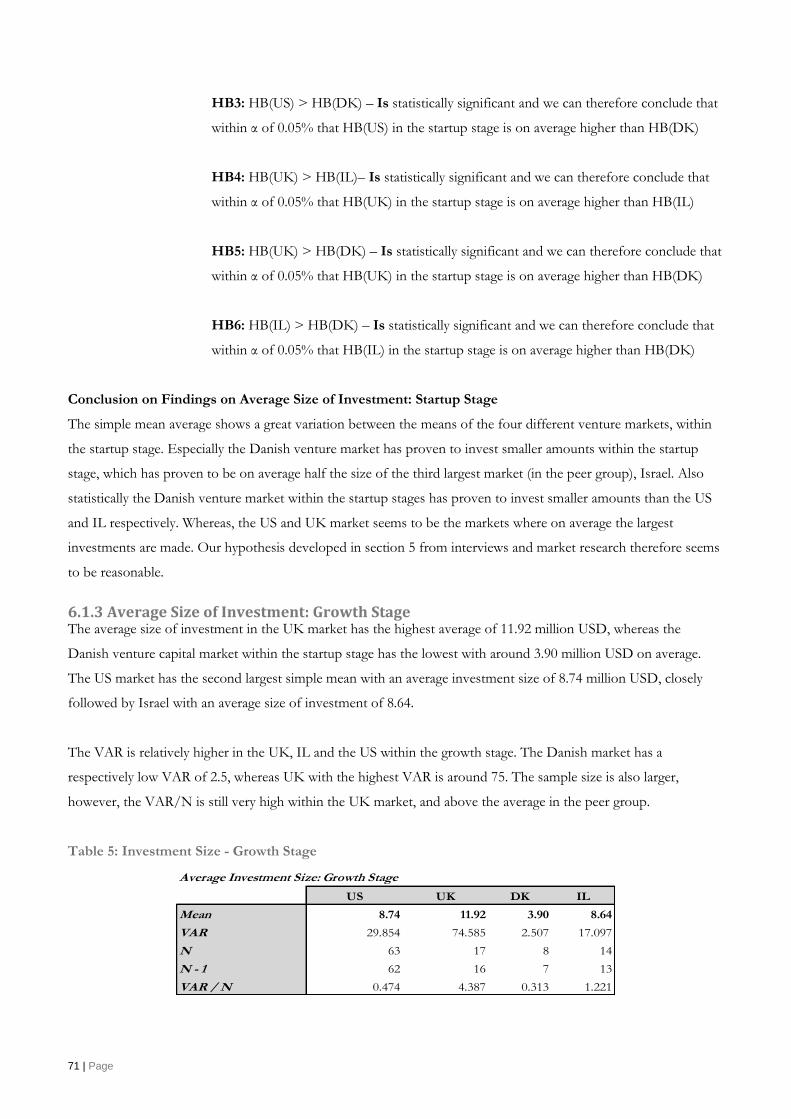
71 | Page
HB3: HB(US) > HB(DK) – Is statistically significant and we can therefore conclude that
within α of 0.05% that HB(US) in the startup stage is on average higher than HB(DK)
HB4: HB(UK) > HB(IL)– Is statistically significant and we can therefore conclude that
within α of 0.05% that HB(UK) in the startup stage is on average higher than HB(IL)
HB5: HB(UK) > HB(DK) – Is statistically significant and we can therefore conclude that
within α of 0.05% that HB(UK) in the startup stage is on average higher than HB(DK)
HB6: HB(IL) > HB(DK) – Is statistically significant and we can therefore conclude that
within α of 0.05% that HB(IL) in the startup stage is on average higher than HB(DK)
Conclusion on Findings on Average Size of Investment: Startup Stage
The simple mean average shows a great variation between the means of the four different venture markets, within
the startup stage. Especially the Danish venture market has proven to invest smaller amounts within the startup
stage, which has proven to be on average half the size of the third largest market (in the peer group), Israel. Also
statistically the Danish venture market within the startup stages has proven to invest smaller amounts than the US
and IL respectively. Whereas, the US and UK market seems to be the markets where on average the largest
investments are made. Our hypothesis developed in section 5 from interviews and market research therefore seems
to be reasonable.
6.1.3 Average Size of Investment: Growth Stage The average size of investment in the UK market has the highest average of 11.92 million USD, whereas the
Danish venture capital market within the startup stage has the lowest with around 3.90 million USD on average.
The US market has the second largest simple mean with an average investment size of 8.74 million USD, closely
followed by Israel with an average size of investment of 8.64.
The VAR is relatively higher in the UK, IL and the US within the growth stage. The Danish market has a
respectively low VAR of 2.5, whereas UK with the highest VAR is around 75. The sample size is also larger,
however, the VAR/N is still very high within the UK market, and above the average in the peer group.
Table 5: Investment Size - Growth Stage
Average Investment Size: Growth Stage
US UK DK IL
Mean 8.74 11.92 3.90 8.64
VAR 29.854 74.585 2.507 17.097
N 63 17 8 14
N - 1 62 16 7 13
VAR / N 0.474 4.387 0.313 1.221
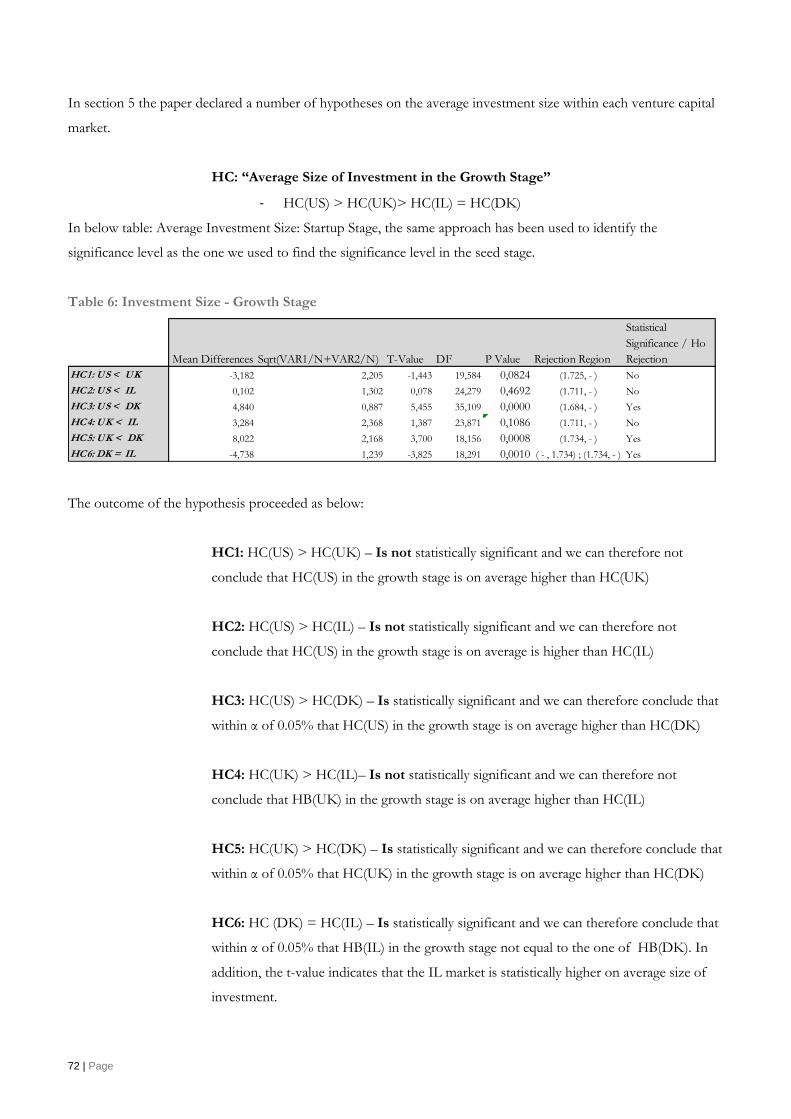
72 | Page
In section 5 the paper declared a number of hypotheses on the average investment size within each venture capital
market.
HC: “Average Size of Investment in the Growth Stage”
- HC(US) > HC(UK)> HC(IL) = HC(DK)
In below table: Average Investment Size: Startup Stage, the same approach has been used to identify the
significance level as the one we used to find the significance level in the seed stage.
Table 6: Investment Size - Growth Stage
The outcome of the hypothesis proceeded as below:
HC1: HC(US) > HC(UK) – Is not statistically significant and we can therefore not
conclude that HC(US) in the growth stage is on average higher than HC(UK)
HC2: HC(US) > HC(IL) – Is not statistically significant and we can therefore not
conclude that HC(US) in the growth stage is on average is higher than HC(IL)
HC3: HC(US) > HC(DK) – Is statistically significant and we can therefore conclude that
within α of 0.05% that HC(US) in the growth stage is on average higher than HC(DK)
HC4: HC(UK) > HC(IL)– Is not statistically significant and we can therefore not
conclude that HB(UK) in the growth stage is on average higher than HC(IL)
HC5: HC(UK) > HC(DK) – Is statistically significant and we can therefore conclude that
within α of 0.05% that HC(UK) in the growth stage is on average higher than HC(DK)
HC6: HC (DK) = HC(IL) – Is statistically significant and we can therefore conclude that
within α of 0.05% that HB(IL) in the growth stage not equal to the one of HB(DK). In
addition, the t-value indicates that the IL market is statistically higher on average size of
investment.
Mean Differences Sqrt(VAR1/N+VAR2/N) T-Value DF P Value Rejection Region
Statistical
Significance / Ho
Rejection
HC1: US < UK -3,182 2,205 -1,443 19,584 0,0824 (1.725, - ) No
HC2: US < IL 0,102 1,302 0,078 24,279 0,4692 (1.711, - ) No
HC3: US < DK 4,840 0,887 5,455 35,109 0,0000 (1.684, - ) Yes
HC4: UK < IL 3,284 2,368 1,387 23,871 0,1086 (1.711, - ) No
HC5: UK < DK 8,022 2,168 3,700 18,156 0,0008 (1.734, - ) Yes
HC6: DK = IL -4,738 1,239 -3,825 18,291 0,0010 ( - , 1.734) ; (1.734, - ) Yes
73 | Page
Conclusion on Findings on Average Size of Investment: Growth Stage
The simple mean average shows a great variation between the means of the four different venture markets, within
the growth stage. Especially the Danish venture market has proven to invest smaller amounts within the growth
stage, which has proven to be on average half the size of the third largest market (in the peer group), Israel.
However, the VAR is extraordinarily high within the UK market, with a relatively small sample size. Also
statistically the Danish venture market within the startup stages has proven to invest smaller amounts than the US
and UK respectively. Whereas, the three other markets in-between has not proven to show any differences with
statistically differences.
6.1.4 Conclusion on Investment Strategy Above analysis shows that there is a simple average differences of the four venture capital markets. The UK market
has the higher mean, whereas the US has the lowest. However, even though there are simple differences within the
market, this paper has not been able to prove any statistical significant differences of any of the markets, which
were stated in the hypothesis section on the seed level.
In the startup stage the simple mean average shows a greater variation between the means of the four different
venture markets. The Danish venture market shows a very low mean on average size of investment within this
stage, which has been proven to invest half the size of the third largest market on average (in the peer group),
Israel. Also statistically the Danish venture market within the startup stages has been shown to invest smaller
amounts than the US, UK and Israeli respectively. Whereas, the three other markets in-between has proven that the
UK market is statistically higher than the IL, but not the US market.
Analyzing the growth stage within the four venture capital markets gives almost the same picture as the startup
stage. The variation in the simple means changes from case to case, and the Danish market has the smallest simple
mean average. Statistically both the IL and the US market are significantly larger than the Danish venture market in
the growth stage, whereas the UK market, given their high variation, is not possible to be proven to be significantly
larger than the Danish market.
6.2 Investment Risk Strategy: Risk Strategy The risk strategy of any VC firm varies from the industry, market, and stage in which they are targeting. In our
questionnaire we have tried to establish a common field of interest with VCs that are focused on technology
investment, however, some have also invested in traditional industry ventures in their history.
The risk strategy is an important area of interest, since innovation is strongly correlated and to some extent
dependent on high-risk investment in the venture capital industry. If investments are only made in secure business
models, VCs are not helping to spur innovation as discussed in section 5. of this thesis.
74 | Page
To identify differences and establish an overall picture of the chosen risk strategy of the VCs in the four peer group
markets, we have created five questions to support or reject the hypothesis established in section 5:
- % of Start-ups in Pre-revenue Phase at Time of Investment
- Me-too Ventures
- Risk Strategy
- Level of Risk
- Portfolio Structure (Percentage of Low, Medium and High Risk Business)
The paper will go through each hypothesis and discuss the meaning of the findings in the next couple of sections,
and give an overall conclusion on the risk strategy within each country.
6.2.1 Pre-Revenue Investments Pre-revenue investments are one of the most important aspects in helping ventures in their early days. Often
ventures need financing when developing and exploring their market potential within the first three years of their
market potential. Also, because of the current market condition, with difficult borrowing opportunities, VCs need
to invest in earlier stages, in order to create a well-functioning capital market for new ventures.
In section 5. the paper established the following hypothesis from interviews and macroeconomic analysis:
HD: “Percentage of Startups in Pre-revenue Phase (Had no Revenue) at Time of Investment”
- HD(US) > HD(IL) > HD(UK) = HD(DK)
Through interviews and macroeconomic analysis it was estimated that the VCs in the US would be the ones who
would invest the most in the pre-revenue stages, followed by Israel and additionally have the UK and DK at the
same investment level, due to their economic development and risk culture.
The hypothesis stating that the US and IL VCs would be the ones who would invest most in pre-revenue scale, is
more or less confirmed in Figure 1. Even though the Israelis invest more in pre-revenue ventures than the US the
difference is only around 3% points. Looking at the HD hypothesis that HD(UK) = HD(DK), this statement is far
from true. Every third investment the UK VCs make is in a pre-revenue venture, whereas it is only every second
one in Denmark.
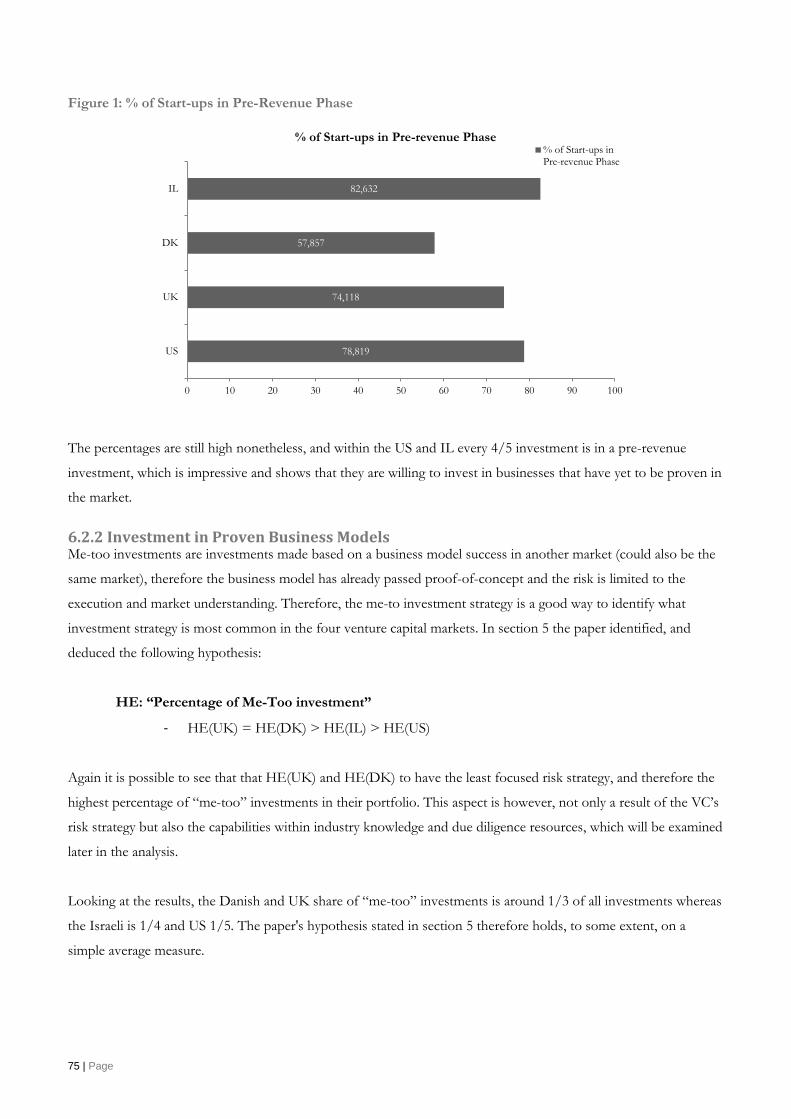
75 | Page
Figure 1: % of Start-ups in Pre-Revenue Phase
The percentages are still high nonetheless, and within the US and IL every 4/5 investment is in a pre-revenue
investment, which is impressive and shows that they are willing to invest in businesses that have yet to be proven in
the market.
6.2.2 Investment in Proven Business Models Me-too investments are investments made based on a business model success in another market (could also be the
same market), therefore the business model has already passed proof-of-concept and the risk is limited to the
execution and market understanding. Therefore, the me-to investment strategy is a good way to identify what
investment strategy is most common in the four venture capital markets. In section 5 the paper identified, and
deduced the following hypothesis:
HE: “Percentage of Me-Too investment”
- HE(UK) = HE(DK) > HE(IL) > HE(US)
Again it is possible to see that that HE(UK) and HE(DK) to have the least focused risk strategy, and therefore the
highest percentage of “me-too” investments in their portfolio. This aspect is however, not only a result of the VC’s
risk strategy but also the capabilities within industry knowledge and due diligence resources, which will be examined
later in the analysis.
Looking at the results, the Danish and UK share of “me-too” investments is around 1/3 of all investments whereas
the Israeli is 1/4 and US 1/5. The paper's hypothesis stated in section 5 therefore holds, to some extent, on a
simple average measure.
78,819
74,118
57,857
82,632
0 10 20 30 40 50 60 70 80 90 100
US
UK
DK
IL
% of Start-ups in Pre-revenue Phase% of Start-ups inPre-revenue Phase
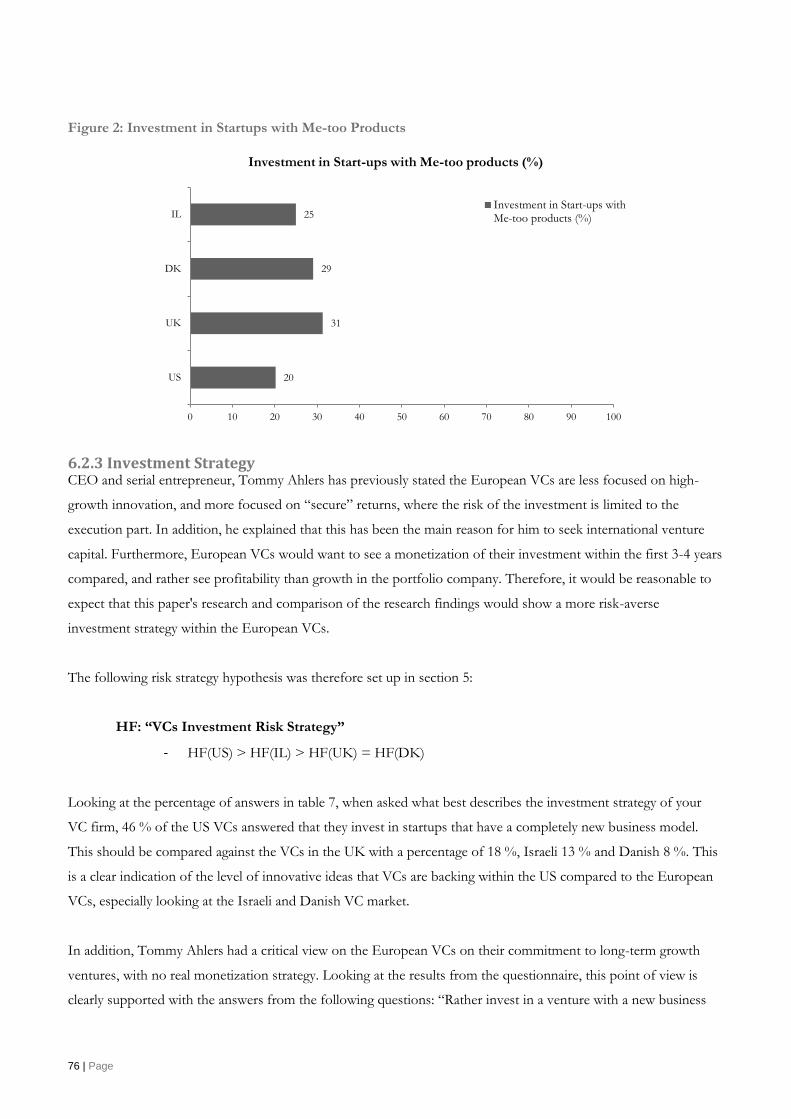
76 | Page
Figure 2: Investment in Startups with Me-too Products
6.2.3 Investment Strategy CEO and serial entrepreneur, Tommy Ahlers has previously stated the European VCs are less focused on high-
growth innovation, and more focused on “secure” returns, where the risk of the investment is limited to the
execution part. In addition, he explained that this has been the main reason for him to seek international venture
capital. Furthermore, European VCs would want to see a monetization of their investment within the first 3-4 years
compared, and rather see profitability than growth in the portfolio company. Therefore, it would be reasonable to
expect that this paper's research and comparison of the research findings would show a more risk-averse
investment strategy within the European VCs.
The following risk strategy hypothesis was therefore set up in section 5:
HF: “VCs Investment Risk Strategy”
- HF(US) > HF(IL) > HF(UK) = HF(DK)
Looking at the percentage of answers in table 7, when asked what best describes the investment strategy of your
VC firm, 46 % of the US VCs answered that they invest in startups that have a completely new business model.
This should be compared against the VCs in the UK with a percentage of 18 %, Israeli 13 % and Danish 8 %. This
is a clear indication of the level of innovative ideas that VCs are backing within the US compared to the European
VCs, especially looking at the Israeli and Danish VC market.
In addition, Tommy Ahlers had a critical view on the European VCs on their commitment to long-term growth
ventures, with no real monetization strategy. Looking at the results from the questionnaire, this point of view is
clearly supported with the answers from the following questions: “Rather invest in a venture with a new business
20
31
29
25
0 10 20 30 40 50 60 70 80 90 100
US
UK
DK
IL
Investment in Start-ups with Me-too products (%)
Investment in Start-ups withMe-too products (%)
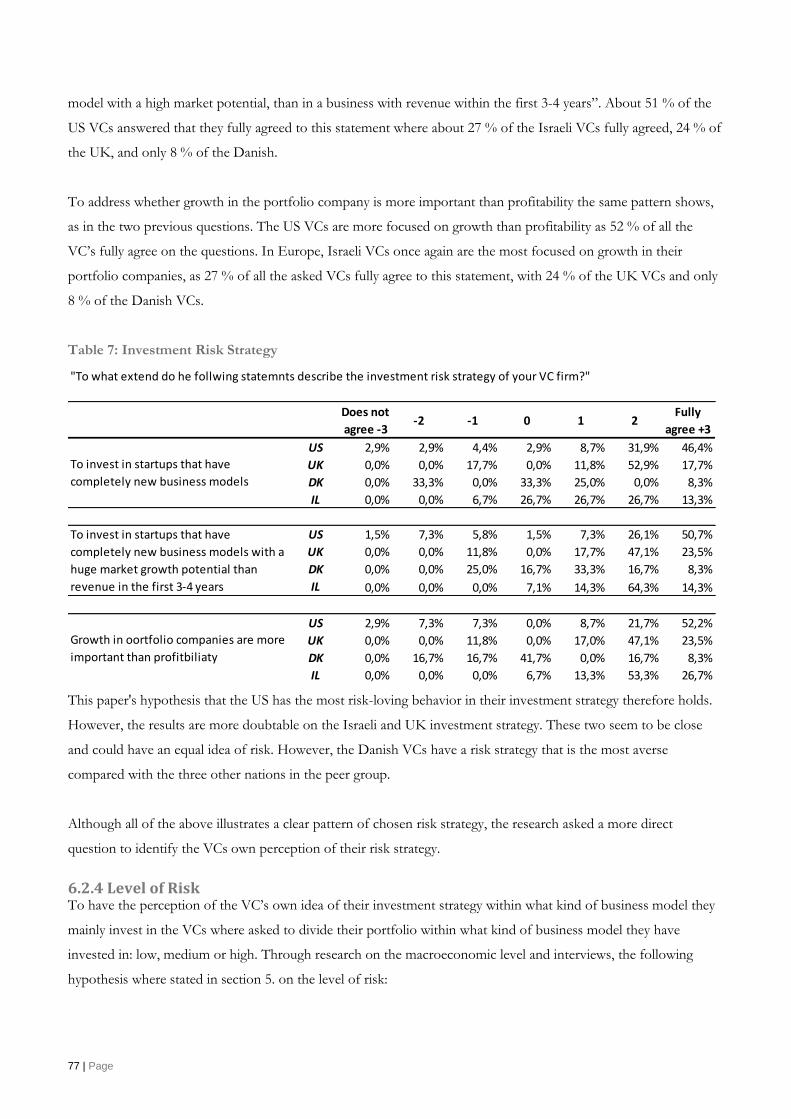
77 | Page
model with a high market potential, than in a business with revenue within the first 3-4 years”. About 51 % of the
US VCs answered that they fully agreed to this statement where about 27 % of the Israeli VCs fully agreed, 24 % of
the UK, and only 8 % of the Danish.
To address whether growth in the portfolio company is more important than profitability the same pattern shows,
as in the two previous questions. The US VCs are more focused on growth than profitability as 52 % of all the
VC’s fully agree on the questions. In Europe, Israeli VCs once again are the most focused on growth in their
portfolio companies, as 27 % of all the asked VCs fully agree to this statement, with 24 % of the UK VCs and only
8 % of the Danish VCs.
Table 7: Investment Risk Strategy
This paper's hypothesis that the US has the most risk-loving behavior in their investment strategy therefore holds.
However, the results are more doubtable on the Israeli and UK investment strategy. These two seem to be close
and could have an equal idea of risk. However, the Danish VCs have a risk strategy that is the most averse
compared with the three other nations in the peer group.
Although all of the above illustrates a clear pattern of chosen risk strategy, the research asked a more direct
question to identify the VCs own perception of their risk strategy.
6.2.4 Level of Risk To have the perception of the VC’s own idea of their investment strategy within what kind of business model they
mainly invest in the VCs where asked to divide their portfolio within what kind of business model they have
invested in: low, medium or high. Through research on the macroeconomic level and interviews, the following
hypothesis where stated in section 5. on the level of risk:
"To what extend do he follwing statemnts describe the investment risk strategy of your VC firm?"
Does not
agree -3-2 -1 0 1 2
Fully
agree +3
US 2,9% 2,9% 4,4% 2,9% 8,7% 31,9% 46,4%
UK 0,0% 0,0% 17,7% 0,0% 11,8% 52,9% 17,7%
DK 0,0% 33,3% 0,0% 33,3% 25,0% 0,0% 8,3%
IL 0,0% 0,0% 6,7% 26,7% 26,7% 26,7% 13,3%
US 1,5% 7,3% 5,8% 1,5% 7,3% 26,1% 50,7%
UK 0,0% 0,0% 11,8% 0,0% 17,7% 47,1% 23,5%
DK 0,0% 0,0% 25,0% 16,7% 33,3% 16,7% 8,3%
IL 0,0% 0,0% 0,0% 7,1% 14,3% 64,3% 14,3%
US 2,9% 7,3% 7,3% 0,0% 8,7% 21,7% 52,2%
UK 0,0% 0,0% 11,8% 0,0% 17,0% 47,1% 23,5%
DK 0,0% 16,7% 16,7% 41,7% 0,0% 16,7% 8,3%
IL 0,0% 0,0% 0,0% 6,7% 13,3% 53,3% 26,7%
To invest in startups that have
completely new business models
To invest in startups that have
completely new business models with a
huge market growth potential than
revenue in the first 3-4 years
Growth in oortfolio companies are more
important than profitbiliaty
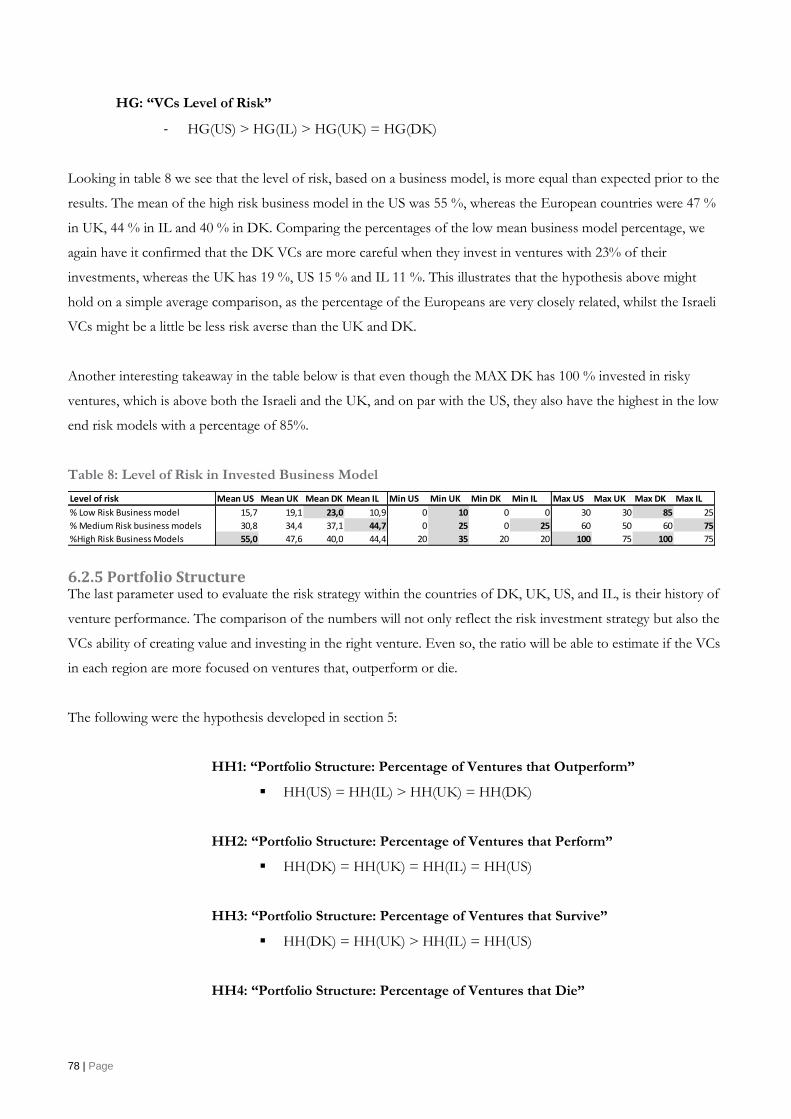
78 | Page
HG: “VCs Level of Risk”
- HG(US) > HG(IL) > HG(UK) = HG(DK)
Looking in table 8 we see that the level of risk, based on a business model, is more equal than expected prior to the
results. The mean of the high risk business model in the US was 55 %, whereas the European countries were 47 %
in UK, 44 % in IL and 40 % in DK. Comparing the percentages of the low mean business model percentage, we
again have it confirmed that the DK VCs are more careful when they invest in ventures with 23% of their
investments, whereas the UK has 19 %, US 15 % and IL 11 %. This illustrates that the hypothesis above might
hold on a simple average comparison, as the percentage of the Europeans are very closely related, whilst the Israeli
VCs might be a little be less risk averse than the UK and DK.
Another interesting takeaway in the table below is that even though the MAX DK has 100 % invested in risky
ventures, which is above both the Israeli and the UK, and on par with the US, they also have the highest in the low
end risk models with a percentage of 85%.
Table 8: Level of Risk in Invested Business Model
6.2.5 Portfolio Structure The last parameter used to evaluate the risk strategy within the countries of DK, UK, US, and IL, is their history of
venture performance. The comparison of the numbers will not only reflect the risk investment strategy but also the
VCs ability of creating value and investing in the right venture. Even so, the ratio will be able to estimate if the VCs
in each region are more focused on ventures that, outperform or die.
The following were the hypothesis developed in section 5:
HH1: “Portfolio Structure: Percentage of Ventures that Outperform”
HH(US) = HH(IL) > HH(UK) = HH(DK)
HH2: “Portfolio Structure: Percentage of Ventures that Perform”
HH(DK) = HH(UK) = HH(IL) = HH(US)
HH3: “Portfolio Structure: Percentage of Ventures that Survive”
HH(DK) = HH(UK) > HH(IL) = HH(US)
HH4: “Portfolio Structure: Percentage of Ventures that Die”
Level of risk Mean US Mean UK Mean DK Mean IL Min US Min UK Min DK Min IL Max US Max UK Max DK Max IL
% Low Risk Business model 15,7 19,1 23,0 10,9 0 10 0 0 30 30 85 25
% Medium Risk business models 30,8 34,4 37,1 44,7 0 25 0 25 60 50 60 75
%High Risk Business Models 55,0 47,6 40,0 44,4 20 35 20 20 100 75 100 75
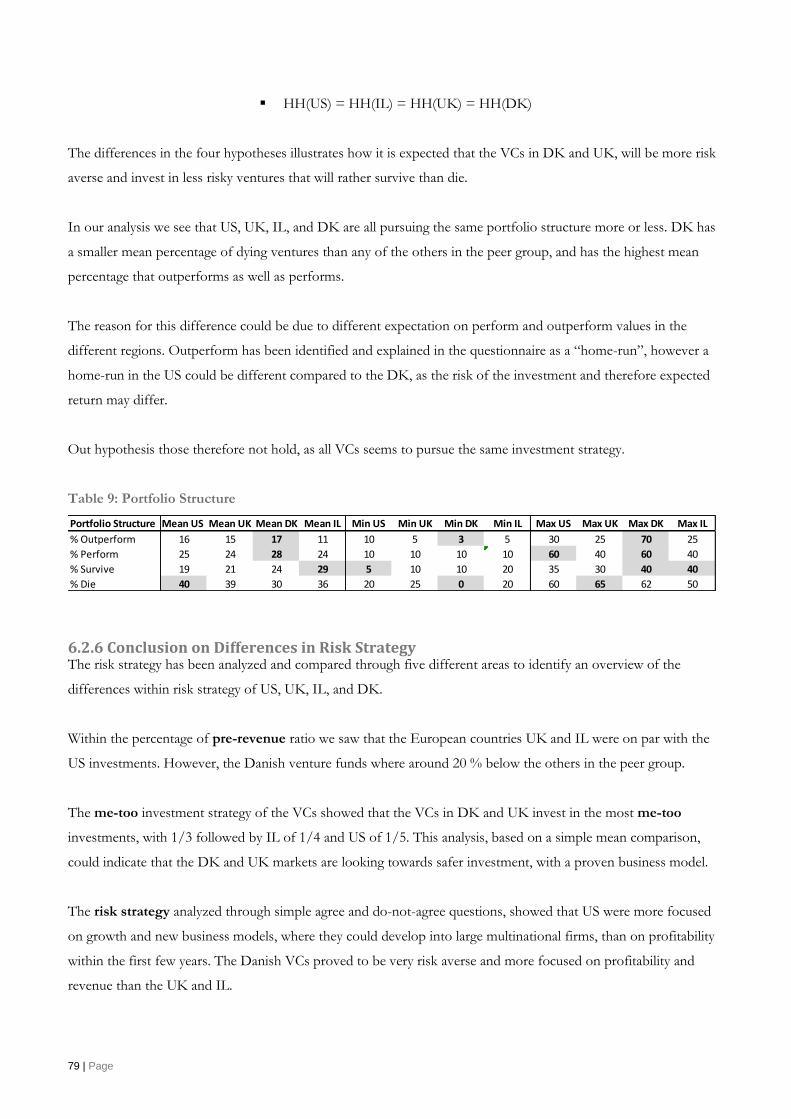
79 | Page
HH(US) = HH(IL) = HH(UK) = HH(DK)
The differences in the four hypotheses illustrates how it is expected that the VCs in DK and UK, will be more risk
averse and invest in less risky ventures that will rather survive than die.
In our analysis we see that US, UK, IL, and DK are all pursuing the same portfolio structure more or less. DK has
a smaller mean percentage of dying ventures than any of the others in the peer group, and has the highest mean
percentage that outperforms as well as performs.
The reason for this difference could be due to different expectation on perform and outperform values in the
different regions. Outperform has been identified and explained in the questionnaire as a “home-run”, however a
home-run in the US could be different compared to the DK, as the risk of the investment and therefore expected
return may differ.
Out hypothesis those therefore not hold, as all VCs seems to pursue the same investment strategy.
Table 9: Portfolio Structure
6.2.6 Conclusion on Differences in Risk Strategy The risk strategy has been analyzed and compared through five different areas to identify an overview of the
differences within risk strategy of US, UK, IL, and DK.
Within the percentage of pre-revenue ratio we saw that the European countries UK and IL were on par with the
US investments. However, the Danish venture funds where around 20 % below the others in the peer group.
The me-too investment strategy of the VCs showed that the VCs in DK and UK invest in the most me-too
investments, with 1/3 followed by IL of 1/4 and US of 1/5. This analysis, based on a simple mean comparison,
could indicate that the DK and UK markets are looking towards safer investment, with a proven business model.
The risk strategy analyzed through simple agree and do-not-agree questions, showed that US were more focused
on growth and new business models, where they could develop into large multinational firms, than on profitability
within the first few years. The Danish VCs proved to be very risk averse and more focused on profitability and
revenue than the UK and IL.
Portfolio Structure Mean US Mean UK Mean DK Mean IL Min US Min UK Min DK Min IL Max US Max UK Max DK Max IL
% Outperform 16 15 17 11 10 5 3 5 30 25 70 25
% Perform 25 24 28 24 10 10 10 10 60 40 60 40
% Survive 19 21 24 29 5 10 10 20 35 30 40 40
% Die 40 39 30 36 20 25 0 20 60 65 62 50
80 | Page
In regards to the pursued portfolio structure, the risk strategy painted a somewhat different picture than the risk
strategy in the four previous analyses. US, UK, IL, and DK were pursuing the same portfolio structure more or
less. DK has a smaller mean percentage of dying ventures than any of the three others in the peer group, and has
the highest mean percentage that outperform as well as perform.
US: Overall the risk strategy of the US VCs has proven to be more focused on helping in earlier stages and
to invest in new business models with high expected returns compared with the IL, US and DK risk
strategy
IL: The Israeli VCs are the most risky investment strategy of the other European peer group.
UK: The risk strategy of the UK VCs has a more risk averse investment strategy than the US and IL. Their
percentage on pre-revenue investment is lower than the US and IL, as their me-too investments is higher
than both of the above. Their pursued portfolio structure are overall the same as the US and IL.
DK: The Danish VCs are very risk-averse and is throughout the analysis showing the most risk-averse
behavior in the questionnaire.
6.3 Due Diligence: Limitation of Risk and Maturity of Market The analysis of the differences between how the VCs are performing their due diligences, is meant to illustrate how
mature and well documented the VC market is in each country in our peer group. If a due diligence is done right,
any VC should be able to limit the percentage of ventures that do not perform, thereby both improving the market
for the right firms and creating better returns to themselves.
To analyze the differences and the most common ways of doing a due diligence we have asked three questions in
the questionnaire regarding the areas:
- Management Team Due Diligence
- Product/Service Due Diligence
- Market Due Diligence
6.3.1 Replacement of CEO – Management Team An important factor of success is creating the right management team, so that the business case will be able to be
executed and developed in the right way and time. Founders are often good at one thing: founding – therefore a
change in management is sometimes important to create a successful start-up. In the hypotheses development the
following hypothesis was set up based on VC maturity, capital and entrepreneurial culture:
HI: “Percentage of Start-ups Not Managed by Founders but Experienced Managers (CEO)”
- HI(US) > HJ(UK) = HI(IL) = HI(DK)
Looking at the results in table 10 below it can be seen that the percentage of the experienced CEOs are around 50
% in the US whereas it is around 30 % in all three European countries.
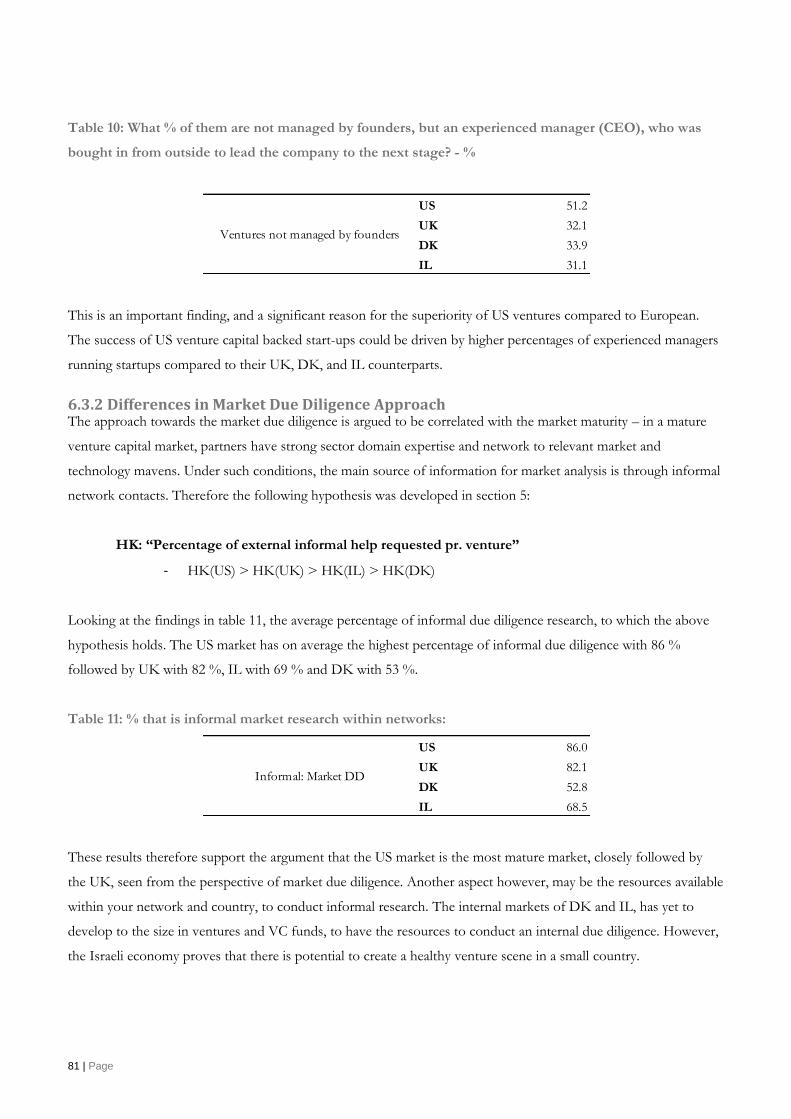
81 | Page
Table 10: What % of them are not managed by founders, but an experienced manager (CEO), who was
bought in from outside to lead the company to the next stage? - %
This is an important finding, and a significant reason for the superiority of US ventures compared to European.
The success of US venture capital backed start-ups could be driven by higher percentages of experienced managers
running startups compared to their UK, DK, and IL counterparts.
6.3.2 Differences in Market Due Diligence Approach The approach towards the market due diligence is argued to be correlated with the market maturity – in a mature
venture capital market, partners have strong sector domain expertise and network to relevant market and
technology mavens. Under such conditions, the main source of information for market analysis is through informal
network contacts. Therefore the following hypothesis was developed in section 5:
HK: “Percentage of external informal help requested pr. venture”
- HK(US) > HK(UK) > HK(IL) > HK(DK)
Looking at the findings in table 11, the average percentage of informal due diligence research, to which the above
hypothesis holds. The US market has on average the highest percentage of informal due diligence with 86 %
followed by UK with 82 %, IL with 69 % and DK with 53 %.
Table 11: % that is informal market research within networks:
These results therefore support the argument that the US market is the most mature market, closely followed by
the UK, seen from the perspective of market due diligence. Another aspect however, may be the resources available
within your network and country, to conduct informal research. The internal markets of DK and IL, has yet to
develop to the size in ventures and VC funds, to have the resources to conduct an internal due diligence. However,
the Israeli economy proves that there is potential to create a healthy venture scene in a small country.
US 51.2
UK 32.1
DK 33.9
IL 31.1
Ventures not managed by founders
US 86.0
UK 82.1
DK 52.8
IL 68.5
Informal: Market DD
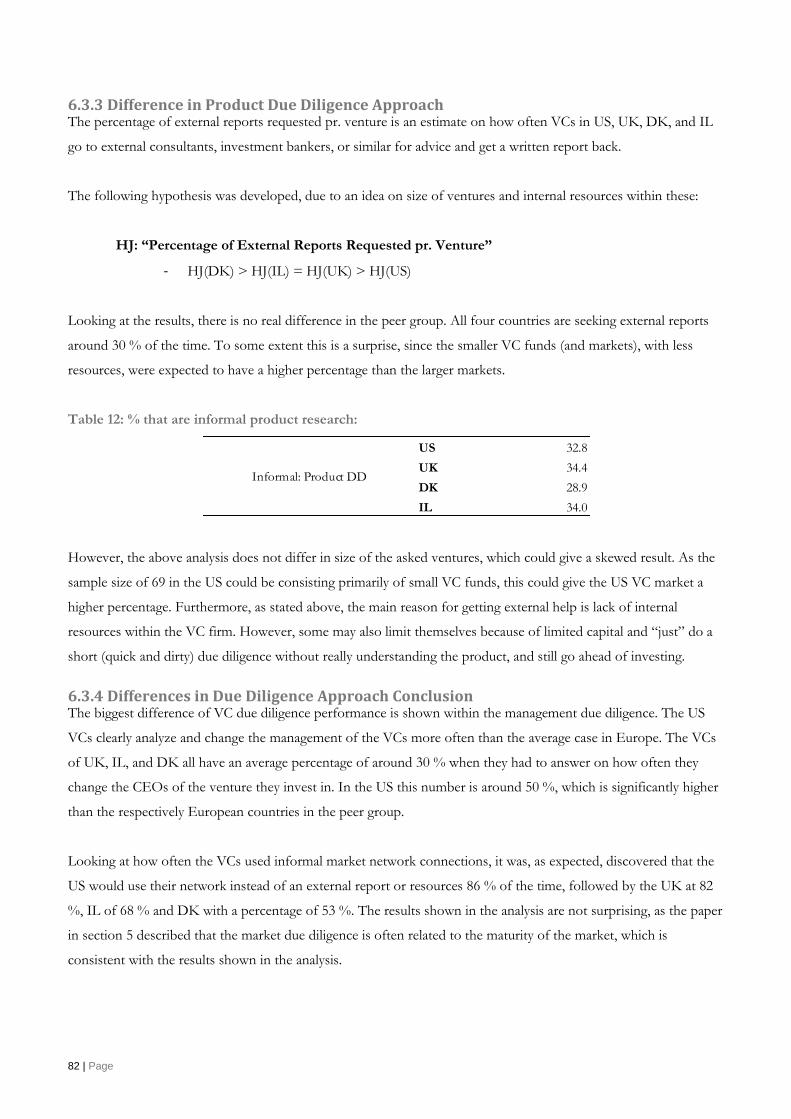
82 | Page
6.3.3 Difference in Product Due Diligence Approach The percentage of external reports requested pr. venture is an estimate on how often VCs in US, UK, DK, and IL
go to external consultants, investment bankers, or similar for advice and get a written report back.
The following hypothesis was developed, due to an idea on size of ventures and internal resources within these:
HJ: “Percentage of External Reports Requested pr. Venture”
- HJ(DK) > HJ(IL) = HJ(UK) > HJ(US)
Looking at the results, there is no real difference in the peer group. All four countries are seeking external reports
around 30 % of the time. To some extent this is a surprise, since the smaller VC funds (and markets), with less
resources, were expected to have a higher percentage than the larger markets.
Table 12: % that are informal product research:
However, the above analysis does not differ in size of the asked ventures, which could give a skewed result. As the
sample size of 69 in the US could be consisting primarily of small VC funds, this could give the US VC market a
higher percentage. Furthermore, as stated above, the main reason for getting external help is lack of internal
resources within the VC firm. However, some may also limit themselves because of limited capital and “just” do a
short (quick and dirty) due diligence without really understanding the product, and still go ahead of investing.
6.3.4 Differences in Due Diligence Approach Conclusion The biggest difference of VC due diligence performance is shown within the management due diligence. The US
VCs clearly analyze and change the management of the VCs more often than the average case in Europe. The VCs
of UK, IL, and DK all have an average percentage of around 30 % when they had to answer on how often they
change the CEOs of the venture they invest in. In the US this number is around 50 %, which is significantly higher
than the respectively European countries in the peer group.
Looking at how often the VCs used informal market network connections, it was, as expected, discovered that the
US would use their network instead of an external report or resources 86 % of the time, followed by the UK at 82
%, IL of 68 % and DK with a percentage of 53 %. The results shown in the analysis are not surprising, as the paper
in section 5 described that the market due diligence is often related to the maturity of the market, which is
consistent with the results shown in the analysis.
US 32.8
UK 34.4
DK 28.9
IL 34.0
Informal: Product DD

83 | Page
The product due diligence is however, not consistent with the aforementioned hypothesis in section 5. The report
expected a close correlation with size of VC firm and market and the use of external reports. This is however, not
the case and it is shown that all countries in the analyzed peer group use external consultants in their product due
diligence, on average 30 % of the time.
Figure 13: Due Diligence Overview
6.4 Management Phase: Value Adding Strategy One of the areas discussed and highlighted as one of the most important factors on how VCs can spur innovation,
is within the issue of value adding services. Venture Capital is seen as a financial input, however often they also
bring knowledge, network and experience to the table, which is often more valuable for the entrepreneurs than the
venture themselves.
Therefore it has been an important issue to analyze differences in value-adding services in different regions. This is
done through four hypotheses developed in section 5.:
- Partner Ratio
o Partner /Analyst
o Partner /Associate
- Number of Board Seats pr. Partner
- Time Used on Portfolio Companies
- Contact of Management of Portfolio Companies
33
34
29
34
86
82
53
68
51
32
34
31
,00 10,00 20,00 30,00 40,00 50,00 60,00 70,00 80,00 90,00 100,00
US
UK
DK
IL
US
UK
DK
IL
US
UK
DK
IL
Info
rmal:
Pro
du
ct
DD
Info
rmal:
Mark
et
DD
Ven
ture
s n
ot
man
ag
ed
by f
ou
nd
ers

84 | Page
All of the above are focused upon time and engagement of the VC on any specific portfolio firm – how much time
does each VC have for each portfolio firm, and especially partner engagement that can create value on the top
executive level.
6.4.1 Employee Mix The analysis offers an overview of the ratio within partners and respective analysts and associates. This shows how
many partners pr. analyst and associate VCs in different countries on average – the higher the value the better, as
partners will have more time to create value through their experience within the venture market.
The following hypotheses were made in section 5:
HL1(US) > HL1(UK) > HL1(IL) > HL1(DK)
Table 14: Employee Overview - Partner Ratio
Looking at the numbers in above table 14, it is clear that within the partners to analyst ratio, that the US has the
highest with a ratio of 0.7 partner pr. analyst, followed by IL with 0.5, UK 0.3 and DK did not have any analysts
employed. It is not surprising that the US has the highest ratio, as the VC industry is more mature and has
developed a private equity setup, with analysts in the bottom of the pyramid to take care of the analysis and the
primary screening sessions. However, it is to some surprise that the IL VCs have a higher ratio than the UK, since
we in our macroeconomic analysis stated that the maturity and size of the IL VCs were below the UK. In addition,
we see that out of the 9 answered questionnaires from Danish VCs, none have analysts employed. This confirms
the paper's preconditioned view on the maturity of the Danish venture capital market.
6.4.2 Number of board seats per partner The research questionnaire estimates how many board seats each partner has. Partners are good to have in boards,
however if each partner has +10 companies to administrate the value of the time in the boards is being diluted,
therefore the following hypothesis from previous discussion in section 5 has been made:
HL2(DK) = HL2(IL) > HL2(UK) > HL2(US)
However, looking below at results and comparing the mean of the peer group, it is obvious that the above
hypothesis does not hold. The IL and US VCs have the highest board seats pr. partner respectively with 5.7 and
5.1, whereas the UK and DK has an average of 4.4 and 4.3 board seats per. partner. The differences in the VCs in
VC Employee overview Mean US Mean UK Mean IL Mean DK
Ratio of Partners to Analysts 0.7 0.3 0.5 N/A
Ratio of Partners to Associates 0.6 0.6 0.8 0.4
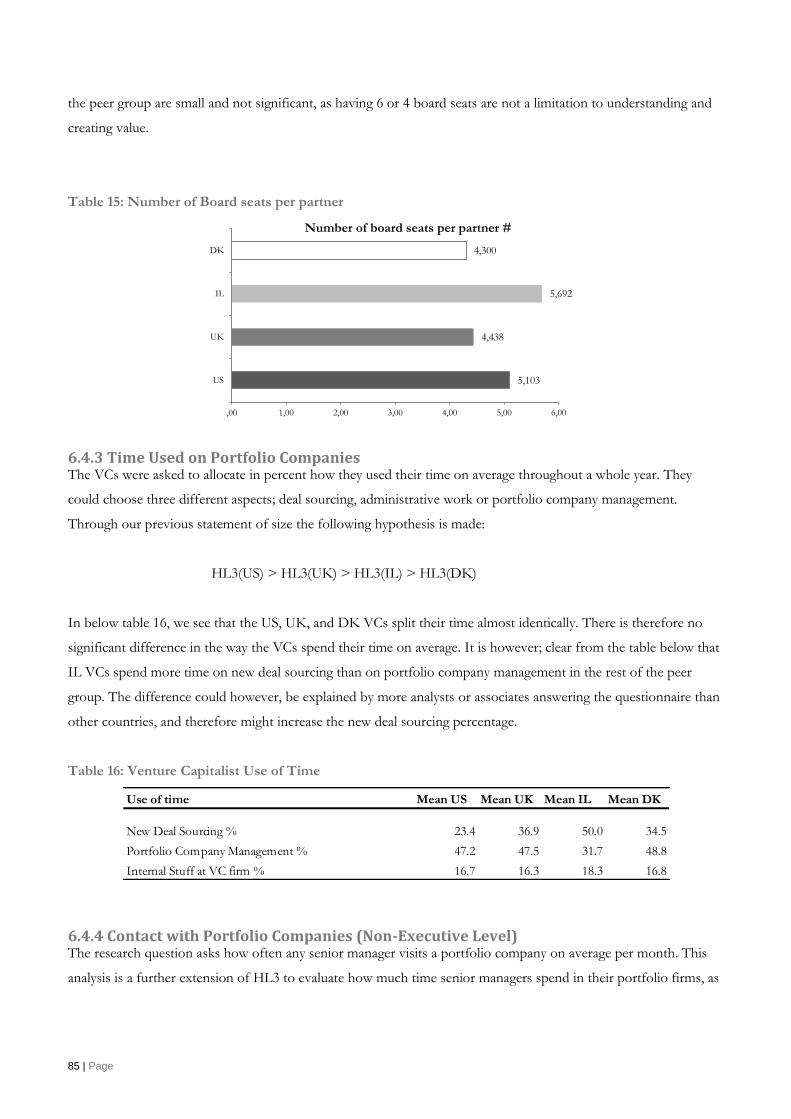
85 | Page
the peer group are small and not significant, as having 6 or 4 board seats are not a limitation to understanding and
creating value.
Table 15: Number of Board seats per partner
6.4.3 Time Used on Portfolio Companies The VCs were asked to allocate in percent how they used their time on average throughout a whole year. They
could choose three different aspects; deal sourcing, administrative work or portfolio company management.
Through our previous statement of size the following hypothesis is made:
HL3(US) > HL3(UK) > HL3(IL) > HL3(DK)
In below table 16, we see that the US, UK, and DK VCs split their time almost identically. There is therefore no
significant difference in the way the VCs spend their time on average. It is however; clear from the table below that
IL VCs spend more time on new deal sourcing than on portfolio company management in the rest of the peer
group. The difference could however, be explained by more analysts or associates answering the questionnaire than
other countries, and therefore might increase the new deal sourcing percentage.
Table 16: Venture Capitalist Use of Time
6.4.4 Contact with Portfolio Companies (Non-Executive Level) The research question asks how often any senior manager visits a portfolio company on average per month. This
analysis is a further extension of HL3 to evaluate how much time senior managers spend in their portfolio firms, as
5,103
4,438
5,692
4,300
,00 1,00 2,00 3,00 4,00 5,00 6,00
US
UK
IL
DK
Number of board seats per partner #
Use of time Mean US Mean UK Mean IL Mean DK
New Deal Sourcing % 23.4 36.9 50.0 34.5
Portfolio Company Management % 47.2 47.5 31.7 48.8
Internal Stuff at VC firm % 16.7 16.3 18.3 16.8
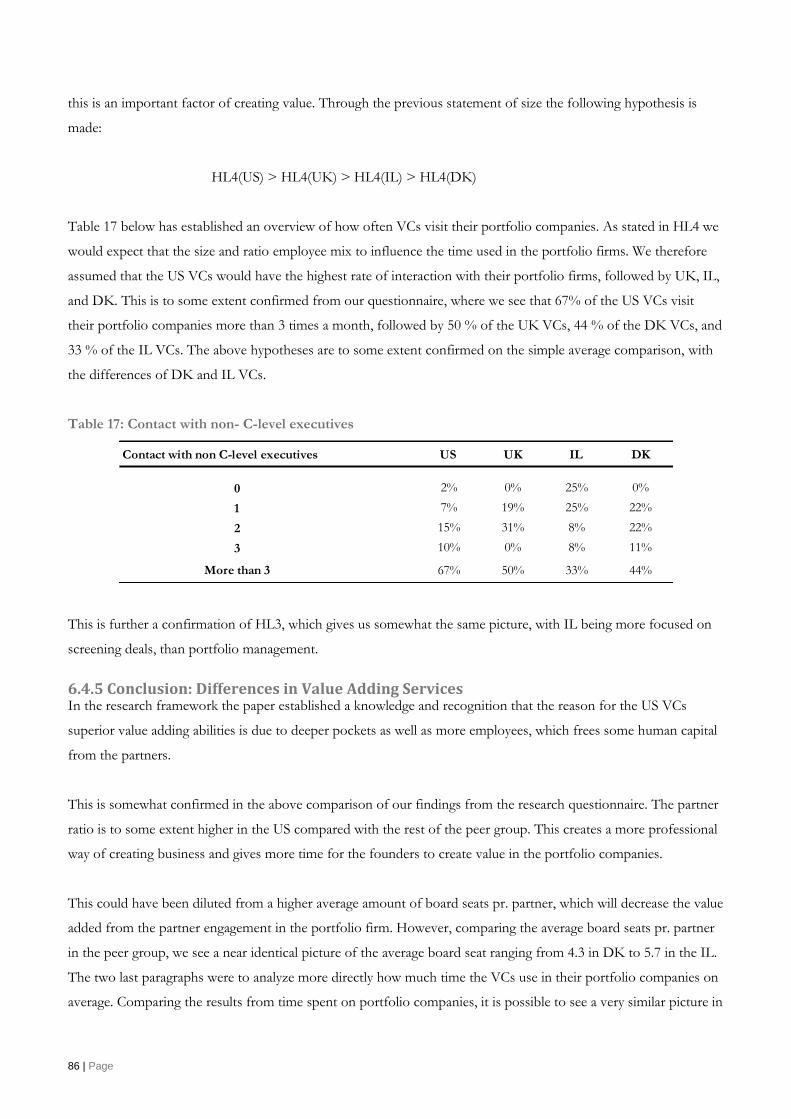
86 | Page
this is an important factor of creating value. Through the previous statement of size the following hypothesis is
made:
HL4(US) > HL4(UK) > HL4(IL) > HL4(DK)
Table 17 below has established an overview of how often VCs visit their portfolio companies. As stated in HL4 we
would expect that the size and ratio employee mix to influence the time used in the portfolio firms. We therefore
assumed that the US VCs would have the highest rate of interaction with their portfolio firms, followed by UK, IL,
and DK. This is to some extent confirmed from our questionnaire, where we see that 67% of the US VCs visit
their portfolio companies more than 3 times a month, followed by 50 % of the UK VCs, 44 % of the DK VCs, and
33 % of the IL VCs. The above hypotheses are to some extent confirmed on the simple average comparison, with
the differences of DK and IL VCs.
Table 17: Contact with non- C-level executives
This is further a confirmation of HL3, which gives us somewhat the same picture, with IL being more focused on
screening deals, than portfolio management.
6.4.5 Conclusion: Differences in Value Adding Services In the research framework the paper established a knowledge and recognition that the reason for the US VCs
superior value adding abilities is due to deeper pockets as well as more employees, which frees some human capital
from the partners.
This is somewhat confirmed in the above comparison of our findings from the research questionnaire. The partner
ratio is to some extent higher in the US compared with the rest of the peer group. This creates a more professional
way of creating business and gives more time for the founders to create value in the portfolio companies.
This could have been diluted from a higher average amount of board seats pr. partner, which will decrease the value
added from the partner engagement in the portfolio firm. However, comparing the average board seats pr. partner
in the peer group, we see a near identical picture of the average board seat ranging from 4.3 in DK to 5.7 in the IL.
The two last paragraphs were to analyze more directly how much time the VCs use in their portfolio companies on
average. Comparing the results from time spent on portfolio companies, it is possible to see a very similar picture in
Contact with non C-level executives US UK IL DK
0 2% 0% 25% 0%
1 7% 19% 25% 22%
2 15% 31% 8% 22%
3 10% 0% 8% 11%
More than 3 67% 50% 33% 44%
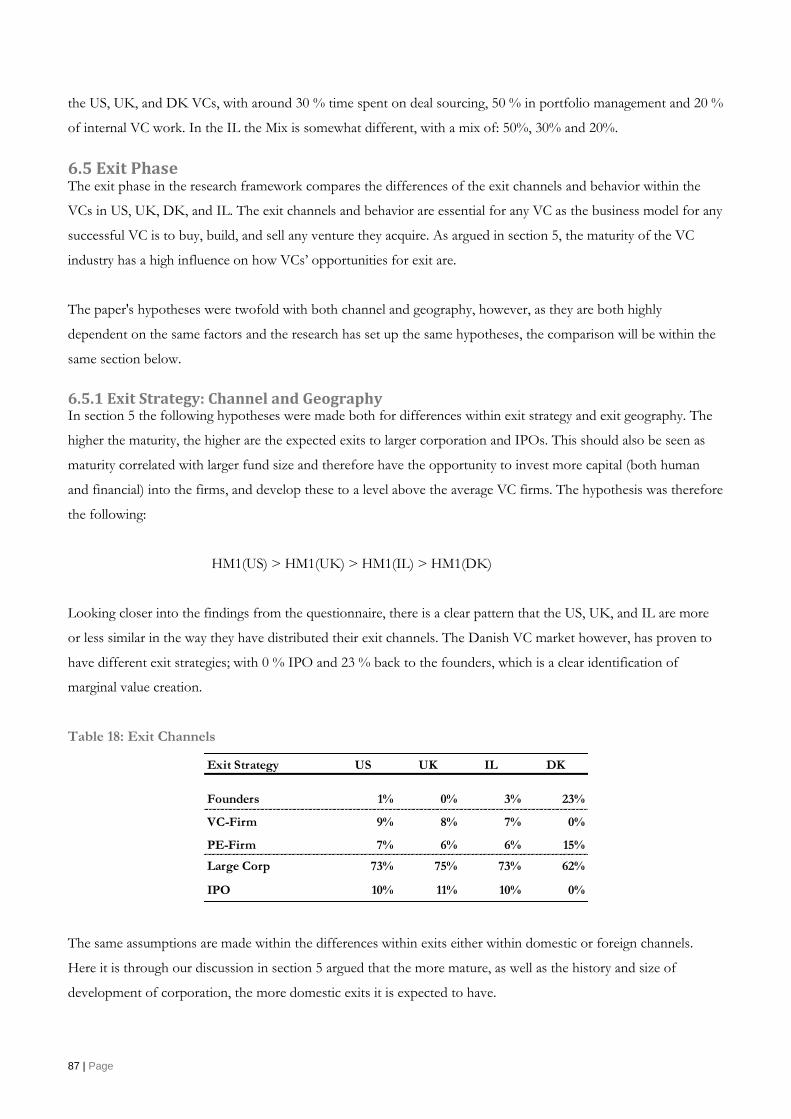
87 | Page
the US, UK, and DK VCs, with around 30 % time spent on deal sourcing, 50 % in portfolio management and 20 %
of internal VC work. In the IL the Mix is somewhat different, with a mix of: 50%, 30% and 20%.
6.5 Exit Phase The exit phase in the research framework compares the differences of the exit channels and behavior within the
VCs in US, UK, DK, and IL. The exit channels and behavior are essential for any VC as the business model for any
successful VC is to buy, build, and sell any venture they acquire. As argued in section 5, the maturity of the VC
industry has a high influence on how VCs’ opportunities for exit are.
The paper's hypotheses were twofold with both channel and geography, however, as they are both highly
dependent on the same factors and the research has set up the same hypotheses, the comparison will be within the
same section below.
6.5.1 Exit Strategy: Channel and Geography In section 5 the following hypotheses were made both for differences within exit strategy and exit geography. The
higher the maturity, the higher are the expected exits to larger corporation and IPOs. This should also be seen as
maturity correlated with larger fund size and therefore have the opportunity to invest more capital (both human
and financial) into the firms, and develop these to a level above the average VC firms. The hypothesis was therefore
the following:
HM1(US) > HM1(UK) > HM1(IL) > HM1(DK)
Looking closer into the findings from the questionnaire, there is a clear pattern that the US, UK, and IL are more
or less similar in the way they have distributed their exit channels. The Danish VC market however, has proven to
have different exit strategies; with 0 % IPO and 23 % back to the founders, which is a clear identification of
marginal value creation.
Table 18: Exit Channels
The same assumptions are made within the differences within exits either within domestic or foreign channels.
Here it is through our discussion in section 5 argued that the more mature, as well as the history and size of
development of corporation, the more domestic exits it is expected to have.
Exit Strategy US UK IL DK
Founders 1% 0% 3% 23%
VC-Firm 9% 8% 7% 0%
PE-Firm 7% 6% 6% 15%
Large Corp 73% 75% 73% 62%
IPO 10% 11% 10% 0%
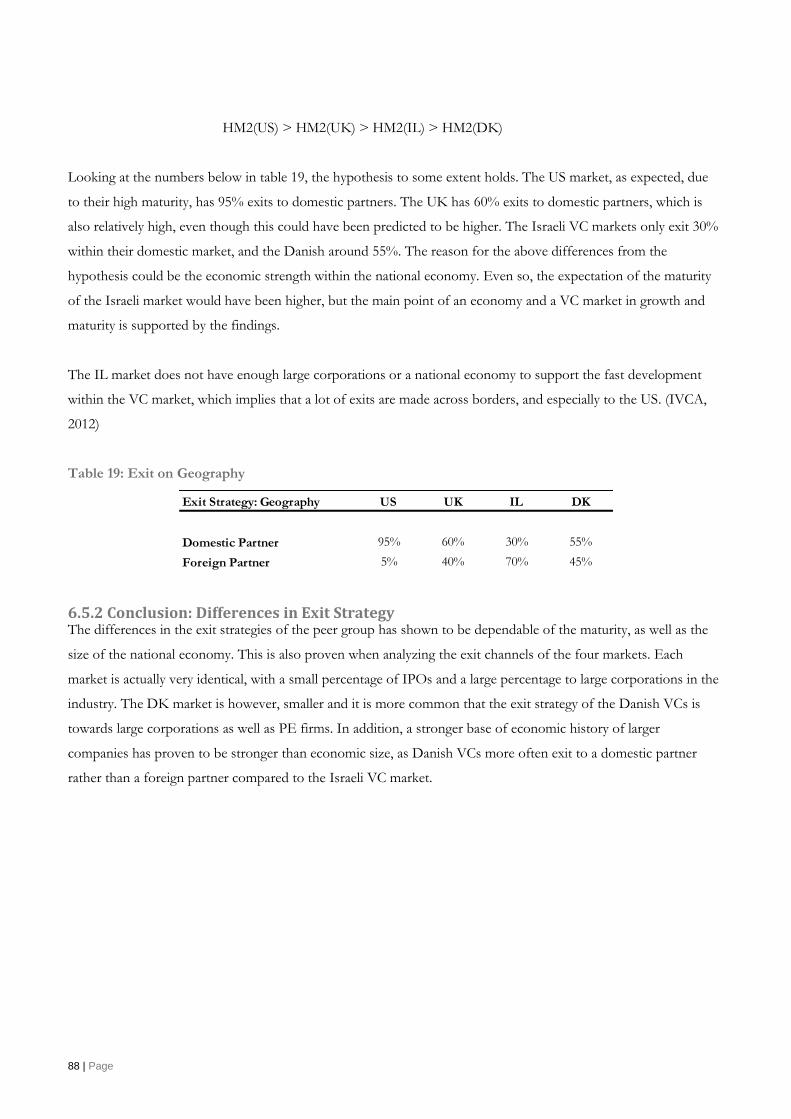
88 | Page
HM2(US) > HM2(UK) > HM2(IL) > HM2(DK)
Looking at the numbers below in table 19, the hypothesis to some extent holds. The US market, as expected, due
to their high maturity, has 95% exits to domestic partners. The UK has 60% exits to domestic partners, which is
also relatively high, even though this could have been predicted to be higher. The Israeli VC markets only exit 30%
within their domestic market, and the Danish around 55%. The reason for the above differences from the
hypothesis could be the economic strength within the national economy. Even so, the expectation of the maturity
of the Israeli market would have been higher, but the main point of an economy and a VC market in growth and
maturity is supported by the findings.
The IL market does not have enough large corporations or a national economy to support the fast development
within the VC market, which implies that a lot of exits are made across borders, and especially to the US. (IVCA,
2012)
Table 19: Exit on Geography
6.5.2 Conclusion: Differences in Exit Strategy The differences in the exit strategies of the peer group has shown to be dependable of the maturity, as well as the
size of the national economy. This is also proven when analyzing the exit channels of the four markets. Each
market is actually very identical, with a small percentage of IPOs and a large percentage to large corporations in the
industry. The DK market is however, smaller and it is more common that the exit strategy of the Danish VCs is
towards large corporations as well as PE firms. In addition, a stronger base of economic history of larger
companies has proven to be stronger than economic size, as Danish VCs more often exit to a domestic partner
rather than a foreign partner compared to the Israeli VC market.
Exit Strategy: Geography US UK IL DK
Domestic Partner 95% 60% 30% 55%
Foreign Partner 5% 40% 70% 45%
89 | Page
7. Discussion of the analysis and the impact on the impact on the innovation This section is set up to discuss the findings in section 6, with the purpose establishing a connection between the
found results and the level of innovation in the given economy on a micro-economic level. This will gives us an
insight into the most important differences and a fundament for further recommendation for both policy makers as
well as give venture capitalist a look at what can be done to spur the innovation. When this is said, it is important to
acknowledge that Venture Capitalist are business, and their main job is not to create and spur innovation, but help
them create better ventures. Therefore this discussion is twofold; with the main focus on how Venture Capitalist
can create sustainable innovation, as we also found in was the main purpose of VCs, in section 3.
The section is divided up into 4 areas, with a short discussion in each section of what the results in the previous
section means for both spurring and creating sustainable innovation. The first area of Investment & Risk strategy,
combined with the Due Diligence section, is to analyze the differences and the ability to spur innovation. The
second section is about value creation, and creating better and more sustainable innovation, with the two sections
of Management Phase as well as the Exit phase.
7.1. Investment Strategy, Risk Strategy, Due Diligence & Exit Phase (Spurring Innovation) As stated in section 3, it is important to have a well-functioning capital market, both in the seed, startup and growth
market, to increase the liquidity of the ventures, and help them through the critical stages. The analysis shows that
there are small differences in every single stage, and especially the DK venture capital market, which has a smaller
average amount invested per venture. Throughout the analysis, the Danish Venture Capital industry shows a more
risk adverse approach towards investing in ventures.
Overall the markets seems to act more or less as expected, however the Danish Venture Capitalists asked in the
survey, seems to be mature and hold back on their money both in the terms of average investment per venture, as
well as investment in new business models, and pre-revenue ventures. This approach could influence the way
Venture Capitalist could spur innovation as discussed in section 3, and could be something that could limit the
ability of creating big and successful enterprises.
Looking deeper into the numbers, it seems like radical and complete new business model innovation are hard to
establish in the European and especially the Danish market from the analysis in section 5. Looking at the
percentage of me-too investments, it is clear that the DK and UK venture capitalist are looking for more safe bets,
than the IL and US venture capitalists, which clearly limits the real innovation in the more risk-adverse countries.
The amount of money invested in “Safe-Ventures”, however does not limit the opportunity of creating value to the
economy, and furthermore the development of a “Safe-venture” could along the life-cycle, creates new products
and innovate its business model. Therefore investment in less risky ventures, as especially the DK venture capitalist
have done, could in the future create radical and new innovative products. However, the venture capitalist of the
European markets tends to look at getting a return rather than creating the next Facebook or Google.
90 | Page
One of the reasons for the less risky approach in the European VC markets, and especially the Danish Venture
Capitalists, could be due to the limitation of available cash and inadequate exit opportunities. Looking at the
differences shown in the analysis it is clear that the exit channels of the other markets are more diversified than the
Danish venture capital market. Also the ability of exiting through an IPO could indicate that the other markets
have more capital to re-invest, and keep the venture longer.
In addition, the paper does not discuss the influence of the business angels in the four markets, which could
influence the above discussion. For example, the US market could have in most recent years transferred upward in
the investment-stage, which is also backed with our analysis of more and more IPOs, and therefore the business
angels network are the once in many cases to facilitate the first investments.
The discussion is however relevant. The analysis in section shows that there are significant differences in the way
the US and European venture capitalist invest, in terms of risk and investment size. You could therefore argue,
from the view of (Murray, 1999), that the US venture capitalists spur innovation to a further extent than the
European peers. Especially in comparison to the DK venture capitalist, who typically is not looking into new
investment areas, and therefore limits the national potential in their market of innovation.
7.2. Management Phase (Creating Sustainable Innovation) In section 3 it is concluded that the real value venture capital can create in regards to the innovation aspect, is
through value adding service in the management phase. As highlighted in section 2 and section 3, VCs can, through
their extensive experience and network and involvement with several ventures, have the opportunity to help new
ventures over several obstacles in their early life. Because these many theories also validate the notion that venture
capital creates better innovation on average than innovation that is not venture backed. In addition, in the research
framework established a knowledge and recognition that the reason for the US VCs superior value adding abilities,
were due to deeper pockets as well as more employees, which could free some human capital of the partners.
Looking at the analysis result this is somewhat confirmed in the analysis, in section 5 on the “Partner Ratio”, where
the American venture capitalist have more employees around them. However, looking at the three other analyses,
“Number of Board Seats per Partner”, “Time Used on Portfolio Companies” and “Amount of Contact with
Management Level of Portfolio Firm”, the differences are not significant.
Even though, the American VCs on average create more value in their portfolio firm this is not due to more time
used on each portfolio venture, nor the amount of contact with the portfolio company, compared to the peer
group. The European markets therefore seem to have the same amount of “internal” value adding services, and the
right fundament.
There are however, two areas in which this report sees its limitations, which could explain the differences of the
different venture industries. The seniority and number of investments, which could give an idea of each partners
91 | Page
experience within the industry, and their network reach. Network is, as stated in section 2 and 3, very important
and one of the most value-adding abilities of the VCs, as this would be able to create new customers and partners.
Through the previous research and analysis, it is therefore difficult to establish a concluding remark on the
different approach each venture capitalist have in the peer group – and what is the best way to create the most
sustainable innovation. Through this paper's analysis the similarities’ are strong and the approach seems to be
uniform. Therefore, there are possibly other areas in which venture capitalist creates value, which are not analyzed
in this thesis.
7.3. Concluding remarks on innovation differences Overall the research shows that the differences found between the four venture capital markets have limited
influence on the overall value adding services, and therefore there is no evidence that the way the US ventures are
more value adding and should be copied into the European ventures way of doing business. There are however,
significant differences in the way VCs invest in the four markets, and especially the DK market, which seems more
risk averse than the US, IL and UK venture markets. This could limit the innovative ideas and the development of
healthy ventures, and therefore create a less attractive ecosystem for entrepreneurs.

92 | Page
8. Conclusion This section concludes the study by summarizing the main results as well as proposing new avenues for further
research and discusses the limitations of the thesis.
8.1. Summary of the Results
This thesis examined the differences between the way venture capitalist in Israel, United Kingdom, Denmark and
the United States act in the process of their investment decision, and see if these differences could explain why
innovation is seen as more advanced in the US. The thesis utilized an empirical background on the venture capital
industry, as well as how venture capital can spur and create sustainable innovation. Through a literature review, the
thesis established a clear recognition that Venture Capital can spur sustainable innovation, while there seems to be
limited recognition that venture capital can create and develop innovation itself. In addition, two different studies
have been utilized in order to be able to answer the stated research questions. These studies supported each other
and together offered a wide and versatile view of the differences in the way the country specific venture capitalists
act. The studies examined the differences of venture capital investment strategy, risk strategy, due diligence,
management phase and the exit phase, with the intent to analysis and highlight the differences between the four
venture capital markets.
The qualitative study indicated that the differences in the characteristics and modes of operation between European
and American venture capital companies were different in the way of investment. The general perception indicated
that the American venture capital industry is more mature than that of the European peers. In general the
American venture capital funds seem to utilize more external advisory boards and have closer relationships with big
corporations. American VCs also get access to a larger deal flow due to the larger markets. This gives them a better
knowledge and deeper insight into their portfolio companies, and therefore can help and create more value in the
management phase. The qualitative study where based upon interviews with venture capitalist, business angels and
entrepreneurs, and their knowledge and opinions were used to set up the quantitative study hypotheses.
The quantitative study shows that there are significant differences in the way the US and European venture
capitalist invest, in terms of risk and investment size. This difference is especially seen within investment in the
later stages where especially the Danish venture capitalist invests significantly smaller amounts into their ventures.
In the research framework, the paper established an understanding and recognition from preliminary interviews,
that the reason for the US VCs superior value adding abilities is due to deeper pockets as well as more employees,
which enables more resources, both in terms of human capital as well as capital in general, and therefore a better
environment for the firm to grow.
The difference in the risk strategies of venture capital in each country was examined within four different areas,
pre-revenue and me-too investment, as well as the venture capital's overall portfolio structure and risk strategy.
Overall we found that the main risk strategy of the US venture capitalists has proven to be more focused on
helping in earlier stages and to invest in new business models with high expected returns compared with the IL, US
93 | Page
and DK risk strategy. Comparing the three European VC markets, the Israeli venture capitalists have the most risky
investment strategy of the European peer group, while the risk strategy of the UK VCs was more risk averse than
the US and IL. The Danish venture capitalists are very risk-averse and are throughout the analysis shown to have
the most risk-averse behavior in the questionnaire.
The biggest difference of the venture capitalists within the due diligence performance is shown within the
management due diligence. The US venture capitalists analyze and change the management of the VCs more often
than the average case in Europe. Looking at how often the VCs used informal market network connections, it was,
as expected, discovered that the US would use their network instead of an external report or resources 86 % of the
time, followed by the UK at 82 %, IL of 68 % and DK with a percentage of 53 %. This result could be related to
the maturity of the venture capital market, which is consistent with the results shown in the national innovation
system analysis where the US market is seen as the most mature and established venture capital market.
In the research framework the paper established a knowledge and recognition that the reason for the US VCs
superior value adding abilities is due to deeper pockets as well as more employees, which frees some human capital
from the partners. This is somewhat confirmed in the above comparison of our findings from the research
questionnaire. The partner ratio is to some extent higher in the US compared with the rest of the peer group. This
creates a more professional way of creating business and gives more time for the founders to create value in the
portfolio companies. This could have been diluted from a higher average amount of board seats pr. partner, which
will decrease the value added from the partner engagement in the portfolio firm. However, comparing the average
board seats pr. partner in the peer group, we see a near identical picture of the average board seat ranging from 4.3
in DK to 5.7 in the IL.
The paper did however, not find any significant differences in the value adding approach throughout the peer
group. The thesis tests the differences in the “Number of Board Seats per Partner”, “Time Used on Portfolio
Companies” and “Amount of Contact with Management Level of Portfolio Firm”, and here there are not any
significant differences. This is furthermore confirmed when we analyze the time the venture capitalists spend in
their portfolio companies on average. Comparing the results between time spent on portfolio companies, it is
possible to see a very similar picture in the US, UK, and DK VCs, with around 30 % time spent on deal sourcing,
50% in portfolio management and 20% of internal VC work. Whereas the IL venture capitalists have a somewhat
different approach with a higher focus on deal sourcing, than portfolio management.
The differences in the exit strategies of the peer group has shown to be dependable on the maturity, as well as the
size of the national economy. This is also proven when analyzing the exit channels of the four markets. Each
market is actually very identical, with a small percentage of IPOs and a large percentage to large corporations in the
industry. The DK market is however, smaller and it is more common that the exit strategy of the Danish VCs is
towards large corporations as well as PE firms. In addition, a stronger base of economic history of larger
94 | Page
companies has proven to be stronger than economic size, as Danish VCs more often exit to a domestic partner
rather than a foreign partner compared to the Israeli VC market. This could however, also be influenced by the exit
channels, as easier domestic exit channels could make and easier exit for many venture capitalist and therefore
increase the willingness to invest due to less risk of “write-off” of their investments.
8.2. Concluding remarks: Implication of the differences and their impact on sustainable
innovation
Even though, the American VCs on average create more value in their portfolio firm this is not due to more time
used on each portfolio venture, nor the amount of contact with the portfolio company compared to the peer
group. The European markets therefore seem to have the same amount of “internal” value adding services, and the
right fundament.
Through the previous research and analysis, it is difficult to establish a concluding remark on the different
approaches each venture capitalist have in the peer group – and what the best way is to create the most sustainable
innovation. Through this paper's analysis the similarities’ are strong and the approach seems to be uniform, which
could indicate that other factors could influence the effect of innovation than how venture capital firm invest.
Overall the research shows that the differences found between the four venture capital markets have limited
influence on the overall value adding services, and therefore there is no evidence that the way the US ventures are
more value adding and should be copied into the European ventures way of doing business. There are however,
significant differences in the way VCs invest in the four markets, and especially the DK market, which seems more
risk averse than the US, IL and UK venture markets. This could limit the innovative ideas and the development of
healthy ventures, and therefore create a less attractive ecosystem for entrepreneurs. In addition, the larger average
investment size in the later stages could indicate that, those in the US venture capital market are willing to invest
and help their ventures in a longer period, which could also be seen as value adding and creating more sustainable
ventures for the economy. Even so, the differences do not interchangeably argue that the US venture capital
industry creates more value adding throughout the lifecycle of the ventures, and there are not clear identification of
these differences.
8.2. Limitation and critique This thesis has tried to illustrate the cross-country differences in how venture capitalist invest and create value in
their portfolio companies. In addition, the thesis has tried to connect the differences to the overall innovative
environment in the country. This has been done through a qualitative as well as quantitative method, and previous
data. Even though this thesis has offered some interesting discussions and implications of how to create a better
environment there are some limitation and critique points of the paper.
95 | Page
Data
- The data points from the American venture market are three times bigger than the other countries, where
we on average have 60. Especially when looking at the Danish data points, where we on average have
around 10 data points, outliers can influence the analysis massively. Some of the conclusions might
therefore not be 100% accurate in replication, but only be used as guidance for further research and
hypothesis development. In addition, the data points of the UK and US market where conducted from a
preliminary study in 2009. These data points might be different if analyzed in 2012.
- Regional assumptions and advantages
The thesis develops the analysis on an assumption that all VCs in the given country acts the same way, and
therefore we do not acknowledge regional differences and clusters. Many studies contradicts this
assumption, with a focus on regional and cluster advantages, even stating that these have more importance
than other factors, such as capital e.g. (Kinnear, Charters, & Vitartas, 2013). This assumption is therefore
very drastic, especially comparing the US market in a whole.
- Entrepreneurs perspective in a more qualitative way
This thesis focuses on the differences of venture capital financing, and attempts to illustrate where the
main differences within the Venture Capital investment cycles are. However, in section 3 we identify that
the venture capitalists do not create more innovation, but only a better environment for sustainable
innovation. With this in mind it could have been interesting connecting the entrepreneurs point of view on
how to create a better environment and how they see the VC markets in the 4 four countries.
- Variables chosen
The variables chosen for this study are based on previous research, it may however be time to conduct
more studies on the micro-level to discover which activities are truly value-adding and important for
venture firms and focus future comparative research more in detail on these critical value adding areas.
Obviously all activities are not equally important and a venture capitalist helping out a portfolio firm with a
market analysis as a one-time event is not as important as providing an optimal funding regime across the
lifecycle of the venture, for example. Factors such as this may be forgone, when using an ordinal scaled
survey instead of more in depth approaches which allow for probing.
96 | Page
8.3. Further Research The ambition with this report has been to contribute meaningful insights in the cross-country differences of
financing and adding value to their portfolio ventures and if this difference could explain the innovative level in the
country, which may be useful to both practitioners, researchers and students. However, due to natural limitations, it
has not been able to investigate every area of interest and value. Hence, the following section would outline some
of the areas which could be interesting to investigate further in the future.
The variable chosen for this analysis has been made from an econometric and measurement objective, which might
therefore not be the optimal and most accurate indicators of differences within venture capitalist. Especially in
terms of value adding services, which throughout the paper has proven to be the most important to create
sustainable innovation, the parameters could be different. A further research of interest could therefore to get an
alternative point of view of Entrepreneurs in the four countries. Here an analysis of what they see as the most
important factors of creating sustainable innovation, compared with the results in section 6, could give an
interesting research.
Furthermore, the above research saw that Venture Capital has only proven to be theoretical within helping
sustainable innovation, and not to spur new innovative ideas. Further research on what stimulates a better
innovative environment could therefore be interesting, based upon the National Innovative Systems and analyze
what impact Universities, Incubators and accelerators have upon both innovation and Venture Capital investment
strategies.
As explained in the theory section, venture capital financing of start-ups comprises of two cycles – fundraising, and
investment cycle. This research study dealt with the investment cycle of the Venture Capitalist. The fundraising
cycle is a fundamental prerequisite for the investment cycle. If a VC fails to raise money, the investment cycle
cannot start. There might be difference in the fundraising practice and process of U.S., UK, German and French
VCs. It would be of great interest to empirically research the fundraising cycle in future research on differences in
venture capital fundraising.
Corporate and public venture capital plays a paramount role in the venture capital financing of start-ups in the
analyzed peer group. For example a majority of the most prominent Venture capitalist in Denmark are all somehow
funded by the government. In addition, more and more multinational corporations establish their own venture
departments, where investments are made within their sphere. Google, Ebay, Cisco, Amazon, Yahoo, Intel, Nokia,
Vodafone, e.g. have all established their own corporate venture capital firms. This research study have limited its
research to be only focused upon independent venture capital firms, and therefore it could be interesting to analyze
the “other-side” of the venture capital industry, as these intercompany firms have in-depth industry and market
expertise.

97 | Page
9. Bibliography
EVCA. (2012). Retrieved 2012 йил 24-11 from European Venture Capital Association.
NVCA. (2012). Retrieved 2012 йил 24-11 from National Venture Capital Organization: ww.nvca.org
World Bank. (2012). Retrieved 2012 йил 25-11 from www.worldbank.org: www.worldbank.org
Zephyr. (2012 йил 30-11).
Aghion, P., & Howitt, P. (1992). A model of growth through creative destruction. Econometrica 60, 323-351.
Ahlers, T. (2012, August). Danish Venture Capital Mentality. (C. S. Tost, Interviewer)
Aiginger, K. (2002). Growth difference between Europe and the US in the nineties: causes and likelihood of.
European Forum Working Paper.
Allwood, M. (2008). AP® Statistics. Greenwich: Brunswick School .
Andreasen, M. (n.d.). Pmarca.com. Retrieved 10 24, 2012, from MARCA: http://blog.pmarca.com/
Ante, S. E. (2008). Creative Capital. Harvard Business School Publishing.
Anton, J. J., & Yao, D. A. (1994). Expropriation and inventions: appropriable rents in the absence of property
rights. American Economic Review, Vol. 84, 215-238.
Arundale, K. (2007). Raising Venture Capital Finance in Europe. In K. Arundale. Philadelphia.
Audretsch, D., & Feldman, M. (1996). R&Dspillovers and the geography of innovation and production. American
Economic Review 86, 630–640.
Bayoumi, T., Coe, D., & Helpman, E. (1999). R&D spillovers and global growth. Journal of International Economics 47
, 399–428.
Bodewes, W. E. (2002). Formalization and innovation revisited. European Journal of Innovation Management.
Bottazzi, L., & Peri, G. (2003). Innovation and spillovers in regions: evidence from European patent data. European
Economic Review 47, 687–710.
Broomfield, S. (2005). Venture Capital Funding.
Brouwer, E., & Kleinknecht, A. (1996). Alternative innovation indicators and determinants of innovation. European
Commision.
Bruce, D., & Gurley, T. (2005). Taxes and entrepreneurial activity: An empirical investigation using longitudinal tax
return data. Small Business Researcg, 252.

98 | Page
Buch, J. (2012, 06 12). What are BA's and VC's looking for in an investment case. (C. S. Tost, & M. Ringsted,
Interviewers)
Bullinger, H. J., Auerhammer, K., & Gomeringer, G. (2004). Managing innovation networks in the knowledge-
driven economy. int. j. prod. res.
Bygrave, W. D., & Timmons, J. A. (1986). Venture Capital’s role in financing innovation for economic growth.
Journal of Business Venturing, 161-176.
Cable, D., & Shane, S. (n.d.). A Prisoner's Dilemma Approach to Entrepreneur-Venture Capitalist Relationship.
Academy of Management Review.
Cameron, G. (1998). Innovation and growth: a survey of the empirical evidence. Working Paper. Nuffield College,
Oxford University.
Cardis, J. (2001). Venture Capital. New York.
Carpentier, C., & Suret, J.-M. (2010). The Canadian Public Venture Capital Market. Wiley Online Library, 303–323.
Caselli, S., Gatti, S., & Perrini, F. (2009). Are Venture Capitalists a Catalyst for Innovation. Milano: European Financial
Management.
Chemmanur, T. J., & He, J. (2011). IPO waves, product market competition, and the going public decision: Theory
and evidence. Journal of Financial Economics, 382-412 .
Chrunch Base. (2011). US Venture IPO Statistics .
Chrunchbase. (2012). Retrieved 11 26, 2012, from Chrunchbase: www.chrunchbase.com
Cleveland, B. (2010). Raising Money From Venture Capital – Size Does Matter….(So Does Time). Rolling Thunder.
Coe, D., & Helpman, E. (1995). International R&D spillovers. European Economic Review 39, 859-887.
CrunchBase. (n.d.). Retrieved October 14, 2012, from CrunchBase: www.crunchbase.com
Cullen, J. B., & Gordon, R. H. (2002). Taxes and entrepreneurial activity: Theory and evidence for the U.S. NBER working
paper.
Cumming, D. (2010). Venture capital, investment strategies, structures, and policies. Hoboken, N.J: Wiley.
Cumming, D. (2010). Venture Capital: Ivestment Strategies, Structures and Policies. Wiley: New Jersey.
Cumming, D. J. (2002). Contracts and Exits in Venture Capital Finance. Copenhagen: Copenhagen Business School.
Cumming, D., & Johan, S. (2006). Is the law or the layers? Investment covenants around theworld. European
Financial Management, Vol. 12, 535-568.
99 | Page
Desai, M. (2006). Institutions and entrepreneurial fi rm dynamics: Evidence form Europe. Havard NOM Research
Paper.
Eisenhardt, K. (1989). Agency Theory: an ssesment and Review. Academy of Management Review, 57-74.
Elango, B., Fried, V. H., Hisrich, R. D., & Polonchek, A. (1995). How venture capital firms differ. Journal of Business
Venturing, 157-179.
Engel, D., & Keilbach, M. (2002). Firm level implications of early stage venture capital investments: an empirical
investigation. ZEWDiscussion paper on entrepreneurship growth and public policy.
Ernest & Young. (2012). Global IPO trends 2012. Ernest & Young.
Ernest & Young. (2012). Globalizing Venture Capital. Ernest & Young.
European Commision. (2012). SBA Fact Sheet 2012. Ispra: European Commission.
EVCA. (2002). Survey of the Economic and Social Impact of Venture Capital in Europe. European Private Equity & Venture
Capital Association.
Fairchild, R. (2011). An entrepreneur's choice of venture capitalist or angel-financing: A A behavioral game-
theoretic approach. Journal of Business Venturing, 359–374.
Gans, J. S., Hsu, D. H., & Stern, S. (2002). When does start-up innovation spur the gale of creative destruction?
RAND Journal of Economics, Vol. 33, 571–586.
Garbade, M. J. (2009). Differences in Venture Capital Financing. Münich: GRIN.
Gilson , R. J., & Black , B. S. (1998). Venture Capital and the Structure of Capital Markets: Banks Versus Stock
Markets. Journal of Financial Economics, 243-277.
Giot, P. (2004). IPOs, trade sales and liquidations: modelling venture capital exits using survival analysis. Namur: University of
Namur,.
Gladstone, D., & Gladstone, L. (2002). Venture Capital Handbook. New Jersey: Upper Saddle River.
Governement of Canada. (2006). Growing the Businesses of Tomorrow: Challenges and Prospects of Early-Stage Venture Capital
Investment in Canada. Ottawa: Governement of Canada.
Greiner, L. E. (1972). Evolution and revolution as organizations grow. Harvard Business Review 50.
Griliches, Z., & Mairesse, J. (1986). R&D and productivity growth: comparing Japanese and US manufacturing
firms. European Economic Review 21 , 89–119.
100 | Page
Groh, A. P., Liechtenstein, H. v., & Lieser, K. (2009). The Attractiveness of Central European Countries for Venture Capital
and Private Equity Firms. Navarra: IESE Business School.
Groh, A., Liechtenstein, H., & Lieser, K. (2011). The Global Venture Capital and Private Equity Country Attractiveness
Index. Navarra: IESE Business School.
Grompers, P., & Lerner, J. (2001). The venture capital revolution. Journal of Economic Perspectives, Vol. 15, 145–168.
Grompers, P., & Lerner, J. (2004). The Venture Capital Cycle. MIT Press Books.
Gujarati, D. N., & Porter, D. C. (2009). Basic Econometrics. Singapore: McGraw Hill International Edition.
Haeming, M. (2003). Finanzieren mit Venture Capital und Private Equity. 13-35.
Hall, H. B. (2003). Exploring the patent explosion. Working Paper (Stanford University).
Hellmann, T. (2001 йил March). A theory of strategic venture investing. Stanford University.
Heyne, P. B. (2010). The Economic Way of Thinking. Prentice Hall.
Hoegl, M., Parboteeah, K. P., & Munson, C. L. (2003). Team-Level Antecedents of Individuals Knowledge
Networks. Decision Sciences .
Hsu, D. (2004). What do Entreprenuers Pay for Venture Capital Affiliation? The Journal of Finance.
ID Invest Partners. (2012). European Private Equity Market Outlook 2012. idinvest Partners.
IESE Business School. (2011). The Global Venture Capital and Private Equity Country Attractiveness Index. Navarra: Ernst
& Young.
IHS Global Insight. (2011). Venture Impact: The Economic Importance of Venture Backed Companies to the U.S. Economy.
NVCA.
Invest In Israel. (2012). Invest in Isreal: Venture Capital. Retrieved from Invest in Isreal:
http://www.investinisrael.gov.il/NR/exeres/A19A138D-87A7-416B-8D62-1C968E035E13.htm
IVCA. (2012, 11 24). Israeli Venture Capital Association. Tel Aviv.
Jacobius, A. (2011). Study: PE firms spend hours on investments they'll avoid. Pensions & Investment.
Jeng, L. A. (2000). The determinants of venture capital funding: evidence across countries. Journal of Corporate
Finance, Vol. 6,, 241-289.
Johnson, B. (2012 йил 15-October). A guide to Europe’s tech hubs. USA: Gigaom. From
http://gigaom.com/2012/10/15/europetechhubs/
101 | Page
Kanberg, A. (2012 йил 2-5). Crowdfunding breder sig i Norden. Retrieved 2012 йил 20-11 from Berlingske Business:
http://www.business.dk/innovation/crowdfunding-breder-sig-i-norden
Kaplan, S. (2003). Financial Contracting Theory Meets the Real World. Review of Economic Studies.
Kazanjian, R. (1988). Relation of dominant problems to stages of growth in technology-based new ventures.
Academy of Management Journal 31, 257-279.
Kemp, R. G., Folkeringa, M., & Wubben, E. F. (2002). Innovation and firm performance. Zoetermeer: SCientific
AnaLysis of Entrepreneurship and SMEs.
Kimberly, J., & Miles, R. (1980). The Organizational Life Cycle: Issues in the Creation,Transformation, and Decline
of Organizations. . -.
Kini, O., & Jain, B. B. (1995). Venture capitalist participation and the post-issue operating performance of IPO
firms. Managerial and Decision Economics Vol. 16, 593–606.
Kinnear, S., Charters, K., & Vitartas, P. (2013). Regional Advantage and Innovation. Sydney: Springer.
Klepper, S. (1996). Entry, Exit, Growth, and Innovation over the Product Life Cycle. American.
Knudsen, T. W. (2012, May 15). Managing Partner - Nordic Capital Partners. (C. S. Tost, Interviewer)
Kølendorf, P. (2012, 05 21). Business Angels angle on investments. (C. S. Tost, Interviewer)
Kølendorf, P. (2012, August). What is the most important features for a startup today? (C. S. Tost, Interviewer)
Kortum, S., & Lerner, J. (1998). Does venture capital spur innovation? NBERWorking Paper 6846.
Kortum, S., & Lerner, J. (2000). Assessing the contribution of venture capital to innovation. AND Journal of
Economics, Vol. 31.
La Porta, R. (2002). Investor Protection and Corporate Valuation. Journal of Finance.
Landström, H. (2007). Handbook of Research in Venture Capital. Cheltenham: Edward Elgar.
Latham, M. (2001). Social Entrepreneurship and the Welfare State. Address to the Social Entrepreneurs Network
Conference. Canberra.
Lazear, E. P. (1990). Job Security Provisions and Employment. Journal of Economics, 699-726.
Lee, S. M., & Peterson, S. J. (n.d.). Culture, Entreprenurial Orientation and Global Competitiveness. Journal of
Economics, 223-246.
Lerner, J. (1999). The government as venture capitalist. Journal of Business, Vol. 72, 285-318.
102 | Page
Lerner, J. (2002). Boom and bust in the venture capital industry and the impact on innovation. Harvard NOM
Working Paper 03–13.
Lerner, J., & Schoar, A. (2004). The illiquidity puzzle: theory and evidence from private equity. Journal of Financial
Economics, 3-40.
Lerner, J., & Schoar, A. (2005). Does legal enforcement affect financial transactions? The contractual channel in
private equity. Quarterly Journal of Economics, Vol. 12, 223-246.
Lindström, T. S. (2006). Venture Capital Performance Determinants and Differences between Europe and Northern America.
Helsinki: Helsinki University.
Lumme, A., Mason, C., & Suomi, M. (1998). Informal Venture Capital. Dordrecht, The Netherlands, 1-24.
Malik, O. (2011 йил 27-December). Why Berlin is poised to be Europe’s new tech hub. USA: Gigaom. From
http://gigaom.com/2011/12/27/why-berlin-is-poised-to-be-europes-new-tech-hub/
Mancinelli, S., & Mazzanti, M. (2008). Innovation, networking and complementarity: evidence on SME
performances for a local economic system in North-Eastern Italy. Annals of Regional Science .
Manigart, S., & Hyfte, M. (1999). Post-investment evolution of Belgian venture capital backed companies: an
empirical study. Paper presented at the Babson Entrepreneurship Conference, Boston.
Mansfield, E. (1980). Basic research and productivity increase in manufacturing. American Economic Review 70 , 863–
873.
March, J. G. (1991). Exploration and exploitation in organizational learning. Organization Science.
Mashable. (2012). Mashable. Retrieved 2012 йил 5-12 from http://mashable.com/category/crowdfunding/
Maurseth, P., & Verspagen, B. (2002). Knowledge spillovers in Europe: a patent citation analysis. Scandinavian
Journal of Economics 104 , 531–545.
Megginson, W. (2004). Toward a global model of venture capital? Jornal of Applied Corporate Finance, 89-107.
Megginson, W. (2004). Towards a Global Model of Venture Capital.
Megginson, W., & Weiss, K. A. (1991). Venture capitalist certification in initial public offerings. Journal of Finance,
Vol. 46, 879-902.
Metrick, A. (2006). Venture Capital and the Finance of Innovation. San Francisco: Wiley.
Miller, D., & Friesen, P. (1984). A longitudinal study of the corporate life cycle. Management Science 30, 1161-1183.
103 | Page
Miller, D., & Toulouse, J. M. (1986). Strategy, structure, CEO personality and performance in small firms. American Journal
of Small Business.
Muyzka, D., & Birley, S. (1996). Trade-offs in the Investment Decision of European Venture Capitalists. Journal of
Business Venturing.
Nathusious, K. (1987). Emerging Strategy in the Venture Capital Indsutry. Journal of Business Venturing, 53-77.
NESTA. (2009). The Innovation Index. London: NESTA.
Nesta. (2010). Venture Capital. London: Nesta.
NVCA. (2012 йил 10-11). National Venture Capital Association. From National Venture Capital Association:
http://www.nvca.org/
NVCA. (2012). NVCA Annual Yearbook. Thomsen Reuters.
Oanda.com. (n.d.). Retrieved 11 30, 2012, from Oanda: www.oanda.com
OECD. (2010). Measuring Innovation, A New Perspective. OECD Publishing .
OECD. (2011). OECD: IT, Network and Logistics. OECD.
OECD. (2011). OECD: National Innovation Systems. OECD.
OECD. (2012). Innovation Strategy. OECD.
OECD. (2012). OECD: World Population.
Orbit. (2012). Orbit.
Ottenbacher, M. C., & Harrington, R. J. (2008). Institutional, cultural and contextual factors: Potential drivers of
the culinary innovation process. Turism & Hospitality.
Poterba, J. (1989). Venture Capital and capital gains. Tax policy and the economy.
Privco. (2011). Privco.com.
PWC. (2012). PWC Moneytree. PWC Moneytree.
Quinn, J., & Cameron, K. (1983). Organizational life cycles and shifting criteria of effectiveness: Some preliminary
evidence. Management Science 29, 33-51.
Rasmussen, S. S. (2012 йил 10-09). VCIC 2013. (C. S. Tost, Interviewer)
Rechtmann, R. (2012). CEO, Go'Viral. Vækstfondens Årsmøde . København.
Rhunka, J., & Young, J. (1987). A Venture Capital Model of the Development Process for New Ventures. Journal of
Business Venturing, 167-184.
104 | Page
Rindermann, R. (2003). Venture capitalist participation and the performance of IPO firms: empirical evidence from
France, Germany, and the UK. EFMA Helsinki Meetings.
Robbins, H., & Beach, R. (Directors). (2012). New Product Development: Innovation Charter [Motion Picture].
RockThePost (Director). (2012). THE FIRST STEP TOWARDS FINDING A SOLUTION. [Motion Picture].
Romer, P. M. (1986). Increasing returns and long-run growth. Journal of Political Economy, 1001-1037.
Romer, P. M. (1990). Endogenous technological change. Journal of Political Economy, 71-102.
Roure, J. B., Keeley, R. H., & van der Heyden, T. (1990). European Venture Capital: Strategies and Challenges in
the 90's. EMJ Vol. 2, 1-10.
Sapienza, H. J., Autio, E., George, G., & Zahra, S. (2006). A Capabilities Perspective on the Effects of Early
Internationalization on Firm Survival and Growth. Academy of Management Review.
Sapienza, H. J., Manigart, S., & Vermeir, W. (1996). Venture Capitalist Governance and Value Added in Four
Countries. Journal of Business Venturing, 439-469.
Sbietiati, Z. (2012, September). Associate. (Christian, Interviewer)
Schertler, A. (2003). Driving Forces of Venture Capital Investments in Europe: A Dynamic Panel Data Analysis.
Schuler, R. S. (1989). "Strategic human resource management and industrial relations. Human Relations.
Schumpeter, J. A. (1943). Capitalism, Socialism, and Democracy . Routledge.
Seppa, T. (2002). Essays on the valuations and syndiaction of Venture Capital Investments. Helsinki: University of Helsinki.
Shar, I. (2012, 8). Differences in the VC envrionment across countries. (C. S. Tost, Interviewer)
Sherman, A. (2005). Raising Capital. In A. Sherman, Raising Capital. New York.
Siang, Y. H. (2009). Venture Capital Firm's Reputation Effect on Its Start-up Company's Long Term Operating Performance and
Survivorship. Singapore: SINGAPORE MANAGEMENT UNIVERSITY.
Splid, R. (2007). Kapitalfonde.
SQWconsulting. (2009). THE SUPPLY OF EQUITY FINANCING TO SMES: REVISITING THE “EQUITY
GAP”. A report to the Department for Business, Innovation and Skills.
Srinivan, T. N. (2003). Entrepreneurship, innovation and growth. Working Paper, Yale University.
Stanley, P. (1986). Pratt's Guide to Venture Capital Sources. Wellesley, 1-26.
Stokey, N. L. (1995). R&D and economic growth. Review of Economic Studies 28.
Sykes, H. B., & Block, Z. (1989). Corporate venturing obstacles: Sources and solutions. Journal of Business Venturing.

105 | Page
Teten, D., Bremer, K., Buslig, G., & Hussein, A. (2012). How VCs Can Accelerate Portfolio Company Returns. New
York: Columbia Business School.
The Economist. (July 2012). Europe not onlu has a Euro Crisis, it also has a growth crisis. Thiat is because of its
chronic failure to encourae ambitios entreprenuers. The Economist.
Thilsted, S. (2012, September). Iconfinder: What have happended since Venture Cup? (C. S. Tost, Interviewer)
Titus, R. (2011 йил 11-February). Start-Up 100: What's wrong with European venture capital? Retrieved 2012 йил 10-11
from The Telegraph: http://www.telegraph.co.uk/technology/technology-startup100/8325627/Start-Up-
100-Whats-wrong-with-European-venture-capital.html
TV2. (2012, 11 20). Billy Billing - Begrænset i DK, men Vækst i USA. TV2 - Nyhedsklip.
Tyebjee, T., & Bruno, A. (1984). A Model of Venture Capital Investment Activity. Management Science.
Tykvova, T. (2003). The decision of venture capitalists on timing and extent of IPOs’,. EFMA Helsinki Meetings.
Utterback, J. M., & Abernathy, W. J. (1975). A Dynamic Model of Process and Product Innovation. Management of
Science.
VCIC DK. (2012). Venture Capital Investment Competition. Venture Capital Investment Competition: Why do we invest?
Vækstfonden vs. Iconfinder. Copenhagen.
Velazco, C. (2011, November 11). Kickstarter: The Present Is Half Art Project, Half Meditation On Time. Retrieved 11 22,
2012, from Techcrunch: http://techcrunch.com/2011/11/09/kickstarter-the-present-is-half-art-project-
half-meditation-on-time/
Wadhwa, V. (2008). Does Venture Capital Spur Innovation? Bloomberg Businessweek.
Walsh, J. P., & Dewar, R. D. (1987). Formalization and the organizational life cycle. Journal of Management Studies.
Wazenig, N. (2012, 6). Why Statup in the UK and Not DK? (C. S. Tost, Interviewer)
William, B., & Jeffrey, T. (1984). Seed and Startup Investing in Technology Companies. Wellely , 10-35.
Witteloostuijin, v. A., & Wijbenga, F. (2006). The Entrepreneur and Venture Capitals as a Team.
Wright, M., & Robbie, K. (1998). Venture Capital and Private Equity: A Review and Syn thesis. Journal of Business
Finance & Accounting.
Wright, M., Robbie, K., Albrighton, M., Mason, C., & Harrison, R. (1998). Venture capital in Europe . London: The
Stationery Office Books .
106 | Page
10. Appendix
Appendix A. Interview List ................................................................................................................................................ 108
Appendix B. Interview Guide ............................................................................................................................................ 109
Appendix C. Questionnaire Respondents (Confidential) .......................................................................................... 122
Appendix C1. Questionnaire Respondents DK (Confidential) ......................................................................... 122
Appendix C2. Questionnaire Respondents IL (Confidential) ............................................................................ 122
Appendix D. Data ................................................................................................................................................................. 123
Appendix D1. Investment Size .................................................................................................................................... 123
Appendix D1a. Investment Size Seed Stage .............................................................................................. 123
Appendix D1b. Investment Size Seed Start-Up Stage ............................................................................. 124
Appendix D1c. Investment Size Seed Growth Stage ............................................................................... 125
Appendix D2. Risk Strategy .......................................................................................................................................... 126
Appendix D2a - % of Start-ups in pre-rev phase ..................................................................................... 126
Appendix D2b - Invest. % Mee-Too .......................................................................................................... 127
Appendix D2c - Risk Strategy ...................................................................................................................... 128
Appendix D2d -Level of Risk ...................................................................................................................... 128
Appendix D2e - Portfolio Structure ........................................................................................................... 128
Appendix D3 - Due Diligence ...................................................................................................................................... 129
Appendix D3a - Product DD done informal ............................................................................................ 129
Appendix D3b - Market DD done informal ............................................................................................. 130
Appendix D3c - % STU not Managed by founders ................................................................................. 131
Appendix D4 – Value Added ............................................................................................................................................ 132
Appendix D4a - Partner Ratio ..................................................................................................................... 132
Appendix D4b - Time used on portfolio company .................................................................................. 132
Appendix D4c - Contact of management of venture ............................................................................... 132

107 | Page
Appendix D4d - Number of board seats ................................................................................................... 133
Appendix D5 – Exit Strategy ............................................................................................................................................. 134
Appendix D5a – Exit Channel .................................................................................................................... 134
Appendix D5b – Exit on Geography ......................................................................................................... 134

108 | Page
Appendix A. Interview List (Confidential)
109 | Page
Appendix B. Interview Guide
Welcome to the questionnaire of an venture capital research study:
"A comparative analysis of the US, UK, IL, DK and their ways of financing Information
Technology startups"
- "A comparative Empirical Research of the Investment Process on the Venture Capital Firm Level"
This research study compares the way startups are financed with venture capital in the U.S. with UK,
IL and DK. The comparison is carried out on the venture capital (VC) firm level. The difference that is
to be analyzed for the VC investment process is the: contact phase, initial screening phase, due
diligence phase, deal structuring and negotiation phase, management phase - value adding services, and
exit phase.
In crafting this questionnaire, preliminary experts interviews (Skype, as well as in person)
were conducted with 4 VCs in UK, 3 VCs in the US, 3 in IL and 4 in DK. In addition, several
interviews with successful startups and Business Angels in DK and the UK have been
interviewed in regard to hearing their perspectives of the VC environment.
The questionnaire is only targeted venture capitalists from venture capital firms that invest in
information technology startups. To take part in this questionnaire, the VC does not need to have any
cross-border investment experience. The research is organized anonymously; therefore the
confidentiality of all respondents is fully protected.
Respondents should therefore feel confident in giving truthful and honest answers. It take approx. 15-
20 minutes to complete the questionnaire.
In appreciation of your participation, you can contact me after Jan 2013, and receive a copy of the
research results. For comments or questions, please contact me at
E: [email protected] or [email protected]
T: +45 4224 2859
Thank you for your time and your willingness to participate in this research.
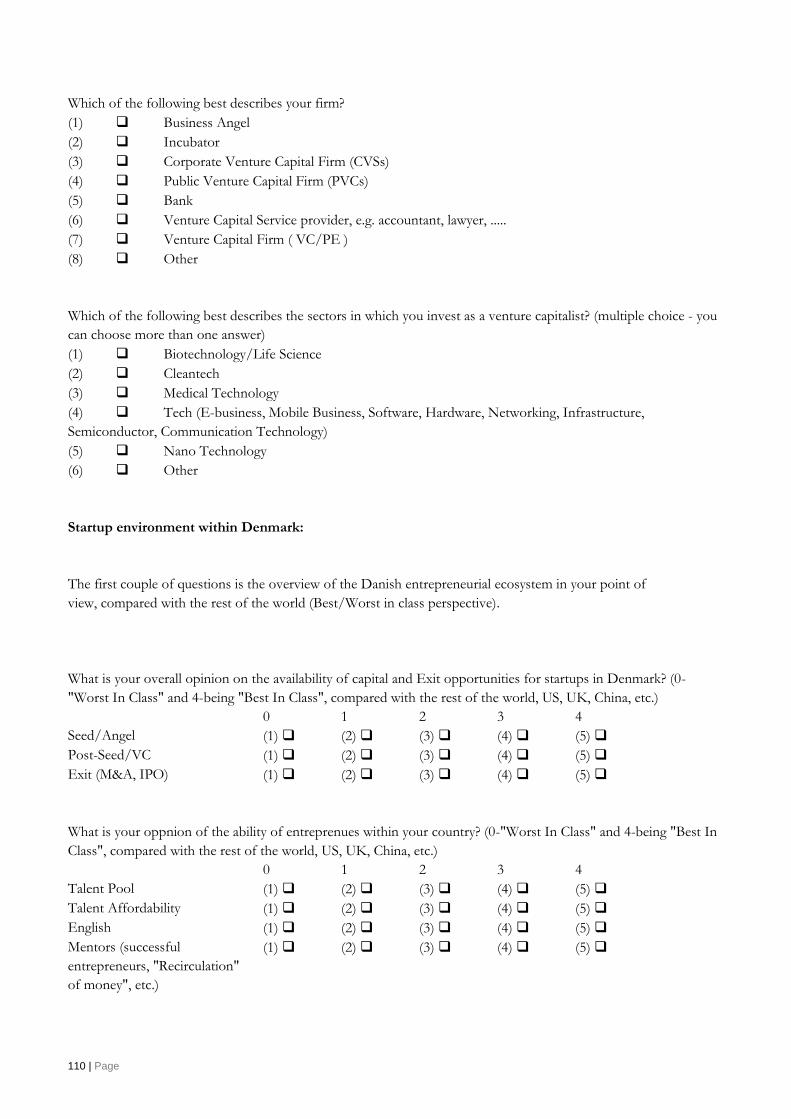
110 | Page
Which of the following best describes your firm?
(1) Business Angel
(2) Incubator
(3) Corporate Venture Capital Firm (CVSs)
(4) Public Venture Capital Firm (PVCs)
(5) Bank
(6) Venture Capital Service provider, e.g. accountant, lawyer, .....
(7) Venture Capital Firm ( VC/PE )
(8) Other
Which of the following best describes the sectors in which you invest as a venture capitalist? (multiple choice - you
can choose more than one answer)
(1) Biotechnology/Life Science
(2) Cleantech
(3) Medical Technology
(4) Tech (E-business, Mobile Business, Software, Hardware, Networking, Infrastructure,
Semiconductor, Communication Technology)
(5) Nano Technology
(6) Other
Startup environment within Denmark:
The first couple of questions is the overview of the Danish entrepreneurial ecosystem in your point of
view, compared with the rest of the world (Best/Worst in class perspective).
What is your overall opinion on the availability of capital and Exit opportunities for startups in Denmark? (0-
"Worst In Class" and 4-being "Best In Class", compared with the rest of the world, US, UK, China, etc.)
0 1 2 3 4
Seed/Angel (1) (2) (3) (4) (5)
Post-Seed/VC (1) (2) (3) (4) (5)
Exit (M&A, IPO) (1) (2) (3) (4) (5)
What is your oppnion of the ability of entreprenues within your country? (0-"Worst In Class" and 4-being "Best In
Class", compared with the rest of the world, US, UK, China, etc.)
0 1 2 3 4
Talent Pool (1) (2) (3) (4) (5)
Talent Affordability (1) (2) (3) (4) (5)
English (1) (2) (3) (4) (5)
Mentors (successful
entrepreneurs, "Recirculation"
of money", etc.)
(1) (2) (3) (4) (5)
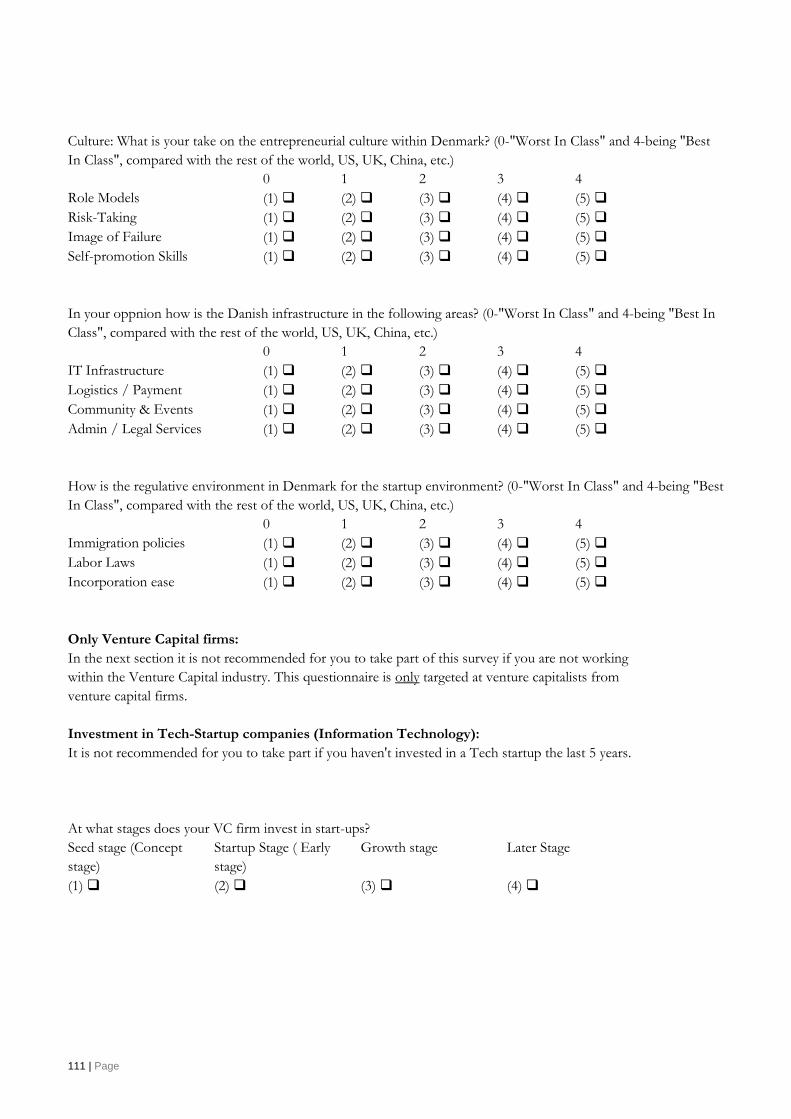
111 | Page
Culture: What is your take on the entrepreneurial culture within Denmark? (0-"Worst In Class" and 4-being "Best
In Class", compared with the rest of the world, US, UK, China, etc.)
0 1 2 3 4
Role Models (1) (2) (3) (4) (5)
Risk-Taking (1) (2) (3) (4) (5)
Image of Failure (1) (2) (3) (4) (5)
Self-promotion Skills (1) (2) (3) (4) (5)
In your oppnion how is the Danish infrastructure in the following areas? (0-"Worst In Class" and 4-being "Best In
Class", compared with the rest of the world, US, UK, China, etc.)
0 1 2 3 4
IT Infrastructure (1) (2) (3) (4) (5)
Logistics / Payment (1) (2) (3) (4) (5)
Community & Events (1) (2) (3) (4) (5)
Admin / Legal Services (1) (2) (3) (4) (5)
How is the regulative environment in Denmark for the startup environment? (0-"Worst In Class" and 4-being "Best
In Class", compared with the rest of the world, US, UK, China, etc.)
0 1 2 3 4
Immigration policies (1) (2) (3) (4) (5)
Labor Laws (1) (2) (3) (4) (5)
Incorporation ease (1) (2) (3) (4) (5)
Only Venture Capital firms:
In the next section it is not recommended for you to take part of this survey if you are not working
within the Venture Capital industry. This questionnaire is only targeted at venture capitalists from
venture capital firms.
Investment in Tech-Startup companies (Information Technology):
It is not recommended for you to take part if you haven't invested in a Tech startup the last 5 years.
At what stages does your VC firm invest in start-ups?
Seed stage (Concept
stage)
Startup Stage ( Early
stage)
Growth stage Later Stage
(1) (2) (3) (4)

112 | Page
How much money (in MDKK ) does your VC firm invest in average in the following stages? (Example 5-10
MDKK)
Seed stage _____ _____
Start-Up stage _____ _____
Growth stage _____ _____
Now think about all the startups your VC firm has invested in and already exited. How much money did it invest in
total in all financing rounds till exit in the following type of startups for the life of the investment? MDKK (Initial
Investment + follow-on-rounds)
Web 2.0 Start-ups _____ _____
E-Commerce Start-ups _____ _____
Mobile Start-Ups _____ _____
Software start-ups _____ _____
How much money does your VC firm reserve at initial investment in a startup for follow-on (subsequent) rounds
to avoid being diluted in later rounds? (Example: 4X initial investment)
Seed Stage _____
Startup Stage _____
Growth Stage _____
Later Stage _____
What are your VC firm exit return expectations (Example 10X Money multiple) at different investment stages?
Seed Stage _____
Startup Stage _____
Growth Stage _____
What is your view of the right % of equity share that founders of a startup should own? (Assume that friends &
family and angel investors are no longer part of the startup in terms of equity)
% of equity for founders __________
Now think about your startups in your portfolio. What % of the startups were in the pre-revenue phase (had no
revenue = $0) when you invested in them?
% pre-revenue investments __________
Now think about all the start-ups in your VC portfolio. What % of the start-ups had role models in other
geographies at the time your VC firm made the investment?
% _____
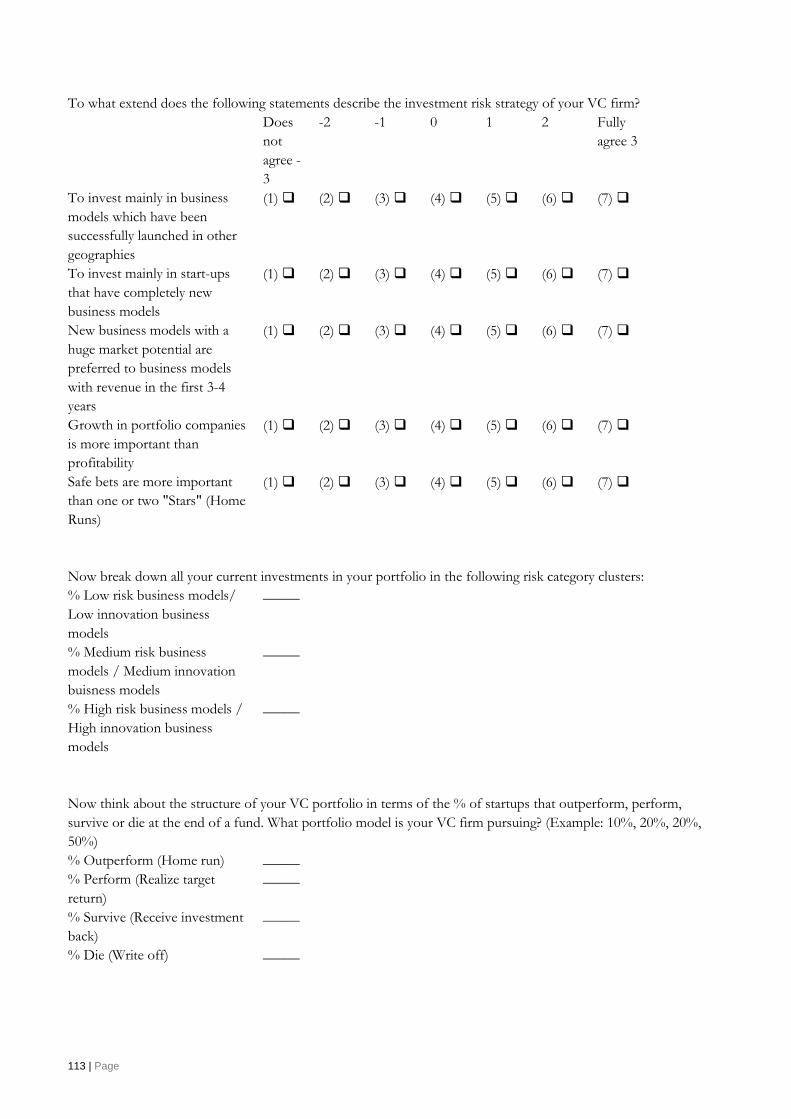
113 | Page
To what extend does the following statements describe the investment risk strategy of your VC firm?
Does
not
agree -
3
-2 -1 0 1 2 Fully
agree 3
To invest mainly in business
models which have been
successfully launched in other
geographies
(1) (2) (3) (4) (5) (6) (7)
To invest mainly in start-ups
that have completely new
business models
(1) (2) (3) (4) (5) (6) (7)
New business models with a
huge market potential are
preferred to business models
with revenue in the first 3-4
years
(1) (2) (3) (4) (5) (6) (7)
Growth in portfolio companies
is more important than
profitability
(1) (2) (3) (4) (5) (6) (7)
Safe bets are more important
than one or two "Stars" (Home
Runs)
(1) (2) (3) (4) (5) (6) (7)
Now break down all your current investments in your portfolio in the following risk category clusters:
% Low risk business models/
Low innovation business
models
_____
% Medium risk business
models / Medium innovation
buisness models
_____
% High risk business models /
High innovation business
models
_____
Now think about the structure of your VC portfolio in terms of the % of startups that outperform, perform,
survive or die at the end of a fund. What portfolio model is your VC firm pursuing? (Example: 10%, 20%, 20%,
50%)
% Outperform (Home run) _____
% Perform (Realize target
return)
_____
% Survive (Receive investment
back)
_____
% Die (Write off) _____
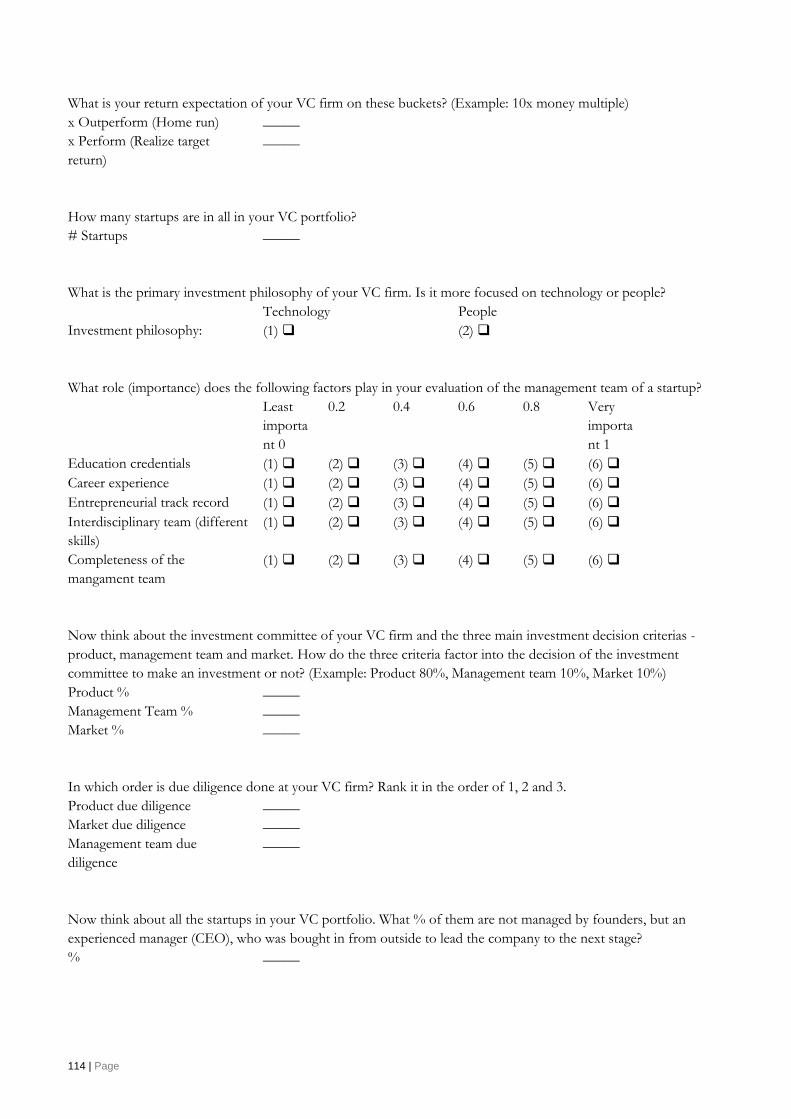
114 | Page
What is your return expectation of your VC firm on these buckets? (Example: 10x money multiple)
x Outperform (Home run) _____
x Perform (Realize target
return)
_____
How many startups are in all in your VC portfolio?
# Startups _____
What is the primary investment philosophy of your VC firm. Is it more focused on technology or people?
Technology People
Investment philosophy: (1) (2)
What role (importance) does the following factors play in your evaluation of the management team of a startup?
Least
importa
nt 0
0.2 0.4 0.6 0.8 Very
importa
nt 1
Education credentials (1) (2) (3) (4) (5) (6)
Career experience (1) (2) (3) (4) (5) (6)
Entrepreneurial track record (1) (2) (3) (4) (5) (6)
Interdisciplinary team (different
skills)
(1) (2) (3) (4) (5) (6)
Completeness of the
mangament team
(1) (2) (3) (4) (5) (6)
Now think about the investment committee of your VC firm and the three main investment decision criterias -
product, management team and market. How do the three criteria factor into the decision of the investment
committee to make an investment or not? (Example: Product 80%, Management team 10%, Market 10%)
Product % _____
Management Team % _____
Market % _____
In which order is due diligence done at your VC firm? Rank it in the order of 1, 2 and 3.
Product due diligence _____
Market due diligence _____
Management team due
diligence
_____
Now think about all the startups in your VC portfolio. What % of them are not managed by founders, but an
experienced manager (CEO), who was bought in from outside to lead the company to the next stage?
% _____
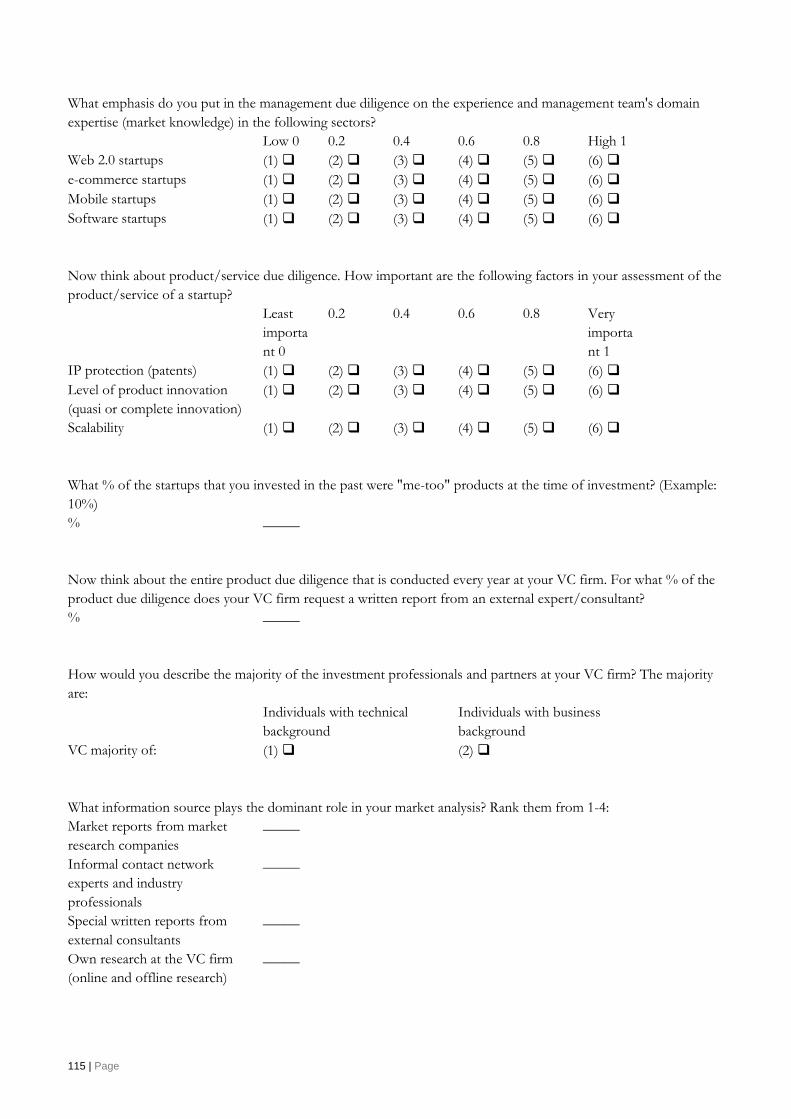
115 | Page
What emphasis do you put in the management due diligence on the experience and management team's domain
expertise (market knowledge) in the following sectors?
Low 0 0.2 0.4 0.6 0.8 High 1
Web 2.0 startups (1) (2) (3) (4) (5) (6)
e-commerce startups (1) (2) (3) (4) (5) (6)
Mobile startups (1) (2) (3) (4) (5) (6)
Software startups (1) (2) (3) (4) (5) (6)
Now think about product/service due diligence. How important are the following factors in your assessment of the
product/service of a startup?
Least
importa
nt 0
0.2 0.4 0.6 0.8 Very
importa
nt 1
IP protection (patents) (1) (2) (3) (4) (5) (6)
Level of product innovation
(quasi or complete innovation)
(1) (2) (3) (4) (5) (6)
Scalability (1) (2) (3) (4) (5) (6)
What % of the startups that you invested in the past were "me-too" products at the time of investment? (Example:
10%)
% _____
Now think about the entire product due diligence that is conducted every year at your VC firm. For what % of the
product due diligence does your VC firm request a written report from an external expert/consultant?
% _____
How would you describe the majority of the investment professionals and partners at your VC firm? The majority
are:
Individuals with technical
background
Individuals with business
background
VC majority of: (1) (2)
What information source plays the dominant role in your market analysis? Rank them from 1-4:
Market reports from market
research companies
_____
Informal contact network
experts and industry
professionals
_____
Special written reports from
external consultants
_____
Own research at the VC firm
(online and offline research)
_____

116 | Page
Now think about the way market analysis is done at your VC firm. What % of market analysis is done informal (by
talking with people you know/contact network) instead of formal (buying market reports, hiring
experts/consultants)?
% that are informal market
research:
_____
How many people/professionals work in average on a deal at your VC firm? (Size of deal team)
People: _____
To what extent do the following statements describe the investment strategy of your VC firm regarding "market"?
Does
not
agree -
3
-2 -1 0 1 2 Fully
agree 3
Our investment philosophy is:
If our startup is a good
company, it will find a good
market
(1) (2) (3) (4) (5) (6) (7)
It is better to pick a good
technology and not as good a
market, than to pick a good
market and not as good a
technology
(1) (2) (3) (4) (5) (6) (7)
Now think about the investment committee of your VC firm. How many people sit on the investment committee?
People _____
What is the best characterization of the normal risk standard of the investment committee?
Conservative Moderate Progressive
- (1) (2) (3)
How are decisions made on your investment committee? (Multiple choice)
(1) Every investment committee member has one voting right
(2) If there is a tie, someone has a double voting right
(3) If there is a tie, the deal is automatically rejected
(4) Someone has a veto-right to block an investment even if all others say yes
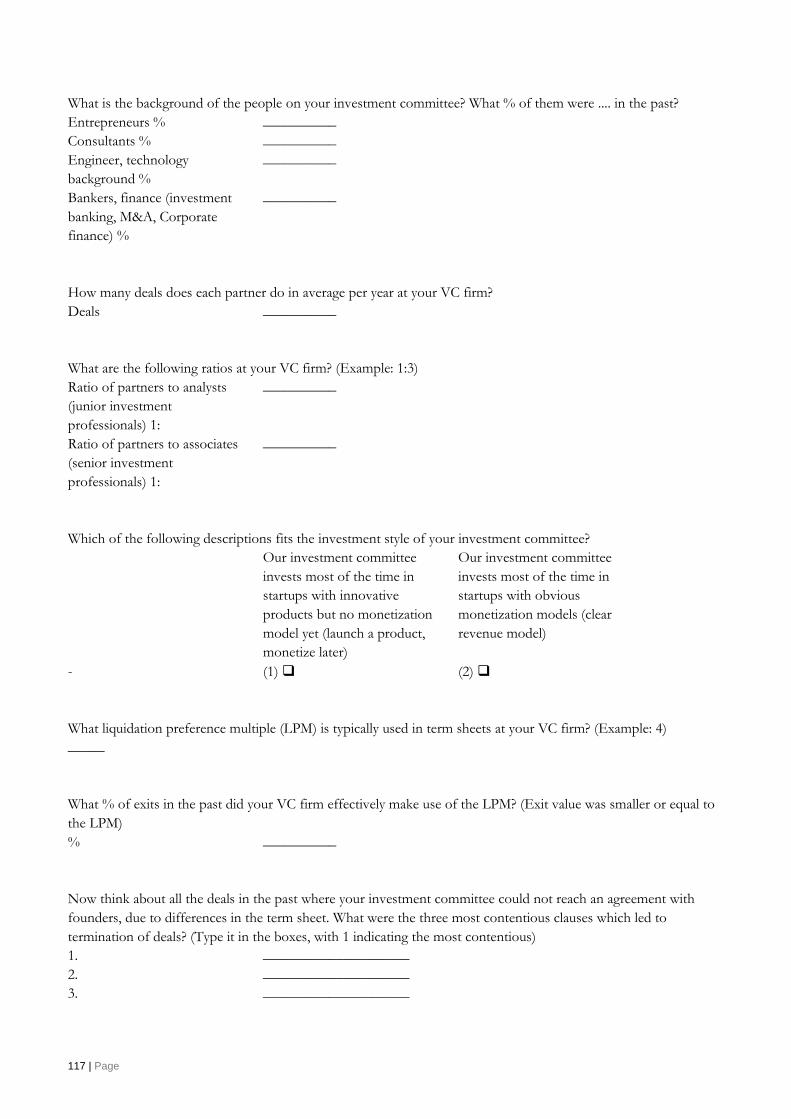
117 | Page
What is the background of the people on your investment committee? What % of them were .... in the past?
Entrepreneurs % __________
Consultants % __________
Engineer, technology
background %
__________
Bankers, finance (investment
banking, M&A, Corporate
finance) %
__________
How many deals does each partner do in average per year at your VC firm?
Deals __________
What are the following ratios at your VC firm? (Example: 1:3)
Ratio of partners to analysts
(junior investment
professionals) 1:
__________
Ratio of partners to associates
(senior investment
professionals) 1:
__________
Which of the following descriptions fits the investment style of your investment committee?
Our investment committee
invests most of the time in
startups with innovative
products but no monetization
model yet (launch a product,
monetize later)
Our investment committee
invests most of the time in
startups with obvious
monetization models (clear
revenue model)
- (1) (2)
What liquidation preference multiple (LPM) is typically used in term sheets at your VC firm? (Example: 4)
_____
What % of exits in the past did your VC firm effectively make use of the LPM? (Exit value was smaller or equal to
the LPM)
% __________
Now think about all the deals in the past where your investment committee could not reach an agreement with
founders, due to differences in the term sheet. What were the three most contentious clauses which led to
termination of deals? (Type it in the boxes, with 1 indicating the most contentious)
1. ____________________
2. ____________________
3. ____________________
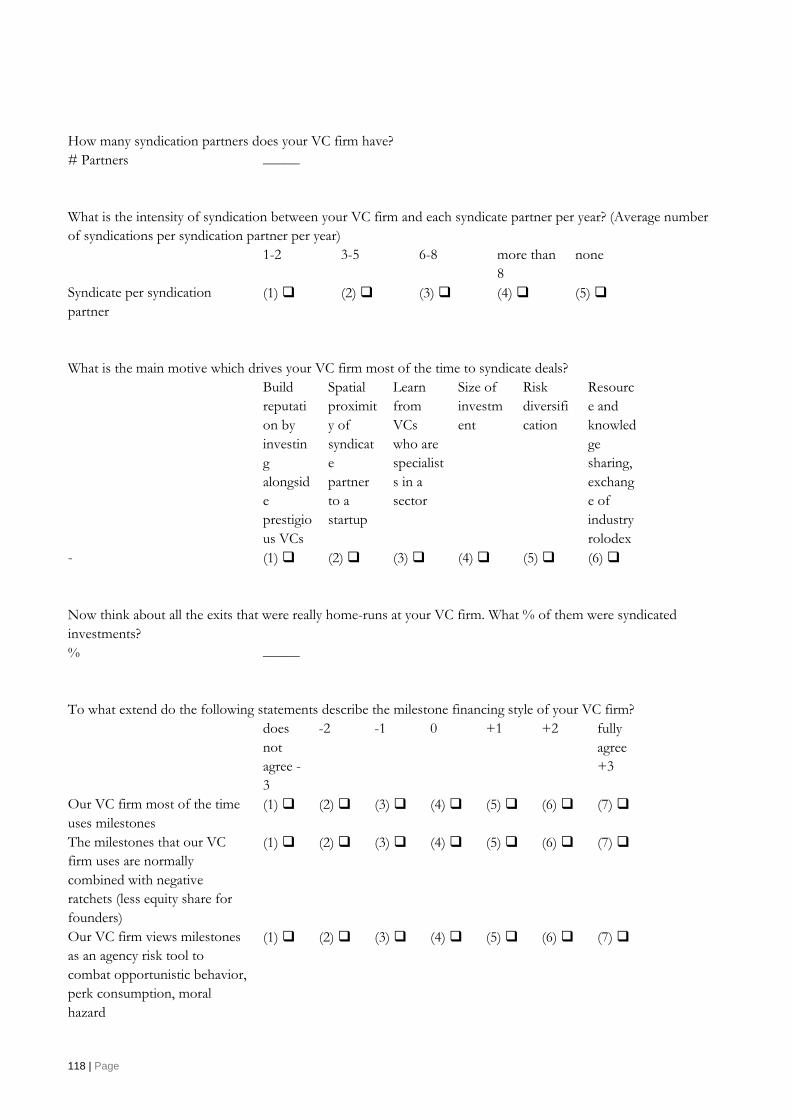
118 | Page
How many syndication partners does your VC firm have?
# Partners _____
What is the intensity of syndication between your VC firm and each syndicate partner per year? (Average number
of syndications per syndication partner per year)
1-2 3-5 6-8 more than
8
none
Syndicate per syndication
partner
(1) (2) (3) (4) (5)
What is the main motive which drives your VC firm most of the time to syndicate deals?
Build
reputati
on by
investin
g
alongsid
e
prestigio
us VCs
Spatial
proximit
y of
syndicat
e
partner
to a
startup
Learn
from
VCs
who are
specialist
s in a
sector
Size of
investm
ent
Risk
diversifi
cation
Resourc
e and
knowled
ge
sharing,
exchang
e of
industry
rolodex
- (1) (2) (3) (4) (5) (6)
Now think about all the exits that were really home-runs at your VC firm. What % of them were syndicated
investments?
% _____
To what extend do the following statements describe the milestone financing style of your VC firm?
does
not
agree -
3
-2 -1 0 +1 +2 fully
agree
+3
Our VC firm most of the time
uses milestones
(1) (2) (3) (4) (5) (6) (7)
The milestones that our VC
firm uses are normally
combined with negative
ratchets (less equity share for
founders)
(1) (2) (3) (4) (5) (6) (7)
Our VC firm views milestones
as an agency risk tool to
combat opportunistic behavior,
perk consumption, moral
hazard
(1) (2) (3) (4) (5) (6) (7)

119 | Page
does
not
agree -
3
-2 -1 0 +1 +2 fully
agree
+3
Our VC firm does not use
milestones because we think
milestones have severe negative
effects on mgmt.
(1) (2) (3) (4) (5) (6) (7)
How many tranches does your VC firm typically use to disburse the amount of capital committed in an investment
round to a start-up?
Tranches _____
Now think about the way you spend your time at your VC firm. What % of your time do you allocate to
New deal sourcing % _____
Portfolio company
management %
_____
Internal stuff at the VC firm % _____
Now think about partners/investment professionals at your VC firm that have board seats in portfolio companies.
In average, how many board sets does each partner/investment professional have?
Board sets _____
How many times in a month do you speak/meet with senior managers (non C-level executives) of a Portfolio
Company?
0 1 2 3 more than
3
- (1) (2) (3) (4) (5)
How many personal meetings does your VC firm have per year with corporate development guys from big
corporations?
Less than
2
2-4 5-8 9-12 more than
12
- (1) (2) (3) (4) (5)
How many times in average per year does your VC firm pitch portfolio companies to investment bankers/M&A
advisory firms/analysis?
0 1 2 3 more than
3
- (1) (2) (3) (4) (5)
120 | Page
Now think about all the startups that you invested in at a certain stage in the past, which are no more in your
portfolio. How many years did you keep the start-ups in your portfolio till exit?
Investment in the seed stage
(seed stage start-ups)
_____
Investments in the start-up
stage (start-up stage start-ups)
_____
Investments in the growth
stage (growth stage start-ups)
_____
What has been your typically exit-strategy the past 5 years? (Please divided a 100% on the choices below)
Private Equity Firms _____
Venture Capital Firm _____
IPO _____
Founders _____
Large Corporation _____
Seen on a geographic perspective what is most common when you exit?
Exit to a domestic partner
within the country:
Exit to a foreign partner:
Exits the past five years have
mostly been:
(1) (2)
Who are in your own view the most prestigious VC firms in Denmark that invest in Information Technology start-
ups (image, brand, exit track record, companies they build in the past, hype, and arrogance)? Rank them from 1-3.
1. __________
2. __________
3. __________
What description best fits your VC firm? (Your answer should be based on a country specific choice)
(1) A small fund
(2) A medium sized fund
(3) A big fund
What is the best description of your position at your VC firm?
(1) Analyst
(2) Associate
(3) Partner
(4) Founder/Partner
How many business plans (investment solicitations) does your VC firm receive in average per year?
Business plans _____
Now think about all the start-ups that your VC firm invested in the past. What % of them already had angel
investors (non-institutional investors) on board?
% _____

121 | Page
In which part of Denmark is your VC firm located?
Copen
hagen
Other
Zealan
d
North
ern
Jutland
Central
Jutland
Southe
rn
Jutland
Fynen Other
- (1) (2) (3) (7) (4) (5) (6)
Thank you for your participation of this research study regarding the Venture Capital environment. If
you are interested in getting a copy of the results please write your name and e-mail address below:
Name: _______________
E-Mail: _______________
I sincerely thank you for your time,
Christian Scheel Tost

122 | Page
Appendix C. Questionnaire Respondents (Confidential)
Appendix C1. Questionnaire Respondents DK (Confidential)
Appendix C2. Questionnaire Respondents IL (Confidential)

123 | Page
Appendix D. Data
Appendix D1. Investment Size
Appendix D1a. Investment Size Seed Stage
Average Size of Investment - Seed Stage
MUSD
VC FIRM / Values US UK DK IL
1 0,55 0,64 0,37 0,74
2 1,5 1,01 0,74 0,34
3 0,65 0,55 0,18 0,80
4 0,4 0,69 1,10 0,54
5 0,125 0,69 0,55 0,40
6 0,625 0,23 0,37 0,54
7 0,125 0,32 0,28 0,54
8 0,3 0,27 0,40 0,34
9 0,55 1,10 0,55 0,80
10 0,175 0,27
11 0,4 0,40
12 1 0,67
13 0,125 0,34
14 0,175
15 0,3
16 0,25
17 1
18 0,25
19 0,625
20 0,55
21 0,25
22 0,625
23 0,8
24 0,2
25 0,3
26 0,65
27 0,3
28 0,75
29 0,25
30 1,125
31 0,175
32 0,5
33 0,3
34 0,25
35 0,375
36 0,375
Average Investment Size: Seed Stage
US UK DK IL
Mean 0,47 0,6098 0,50 0,5156
VAR 0,100 0,094 0,078 0,035
N 36 9 9 13
N - 1 35 8 8 12
VAR / N 0,003 0,010 0,009 0,003
Average Investment Size: Seed Stage
Mean Differences Sqrt(VAR1/N+VAR2/N) T-Value DF P Value Rejection Region
Statistical Significance / Ho
Rejection
HA1: US < UK -0,140 0,115 -1,220 12,611 0,1225 (1.771, - ) No
HA2: US < IL -0,046 0,074 -0,622 36,061 0,2691 (1.684, - ) No
HA3: US < DK -0,035 0,107 -0,326 13,668 0,3749 (1.761, - ) No
HA4: UK < IL 0,094 0,115 0,820 12,166 0,2139 (1.782, - ) No
HA5: UK < DK 0,106 0,138 0,764 15,852 0,2279 (1.746, - ) No
HA 6: IL < DK 0,011 0,107 0,107 13,001 0,4583 (1771, - ) No
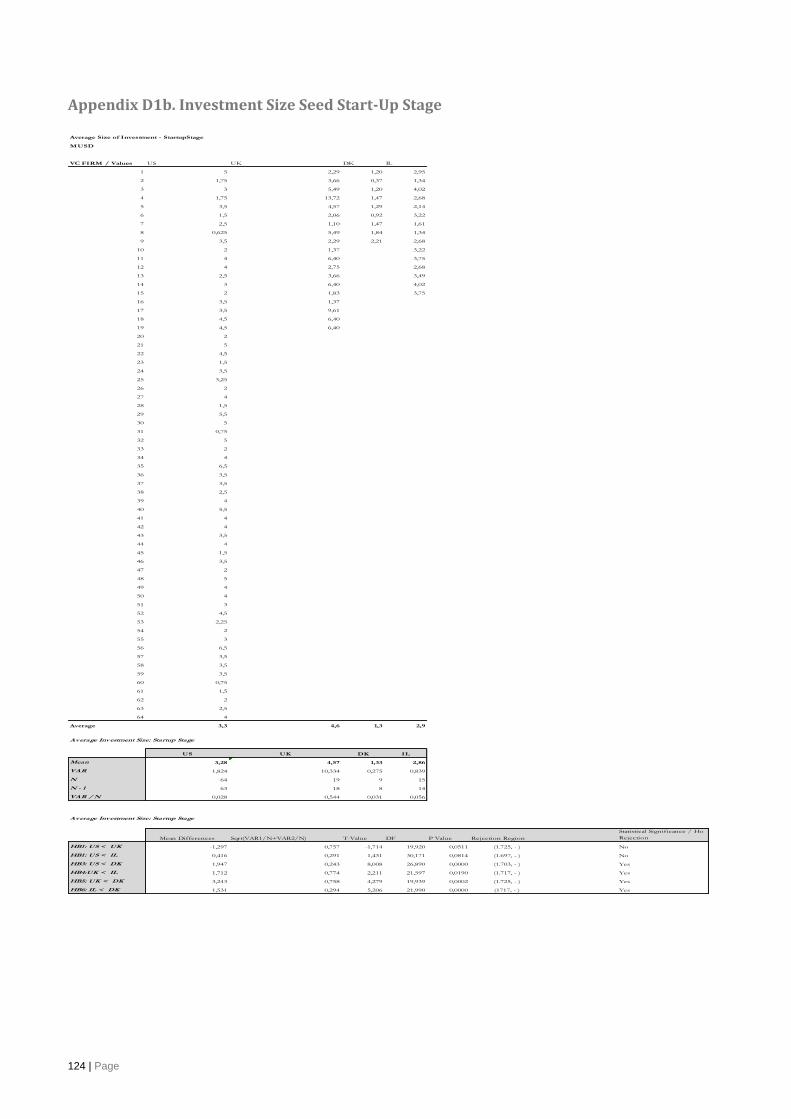
124 | Page
Appendix D1b. Investment Size Seed Start-Up Stage
Average Size of Investment - StartupStage
MUSD
VC FIRM / Values US UK DK IL
1 5 2,29 1,20 2,95
2 1,75 3,66 0,37 1,34
3 3 5,49 1,20 4,02
4 1,75 13,72 1,47 2,68
5 3,5 4,57 1,29 2,14
6 1,5 2,06 0,92 3,22
7 2,5 1,10 1,47 1,61
8 0,625 5,49 1,84 1,34
9 3,5 2,29 2,21 2,68
10 2 1,37 3,22
11 4 6,40 3,75
12 4 2,75 2,68
13 2,5 3,66 3,49
14 3 6,40 4,02
15 2 1,83 3,75
16 3,5 1,37
17 3,5 9,61
18 4,5 6,40
19 4,5 6,40
20 2
21 5
22 4,5
23 1,5
24 3,5
25 3,25
26 2
27 4
28 1,5
29 5,5
30 5
31 0,75
32 5
33 2
34 4
35 6,5
36 3,5
37 3,5
38 2,5
39 4
40 5,5
41 4
42 4
43 3,5
44 4
45 1,5
46 3,5
47 2
48 5
49 4
50 4
51 3
52 4,5
53 2,25
54 2
55 3
56 6,5
57 3,5
58 3,5
59 3,5
60 0,75
61 1,5
62 2
63 2,5
64 4
Average 3,3 4,6 1,3 2,9
Average Investment Size: Startup Stage
US UK DK IL
Mean 3,28 4,57 1,33 2,86
VAR 1,824 10,334 0,275 0,839
N 64 19 9 15
N - 1 63 18 8 14
VAR / N 0,028 0,544 0,031 0,056
Average Investment Size: Startup Stage
Mean Differences Sqrt(VAR1/N+VAR2/N) T-Value DF P Value Rejection Region
Statistical Significance / Ho
Rejection
HB1: US < UK -1,297 0,757 -1,714 19,920 0,0511 (1.725, - ) No
HB1: US < IL 0,416 0,291 1,431 30,171 0,0814 (1.697, - ) No
HB3: US < DK 1,947 0,243 8,008 26,890 0,0000 (1.703, - ) Yes
HB4:UK < IL 1,712 0,774 2,211 21,597 0,0190 (1.717, - ) Yes
HB5: UK < DK 3,243 0,758 4,279 19,939 0,0002 (1.725, - ) Yes
HB6: IL < DK 1,531 0,294 5,206 21,990 0,0000 (1717, - ) Yes
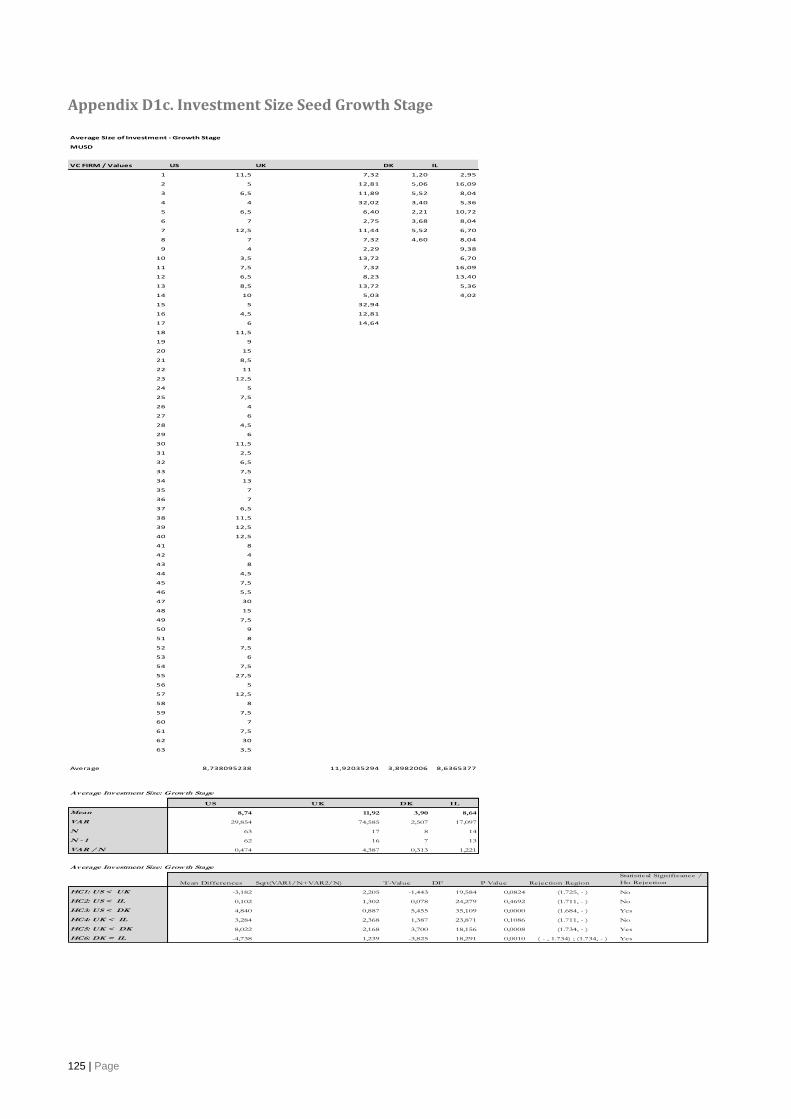
125 | Page
Appendix D1c. Investment Size Seed Growth Stage
Average Size of Investment - Growth Stage
MUSD
VC FIRM / Values US UK DK IL
1 11,5 7,32 1,20 2,95
2 5 12,81 5,06 16,09
3 6,5 11,89 5,52 8,04
4 4 32,02 3,40 5,36
5 6,5 6,40 2,21 10,72
6 7 2,75 3,68 8,04
7 12,5 11,44 5,52 6,70
8 7 7,32 4,60 8,04
9 4 2,29 9,38
10 3,5 13,72 6,70
11 7,5 7,32 16,09
12 6,5 8,23 13,40
13 8,5 13,72 5,36
14 10 5,03 4,02
15 5 32,94
16 4,5 12,81
17 6 14,64
18 11,5
19 9
20 15
21 8,5
22 11
23 12,5
24 5
25 7,5
26 4
27 6
28 4,5
29 6
30 11,5
31 2,5
32 6,5
33 7,5
34 13
35 7
36 7
37 6,5
38 11,5
39 12,5
40 12,5
41 8
42 4
43 8
44 4,5
45 7,5
46 5,5
47 30
48 15
49 7,5
50 9
51 8
52 7,5
53 6
54 7,5
55 27,5
56 5
57 12,5
58 8
59 7,5
60 7
61 7,5
62 30
63 3,5
Average 8,738095238 11,92035294 3,8982006 8,6365377
Average Investment Size: Growth Stage
US UK DK IL
Mean 8,74 11,92 3,90 8,64
VAR 29,854 74,585 2,507 17,097
N 63 17 8 14
N - 1 62 16 7 13
VAR / N 0,474 4,387 0,313 1,221
Average Investment Size: Growth Stage
Mean Differences Sqrt(VAR1/N+VAR2/N) T-Value DF P Value Rejection Region
Statistical Significance /
Ho Rejection
HC1: US < UK -3,182 2,205 -1,443 19,584 0,0824 (1.725, - ) No
HC2: US < IL 0,102 1,302 0,078 24,279 0,4692 (1.711, - ) No
HC3: US < DK 4,840 0,887 5,455 35,109 0,0000 (1.684, - ) Yes
HC4: UK < IL 3,284 2,368 1,387 23,871 0,1086 (1.711, - ) No
HC5: UK < DK 8,022 2,168 3,700 18,156 0,0008 (1.734, - ) Yes
HC6: DK = IL -4,738 1,239 -3,825 18,291 0,0010 ( - , 1.734) ; (1.734, - ) Yes
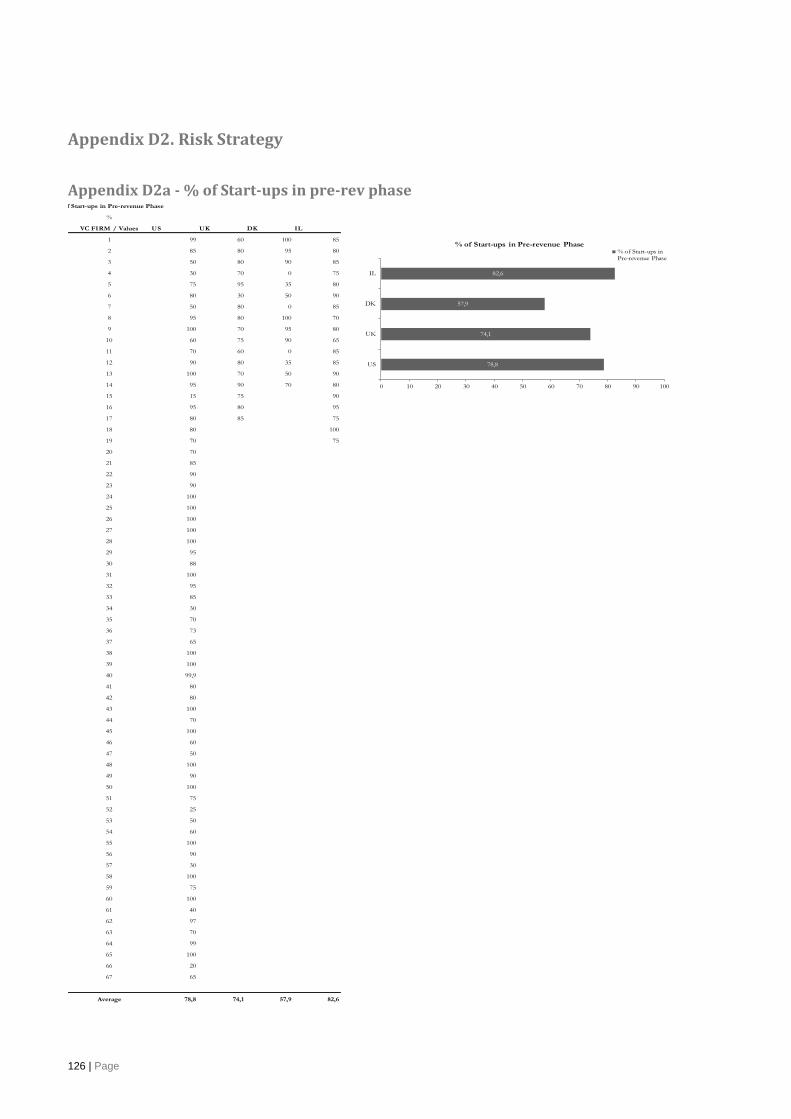
126 | Page
Appendix D2. Risk Strategy
Appendix D2a - % of Start-ups in pre-rev phase
% of Start-ups in Pre-revenue Phase
%
VC FIRM / Values US UK DK IL
1 99 60 100 85
2 85 80 95 80
3 50 80 90 85
4 30 70 0 75
5 75 95 35 80
6 80 30 50 90
7 50 80 0 85
8 95 80 100 70
9 100 70 95 80
10 60 75 90 65
11 70 60 0 85
12 90 80 35 85
13 100 70 50 90
14 95 90 70 80
15 15 75 90
16 95 80 95
17 80 85 75
18 80 100
19 70 75
20 70
21 85
22 90
23 90
24 100
25 100
26 100
27 100
28 100
29 95
30 88
31 100
32 95
33 85
34 30
35 70
36 73
37 65
38 100
39 100
40 99,9
41 80
42 80
43 100
44 70
45 100
46 60
47 50
48 100
49 90
50 100
51 75
52 25
53 50
54 60
55 100
56 90
57 30
58 100
59 75
60 100
61 40
62 97
63 70
64 99
65 100
66 20
67 65
Average 78,8 74,1 57,9 82,6
78,8
74,1
57,9
82,6
0 10 20 30 40 50 60 70 80 90 100
US
UK
DK
IL
% of Start-ups in Pre-revenue Phase% of Start-ups inPre-revenue Phase
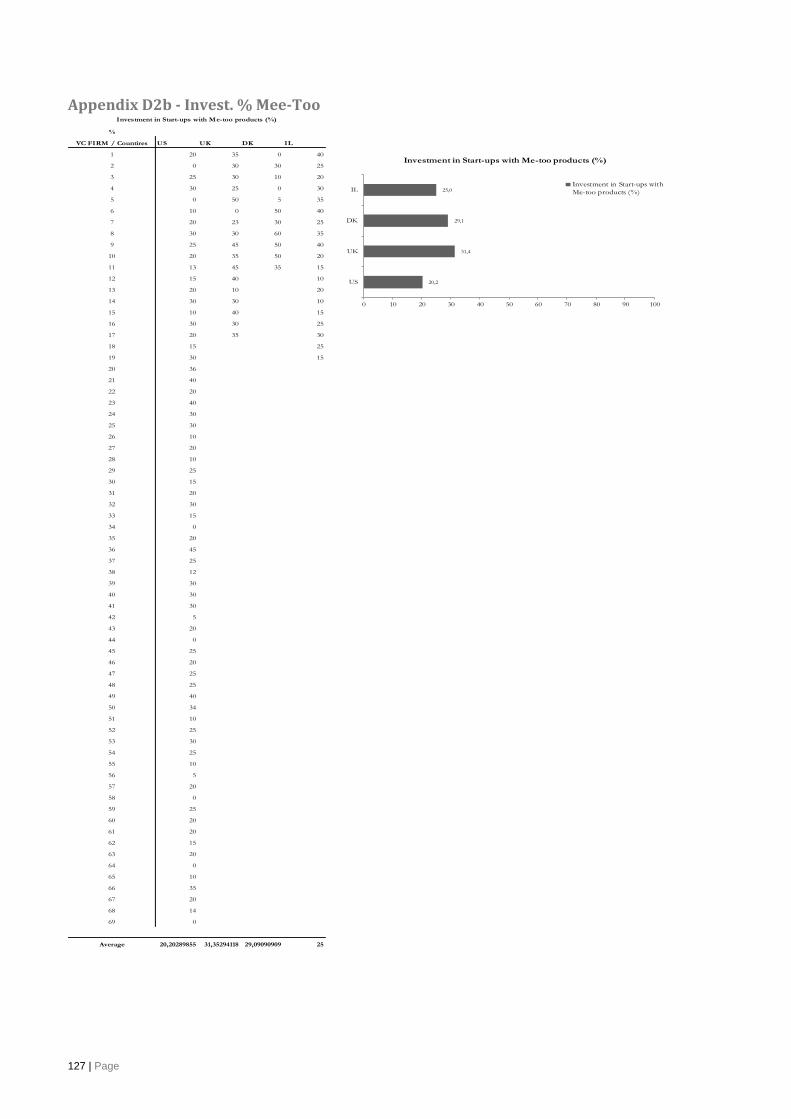
127 | Page
Appendix D2b - Invest. % Mee-Too
%
VC FIRM / Countires US UK DK IL
1 20 35 0 40
2 0 30 30 25
3 25 30 10 20
4 30 25 0 30
5 0 50 5 35
6 10 0 50 40
7 20 23 30 25
8 30 30 60 35
9 25 45 50 40
10 20 35 50 20
11 13 45 35 15
12 15 40 10
13 20 10 20
14 30 30 10
15 10 40 15
16 30 30 25
17 20 35 30
18 15 25
19 30 15
20 36
21 40
22 20
23 40
24 30
25 30
26 10
27 20
28 10
29 25
30 15
31 20
32 30
33 15
34 0
35 20
36 45
37 25
38 12
39 30
40 30
41 30
42 5
43 20
44 0
45 25
46 20
47 25
48 25
49 40
50 34
51 10
52 25
53 30
54 25
55 10
56 5
57 20
58 0
59 25
60 20
61 20
62 15
63 20
64 0
65 10
66 35
67 20
68 14
69 0
Average 20,20289855 31,35294118 29,09090909 25
Investment in Start-ups with Me-too products (%)
20,2
31,4
29,1
25,0
0 10 20 30 40 50 60 70 80 90 100
US
UK
DK
IL
Investment in Start-ups with Me-too products (%)
Investment in Start-ups with
Me-too products (%)

128 | Page
Appendix D2c - Risk Strategy
Appendix D2d -Level of Risk
Appendix D2e - Portfolio Structure
"To what extend do he follwing statemnts describe the investment risk strategy of your VC firm?"
Does not
agree -3-2 -1 0 1 2
Fully
agree +3
US 2,9% 2,9% 4,4% 2,9% 8,7% 31,9% 46,4%
UK 0,0% 0,0% 17,7% 0,0% 11,8% 52,9% 17,7%
DK 0,0% 33,3% 0,0% 33,3% 25,0% 0,0% 8,3%
IL 0,0% 0,0% 6,7% 26,7% 26,7% 26,7% 13,3%
US 1,5% 7,3% 5,8% 1,5% 7,3% 26,1% 50,7%
UK 0,0% 0,0% 11,8% 0,0% 17,7% 47,1% 23,5%
DK 0,0% 0,0% 25,0% 16,7% 33,3% 16,7% 8,3%
IL 0,0% 0,0% 0,0% 7,1% 14,3% 64,3% 14,3%
US 2,9% 7,3% 7,3% 0,0% 8,7% 21,7% 52,2%
UK 0,0% 0,0% 11,8% 0,0% 17,0% 47,1% 23,5%
DK 0,0% 16,7% 16,7% 41,7% 0,0% 16,7% 8,3%
IL 0,0% 0,0% 0,0% 6,7% 13,3% 53,3% 26,7%
To invest in startups that have
completely new business models
To invest in startups that have
completely new business models with a
huge market growth potential than
revenue in the first 3-4 years
Growth in oortfolio companies are more
important than profitbiliaty
Now think about all the startups in your current portfolio. Break dwon all the startups in the portfolio of your VC firm in % in the following clusters
Level of risk Mean US Mean UK Mean DK Mean IL Min US Min UK Min DK Min IL Max US Max UK Max DK Max IL
% Low Risk Business model 15,7 19,1 23,0 10,9 0 10 0 0 30 30 85 25
% Medium Risk business models 30,8 34,4 37,1 44,7 0 25 0 25 60 50 60 75
%High Risk Business Models 55,0 47,6 40,0 44,4 20 35 20 20 100 75 100 75
Portfolio Structure Mean US Mean UK Mean DK Mean IL Min US Min UK Min DK Min IL Max US Max UK Max DK Max IL
% Outperform 16 15 17 11 10 5 3 5 30 25 70 25
% Perform 25 24 28 24 10 10 10 10 60 40 60 40
% Survive 19 21 24 29 5 10 10 20 35 30 40 40
% Die 40 39 30 36 20 25 0 20 60 65 62 50
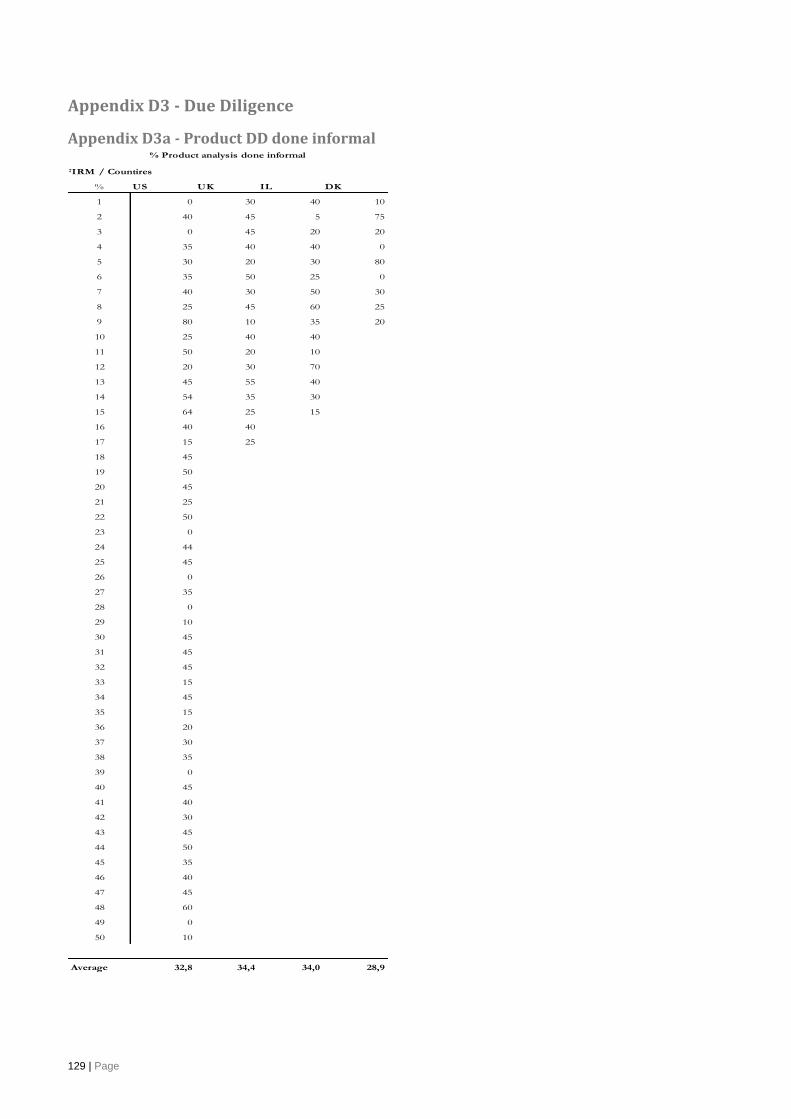
129 | Page
Appendix D3 - Due Diligence
Appendix D3a - Product DD done informal
VC FIRM / Countires
% US UK IL DK
1 0 30 40 10
2 40 45 5 75
3 0 45 20 20
4 35 40 40 0
5 30 20 30 80
6 35 50 25 0
7 40 30 50 30
8 25 45 60 25
9 80 10 35 20
10 25 40 40
11 50 20 10
12 20 30 70
13 45 55 40
14 54 35 30
15 64 25 15
16 40 40
17 15 25
18 45
19 50
20 45
21 25
22 50
23 0
24 44
25 45
26 0
27 35
28 0
29 10
30 45
31 45
32 45
33 15
34 45
35 15
36 20
37 30
38 35
39 0
40 45
41 40
42 30
43 45
44 50
45 35
46 40
47 45
48 60
49 0
50 10
Average 32,8 34,4 34,0 28,9
% Product analysis done informal
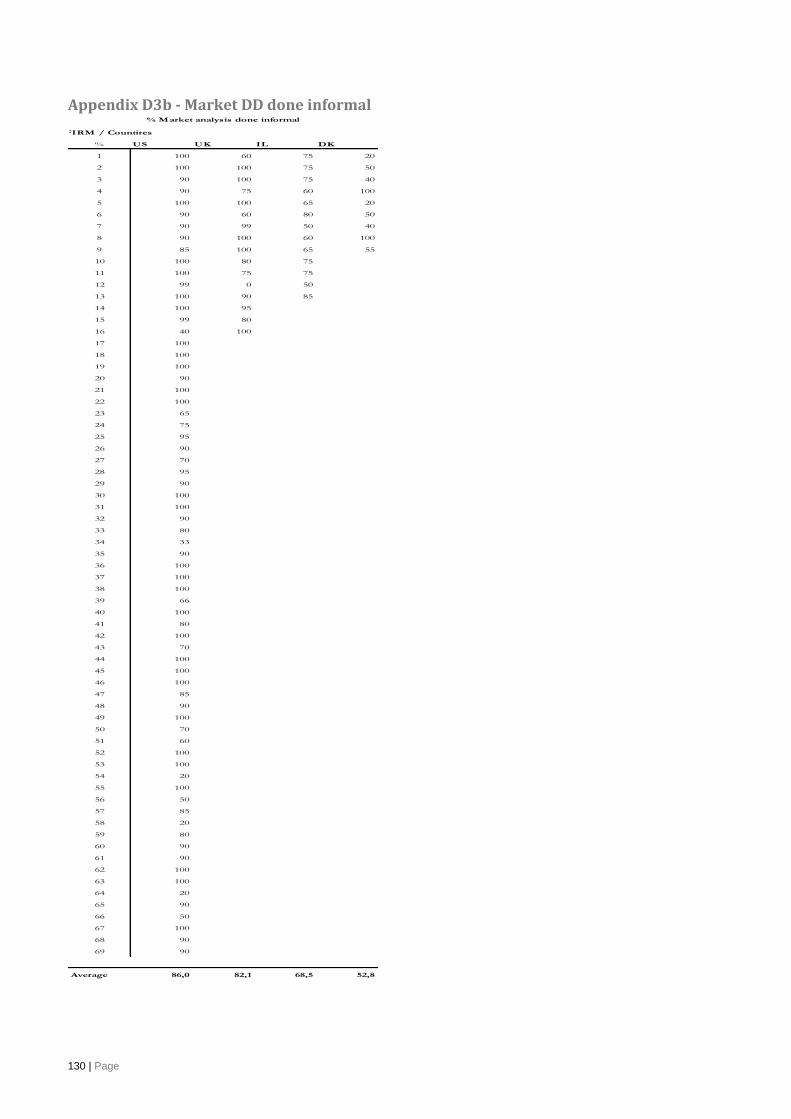
130 | Page
Appendix D3b - Market DD done informal
VC FIRM / Countires
% US UK IL DK
1 100 60 75 20
2 100 100 75 50
3 90 100 75 40
4 90 75 60 100
5 100 100 65 20
6 90 60 80 50
7 90 99 50 40
8 90 100 60 100
9 85 100 65 55
10 100 80 75
11 100 75 75
12 99 0 50
13 100 90 85
14 100 95
15 99 80
16 40 100
17 100
18 100
19 100
20 90
21 100
22 100
23 65
24 75
25 95
26 90
27 70
28 95
29 90
30 100
31 100
32 90
33 80
34 33
35 90
36 100
37 100
38 100
39 66
40 100
41 80
42 100
43 70
44 100
45 100
46 100
47 85
48 90
49 100
50 70
51 60
52 100
53 100
54 20
55 100
56 50
57 85
58 20
59 80
60 90
61 90
62 100
63 100
64 20
65 90
66 50
67 100
68 90
69 90
Average 86,0 82,1 68,5 52,8
% Market analysis done informal
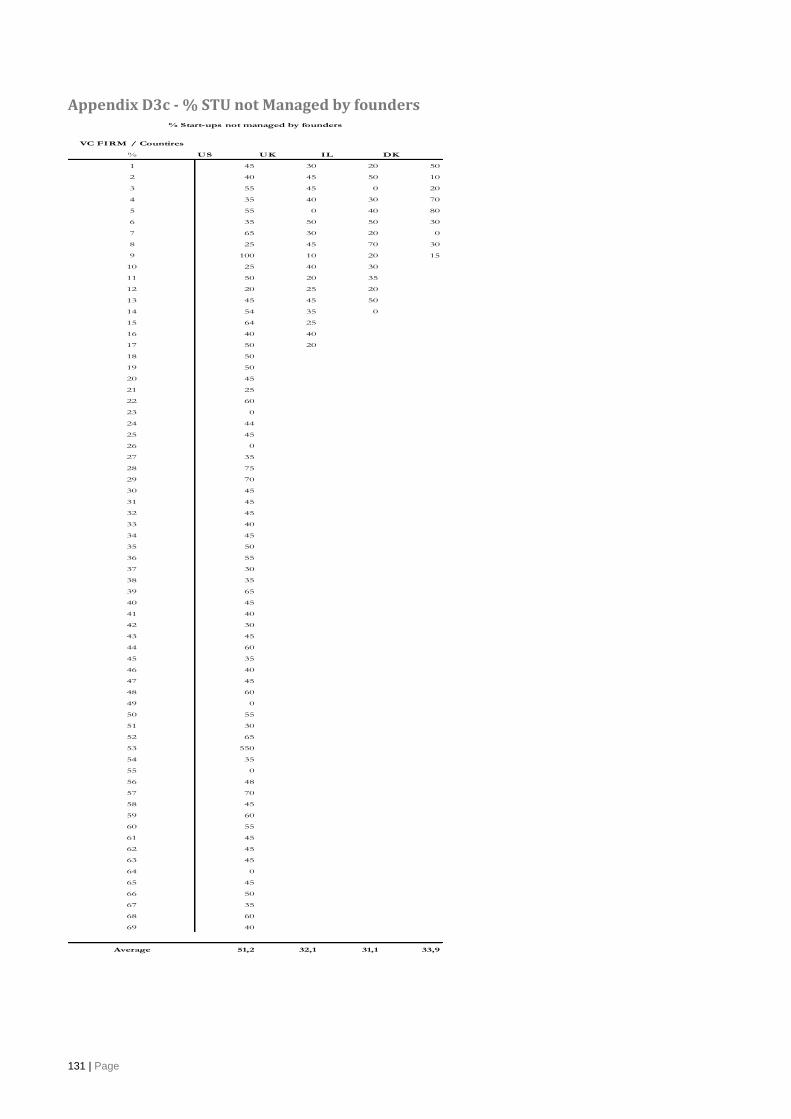
131 | Page
Appendix D3c - % STU not Managed by founders
VC FIRM / Countires
% US UK IL DK
1 45 30 20 50
2 40 45 50 10
3 55 45 0 20
4 35 40 30 70
5 55 0 40 80
6 35 50 50 30
7 65 30 20 0
8 25 45 70 30
9 100 10 20 15
10 25 40 30
11 50 20 35
12 20 25 20
13 45 45 50
14 54 35 0
15 64 25
16 40 40
17 50 20
18 50
19 50
20 45
21 25
22 60
23 0
24 44
25 45
26 0
27 35
28 75
29 70
30 45
31 45
32 45
33 40
34 45
35 50
36 55
37 30
38 35
39 65
40 45
41 40
42 30
43 45
44 60
45 35
46 40
47 45
48 60
49 0
50 55
51 30
52 65
53 550
54 35
55 0
56 48
57 70
58 45
59 60
60 55
61 45
62 45
63 45
64 0
65 45
66 50
67 35
68 60
69 40
Average 51,2 32,1 31,1 33,9
% Start-ups not managed by founders
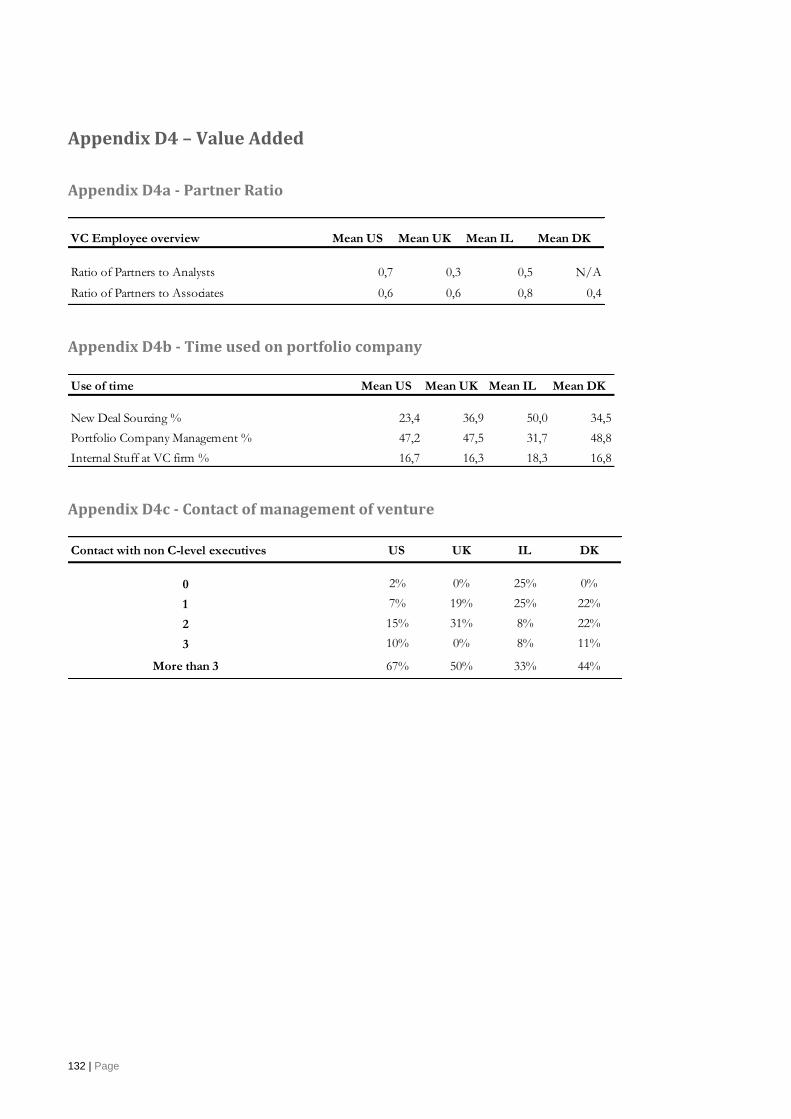
132 | Page
Appendix D4 – Value Added
Appendix D4a - Partner Ratio
Appendix D4b - Time used on portfolio company
Appendix D4c - Contact of management of venture
VC Employee overview Mean US Mean UK Mean IL Mean DK
Ratio of Partners to Analysts 0,7 0,3 0,5 N/A
Ratio of Partners to Associates 0,6 0,6 0,8 0,4
Use of time Mean US Mean UK Mean IL Mean DK
New Deal Sourcing % 23,4 36,9 50,0 34,5
Portfolio Company Management % 47,2 47,5 31,7 48,8
Internal Stuff at VC firm % 16,7 16,3 18,3 16,8
Contact with non C-level executives US UK IL DK
0 2% 0% 25% 0%
1 7% 19% 25% 22%
2 15% 31% 8% 22%
3 10% 0% 8% 11%
More than 3 67% 50% 33% 44%
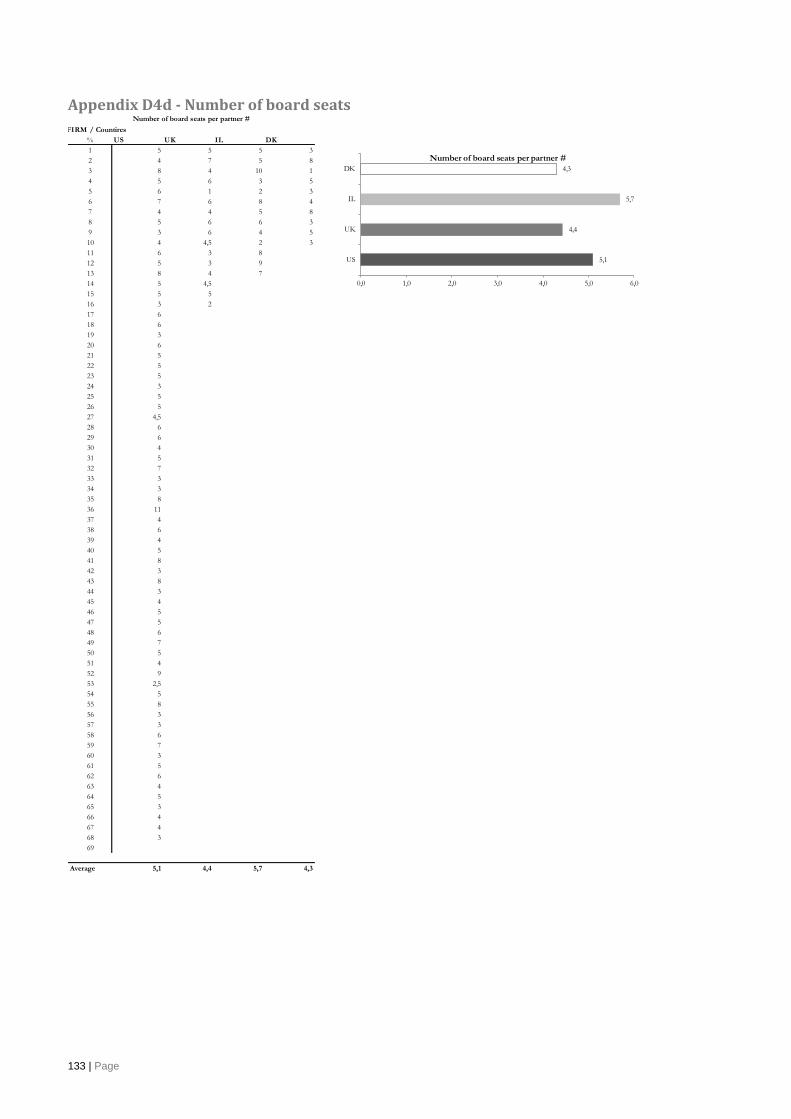
133 | Page
Appendix D4d - Number of board seats
VC FIRM / Countires
% US UK IL DK
1 5 5 5 3
2 4 7 5 8
3 8 4 10 1
4 5 6 3 5
5 6 1 2 3
6 7 6 8 4
7 4 4 5 8
8 5 6 6 3
9 3 6 4 5
10 4 4,5 2 3
11 6 3 8
12 5 3 9
13 8 4 7
14 5 4,5
15 5 5
16 3 2
17 6
18 6
19 3
20 6
21 5
22 5
23 5
24 3
25 5
26 5
27 4,5
28 6
29 6
30 4
31 5
32 7
33 3
34 3
35 8
36 11
37 4
38 6
39 4
40 5
41 8
42 3
43 8
44 3
45 4
46 5
47 5
48 6
49 7
50 5
51 4
52 9
53 2,5
54 5
55 8
56 3
57 3
58 6
59 7
60 3
61 5
62 6
63 4
64 5
65 3
66 4
67 4
68 3
69
Average 5,1 4,4 5,7 4,3
Number of board seats per partner #
5,1
4,4
5,7
4,3
0,0 1,0 2,0 3,0 4,0 5,0 6,0
US
UK
IL
DK
Number of board seats per partner #

134 | Page
Appendix D5 – Exit Strategy
Appendix D5a – Exit Channel
Appendix D5b – Exit on Geography
Exit Strategy US UK IL DK
Founders 1% 0% 3% 23%
VC-Firm 9% 8% 7% 0%
PE-Firm 7% 6% 6% 15%
Large Corp 73% 75% 73% 62%
IPO 10% 11% 10% 0%
Exit Strategy: Geography US UK IL DK
Domestic Partner 95% 60% 30% 55%
Foreign Partner 5% 40% 70% 45%