cross-country report on inflation: selected issues; imf ... · cross-country report on inflation 4...
TRANSCRIPT

© 2015 International Monetary Fund
IMF Country Report No. 15/184
CROSS-COUNTRY REPORT ON INFLATION SELECTED ISSUES This Selected Issues paper on the Czech Republic, the Republic of Poland, Sweden, and Switzerland was prepared by a staff team of the International Monetary Fund as background documentation for the periodic consultations with the Czech Republic, the Republic of Poland, and Sweden. It is based on the information available at the time it was completed on June 22, 2015.
Copies of this report are available to the public from
International Monetary Fund Publication Services PO Box 92780 Washington, D.C. 20090
Telephone: (202) 623-7430 Fax: (202) 623-7201 E-mail: [email protected] Web: http://www.imf.org
Price: $18.00 per printed copy
International Monetary Fund Washington, D.C.
July 2015

CROSS-COUNTRY REPORT ON INFLATION
SELECTED ISSUES
Approved By European Department
Prepared by Nathaniel Arnold, Jiaqian Chen, and
Lone Christiansen, with assistance from Thomas Dowling
and Nhu Nguyen, under the guidance of Helge Berger and
Daria Zakharova (all EUR).
LOW INFLATION IN EUROPEAN INFLATION TARGETERS: CAUSES, SPILLOVERS,
AND POLICY RESPONSES _______________________________________________________________ 3
A. Introduction ___________________________________________________________________________ 3
B. Drivers of Low Inflation: Stylized Facts _________________________________________________ 5
C. A More Structured Approach __________________________________________________________ 9
D. The Policy Response to Inflation so Far _______________________________________________ 21
E. Policy Considerations _________________________________________________________________ 25
F. Conclusion ____________________________________________________________________________ 28
BOX
1. Poland: Disaggregate Model to Assess Indirect and Second-Round Effects ___________ 20
FIGURES
1. Disinflation in Europe __________________________________________________________________ 4
2. Decomposing Headline Inflation _______________________________________________________ 6
3. Real Sector Activity _____________________________________________________________________ 7
4. Nominal Effective Exchange Rates _____________________________________________________ 8
5. Inflation Expectations __________________________________________________________________ 9
6. System of Equations __________________________________________________________________ 11
7. Decomposition of Contributions to Inflation __________________________________________ 12
8. First-Round and Second-Round Effects of External Factors ___________________________ 15
9. Inflation Responses to External Shocks ________________________________________________ 18
10. Inflation Responses to Inflation Expectation Shock __________________________________ 19
REFERENCES ____________________________________________________________________________29
CONTENTS
June 22, 2015

CROSS-COUNTRY REPORT ON INFLATION
2 INTERNATIONAL MONETARY FUND
APPENDICES
I. Data ___________________________________________________________________________________________ 31
II. Main Empirical Methodology and Results _____________________________________________________ 32
III. Disentangling World Oil Supply and Demand Shocks ________________________________________ 37

CROSS-COUNTRY REPORT ON INFLATION
INTERNATIONAL MONETARY FUND 3
LOW INFLATION IN EUROPEAN INFLATION
TARGETERS: CAUSES, SPILLOVERS, AND POLICY
RESPONSES1
This paper takes a fresh look at the causes and drivers of low inflation in European inflation targeting
countries outside the euro area, focusing on the Czech Republic, Poland, Sweden, and Switzerland. It
estimates the effects on inflation from the output gap and external factors, including oil price changes,
nominal effective exchange rate (NEER) fluctuations, and euro area inflation spillovers. The empirical
model disentangles the contribution of direct and indirect first-round effects (e.g., through input-output
linkages), as well as second-round effects working through inflation expectations. We find that external
factors have been significant drivers of low inflation recently, though their contributions to inflation
and the channels through which they operate vary across countries. Policy responses and options are
discussed, taking into account country-specific circumstances.
A. Introduction
1. Global inflation is trending down. Amid
modest global growth, headline inflation was
persistently below 3 percent in G-7 countries,
large parts of Europe, and China during 2013–14.
As of April 2015, headline inflation in the United
States (U.S.) and China had dropped markedly to
-1.1 percent and 1.7 percent, respectively.
2. Inflation in the euro area is particularly
low. This partly reflects still-sizable output gaps
and debt overhangs weighing on growth. Overall,
inflation in the euro area has steadily declined
since late-2011 and stood at around zero percent
in April 2015, following wide-spread disinflation,
with 9 of 19 euro area countries experiencing deflation as of April 2015 (Figure 1).
3. Surprisingly, inflation has also fallen to very low levels in many inflation-targeting
countries outside the euro area. Low euro area inflation would be expected to spill over into
countries pegged to the euro, which Iossifov and Podpiera (2014) show has been the case. However,
in principle, inflation targeters should be able to counter disinflationary effects through monetary
policy. Yet, inflation is also well below goal levels in a number of inflation targeting countries in the
1 We would like to thank Costas Christou, Engin Dalgic, Kevin Fletcher, Davide Furceri, Plamen Iossifov, and
Jiri Podpiera for their very useful comments and discussions.
-4
-2
0
2
4
6
8
10
2006 2007 2008 2009 2010 2011 2012 2013 2014 2015
Japan
U.S.
China
Euro Area
Headline Inflation in Major Economies
(Annual percent change)
Sources: Haver Analytics, national statistical agencies, and IMF
staff calculations.

CROSS-COUNTRY REPORT ON INFLATION
4 INTERNATIONAL MONETARY FUND
region. This paper explores this puzzle, looking in particular at the Czech Republic, Poland, Sweden,
and Switzerland, all of which recorded headline inflation near or below zero by the end of 2014.2
Figure 1. Disinflation in Europe
A number of countries are in deflation in the euro area… …as well as in other European Union (EU) countries.
Countries with euro-pegs have imported disinflation… …but inflation is also weak in inflation targeters.
4. Both domestic and external factors could be contributing to low inflation. Headline
inflation can be broken down into core (headline excluding energy) and non-core inflation.
Domestic factors (in particular the output gap) can affect core inflation, while external shocks—
operating through multiple channels—can feed into both non-core and core components. For
example, a change in the world price of oil can have direct first-round effects by impacting the non-
core component of inflation through fuel prices. However, oil price changes can also have indirect
first-round effects by feeding into core inflation through the input cost channel, such as through
transportation costs and prices. Finally, both external and domestic factors can have second-round
effects, with shocks impacting inflation expectations, which can affect price setting behavior.
2 Inflation in Switzerland has been technically consistent with the Swiss National Bank’s (SNB) definition of price
stability, which is “less than 2 percent” inflation, and the SNB is not a formal inflation targeter. However, the SNB’s
annual reports state that deflation is to be avoided. Hence, in this paper, we assume that the SNB’s de facto target
range is 0–2 percent.
0
2
4
6
8
10
12
14
16
18
Jan-13 Jul-13 Jan-14 Jul-14 Jan-15
Euro Area Countries in Deflation
(Number of countries out of 19)
Sources: Eurostat and IMF staff calculations.
0
1
2
3
4
5
6
7
8
9
Jan-13 Jul-13 Jan-14 Jul-14 Jan-15
Non-Euro Area EU Countries in Deflation
(Number of countries out of 9)
Sources: Eurostat and IMF staff calculations.
-3
-2
-1
0
1
2
3
4
5
6
Jan-12 Jan-13 Jan-14 Jan-15
Bulgaria
Croatia
Lithuania
Euro Area
Inflation in Non-Euro Area European Exchange Rate
Targeters (Percent)
Sources: Haver Analytics and IMF staff calculations.
-2
-1
0
1
2
3
4
5
Jan-12 Jan-13 Jan-14 Jan-15
Czech. Rep.
Poland
Sweden
Switzerland
Euro Area
Inflation in Non-Euro Area European Inflation
Targeters (Percent)
Sources: Haver Analytics and IMF staff calculations.

CROSS-COUNTRY REPORT ON INFLATION
INTERNATIONAL MONETARY FUND 5
5. The analysis points to a prominent role for external factors. The results for the four
countries of interest suggest that domestic output gap dynamics have had a relatively minor role in
explaining recent inflation dynamics, whereas external factors, including oil price changes, exchange
rate movements, and spillovers from low euro area inflation, have had a larger role. This has
occurred not only through direct and indirect first-round effects on inflation, but also through
second-round effects, which may be particularly concerning for monetary policy makers.
6. External shocks may result in a prolonged period of low inflation, which could become
entrenched in inflation expectations. In a tail-risk scenario, unanchored inflation expectations
could result in a downward spiral with increasing real debt burdens, declining corporate and bank
profits, and worsening fiscal balances and debt. In turn, this highlights the importance of the central
bank price stability mandate.
7. Faced with differing economic imbalances and available policy space, countries have
implemented a variety of monetary policy actions to boost inflation. With policy rates near zero
or negative, the Czech Republic and Switzerland turned to exchange rate intervention, while Sweden
recently introduced quantitative easing (QE). Poland, with a policy interest rate at 1.5 percent, still
has space for conventional easing even after substantial interest rate cuts over the last two years.
However, while all the countries have taken measures to help boost inflation, they have so far been
unsuccessful in putting inflation on a clear trajectory toward target. Even where fiscal space is
available, fiscal policy has played a more limited role in the policy response so far. This reflects,
among other things, the fact that unlike in the euro area, low inflation in these countries has
occurred despite relatively robust economic activity (except in the Czech Republic, which
experienced a recession during 2012–13).
8. The paper is organized as follows. We first describe the stylized facts, decomposing
headline inflation into core and non-core components. We then present the analytical framework to
assess the drivers of low inflation and subsequently present the results. Finally, we consider the
specific country experiences and discuss the policy implications of our findings.
B. Drivers of Low Inflation: Stylized Facts
9. The drop in inflation has been broad-based. While some cross-country differences exist,
both core and non-core disinflation has occurred across all of the inflation targeting countries in our
sample (Figure 2). Core inflation’s positive contribution to headline inflation has declined over the
last few years in most of the countries and energy prices have contributed negatively to inflation for
all of them.3 In turn, external drivers appear a key source of disinflationary pressure. More
specifically:
3 Changes in indirect taxes and administered prices have also contributed to changes in our measure of core inflation
in some countries.

CROSS-COUNTRY REPORT ON INFLATION
6 INTERNATIONAL MONETARY FUND
Domestic drivers. Domestic factors currently have a relatively small role in driving inflation.
Output gap. While the exact size of the output gap is subject to uncertainty, estimated
output gaps nonetheless provide an important indicator of domestic drivers of inflation (see
Appendix I). Specifically, output gaps currently remain negative in all four countries but, with
the exception of the Czech Republic, are generally modest (Figure 3). In 2014, when
disinflationary pressures picked up, all four countries experienced relatively robust growth,
with output gaps closing fast. Nonetheless, robust domestic demand has so far failed to lift
subdued core inflation in the face of headwinds from external factors.
Figure 2. Decomposing Headline Inflation1/
1/ Core inflation denotes inflation as measured based on the Harmonized Index of Consumer Prices (HICP), excluding energy prices.
-2
-1
0
1
2
3
4
5
6
7
8
9
2006 2007 2008 2009 2010 2011 2012 2013 2014 2015
Core
Energy
Headline
Czech Republic: Inflation Decomposition
(Percent)
Sources: Eurostat and IMF staff calculations.
-2
-1
0
1
2
3
4
5
2006 2007 2008 2009 2010 2011 2012 2013 2014 2015
Core Energy
Headline
Poland: Inflation Decomposition
(Percent)
Sources: Eurostat and IMF staff calculations.
-1
0
1
2
3
4
5
2006 2007 2008 2009 2010 2011 2012 2013 2014 2015
Core
Energy
Headline
Sweden: Inflation Decomposition
(Percent)
Sources: Eurostat and IMF staff calculations.
-2
-1
0
1
2
3
4
2006 2007 2008 2009 2010 2011 2012 2013 2014 2015
Core
Energy
Headline
Switzerland: Inflation Decomposition
(Percent)
Sources: Eurostat and IMF staff calculations.

CROSS-COUNTRY REPORT ON INFLATION
INTERNATIONAL MONETARY FUND 7
Figure 3. Real Sector Activity
Output gaps are generally modest and set to narrow… …amid robust growth in most of the countries.
External drivers. External factors have been a drag on inflation:
Oil prices. Oil price declines have been an
important driver of domestic non-core
energy price inflation. While commodity
prices were fairly stable during most
of 2013, they declined substantially in the
second half of 2014. Most notably, oil
prices dropped more than 50 percent
between mid-2014 and January 2015,
contributing to lower inflation globally and
in Europe.
Spillovers from the euro area. These can
play a crucial role as well, given tight trade
linkages. Disinflation in the euro area
could be directly imported, as around
60 percent of imports are from the euro
area, with a high share of euro area value
added finally consumed domestically. In
addition, low growth and the relatively
large output gap in the euro area, which
stood at close to 3 percent in 2014, has
contributed to weak external demand.
NEER. Sustained periods of NEER
appreciation can damp imported inflation.
This is particularly relevant for Sweden
and, even more so, Switzerland, which has
seen significant net capital inflows, including recently related to QE in the euro area and
-80
-60
-40
-20
0
20
40
60
80
100
120
2006 2007 2008 2009 2010 2011 2012 2013 2014 2015
Food
Industrial Inputs
Natural Gas
Crude Oil
Commodity Prices
(Annual percent change)
Sources: IMF International Financial Statistics and IMF staff
calculations.
0
10
20
30
40
50
60
70
80
Switzerland Poland Czech Rep. Sweden
Imports from Euro Area, 2014
(Percent of total imports)
Sources: IMF Direction of Trade Statistics and IMF staff
calculations.
-4
-3
-2
-1
0
1
2
2010 2011 2012 2013 2014 2015 2016 2017
Czech Rep.
Poland
Sweden
Switzerland
Output Gap
(Percent of potential GDP)
Sources: IMF World Economic Outlook (WEO), April 2015, and
IMF staff calculations.
-2
-1
0
1
2
3
4
5
6
7
2010 2011 2012 2013 2014 2015 2016 2017
Czech Rep.
Poland
Sweden
Switzerland
Real GDP Growth
(Percent)
Sources: IMF WEO, April 2015, and IMF staff calculations.

CROSS-COUNTRY REPORT ON INFLATION
8 INTERNATIONAL MONETARY FUND
other factors (Figure 4). Conversely, NEER depreciation in the Czech Republic, starting in
late-2013, has helped lift imported inflation. The NEER can be affected by both domestic
(related to monetary policy actions) and external (related to global shocks) factors. We
group the NEER with external drivers of inflation to highlight that external shocks (e.g., “safe-
haven” capital flows during the euro area crisis) were important contributors to exchange
rate fluctuations in the four small open economies we study, particularly in recent years.
Figure 4. Nominal Effective Exchange Rates
-15
-10
-5
0
5
10
15
20
25
Jan-06 Jan-08 Jan-10 Jan-12 Jan-14
Czech Republic: Nominal Effective Exchange Rate
(Year-on-year percent change ; + denotes appreciation)
Sources: Haver Analytics and IMF staff calculations.
-30
-20
-10
0
10
20
Jan-06 Jan-08 Jan-10 Jan-12 Jan-14
Poland: Nominal Effective Exchange Rate
(Year-on-year percent change; + denotes appreciation)
Sources: Haver Analytics and IMF staff calculations.
-20
-15
-10
-5
0
5
10
15
Jan-06 Jan-08 Jan-10 Jan-12 Jan-14
Sweden: Nominal Effective Exchange Rate
(Year-on-year percent change; + denotes appreciation)
Sources: Haver Analytics and IMF staff calculations.
-15
-10
-5
0
5
10
15
20
25
Jan-06 Jan-08 Jan-10 Jan-12 Jan-14
Switzerland: Nominal Effective Exchange Rate
(Year-on-year percent change; + denotes appreciation)
Sources: Haver Analytics and IMF staff calculations.
CROSS-COUNTRY REPORT ON INFLATION
INTERNATIONAL MONETARY FUND 9
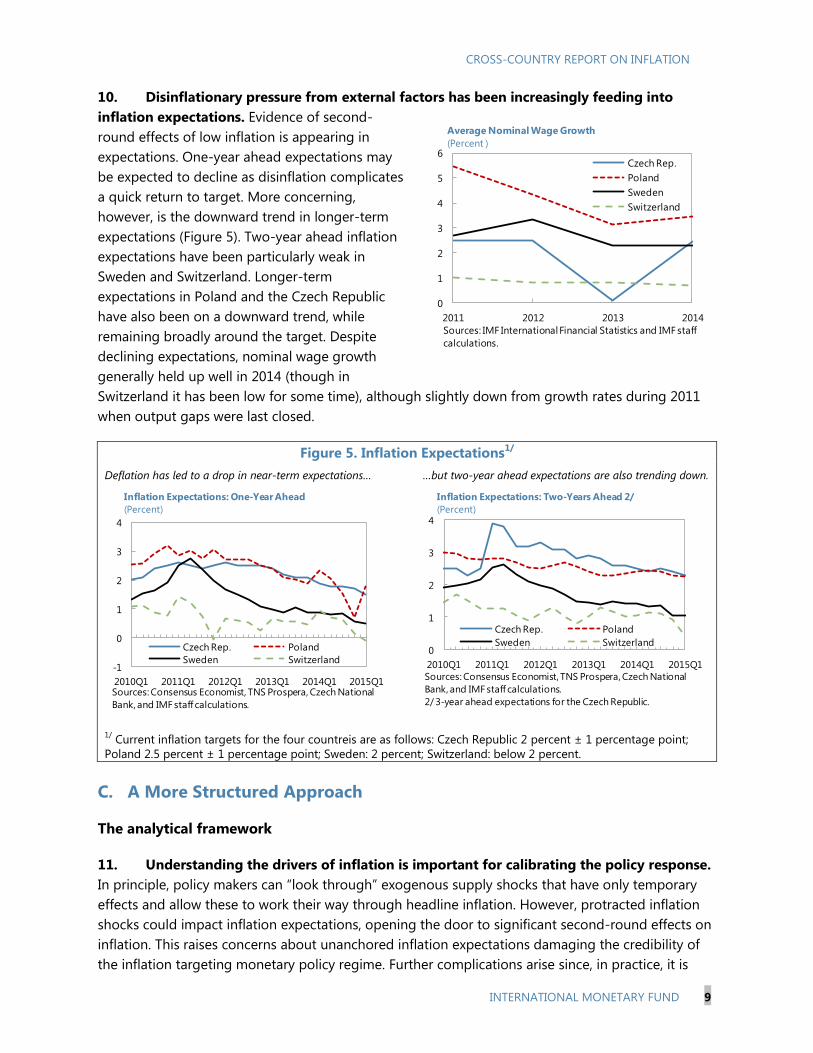
10. Disinflationary pressure from external factors has been increasingly feeding into
inflation expectations. Evidence of second-
round effects of low inflation is appearing in
expectations. One-year ahead expectations may
be expected to decline as disinflation complicates
a quick return to target. More concerning,
however, is the downward trend in longer-term
expectations (Figure 5). Two-year ahead inflation
expectations have been particularly weak in
Sweden and Switzerland. Longer-term
expectations in Poland and the Czech Republic
have also been on a downward trend, while
remaining broadly around the target. Despite
declining expectations, nominal wage growth
generally held up well in 2014 (though in
Switzerland it has been low for some time), although slightly down from growth rates during 2011
when output gaps were last closed.
Figure 5. Inflation Expectations1/
Deflation has led to a drop in near-term expectations… …but two-year ahead expectations are also trending down.
1/
Current inflation targets for the four countreis are as follows: Czech Republic 2 percent ± 1 percentage point;
Poland 2.5 percent ± 1 percentage point; Sweden: 2 percent; Switzerland: below 2 percent.
C. A More Structured Approach
The analytical framework
11. Understanding the drivers of inflation is important for calibrating the policy response.
In principle, policy makers can “look through” exogenous supply shocks that have only temporary
effects and allow these to work their way through headline inflation. However, protracted inflation
shocks could impact inflation expectations, opening the door to significant second-round effects on
inflation. This raises concerns about unanchored inflation expectations damaging the credibility of
the inflation targeting monetary policy regime. Further complications arise since, in practice, it is
-1
0
1
2
3
4
2010Q1 2011Q1 2012Q1 2013Q1 2014Q1 2015Q1
Czech Rep. Poland
Sweden Switzerland
Inflation Expectations: One-Year Ahead
(Percent)
Sources: Consensus Economist, TNS Prospera, Czech National
Bank, and IMF staff calculations.
0
1
2
3
4
2010Q1 2011Q1 2012Q1 2013Q1 2014Q1 2015Q1
Czech Rep. Poland
Sweden Switzerland
Inflation Expectations: Two-Years Ahead 2/
(Percent)
Sources: Consensus Economist, TNS Prospera, Czech National
Bank, and IMF staff calculations.
2/ 3-year ahead expectations for the Czech Republic.
0
1
2
3
4
5
6
2011 2012 2013 2014
Czech Rep.
Poland
Sweden
Switzerland
Average Nominal Wage Growth
(Percent )
Sources: IMF International Financial Statistics and IMF staff
calculations.

CROSS-COUNTRY REPORT ON INFLATION
10 INTERNATIONAL MONETARY FUND
difficult to disentangle temporary from protracted shocks, complicating monetary policy. In addition,
monetary policy in the euro area will have spillovers through its effect on euro area inflation and on
capital flows. For small open economies such as the four we examine here, ample liquidity in the
context of European Central Bank (ECB) QE could result in exchange rate appreciation pressures,
creating a drag on inflation. A number of factors need to be taken into consideration for fiscal policy
too, including fiscal space, monetary policy constraints, and domestic and external balances.
12. The literature offers a number of approaches. A number of papers have aimed at
understanding the main drivers of consumer price inflation (see, for example, Gali and
Gertler (1999)). Some studies have explored the importance of exchange rate changes (Burstein and
Gopinath, 2014). Others have focused more explicitly on the importance of the monetary policy
regime (Gali and Monacelli, 2005). In light of the recent drop in inflation across a number of
countries, the importance of other external factors has become increasingly relevant. Iossifov and
Podpiera (2014) found in a panel setting that in addition to falling commodity prices, recent low
euro area core inflation has spilled over to non-euro area EU countries. Both Mija and others (2013)
and IMF (2015a) highlight signs of second-round effects on inflation.
13. A more structured approach can contribute to further disentangle the various
domestic and external factors driving inflation. While the decomposition of headline inflation in
Section B above suggests that external factors are important drivers of declining core and noncore
inflation, the channels through which this occurs remain to be examined. Our analytical approach
differentiates between domestic and external factors. This is particularly important in light of the
recent flattening of the traditional Phillips curve, pointing to a smaller role of output gaps in
inflation fluctuations (see for example IMF, 2013 and 2015b). In addition, we distinguish direct and
indirect first-round effects of the external factors from their second-round effects (Figure 6).
Separate equations for core and non-core inflation, as well as inflation expectations, allows us to
trace the effects of shocks to oil prices, the NEER, and euro area core inflation through the system.4
Appendix II provides a detailed discussion of the model and its empirical specification that is applied
on a country-by-country basis for sample periods ranging between 12 and 17 years. The approach is
designed to minimize endogeneity issues and facilitates the analysis of global oil price shocks that
tend to impact our sample economies directly, but also through shocks’ (indirect) impact on euro
area core inflation.
4 In the econometric analysis, we define core inflation as headline inflation, excluding energy price inflation. Using
other definitions to explicitly account for food price inflation did not materially alter the results.

CROSS-COUNTRY REPORT ON INFLATION
INTERNATIONAL MONETARY FUND 11
Figure 6. System of Equations1
Empirical results
14. The empirical results suggest that external factors are indeed significant drivers of
inflation.5 Historical decompositions using this approach attribute inflation developments to both
domestic and external factors, but with external factors accounting for the largest contribution
(Figure 7).
Domestic factors. The output gap has impacted inflation in all four countries, though overall its
impact has typically been relatively small.6 In particular, in the run-up to the global financial
crisis, positive output gaps put upward pressure on inflation. More recently, the output gap has
been a dampening factor, reducing inflation by around half a percentage points in all countries,
except Switzerland. In addition, for the Czech Republic and Poland, we account for changes in
administered prices, which have tended to raise inflation. In the case of the Czech Republic, we
also account for the effect of tax changes (indirect and excise taxes mainly), which have
contributed positively to inflation.
External drivers. Oil price changes, euro area core inflation, and NEER fluctuations have
generally had a larger combined impact than the output gap—with oil price changes generally a
major contributor. Spillovers from falling euro area core inflation have also weighed on domestic
5 See Appendix II for detailed regression results. Also, note that while the model provides a relatively good fit for
each of the countries, the “other” categories in Figure 7 collects otherwise unaccounted for domestic and external
shocks to inflation and their persistent impacts.
6 A zero output gap does not imply that inflation would be zero. For example, in a simple New Keynesian model,
inflation would converge to its steady-state level, reflecting, among other things, the central bank’s inflation target.
Note that Figure 7 shows the decomposition of HICP, adjusted for the constants in the regression framework.
π CORE
Output Gap πe
Oil + NEER
Euro area core
NONCORE
1/ Yellow arrow denotes direct first-round efffects of oil price and NEER fluctuations; blue arrows denote
indirect first-round effects of domestic and external factors; and red arrows denote second-round effects of
domestic and external factors.

CROSS-COUNTRY REPORT ON INFLATION
12 INTERNATIONAL MONETARY FUND
inflation during 2013–14, particularly in the Czech Republic, Poland, and Switzerland. For
Sweden and Switzerland, NEER appreciations had sizable negative effects on inflation during the
last few years. In contrast, exchange rate intervention and the introduction of an exchange rate
floor against the euro in the Czech Republic in late 2013 boosted inflation over the past year
(see country case experiences below).
Figure 7. Decomposition of Contributions to Inflation
Czech Republic
(Percentage point contributions)
Sources: Czech National Bank, Consensus Forecasts, Eurostat, Haver Analytics, IMF World Economic Outlook (WEO),
and Fund staff calculations.
Note: HICP inflation is adjusted to account for the constants in the regression framework and any insignificant
external factors (see Appendix II). “Other domestic” are the residuals and base effects from the core and expectations
equations, while “Other external” are the base effects and residuals from the non-core inflation equation.
-5
-3
-1
1
3
5
7
9
2007Q1 2008Q1 2009Q1 2010Q1 2011Q1 2012Q1 2013Q1 2014Q1 2015Q1
Taxes Administered prices
Other external Other domestic
EA Inflation NEER
Oil Output gap
HICP (adjusted)

CROSS-COUNTRY REPORT ON INFLATION
INTERNATIONAL MONETARY FUND 13
Figure 7. Decomposition of Contributions to Inflation (continued)
Poland
(Percentage point contributions)
Sweden
(Percentage point contributions)
Sources: Consensus Forecasts, Eurostat, Haver Analytics, IMF WEO, Sveriges Riksbank, and Fund staff calculations.
Note: HICP inflation is adjusted to account for the constants in the regression framework and any insignificant
external factors (see Appendix II). “Other domestic” are the residuals and base effects from the core and expectations
equations, while “Other external” are the base effects and residuals from the non-core inflation equation.
-3
-2
-1
0
1
2
3
4
5
2007Q1 2008Q1 2009Q1 2010Q1 2011Q1 2012Q1 2013Q1 2014Q1 2015Q1
Administered prices Other external
Other domestic EA Inflation
NEER Oil
Output gap HICP (adjusted)
-2
-1
0
1
2
3
4
2007Q1 2008Q1 2009Q1 2010Q1 2011Q1 2012Q1 2013Q1 2014Q1 2015Q1
Other external Other domestic EA Inflation
NEER Oil Output gap
HICP (adjusted)

CROSS-COUNTRY REPORT ON INFLATION
14 INTERNATIONAL MONETARY FUND
Figure 7. Decomposition of Contributions to Inflation (concluded)
Switzerland
(Percentage point contributions)
Sources: Consensus Forecasts, Eurostat, Haver Analytics, IMF WEO, and Fund staff calculations.
Note: HICP inflation is adjusted to account for the constants in the regression framework and any insignificant
external factors (see Appendix II). “Other domestic” are the residuals and base effects from the core and expectations
equations, while “Other external” are the base effects and residuals from the non-core inflation equation.
15. Indirect and second-round effects have been material. The model also allows us to
decompose the sum of the impacts of external shocks on headline inflation into direct first-round
effects, affecting headline inflation through non-core inflation; indirect first-round effects, affecting
headline inflation through core inflation;7 and second-round effects, affecting core inflation through
inflation expectations (Figure 8). Across all four countries, direct first-round effects (blue bars) from
external factors are similar in terms of direction and timing, largely corresponding to oil price
fluctuations. However, external factors typically have the largest impact through indirect first-round
effects (orange bars). Second-round effects (red bars) tend to be smaller, but are non-negligible in
most cases. In particular, while the contribution of second-round effects to inflation has been
positive in the past, it has recently declined in most of the countries, turning negative in the
Czech Republic and Sweden.
7 While imported final goods in the core inflation basket would also have a direct effect, we do not disentangle this
effect from the effect of shocks that have indirect effects, such as oil price inflation affecting transportation costs.
-3
-2
-1
0
1
2
3
4
2007Q1 2008Q1 2009Q1 2010Q1 2011Q1 2012Q1 2013Q1 2014Q1 2015Q1
Other external Other domestic
EA Inflation NEER
Oil Output gap
HICP (adjusted)

CROSS-COUNTRY REPORT ON INFLATION
INTERNATIONAL MONETARY FUND 15
Figure 8. First-Round and Second-Round Effects of External Factors
Czech Republic
(Percentage point contributions)
Poland
(Percentage point contributions)
Sources: Czech National Bank, Consensus Forecasts, Eurostat, Haver Analytics, IMF WEO, and Fund staff calculations.
Note: The direct and indirect first-round effects and second-round effects of all three external factors (i.e., oil price
changes, euro area core inflation, and NEER fluctuations) are summed to get the aggregate contribution of external
factors through each effect.
-1.5
-1.0
-0.5
0.0
0.5
1.0
1.5
2007Q1 2008Q1 2009Q1 2010Q1 2011Q1 2012Q1 2013Q1 2014Q1 2015Q1
Direct first-round
Indirect first-round
Second-round
-2.0
-1.5
-1.0
-0.5
0.0
0.5
1.0
1.5
2.0
2.5
3.0
2007Q1 2008Q1 2009Q1 2010Q1 2011Q1 2012Q1 2013Q1 2014Q1 2015Q1
Direct first-round
Indirect first-round
Second-round

CROSS-COUNTRY REPORT ON INFLATION
16 INTERNATIONAL MONETARY FUND
Figure 8. First-Round and Second-Round Effects of External Factors (concluded)
Sweden
(Percentage point contributions)
Switzerland
(Percentage point contributions)
Sources: Consensus Forecasts, Eurostat, Haver Analytics, IMF WEO, Sveriges Riksbank, and Fund staff calculations.
Note: The direct and indirect first-round effects and second-round effects of all three external factors (i.e., oil price
changes, euro area core inflation, and NEER fluctuations) are summed to get the aggregate contribution of external
factors through each effect.
-1.5
-1.0
-0.5
0.0
0.5
1.0
1.5
2007Q1 2008Q1 2009Q1 2010Q1 2011Q1 2012Q1 2013Q1 2014Q1 2015Q1
Direct first-round
Indirect first-round
Second-round
-2.0
-1.5
-1.0
-0.5
0.0
0.5
1.0
1.5
2.0
2.5
2007Q1 2008Q1 2009Q1 2010Q1 2011Q1 2012Q1 2013Q1 2014Q1 2015Q1
Direct first-round
Indirect first-round
Second-round

CROSS-COUNTRY REPORT ON INFLATION
INTERNATIONAL MONETARY FUND 17
16. The effects of external shocks can be sizable and persistent. Moving beyond historical
decompositions, the model can also be used to illustrate how future shocks to external factors
would impact headline inflation. In addition to informing policymakers about what could be, this
exercise is also helpful to understand the degree of persistence of shocks’ effects on inflation.
Indeed, the impulse responses of inflation to external shocks illustrate that even short-lasting shocks
may continue to impact headline inflation for several years (Figure 9).
Oil price shock. The first panel in Figure 9 illustrates the impact of a 10 percentage point drop
in the oil price in period 1. For all four countries, the peak impact occurs at the time of the
shock, though the size of the impact differs across countries, with the Czech Republic and
Switzerland experiencing the largest impact. The impact of the shock fades relatively quickly,
diminishing to half its initial size after 1 to 3 quarters.
Euro area core inflation shock. We construct the euro area core inflation shock as a
-0.5 percentage point persistent shock. That is, euro area core inflation does not revert
immediately back to the baseline in the following quarter.8 Thus, a euro area core inflation shock
has a very persistent impact on inflation in all four countries. The impact is largest in the
Czech Republic and Poland, with the effect of the shock peaking at around -0.3 to
-0.4 percentage points after 5 quarters. This is consistent with these countries’ close integration
with the euro area (in particular Germany). In Switzerland the impact is smaller, around
-0.15 percentage points, and peaks after 6 quarters. Sweden experiences the smallest impact
from the shock, peaking at -0.07 percentage points, but is particularly persistent with the peak
occurring after 12 quarters.
NEER shock. The third panel in Figure 9 shows the impulse responses to a 5 percentage point
appreciation in the NEER in period 1. As with the oil shock, the peak impact occurs in the quarter
of the shock but the effect is more persistent. It generally takes 3 to 5 quarters for the effect to
decline to half its initial impact. Inflation in the Czech Republic is the most responsive to the
NEER shock, falling more than 0.4 percentage points at peak, whereas the peak impact reaches
around -0.2 percentage points in the other countries. The Czech Republic’s responsiveness to a
NEER shock is likely due to imports accounting for a substantial share of consumption.
17. Second-round effects can have long-lasting impacts. The model also allows us to
examine the impact on headline inflation of a shock to inflation expectations no matter its source.
The peak impact of a 1 percentage point negative shock to inflation expectations varies across
countries. The largest peak responses occur for Poland and Switzerland (Figure 10). However, in all
cases the impact is relatively persistent (though less so for the Czech Republic and more so for
Sweden), with inflation still below the baseline after 12 quarters. In turn, these sizable and persistent
effects emphasize the importance of well-anchored inflation expectations and that monetary
policymakers should be vigilant that shocks’ effects do not become entrenched in expectations.
8 The euro area shock decays over time according to the coefficient on the lagged euro area core inflation in the
euro area core equation described in Appendix II (equation (7)).

CROSS-COUNTRY REPORT ON INFLATION
18 INTERNATIONAL MONETARY FUND
Figure 9. Inflation Responses to External Shocks
Source: IMF staff calculations.
-0.30
-0.25
-0.20
-0.15
-0.10
-0.05
0.00
0 2 4 6 8 10 12 14 16 18 20 22 24
Czech Rep.
Poland
Sweden
Switzerland
Note: Impulse response of headline inflation to a -10 percentage point drop in oil
price inflation in quarter t=1.
Inflation Responses to Oil Shock
(Percentage points)
-0.45
-0.40
-0.35
-0.30
-0.25
-0.20
-0.15
-0.10
-0.05
0.00
0 2 4 6 8 10 12 14 16 18 20 22 24
Czech Rep.
Poland
Sweden
Switzerland
Note: Impulse response of headline inflation to -0.5 percentage point drop in
euro area core inflation in quarter t=1.
Inflation Responses to Euro Area Core Inflation Shock
(Percentage points)
-0.50
-0.45
-0.40
-0.35
-0.30
-0.25
-0.20
-0.15
-0.10
-0.05
0.00
0 2 4 6 8 10 12 14 16 18 20 22 24
Czech Rep.
Poland
Sweden
Switzerland
Note: Impulse response of headline inflation to a 5 percentage point NEER
appreciation in quarter t=1.
Inflation Responses to NEER Shock
(Percentage points)

CROSS-COUNTRY REPORT ON INFLATION
INTERNATIONAL MONETARY FUND 19
Figure 10. Inflation Responses to Inflation Expectation Shock1/
(Percentage points)
-0.4
-0.3
-0.2
-0.1
0.0
1 3 5 7 9 11 13 15 17 19 21 23
Czech Rep.
Poland
Sweden
Switzerland
Source: IMF staff calculations.
1/ Impulse response from a 1 percentage point drop in inflation expectations.

CROSS-COUNTRY REPORT ON INFLATION
20 INTERNATIONAL MONETARY FUND
Box 1. Poland: Disaggregate Model to Assess Indirect and Second-Round Effects
A disaggregate model of inflation serves as a robustness check for assessing combined indirect and
second-round effects. The disaggregate model follows the setup in Leon (2012) and Christiansen and
Ebeke (2015) and takes into account the granular information contained in the subcomponents forming the
consumer price index (CPI). In particular, it allows domestic and external shocks to affect producer prices
and, subsequently, feed into a number of components of headline CPI, which interact with each other. In
turn, combined first-round indirect and second-round effects are captured as the difference between the full
effect of shocks on CPI inflation and the portion of the CPI inflation response, which excludes feedback
effects between components of CPI. The details of the model are described in Christiansen and Ebeke (2015).
The disaggregate model points to significant indirect and second-round effects in Poland.
Commodity price shock. About 20 percent of the effect from a cumulative 63 percentage points
decline in oil and coal price inflation over 7 months is accounted for by indirect and second-round
effects. These are persistent, representing more than 40 percent of the impact on CPI inflation after
18 months.
Euro area inflation shock. After 9 months, about 20 percent of a protracted cumulative 2 percentage
points decline in euro area inflation (lasting a total of 18 months) is accounted for by indirect and
second-round effects. After 18 months, these effects account for more than 25 percent of the change in
CPI inflation.
These results are in line with the main results in this paper. Consistent with the results using the
Seemingly Unrelated Regressions (SUR) approach, the combined effects of indirect first-round and second-
round effects can be substantial and have persistent effects on headline inflation. The recently observed
declines in oil prices as well as protracted disinflation in the euro area would therefore likely continue to
affect headline inflation for months to come.
-20
0
20
40
60
-0.4
-0.3
-0.2
-0.1
0.0
1 3 5 7 9 11 13 15 17 19 21
Indirect and second-round effects (percent of the
shock, RHS)Effect (with indirect and second-round effects)
Effect (without indirect and second-round effects)
Effect on CPI Inflation of Protracted 9 Percentage Point
Decline in Oil and Coal Price Inflation (Percentage points)
Source: IMF staff calculations.
Effect on CPI inflation relative to the baseline
The shock occurs at t=1 and lasts seven months0
5
10
15
20
25
30
-0.20
-0.15
-0.10
-0.05
0.00
1 3 5 7 9 11 13 15 17 19 21
Indirect and second-round effects (percent of the
shock, RHS)Effect (with indirect and second-round effects)
Effect (without indirect and second-round effects)
Effect on CPI Inflation of Protracted 0.1 Percentage Point
Decline in Euro Area Inflation (Percentage points)
Source: IMF staff calculations.
Effect on CPI inflation relative to the baseline
The shock occurs at t=1 and continues
throughout the horizon

CROSS-COUNTRY REPORT ON INFLATION
INTERNATIONAL MONETARY FUND 21
D. The Policy Response to Inflation so Far
18. While policy responses have differed,
all countries took monetary measures to boost
inflation. Policymakers are generally concerned
about guiding inflation back to target to avoid
inflation expectations becoming unanchored.
While Poland has monetary policy space to
continue conventional monetary easing, the other
countries face more constraints. After running out
of conventional monetary policy space, Sweden
pushed its policy rate into negative territory and
initiated a QE program. In contrast, given concerns
about the effectiveness of QE in the
Czech Republic and Switzerland, unconventional
measures involving the foreign exchange market were implemented after policy rates hit the zero
lower bound. Common to all of them, however, is that headline inflation is projected to remain low
for a prolonged period. In what follows, we discuss in more detail the countries’ experiences so far.
Poland: Conventional monetary policy space available
19. Substantial monetary policy easing
helped reinvigorate growth but disinflation
continued. Along with weakening growth in 2012,
declining inflation led to cumulative rate cuts of
225 basis points to 2.5 percent between
November 2012 and July 2013. Subsequently,
growth strengthened to 3.4 percent in 2014.
However, inflation continued to diverge from its
target (2.5 percent ±1 percentage point), turning
into deflation in July 2014. A second round of
monetary easing was implemented, with the policy
rate declining to 1.5 percent in March 2015. At the
same time, and despite weak inflation
expectations and an appreciating zloty, the Monetary Policy Council announced the end of the
easing cycle. Paying due attention to growth, gradual fiscal consolidation in 2014 was geared toward
putting the deficit on a path to exit the EU’s Excessive Deficit Procedure. Alongside, macroprudential
policies have been gradually strengthened, including by lowering loan-to-value (LTV) limits, and
work is underway to establish a formal macroprudential body.
Sweden: Turning to QE
20. With inflation falling and below target, Swedish monetary policy turned increasingly
expansionary despite concerns about macro-financial stability risks. In a number of steps, the
Riksbank reduced its policy rate starting in December 2011 and provided forward guidance by
3.9
4.0
4.1
4.2
4.3
4.4
0
1
2
3
4
5
Jan-12 Jan-13 Jan-14 Jan-15
Policy rate
Exchange rate (rhs)
Poland: Policy Rate and Exchange Rate
(LFS: Percent ; RHS: zloty per euro, zloty depreciation=+)
Sources: Haver Analytics and IMF staff calculations.
-2
-1
0
1
2
3
4
5
2010 2011 2012 2013 2014 2015 2016 2017
Czech Rep.
Poland
Sweden
Switzerland
Inflation Projections
(Percent)
Sources: IMF WEO, April 2015, and IMF staff calculations.

CROSS-COUNTRY REPORT ON INFLATION
22 INTERNATIONAL MONETARY FUND
lowering the repo rate forecast on several occasions. In mid-2014, with headline deflation and
medium-term inflation expectations drifting below the 2 percent target, it accelerated its cuts,
reaching the zero lower bound in October 2014. This came despite continued concerns about high
household debt and strong house price growth. These have continued rising despite the
introduction of several macroprudential policy measures, including an LTV ratio cap and minimum
risk weights on mortgages. Fiscal policy remained mildly expansionary throughout this period.
21. Recently, the Riksbank has cut the policy rate below zero and engaged in domestic QE.
By March 2015, it had reduced the policy rate to -0.25 percent. The QE program, first introduced at a
small scale, has since been increased to about 80–90 billion Swedish kronor, equivalent to the
expected issuance of krona-denominated central government bonds in 2015. In addition, the
Riksbank has communicated that it has a range of further policy options, noting that foreign
exchange (FX) interventions could be part of its policy toolkit should other domestic measures not
succeed in lifting inflation. The initial evidence suggests that QE has been successful in impacting
interest rates across maturities, broadly in line with the experiences in other countries that have
conducted QE programs. Longer-term inflation expectations have begun to reverse their decline,
rising closer to the 2 percent inflation target in March. The impact on the exchange rate has been
more limited. After strengthening as the ECB announced and then implemented QE in the euro area,
the krona/euro rate weakened slightly in reaction to the Riksbank’s most recent expansionary
moves.
Czech Republic: One-time exchange rate intervention and exchange rate floor
22. Low inflation first prompted conventional monetary easing. Amid declining inflation,
limited signs of asset price bubbles, and strengthening net capital inflows, a monetary policy easing
cycle started in mid-2012. Through three interest rate cuts, the policy rate reached a low of
0.05 percent before the end of the year. However, disinflation continued, and inflation has been
below the lower end of the target band (2 percent ±1 percentage point) throughout 2014.
Nonetheless, three-year ahead inflation expectations remain well anchored at above 2 percent.
175
180
185
190
195
2009 2010 2011 2012 2013 2014
Debt (incl. tenant-owner
associations)
Sweden: Household Indebtedness
(Percent of disposable income, end point=2014Q4)
Sources: SEB, Sveriges Riksbank, Statistics Sweden, and IMF
staff calculations.
8.0
8.2
8.4
8.6
8.8
9.0
9.2
9.4
9.6
-0.5
0.0
0.5
1.0
1.5
2.0
2.5
2012 2013 2014 2015
Repo Rate
Exchange rate (rhs)
Sources: Haver Analytics, Sveriges Riksbank and IMF staff
calculations.
Sweden: Policy Rate and Exchange Rate
(LHS: Percent; RHS: krona per euro, depreciation=+)

CROSS-COUNTRY REPORT ON INFLATION
INTERNATIONAL MONETARY FUND 23
23. Further attempts to lift inflation
consisted of more unconventional measures.
With the main policy rate near zero, the
authorities faced limited room for further interest
rate cuts. In addition, they assessed that already
low long-term rates and a liquid banking system
would likely render QE using domestic assets
ineffective. Instead, the Czech Republic, as a small
open economy, would be expected to experience
significant pass-through to inflation from a
depreciation of the exchange rate. An exchange
rate floor at 27 koruny per euro was implemented
in November 2013, backed by foreign exchange
intervention, which led to a 6 percent depreciation of the koruna, to help lift inflation. Financial
markets promptly internalized the change, and the exchange rate remained at a depreciated level
slightly beyond what was warranted by the floor, despite no further interventions in the foreign
exchange market. The fiscal stance was also relaxed by about 1 percent of GDP in 2014, likely
contributing to the pick-up in growth. In addition, the macroprudential framework was
strengthened, including by elevating financial stability to a policy objective in the Czech National
Bank law and through regular meetings on financial stability.
24. These unconventional measures showed initial signs of success. The exchange rate
depreciation had the expected pass-through to tradables prices, which helped support inflation.
Year-on-year inflation in the fall of 2014 climbed to 0.7 percent, just marginally below the lower end
of the inflation tolerance band. However, the sharp decline in oil prices during the second half
of 2014 and declining euro area core inflation has fed through to headline inflation, pulling inflation
back to around zero.
Switzerland: Substantial exchange rate interventions before exiting from the floor
25. To limit franc appreciation and its impact on inflation, an exchange rate floor was
introduced. During the first three quarters of 2011, strong capital inflows resulted in a substantial
appreciation of the Swiss franc (CHF) against the euro and lowered imported inflation.
Notwithstanding concerns about risks related to rising house prices and household debt, the SNB
cut its policy rate to zero in 2011 to stem appreciation pressures and help lift imported inflation.
However, as appreciation continued, a floor of CHF1.20 per euro was implemented in
September 2011. Though headline inflation was still close to or below zero after the floor was
introduced, the decomposition in Figure 7 suggests inflation probably would have been even lower
in the absence of the exchange rate floor.
22
23
24
25
26
27
28
29
0.0
0.2
0.4
0.6
0.8
1.0
1.2
2010 2011 2012 2013 2014 2015
Policy rate
Exchange rate (rhs)
Source: Haver Analytics and IMF staff calculations.
Exchange rate
floor as of
Nov. 2013
Czech Republic: Policy Rate and Exchange Rate
(LHS: Percent; RHS: koruny per euro, depreciation=+)

CROSS-COUNTRY REPORT ON INFLATION
24 INTERNATIONAL MONETARY FUND
26. However, faced with increasing divergences between monetary policies of major
currency areas, the SNB concluded that the exchange rate floor was no longer sustainable.
While the floor was effective in stemming further appreciation, substantial exchange rate pressure in
late 2014 prompted renewed interventions at a rapid pace. As a result, the size of the SNB’s balance
sheet expanded substantially, approaching 90 percent of GDP. In addition, the SNB was concerned
that, once the magnitude of its interventions became public, speculation about exit from the floor
would mount, fueling a vicious cycle of rising inflows and a rapidly growing balance sheet
(IMF, 2015c). In turn, the SNB made a surprise move to exit from the exchange rate floor on
January 15, 2015 and lowered the deposit rate to -0.75 percent.9 Even as rates have moved into
negative territory, macroprudential policies introduced over the last few years to limit housing-
related risks, including minimum down payment and amortization requirements, appear to be
having some effect. Meanwhile, Switzerland’s fiscal rule has helped it maintain low deficits and debt,
requiring the federal government budget to be in structural balance ex ante and that any ex post
overruns be made up by running structural surpluses.
27. The exit from the exchange rate floor led to a sharp appreciation, with potentially
adverse effects on growth and inflation. By April 2015, the real effective exchange rate (REER) had
appreciated by about 10 percent relative to its average level in 2014. The appreciated level of the
exchange rate could result in new challenges for both growth and inflation by further worsening
competitiveness and deepening near-term deflation. In fact, two-year ahead inflation expectations
have dropped considerably (by 0.8 percentage points to 0.4 percent) since the exit from the
exchange rate floor. The impulse response of inflation to an expectations shock (shown above)
suggests this could reduce headline inflation by as much as 0.25 percentage points this year (see
Figure 10).
9 This interest rate applies only on deposits at the SNB in excess of a certain threshold. For domestic banks, this
threshold is set at twenty times required reserves as of November 2014 minus any increase in cash held since then.
150
160
170
180
190
2000 2002 2004 2006 2008 2010 2012
Switzerland: Household Debt
(Percent of gross disposable income)
Sources: Swiss National Bank and Haver Analytics.
0.9
1.0
1.1
1.2
1.3
1.4
1.5
1.6
1.7
-1.5
-1.0
-0.5
0.0
0.5
1.0
1.5
2009 2010 2011 2012 2013 2014 2015
3M LIBOR target range
(upper and lower limit)
Exchange rate (rhs)
Sources: Bloomberg and IMF staff calculations.
Exchange rate floor
from Sept. 2011 to
Jan. 2015
Switzerland: Interest Rate Range and Exchange Rate
(LHS: Percent; RHS: franc per euro, depreciation=+)

CROSS-COUNTRY REPORT ON INFLATION
INTERNATIONAL MONETARY FUND 25
E. Policy Considerations
28. External shocks can trigger a prolonged period of low inflation. The empirical evidence
points to significant and long-lasting effects on headline inflation from external shocks, whereas
domestic factors are currently somewhat less important, in particular for Poland and Sweden where
output gaps are estimated to be rapidly narrowing. These effects have occurred through direct and
indirect first-round effects, as well as second-round effects working through inflation expectations.
Considering the recent commodity price declines and the lags with which these translate into
headline inflation, inflation would likely remain below target for a protracted period in the absence
of shocks in the opposite direction that would push up inflation.
29. Persistent bouts of disinflation can be problematic. While temporary shocks, such as a
fall in oil prices that lowers inflation, may not be problematic, longer periods of very low inflation
can have deleterious effects. Importantly, such periods could lead to inflation expectations
becoming unanchored, which would undermine the credibility and efficacy of monetary policy.
Indeed, a period of protracted disinflation can raise the risk of a deflationary spiral. In addition, very
low inflation, once embedded in inflation expectations, can complicate real wage adjustment in the
presence of nominal wage rigidities and increase the real value of debt, which might trigger
deleveraging or make it more severe. Just as low inflation may worsen tax revenue and complicate
fiscal adjustment, very low inflation can also complicate monetary policy by making it more difficult
to reduce real interest rates as necessary in response to shocks.
30. This suggests that monetary policy should continue to ensure that prolonged low
inflation does not become entrenched in inflation expectations. As noted above, it can be
difficult to distinguish in real time between shocks with temporary effects on headline inflation and
more protracted shocks, which could impact inflation expectations. Inflation expectations have been
declining in the four countries we examine, and our analysis suggests that second-round effects
from external shocks could impact inflation going forward.
31. The specific monetary policy response will depend on country-specific circumstances.
Countries differ in their available conventional monetary policy space, as well as their existing
macroprudential frameworks to limit financial stability risks. In addition, the need to stimulate the
real economy may vary, with impacts on the output gap and inflation complicated by monetary
policy transmission lags. Fiscal policy can also play a role in supporting the real economy and lifting
inflation. Nonetheless, challenges may arise owing to asynchronous monetary policies among major
central banks, which could subject small open economies to sudden capital flow movements.
Conventional monetary policy. Countries with sufficient conventional monetary policy space
(e.g., Poland) can utilize this space to further reduce policy interest rates if headline inflation
continues to diverge from the target band. The decision on whether to further ease monetary
policy would need to be data-driven and should take into account developments in consumer
and producer price inflation, inflation expectations, credit growth, wages, and the exchange rate.
Negative nominal policy rate (NNPR). Once conventional monetary space is exhausted,
countries may opt to introduce NNPR as recently done in Sweden and Switzerland. However,

CROSS-COUNTRY REPORT ON INFLATION
26 INTERNATIONAL MONETARY FUND
economic effects of NNRPs would need to be carefully monitored, including by paying close
attention to the evolution of deposits, bank interest margins, profitability, capital flows, and
asset prices. For example, at some point NNPRs can introduce distortions such as (i) reduced
financial intermediation and weakened monetary transmission if economic agents move into
cash, which could diminish the deposit base, or (ii) excessive risk-taking by financial institutions
to increase returns in a low interest-rate environment. In turn, this underscores the importance
of an effective macroprudential framework.
Quantitative easing (QE). Countries that have exhausted conventional monetary policy space
also have the option of introducing QE, provided that they have a sufficient domestic asset base
to launch a credible asset purchase program. In Switzerland, the small outstanding stock of
federal government bonds (12 percent of GDP) and already low yields on domestic assets
factored into the SNB’s monetary policy deliberations. Similarly, in the Czech Republic, where the
stock of central government bonds amounts to 30 percent of GDP, the efficient implementation
of domestic QE was expected to be hampered by already low bond yields and ample liquidity.
Even in Sweden, where government debt is about 40 percent of GDP, the QE purchases
announced so far are relatively small (around 2 percent of GDP), compared to QE programs in
other major economies (e.g., the U.S. and Japan). The purchase of other domestic assets is
possible, but the potential financial stability risks need to be weighed. Targeted credit support
for firms could also be considered.
FX interventions or external QE (QEE). When conventional and other unconventional policy
options have been exhausted or are deemed ineffective, consideration could be given to
deploying QEE. However, the decision to deploy QEE is subject to a higher threshold than, for
example, QE because it has a direct impact on the exchange rate. Whenever QEE is undertaken,
this should be well-integrated into the inflation targeting framework, where relevant, done in the
context of an appropriate policy mix, linked to a clear domestic objective, and the initial external
position should not be substantially stronger than implied by the fundamentals. In addition, a
well communicated and clear exit strategy would help facilitate a smooth exit from the policy,
especially where implemented via a temporary exchange rate floor or ceiling. In cases where
policies may have spillovers of systemic importance, consideration should be given, including in
discussions with the Fund, to alternative policies that can yield similar results for the country
while minimizing potential negative spillovers.
Switzerland: The recent sharp exchange rate appreciation is expected to slow growth and
has likely left the exchange rate overvalued. In this context, monetary easing via foreign
asset purchases (given limited options for other methods of monetary easing) could help
limit the near-term growth slowdown, reduce risks of inflation expectations becoming
anchored at low levels (core inflation is very low at –½ percent, and 10-year bond yields are
near zero), and lessen franc overvaluation. On this basis, staff recently recommended that
Switzerland consider pre-announced QEE purchases, to be continued until inflation rises to
safer levels.
Czech Republic: With exchange rate depreciation expected to have a rapid pass-through to
tradable prices and headline inflation, the Czech Republic has introduced an exchange rate

CROSS-COUNTRY REPORT ON INFLATION
INTERNATIONAL MONETARY FUND 27
floor as a tool within its inflation targeting framework. Staff has supported the move, while
emphasizing that a return to a floating exchange rate once deflation risks recede—and the
inflation forecast and inflation expectations, as well as wage developments, become
entrenched around the central bank’s target—would be appropriate.
Where low interest rates exacerbate financial stability risks, macroprudential policies are
critical. When monetary policy goes to extremes to raise low inflation, there is a risk of rapid
credit growth and housing or other asset price bubbles (e.g., Sweden and Switzerland). In such
cases, the timely adoption of appropriate macroprudential policies is essential. In Switzerland,
various prudential measures undertaken over the last three years, aimed at reducing housing-
related risks, have helped slow house price and mortgage growth, though these effects are still
tentative and partial. Sweden has also introduced several macroprudential measures but the
housing market and household borrowing have not slowed appreciably yet. It remains to be
seen whether the proposed amortization requirement, if implemented, will have a more
noticeable impact. Even in cases where domestic financial imbalances or asset price booms are
not an immediate concern, such as in the Czech Republic and Poland, it is important to develop a
comprehensive macroprudential policy framework to guard against financial stability risks that
could eventually arise.
Fiscal policy could also play a role. Expansionary fiscal policy can help to close a negative
output gap and lift inflation. However, the desirability of this approach will depend on a number
of factors, including the degree of fiscal space (including constraints from fiscal rules), the
valuation of the exchange rate (as fiscal easing may worsen external imbalances), and the size of
fiscal multipliers (which may be modest in small, open economies). In principle, monetary and
fiscal policy measures could be coordinated—for example, the central bank could buy
government debt issued to finance a one-off tax cut—to try and boost inflation. However, such
coordination might be difficult to achieve in practice and could undermine the independence of
the central bank. Tradeoffs may be further complicated in cases where inflation is low, but the
output gap is closed. In cases where a more expansionary fiscal policy is appropriate, measures
to bring forward or increase necessary public investment can help boost demand in the short-
term and raise potential growth over the medium-term.
Policies may also need to take into account capital flows. In particular, positive interest rate
differentials vis-à-vis peer economies could result in speculative capital inflows, which are
subject to sudden stops or reversals. For example, monetary and quantitative easing in the euro
area could prompt short-run capital inflows in non-euro area economies, appreciating the
exchange rate and further complicating reaching the inflation objective in the short run. To the
extent that these capital flows are rooted in short-term search for yields, the effects on domestic
asset prices could create substantial financial stability risks, including the risk of sudden
outflows. Countries have a number of policy options for managing capital flows, including
conventional monetary policy and exchange rate interventions, with the appropriate response
depending on country-specific circumstances (IMF, 2012).

CROSS-COUNTRY REPORT ON INFLATION
28 INTERNATIONAL MONETARY FUND
F. Conclusion
32. External factors have been important drivers of low inflation. The analysis shows that
while domestic factors, particularly the output gap, did play a role in the recent spell of disinflation
in the four countries examined here, their impact has been relatively limited. External factors,
including the recent sharp decline in oil prices, NEER fluctuations, and spillovers from low euro area
inflation, have been important drivers of disinflation. These external factors not only had direct first-
round effects on headline inflation, but also had indirect first-round effects through core inflation
and second-round effects through their impact on inflation expectations feeding back into prices.
33. Policy responses differed, but all four countries took action to help lift inflation.
Differences in available monetary policy space had important implications for the choice of policy
response. Poland cut policy interest rates and maintains conventional policy space in the context of
limited domestic financial sector and external imbalances. Sweden and Switzerland introduced
negative policy interest rates, with Sweden also implementing QE. The Czech Republic and
Switzerland turned to exchange rate measures amid depleted conventional monetary policy space,
given concerns about the effectiveness of domestic QE. While they both implemented floors to
prevent further appreciation, Switzerland exited from its floor in January 2015.
34. Going forward, policy responses should take into consideration a number of factors.
The inflation objective may warrant further monetary easing in itself. However, other factors to
consider before deploying unconventional responses include: (i) an assessment of circumstances
(including the exchange rate assessment); (ii) an assessment of policy mix and space (e.g., policy
rates near zero or negative; fiscal space; in the case of QEE, clear constraints on the deployment of
QE or other policies); (iii) time horizon (temporary); (iv) domestic policy objective; (v) financial
stability concerns; and (vi) potential policy credibility issues that could arise from inaction or lack of
adherence to stated objectives or actions. Alongside, macroprudential policy would likely have a
significant role where financial stability concerns exist.

CROSS-COUNTRY REPORT ON INFLATION
INTERNATIONAL MONETARY FUND 29
References
Burbidge, John and Alan Harrison, 1985, “A Historical Decomposition of the Great Depression to
Determine the Role of Money,” Journal of Monetary Economics, Vol. 16, pp. 45–54.
Burstein, Ariel and Gita Gopinath, 2014, “International Prices and Exchange Rates,” Handbook of
International Economics, Vol. 4, pp. 391–451.
Christiansen, Lone and Christian Ebeke, 2015, “Forecasting Inflation in Poland,” Chapter I of Republic
of Poland: Selected Issues.
Gali, Jordi and Mark Gertler, 1999, “Inflation Dynamics: A Structural Econometric Analysis,” Journal of
Monetary Economics, Vol. 44, pp. 195–222.
Gali, Jordi, Mark Gertler, and J. David Lopez-Salido, 2001, ”European Inflation Dynamics,” European
Economic Review, Elsevier, Vol. 45, Issue 7, pp. 1237–1270, June.
Gali, Jordi and Tommaso Monacelli, 2005, “Monetary Policy and Exchange Rate Volatility in a Small
Open Economy,” The Review of Economic Studies, Vol. 72, No. 3, July, pp. 7070–734.
IMF, 2012, “The Liberalization and Management of Capital Flows: An Institutional View,” International
Monetary Fund, November.
IMF, 2013, World Economic Outlook, Chapter 3,” The Dog That Didn’t Bark: Has Inflation Been
Muzzled or Was it Just Sleeping?” International Monetary Fund, April.
IMF, 2015a, “Regional Economic Issues: Central, Eastern and Southeastern Europe,” International
Monetary Fund, May.
IMF, 2015b, “2015 Spillover Report,” International Monetary Fund.
IMF, 2015c, “Switzerland. 2015 Article IV Consultation—Staff Report,” IMF Country Report
No. 15/132, International Monetary Fund, May.
Iossifov, Plamen and Jiri Podpiera, 2014, “Are Non-Euro Area EU Countries Importing Low Inflation
from the Euro Area?” IMF Working Paper, No WP/14/191, International Monetary Fund, October.
Killian, Lutz, 2009, “Not All Oil Price Shocks Are Alike: Disentangling Demand and Supply Shocks in
the Crude Oil Market,” American Economic Review, Vol. 99:3, pp. 1053–1069.
Leon, J., 2012, “A Disaggregate Model and Second Round Effects for the CPI Inflation in Costa Rica,”
Munich Personal RepEc Archive (MPRA) Paper No. 44484, posted online in February 2013.
Mavroeidis, Sophocles, 2005, “Identification Issues in Forward-Looking Models Estimated by GMM,
with an Application to the Phillips Curve,” Journal of Money, Credit and Banking, Vol. 37, No. 3,
pp. 421–448, June.

CROSS-COUNTRY REPORT ON INFLATION
30 INTERNATIONAL MONETARY FUND
Mija, Simion, Dorin Slobozian, Radu Cuhal, Alexandru Stratan, 2013, “How Core Inflation Reacts to
the Second Round Effects,” Romanian Journal of Economic Forecasting, 1/2013.
Svensson, Lars E. O., 2000, “Open-Economy Inflation Targeting,” Journal of International Economics,
Elsevier, Vol. 50, Issue 1, pp. 155–183, February.
World Economic Outlook (WEO), 2015, “Uneven Growth: Short- and Long-Term Factors,”
International Monetary Fund, April.

CROSS-COUNTRY REPORT ON INFLATION
INTERNATIONAL MONETARY FUND 31
Appendix I. Data
Headline inflation. HICP inflation (year-on-year (y-o-y), quarterly, non-seasonally adjusted
(NSA)) from Eurostat.
Core inflation. HICP excluding energy price inflation (y-o-y, quarterly, NSA) from Eurostat. An
equivalent measure of inflation is used for euro area core inflation.
Non-core inflation. HICP energy price inflation (y-o-y, quarterly, NSA) from Eurostat.
Inflation expectations. For Poland and Switzerland, we use 2-year ahead forecasts from
Consensus Economics, which are based on surveys every other quarter. We use cubic spline
interpolation to interpolate the expectations values for missing quarters. For Sweden, we use the
quarterly 2-year ahead expectations average from surveys of financial market participants, firms,
and households, conducted by TNS Prospera. For the Czech Republic, we use 3-year ahead
inflation expectations from a survey of non-financial corporations, conducted by the Czech
National Bank.
Output gap. The quarterly output gap series for each country (including the euro area) is
calculated using quarterly real GDP data (seasonally adjusted) from national statistics agencies
and by constructing a quarterly potential real GDP series from the annual potential GDP series
from the April 2015 WEO. The quarterly potential GDP series grow at a constant rate within a
year, consistent with the annual growth rate of potential GDP in that year and the sum of the
quarterly potential GDP level in a given year is equivalent to the annual potential GDP level. The
quarterly output gap is defined as 100×(real GDP – potential GDP)/potential GDP.
Nominal Effective Exchange Rate (NEER). We use the IMF’s NEER index for all countries
except for Sweden, where we use the KIX NEER index provided by the Riksbank. Y-o-y
percentage changes in the NEER index are used in estimating the model. An increase denotes an
appreciation.
Oil prices. Y-o-y percentage change in the WEO quarterly average oil price per barrel.
Real interest rate. The real interest rate used in equation (5) (see Appendix II) is calculated as
the quarterly average nominal 3-month interbank rate less the headline inflation rate for each
country, including the euro area. The nominal interest rate series is taken from Haver Analytics.
Administered prices inflation. Y-o-y quarterly administered price inflation for the
Czech Republic and Poland are taken from Eurostat.
Tax dummy. For the Czech Republic, the “imputed contribution of taxes to headline inflation” is
calculated as the difference between headline HICP inflation and HICP inflation at constant tax
rates. We then construct a tax dummy: the dummy is 0 if the imputed contribution of taxes to
headline inflation is less than 1; the tax dummy is 1 if the imputed contribution of taxes to
headline inflation is greater than or equal to 1.

CROSS-COUNTRY REPORT ON INFLATION
32 INTERNATIONAL MONETARY FUND
Appendix II. Main Empirical Methodology and Results
Empirical approach
We seek to disentangle the effects of domestic and external factors on headline inflation.
Separating headline inflation into core inflation and non-core inflation (i.e., energy) allows us to
distinguish between direct and indirect first-round effects of shocks. For example, an oil price shock
will impact non-core inflation directly but might also affect core inflation through input prices. In
addition, we assess effects of shocks on inflation that work through the price setting and
expectations mechanism—the so-called second-round effects. This allows us to document how
different domestic and external factors impact headline inflation through the different channels.
Domestic factors are captured by the impact of the output gap on inflation. External factors are
captured by oil price changes, spillovers from euro area core inflation, and NEER fluctuations.
We employ a semi-structural empirical modeling approach. We start with the identity of
headline inflation as the weighted sum of core and non-core inflation. Core inflation is modeled as a
hybrid open-economy Phillips curve equation, which includes lagged core inflation, forward-looking
expectations, and domestic and external variables. Non-core inflation is linked to external factors
only. Inflation expectations are modeled based on all domestic and external factors impacting
headline inflation. This allows us to capture the second-round effects from shocks.
The system of equations is estimated using the SUR approach to account for possible
correlation between the error terms across equations. As CPI baskets differ across countries but
common factors feed into inflation dynamics across the sample, we estimate the SUR system for
each of the four countries individually. The system is estimated using quarterly data over the longest
sample period for which all variables are available–with sample periods up to 2014Q ranging
between 12 and 17 years for our four countries (see below).
Main system of SUR equations
Four equations represent the country-specific system of equations estimated using the SUR
approach. Let denote headline inflation,
denote core inflation, denote non-
core inflation (energy), and (
) denote the weight in the consumption basket of the
core (non-core) components. Also, let
denote (2-year ahead) inflation expectations1 formed at
period t, and denote the domestic output gap. External factors include NEER fluctuations
( ), oil price changes ( , and euro area core inflation (
). The component of oil
price changes due to global aggregate demand is denoted (see Appendix III).
1 Three-year ahead inflation expectations are used for the Czech Republic.

CROSS-COUNTRY REPORT ON INFLATION
INTERNATIONAL MONETARY FUND 33
Headline inflation identity. Including this indentify in the estimation of the system means
minimizing the weighted sum of squared error terms for equations (2) and (3), with the weights
corresponding to the weights of core and noncore inflation in headline inflation.
(1)
Core inflation. We model core inflation using a hybrid open-economy Phillips curve (Gali and
others, 2001; Svensson, 2000), with the constraint that the coefficients on the backward and
forward-looking inflation terms sum up to 1 (Mavroeidis, 2005). To control for potential
endogeneity or multicollinearity issues when estimating the system, we use predicted values
from equations (5), (6), and (7) for the output gap, NEER changes, and euro area core inflation,
respectively (see below). For the Czech Republic a dummy variable for changes in indirect and
excise taxes is also included when estimating the system of equations.2
(2)
Non-core inflation. Non-core inflation is a function of changes in oil prices and the NEER,
using predicted NEER values from equation (6) when estimating the model. Iossifov and
Podpiera (2014) find administered prices are also important in recent inflation developments for
the Czech Republic and Poland, so administered price inflation is also included in the non-core
equations for these two countries as an additional variable.
(3)
Inflation expectations. We assume inflation expectations are formed based on all available
information at time t, including the domestic and external factors affecting core and non-core
inflation, as well as the previous period’s inflation expectations.
(4)
Country-specific auxiliary equations (estimated outside the SUR system)
We also estimate equations for some exogenous variables outside the system and use
predicted values to control for potential endogeneity issues. Within a given quarter, the NEER
changes could be affected by contemporaneous feedback from inflation (or inflation expectations).
Additionally, any potential measurement errors associated with the output gap may be correlated
with the contemporaneous error terms in the inflation equations. Hence, we use predicted values for
the output gap (from an IS-curve-type regression) and NEER changes when estimating the main
2 We only have the imputed contribution of taxes to headline inflation (HICP inflation minus HICP inflation at
constant tax rates). As we do not have the weights for core and non-core inflation at constant tax rates, unlike in
Iossifov and Podpiera (2014), we cannot use the imputed contribution of taxes to headline HICP inflation in
equation (1). Hence, we use a dummy for the tax changes in the core inflation equation instead.

CROSS-COUNTRY REPORT ON INFLATION
34 INTERNATIONAL MONETARY FUND
system of equations. Equations (5) and (6) describe the country-specific equations for the output
gap and NEER changes, estimated outside the SUR system.
(5)
(6)
Euro area core inflation
Domestic core inflation and euro area core inflation may also be affected by common global
shocks not explicitly controlled for in our system of equations. This could induce correlations in
the error term of domestic core inflation and euro area core inflation. To preserve consistency across
countries, we estimate an equation for euro area core inflation (similar to that of the country specific
core inflation equation) outside of the system, rather than including an equation for euro area core
within the SUR system for each country. We then use predicted values from the euro area core
inflation equation when estimating the system of equations for each country i described above. The
euro area core inflation equation also allows us to distinguish between euro area specific factors and
external factors. This allows us to identify both how domestic euro area developments and global
factors spill over into country i inflation through euro area trade (see main text).
The empirical approach to estimate euro area core inflation (equations (7) to (10)) is similar to
the one described above. As with the estimation for our non-euro area countries, we use predicted
values for the euro area output gap and NEER changes to control for potential endogeneity issues.
Since the euro area reflects a relatively large share of the world economy, coefficient estimates for
contemporaneous oil price changes due to global aggregate demand ( ) may also suffer from
endogeneity bias. Thus, when estimating equation (7), we use the predicted value of the component
of oil price changes due to global aggregate demand, which we treat as a persistent random
variable in equation (10).
(7)
(8)
(9)
(10)
Historical decomposition
The historical decomposition accounts for the contribution of domestic and external factors
including their lagged effects. Following Burbidge and Harrison (1985), we estimate the individual
contributions of each domestic and external factor to the headline inflation over the sample period.
Equations (2), (3), and (4) above essentially describe core inflation, non-core inflation, and inflation
expectations as AR(1) processes with some external “shocks” (i.e., NEER, oil prices and euro area core
inflation). Using backward substitution, core inflation, noncore inflation and inflation expectations at
each point in time can be represented as a function of initial values plus all the external shocks as

CROSS-COUNTRY REPORT ON INFLATION
INTERNATIONAL MONETARY FUND 35
well as the residuals in the model, as represented by equations (11), (12), and (13), respectively,
below. Also, when constructing the decompositions, for the external factors we set the coefficient on
an external factor equal to zero if it is insignificant and a test of joint significance of the coefficients
on that factor across equations (using the Wald test) is not significant at the 5 percent level.
11 𝑡𝑐 𝑒 = 21 α22
j
t 1
j=0
+ α22t 0
𝑐 𝑒 + (1 22) α22j
t 1
j=0
𝑡 1 𝑗 _2𝑦
+ 23 α22j
t 1
j=0
𝑡 𝑗
+ 24 α22j
t 1
j=0
𝑡 𝑗 + 25 α22j
t 1
j=0
𝑡 𝑗𝐷 + 26 α22
j
t 1
j=0
𝑡 𝑗 𝐴_𝑐 𝑒 + α22
j
t 1
j=0
𝑡 𝑗𝑐 𝑒
12 𝑡𝑛 𝑛𝑐 𝑒 = 31 α32
j
t 1
j=0
+ α32t 0
𝑛 𝑛𝑐 𝑒 + 33 α32j
t 1
j=0
𝑡 𝑗 + 34 α32j
t 1
j=0
𝑡 𝑗
+ α32j
t 1
j=0
𝑡 𝑗𝑛 𝑛𝑐 𝑒
13 𝑡 _2𝑦
= 41 α42j
t 1
j=0
+ α42t 0
_2𝑦 + 43 α42
j
t 1
j=0
𝑡 𝑗 + 44 α42j
t 1
j=0
𝑡 𝑗
+ 45 α42j
t 1
j=0
𝑡 𝑗 + 46 α42
j
t 1
j=0
𝑡 𝑗 𝐴_𝑐 𝑒 + α42
j
t 1
j=0
𝑡 𝑗E_2yr
Other estimation details
The sample sizes vary across countries. The biggest constraint on the length of the sample is the
availability of inflation expectations data. In most cases, except Poland, the panel is unbalanced.
Sample periods for each country are as follows:
Czech Republic. The model is estimated over 2003Q1–2014Q4 (184 total system observations).
Poland. The model is estimated over 2003Q2–2014Q4 (188 total system observations).
Sweden. The model is estimated over 1997Q2–2014Q4 (260 total system observations).
Switzerland. The model is estimated over 1999Q1–2014Q4 (200 total system observations).

CROSS-COUNTRY REPORT ON INFLATION
36 INTERNATIONAL MONETARY FUND
Table AII.1. Coefficient Estimates1/
RESULTS Czech Rep. Poland Sweden Switzerland
Core inflation equation
core(-1) 0.6787 *** 0.7546 *** 0.8995 *** 0.7895 ***
0.0904 0.0443 0.0630 0.0500
inf. exp(-1) 0.3213 0.2454 0.1005 0.2105
ygap_hat 0.0548 0.2516 *** 0.0433 * 0.0398 **
0.0345 0.0805 0.0232 0.0191
neer_hat -0.0788 *** -0.0382 *** -0.0323 *** -0.0284 ***
0.0249 0.0067 0.0085 0.0071
oil_d 0.0212 *** 0.0038 -0.0003 0.0002
0.0045 0.0027 0.0020 0.0014
ea_core_hat 0.3648 0.3415 *** -0.0575 0.1145 **
0.2540 0.1250 0.0742 0.0491
tax dummy 0.6560 ***
0.1853
Non-core inflation equation
noncore(-1) 0.7723 *** 0.6040 *** 0.6833 *** 0.4710 ***
0.0719 0.0770 0.0585 0.0448
neer_hat -0.1359 * -0.0440 * -0.1076 * -0.1588 *
0.0788 0.0237 0.0597 0.0905
oil 0.0352 *** 0.0396 *** 0.0589 *** 0.1919 ***
0.0103 0.0069 0.0071 0.0129
admin 0.2975 *** 0.5490 ***
0.1025 0.1364
Inflation expectations equation
exp(-1) 0.3436 *** 0.7428 *** 0.6535 *** 0.6597 ***
0.1180 0.0781 0.0942 0.0849
ygap_hat 0.0228 * 0.0394 * 0.0224 * -0.0015
0.0139 0.0207 0.0136 0.0138
neer_hat -0.0051 -0.0053 *** 0.0070 -0.0097 *
0.0119 0.0020 0.0063 0.0051
oil 0.0035 *** 0.0027 *** 0.0022 *** 0.0015 ***
0.0014 0.0005 0.0008 0.0006
ea_core_hat 0.2230 ** -0.0359 0.1454 ** 0.0371
0.0933 0.0340 0.0729 0.0353
Source: IMF staff calculations.
1/ Standard errors in italics below coefficients. ***, **, * indicate significance at 1, 5, and 10 percent levels.
Coefficient on “inf. exp(-1)” equals “1-core(-1)” (equation (2)) and does not have a separate standard error entry.

CROSS-COUNTRY REPORT ON INFLATION
INTERNATIONAL MONETARY FUND 37
Appendix III. Disentangling World Oil Supply and Demand Shocks
We decompose oil prices into world demand and supply shock components. To disentangle the
drivers of world oil price fluctuations, we use a three-variable vector autoregression (VAR), including
world oil production, world economic activity (dry cargo bulk freight rates), and the price of oil.
Following the identification strategy in Kilian (2009), we decompose the historical oil price into three
components: (i) world commodity/aggregate demand shocks, (ii) world oil supply shocks, and
(iii) world oil market shocks, which captures precautionary demand associated with concerns about
future oil supply. Figure AIII.1 illustrates the contributions from each of the three components.
This allows us to distinguish between global aggregate demand factors that may have an
effect beyond just the oil price, supply shocks, and precautionary demand factors. It is
important to differentiate between global demand shocks, oil-specific precautionary demand
shocks, and supply shocks. Global aggregate demand shocks that drive up the price of oil may have
effects beyond their impact on oil prices. Namely, as demand for other goods increase as well, firms
may have greater ability to pass through higher oil prices to their customers. Effects from
precautionary demand shocks, driven by expectations about future demand and supply, may be
more nebulous, particularly when they offset the impact of current global demand conditions on the
observed oil price. In particular, even if precautionary demand shocks are pushing the oil price up, if
current demand conditions are pushing it in the other direction, firms may not be as able to pass
through increases in input cost due to oil price rises as easily. Actual supply shocks have typically
been small in recent years, though, like precautionary demand shocks, their effects can be
ambiguous.
Figure AIII.1. Disentangling Oil Supply and Oil Demand Shocks
Lower aggregate demand led to a drop in oil prices in 2014, with supply and precautionary demand factors
also becoming increasingly relevant toward the end of the year.
Source: IMF staff calculations.
-100
-80
-60
-40
-20
0
20
40
60
80
Jan-09 Jan-10 Jan-11 Jan-12 Jan-13 Jan-14
Oil Price Decomposition
(Percentage point contribution to the change in oil prices; change in oil prices in percent)
Precautionary demand Demand
Supply Constant term
Change in oil prices

CROSS-COUNTRY REPORT ON INFLATION
38 INTERNATIONAL MONETARY FUND
The results from this exercise are in line with other approaches that attempt to disentangle
the effects of supply and demand shocks on the oil price. Box 1.1 in the April 2015 WEO looks at
how much of recent oil price changes are attributable to supply and demand shocks. One approach
finds that between October 2014 and January 2014 about 64 percent of oil price changes were due
to supply and 36 percent due to demand. Their measure of supply is most comparable to the sum of
supply and precautionary demand shocks in our decomposition. For supply and precautionary
demand components combined, we find they accounted for more than half of the decline in oil
prices in the last couple of months of 2014, which is broadly in line with the WEO results.