cross-functional big data integration: applying …essay.utwente.nl/71098/1/brunink_ma_bms.pdf ·...
TRANSCRIPT

MASTER THESIS BUSINESS ADMINISTRATION
CROSS-FUNCTIONAL BIG DATA INTEGRATION:
APPLYING THE UTAUT MODEL
Leonine Brünink University of Twente
1st supervisor: Dr. M.L. Ehrenhard 2nd supervisor: Dr. A.B.J.M. Wijnhoven
25th September 2016

2
ABSTRACT
To successfully exploit Big Data for competitive advantage, data scientists and domain experts need to work hand in
hand. This poses a challenge to most companies as they need to ensure that stakeholders from all functional levels
are willed to integrate Big Data into their day-to-day activities and decision-making processes. By adapting the
Unified Theory of Use and Acceptance of Technology (UTAUT) to the context of Big Data, this study makes a first
approach to explore the factors that drive Big Data acceptance across different functional levels. The results reveal
that Performance Expectancy, Business Value Expectancy, and Social Influence have significant positive effects on
Big Data adoption intention. Moreover, they indicate that high levels of data-usage experience and data-driven
decision-making behavior have a negative moderating effect on Big Data adoption intention. Based on the research
findings, first managerial implications are derived and discussed to assist organizations in their initial Big Data
implementation phase.
Keywords: Big Data, strategic advantage, cross-functional integration, unified theory of acceptance and use of
technology (UTAUT), technology adoption.

3
1. INTRODUCTION
With the steady increase in digital data over the last few years, Big Data technology has gained increasing attention
among different industries. Today’s business environment and the data describing it are constantly changing, so that
the intelligent use of data is considered as key to competitive advantage. Frontrunners like Google, Facebook or
Amazon, which were build around Big Data from their beginning, show how to successfully derive value from Big
Data. By collecting, managing and combining customer data in smart ways they are extremely close to their
customers allowing them to quickly grasp trends, extract valuable information for product, service and process
improvements and discover novel opportunities for innovation (McAfee, Brynjolfsson, Davenport, Patil & Barton,
2012; George, Haas & Pentland, 2014).
However, there are many companies that face difficulties with Big Data integration as they need to merge their
existing IT infrastructures with new Big Data technologies. Being at the early stage of Big Data adoption they often
have lacking understanding and experience with Big Data and still need to learn how to adapt managerial and
organizational structures in order to build and maintain a Big Data-driven company culture (Davenport, Barth &
Bean, 2012; Kwon, Lee & Shin, 2014). As a consequence, Big Data is not utilized to its full potential, which is
crucial for organizations to keep pace with their competitors in the long run (Davenport, Barth and Bean, 2013;
LaValle, Lesse, Shockley, Hopkins and Kruschwitz, 2013).
Taking a closer look at current Big Data research, academia is mainly concerned with the characteristics of Big
Data, its technical algorithms and system developments while neglecting the critical issue of company-wide
integration (Kwoo, Lee & Shin, 2014). Therefore, Big Data integration represents a timely relevant topic for both,
researchers and practitioners, to bring forward the neglected dimensions of company-wide Big Data acceptance and
adoption. As starting point, companies need to understand the prevailing attitude towards Big Data across all
functional levels. These insights represent a basis to create both organizational commitment and skills to adopt Big
Data throughout the organization. The aim of this research is to make a first attempt to close this knowledge gap by
exploring the drivers, which might impact the intention to adopt Big Data at different functional levels. Accordingly,
organizations can better understand potential implementation problems and reasons for resistance and intervene by
designing an appropriate implementation plan supporting managers in the successful introduction of Big Data.
Based on the problem described above, the following research question (RQ) can be stated: What are the factors
impacting the acceptance level of Big Data within organizations?
4
This paper will be structured as follows: In the first part, a literature review will be conducted highlighting the
concept of Big Data, its contribution to strategic advantage and the importance of cross-functional Big Data
integration. In the second part, the Unified Theory of Acceptance and Use of Technology (UTAUT) will be presented
as underlying research model and adapted to the context of Big Data. The third part of this paper will cover the
research methodology and results. In the last part, the research findings will be discussed and some concluding
remarks for researchers and practitioners will be given. Moreover, based on the research limitations some
suggestions for future research will be presented.
2. LITERATURE REVIEW
2.1 Concept of Big Data
Today, most data is produced as by-product of everyday activities, for example when using mobile apps, social
networks, GPS devices, instrumented machinery etc., enabling companies to access various data from different
sources in real-time (McAfee et al., 2012). Accordingly, not only the volume and types of data, but also the speed at
which data is being created and processed has changed resulting in the emergence of Big Data.
The term Big Data is used to describe (1) data sets that are too large, diverse and complex for traditional database
systems to process, and (2) the advanced technologies needed to store, manage, analyze and visualize this data
efficiently (Chen, Chiang & Storey, 2012; Hashem, Yaqoob, Anuar, Mokhtar, Gani, & Khan, 2015; James, Michael,
Brad, Jacques, Richard, Charles & Angela, 2011; Provost & Fawcett, 2013; Tsai, Lai, Chao & Vasilakos, 2015).
To characterize Big Data, most scholars refer to the three V’s model proposed by Gartner (2012), which takes the
volume, variety and velocity of data into account.
Volume refers to the huge amounts of data being created by both humans and machines, which continue to expand.
Velocity relates to the increased speed, at which data is being created. This means, organizations have to handle
greater amounts of data at a faster pace. Variety describes the different kinds of data formats, which need to be
analyzed. These data can be either be structured1, unstructured data2 or semi-structured3 stemming from sources
1 = pre-defined, machine-readable data with a defined length and format stored in a relational database, such as financial data, purchase records, etc. 2 = data that cannot be specifically structured e.g. text, video, audio data, etc. 3 = data that has any schema or carries a tag, e.g. sensor data, web server logs, etc.

5
inside and outside the company. From all data available today, unstructured data represent the largest part with more
than 80 percent (McAfee et al., 2012).
In the meantime, the 3 V’s model has been extended by two additional characteristics, namely veracity and value.
Veracity relates to the challenge to ensure the truthfulness, accuracy and reliability of data, which are being
generated from multiple sources and systems. Value refers to the insights gained through Big Data analysis and the
value derived from these insights providing organizations with new opportunities for learning, creativity, innovation
and performance improvement (Fan & Bifet, 2013).
Big Data analytics allow organizations to generate business insights from Big Data in three different ways: (1)
Descriptive analytics uses data from current and past events to summarize what has happened and the reasons
behind to understand the current business performance. (2) Predictive analytics explores current and historical data
to reveal hidden relationships between data inputs and performance outcomes and to make predictions about the
future. Here, techniques such as data mining, predictive data modeling, root cause analysis, and machine learning
are used to identify business trends or patterns, opportunities and risks in order to anticipate accordingly in the
future. (3) Prescriptive analytics uses current and historical data to predict multiple, possible courses of future
actions and assess their likely consequences based upon the chosen action. Prescriptive analytics allows to make
more informed business decisions by understanding and evaluating how different actions might affect business
performance in the future with the central aim to improve it (Chen, Chiang & Storey, 2012; Phillips-Wren &
Hoskisson, 2015).
As this research makes a first attempt to explore the factors that drive Big Data adoption intention across different
functional levels, in this paper “Big Data” refers to the technology allowing to store, process and combine enormous
amounts of different data types from various sources.
2.2 Strategic advantage through Big Data
Big Data plays a crucial role when it comes to strategic advantage.
In the past, business analytics has been limited to structured data, which means that companies had to mainly rely on
structured data sets stored in relational data warehouses for their conventional data analytics (Chen, Mao & Liu,
2014). Simultaneously, those traditional data sets have often been locked away within functional silos, which means
every department has been collecting and analyzing its own data independently to optimize activities at functional

6
level while neglecting the broad company picture (Davenport & Dyché, 2013).
With the emergence of Big Data technologies, large volumes of structured and unstructured data sets can be
collected, stored and combined on enterprise-wide platforms. Those data sets, stemming from various internal and
external sources, can be brought together, correlated and analyzed to uncover patterns and relationships, which
cannot be detected by data sets stored on data warehouses in isolation. Various potential strategic advantages might
arise out of that, for example:
(1) Enhanced flexibility: all data being stored on one enterprise-wide platform can be managed and mobilised across
the organization to be readily available where needed (McAfee et al., 2012).
(2) Reduced information and time gaps: real-time data access allows to access and analyze information from
different sources on a minute-to-minute, day-to-day basis rather than being constrained to e.g. quarterly reports
(Davenport & Dyché, 2013; McAfee et al., 2012).
(3) Improved decision-making: insights generated from huge volumes of information can guide business decision-
making in a timely manner (Provost & Fawcett, 2013).
(4) Real-time monitoring of the environment: organizations can rapidly respond to market movements and changing
needs, identify trends and innovation opportunities and keep track of competition (Davenport, Barth & Bean, 2013;
George, Haas & Pentland, 2014; Provost & Fawcett, 2013).
(5) Process optimization: forecast personnel allocation, optimize inventory, and improve logistics and supplier
coordination (Kaisler, Amour, Espinosa & Money, 2013).
Accordingly, all business units within the company can benefit from Big Data and Big Data analytics technologies
in different ways. Therefore, it is important that Big Data is integrated and used across all functional levels within
the enterprise contributing to strategic advantage.
2.3 Organizational challenge: cross-functional Big Data integration
As Big Data technologies open up a myriad of new possibilities across the entire organization, complementing
expertise from different disciplines is needed to fully embrace Big Data analytics and to realize its potential (Beath,
Becerra-Fernandez, Ross & Short, 2012; Chen, Mao & Liu, 2014; Davenport, Barth, & Bean, 2012; Waller &
Fawcett, 2013).
On the one side there are data scientists and engineers required, who have the essential know-how about the
7
infrastructure and technologies as well as the analytical capabilities necessary to run Big Data analytics (Davenport,
Barth, & Bean, 2012; Phillips-Wren & Hoskisson, 2014; Waller & Fawcett, 2013). They know which statistical and
computational techniques can be applied to analyse a specific business phenomenon or problem and how to translate
the generated results into graphs, charts and animations (Chen & Zhang, 2014). On the other side there are domain
experts from different fields, who have profound knowledge about their domain, the company’s strategy and
business goals. The experts have to identify business requirements, problems or opportunities, prioritize them
according their level of importance and translate them into questions to be addressed by Big Data. Also, they have to
be capable to determine the right course of action based on results generated from Big Data. Thus both technology
side and business side need to combine their knowledge to develop ideas how Big Data analytics can be applied to
address critical needs, formulate questions to be addressed and finally turn Big Data insights into valuable actions
(Kaisler et al., 2013). However, this is no small task as the value of Big Data may not be clear to everyone so the
potential risk of internal resistance has to be overcome, and both the willingness and skills to use Big Data
throughout the organization need to be created (Phillips-Wren & Hoskisson, 2014; Davenport, Barth & Bean, 2012).
Succeeding with Big Data therefore requires embedding Big Data deeply into the organization to achieve
organizational alignment (Buckby, Best & Stewart, 2008). Big Data must be closely linked to the business strategy
and anchored within organizational processes, routines and daily activities so that the right actions can be taken or
profound decisions can be made at the right time while being in line with overall business objectives (Davenport,
Barth & Bean, 2012).
Accordingly, new infrastructures for Big Data need to be build in order to overcome potential cultural,
organizational and communications barriers between IT and the rest of the company and to establish a synchronized,
data-driven strategy (Barton & Court, 2012; Bean & Kiron, 2013).
3. RESEARCH MODEL
3.1 Justification of research model
Prior research has indicated that the successful introduction of a new technology is highly associated with the depth
of understanding the factors impacting users intention to adopt it (Yu, 2012). As a first step towards successful
cross-functional Big Data integration it is therefore important to examine potential drivers or impediments impacting

8
employees decisions to adopt Big Data. Therefore, the Unified Theory of Acceptance and Use of Technology
(UTAUT) proposed by Venkatesh et al. (2003) has been chosen as underlying theoretical framework for this study
as it considers the factors and contingencies related to the prediction of technology acceptance and usage intention
primarily in organizational contexts.
In contrast to prior user technology acceptance models, UTAUT presents a more holistic picture of technology
acceptance as it brings the different key constructs of the most dominant technology acceptance models and theories
together. Moreover, its explanatory power explaining 70% of technology usage intention is considerably higher
compared to any of the previous models explaining only about 40% (Wu, Tao, & Yang, 2007; Waehama, McGrath,
Korthaus, & Fong, 2014).
The UTAUT model is especially suitable for this study, as it helps managers to assess the level of Big Data
acceptance within their organization before its initial introduction allowing to proactively design interventions based
on the results. Moreover, it has already been applied for several studies in different countries such as Saudi Arabia
(Alkhunaizan & Love, 2012), Kuala Lumpur, Korea and US (Im, Hong & Kang, 2011) and has been adapted to
different technologies such as mobile banking (Yu, 2012), internet banking and (Foon & Fah, 2011) and social
media (Gruzd, Staves & WiIk, 2012) proving its international applicability for different technologies.
3.2 The Unified Theory of Technology Adoption and Use of Technology (UTAUT)
The UTAUT model (see figure 1) unifies eight major models on user technology acceptance, namely the theory of
reasoned action (TRA), the technology acceptance model (TAM), the theory of planned behavior (TOPB), the
motivational model (MM), the innovation diffusion theory (IDT), the model of PC utilization (MPU), the social
cognitive theory (SCT), and a model combining TAM and TOPB (C-TAM-TOPB). UTAUT sums up the main
constructs from all eight models to four independent variables, which predict the two dependent variables
‘technology usage intention’ and ‘technology usage behaviour’ (Tan, 2013; Venkatesh et al., 2003). The four
independent variables are Performance Expectancy (PE), Effort Expectancy (EE), Social Influence (SI) and
Facilitating Conditions (FC).
9
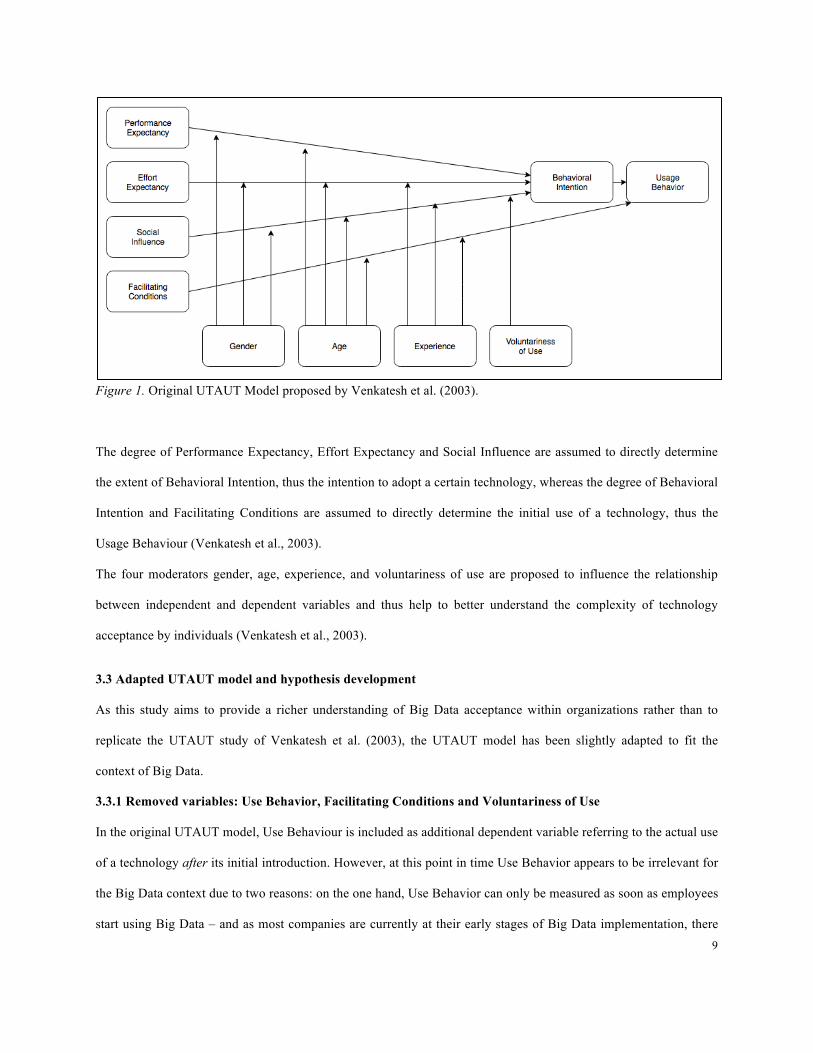
Figure 1. Original UTAUT Model proposed by Venkatesh et al. (2003).
The degree of Performance Expectancy, Effort Expectancy and Social Influence are assumed to directly determine
the extent of Behavioral Intention, thus the intention to adopt a certain technology, whereas the degree of Behavioral
Intention and Facilitating Conditions are assumed to directly determine the initial use of a technology, thus the
Usage Behaviour (Venkatesh et al., 2003).
The four moderators gender, age, experience, and voluntariness of use are proposed to influence the relationship
between independent and dependent variables and thus help to better understand the complexity of technology
acceptance by individuals (Venkatesh et al., 2003).
3.3 Adapted UTAUT model and hypothesis development
As this study aims to provide a richer understanding of Big Data acceptance within organizations rather than to
replicate the UTAUT study of Venkatesh et al. (2003), the UTAUT model has been slightly adapted to fit the
context of Big Data.
3.3.1 Removed variables: Use Behavior, Facilitating Conditions and Voluntariness of Use
In the original UTAUT model, Use Behaviour is included as additional dependent variable referring to the actual use
of a technology after its initial introduction. However, at this point in time Use Behavior appears to be irrelevant for
the Big Data context due to two reasons: on the one hand, Use Behavior can only be measured as soon as employees
start using Big Data – and as most companies are currently at their early stages of Big Data implementation, there
10
will be few if any employees actually making use of Big Data making this variable difficult to measure. On the other
hand, one central aim of this research is to support organizations in their development of successful Big Data
implementation strategies. It is therefore important to identify the drivers that considerably stimulate and/or prevent
employees’ Big Data adoption intention prior to actual Big Data introduction allowing organizations to understand
how Big Data acceptance can be promoted and reinforced within the entire organization and act upon that.
Accordingly, the dependent variable Use Behaviour will be removed from the adapted UTAUT model.
Facilitating Conditions, which are defined as the degree to which users perceive that organizational resources and a
supporting technical infrastructure are available facilitating the actual use of a particular technology, will also be
removed from the adapted UTAUT model. In the original UTAUT model Facilitating Conditions are shown to have
a direct impact on Use Behavior, but not Adoption Intention. This makes them irrelevant for this study, as Use
Behaviour has been excluded from the adapted UTAUT model.
In addition, it can be assumed that the introduction of Big Data represents a corporate decision imposed from top
management. Accordingly, employees cannot voluntarily choose to adopt Big Data, but will have to make use of it
mandatorily. This makes Voluntariness of Use as moderator inapplicable, so that it will not be included in the
adapted UTAUT model.
In the following sections, the remaining variables Performance Expectancy, Effort Expectancy and Social Influence
as well as Business Value Expectancy will be discussed in more detail. The latter one will be incorporated as new,
additional independent variable into the adapted UTAUT model (Figure 2).

11
Figure 2. Conceptual UTAUT Model adapted to the context of Big Data.
3.3.2 Performance Expectancy
Performance Expectancy focuses on task accomplishment and can be defined as the degree to which employees
believe that using a specific technology will enhance their job performance (Venkatesh, Morris & Davis, 2003). The
construct is considered as important determinant of adoption intention, since people are more likely to adopt a
technology when they expect it to be useful for their job (Brown, Dennis & Venkatesh, 2010; McKenna, Tuunanen
& Gardner, 2013).
Previous research indicates that the usage of Big Data technologies is associated with smarter decision making and
performance enhancements (McAfee et al., 2012). Big Data allows employees to analyze and understand data at a
wider scope and depth than traditional data analysis methods, offering performance advantages such as smarter data
usage, increased data quality, better customer insights and improved decision making. Therefore, it can be assumed
that employees expect a performance improvement by using Big Data. Following the above mentioned performance-
adoption logic, the following hypothesis can be stated:
H1a: Performance expectancy has a positive impact on employees’ intention to use Big Data.
The relationship between Performance Expectancy and Big Data Adoption Intention is expected to be moderated by
Data Usage Experience and Decision-Making Behaviour.
Employees, who already have experience with data usage, tend to be more open concerning Big Data adoption.

12
Compared to employees with limited prior data experience, they already know how traditional analytics in general
assists them in performing their job (Kwon et al., 2014; Parameswaran, Kishore & Li, 2015). Based on experiences
with traditional data analytics they can better understand the benefits and drawbacks of Big Data motivating them to
adopt it (Kaisler et al., 2013; Parameswaran, Kishore & Li, 2015).
Also, there is evidence that organizations that rely more on data-driven decision-making than intuition-based
decision-making are performing better in terms of productivity and profitability (McAfee & Brynjulfsson, 2012).
Therefore, it can be expected that employees who are already applying data-driven decision-making are more salient
to adopt Big Data as they are used to base their decisions on insights generated from data and made positive
experiences with that. Thus, it can be hypothesized:
H1b: The impact of performance expectancy on Big Data adoption intention will be altered by data management
experience and decision-making behaviour, such that the effect will be stronger for employees who already have
data usage experience and tend to base their decisions on data-analytics rather than on intuition.
Previous UTAUT studies have indicated that the relationship between performance expectancy and adoption
intention is being moderated by gender and age (Yu, 2012). It is argued that men, particularly younger men, are
more focussed on their tasks, productivity and effectiveness, whereas women are more communally-oriented
(Brown, Dennis & Venkatesh, 2010). Therefore, younger man are more likely to adopt Big Data when they believe
to improve their job performance through Big Data usage compared to women. Accordingly, it can be assumed:
H1c: The impact of performance expectancy on Big Data adoption intention will be moderated by gender and age,
such that men, particularly younger men, are more likely to adopt Big Data to gain performance benefits.
3.3.3 Effort Expectancy
Effort Expectancy, which takes both perceived ease of use and complexity into account, reflects the extent to which
employees believe that using a certain technology will be free from effort (Venkatesh, Morris & Davis, 2003;
McKenna, Tuunanen & Gardner, 2013).
Previous research theorizes effort expectancy to negatively impact adoption intention. Especially when new
technologies are perceived as highly complex and difficult to be integrated into daily business operations, employee
satisfaction diminishes resulting in lower levels of adoption intention (Oliveira, Thomas & Espadanal, 2014; Choi,
Nazareth & Jain, 2010; Son & Benbasat, 2007).

13
Big Data adoption requires organizational change at all company levels, as it implies new forms of data integration
and analysis processes (Hashem, Yaqoob, Anuar, Moktar, Gani & Khan, 2015). As previously discussed in the
literature review, Big Data embraces new sources and types of data, which can be linked and fused in totally new
ways. Employees do not only have to understand how Big Data results can be applied for their specific business line,
but also need to learn how Big Data can be used to explore new business opportunities, solve business problems or
improve performance (McAfee et al, 2012; George, Haas & Pentland, 2014). As a result, Big Data adoption might
be perceived as highly complicated and time-demanding diminishing employees’ intention to adopt Big Data. Taken
the above together, this study hypothesizes:
H2a: Effort expectancy has a negative impact on employees’ intention to use Big Data.
Data usage experience and intuition-based decision-making are assumed to moderate the relationship between effort
expectancy and Big Data usage intention. Previous research suggests that past usage experience can act as frame of
reference for comparison, such that employees will evaluate the usefulness and expected ease of use of Big Data
based on their interaction with traditional data analytics. This, in return, affects employees’ intentions to adopt Big
Data. It is therefore expected:
H2b: The impact of effort expectancy on adoption intention will be moderated by data usage experience and DM
behaviour, such that the effect will be stronger for employees, who have little data usage experience and tend to
base their decisions more on intuition than on data-analytics.
Moreover, it is argued that increased age has a negative moderating effect on effort expectancy. Older people face
more difficulties in processing complex stimuli and paying attention on the job, which makes it harder to learn using
Big Data (Venkatesh et al., 2003). In addition, prior UTAUT studies suggest that constructs associated with effort
expectancy will be stronger determinants for personal adoption intention for women than for men (Zhou, Lu &
Wang, 2010; Venkatesh & Morris, 2000; Venkatesh, Morris & Ackerman, 2000). This results in the following
hypothesis:
H2c: The impact of effort expectancy on adoption intention will be altered by age and gender, such that the effect
will be stronger for women, particularly younger woman.
14
3.3.4 Social Influence
Social Influence occurs when the intention to adopt a particular technology is influenced by the opinion of
important others and reflects the extent to which users believe that reference persons (e.g. managers, colleagues)
think they should use a particular technology. It is based on social influence theory, which proposes that users tend
to behave in accordance of important others opinions in order to conform to their expectation (Alwahaishi & Snasel,
2013; Mun, Jackson, Park, & Probst, 2006). Accordingly, if superiors or peers find a particular technology to be
useful, this suggestion might affect an individual’s perception and adoption intention (Mun et al., 2006).
Social Influence might also play a crucial role when it comes to Big Data adoption. There is evidence that in
organizations where executive management focusses on and supports data analytics, employees are more successful
in using data analytics (Russom, 2011). Being perceived as role model, senior management and business executives
can promote a more data-driven company culture, reinforce Big Data usage and by this stimulate to adjust
employees’ mindsets about Big Data (McAfee et al., 2012). Thus, it can be expected:
H4a: Social Influence has a positive impact on employees’ intention to use Big Data.
Data Usage Experience is expected to moderate the relationship between Social Influence and Big Data usage
intention. Parmeswaran et al. (2015) suggest that prior technology usage experience might shape the individual’s
frame of reference. Whereas users with high experience levels are less sensitive to others opinions, individuals with
little technology experience tend to comply more easily with social influence. This study therefore assumes:
H4b: The impact of social influence on adoption intention will be moderated by data usage experience, such that the
effect will be stronger for employees with little data usage experience.
Gender differences and higher age levels are expected to affect social influence. Compared to men, who are task-
oriented, women are more communally-oriented. They are sensitive to other’s opinions so that they might be more
influenced by other’s views and suggestions of technology adoption and usage (Venkatesh, Morris & Ackermann,
2000; Saleh, Haris & Ahmad, 2014). Findings also show that older workers place increased salience on social
influences due to higher affiliation needs (Venkatesh et al., 2003). Accordingly, the following hypothesis is put
forward:
H4c: The impact of social influence on adoption intention will be moderated by age and gender, such that the effect
will be stronger for women, especially older women.
15
3.3.5 Business Value Expectancy
Business Value Expectancy, which refers to the expected short-, medium- and long-term usefulness of a certain
technology when applying it for one’s business line, will be included as fourth independent variable in the adapted
UTAUT model (Triandis, 1980; Lu, Yu, Liu & Yao, 2003). Compared to the Performance Expectancy construct
measuring the implications for one’s individual job performance, Business Value Expectancy reflects the expected
positive consequences for one’s business line over time.
According to Chau (1996) and Lu et al. (2003) expected favorable near-term and long-term consequences have a
positive significant impact on potential users’ attitude towards a technology and their usage and adoption intention.
Especially, when tangible results are directly apparent, potential technology users can better understand the
advantages of using a technology motivating them to adopt it (Luzipo, Van Biljon, & Herselman, 2015; Mun et al.
2006). But also in the case that there is a time lag between technology usage and the occurrence of positive business
outcomes, adoption intention can be triggered when potential adopters are aware of the additional business value to
accrue in the mid- or long-term (Venkatesh, 2006).
As already discussed before, Big Data is considered to contribute to value creation in different ways over time. For
example, Big Data allows continuous monitoring and analysis of the business environment to guide time-sensitive
decision-making. Accordingly, it can assist departments in their every-day decision making resulting in short-term
business value. On the other hand, Big Data can help to strengthen one’s competitive position over time, for
example by improving efficiency, reducing costs or optimizing campaigns, products or processes to achieve better
results. In those cases, one determines mid- or long-term goals, which outcomes will payoff in the future.
Accordingly, it is interesting to see if the business value associated with Big Data stimulates potential users to adopt
Big Data resulting in the following hypothesis:
H3a: Business Value has a positive impact on employees’ intention to use Big Data.
It can be assumed that employees, who are more experienced in using data and who tend to base their decisions on
data are more aware of the business value associated with Big Data. Therefore, it is also hypothesized:
H3b: The impact of business value expectancy on adoption intention will be moderated by data usage experience
and DM behaviour, such that the effect will be stronger for employees who already have data usage experience and
tend to base their decisions more on data-analytics rather than on intuition.

16
4. RESEARCH METHODOLOGY
4.1 Research Design
The purpose of this formative research is to understand how Performance Expectancy, Effort Expectancy, Value
Expectancy and Social Influence are related to employees’ intention to adopt Big Data. A study was conducted in
the digital department of a Franco-Dutch company using a correlational survey design.
The time the study has been conducted, the given company was in its initial Big Data implementation phase
planning to gradually integrate Big Data within the entire digital department. Accordingly, the population of interest
for this study were all 249 employees from the digital department, from which a determined group consisting of 49
employees had already been attended a company-intern workshop preparing them for actual Big Data usage,
whereas the remaining 200 employees had not been invited to the workshop and therefore not been involved in any
internal Big Data activities.
4.2 Participants
From the whole target population of 249 employees, a total of 157 responses have been collected. After eliminating
all incomplete and ineligible responses, 93 responses remained suitable for analysis resulting in an active response
rate of 37.8%. The final sample consisted of 50 male and 43 female respondents, with a mean average age of 38
years and a standard deviation of 9 years. From all 93 respondents, 16 had already been attending a company-
internal Big Data workshop while the remaining 77 have not been involved in company-internal Big Data activities
yet. Among all workshop attendants, 7 were already making use of Big Data. Table 1 provides an overview of the
respondents’ characteristics.
Table 1. Descriptive statistics of the respondents’ characteristics Measure Items Subjects
Frequency Percentage
Gender Female 43 46.2 Male 50 53.8 Attended internal Big Data workshop
Yes No
16 77
17.2 82.8
Using Big Data already Yes No
7 86
07.5 92.5
Total 93 100.0

17
4.3 Procedure
As research instrument, a self-administered questionnaire fitting the adapted UTAUT model was used for data
collection. The questionnaire was divided up into three main parts: the first part covered a brief introduction to
explain the topic and purpose of the study. Moreover, items measuring the respondent’s present data usage
experience and decision-making behavior were included controlling for the first two moderator variables. It has been
chosen to ask those questions at the beginning of the survey as they are relatively easy to answer and get the
respondents involved. The second part of the survey started with a clear Big Data definition fitting the company
context to ensure that all participants had the same understanding of Big Data. The following items were measuring
the four independent variables performance expectancy, effort expectancy, business value expectancy and social
influence as well as the dependent variable Big Data adoption intention. The last part of the questionnaire assessed
demographic variables including the two last moderator variables gender and age. The survey mainly consisted of
closed questions and several rating, list and open questions.
The questionnaire was evaluated prior to distribution using three methods: the first survey draft has been submitted
to a researcher for critical evaluation. After revisions regarding content, wording and measurement scales, the
revised survey has been presented to a company-intern Big Data expert to assess if the questions were fitting the
company’s Big Data context. To finalize the instrument, a pretest has been conducted with two employees to get
feedback on the understandability of the survey and the ease of response.
The survey has been distributed by the digital communications manager via mail including a cover letter and an
anonymous survey link. The respondents were given three weeks to complete the survey. After the first week of
distribution a reminder has been sent out by the communications manager, after the second week another final
reminder including a personal mail has been sent out by the researcher.
4.4 Measures & Analysis
4.4.1 Independent Variables
A total of 18 items were used to measure the four independent variables Performance Expectancy (7 statements),
Effort Expectancy (5 statements), Social Influence (3 statements) and Value Expectancy (3 statements) (see Table A
in appendix).
Performance Expectancy was assessed in terms of expected Big Data usage benefits, such as smarter data use,

18
increased data quality, more valuable customer insights, and more intelligent business decisions. Effort Expectancy
was measured in terms of presumed complexity to understand and learn using Big Data, for example the ease of
learning how to using Big Data and the understanding of how Big Data can be used for one’s business line. Business
Value Expectancy was measured in terms of estimated added value for one’s business line in the short-, middle- and
long-term. Social Influence was measured in terms of expected support from the company and one’s manager, for
instance higher functional status and company support.
Consistent with previous UTAUT studies, all four variables were measured on a 5-point Likert-Scale, on which 1
has been the negative and 5 has been the positive end (1= totally disagree; 2= disagree; 3= neither agree nor
disagree; 4=agree; 5=highly agree). Although most items had positive wording, some items included negative
wording in order to reduce extreme response bias. Prior to analysis, items with negative wording were recoded to
ensure that for all items a higher score indicates greater degrees of Performance Expectancy, Effort Expectancy,
Business Value Expectancy or Social Influence.
4.4.2 Dependent Variable
In the original UTAUT model, Adoption Intention was measured on a 5-point Likert scale measuring the likeliness
to which employees intend to adopt a technology within <n> months (E.g. I intend to use the system in the next <n>
months. where 1= totally disagree and 5=totally agree). This might lead to the risk of ceiling effects, as respondents
have to estimate their intention to adopt a specific technology within a specific time period whereas they intend to
adopt it at a later point in time. Moreover, the given scale is not really suitable for assessing at what point in time
employees will start or intend to use a specific technology at a more accurate level.
In this study, the dependent variable Adoption Intention was therefore measured on a nominal, 4-point Likert scale
assessing the point in time at which employees intend to use Big Data. As respondents can choose between different
points in time, one can get a more detailed picture with respect to Big Data adoption.
As both, Big Data workshop attendants and non-attendants, were included in the sample, the measurement items
were slightly different for each group. Since workshop attendants were prepared for actual Big Data usage, they
were asked to indicate at what point in time they will start using Big Data (1 = “somewhere within the next 4
weeks”, 2= “somewhere within the next 6 months”, 3= “somewhere within the next 12 months”, and 4= “already
using it”). Non-attendants were asked to indicate at what point in time they would be interested in using Big Data (1

19
= “as soon as possible”, 2= “somewhere within the next 6 months”, 3= “somewhere within the next 12 months”,
and 4 = “not interested yet”). Before performing the analysis, the variables for Adoption Intention had to be recoded
for easier comparison between employees who already attended a Big Data workshop and employees, who were not
actively involved in Big Data activities yet. All variables were recoded to reflect the ascending levels of adoption
intention (see Table 2).
Table 2. Recoding variables for adoption intention
Workshop attendants Workshop non-attendants Recoding original variables
Recoded variables Recoding original variables
Recoded variables
1 à 3 1 = somewhere within the next 12 months
1 à 3 1 = somewhere within the next 12 months
2 à 2 2= somewhere within the next 6 months
2 à 2 2 = somewhere within the next 6 months
2 à 1 3= somewhere within the next 4 weeks
3 à 1 3 = as soon as possible
4 à 4 4 = already using it 4 à 0 0 = not interested yet
4.4.3 Moderator variables
Gender was measured on a nominal scale where 1 represented male and 2 represented female. Age was measured on
a ratio scale and has been recorded as its actual number.
Data Usage Experience was assessed in terms of frequency of data usage for one’s daily work. The corresponding
item was measured on a 6-point Likert scale, where 1 represented the positive and 6 the negative end (1= “on a daily
basis”; 2= “on a weekly basis”; 3= “on a monthly basis”; 4= “on a quarterly basis; 5 = “on a yearly basis”; 6=
“never”). Before analysis, the variables have been recoded to reflect the frequency of data usage in an ascending
order (1=>6; 2=>5; 3=>4; 4=>3; 5=>2; 6=>1). The higher the score, the more intensive the frequency of data usage
in working routine.
Decision-Making Behavior was assessed in terms of analytical-rational vs. intuitive-experiential decision-making
style. A total of four statements were used, which were adapted from the CEST-scale proposed by Seymour Epstein
(1998) and the REI suggested by Pacini and Epstein (1999) measured on a 5-point Likert-Scale.

20
4.5 Analysis
To test the internal consistency for each independent variable, a reliability analysis for each itemset has been
conducted using Cronbach’s alpha. The model was further checked for normal distribution by conducting a Shapiro-
Wilk test and examining the skewness and kurtosis of all independent and dependent variables. A moderator
regression analysis has been conducted using SPSS to investigate the relationship between the dependent variable
adoption intention and the independent variables Performance Expectancy, Effort Expectancy, Value Expectancy
and Social Influence, which might be modified by the moderating variables age, gender, data usage experience and
decision-making behavior.
5. RESULTS
5.1 Reliability
While Performance Expectancy and Business Value Expectancy show an acceptable reliability with Cronbach’s
alpha > 0.7, Effort Expectancy shows a low reliability with Cronbach’s alpha > 0.6 and Social Influence shows a
poor reliability with Cronbach’s alpha between 0.5 and 0.6 (see Table 3) (McCrae, Kurtz, Yamagata, & Terracciano,
2010). Also by excluding certain items with low correlations, the poor reliability of Effort Expectancy and Social
Influence could not be improved. However, both items will still be considered in the analysis due to specifications in
the model (Allen, 1997).
Table 3. Cronbach’s alpha coefficients UTAUT subscale Cronbach alpha coefficient Numbers of items Performance Expectancy .793 7 Effort Expectancy .622 5 Value Expectancy .706 3 Social Influence .573 4 Note. 0.5 < α: unacceptable; 0.5 ≤ α ≤ 0.6: poor; 0.6 ≤ α ≤ 0.7: acceptable; 0.8 ≤ α ≤ 0.9: good.
5.2 Normality and multicollinearity testing
Examining kurtosis and skewness of all predictor variables, all values lie between -1 and +1 indicating normal
distribution (see table 4).

21
Table 4. Skewness and kurtosis for normality testing UTAUT Skewness Kurtosis Performance Expectancy -.22 .28 Effort Expectancy .15 -.14 Value Expectancy .03 .03 Social Influence .21 .58 Adoption Intention -.81 .57
To detect the potential presence of multicollinearity among the four predictor variables, the variance inflation factor
(VIC) has been taken into account. As a rule of thumb, VIF-values higher than 10 are considered as indicator for
multicollinearity (O’Brien, 2007). For this study it can therefore be assumed that the predictor variables are not
highly correlated as no multicollinearity is present (see Table 5).
Table 5.
Collinearity statistics for all variables
Model Unstandardized Coefficients
Standardized Coefficients
Collinearity Statistics
B Std. Error
Beta t Sig. Tolerance VIF
(Constant) -,96 1.06 -.90 .37 Performance Expectancy
-.03 .28
.01 .09 .92 .50 1.99
Effort Expectancy
.15 .17 .09 .88 .37 .92 1.08
Value Expectancy
.35 .24 .19 1.4 .15 .61 1.63
Social Influence
.34 .23 .17 1.5 .14 .76 1.31
Note. Dependent variable: AdoptionIntention. 5.3 Regression Analysis
The results from regression analysis show that Performance Expectancy, Value Expectancy and Social Influence all
have a 𝑝 -value lower than .05, which indicates that a change in the value of one of those three predictor variables is
related to changes in Big Data Adoption Intention (see Table 6).

22
Table 6. Effects of independent variables and moderators on adoption intention. Independent variables and moderators
Standardized Coefficients Beta
Sig.
PerfExp .236 .023* PerfExp_Gen -.168 .098 PerfExp_Age .000 .998 PerfExp_DataExperience -.258 .013* PerfExp_DMBehavior -.219 .035* EffortExp .142 .175 EffortExp_Gen -.046 .649 EffortExp_Age .045 .681 EffortExp_DataExperience -0.92 .397 EffortExp_DMBehavior .155 .136 ValueExp .264 .011* ValueExp_DataExperience -.085 .066 ValueExp_DMBehavior .042 .048* SocialInfl .241 .020* SocialInfl_Gen -.073 .468 SocialInfl_Age .012 .911 Note. Dependent Variable: AdoptionIntention. * p ≤ 0.05
Performance Expectancy, thus the expected performance benefits associated with Big Data adoption, is found to
have a direct positive effect on the intention to use Big Data (𝛽 = .454, 𝑝 = .023*) supporting hypothesis H1a.
Accordingly, the higher the expected benefits associated with Big Data, the higher the intention to adopt Big Data.
Contrary to hypothesis H1b, the relationship between Performance Expectancy and Big Data Adoption Intention is
moderated by Data Usage Experience (𝛽 = -.215, 𝑝 = .013*) and Decision-making Behavior (𝛽 = -.219, 𝑝 = .035*)
in such a way that higher levels of data usage experience and higher levels of data-driven decision-making behavior
indicate lower levels of Big Data acceptance. Accordingly, hypothesis H1b can not be supported as both data usage
experience and decision-making behavior have a negative instead of a positive moderating effect on Big Data
acceptance. There were no significant interaction effects obtained from gender (𝛽 = -.160, 𝑝 = .098) and age (𝛽 =
.000, 𝑝 = .998) on the relationship between Performance Expectancy and Big Data Adoption Intention, so that
hypothesis H1c can be rejected.
Effort Expectancy did not seem to have a significant direct relationship to Big Data Adoption Intention (𝛽 = .232; 𝑝
= .175), so that hypothesis H2a is not confirmed. In consequence, the assumption that gender, age, data usage
experience and decision-making behavior impact the relationship between Effort Expectancy and Big Data Adoption
intention were not significant as well, so that hypotheses H2b and H2c cannot be supported.
23
Business Value Expectancy, referring to the expected short, medium and long-term business value created by Big
Data usage, had a significant positive effect on the intention to use Big Data (𝛽 = .496, 𝑝 = .011). The results
demonstrate that the higher the expected business value, the higher the intention to adopt Big Data. Accordingly,
hypothesis H3a can be accepted. Moreover, Data-driven decision-making behavior (𝛽 = -.042, 𝑝 = .048*) has a
positive moderating effect on the relationship between Business Value Expectancy and Big Data Acceptance, such
that higher levels of Business Value expectancy in combination with higher levels of data-driven decision-making
behavior have a negative effect on individuals’ intentions to adopt Big Data. Hypothesis 3b can therefore only be
partially supported.
Social Influence, thus the support from managers’ and company to use Big Data, had a significant positive effect on
the intention to use Big Data (𝛽 = .484; 𝑝 = .020). That means, the higher the perceived level of social influence, the
higher the individual’s intention to adopt Big Data providing support for hypothesis H4a. Data usage experience (𝛽
= -.214, 𝑝 = .053) has a significant, but negative moderation effect on Big Data Adoption intention. This is contrary
to what was anticipated by hypothesis H4b. Both gender (𝛽 = -.070, 𝑝 = .468) and age (𝛽 = .011, 𝑝 = .911) do not
show a significant moderation effect on the relationship between Social Influence and Big Data Adoption Intention
so that hypothesis H4c is rejected.
6. DISCUSSION & CONCLUSION
Given that the chance of success in introducing a new technology is highly related to the depth of understanding
which factors impact employees’ intentions to use it, the goal of this research was to investigate potential factors
affecting Big Data adoption. Based on current management literature and the UTAUT model, a research framework
has been developed fitting the context of Big Data.
In line with previous UTAUT research, the key results highlight that Performance Expectancy and Social Influence
fuel employees’ intentions to adopt Big Data. This implies that employees, who expect to gain job-related
performance benefits from Big Data and who believe that management supports and values their efforts to use Big
Data are more likely to adopt Big Data than those who perceive low levels of performance benefits and management
engagement. The results also show that Business Value Expectancy is positively associated with the intention to use

24
Big Data, which means that employees, who think that Big Data will create considerable value for their business line
in the short, medium and long-term are more motivated to adopt Big Data. These findings are highly valuable for
practitioners as they provide some empirically grounded orientation for the design of Big Data intervention plans:
(1) Organizations should clearly communicate performance benefits resulting from Big Data usage. By creating a
common understanding of how Big Data usage allows employees to generate job-related performance benefits, Big
Data acceptance will be higher.
(2) Organizations should develop strong leadership engagement. This implies mobilizing managers to encourage
employees make use of Big Data, for example by creating and communicating a Big Data-driven vision, providing
the needed resources and establishing data-driven mind-sets.
(3) Organizations should demonstrate the business value created through Big Data usage in the short, medium and
long-term.
In contrast to previous UTAUT studies, this study empirically concludes that Effort Expectancy is not a salient
factor impacting Big Data adoption intention. There might be several possible explanations for that. The research
results indicate that employees, who expect performance improvements and business value from Big Data usage, are
more likely to adopt Big Data. Accordingly, it might be the case that they put more emphasis on the benefits
associated with Big Data usage than the possible effort related to Big Data usage. It is also possible that the given
sample feels confident with the use of technology in general, so that effort expectancy does not play an important
role for their adoption intention.
Moreover, the findings obtained in this study do not verify the predictions about gender and age differences having
moderating effects on Big Data adoption intention. This indicates that irrespective of gender and age, employees
with higher performance expectations, business value expectations and social influence levels have higher intentions
to use Big Data than those with lower performance expectations, business value expectations and social influence
levels. This is contradictory to previous UTAUT studies, which indicated that gender and age significantly moderate
the effects of performance expectancy and social influence on technology adoption intention. A possible explanation
might be rooted in today’s more technology-driven world. Between 2002, when the original UTAUT model was
developed, and today, our world has gone through an ongoing digital transformation and the use of computers and
the internet as well as of new emerging technologies such as smartphones, tablets, and social media, have permeated
our daily lives. As a consequence, differences in technology adoption intention and use between male and female in

25
different age groups might have been diminishing so that they are no longer significant.
Another surprising result is that high levels of data-usage experience and data-driven decision-making behavior had
a significant, but negative moderating effect on Big Data adoption. A possible explanation for these findings can be
that employees, who are more experienced with data-usage and data-driven decision-making, might be more
skeptical about the Big Data hype. On the one hand, they might be satisfied with their current data analysis tools,
and on the other hand better aware of possible drawbacks. For instance, as Big Data technologies are still in their
emerging stages, companies might first be facing problems with data quality and analysis accuracy. Another
explanation might be that employees who are experiences with data-usage and/or are relying on data-driven
decision-making have made negative experiences with that resulting in lower levels of Big Data adoption intentions.
All in all, this study makes important contributions to the body of UTAUT and Big Data adoption literature
in several ways. Overall, this study found that the UTAUT constructs were a useful starting point in identifying
factors positively impacting Big Data adoption intention. Moreover, the research findings suggest that the UTAUT
model can be extended by including Business Value as additional independent variable to make it more suitable for
the Big Data context. However, the findings also revealed that the original UTAUT model has to be adapted to fit
the Big Data context challenging the generalizability of the UTAUT model.
In addition, this research has produced first insights into Big Data implementation research, which is still in its
infancy. As first step towards closing this knowledge gap, this research identified Performance Expectancy,
Business Value Expectancy and Social Influence impacting Big Data adoption intention. Future research might draw
on additional theories to help explain successful Big Data adoption on a more holistic level.
7. LIMITATIONS & FUTURE RESEARCH
First, the study was conducted in the digital department of one single organization, which results in several
limitations concerning the sample composition. On the one hand, employees working in a digital department might
in general be more open to adopt new technologies as they are closer to innovative digital channels than employees
working in classical offline departments. On the other hand, participants were free to choose if they want to take part
in this study or not, therefore it could be that especially employees having a personal interest in Big Data were
motivated to take part in the given study. A follow-up study in different organizations including employees from
both digital and non-digital departments could enrich the qualitative findings and make them more representative.

26
Second, the study was conducted at one specific point in time resulting in cross-sectional data. Moreover, as the
given organization has been in its initial Big Data introduction phase, the sample only consisted of employees who
were not using Big Data yet or who were somewhere in the beginning phase of Big Data usage. Accordingly, it
would be interesting to include both potential and actual Big Data users with different Big Data usage experience
levels in a longitudinal research to shed more light on how Big Data acceptance – focusing on both initial adoption
and usage behavior- changes over time and how company-wide Big Data acceptance can be ensured on the long run.
Third, as already mentioned in the discussion, this study has shown that the assumption that different levels of Big
Data adoption intention will be moderated by gender might have become obsolete. In future studies, it might be
more appropriate to include these variables as control variables rather than as moderator variables. Taking over a
more modern perspective, it would be more interesting to consider personality-related or behavioral variables rather
than gender-specific as possible moderators, for example assertiveness.
Last but not least, there is little prior research on Big Data adoption. Accordingly, findings from both UTAUT and
Big Data literature were combined in this study to make a first attempt to explain Big Data acceptance. To extend
this study, future research may draw on further adoption theories and explore effects of additional factors impacting
Big Data acceptance. For example, trust was found to play a role in technology acceptance (Belanche, Casaló &
Flavián, 2011) so that concerns about the veracity of Big Data, thus its reliability and accuracy, might represent an
impediment for Big Data acceptance.

27
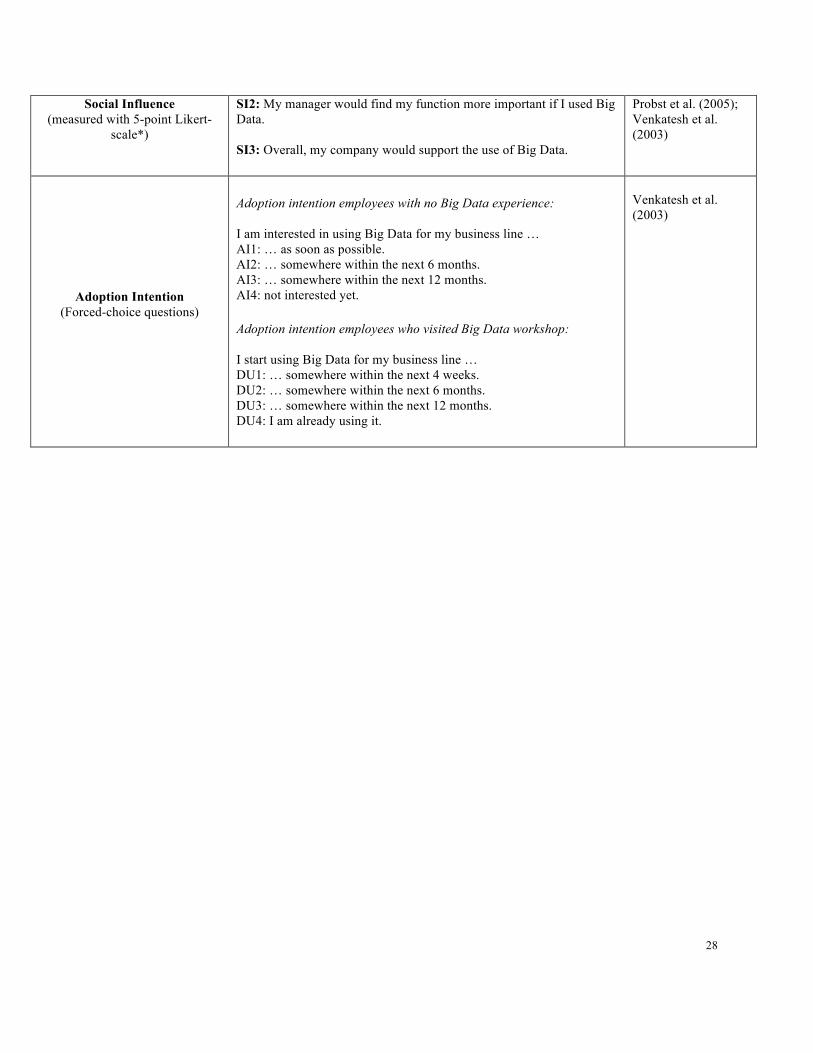
8. APPENDIX
Table 1A. UTAUT questionnaire items for Big Data adoption
Construct Corresponding items Item Sources
Performance Expectancy
(measured with 5-point Likert-scale*)
Assume you are using Big Data. PE1: Big Data would enable me to use customer data in a smarter way. PE2: Big Data would increase they quality of customer data I am using for my business line. PE3: Big Data would bring valuable customer insights for my business line. PE4: Big Data would have a positive impact on my work performance. PE5: Big Data would enable me to increase my productivity. PE6: Big Data would help me to work more customer-centric. PE7: Big Data would allow me to make more intelligent business decisions.
Moore & Benbasat (1991); MacAfee et al. (2012); Provost & Fawcett (2013); Venkatesh et al. (2003)
Effort Expectancy(measured with 5-point Likert-
scale*)
EE1: I have a clear understanding of how Big Data could be used for my business line. EE2: Learning to use Big Data would be easy for me. EE3: Generating insights from Big Data would be easy for me. EE4: Big Data would not be relevant for my business line. EE5: Learning to use Big Data would be highly time-intensive.
Venkatesh et al. (2003); Moore & Benbasat (1991); Nasri & Charfeddine (2012); Oliveira & Popovic (2014); Venkatesh, Davis & Davis (2003)
Business Value Expectancy(measured with 5-point Likert-
scale*)
AV1: Big Data would bring added value to my business line in the short-term. AV2: Big Data would bring added value to my business line in the mid-term.AV3: Big Data would bring added value to my business line in the long-term.
Chau (1996); Lu et al., (2003)
SI1: My manager would think that it is important to use Big Data for my business line.
Foon & Fah (2011); Karmeswaran, Kishore & Li (2015);
28
Social Influence(measured with 5-point Likert-
scale*)
SI2: My manager would find my function more important if I used Big Data. SI3: Overall, my company would support the use of Big Data.
Probst et al. (2005); Venkatesh et al. (2003)
Adoption Intention(Forced-choice questions)
Adoption intention employees with no Big Data experience: I am interested in using Big Data for my business line … AI1: … as soon as possible. AI2: … somewhere within the next 6 months. AI3: … somewhere within the next 12 months. AI4: not interested yet. Adoption intention employees who visited Big Data workshop: I start using Big Data for my business line … DU1: … somewhere within the next 4 weeks. DU2: … somewhere within the next 6 months. DU3: … somewhere within the next 12 months. DU4: I am already using it.
Venkatesh et al. (2003)
29
9. REFERENCES
Allen, M. P. (1997). Understanding Regression Analysis. New York City, New York: Springer US. Alwahaishi, S. & Snasel, V. (2013). Modeling the Determinants Affecting Consumers’ Acceptance and Use of Information and Communications Technology. International Journal of E-Adoption (IJEA), 5(2), 25-39. Barton, D., & Court, D. (2012). Making advanced analytics work for you. Harvard Business Review, 90(10), 78-83. Beath, C., Becerra-Fernandez, I., Ross, J., & Short, J. (2012). Finding value in the information explosion. MIT Sloan Management Review, 53(4), 18. Belanche, D., Casaló, L. V., & Flavián, C. (2012). Integrating trust and personal values into the Technology Acceptance Model: The case of e-government services adoption. Cuadernos de Economía y Dirección de la Empresa, 15(4), 192-204. Brown, S. A., Dennis, A. R., & Venkatesh, V. (2010). Predicting collaboration technology use: Integrating technology adoption and collaboration research. Journal of Management Information Systems, 27(2), 9-54. Buckby, S., Best, P., & Stewart, J. (2008). The current state of information technology governance literature. Business Information Systems: Concepts, Methodologies, Tools and Applications, 1657-1705. Chau, P. Y. (1996). An empirical assessment of a modified technology acceptance model. Journal of Management Information Systems, 13(2), 185-204. Chen, H., Chiang, R. H., & Storey, V. C. (2012). Business Intelligence and Analytics: From Big Data to Big Impact. MIS Quarterly, 36(4), 1165-1188. Chen, M., Mao, S., & Liu, Y. (2014). Big data: a survey. Mobile Networks and Applications, 19(2), 171-209. Chen, C. P., & Zhang, C. Y. (2014). Data-intensive applications, challenges, techniques and technologies: A survey on Big Data. Information Sciences, 275, 314-347. Choi, J., Nazareth, D. L., & Jain, H. K. (2010). Implementing service-oriented architecture in organizations. Journal of Management Information Systems, 26(4), 253-286. Davenport, T. H., Barth, P., & Bean, R. (2012). How big data is different. MIT Sloan Management Review, 54(1), 43. Davenport, T. H., & Dyché, J. (2013). Big data in big companies. SAS International Institute for Analytics, Inc. Retrieved on August 15, 2016 from https://www.academia.edu/4688908/Big_Data_in_Big_Companies_Date_May_2013_Authored_by Epstein, S. (1998). Cognitive-experiential self-theory. Advanced Personality, 211-238. Fan, W., & Bifet, A. (2013). Mining big data: current status, and forecast to the future. ACM sIGKDD Explorations Newsletter, 14(2), 1-5. Foon, Y. S., & Fah, B. C. Y. (2011). Internet banking adoption in Kuala Lumpur: an application of UTAUT model. International Journal of Business and Management, 6(4), 161. Gartner (2012). Retrieved on September 10, 2016 from the Gartner IT Glossary: http://www.gartner.com/it-glossary/big-data/
30
George, G., Haas, M. R., & Pentland, A. (2014). Big data and management. Academy of Management Journal, 57(2), 321-326. Gruzd, A., Staves, K., & Wilk, A. (2012). Connected scholars: Examining the role of social media in research practices of faculty using the UTAUT model. Computers in Human Behavior, 28(6), 2340-2350. Hashem, I. A. T., Yaqoob, I., Anuar, N. B., Mokhtar, S., Gani, A., & Khan, S. U. (2015). The rise of “big data” on cloud computing: Review and open research issues. Information Systems, 47, 98-115. Henderson, J. C., & Venkatraman, H. (1999). Strategic alignment: Leveraging information technology for transforming organizations. IBM Systems Journal, 38(2/3), 472. Im, I., Hong, S., & Kang, M. S. (2011). An international comparison of technology adoption: Testing the UTAUT model. Information & Management, 48(1), 1-8. James, M., Michael, C., Brad, B., Jacques, B., Richard, D., Charles, R., & Angela, H. B. (2011). Big data: The next frontier for innovation, competition, and productivity. The McKinsey Global Institute. Kaisler, S., Armour, F., Espinosa, J. A., & Money, W. (2013). Big data: issues and challenges moving forward. Paper presented at System Sciences (HICSS), 46th Hawaii International Conference on System Sciences, Wailea, Hawaii. Kiron, D., & Bean, R. (2013). Organizational alignment is key to big data success. MIT Sloan Management Review, 54(3), 1-6. Kwon, O., Lee, N., & Shin, B. (2014). Data quality management, data usage experience and acquisition intention of big data analytics. International Journal of Information Management, 34(3), 387-394. LaValle, S., Lesser, E., Shockley, R., Hopkins, M. S., & Kruschwitz, N. (2011). Big data, analytics and the path from insights to value. MIT Sloan Management Review, 52(2), 21. Lee, Y. C., Chu, P. Y., & Tseng, H. L. (2009). Exploring the relationships between information technology adoption and business process reengineering. Journal of Management & Organization, 15(02), 170-185. Luzipo, S., Van Biljon, J., & Herselman, M. (2015, May). Business process adoption in organisations: A case study from an insurance company in South Africa. Paper presented at the IST-Africa Conference, Lilongwe, Africa. McAfee, A., Brynjolfsson, E., Davenport, T. H., Patil, D. J., & Barton, D. (2012). Big data. The management revolution. Harvard Business Review, 90(10), 61-67. McCrae, R. R., Kurtz, J. E., Yamagata, S., & Terracciano, A. (2010). Internal consistency, retest reliability, and their implications for personality scale validity. Personality and Social Psychology Review, 15 (1), 28-50. McKenna, B., Tuunanen, T., & Gardner, L. (2013). Consumers’ adoption of information services. Information & Management, 50(5), 248-257. Mun, Y. Y., Jackson, J. D., Park, J. S., & Probst, J. C. (2006). Understanding information technology acceptance by individual professionals: Toward an integrative view. Information & Management, 43(3), 350-363. O’Brien, R. M. (2007). A caution regarding rules of thumb for variance inflation factors. Quality & Quantity, 41(5), 673-690. Oliveira, T., Thomas, M., & Espadanal, M. (2014). Assessing the determinants of cloud computing adoption: An analysis of the manufacturing and services sectors. Information & Management, 51(5), 497-510.
31
Pacini, R., & Epstein, S. (1999). The relation of rational and experiential information processing styles to personality, basic beliefs, and the ratio-bias phenomenon. Journal of Personality and Social Psychology, 76(6), 972. Parameswaran, S., Kishore, R., & Li, P. (2015). Within-study measurement invariance of the UTAUT instrument: An assessment with user technology engagement variables. Information & Management, 52(3), 317-336. Phillips-Wren, G., & Hoskisson, A. (2015). An analytical journey towards big data. Journal of Decision Systems, 24(1), 87-102. Provost, F., & Fawcett, T. (2013). Data science and its relationship to big data and data-driven decision making. Big Data, 1(1), 51-59. Russom, P. (2011). Big data analytics. TDWI Best Practices Report, Fourth Quarter, 1-35. Saleh, A. M., Haris, A. B., & Ahmad, N. B. (2014). Towards a UTAUT-based model for the intention to use solar water heaters by Libyan households. International Journal of Energy Economics and Policy, 4(1), 26. Son, J. Y., & Benbasat, I. (2007). Organizational buyers' adoption and use of B2B electronic marketplaces: efficiency-and legitimacy-oriented perspectives. Journal of management information systems, 24(1), 55-99. Tan, P. J. B. (2013). Applying the UTAUT to understand factors affecting the use of English e-learning websites in Taiwan. Sage Open, 3(4),1-12. Tsai, C., Lai, C., Chao, H., Vasilakos, A.V. (2015). Big data analytics: a survey. Journal of Big Data, 2(21), 1-32. Venkatesh, V. (2006). Where to go from here? Thoughts on future directions for research on individual�level technology adoption with a focus on decision making. Decision Sciences, 37(4), 497-518. Venkatesh, V., & Morris, M. G. (2000). Why don't men ever stop to ask for directions? Gender, social influence, and their role in technology acceptance and usage behavior. MIS quarterly, 24(1), 115-139. Venkatesh, V., Morris, M. G., & Ackerman, P. L. (2000). A longitudinal field investigation of gender differences in individual technology adoption decision-making processes. Organizational behavior and human decision processes, 83(1), 33-60. Venkatesh, V., Morris, M. G., Davis, G. B., & Davis, F. D. (2003). User acceptance of information technology: Toward a unified view. MIS quarterly, 27(3), 425-478. Waller, M. A., & Fawcett, S. E. (2013). Data science, predictive analytics, and big data: a revolution that will transform supply chain design and management. Journal of Business Logistics, 34(2), 77-84. Waehama, W., McGrath, M., Korthaus, A., & Fong, M. ICT Adoption and the UTAUT Model (2014, November). Paper presented at the International Conference on Educational Technology Information Technology (ICETIS2014), Bangkok, Thailand. Wu, Y. L., Tao, Y. H., & Yang, P. C. (2007, December). Using UTAUT to explore the behavior of 3G mobile communication users. Paper presented at the IEEE International Conference on Industrial Engineering and Engineering Management, Singapore, Malaysia. Yu, C. S. (2012). Factors affecting individuals to adopt mobile banking: Empirical evidence from the UTAUT model. Journal of Electronic Commerce Research, 13(2),104. Zhou, T., Lu, Y., & Wang, B. (2010). Integrating TTF and UTAUT to explain mobile banking user adoption. Computers in human behavior, 26(4), 760-767.