cross listing and investment decisions - rutgers...
TRANSCRIPT

Cross-Listing and Capital Investment Decisions
Sam Han Korea University Business School
Korea University [email protected]
Don Herrmann William S. Spears School of Business
Oklahoma State University [email protected]
Tony Kang William S. Spears School of Business
Oklahoma State University [email protected]
Michael Wolfe William S. Spears School of Business
Oklahoma State University [email protected]
Current version: December 29, 2010
We thank Giorgio Gotti, Ole-Kristian Hope, Wayne Thomas, seminar participants at McMaster University and seminar participants at the 2010 AAA Annual Meeting in San Francisco for their helpful comments.

Cross-Listing and Capital Investment Decisions
Abstract
This study examines how cross-listing in the U.S. relates to the efficiency of capital investment decisions. We find that U.S. cross-listed firms exhibit greater investment efficiency than foreign firms not cross-listing in the U.S. We then explore whether this finding is related to the type of cross-listing (exchange vs. non-exchange), the strength of the home country disclosure environment, and the level of analyst following. We observe a stronger association between cross-listing and investment efficiency for exchange-listed ADRs, subject to U.S. disclosure and enforcement requirements, than for non-exchange listed ADRs. We further find that this association is largely concentrated in exchange-listed firms from weaker home country disclosure environments where the potential benefits of cross-listing in the U.S. are greater. Finally, we document that the association between cross-listing and investment efficiency is generally stronger for firms with high analyst following. Additional sensitivity tests indicate the findings continue to hold when controlling for potential endogeneity using the Heckman procedure, a propensity matched sample, adding additional controls for earnings quality and level of disclosure, and weighting observations from each country equally. Our findings provide new evidence regarding the possible internal benefits to cross-listing. For instance, we provide evidence that actual managerial decisions, specifically capital investment efficiency, are associated with cross-listing.
Keywords: Cross-Listing; Investment Efficiency; Reputational Bonding

3
Cross-Listing and Capital Investment Decisions
1. Introduction
Stultz (2005) describes how the financial markets of many countries were closed to cross-
border trade of financial assets through World War II and that substantial liberalization in the
trade of financial assets across countries has taken place since then. He points out that financial
globalization can generate major economic benefits as it enables investors worldwide to diversify
risk, allows capital to flow where productivity is highest, and provides countries an opportunity
to reap the benefits of their respective comparative advantages. Cross-listing of shares has been a
major effort associated with the financial liberalization process. Karolyi (2006) notes how the
listing of shares across national borders has increased over the years despite the costs associated
with financial statement reconciliation, direct listing costs, exposure to legal liabilities, taxes and
various other trading frictions.
Prior literature on cross-listing documents various types of cross-listing benefits for the
firm including improvement in the firm’s information environment (e.g., Lang, Lins, Miller, and
Leuz 2003; Fernandes and Ferreira 2008), increase in return and volume reactions to earnings
announcements (Bailey, Karolyi, and Salva 2006), reduction in the cost of equity capital (Hail
and Leuz 2006), increase in liquidity and investor recognition (Forester and Karolyi 1999), and
increase in firm value (e.g., Miller 1999; Doidge, Karolyi and Stultz 2004). However, there is
limited evidence on whether cross-listings simply affect the market’s perception of an
improvement or whether cross-listed firms actually take specific actions to improve governance
and managerial decisions. Our investigation contributes to this line of research by focusing on an
important aspect of managerial decision-making – the capital investment decisions made by

4
managers. Specifically, using the framework developed in Biddle, Hilary and Verdi (2009), we
examine how cross-listing in the U.S. relates to firms’ investment behaviors.
There are four ways a foreign firm can enter the U.S. capital market as an American
Depositary Receipt (ADR). Level I ADRs trade in the over-the-counter market, but not on any of
the U.S. stock exchanges. Level I ADRs must supply the U.S. Securities and Exchange
Commission (SEC) with copies of reports, shareholder communications, and other materials
requested to be prepared pursuant to regulations in its home country, but are not subject to U.S.
GAAP reporting under the U.S. Securities Exchange Act of 1934. Nevertheless, they are still
subject to Section 10(b) and Rule 10(b)-5 under the U.S. Securities Exchange Act. In contrast,
Level II and III ADRs list on an organized exchange in the U.S. (e.g., NYSE, AMEX, or
NASDAQ) and are required to reconcile their financial information with U.S. GAAP under form
20-F.1 Both Level II and III ADRs must file a registration statement and comply with SEC
regulations. Level III ADRs are the only type of ADRs that are allowed to raise new shares in the
U.S. The fourth type of ADR, Rule 144a, provides a safe harbor from the registration
requirements of the Securities Act of 1933 including the reconciliation to U.S. GAAP for certain
large, private sales of restricted securities to qualified institutional buyers. These buyers are
generally large institutional investors with over $100 million in investable assets.
Coffee (1999, 2002) suggests that foreign firms voluntarily choose to list in the United
States (i.e., bond) to enhance investor protection and potentially reduce agency costs (see also
Ball 2001; Stulz 1999; Reese and Weisbach 2002).2 Coffee (2002) defines bonding as a
mechanism by which firms incorporated in a jurisdiction with weak minority shareholder 1 Beginning in 2007, the SEC makes an exception to the requirement to reconcile financial information with U.S. GAAP under form 20-F for firms already reporting under International Financial Reporting Standards. 2 As Coffee (2002) notes, the notion of bonding comes from the law and economics literature where it is used to refer to the costs or liabilities an agent or entrepreneur incur in order to assure investors that (s)he will perform as promised.

5
protection voluntarily subject themselves to higher disclosure standards and stronger investor
protection in order to be more attractive to investors who, otherwise, might discount stocks with
high information risk related to factors such as poor disclosure and risk of minority expropriation.
Cross-listing can increase the public value of their shares by lowering the cost of capital due to
an increased shareholder base, increasing stock liquidity and growth opportunities, and
improving reputation and visibility. This process occurs either through enforcement of law
(referred to as legal bonding) or through monitoring by financial intermediaries such as financial
analysts, underwriters, auditors, credit-rating agencies, and stock exchanges (referred to as
reputational bonding).
The bonding view suggests that managers’ commitment to protect minority shareholders’
interest is positively associated with cross-listing as it increases the expected cost of extracting
private benefits. Consistent with this view, Reese and Weisbach (2002) report that equity issues
increase following cross-listings and that this phenomenon is more pronounced for cross-listings
from weak investor protection countries, suggesting that the desire to protect shareholder rights
is an important reason why some foreign firms cross-list in the U.S. Similarly, Doidge, Karolyi
and Stultz (2004) argue that cross-listing helps controlling shareholders commit to limit their
expropriation from minority shareholders. They also find that cross-listing firms have higher
growth opportunities than their peers that do not cross-list. Hail and Leuz (2009) provide
evidence that cross-listing in the U.S. is associated with a reduction in the cost of equity capital
and that this association is larger for firms from countries with weaker institutional features, in
line with the idea that cross-listings are a way to ‘opt-out’ of the home country’s weaker
institutional framework.

6
However, Licht (2003) argues that managers in weak protection countries might be
reluctant to cross-list in the United States because of the potential loss of private benefits. For
instance, better firms signal their business quality by listing in the United States but without
much corporate governance improvement. In a similar context, Siegel (2005) suggests that the
SEC and minority shareholders have not effectively enforced the securities laws against cross-
listed foreign firms.
In his review of cross-listing, Karolyi (2006) notes that the effects of the decision to
cross-list are not fully understood. Bailey, Karolyi, and Salva (2006) conclude that “researchers
are still unable to determine clearly the motivations for pursuing international cross-listings in
the first place.” Similarly, Leuz (2006) points out that the sources of cross-listing benefits need
further investigation. While there is some evidence on how investors and financial analysts
perceive cross-listing decisions, there is little evidence on how managerial decisions improve
with cross-listing. Our investigation helps fill this void in the literature by focusing on whether
cross-listed firms make better capital investment decisions than foreign firms that do not cross
list.
We find that firms cross-listing in the U.S. exhibit greater investment efficiency than
non-cross-listed firms. We observe this pattern mainly in exchange-listed ADRs (Level II and
Level III) rather than non-exchange listed ADRs (Level I and Rule 144a). When we split the
sample based on the home country disclosure environment, we find consistently stronger results
for exchange-listed firms from weaker disclosure environments. We then explore the impact of
analyst following and find that high analyst following generally improves the relation between
cross-listing and investment decisions. While previous research documents the benefits of cross-

7
listing based on share price and analyst behaviors, this is the first study to explore the relation
between cross-listing and investment efficiency.
This paper is organized as follows. In the next section, we provide a background on
cross-listing and develop our hypotheses. In Section 3, we describe the research design and
sample selection procedures. In Section 4, we discuss the primary research findings and in
Section 5 we address additional sensitivity analyses. Finally, in Section 6 we present a summary
of the findings and conclusions.
2. Background and Hypotheses Development
Cross-listing shares on more than one stock exchange is a practice that dates back to the
18th century (e.g., Gherig and Fohlin 2006; Foucault and Gherig 2008). Firms choose to cross-list
shares for many reasons. Karolyi (2006) points out that cross-listings enable firms to avoid
investment barriers, increase their visibility, enhance their liquidity, restrain expropriation by
controlling shareholders, and provide a signal of quality financial reporting. Stultz (2005) notes
that the cost of corporate insiders extracting private benefits from the firms they control – such as
excessive spending on corporate planes to outright theft – varies with the rights different
jurisdictions grant corporate investors and the degree to which these rights are enforced.
Firms in countries with weak institutional features have limited access to external capital
given that outside investors in those environments tend to price protect themselves from possible
expropriation by controlling shareholders. Hence, firms with external capital needs have
incentives to assure outside investors that their funds will not be misused. Cross-listing shares in
the U.S. is often considered such a device as the listing requires increasing disclosure (especially
disclosure of sensitive corporate governance-related information) making it more difficult and
costly for managers and controlling shareholders to extract private control benefits to the

8
detriment of outside investors. However, committing to the more rigorous disclosure and
regulatory requirements in the U.S. can also be expensive due to the need to comply with U.S.
GAAP, a process which is known to be costly (e.g., Biddle and Saudagaran 1989, Saudagaran
and Biddle 1992).3
Legal bonding refers to firms incorporated in a jurisdiction with weak protection of
minority rights or poor enforcement mechanisms voluntarily subjecting themselves to higher
disclosure standards and stricter enforcement in order to attract investors. A firm’s corporate
governance may improve subsequent to cross-listing if the process of cross-listing increases the
expected cost to managers of extracting private benefits and commits the firm to protect minority
shareholders’ interests. Cross-listing in the U.S. subjects a non-U.S. firm to numerous provisions
of U.S. securities law. Cross-listing obligates the firm to conform to more stringent financial
reporting standards, to periodically file reports with the SEC, and to comply with the
requirements of the exchange on which it lists. Firms cross-listing on an organized exchange (i.e.,
Level II and III ADRs) are subject to more extensive reporting and disclosure requirements.
Further, raising capital by way of a public issue (Level III ADRs) requires additional disclosure
of an SEC F-1 filing (prospectus) for a public offering and an F-2 or F-3 filing for subsequent
offerings (Bailey et al. 2006). In contrast, firms that do not list on an organized exchange (i.e.,
Level I ADRs and 144a’s) are subject to less stringent supervision by the SEC.
Reputational bonding refers to foreign firms entering the U.S. equity markets exposing
themselves to the scrutiny of financial intermediaries such as underwriters, auditors, debt rating
agencies, and financial analysts (Coffee 2002). Analytical research suggests that firms can
3 According to the SEC, the estimated cost of preparing the U.S. GAAP reconciliation required in the form 20-F is around $4.6 million. In addition, listing costs on the NYSE typically amount to less than $50,000 initially with a modest annual fee thereafter and that these costs are much less for AMEX and NASDAQ firms, suggesting that listing fee is relatively minor compared with the cost of meeting financial disclosure requirements.

9
demonstrate over time, that through good internal behavior, they deserve a reputational discount
in the market for external capital (Diamond 1991). Siegel (2005) argues that even without
effective law enforcement, the additional voluntary disclosure and subsequent investor following
that result from cross-listing enables many firms to strengthen reputational bonding. He further
claims that the prospect of creating a reputational asset can lead many firms to observe rules that
they are not required to follow and that reputational bonding can explain the growth in the
market for cross-listings even in the absence of effective U.S. law enforcement.
Firms’ capital investment-cash flow sensitivities are often regarded as a key indicator of
economic productivity. Corporate finance theory suggests that managers invest in projects until
the marginal rate of return equals the market-determined discount rate (Fisher 1965). Therefore,
shareholders’ wealth can be measured as the present value of cash flows discounted at the
opportunity cost of capital, i.e., the market determined rate (Tobin 1969; Copeland and Weston
1992). To maximize firm value, managers do not always use internally generated cash flows for
capital investment, but rather distribute these excess cash flows to shareholders in the form of
share repurchases or dividends.
Agency conflicts can hinder managers from achieving optimal investment decisions for
several reasons. A common agency conflict is adverse selection wherein managers seek to
exploit private information to issue securities at inflated prices. As a consequence, investors
rationally withhold capital (Myers 1984; Myers and Majluf 1984). Another agency conflict is
moral hazard wherein managers using external financing have an incentive to engage in
perquisite consumption and empire building rather than returning excess cash to investors
(Jensen and Meckling 1976; Hope and Thomas 2008). Under both situations, managers are more

10
likely to rely on internally generated cash flows for making capital investments, increasing the
sensitivity of internally generated cash flow to capital investment.
As Biddle, Hilary and Verdi (2009) note, better monitoring of managers can improve
capital investment decisions by curbing managerial incentives to engage in value destroying
activities such as empire building. They find that better monitoring (through corporate disclosure)
improves investment decisions. While their evidence is based on the general nature of financial
reporting quality, we focus on the efficacy of cross-listing as a corporate monitoring mechanism
with the potential to impact capital investment decisions. To the extent that cross-listing in the
U.S. improves corporate governance through legal bonding, reputational bonding, or both,
mitigating the above mentioned frictions, we expect improved capital investment efficiency for
firms cross-listing in the U.S. Based on this line of reasoning, our first hypothesis is stated as
follows:
H1: Foreign firms cross-listed in the U.S. will have greater investment efficiency than foreign
firms that are not cross-listed.
During our sample period, U.S. regulatory standards demanded that Level II and Level III
ADRs comply with U.S. Generally Accepted Accounting Principles (U.S. GAAP) either by
filing item 17 (partial reconciliation to U.S. GAAP) or item 18 (full reconciliation by filing a 10-
K report) of the 20-F reconciliation.4,5 Level II and Level III ADRs must also comply with the
requirements of the exchange on which it lists, and at least to some extent conform to U.S.
4 Exceptions are Canadian and Israeli firms that list directly, a, few Dutch firms that list as New York Registry Shares, and a handful of European companies that list directly as Global Registered Shares. Following extant literature (e.g., Doidge et al. 2004) we do not include these firms in our sample. ADR has been by far the most popular mode of listing for foreign firms. As of December 31, 1999, approximately 96% of foreign firms listed in the United States were ADRs (Citibank 2000). 5 These requirements for Level II and III American Depositary Receipts (ADRs) are often justified by the presumption that non-U.S. accounting and disclosure standards are not as stringent as U.S. GAAP.

11
security laws, providing a mechanism by which foreign firms can voluntarily adopt shareholder
protections under U.S. security laws (Reese and Weisbach 2002).
In contrast, foreign firms that enter the U.S. market and trade in the over-the-counter
market (known as Level I ADRs or “pink sheet”) or have limited secondary trading under Rule
144a do not need to comply with U.S. GAAP because of the 1934 Act’s exemption under Rule
12g3-2(b) for unlisted companies that furnish home country information to the SEC.6 Regardless
of whether securities must be registered, the 1934 Act and Rule 10b-5 make it illegal to commit
fraud in conjunction with the sale of securities in the United States. A defrauded investor can sue
for recovery under the 1934 Act.7
If legal bonding plays an important role in mitigating adverse selection and moral hazard
problems, we should observe this effect to be more pronounced for exchange-listed firms, which
subject themselves to U.S. disclosure and enforcement requirements. In turn, we expect better
investment decisions being made for exchange-listed firms. However, critics of legal bonding
argue that such bonding has not been effective. For example, Siegel (2005) claims that the SEC
enforcement on foreign firms has been ineffective and that reputational bonding, rather than legal
bonding, likely better explains cross-listing benefits. In summary, if legal bonding holds, we
expect the relation between cross listing and investment decisions to be stronger for firms listed
on a stock exchange. However, if reputational bonding mechanisms are as effective as legal
6 Rule 144a securities (sometimes referred to as “PORTAL”) are placed privately (as opposed to being traded publicly) to qualified institutional investors. 7 A recent example is the Roche Holdings case in 2002, where their Level 1 ADR investors had a class action lawsuit launched against the company for material misstatements (Prime Zone Media Network, Inc., May 31, 2002). Roche Holdings Ltd. entered into a class action suit for material misstatements made by it regarding the competitiveness of the vitamin market. The court determined that Roche’s plea agreement with the United States government regarding its subsidiaries’ involvement in a worldwide conspiracy to fix vitamin prices was not made public until after the ADRs were purchased by the plaintiff, causing the plaintiff to purchase the ADRs at artificially inflated prices.

12
bonding mechanisms, we could find the relation between cross listing and investment decisions
to be equally strong for non-exchange listed ADRs. Therefore, we state our second hypothesis as
follows:
H2: The association between cross-listing in the United States and the quality of capital
investment decisions is greater for exchange-listed foreign firms than non-exchange-listed foreign firms.
Rajan and Zingales (2003) note that “to function properly, a financial system requires
clear laws and rapid enforcement, an accounting disclosure system that promotes transparency,
and a regulatory structure that protects consumers and controls for risk.” Consistent with this
idea, Biddle and Hilary (2006) suggest that transparent accounting reduces both adverse
selection (i.e., the tendency to issue securities at an inflated price) and moral hazard (i.e.,
perquisite consumption using assets in place) by improving contracting and monitoring. As a
result, firms located in countries with more stringent financial reporting and disclosure standards
should make better investment decisions.
Prior studies find that firms located in countries with weaker investor protection are more
likely to accumulate private control benefits (e.g., Reese and Weisbach 2002; Dyck and Zingales
2004; Doidge et al. 2004). Hence, from an agency cost perspective, while firms in a weaker
financial reporting and disclosure environment may have greater costs in the form of control
benefits given up to cross-list in the U.S, the marginal benefits of cross-listing should also be
greater. Verrecchia (1983) suggests that firms determine their optimal disclosure level after
considering both the costs and benefits of disclosure. For ADRs, this means that firms from
weaker legal environments, where disclosure levels tend to be lower but private control benefits
tend to be greater, might enjoy a higher marginal benefit from improved disclosure (as they are

13
likely to be further away from the optimal disclosure level) while incurring higher marginal costs
of disclosure from endangering their private control benefits.
In line with this idea, Lang et al. (2006) show that ADRs from countries with stronger
investor protection demonstrate less evidence of earnings management than those from weaker
investor protection countries. Hope et al. (2007) find that firms from stronger legal environments
are more likely to list on an organized exchange in the U.S. and comply with U.S. GAAP.
Collectively, these results suggest that improvements in cross-listing firms’ corporate
governance practices are related to the institutional factors of the home country.
Based on these findings, we expect the relation between cross listing and investment
decisions to vary with the home country disclosure level of a firm. We focus on disclosure level
as it has been shown to be a form of corporate governance mechanism that explains firms’
investment decisions (Biddle and Hilary 2006). Cross-listing is expected to be more (less) costly
for firms from weaker (stronger) disclosure environments, but the expected benefits are also
expected to be greater (smaller). Thus, we predict that firms from weaker disclosure
environments reap greater benefits from a U.S. cross-listing in the sense that they experience a
greater association with investment efficiency. We state our third hypothesis as follows:
H3: The association between cross-listing in the United States and the quality of capital
investment decisions is more pronounced for firms from weaker disclosure environments. 3. Research Design
3.1 Dependent Variables
Our dependent variable is the level of investment. Following prior research (e.g., Biddle,
Hilary and Verdi 2009), we use two proxies for the level of investment in a given year: INV1 is
equal to the sum of the change in fixed assets and depreciation scaled by lagged total fixed assets;
14
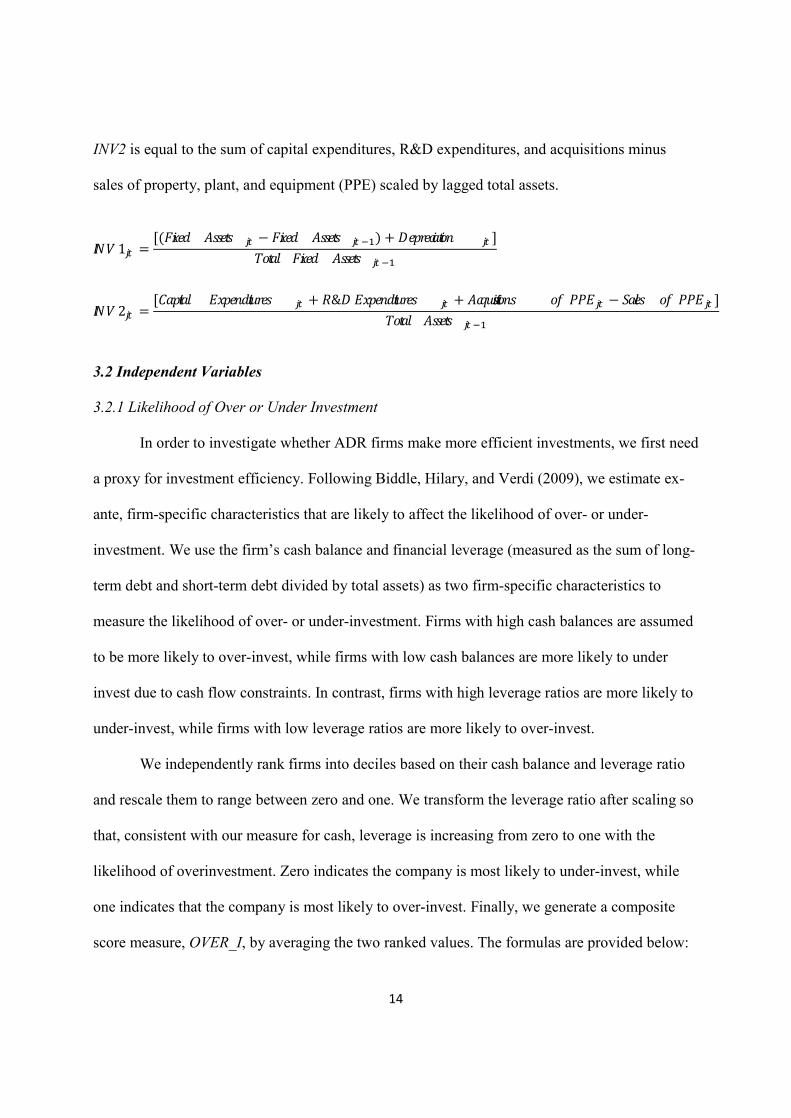
INV2 is equal to the sum of capital expenditures, R&D expenditures, and acquisitions minus
sales of property, plant, and equipment (PPE) scaled by lagged total assets.
1 = [( − ) + ]
2 = [ + & + − ]
3.2 Independent Variables
3.2.1 Likelihood of Over or Under Investment
In order to investigate whether ADR firms make more efficient investments, we first need
a proxy for investment efficiency. Following Biddle, Hilary, and Verdi (2009), we estimate ex-
ante, firm-specific characteristics that are likely to affect the likelihood of over- or under-
investment. We use the firm’s cash balance and financial leverage (measured as the sum of long-
term debt and short-term debt divided by total assets) as two firm-specific characteristics to
measure the likelihood of over- or under-investment. Firms with high cash balances are assumed
to be more likely to over-invest, while firms with low cash balances are more likely to under
invest due to cash flow constraints. In contrast, firms with high leverage ratios are more likely to
under-invest, while firms with low leverage ratios are more likely to over-invest.
We independently rank firms into deciles based on their cash balance and leverage ratio
and rescale them to range between zero and one. We transform the leverage ratio after scaling so
that, consistent with our measure for cash, leverage is increasing from zero to one with the
likelihood of overinvestment. Zero indicates the company is most likely to under-invest, while
one indicates that the company is most likely to over-invest. Finally, we generate a composite
score measure, OVER_I, by averaging the two ranked values. The formulas are provided below:

15
_1 = ℎ − 19
= − − 19 + 1
_ = (_1 + _2)2
3.2.2 Cross-listing (ADR)
American Depositary Receipts (ADRs) are negotiable certificates issued by an American
bank denominated in US dollars representing a specific number of shares of a foreign company.
ADRs are traded on major stock exchanges (NYSE, AMEX and NASDAQ) and over-the-
counter markets (e.g. OTC Bulletin Boards, Pink Sheets) and all dividends are paid in US dollars.
For the primary analysis, we form an indicator variable equal to one for ADR firms and zero
otherwise. Since stricter reporting requirements are applied for ADRs listed on an exchange, we
also examine whether investment decisions differ between exchange-listed ADRs (Levels II and
III) and non-exchange listed ADRs (Level I and Rule 144a). We further examine whether the
association between cross-listing and capital investment decisions differ depending on the
strength of a firm’s home country disclosure environment and level of analyst following.
3.2.3 Control Variables
We include controls for effects that could potentially confound our results. Following
prior studies, we control for firm size (SIZE) because larger firms exhibit a relatively lower
growth rate in fixed assets than smaller firms. SIZE is measured as the log of total assets. Thus
we expect firm size to be negatively associated with capital investment (INV). Second, we add a
control for capital structure (CAP) since firms financed more with debt are less likely to increase
the level of new capital investment. CAP is measured as the ratio of long-term debt to the sum of

16
long-term debt and the market value of equity. Based on this, we expect a negative association
between capital structure and investment. Firms that pay dividends (DIV) are less likely to have
positive net present value projects. Thus we expect a negative association between firms that pay
dividends and capital investment. We include an indicator variable for loss (LOSS) to proxy for
the financial distress of a firm. While firms’ capital investments are expected to be smaller when
they face financial constraints, unsuccessful over-investment may also be associated with less
profitable firms. Therefore, we include this control variable with no expectation regarding the
sign. Finally, since growth firms are more likely to expand investments, we expect that firms
with a low book-to-market ratio (BM) are associated with more capital investment. Table 1
provides formal definitions of the variables used in our empirical tests.
[Insert Table 1 here]
3.3 Regression Model
We examine whether cross-listed firms decrease (increase) the level of capital investment
in situations where they are more likely to over-invest (under-invest). We use the following
regression model to test this prediction.
= + + × _ + b_ + b + b+ b + b + b + + + +
where INVjt = INV1 is the change in fixed assets and depreciation scaled by lagged total fixed assets. INV2 is the R&D, capital, and acquisition of PPE minus the sale of PPE scaled by lagged total assets.

17
ADRjt = An indicator variable that equals one if the firm is cross-listed in the US and zero otherwise.
OVER_Ijt = OVER_I is a continuous variable of over-investment between 0 and 1. This is measured by the decile ranks based on cash and the leverage ratio.
SIZEjt = The log of total assets. CAPt = Capital structure is measured as the ratio of long-term
debt to the sum of long-term debt and the market value of equity.
DIVjt = An indicator variable that equals one if the firm paid dividends and zero otherwise.
LOSSjt = An indicator variable that equals one if net income before extraordinary items is negative and zero otherwise.
BMjt = The ratio of book value of equity to the market value of equity.
If U.S. cross-listed firms on average invest more than non-cross-listed firms, the ADR
coefficient () will be positive. If a U.S. cross-listing discourages under-investment (i.e., among
firms that are likely to under-invest, cross-listed firms under-invest less than non-cross-listed
firms) or if a U.S. cross-listing mitigates over-investment (i.e., among firms that are likely to
over-invest, cross-listed firms over-invest less than non-cross-listed firms), the interaction
between ADR and OVER_I () will be negative. This would suggest that among ADRs, those
that are more likely to over-invest (under-invest) actually invest less (more). If ADR firms that
are likely to over-invest invest less than an average firm, the sum of the coefficients and
will be negative. To the extent that non-ADR firms that are likely to over-invest ex-ante do over-
invest, the OVER_I coefficient () will be positive.
We estimate the above model using Ordinary Least Squares (OLS) and adjust the
standard errors for heteroskedasticity proposed by White (1980). In addition to the control
variables that might be related to the capital investment as discussed in the previous section, we
also include year fixed effects, industry fixed effects using 2-digit SIC codes, and country-level

18
indicator variables to control for possible year-, industry-, and country-specific shocks to capital
investment.
3.4 Sample Selection
Data about ADR firms and their exchange listing are obtained from the list of ADRs
provided by the Bank of New York. We obtain the accounting data needed to construct the
variables from COMPUSTAT Global, a database of listed companies from around the world.
Analyst coverage data is obtained from the I/B/E/S database. The sample period is from 1990 to
2006. The sample used in the main analysis consists of 35,272 firm-year observations with data
available to estimate our empirical models. The sample size varies for each empirical model
depending on the variables required. In order to mitigate the potential influence of extreme
observations in the sample, we winsorize all continuous variables used in the empirical analysis
at the 1% and 99% levels.
4. Empirical Results 4.1 Descriptive Statistics
Panel A of Table 2 summarizes the descriptive statistics used in our empirical analyses.
Panel A indicates that INV1 and INV2 have means (medians) of 0.3728 (0.1318) and 2.3906
(0.4943), respectively. The mean ADR is approximately 2.5%, suggesting that around 2.5% of
our sample observations list as ADRs. By design, the mean and median of Over_1 is 0.50. The
mean of capital structure (CAP) equals 15.66%, the percentage of dividend paying firms (DIV) is
69.21%, and the percentage of firms reporting a loss (LOSS) is 22.13%.
Panel B of Table 2 provides correlations among selected variables used in the study. The
level of investment is highly correlated with our empirical measures for over-investment. The

19
two investment measures (i.e., INV1 and INV2) are highly positively correlated with a Pearson
correlation of 0.4072. The correlation between INV1 (INV2) and OVER_I is 0.1107 (0.0373),
significant at the 1% level. Control variables related to financing activities are also significantly
correlated with our dependent variable, INV. For example, both INV variables are significantly
negatively correlated with SIZE and CAP at the 1% level.
[Insert Table 2 here]
4.2 Primary Results
We first examine whether foreign firms cross-listing in the United States have greater
investment efficiency than foreign firms that are not cross-listed. Table 3 reports the results using
proxies for investment efficiency based on the balance in cash and the leverage ratio, as
discussed in section 3.2.1. We also control for other factors that may be related to the level of
investment including country-, industry-, and year fixed effects. Panel A provides the investment
efficiency tests using the change in fixed assets and depreciation scaled by lagged total assets as
the dependent variable (INV1). Panel B presents the investment efficiency tests based on our
second measure of capital investment (INV2) measured as R&D, capital, and acquisition of PPE
minus the sale of PPE scaled by lagged total assets. The first two columns of Panels A and B
present the overall regression results.
In both the pooled and Fama-MacBeth regressions, the coefficient on ADR is positive
and significant as the main effect, suggesting that cross-listed firms on average invest more.8
More importantly, the coefficient on the interaction between ADR and OVER_I is negative and
8 Since the pooled OLS regressions are potentially subject to upwardly biased t-statistics due to serial correlation, year by year regressions (i.e., Fama-MacBeth regressions) are also reported. Although the t-statistics on the interaction between ADR and over-investment are smaller in the Fama-MacBeth regressions, the direction and statistical significance are consistent with the results using the pooled data.

20
significant for two separate measures of investment reported in Panels A and B, respectively. In
other words, among firms that are likely to over-invest (under-invest), ADRs over-invest (under-
invest) less. These results support Hypothesis 1, which states that foreign firms cross-listed in the
U.S. will have greater investment efficiency than foreign firms that are not cross-listed. The
second columns of Panels A and B report year-by-year regression results, which are consistent to
the findings reported in the pooled regressions.
4.3 Exchange Listed vs. Non-Exchange Listed
The final two columns in Panels A and B of Table 3 present the pooled results dividing
the cross-listed firms into non-exchange listed and exchange listed samples. The first sub-sample
includes non-exchange listed firms (Level I and Rule 144a) and the second sub-sample consists
of all firms listed on a major exchange such as the NYSE, AMEX, or NASDAQ (Levels II and
III). We separate the sample in order to examine Hypothesis 2 regarding the potential effect of
exchange listing for ADRs on the level of investment. We explore whether the hypothesized
relation holds for both sub-samples as the non-exchange listing (exchange listing) ADRs are
exempt from (conform to) U.S. reporting requirements.
We find that the ADR coefficient is positive and significant for both measures of
investment in the exchange listing sample, but the results are mixed in the non-exchange-listed
sample. The negative coefficient on the interaction between ADR and over-investment is
statistically significant only for the exchange-listing sub-sample. Tests for a significant
difference in the interaction coefficients between exchange listing and non-exchange listing
subsamples are statistically significant at the 5% level and 1% level for the two measures of
investment. In sum, the results in Table 3 support the notion that firms cross listed on major U.S.
exchanges exhibit greater investment efficiency i.e., mitigating over- and under-investment

21
problems. This finding also supports legal bonding, finding an association between cross-listing
and greater investment efficiency only for exchange-listed ADRs subjecting themselves to more
strict security regulation in the United States.
[Insert Table 3 here]
4.4 High vs. Low Levels of Home Country Disclosure
Table 4 presents the regression results divided based on the home country disclosure
environment in order to examine Hypothesis 3 and test whether the association between cross-
listed firms and the quality of investment decisions is more pronounced for firms based in
countries with weaker corporate disclosure. As a proxy for the level of disclosure, we use the
CIFAR index issued by the Center for International Financial Analysis and Research. This
measure captures both mandatory and voluntary disclosure components. We classify countries as
low level of disclosure using the cross-sectional median in the sample (71) as a cut-off point. If
the CIFAR score is less than the median, the country is classified as a country with weaker
corporate disclosure. While a cross-listing is likely to be more costly for firms from weaker
disclosure environments, the expected benefits are also expected to be greater. Thus, we predict
that for firms from weaker disclosure environments, which are likely to reap greater benefits
from cross-listing (e.g., in the form of improved managerial monitoring), the association between
U.S. cross-listing and investment efficiency is expected to be stronger.
Panel A of Table 4 presents the findings examining investment efficiency conditional on
a weak/strong level of disclosure using our first investment measure (INV1) as the dependent
variable. Comparing weak and strong disclosure countries, we find that the interaction between
ADR and over-investment is negative and significant only for major exchange listing firms from

22
weak disclosure environments. When we further investigate the relation using the second
investment measure in Panel B of Table 4, we also find the coefficient on the interaction between
cross-listing and over-investment to be significantly negative only in the major exchange listing
firms from weaker disclosure regimes. These results suggest that only firms from countries with
a lower level of disclosure experience improvement in investment efficiency, and then, only if
they are listed on a major U.S. stock exchange. This again points to the role and importance of
legal bonding in the development of firms’ financial reporting and corporate governance
structures.
[Insert Table 4 here]
4.5 Analyst Coverage
Prior research suggests that financial analysts act as external monitors of financial
reporting and management practices (Jensen and Meckling 1976, Healy and Palepu 2001). For
instance, Knyazeva (2009) finds that greater intensity and quality of analyst following
contributes to higher profits, lower degree of diversification, M&A activity, lower leverage and
more equity issuance, higher cash holdings, and less earnings management. Her evidence
suggests that analyst coverage is one of the primary factors affecting the information
environment. Since a firm’s information environment moderates their investment decisions and
complements their financial reporting and disclosure, a relevant question would be whether the
relation between cross-listing and investment efficiency is affected by analyst coverage. We
expect that the relation between cross-listing and investment efficiency should be stronger for
firms with high analyst following.

23
To test this idea, we examine if higher analyst coverage is associated with better
investment decisions in a sample of cross-listing firms. We split the sample observations into
high and low analyst coverage samples using the median analyst coverage. The results are
reported in Table 5. We find that firms with high analyst following are associated with greater
investment efficiency (i.e., have a significant negative coefficient on ADR_OVER_I), consistent
with the monitoring role of analysts. The picture is less clear in the low analyst coverage sample
where the interaction term ADR_OVER_I is either insignificant or of lower significance.
[Insert Table 5 here]
5. Sensitivity Analysis
5.1 Endogeneity of ADR firms
A potential concern in our analysis is that ADRs may not be a random sample of non-U.S.
firms and thus that the decision to cross-list may be endogeneously determined. In other words,
we cannot rule out the possibility that certain environmental factors that simultaneously
influence firms U.S. cross-listing decisions and their investment decisions are not adequately
controlled for in our research design. In the presence of such endogeneity, inferences based on
classical ordinary least squares regressions may be subject to a selection bias problem. Therefore,
we perform an additional analysis to control for potential endogeneity in the decision to cross-list
in the U.S.
Similar to Bailey et al. (2006), we first use a standard Heckman approach to assess the
potential impact of selection bias.9 Specifically, we model the propensity to cross-list in the first
9 We take this approach, rather than including the explanatory variables in the 1st stage regression directly in the 2nd stage, as we expect to obtain a more consistent estimator under this approach. For instance, Achen (1986) notes that including the 1st stage variables directly in the 2nd stage regression can worsen the estimation (i.e., consistency) of the treatment effect when selection cannot be predicted perfectly.

24
stage probit model using the book to market ratio, sales revenue, sales growth, leverage, and the
market value of equity as the instruments. In the second stage, we include the inverse-Mills ratio
(IMR) as an additional explanatory variable to capture possible selection bias. To the extent that
economic characteristics (i.e., mainly firm growth) of our first stage regression variables relate to
the manner in which our sample is biased, the inverse-Mills ratio will load significantly in the
second stage model and the significance of our test variables might be affected. As reported in
Table 6, IMR is insignificant, and our main inferences do not change. The coefficient on the
interaction variable, ADR_OVER_I,
[Insert Table 6 here]
5.2 Propensity-Matched Control Sample Test
An alternative way to alleviate the concern of self-selection is to compare cross-listed
firms with a matched control sample. Specifically, we carry out a “propensity score matching
(PSM)” approach. In the first stage, we estimate a probit regression, where we regress the ADR
indicator variable on the control variables used in the Heckman model. Then, we match each
ADR firm against a non-ADR firm using the propensity score. More specifically we use
Mahalanobis metric matching using the same country and industry membership. Finally, we
perform a multivariate regression analysis based on the cross-listed sample and the propensity
matched sample. The result is shown in Table 7.
[Insert Table 7 here]
In panel A of Table 7, we report that the treatment group (i.e., ADRs) has a lower
OVER_I value than the control group (i.e., non-ADRs), indicating that ADRs are generally less

25
likely to over-invest than non-ADRs. The difference in the probability of over-investments
between the two groups is significant with a t-statistic of -1.94. This suggests that the control
group observations (non-ADRs) have a higher likelihood of over-investment compared to the
treatment group observations (ADRs). In panel B, we continue to find that cross-listed firms are
less likely to over-and under-invest than the matched control sample as indicated by the
significant negative coefficient on ADR_OVER_I. These results, combined with the results from
the Heckman approach, provide additional assurance that our results are unlikely to be driven by
sample selection bias.
5.3 Additional Control Variables
Prior studies show that the quality and quantity of disclosure could affect firms’ capital
investment by changing the information environment around firms (e.g., Botosan (1996), Biddle
and Hilary (2006)).10 We include discretionary accruals as measured in Tucker and Zarowin
(2006) and the CIFAR index as proxies for earnings quality and the level of disclosure,
respectively. These additional control variables are included to mitigate concerns that the capital
investment decisions are not just driven by innate factors that influence both cross-listing
decisions and optimal capital investment. The results are presented in Table 8. Adding
discretionary accruals DACC and CIFAR as additional control variables does not change our
primary results. The ADR coefficient is positive in most cases and the interaction between ADR
and over-investment continues to be negative and significant, especially for the exchange-listing
firms.
[Insert Table 8 here]
10 For example, earnings quality could enhance investment efficiency by reducing information asymmetry between managers and outside suppliers of capital (Biddle and Hilary, 2006).

26
5.4 Equally Weighted Country Representation
To alleviate the concern that our results are driven by observations from certain countries
that are heavily represented in the sample, we repeat the analysis using the country means of
each regression variable. This approach reduces the number of observations in each country to
one, weighting each country observation equally. We obtain the same inferences under this
approach (results untabulated).
6. Conclusion
We examine the relationship between foreign firms cross-listing in the U.S. and capital
investment efficiency. Legal and reputational bonding arguments in the cross-listing literature
indicate that foreign firms choosing to list in the U.S., a country known to have high disclosure
standards and strong investor protection, can have many positive external benefits to the firm
including improvement in the firm’s information environment, increase in trading volume,
reduction in the cost of equity capital, and increase in firm value. However, there is little
evidence regarding possible internal benefits, for instance, whether actual managerial decisions
are associated with cross-listing.
We provide evidence that cross-listed firms in the U.S. have greater capital investment
efficiency. This association is concentrated in ADRs listed on the major stock exchanges where
additional reporting and disclosure requirements are greater. We also find the association with
investment efficiency is greater for cross-listed firms that originate from countries with weaker
disclosure environments. In particular, exchange-listed firms from countries with weaker
disclosure environments demonstrate the highest investment efficiency. We also examine the
effects of analyst following and find some evidence that the association between cross-listed
firms and investment efficiency is related to firms with high analyst following. Additional

27
sensitivity tests indicate the findings continue to hold when controlling for potential endogeneity
using the Heckman procedure, a propensity matched sample, adding additional controls for
earnings quality and level of disclosure, and weighting observations from each country equally.
The benefits of cross-listing are still not well understood. Future research could examine
the benefits of cross-listing from the perspectives of distinctively different reporting
environments such as the U.K. and Japan. Another avenue for future research relates to
International Financial Reporting Standards (IFRS). Do firms reporting under IFRS still obtain
additional benefits by cross-listing in the U.S.? With the dramatic changes in financial reporting
on a global basis, the affects of cross-listing for these firms merits further investigation.

28
References Achen, C.H. 1986. The statistical analysis of quasi-experiments. Berkeley, CA. University of
California Press. Bailey, W., Karolyi, G.A., C. Salva. 2006. The economic consequences of increased disclosure:
Evidence from international cross-listings. Journal of Financial Economics 81: 175-213. Benos, E. and M.S. Weisbach. 2004. Private benefits and cross-listings in the United States.
Emerging Markets Review 5(2): 217-240 Biddle, G. and G. Hilary. 2006. Accounting quality and firm-level capital investment. The
Accounting Review 81(5): 963-982. Biddle, G., G. Hilary, and R.S. Verdi. 2009. How does financial reporting quality relate to
investment efficiency? Journal of Accounting and Economics, 48 (2,3): 112-131. Bradshaw, M.T., Bushee, B.J., and Miller, G.S. 2004. Accounting choice, home bias, and U.S.
investment in Non-U.S. firms. Journal of Accounting Research 42(5): 795-841. Coffee, J. 2002. Racing towards the top? The impact of cross-listings and stock market
competition on international corporate governance. Columbia Law Review 102: 1757-1831.
Diamond, D. 1991. Monitoring and reputation: the choice between bank loans and directly
placed debt. Journal of Political Economy 99: 689-721. Doidge, C., Karolyi, G.A., Stulz, R. M. 2004. Why are foreign firms listed in the U.S. worth
more? Journal of Financial Economics 71: 205-238. Dyck, A., and L. Zingales. 2004. “Private benefits of control: An international comparison.”
Journal of Finance 59: 537-600. Fernandes N. and M.A. Ferreira. 2008. Does international cross-listing improve the information
environment? Journal of Financial Economics 88: 216-244. Fisher, I.G. 1965. The theory of interest. New York: Augustus M. Kelly. Foucault, T. and T. Gherig. 2008. Stock price informativeness, cross-listings, and investment
decisions. Journal of Financial Economics 88: 146-168. Forester, S.R. and Karolyi G.A. 1999. The effects of market segmentation and investor
recognition on asset prices: Evidence from foreign stock listing in the United States. Journal of Finance 54: 981-1013.

29
Hail, L. and C. Leuz. 2009. Cost of capital and cash flow effects of U.S. cross-listings. Journal of Financial Economics 93(3): 428-454.
Healy, P. and K. Palepu. 2001. Information asymmetry, corporate disclosure, and the capital
markets: A review of the empirical disclosure literature. Journal of Accounting and Economics 31: 405-440.
Heckman, J. 1979. Sample selection bias as a specification error. Econometrica 47: 153-161. Hope, O.-K., T. Kang, and Y. Zang. 2007. Bonding to the improved disclosure environment in
the United States: Firms’ listing choices and their capital market consequences. Journal of Contemporary Accounting and Economics 3(2): 1-33.
Hope, O.-K. and W. B. Thomas. 2008. Managerial empire building and firm disclosure. Journal
of Accounting Research 46(3): 591-626. Jensen M. C and W. H. Meckling. 1976. Theory of the firm: Managerial behavior, agency costs
and ownership structure. Journal of Financial Economics 3: 305-360. Karolyi, G.A. 1998. Why do companies list their shares abroad? A survey of the evidence and its
managerial implications. Salomon Brothers Monograph Series 7(1). New York University.
Karolyi, G.A. 2006. The world of cross-listings and cross-listings of the world: Challenging
conventional wisdom. Review of Finance 10(1): 73-115. Khanna, T., K.G. Palepu, and S. Srinivasan. 2004. Disclosure practices of foreign companies
interacting with U.S. markets. Journal of Accounting Research 42(2): 475-508. Knyazeva, D. 2009. Analysts and journalists: Firm policies and governance design. Working
paper, Simon School of Business, University of Rochester. Lang, M., K. Lins, D. Miller, and C. Leuz. 2003. ADRs, analysts, and accuracy: Does cross
listing in the United States improve a firm’s information environment and increase market value? Journal of Accounting Research 41(2): 317-362.
Lang, M., J.S. Ready, and W. Wilson. 2006. Earnings management and cross listing: Are
reconciled earnings comparable to US earnings? Journal of Accounting and Economics 42: 255-283.
La Porta, R., Lopez-de-Silanes F., Shleifer, A. and Vishney, R. 1997. The legal determinants of
external finance. Journal of Finance 52: 1131-1150. La Porta, R., Lopez-de-Silanes F., Shleifer, A. and Vishney, R. 1998. Law and finance. Journal
of Political Economy 106: 1113-1155.

30
Leuz, C. 2006. Cross Listing, Bonding and firms’ reporting incentives: A discussion of Lang, Ready and Wilson (2006). Journal of Accounting and Economics 42: 285-299.
Licht, A.N. 2003. Cross-listing and corporate governance: Bonding or avoiding? Chicago
Journal of International Law 4 (1): 141-163. Miller, D. 1999. The market reaction to international cross-listings: Evidence from Depositary
Receipts. Journal of Financial Economics 51: 103-123. Myers, S. 1977. Determinants of corporate borrowing. Journal of Financial Economics 5: 147-
175. Myers, S. 1984. The capital structure puzzle. Journal of Finance 39: 575-592. Myers, S. and N. Majluf. 1984. Corporate financing and investment decisions when firms have
information that investors do not have. Journal of Financial Economics 13: 187-222. Pagano, M., A. Roell, and J. Zechner. 2002. The geography of equity listing: why do companies
list abroad? Journal of Finance 57: 2651–2694. Piotroski, J.D. and S. Srinivasan. 2008. Regulation and bonding: The Sarbanes-Oxley Act and
the flow of international cross-listings. Journal of Accounting Research 46(2): 383-426. Rajan and Zingales 2003. The great reversals: the politics of financial development in the
twentieth century. Journal of Financial Economics 69: 5-50. Reese, W.A. Jr. and M.S. Weisbach. 2002. Protection of minority shareholders interests, cross-
listings in the United States, and subsequent equity offerings. Journal of Financial Economics 66: 65-104.
Siegel, J. 2005. Can foreign firms bond themselves effectively by renting U.S. security laws?
Journal of Financial Economics 75: 319-359. Stulz, R.M. 1999. Globalization of equity markets and the cost of capital. Journal of
Applied Corporate Finance (Fall): 8-25. Stulz, R.M. 2005. The limits of financial globalization. Journal of Finance 60(4): 1595-
1638.

31
Table 1 Variable Definitions
VARIABLE DEFINITION
INV INV1 is the change in fixed assets and depreciation scaled by lagged total fixed assets. INV2 is the R&D, capital, and acquisition of PPE minus the sale of PPE scaled by lagged total assets.
ADR An indicator variable that equals one if the firm is cross-listed in the US and zero otherwise.
OVER_I OVER_I is a continuous variable of over-investment between 0 and 1. This is measured by the decile ranks based on cash and the leverage ratio.
SIZE The log of total assets. CAP Capital structure is measured as the ratio of long-term debt to the sum of
long-term debt and the market value of equity. DIV An indicator variable that equals one if the firm paid dividends and zero
otherwise. LOSS An indicator variable that equals one if net income before extraordinary
items is negative and zero otherwise. BM The ratio of book value of equity to the market value of equity. CIFAR The disclosure score issued by the Center For International Financial
Analysis and Research, Inc. CLASS An indicator variable that takes the value of zero for foreign firms that have
not yet cross-listed, one for OTC firms (Level I and 144a), and two for exchange traded ADR firms (Levels II and III).

32
Table 2 Descriptive Statistics
Panel A: Summary Statistics
VARIABLE N MEAN s.d. 25% 50% 75% INV1 35,272 0.3728 1.2727 0.0427 0.1318 0.2846 INV2 35,272 2.3906 7.2824 0.0607 0.4943 2.0384 ADR 35,272 0.0255 0.1577 0.0000 0.0000 0.0000 OVER_I 35,272 0.4983 0.2585 0.2778 0.5000 0.7222 SIZE 35,272 5.3544 2.1038 4.3062 5.4646 6.6198 CAP 35,272 0.1566 0.1910 0.0011 0.0814 0.2528 DIV 35,272 0.6921 0.4616 0.0000 1.0000 1.0000 LOSS 35,272 0.2213 0.4151 0.0000 0.0000 0.0000 BM 35,272 0.3817 3.0679 0.0540 0.1619 0.3596 CIFAR 35,272 72.2570 6.9267 68.0000 71.0000 75.0000 LS 35,272 0.1966 0.3974 0.0000 0.0000 0.0000
N denotes the number of observations, MEAN is the mean value, and s.d. is the standard deviation.

33
Panel B: Pearson Correlation Matrix
[1] [2] [3] [4] [5] [6] [7] [8] [9] [10] [1] INV1 1.0000 [2] INV2 0.4072 1.0000 0.0000 [3] ADR 0.0057 -0.0045 1.0000 0.2666 0.3785 [4] OVER_I 0.1107 0.0373 -0.0034 1.0000 0.0000 0.0000 0.5072 [5] SIZE -0.2308 -0.3489 0.1327 -0.1495 1.0000 0.0000 0.0000 0.0000 0.0000 [6] CAP -0.1375 -0.1391 -0.0375 -0.5413 0.3355 1.0000 0.0000 0.0000 0.0000 0.0000 0.0000 [7] DIV -0.1265 0.0020 -0.0017 0.0235 0.1643 -0.0783 1.0000 0.0000 0.6944 0.7461 0.0000 0.0000 0.0000 [8] LOSS 0.0948 0.0125 -0.0358 -0.0566 -0.1637 0.1566 -0.4091 1.0000 0.0000 0.0149 0.0000 0.0000 0.0000 0.0000 0.0000 [9] BM 0.0191 -0.0238 -0.0154 -0.0249 -0.0126 0.1185 -0.0731 0.0651 1.0000 0.0002 0.0000 0.0028 0.0000 0.0139 0.0000 0.0000 0.0000 [10] CIFAR 0.0576 -0.1459 0.0554 0.0472 0.0684 -0.0003 0.1479 0.0810 -0.0111 1.0000 0.0000 0.0000 0.0000 0.0000 0.0000 0.9506 0.0000 0.0000 0.0303

34
Table 3 Regression Models of ADR Firms on Investment Efficiency:
Exchange Listing vs. Non-Exchange Listing
Panel A: Using INV1 as the dependent variable
VARIABLE
OVERALL
TYPE OF EXCHANGE LISTING
POOLED FAMA-MACBETH
NON-EXCH EXCH
ADR 0.2567 0.2827 0.0435 0.3249 [3.30]*** [2.81]*** [0.31] [3.44]***
ADR_OVER_I -0.2863 -0.2155 -0.0038 -0.3645 [2.21]** [1.65]* [0.01] [2.55]**
OVER_I 0.1559 0.1769 0.1570 0.1519 [4.28]*** [4.47]*** [4.27]*** [4.15]***
SIZE -0.1355 -0.0971 -0.1361 -0.1371 [20.18]*** [9.17]*** [19.65]*** [20.14]***
CAP -0.3185 -0.2429 -0.3099 -0.3214 [7.57]*** [5.39]*** [7.26]*** [7.59]***
DIV -0.1330 -0.1895 -0.1361 -0.1345 [5.79]*** [12.70]*** [5.83]*** [5.83]***
LOSS 0.1147 0.0462 0.1110 0.1134 [5.15]*** [0.93] [4.96]*** [5.08]***
BM 0.0046 -0.0455 0.0045 0.0046 [0.50] [1.73]* [0.49] [0.50]
Year Dummies included included included
Industry Dummies included included included included
Country Dummies included included included included
Constant 0.8709 0.9221 0.8709 0.8588 [4.82]*** 14.20 [4.82]*** [6.66]***
ADR + ADR_OVER_I -0.0296 [0.20]
0.0672 [0.41]
0.0397 [010]
-0.0396 [0.23]
Observations 35,272 2,228 34,516 35,077 R-square 0.1057 0.0570 0.1057 0.1054

35
Panel B: Using INV2 as the dependent variable
VARIABLE
OVERALL
TYPE OF EXCHANGE LISTING
POOLED FAMA-
MACBETH NON-EXCH EXCH
ADR 2.6119 2.9775 1.5600 2.8937 [7.89]*** [8.58]*** [3.27]*** [7.14]***
ADR_OVER_I -2.2351 -2.6334 -0.2388 -2.6806 [4.30]*** [5.88]*** [0.21] [4.59]***
OVER_I 0.0862 -0.0530 0.0900 0.0743 [0.48] [0.16] [0.50] [0.41]
SIZE -0.6511 -1.1229 -0.6554 -0.6540 [16.06]*** [12.41]*** [15.56]*** [15.90]***
CAP -0.7892 -0.5230 -0.7794 -0.8112 [3.85]*** [1.49] [3.74]*** [3.93]***
DIV 0.2504 0.1143 0.2264 0.2403 [2.03]** [0.51] [1.80]* [1.94]*
LOSS 0.2546 -0.3804 0.2413 0.2544 [2.44]** [1.96 ]** [2.29]** [2.43]**
BM -0.0149 -0.6158 -0.0150 -0.0147 [2.14]** [3.54]*** [2.14]** [2.13]**
Year Dummies included included included
Industry Dummies
included included included included
Country Dummies included included included included
Constant 5.8483 8.6384 4.8261 5.6837
[8.20]*** 17.12 [7.38]*** [7.71]***
ADR + ADR_OVER_I 0.3768 [0.61]
0.3441 [0.61]
1.3212 [1.07]
0.2131 [0.30]
Observations 35,272 2,228 34,516 35,077 R-square 0.3224 0.1209 0.3232 0.3222

36
Table 4 Regression Models of ADR Firms on Investment Efficiency:
Weak vs. Strong Disclosure Environment
Panel A: Using INV1 as the dependent variable
VARIABLE
WEAK
DISCLOSURE ENVIRONMENT
STRONG DISCLOSURE
ENVIRONMENT
NON-EXCH EXCH NON-EXCH EXCH
ADR 0.0416 0.2241 -0.1799 0.2514 [0.23] [1.48] [0.88] [1.98]**
ADR_OVER_I -0.3990 -0.5605 0.5804 -0.2904 [1.26] [2.73]*** [0.99] [1.44]
OVER_I 0.0764 0.0744 0.4060 0.3855 [1.97]** [1.92]* [5.31]*** [5.01]***
SIZE -0.1604 -0.1619 -0.0847 -0.0909 [17.38]*** [17.67]*** [7.83]*** [8.24]***
CAP -0.2297 -0.2329 -0.4437 -0.4827 [5.18]*** [5.27]*** [5.03]*** [5.53]***
DIV -0.0835 -0.0882 -0.2081 -0.1885 [2.84]*** [3.02]*** [5.69]*** [5.17]***
LOSS 0.1224 0.1217 0.0530 0.0618 [4.62]*** [4.62]*** [1.22] [1.44]
BM -0.0148 -0.0148 0.0165 0.0166 [2.41]** [2.41]** [1.83]* [1.86]*
Year Dummies included included included included
Industry Dummies included included included included
Country Dummies included included included included
Constant 1.0396 1.4335 0.0672 0.1464 [0.00] [8.62]*** [0.29] [0.69]
ADR + ADR_OVER_I -0.3844 [1.19]
-0.3364 [1.32]
0.4005 [0.65]
-0.0390 [0.16]
Observations 25,150 25,358 9,366 9,719 R-square 0.0970 0.0977 0.1325 0.1287

37
Panel B: Using INV2 as the dependent variable
VARIABLE
WEAK
DISCLOSURE ENVIRONMENT
STRONG DISCLOSURE
ENVIRONMENT
NON-EXCH EXCH NON-EXCH EXCH
ADR 0.1320 2.7653 -0.0942 0.7013 [0.13] [4.05]*** [1.11] [1.47]
ADR_OVER_I 2.7016 -3.3411 0.1063 -0.0938 [1.28] [3.60]*** [0.55] [0.13]
OVER_I 1.0414 1.0204 0.0354 -0.0631 [4.15]*** [4.08]*** [0.63] [0.80]
SIZE -0.9966 -0.9981 -0.0980 -0.1275 [17.02]*** [17.23]*** [3.70]*** [4.15]***
CAP -0.5470 -0.5616 -0.2480 -0.3349 [1.95]* [2.01]** [2.51]** [3.02]***
DIV -0.1360 -0.1443 0.0900 0.1312 [0.75] [0.80] [1.16] [1.63]
LOSS 0.5696 0.5621 0.0423 0.0761 [3.90]*** [3.87]*** [0.66] [1.11]
BM -0.0324 -0.0318 0.0003 0.0004 [1.86]* [1.85]* [0.50] [0.58]
Year Dummies included included included included
Industry Dummies included included included included
Country Dummies included included included included
Constant 7.9972 10.7834 0.7998 0.8469 [0.00] [10.32]*** [1.70]* [2.25]**
ADR + ADR_OVER_I 2.8336 [1.21]
-0.5758 [0.50]
0.0121 [0.06]
0.6075 [0.70]
Observations 25,150 25,358 9,366 9,719 R-square 0.3289 0.3292 0.0440 0.0437

38
Table 5
Regression Models of ADR Firms on Investment Efficiency: Low vs. High Analyst Following
VARIABLE
INV1 Model
INV2 Model
LOW ANALYST
FOLLOWING
HIGH ANALYST
FOLLOWING
LOW ANALYST
FOLLOWING
HIGH ANALYST
FOLLOWING ADR 0.4553 0.1610 2.9625 2.2519
[2.53]** [2.02]** [3.83]*** [6.27]*** ADR_OVER_I -0.3501 -0.3052 -2.3838 -2.6639
[1.11] [2.40]** [1.83]* [4.95]*** OVER_I 0.1441 0.1667 0.1795 0.8820
[3.04]*** [3.24]*** [0.76] [3.11]*** SIZE -0.1523 -0.1322 -0.5962 -0.7159
[14.78]*** [12.36]*** [9.18]*** [12.00]*** CAP -0.2894 -0.1690 -0.6424 0.9723
[5.60]*** [2.61]*** [2.51]** [2.68]*** DIV -0.1364 -0.1186 -0.0277 0.1717
[5.23]*** [2.55]** [0.19] [0.72] LOSS 0.1030 0.1463 0.2460 0.6803
[4.28]*** [2.79]*** [2.26]** [2.58]*** BM 0.0076 -0.0190 -0.0061 -0.0343
[0.82] [2.45]** [1.65]* [1.57]
Year Dummies included included included included
Industry Dummies included Included included included
Country Dummies included Included included included
Constant 1.0674 1.048 5.0858 5.8799 [9.08]*** [4.54]*** [5.90]*** [6.10]***
ADR + ADR_OVER_I 0.1052 [0.29]
-0.1442 [0.96]
0.5787 [0.38]
-0.4120 [0.64]
Observations 24,004 11,469 24,004 11,469 R-square 0.1243 0.0885 0.3970 0.2234

39
Table 6 Endogeneity of ADR firms
1st Stage VARIABLE ADR
2nd Stage VARIABLE INV1 Model INV2 Model
ADR 0.0178 1.5512 [0.77] [61.03]*** ADR_OVER_I -0.4123 -1.9086 [2.03]** [2.04]** OVER_I -0.2304 -0.8630 [9.30]*** [7.71]*** SIZE -0.7892 0.8410 [2.35]** [0.54] CAP 0.3099 1.4241 [2.65]*** [2.64]*** DIV 0.1890 0.0992 [1.61] [0.18] LOSS -0.1542 -0.4820 [0.70] [0.59]
BM -0.9519 BM -0.4123 -1.9086 [13.53]*** [2.03]** [2.04]**
SALES 0.0684 IMR -0.0164 -0.4628 [21.79]*** [0.07] [0.77]
SGR 0.0228 [1.25]
Year Dummies included included
LEV -0.0005 [0.63]
Industry Dummies included included
MV 0.0000 [0.47]
Country Dummies included included
Constant -1.9846 Constant 5.0858 5.8799 [87.28]*** [5.90]*** [6.10]***
ADR + ADR_OVER_I -0.3945 [1.93]*
-0.3574 [0.38]
Observations 37,833 Observations 37,833 37,833 R-square 0.1037 Wald chi2 332.88 523.42
* Note: SALES is the natural logarithm of sales revenues; MV is the natural logarithm of market value of equity; LEV and BM are as defined in Table 1. CLASS is an indicator variable coded as one if a firm is cross-listed, and zero otherwise for the model of NON-ADR vs. ADR and one if a firm is listed on a major stock exchange, and zero otherwise for the model of NON_EX vs. EX LISTING; IMR is the inverse mills ratio.

40
Table 7 Propensity Matching
Panel A: Probability of Being Assigned to the Over-Investment Group in the Propensity-Matched Sample
Variable
Sample
Treatment (ADR)
Control (Non-ADR)
Difference (Treatment –
Control) S.E.
T-stat
OVER_I Matched 0.4936 0.5189 -0.0253 0.0130 -1.94*
Panel B: Regression Results using a Propensity Matched Sample
VARIABLE INV1 Model INV2 Model
ADR 0.2744 1.8987 [2.71]*** [4.70]***
ADR_OVER_I -0.4608 -1.3922 [2.38]** [1.87]*
OVER_I 0.5331 -0.3897 [3.41]*** [0.62]
SIZE -0.0637 -0.8047 [4.28]*** [11.13]***
CAP -0.2531 0.0763 [1.85]* [0.14]
DIV -0.2522 0.7790 [4.28]*** [3.64]***
LOSS 0.1000 -0.4194 [0.81] [1.01]
BM -0.1472 -0.9642 [2.56]** [3.91]***
Constant 0.7612 6.4614 [4.66]*** [9.30]***
ADR + ADR_OVER_I -0.1864 [0.85]
0.5065 [0.60]
Observations 1,917 1,917 R-square 0.0597 0.1718

41
Table 8
Additional Control Variables
VARIABLE ALL NON-EXCHANGE LISTING EXCHANGE LISTING
INV1 Model INV2 Model INV1 Model INV2 Model INV1 Model INV2 Model
ADR 0.2466 2.2538 0.0443 0.3140 0.3140 2.5717 [3.15]*** [6.75]*** [0.31] [3.32]*** [3.32]*** [6.23]***
ADR_OVER_I -0.2778 -1.8942 -0.0060 -0.3558 -0.3558 -2.4263 [2.06]** [3.50]*** [0.02] [2.39]** [2.39]** [4.00]***
OVER_I 0.1510 0.0433 0.1515 0.1467 0.1467 0.0329 [4.11]*** [0.25] [4.10]*** [3.98]*** [3.98]*** [0.19]
SIZE -0.1369 -0.4684 -0.1376 -0.1386 -0.1386 -0.4689 [19.56]*** [12.14]*** [19.04]*** [19.52]*** [19.52]*** [11.98]***
CAP -0.3317 -1.3001 -0.3233 -0.3350 -0.3350 -1.3236 [7.77]*** [6.80]*** [7.47]*** [7.80]*** [7.80]*** [6.87]***
DIV -0.1403 0.1134 -0.1434 -0.1419 -0.1419 0.1034 [5.99]*** [0.94] [6.03]*** [6.04]*** [6.04]*** [0.85]
LOSS 0.1126 0.3289 0.1079 0.1111 0.1111 0.3298 [4.98]*** [3.17]*** [4.76]*** [4.91]*** [4.91]*** [3.17]***
BM 0.0047 -0.0111 0.0046 0.0047 0.0047 -0.0109 [0.51] [1.88]* [0.50] [0.52] [0.52] [1.87]*
CIFAR 0.0047 -0.0111 0.0046 0.0047 -0.0112 -0.0109 [0.51] [1.88]* [0.50] [0.52] [1.89]* [1.87]*
DACC -0.0061 0.0967 -0.0069 -0.0063 0.1079 0.0960 [1.00] [3.32]*** [0.95] [1.03] [3.06]*** [3.29]***
Year Dummies included included included included included included
Industry Dummies included Included included Included included Included
Country Dummies included Included included Included included Included
Constant 1.3444 0.3127 1.3840 1.3628 0.1354 0.3609
[9.04]*** [0.57] [8.54]*** [9.12]*** [0.22] [0.66]
ADR + ADR_OVER_I -0.0312 [0.20]
0.3596 [0.57]
0.0383 [0.12]
-0.0418 [0.24]
-0.0418 [0.24]
0.1454 [0.20]
Observations 34,372 34,372 33,676 34,180 33,676 34,180 R-square 0.1049 0.2489 0.1054 0.1053 0.2482 0.2485