cross-oncopanel study reveals high sensitivity and
TRANSCRIPT

RESEARCH Open Access
Cross-oncopanel study reveals high sensitivityand accuracy with overall analyticalperformance depending on genomic regionsBinsheng Gong1†, Dan Li1†, Rebecca Kusko2†, Natalia Novoradovskaya3, Yifan Zhang1,4, Shangzi Wang5,Carlos Pabón-Peña6, Zhihong Zhang7, Kevin Lai8, Wanshi Cai9, Jennifer S. LoCoco10, Eric Lader11, Todd A. Richmond12,Vinay K. Mittal13, Liang-Chun Liu14, Donald J. Johann Jr15, James C. Willey16, Pierre R. Bushel17, Ying Yu5, Chang Xu11,Guangchun Chen18, Daniel Burgess19, Simon Cawley20, Kristina Giorda21, Nathan Haseley10, Fujun Qiu7,Katherine Wilkins6, Hanane Arib22, Claire Attwooll10, Kevin Babson23, Longlong Bao24,25,26, Wenjun Bao27,Anne Bergstrom Lucas6, Hunter Best28,29, Ambica Bhandari30, Halil Bisgin31, James Blackburn32,33,Thomas M. Blomquist34,35, Lisa Boardman36, Blake Burgher37, Daniel J. Butler38, Chia-Jung Chang39, Alka Chaubey23,Tao Chen40, Marco Chierici41, Christopher R. Chin38, Devin Close29, Jeffrey Conroy37, Jessica Cooley Coleman23,Daniel J. Craig42, Erin Crawford42, Angela del Pozo43,44, Ira W. Deveson45,46, Daniel Duncan47, Agda Karina Eterovic48,Xiaohui Fan49, Jonathan Foox38, Cesare Furlanello41,50, Abhisek Ghosal30, Sean Glenn37, Meijian Guan27, Christine Haag51,Xinyi Hang9, Scott Happe52, Brittany Hennigan23, Jennifer Hipp53, Huixiao Hong1, Kyle Horvath30, Jianhong Hu54,Li-Yuan Hung55, Mirna Jarosz56, Jennifer Kerkhof57, Benjamin Kipp58, David Philip Kreil59, Paweł Łabaj60,61,Pablo Lapunzina62,63,44, Peng Li55, Quan-Zhen Li18, Weihua Li64, Zhiguang Li65, Yu Liang66, Shaoqing Liu67, Zhichao Liu1,Charles Ma47, Narasimha Marella47, Rubén Martín-Arenas68, Dalila B. Megherbi69, Qingchang Meng54,Piotr A. Mieczkowski70, Tom Morrison71, Donna Muzny54, Baitang Ning1, Barbara L. Parsons40, Cloud P. Paweletz72,Mehdi Pirooznia73, Wubin Qu9, Amelia Raymond74, Paul Rindler29, Rebecca Ringler30, Bekim Sadikovic57,75,Andreas Scherer76,44, Egbert Schulze77, Robert Sebra22, Rita Shaknovich47, Qiang Shi78, Tieliu Shi79,Juan Carlos Silla-Castro80, Melissa Smith22, Mario Solís López43,44, Ping Song48, Daniel Stetson74, Maya Strahl22,Alan Stuart57, Julianna Supplee72, Philippe Szankasi29, Haowen Tan81, Lin-ya Tang48, Yonghui Tao24,25,26,Shraddha Thakkar1, Danielle Thierry-Mieg82, Jean Thierry-Mieg82, Venkat J. Thodima47, David Thomas45,33, Boris Tichý83,44,Nikola Tom83,44, Elena Vallespin Garcia43,44, Suman Verma30, Kimbley Walker54, Charles Wang84,85, Junwen Wang86,87,88,Yexun Wang11, Zhining Wen89, Valtteri Wirta90, Leihong Wu1, Chunlin Xiao91, Wenzhong Xiao55,39, Shibei Xu92,Mary Yang4, Jianming Ying64, Shun H. Yip86,93, Guangliang Zhang94, Sa Zhang94, Meiru Zhao95, Yuanting Zheng5,Xiaoyan Zhou24,25,26, Christopher E. Mason38, Timothy Mercer96,97, Weida Tong1, Leming Shi5,98,99*,Wendell Jones100* and Joshua Xu1*
* Correspondence: [email protected]; [email protected]; [email protected]†Binsheng Gong, Dan Li andRebecca Kusko contributed equallyto this work.
5State Key Laboratory of Genetic Engineering, School of Life Sciences and Shanghai Cancer Hospital/Cancer Institute,Fudan University, Shanghai 200438, China100Q2 Solutions - EA Genomics, 5927 S Miami Blvd, Morrisville, NC 27560, USA1Division of Bioinformatics and Biostatistics, National Center for Toxicological Research, US Food and DrugAdministration, Jefferson, AR 72079, USAFull list of author information is available at the end of the article
© The Author(s). 2021, corrected publication 2021. Open Access This article is licensed under a Creative Commons Attribution 4.0International License, which permits use, sharing, adaptation, distribution and reproduction in any medium or format, as long as yougive appropriate credit to the original author(s) and the source, provide a link to the Creative Commons licence, and indicate ifchanges were made. The images or other third party material in this article are included in the article's Creative Commons licence,unless indicated otherwise in a credit line to the material. If material is not included in the article's Creative Commons licence andyour intended use is not permitted by statutory regulation or exceeds the permitted use, you will need to obtain permission directlyfrom the copyright holder. To view a copy of this licence, visit http://creativecommons.org/licenses/by/4.0/. The Creative CommonsPublic Domain Dedication waiver (http://creativecommons.org/publicdomain/zero/1.0/) applies to the data made available in thisarticle, unless otherwise stated in a credit line to the data.
Gong et al. Genome Biology (2021) 22:109 https://doi.org/10.1186/s13059-021-02315-0

Abstract
Background: Targeted sequencing using oncopanels requires comprehensiveassessments of accuracy and detection sensitivity to ensure analytical validity. Byemploying reference materials characterized by the U.S. Food and DrugAdministration-led SEquence Quality Control project phase2 (SEQC2) effort, weperform a cross-platform multi-lab evaluation of eight Pan-Cancer panels to assessbest practices for oncopanel sequencing.
Results: All panels demonstrate high sensitivity across targeted high-confidencecoding regions and variant types for the variants previously verified to have variantallele frequency (VAF) in the 5–20% range. Sensitivity is reduced by utilizing VAFthresholds due to inherent variability in VAF measurements. Enforcing a VAFthreshold for reporting has a positive impact on reducing false positive calls.Importantly, the false positive rate is found to be significantly higher outside thehigh-confidence coding regions, resulting in lower reproducibility. Thus, regionrestriction and VAF thresholds lead to low relative technical variability in estimatingpromising biomarkers and tumor mutational burden.
Conclusion: This comprehensive study provides actionable guidelines for oncopanelsequencing and clear evidence that supports a simplified approach to assess theanalytical performance of oncopanels. It will facilitate the rapid implementation,validation, and quality control of oncopanels in clinical use.
Keywords: Oncopanel sequencing, Target enrichment, Molecular diagnostics,Reproducibility, Analytical performance, Precision medicine
BackgroundDespite ongoing advances in sequencing technologies to date, the promise of their use
for precision medicine has not yet borne out entirely for the majority of cancer pa-
tients. Although cancer is a genomic disease, most malignant tumors are currently clas-
sified and often treated based on the tissue of origin and the TNM (tumor, node, and
metastases) staging system for solid tumors rather than presence or absence of relevant
mutations in key oncogenic pathways. Presently, only a small number of specific muta-
tions in genes such as EGFR, ALK [1], and BRAF [2] are routinely tested to inform clin-
ical decisions. To move precision medicine from theoretical discussions to the bedside
of individual patients, it requires accurate and reproducible testing of a broad spectrum
of clinically relevant mutations combined with appropriate therapies. Hence, improved
mutation testing is greatly needed to confidently classify individual tumors, reliably pro-
vide personalized therapeutic choices, and inform patient prognosis.
Next-generation sequencing (NGS) of targeted genomic regions has become increas-
ingly common because targeted panels focus sequencing coverage on genomic regions
more likely to harbor important genomic aberrations and thereby increase diagnostic
sensitivity [3]. Oncopanels have several potential clinical applications, including identi-
fication of driver and potential driver mutations. Variants can be prioritized for their
biological significance and cross-referenced with potentially useful targeted therapies.
Some oncopanels are also used to assess micro-satellite instability [4], homologous re-
combination defect status [5], copy number alterations [6], and gene rearrangements
[7]. There is increasing evidence that a significant proportion of patients with low-
frequency alleles of these clinically actionable mutations show clinical response to tar-
geted therapies [8]. Because key therapeutic decisions are based on these results,
Gong et al. Genome Biology (2021) 22:109 Page 2 of 23

including choice of molecular-targeted therapy and prediction of outcomes, it is critical
that mutation detection displays high sensitivity and low false positive (FP) rate and
that reports to physicians are highly accurate [9–11]. Importantly, both oncopanels and
downstream bioinformatic methods must be validated to be accurate, informative, and
reliable.
Certain tumors that are genetically unstable may result in a large number of cellular
proteins having somatic mutations (also known as neoantigens). More exposure of
neoantigens increases the likelihood of non-self recognition by the adaptive immune
system. If such a recognition event has occurred, but the tumor still progresses, a pos-
sible reason is the autoregulatory process of immune checkpoints which ordinarily pre-
vent autoimmunity by deactivating active T cells in the tumor microenvironment.
Therefore, if oncopanels are large enough in size, they can be used to estimate tumor
mutational burden (TMB), an emerging indicator for immune checkpoint inhibitors in
certain tumor types [12, 13].
In current practice, there are multiple Clinical Laboratory Improvement Amend-
ments (CLIA)-certified labs that have implemented oncopanels for tumor profiling. At
present, four pan-cancer panels have been approved or cleared by U.S. Food and Drug
Administration (FDA): FoundationOne CDx [14], MSK- IMPACT [10], NantHealth
Omics Core [15], and PGDx elio tissue complete [16]. In 2017, the FDA approved
Merck’s Keytruda (pembrolizumab) for any unresectable or metastatic solid tumor with
evidence of mismatch repair deficiency. Thus, this was the first approval that was
biomarker-based and tissue agnostic [17]. The FDA accelerated the approval of Bayer’s
Vitrakvi in 2018, and Roche’s Rozlytrek (entrectinib) in 2019, both of which are
biomarker-based cancer treatments [18]. However, only a minority of cancer patients
undergo high-throughput mutational profiling [19] and many physicians remain
skeptical of the rigorousness of genomic testing [20], hesitant to deplete precious tumor
material, and/or apprehensive about performing an additional tumor biopsy [21]. For
oncopanel sequencing to become a useful and widely adopted clinical test, a thorough
understanding of its sensitivity, reproducibility, and accuracy is greatly needed. To date,
no study has assessed how distinct oncopanel methodologies perform with respect to
variant allele frequency (VAF) and variant location, impacting sensitivity, FP rate, re-
producibility, and potential biomarkers such as TMB for oncopanels. Previous studies
comparing oncopanels have not used reference materials as test samples with (1)
enough VAF range and sufficient diversity of mutations to thoroughly interrogate a suf-
ficient number of clinically relevant mutations [22] and (2) sufficient material readily
available for the scientific community [23–25]. In contrast, this study used recently
characterized reference samples that contain an extensive collection of known positive
and negative variants [26] to provide a much more definitive and comprehensive un-
derstanding of key variables that impact performance of oncopanels.
The FDA-led SEquencing and Quality Control project phase 2 (SEQC2) continues
earlier consortium efforts [27–30] to advance best practices and address the technical
gaps in genomics technologies. Its Somatic Mutation Working Group has extensively
identified variant content of an individual pair of reference samples (breast cancer cell
line HCC1395 and its normal counterpart) and established best practices for genome-
wide somatic mutation calling [31, 32]. In parallel, the Oncopanel Sequencing Working
Group’s efforts, which are detailed herein, utilize a recently identified novel set of
Gong et al. Genome Biology (2021) 22:109 Page 3 of 23

comprehensive variants and negatives [26] from additional reference samples to com-
pare variant calling across eight distinct oncopanels. We assessed intra-lab and cross-
lab reproducibility, sensitivity for known positives, and accuracy (i.e., FP rate) through
known negatives across a range of VAFs and in selected important genomic regions.
The relationships between analytical variables and TMB estimation were also estab-
lished to inform the selection of oncopanel and harmonization of TMB measurements
across test platforms, which are important needs [33] identified recently to advance the
successful utilization of TMB in clinical practice. This study provided a comprehensive
evaluation of eight oncopanels to inform best practice guidelines for oncopanel sequen-
cing (Table 1).
ResultsOverview of study design
We employed four reference samples (Fig. 1a)—sample A (an equal mass pooled gen-
omic DNA (gDNA) sample of ten cancer cell lines from the Agilent Universal Human
Reference RNA (UHRR) material) [34], sample B (derived from a non-cancer male cell
line), sample C (equal dilution of sample A and sample B), and a spike-in sample (sam-
ple B with 5% AcroMetrix hotspot synthetic controls [35]). The majority (about two
Table 1 Summary of recommendations
Issue Recommendation
Reference material selection A reference material (or a set of reference materials) with a high density ofknown variants spanning a range of low allele frequencies (e.g., from above1 to 20%) is needed to assess the analytical performance of oncopanels(Fig. 1a). Ideally, the reference material will encompass a diversity of simpleand complex variants in different cancer-associated genes.
Sensitivity Sensitivity was found to be high (> 96.5%) for variants previously verified tohave variant allele frequency (VAF) greater than 5% (Fig. 2a). We recommendthat a less stringent VAF threshold is used to achieve high sensitivity forvariants of VAF below 5%.
Spike-in Utilizing a sample spiked-in at a specified amount (e.g., 5%) can provide add-itional variants at known allele frequencies for analytical validation ofoncopanels.
Variant type The sensitivity for detecting insertion and deletion variants (indels) istypically more variable and poorer than single nucleotide variants (SNVs),and this difference becomes more pronounced at low VAFs (Fig. 3). Werecommend that analytical validation of indels is performed independentlyto SNVs.
Determining VAF threshold Reference materials can be used to establish an optimal VAF threshold thatreduces false positives (FPs) and retains sensitivity. Indels and SNVs mayrequire different VAF thresholds to optimize performance (Fig. 3b).
Controlling the FP rate In applications where a minimal FP rate is required, raising the allelefrequency threshold was effective at reducing FPs. The additional restrictionof analysis to the consensus targeted regions (CTR) can further reduce FPrate.
Genomic location Genomic location can impact the rate of FPs detected, and we recommendthat analytical validation of panels is independently performed inside andoutside of the CTR (Fig. 4a).
Cross-lab reproducibility Measuring the analytical performance of a panel in multiple labs is critical toestablish reproducibility (Fig. 4c).
Estimating tumor mutationalburden (TMB)
TMB estimation should be confined to the CTR of each panel. Applying aminimal VAF threshold was helpful to reduce FPs and improve TMBevaluation (Fig. 5d).
Gong et al. Genome Biology (2021) 22:109 Page 4 of 23

thirds) of more than 42,000 known small variants (including SNVs, small indels, and
multi-nucleotide variants (MNVs)) in the 22-Mb exon coding regions of sample A have
a VAF below 20%, making sample A uniquely suitable for assessing the analytical per-
formance of oncopanels. Sample C was included to increase the number of known vari-
ants with VAF between 1 and 2.5%. More details about the four reference samples are
included in “Methods.” A total of eight oncopanels from eight distinct well-established
panel providers were tested herein on these four samples, including Agilent Custom
Comprehensive Cancer Panel v2 (AGL), Burning Rock DX OncoScreen Plus (BRP), In-
tegrated DNA Technologies xGen Pan-Cancer Panel (IDT), iGeneTech AIOnco-seq
(IGT), Illumina TruSight Tumor 170 (ILM), QIAGEN Comprehensive cancer panel
(QGN), Roche SeqCap EZ Choice custom PHC Panel (ROC), and Thermo Fisher
Oncomine Comprehensive Assay v3 (TFS). Vendors shipped the same reagent kits to
all sites. Information about the oncopanels is included in Fig. 1b and Additional file 1:
Table S1.
Each panel was tested in at least three independent laboratories with quadruplicates
for each sample. In total, this unprecedented large-scale study encompassed 28 labora-
tories and 430 libraries (Fig. 1c). Each panel provider recruited the test laboratories and
harmonized the experimental protocols to minimize cross-lab variations in the study.
Libraries were sequenced on the same sequencing platform for each panel and the
panel provider then performed panel-specific variant calling. For more information
about sequencing and downstream bioinformatic pipelines, please see Additional file 2:
Supplementary Methods. Variant calling results were submitted in variant call format
(VCF) files, along with their targeted regions and whitelist/blacklist, to an independent
group with sole knowledge of the known content of samples A, B, C, and the spike-in
for performance evaluation (Fig. 1d). Intra-lab and cross-lab reproducibility were
Fig. 1 Comprehensive study design for assessing analytical performance of multiple pan-cancer targetedsequencing technologies. a Four samples were tested on 8 pan-cancer panels with at least 3 different testlaboratories for each panel. b Basic information of 8 pan-cancer panels is listed in the embedded table (seeAdditional file 1: Table S1 for detailed information). *All participating panels are for research use only.†QGN’s UMI-aware variant caller is able to call variants with VAF as low as 0.5%. c Each sample had 4 libraryreplicates at each test laboratory. After sequencing, panel-specific variant calling was performed by eachpanel vendor. d Variant calling results were submitted for performance analysis including sensitivity, falsepositive call rate, and reproducibility
Gong et al. Genome Biology (2021) 22:109 Page 5 of 23

computed between library replicates as a measure of variant calling consistency. Sensi-
tivity and FP rate were then estimated by utilizing the large sets of known positive (KP)
and known negative (KN) loci from our companion work [26]. More than 42,000 KPs
and 10 million KNs in sample A were characterized in the 22-Mb high-confidence exon
coding regions through extensive sequencing of sample A and the individual cell line
DNA samples that made up sample A. KN loci had the mismatch error rate below
0.25%. The distribution of KPs by VAF is shown in Fig. 1a.
Sensitive detection of SNVs in the focused regions by all panels
We evaluated the performance of detecting SNVs in the consensus targeted regions
(CTR, see “Methods” for details) [26]. Given there is a general consensus that higher
VAF variants are “easier” to detect, we focused our analysis on metrics that character-
ized performance relative to VAF, especially in the lower [1–10%] VAF range (Fig. 2).
The number of KPs and observed sensitivity are listed side by side for each VAF range
across three reference samples (A, C, and spike-in) and all panels (Fig. 2a). Sample C
was not tested by TFS. Overall, sensitivity across all VAF ranges in all panels was high
with narrow confidence intervals (Additional file 1: Table S2). It ranged from 87.1 to
98.3% for the lowest VAF range (1–2.5%) tested by AGL, BRP, IGT, and QGN (Fig. 2a).
Sensitivity was greater than 96.8% for the 2.5–5% range and greater than 98.4% for the
5–20% range. The unusual sensitivity for ILM in sample C for the 10–20% range was
due to a single false negative in all library replicates. Other exceptions were ILM, ROC,
and TFS for the 2.5–5% range, as their variant calling pipelines had a VAF reporting
threshold very close to 2.5%. So their sensitivity was reduced due to a boundary VAF
threshold effect (see below for the effect of VAF cutoff on sensitivity). Accordingly,
Fig. 2 Reproducibility and sensitivity across VAF ranges for SNVs in the consensus targeted regions. a Tablelisted the number of known variants in each VAF range (left number), sensitivity (right number) for all 8panels across all samples tested. For the panels with a built-in VAF threshold, “N/A” is listed if the VAF lowbound is much lower than the panel provider’s chosen VAF threshold. The VAF threshold is 2.6% for ILM,2.0% for IDT, 2.5% for ROC, and 2.5% for TFS, respectively. b Average false positive SNV calls per millionacross various VAF cutoffs. Jittering was applied to avoid overlapping. c Cross-lab and intra-labreproducibility (in Phred scale) for variant calls with VAF between 2.5 and 20%
Gong et al. Genome Biology (2021) 22:109 Page 6 of 23

these threshold-dependent panels and IDT were not assessed for the lowest VAF range
(since IDT’s pipeline utilizes a VAF reporting threshold of 2.0%). All false negatives in
sample A or C were manually checked and can be explained by a combination of low
VAF and the panel’s VAF threshold except the above mentioned single case for ILM in
sample C. We initially anticipated similar sensitivity for the spike-in sample in the VAF
range of 2.5–10%, as the variants were designed to be 5% VAF. However, this was not
observed, likely due to interference of the nearby spike-in variants with amplicon
primers, DNA capture, or variant calling. To derive sensitivity estimates, custom filter-
ing of the spike-in’s variants was carried out by the panel providers to exclude variants
under primer interference for QGN and TFS or variants in dense clusters for IDT (see
Additional file 2: Supplementary Methods for details). Likewise, several dense variant
clusters led to unexpectedly low reported sensitivity for ROC (88.0%).
All panels had FP rates lower than 10.5 per Mb in the CTR with each panel’s default
VAF threshold, and the FP rates dropped as the VAF cutoff increased (Fig. 2b). The FP
rate was noticeably different between panels for a VAF cutoff at 1%, but became in-
creasingly similar as the VAF cutoff became more stringent. As a result, all panels had
similar FP rates of approximately 1 FP per Mb or less for VAF greater than 5%. And all
panels reported no FP calls for VAF greater than 10%. We also assessed both intra- and
cross-lab reproducibility for variant calls in the CTR with VAF between 2.5 and 20%
and observed that they were similar for each panel sample combination (Fig. 2c, Add-
itional file 3: Fig. S1A), with cross-lab reproducibility being slightly worse than intra-lab
reproducibility in a few instances. Results for sample A and sample C were similar for
VAF above 5% but showed some noticeable differences in the VAF range 2.5–5%. The
differences may be driven by VAF reporting boundary effects, as sample C has more
variants in the lower VAF ranges (thus, near the VAF reporting thresholds for several
panels) (Additional file 3: Fig. S1B).
Impact of variant type, VAF cutoff, and genomic region on sensitivity
We explored the impact of variant type on sensitivity for each panel by aggregating all
sample A and C libraries (Fig. 3a). Non-SNV variant calling (small indels and multi-
nucleotide variants (MNVs)) had more variable sensitivity than SNV variant calling for
AGL, ILM, and ROC panels, as the number of known non-SNV small variants per
panel in samples A and C is typically small by absolute numbers (green numbers in
Fig. 3a, Additional file 3: Fig. S2). Thus the confidence interval was usually wider for
non-SNV small variants (Additional file 1: Table S3). We characterized the impact of
VAF on sensitivity comparing SNVs against non-SNV variants (Additional file 3: Fig.
S2). For sample A, the difference between SNVs and non-SNV variants was most pro-
nounced in the lowest VAF range. For both SNVs and non-SNV variants, sensitivity
was generally observed to improve with known variants of higher expected VAFs.
We also applied a range of artificial VAF cutoffs in addition to each panel’s normal
reporting thresholds from stringent (2.5%) to less stringent (1.5%) to better understand
the impact of a VAF reporting threshold on sensitivity in detecting known positives in
the VAF range 2.5–5% (Fig. 3b, see Additional file 1: Table S4 for confidence intervals).
As the cutoff filter was more relaxed, and the boundary effects decreased, sensitivity
rose expectedly across most panels and all reference samples. This increased sensitivity
Gong et al. Genome Biology (2021) 22:109 Page 7 of 23
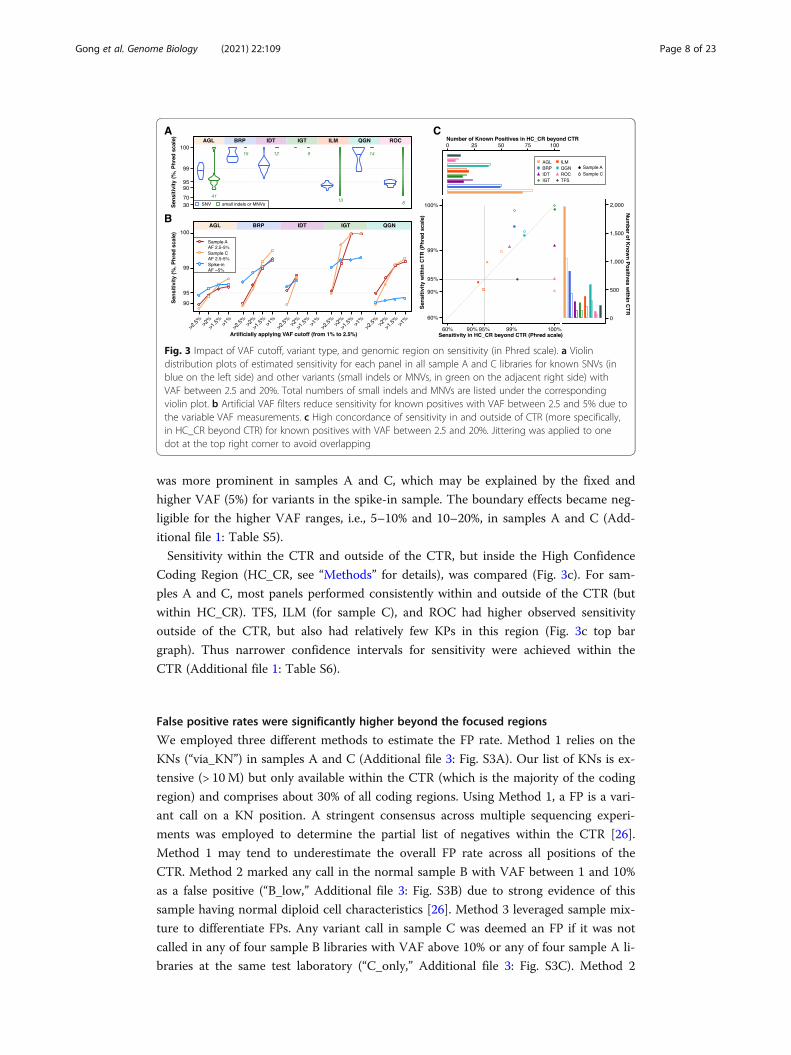
was more prominent in samples A and C, which may be explained by the fixed and
higher VAF (5%) for variants in the spike-in sample. The boundary effects became neg-
ligible for the higher VAF ranges, i.e., 5–10% and 10–20%, in samples A and C (Add-
itional file 1: Table S5).
Sensitivity within the CTR and outside of the CTR, but inside the High Confidence
Coding Region (HC_CR, see “Methods” for details), was compared (Fig. 3c). For sam-
ples A and C, most panels performed consistently within and outside of the CTR (but
within HC_CR). TFS, ILM (for sample C), and ROC had higher observed sensitivity
outside of the CTR, but also had relatively few KPs in this region (Fig. 3c top bar
graph). Thus narrower confidence intervals for sensitivity were achieved within the
CTR (Additional file 1: Table S6).
False positive rates were significantly higher beyond the focused regions
We employed three different methods to estimate the FP rate. Method 1 relies on the
KNs (“via_KN”) in samples A and C (Additional file 3: Fig. S3A). Our list of KNs is ex-
tensive (> 10M) but only available within the CTR (which is the majority of the coding
region) and comprises about 30% of all coding regions. Using Method 1, a FP is a vari-
ant call on a KN position. A stringent consensus across multiple sequencing experi-
ments was employed to determine the partial list of negatives within the CTR [26].
Method 1 may tend to underestimate the overall FP rate across all positions of the
CTR. Method 2 marked any call in the normal sample B with VAF between 1 and 10%
as a false positive (“B_low,” Additional file 3: Fig. S3B) due to strong evidence of this
sample having normal diploid cell characteristics [26]. Method 3 leveraged sample mix-
ture to differentiate FPs. Any variant call in sample C was deemed an FP if it was not
called in any of four sample B libraries with VAF above 10% or any of four sample A li-
braries at the same test laboratory (“C_only,” Additional file 3: Fig. S3C). Method 2
Fig. 3 Impact of VAF cutoff, variant type, and genomic region on sensitivity (in Phred scale). a Violindistribution plots of estimated sensitivity for each panel in all sample A and C libraries for known SNVs (inblue on the left side) and other variants (small indels or MNVs, in green on the adjacent right side) withVAF between 2.5 and 20%. Total numbers of small indels and MNVs are listed under the correspondingviolin plot. b Artificial VAF filters reduce sensitivity for known positives with VAF between 2.5 and 5% due tothe variable VAF measurements. c High concordance of sensitivity in and outside of CTR (more specifically,in HC_CR beyond CTR) for known positives with VAF between 2.5 and 20%. Jittering was applied to onedot at the top right corner to avoid overlapping
Gong et al. Genome Biology (2021) 22:109 Page 8 of 23
might overestimate the FP rate by failing to exclude rare mosaic variants caused by cell
line drift. Method 3 could underestimate the FP rate by failing to recognize those FP
calls due to systematic errors as they would be called in all three samples. These three
methods were compared and found to produce largely similar estimates within the
CTR (Additional file 3: Fig. S3D), with the “B_low” method in one specific VAF range
of IGT and ILM being the only exception. As expected, almost all FP calls within the
CTR were irreproducible across library replicates for any panel, sample, and FP method
(Additional file 3: Fig. S4). Those few exceptions were then confirmed through manual
curation as systematic errors (see the legend for Additional file 3: Fig. S4).
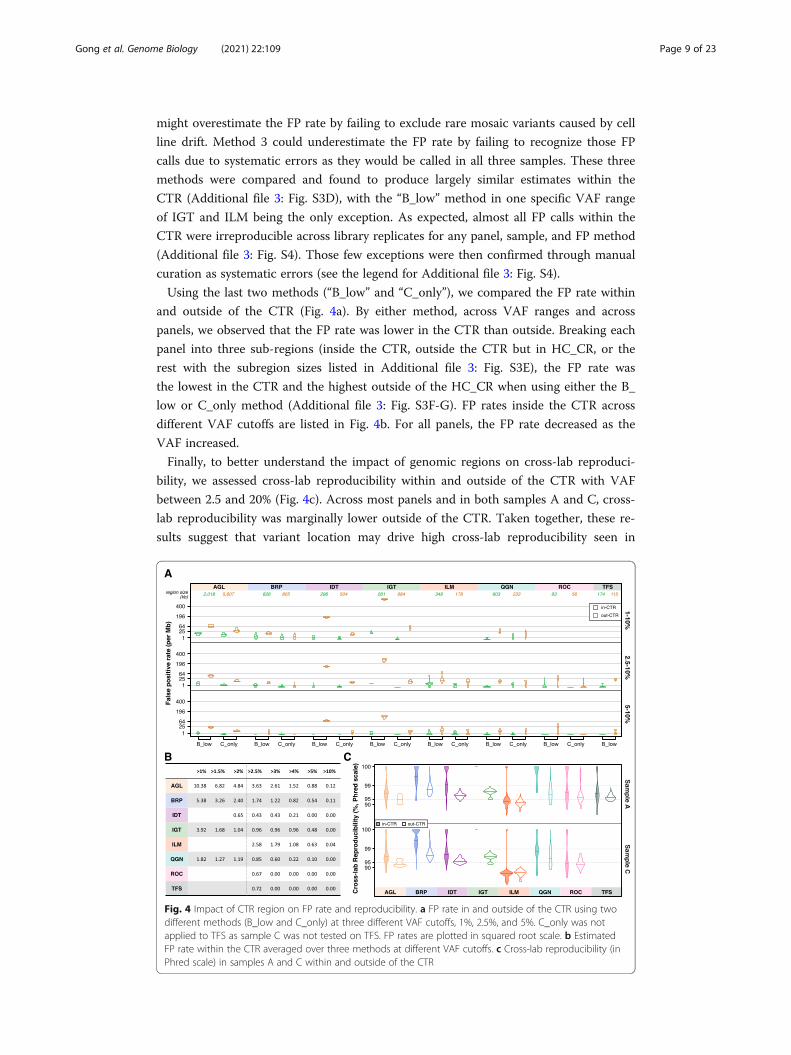
Using the last two methods (“B_low” and “C_only”), we compared the FP rate within
and outside of the CTR (Fig. 4a). By either method, across VAF ranges and across
panels, we observed that the FP rate was lower in the CTR than outside. Breaking each
panel into three sub-regions (inside the CTR, outside the CTR but in HC_CR, or the
rest with the subregion sizes listed in Additional file 3: Fig. S3E), the FP rate was
the lowest in the CTR and the highest outside of the HC_CR when using either the B_
low or C_only method (Additional file 3: Fig. S3F-G). FP rates inside the CTR across
different VAF cutoffs are listed in Fig. 4b. For all panels, the FP rate decreased as the
VAF increased.
Finally, to better understand the impact of genomic regions on cross-lab reproduci-
bility, we assessed cross-lab reproducibility within and outside of the CTR with VAF
between 2.5 and 20% (Fig. 4c). Across most panels and in both samples A and C, cross-
lab reproducibility was marginally lower outside of the CTR. Taken together, these re-
sults suggest that variant location may drive high cross-lab reproducibility seen in
Fig. 4 Impact of CTR region on FP rate and reproducibility. a FP rate in and outside of the CTR using twodifferent methods (B_low and C_only) at three different VAF cutoffs, 1%, 2.5%, and 5%. C_only was notapplied to TFS as sample C was not tested on TFS. FP rates are plotted in squared root scale. b EstimatedFP rate within the CTR averaged over three methods at different VAF cutoffs. c Cross-lab reproducibility (inPhred scale) in samples A and C within and outside of the CTR
Gong et al. Genome Biology (2021) 22:109 Page 9 of 23

Fig. 2c. Since sensitivity did not drop noticeably outside the CTR (Fig. 3c), the observed
drops in reproducibility (Fig. 4c) may be driven by more FPs outside of the CTR
(Fig. 4a).
Enabling oncopanels of sufficient size to estimate TMB
Commonly measured by whole-exome sequencing (WES), TMB ranges over several or-
ders of magnitude and varies by tumor type. Suitable TMB biomarker thresholds can
also vary by tumor type, implying different degrees of accuracy may be required
for different indications. The elevated FP rate outside of the CTR will have a
strong detrimental effect on the accuracy of variant calls and subsequently TMB
estimates. This leads to a reasonable requirement that TMB estimation should be
confined to the CTR portion of each panel. The high density of variants in these
reference samples was purposely designed to enable an accurate evaluation of sen-
sitivity and limit of detection. To investigate a more “real-world” scenario where
using an oncopanel to estimate exome-level TMB might be relevant, we randomly
selected known variants comprised of a prevalence more consistent with actual tu-
mors for a variety of indications (e.g., between 5 and 50 per Mb). We then com-
puted the average technical run-to-run variance of panel-focused TMB estimates
and plotted the technical coefficient of variation (CV) at two different VAF cutoffs:
Fig. 5 Coefficient of variation (CV) of TMB. a Technical run-to-run variance of TMB with VAF cutoff above2.5% was estimated for six panels at different TMB levels. A power-law curve (dashed line) is fitted for eachpanel. b Technical run-to-run variance of TMB with VAF cutoff above 5%. c The intrinsic CV is plotted withthe equation (embedded, see “Methods” for detail) for each panel based on their panel size. The curve(dashed) for size of 1 Mb is also plotted as a reference. d The overall CV is plotted combining technical andintrinsic CV. The solid fitting power-law curve is for TMB (VAF > 2.5%), and the dashed curve is forTMB (VAF > 5%)
Gong et al. Genome Biology (2021) 22:109 Page 10 of 23

2.5% (Fig. 5a) and 5% (Fig. 5b, see “Methods” for details). All six panels with tar-
geted regions in the CTR greater than 250 kb were included in the analysis.
Clearly, the technical CV decreased at higher panel TMB values. There was no ob-
served effect related to the panel size. All panels achieved a CV lower than 25%
when panel-focused TMB was 25 or higher.
To assess the magnitude of additional variance introduced by the genomic coverage
of oncopanels, we utilized The Cancer Genome Atlas (TCGA) WES mutation data [36]
to compute TMB estimates using each panel’s CTR portion. We then used the mean
squared deviation (MSD) to measure the TMB estimation difference between whole-
exome and the panel-specific CTR portion. MSD has two components: mean bias and
variance. We characterized an intrinsic CV measure specific to each panel, related to
this variance component. Further linear regression analysis led to an approximate
equation estimating the intrinsic CV by TMB and the panel size (Additional file 3: Fig.
S5, see “Methods” for details). The intrinsic CV is plotted in Fig. 5c. In agreement with
technical CV, intrinsic CV decreases at higher TMB values. For example, a 1-Mb onco-
panel is estimated to have an intrinsic CV of 25% at a TMB value of 21. By incorporat-
ing both technical variance and intrinsic variance, an overall CV for TMB was
computed and plotted in Fig. 5d when using VAF cutoffs of 2.5% and 5% for each
panel. Overall CV was close to intrinsic CV for each panel at corresponding TMB
values. This indicates that all panels were able to achieve a lower technical variance
than the intrinsic variance associated with estimating exome-level TMB from a smaller
focused panel. Nevertheless, lower technical run-to-run variance is possible for all
panels using a higher VAF cutoff as illustrated in Fig. 5d. This improvement was more
apparent for AGL and QGN panels at lower TMB, and consistently large for IDT
across a wide TMB range. Although many of the panels, e.g., QGN, were not designed
for TMB estimation, they may be used to do so under certain circumstances. However,
if the goal is to maintain an overall CV lower than 25% in the clinically important TMB
range between 15 and 30, AGL combined with an VAF cutoff at 5% would be the only
panel from these eight suitable for TMB estimation.
DiscussionThis oncopanel study was comprehensive in several areas: (1) the use of rigorous per-
formance metrics both within and outside of easier/difficult genomic regions, (2)
utilization of various oncopanel vendors with different panel sizes, (3) broad multi-
laboratory participation, (4) analysis of a wide dynamic range of VAFs, and (5) use of
test samples comprising advanced reference material with dense, known variant content
from a stable source. We assessed reproducibility, sensitivity, and the FP rate of eight
pan-cancer oncopanels across laboratories. We examined the impact on these metrics
by VAF ranges, variant types, and genomic regions. These panels ranged in size from as
small as 149 up to 7625 kb, and DNA input ranged from 20 to 100 ng. Enrichment of
targets by both hybridization-based capture and PCR amplification were represented.
The panel vendors represented major providers of currently marketed targeted sequen-
cing technologies.
We cannot be completely certain that all of our results would generalize to a new ad-
mixture reference sample similarly constructed or real-world clinical formalin-fixed
paraffin-embedded (FFPE) samples. Our primary reference sample (sample A) does not
Gong et al. Genome Biology (2021) 22:109 Page 11 of 23

reflect all cancer indications, nor does it reflect all subtypes for any given cancer [26].
However, this approach provided noticeably better estimates than previous efforts [24].
For example, the large number of variants present in diverse sequence contexts in sam-
ples A and C enabled an accurate assessment of sensitivity and reproducibility for de-
tecting SNVs. We observed that these panels detected known small indel or MNV
positives with similar sensitivity and reproducibility as SNVs (Fig. 3a, Additional file 3:
Fig. S2). However, with the limited amount of small indel/MNV positives identified as
a proportion of all identified variants in the reference sample (1.2%), it is likely given
prior research in the field that these small indel/MNV positives identified in the refer-
ence sample are in group that is easier to detect, in general. Therefore, we cannot sug-
gest that these panels find small indels/MNVs with the same proficiency as SNVs
throughout their target regions until we have identified a larger and more representa-
tive set of indels/MNVs from which to compare. While SNVs predominate clinically
relevant oncology mutations, non-SNVs can also be key drivers [37], and panels should
be further characterized for analysis of non-SNVs as these variants are typically more
challenging to detect than SNVs. Additional reference material with more complex var-
iants is required to address this outstanding question.
We chose to use the output of vendor-implemented bioinformatics pipelines for their
respective proprietary panels. Other SEQC2 work has clearly demonstrated that choices
of bioinformatics pipelines will influence the variant calling results in WES and whole-
genome sequencing (WGS) [31]. Our raw data are made public to enable further evalu-
ation of various bioinformatics pipelines by the community. This study did not
characterize the effect of read coverage, which can be critical for low VAF variants.
Low read coverage can reduce sensitivity and sometimes inflate the FP rate [38]. In
addition, this study did not explore the impact of sample quality on variant calling. In
the clinical setting, it can take considerable time before samples are processed, and
samples are often subject to formalin fixation. A separate team from the Oncopanel Se-
quencing Working Group revealed the impact of formalin fixiation time and within
block position on the performance of oncopanel sequencing [39]. Taken together, the
experience gained from this study suggests that future analysis should focus on asses-
sing the impact of bioinformatics pipelines, including variant callers, on sensitivity and
FP rates.
The FP rate impacts TMB and overall confidence in the panel. To the best of our
knowledge, this is the first study with a comprehensive analysis of the FP rate for onco-
panels. Importantly, our results revealed that increasing the VAF reporting threshold
reduced the FP rate across all VAF values within the CTR, but this effect was far less
dramatic outside of the CTR. Therefore, one straightforward way to control the FP rate,
at least within the CTR, is to adjust the VAF reporting threshold, which for different
panel implementation modalities, may be optimally and more simply determined by
assaying our reference samples and additional negative (normal) reference material
using multiple technical replicates and cross-lab testing. On the contrary, if the goal is
to have sensitive detection of clinically actionable mutations, where the FP rate over a
region is not so relevant, lower variant-specific VAF threshold can be used without
compromising accuracy through a novel synthetic spike-in control that directly mea-
sures the variant-specific and experiment-specific background errors. The control is
presented in an accompanying SEQC2 manuscript [40].
Gong et al. Genome Biology (2021) 22:109 Page 12 of 23

To understand the impact of genomic region on sensitivity, reproducibility, and FP
rates, we assessed all variants compared to those only within the CTR. Sensitivity was
consistent for each panel between the CTR and HC_CR (Fig. 3c). However, because
known variants were only available within HC_CR, we were not able to assess sensitiv-
ity for the regions outside of HC_CR. We hypothesize that sensitivity would be the
same outside of HC_CR or slightly lowered. As for the FP rate, we observed multiple
fold increases for all panels outside of the CTR when studying the impact of genomic
region (Fig. 4a). Reproducibility was lower outside of the CTR (Fig. 4c). A plausible in-
ference would be that the much higher FP rate outside of the CTR led to lower repro-
ducibility in that region. “Real-world” clinical samples likely harbor much fewer low
VAF variants (i.e., VAF < 20%) than sample A or C that was used here. With fewer vari-
ants, the effect of FP rate on reproducibility will be even more pronounced, i.e., the
change in reproducibility will be greater between the CTR and outside of the CTR. In the
extreme case of samples without any low VAF variants, e.g., a pure sample from a healthy
infant, reproducibility will be completely dependent on the FP calls with no relationship
to sensitivity. When reproducibility would play an important role in the specific applica-
tion of oncopanel sequencing, for example, profiling multiple samples to study intratumor
genetic heterogeneity, one may consider restricting the analysis to the CTR. Although
most pathogenic mutations are within the CTR [26], restricting the analysis of clinical
samples to the CTR may lead to the exclusion of certain mutations of interest. Currently,
the CTR has excluded difficult regions and places likely to cause systematic sequencing
errors. Extending the CTR will be a good direction for future work.
We noted that cross-lab reproducibility is similar to, but generally lower than intra-
lab reproducibility (Additional file 3: Fig. S1A). The VAF range has a greater impact
than the lab on reproducibility; however, given the increased variability across labs, we
encourage cross-lab testing of oncopanels. If this is not possible, an alternative is more
extensive testing within the same lab with different operators over an extended period.
Furthermore, routine proficiency testing will help safeguard the performance, even
within the same lab.
When screening clinically actionable mutations, FP variants are typically filtered by
various processes, including variant prioritization (where only selected variants are con-
sidered for determining targeted therapy), and therefore have a small impact in final
clinical decisions [10, 25]. In contrast, FP calls could easily confound TMB calculations
and create a noninformative biomarker. Based on the findings of this large-scale cross-
panel study, we propose different filtering and threshold-related methods for different
modalities: variants for prioritization and targeted therapy selection may employ lower
VAF reporting thresholds to achieve maximal sensitivity, while variants used in TMB
calculations for immunotherapy purposes should consider higher VAF reporting
thresholds or use VAF cutoffs commensurate with a low FP rate. Within this study, we
have evaluated the impact of analytical variables on the detection of mutations and
TMB estimation without reference to specific cancer subtypes. While the described re-
lationships between analytical variables and TMB estimation are likely to remain con-
stant regardless of cancer subtypes, the cancer type may inform the selection of
oncopanel and VAF threshold to optimize diagnostic yields. For example, a greater mu-
tation density, which is typical in lung cancers and melanomas, will enable a more
confident estimation of TMB with lower overall CVs (as shown in Fig. 5d for high
Gong et al. Genome Biology (2021) 22:109 Page 13 of 23

TMB values). Therefore, a moderately sized oncopanel with a higher VAF threshold
may be sufficient. Alternatively, lower VAFs, which confound confident diagnosis, are
typical in cancers with lower sample purity or greater intratumor heterogeneity, such as
pancreatic cancers. In these cancers, a larger oncopanel with a lower VAF threshold
may be required to confidently estimate TMB.
In summary, all eight panels achieved high sensitivity (ranging from 84.2 to 100%) for
variants of low VAF between 1 and 5% (Fig. 2a). Applying an increasingly strict VAF
cutoff reduces the FP rate, but also reduces sensitivity (Fig. 3b). VAF reporting thresh-
olds create boundary effects due to stochastic sampling, where a variant may have an
observed VAF just above the threshold in one replicate and but below in another, caus-
ing a decrease in sensitivity and reproducibility. When comparing performance metrics
in different genomic regions, sensitivity remains consistent; however, the FP rate is
higher and consequentially reproducibility is lower outside of the CTR. These oncopa-
nels demonstrated low relative technical variability in estimating TMB; however, due to
the greater variability in sampling a much smaller region of the exome (Fig. 5), our re-
sults suggest that, at a minimum, oncopanels will require 1Mb in the CTR region to
properly estimate TMB at levels commonly used for decision thresholds and may re-
quire even larger panels if TMB thresholds are needed below 10–15 mutations per
megabase. Results are generally consistent with previous in silico studies [41–43]. This
comprehensive study provides actionable guidelines for oncopanel sequencing and clear
evidence that supports a simplified approach to assess the analytical performance of
oncopanels. It will facilitate the rapid implementation, validation, and quality control of
oncopanels in clinical use.
MethodsTesting samples
Realizing that there is no adequate reference genomic material to enable a transparent
cross-lab study of oncopanels, the Oncopanel Sequencing Working Group developed
and validated a genomic sample suitable for benchmarking oncopanel’s performance in
detecting small variants of low allele frequency (AF). The design, validation process,
and the results are reported in a companion paper [26]. This sample, termed “sample
A,” is composed of an equal mass pooling of 10 gDNA samples prepared from Agilent’s
Universal Human Reference RNA (UHRR) [34] cancer cell lines. Over 42K small vari-
ants are called with high confidence in the defined CTR of over 22 million bases.
Briefly, CTR is the overlap of targeted regions of four whole-exome sequencing panels,
UCSC coding genes, Ensemble exons, and NIST high-confidence genomic regions,
followed by a removal of low complexity regions [26]. The majority of these small vari-
ants have a VAF below 20%, making sample A uniquely suitable for assessing the ana-
lytical performance of oncology panels. More specifically, about 7% of them are in
variant allele frequency (VAF) range (1%, 2.5%), 18% in (2.5%, 5%), 25% in (5%, 10%),
and 18% in (10%, 20%). Sample B is a gDNA sample from a normal male cell line (Agi-
lent Human Reference DNA, Male, Agilent part #: 5190-8848). Sample C is a 1:1 mix
of sample A and sample B. Sample C was included to increase the number of known
variants with VAF between 1 and 2.5%. The spike-in sample is sample B with 5% Acro-
Metrix29 Spike hotspot synthetic controls (Thermo Fisher Scientific, Fremont, CA).
Gong et al. Genome Biology (2021) 22:109 Page 14 of 23

Samples A, B, and C were prepared by Agilent and provided without charge to SEQC2
for study. The spike-in sample was prepared at Thermo Fisher Scientific (Fremont, CA)
after receiving sample B from Agilent under their material transfer agreement. All four
samples were stored in low-EDTA TE buffer (10 mM Tris, 0.1 mM EDTA, pH 8.0) at
20 ng/μl concentration.
Participating panels, test sites, and study protocol
Study participation of oncopanel vendors was actively sought out through all available
venues. A study plan was discussed in detail with each interested contact, emphasizing
the cross-lab study design, transparency, and the requirement for eventual data release
to the public domain. Eight panel providers agreed to participate. Each panel provider
then recruited independent test sites (i.e., laboratories) that were proficient with its
panel and oncology sequencing procedure. Test samples were distributed to test sites
after executing Agilent material transfer agreement and SEQC2 confidentiality agree-
ment. A sample processing and sequence data reporting standard operating procedure
(SOP) was also distributed to all test sites. It includes test sample description, sample
receiving and preparation, a list of test sites, naming convention, testing procedure,
and instructions on library preparation quality data collection. There were at least
three independent test sites for each participating panel. Panel providers and their
supporting partners distributed panels and reagents to the corresponding test sites.
Each site followed the SOP and a panel-specific experimental protocol (see Add-
itional file 2: Supplementary Methods for details) to make 4 replicate libraries for
each sample. Sequencing was done on the same sequencing platform for each
panel. Each panel provider determined the depth of coverage per library and sam-
ple C libraries were sequenced twice as deep as other samples. Panel providers
were encouraged to conduct pilot sequencing experiments with test samples at
their internal lab or test sites. Pilot data was not required for submission to
SEQC2.
Reproducibility by VAF ranges per panel
Given the variability in VAF measurements and its influence on reproducibility, a non-
symmetric reproducibility measure was devised. For comparing library “Libx” to an-
other replicate “Liby” of the same sample, reproducibility is defined as the portion of
Libx’s variant calls that are also detected in Liby. It can be computed by dividing the
number of variants called in both Libx and Liby by the number of variant calls in Libx.
Similarly, a reproducibility value can be computed for comparing Liby to Libx. These
two reproducibility values are not symmetric and thus may be different. For comparing
Libx to Liby, VAF ranges are applied unsymmetrically to compute reproducibility
through stratifying variant calls of Libx into VAF ranges with no restriction imposed to
variant calls of Liby. When both library replicates are from a same test lab, it is counted
as one intra-lab reproducibility measurement. When they are from different test labs, it
is counted as one cross-lab reproducibility measurement. As there are multiple library
replicates from multiple labs, many reproducibility measurements can be computed for
each sample. The average intra-lab reproducibility indicates what percentage of variants
called by one library in one lab within a specific VAF range will be detected by another
Gong et al. Genome Biology (2021) 22:109 Page 15 of 23
library replicate in the same lab without any restriction to their VAF values. The aver-
age cross-lab reproducibility may be interpreted similarly.
Sensitivity estimation by VAF ranges
Sensitivity is defined as the portion of known variants detected by each panel sequen-
cing experiment among all the KPs targeted by the panel. As the list of KPs was not all
inclusive, sensitivity was provided as an estimate. Fortunately, the number of known
variants was usually high enough to provide an accurate estimate. For each sensi-
tivity estimate, a 95% confidence interval was calculated by bootstrap resampling
with the assumption that library replicates are not independent. Sensitivity esti-
mates can be further stratified by the VAF of known variants. Four VAF ranges
were adopted in this study, 1–2.5%, 2.5–5%, 5–10%, and 10–20%. For the spike-in
sample, there was a single range around 5% as all AcroMetrix variants were
spiked-in at a VAF of 5%.
FP rate estimation approaches
Three approaches were adopted to estimate false positive (FP) rate. In the CTR, a list
of known negative (KN) positions was provided for sample A. This list covers over 50%
of the CTR, enough for an accurate estimation of FP rate. By removing the positions
overlapping with any known variants in sample B, a separate list of KN positions was
generated for sample C. Any variant calls overlapping with the negative positions are
flagged as FPs. FP rate is estimated as the ratio of FP calls out of every million KN posi-
tions. This is the first approach (coded as “viaKN”), applicable to sample A and sample
C, but limited to the CTR.
By the second approach (coded as “B_low”), any calls in the normal sample B with
VAF between 1 and 10% are marked as false positives (FPs). A pure diploid normal
sample has variants at either 50% (heterozygous) or 100% (homozygous). Stochastic
sampling and the influence of copy number variation lead to VAF deviation from those
two values. As no extremely high copy number variation was observed in sample B, it
is reasonable to assume that variant calls in sample B with VAF below 10% are FPs.
Variant calls with VAF greater than 10% in any of other three sample B libraries at the
same test sites will be excluded. The third approach (coded as “C_only”) leveraged sam-
ple mixture to differentiate FPs. Any variant in sample C must come from either sam-
ple A or sample B. If a variant is called in one sample C library, but not in any of four
sample B libraries with VAF above 10% or any of four sample A libraries at the same
test laboratory, it is an FP. This approach is more burdensome as all three samples and
multiple libraries must be considered, but it does not rely on the assumption of sample
B’s variant VAF range or the KNs in sample A. Furthermore, it cannot detect FPs due
to any panel bias. Unlike “viaKN,” both “B_low” and “C_only” can be applied to esti-
mate FP rate in the regions beyond the CTR.
Description of three sub-regions for each panel
The CTR was defined as the overlapping regions of four whole-exome sequencing
panels that were used in the companion work21 to characterize known variants in sam-
ple A, NIST high-confidence regions, and exome coding regions. The CTR was then
Gong et al. Genome Biology (2021) 22:109 Page 16 of 23

refined by removing the low complexity regions. The CTR is completely within high-
confidence exome coding regions (HC_CR) that is defined as the overlapping regions
of NIST high-confidence regions and exome coding regions. By intersecting the CTR
and HC_CR with the targeting region of each panel, three sub-regions for each panel
can be defined for performance comparison: within the CTR, within the HC_CR but
outside of the CTR, and the rest.
Evaluation of technical run-to-run variability in panel TMB estimates via simulation
The simulation aimed to reduce the variant density and reduce low VAF variants to
better mimic a “real-world” clinical sample. While the high variant density and high
percentage of variants with VAF below 5% in the test samples provided an advantage in
estimating detection sensitivity with narrow confidence intervals, they presented obsta-
cles here for the evaluation of TMB technical variability. The high variant density
(equivalent to a TMB value about 1000) in the test samples will overshadow the effect
of the FP calls and thus greatly underestimate TMB technical variability. The high
percentage (over 75% in sample C) of variants with VAF below 5% may lead to an over-
estimate of TMB technical variability due to the variability in detecting these low VAF
variants. The simulation was applied to the CTR. The resultant median VAF for low-
frequency (< 20%) KPs would be between 5 and 10%. Sample C was chosen for the
simulation analysis as there are fewer uncharacterized true variants in sample C with
VAF greater than 2.5% in comparison to sample A. All the known variants in sample B
were excluded first from our KP list and from all the variant calling results (VCF files
of library replicates) of each panel. The KPs with VAF < 5% or VAF > 40% in sample A
were also removed. In theory, no KP with VAF < 2.5% or VAF > 20% in sample C was
left. To mimic multiple samples with the constant TMB at a similar level with a clinical
sample, we kept a fixed portion of KPs that resulted in the same number of KPs across
the CTR for panel testing in the simulated samples. Specifically, based on their VAF in
sample A, k% (k = 0, 1, 2, 5, 10, 20) of KPs were retained for VAF between 10 to 40%
and 0.5 × k% of KPs were kept for VAF between 5 and 10%. Given each value, (100 −
k)% of KPs were randomly excluded from CTR to generate a base-report-region for all
the pan-cancer panels. Therefore, the variants not excluded from a VCF file were
counted as the reported calls by the library of a pan-cancer panel in a simulation run.
It is worth pointing out that the reported variants include FP calls and possibly unchar-
acterized true variants in additional to the retained KPs. Finally, 5000 rounds of simula-
tion were performed for each based-report-region with a k value greater than 0.
For each one of 5000 base-report-region with a k value (k > 0), the reported variants
were then counted for these above a chosen VAF threshold for each library replicate.
The variance and mean across all technical replicates for each panel were calculated.
Then, we computed the overall average of variance and mean over the 5000 runs of
simulation. Finally, the CV for TMB were calculated as:
CV ¼ffiffiffiffiffiffiffiffiffiffiffiffiffiffiffiffiffiffiffiffiffiffiffiffiffiffiffiffiffiffiffiffiffiffiffiffiffiffiffiffiffiffiffiffiffiffiffiffiffiffiffiffiffiffiffiffiffiffiOvarall Average of Variance
p
Ovarall Average of Mean Count
The mean TMB for each chosen k value was calculated as the overall average count
of variants divided by the report region sizes of six panels. This CV is adopted to
Gong et al. Genome Biology (2021) 22:109 Page 17 of 23

measure the technical run-to-run variability and examine its dependence on TMB and
VAF cutoff.
Model the deviation in TMB rate from WES by pan-cancer panels via TCGA dataset
Mutation Annotation Format (MAF) files of 10,295 cancer genomes across 33 cancer
types were collected from The Cancer Genome Atlas (TCGA) project involving 2.9
million somatic mutations (MC3 Public MAF) for TMB measurement. The shared por-
tion of TCGA coding sequence (CDS) region and the CTR with a size of 22,089,460
bases (55% of TCGA CDS) was used to calculate the TMB rate of each individual can-
cer sample. The TCGA-measured TMB rate was calculated as the number of mutations
per million bases within the shared region and used as the baseline in this analysis.
Then, given the TCGA somatic mutations as ground truth, the panel-measured TMB
rate of each cancer sample was calculated by the number of mutations within the panel
divided by the panel’s region overlapping with the CTR and TCGA CDS in million base
pairs. Two panels, ROC and TFS, were excluded from this analysis because of their
small sizes.
For each pan-cancer panel, the mean squared deviation (MSD) was utilized to evalu-
ate the difference between TCGA and panel TMB rates of the same group of cancer
samples,
MSD P j� � ¼
Pni¼1 TCGA:TMBi−P j i;TMBi;Cov j
� �� �2
N
where j represents each panel and i is an individual cancer sample. The function Pj cal-
culates the TMB of sample i within the covered region (Covj) by panel j. N represents
the number of samples in the group for the calculation of MSD. One outlier cancer
genome TCGA-13-0889-01A-01W-0420-08 (with TCGA TMB rate of 33) was excluded
from the calculation of MSD due to the abnormally huge difference between the TMB
rates measured by TCGA WES and panels.
For a group of samples with TMB rates close to each other and thus close to their
mean value, a modified MSD (MSD´) is defined by substituting the TMB mean for the
individual TCGA TMB in the equation above. Approximately, MSD equals to MSD´
subtracting the variance of TCGA TMB in the sample group. Mathematically, MSD´
equals to the sum of the variance of TMB by the panel and the squared difference in
the mean TMB values between TCGA and the panel. Thus, MSD is broken down into
two components of mean bias and variance (see Additional file 2: Supplementary
Methods for details). The mean bias component is equal to the squared difference in
the mean TMB values between TCGA and the panel. The variance component is equal
to the variance of TMB by the panel reduced by the variance of TCGA TMB. This ad-
justed variance component is of particularly interest.
To better understand this adjusted panel TMB variance, we selected the TCGA
samples (about 2400 samples) with TMB rates from 5 to 40 and sorted them by
TMB. We then grouped each 100 samples and calculated the panel TMB mean
value and the adjusted panel TMB variance. Multiplying it by the squared panel
size in million bases, we converted the adjusted panel TMB variance to the muta-
tion count level, which was then plotted against the product of the panel TMB
mean and the panel size. A linear regression model was fitted over these two
Gong et al. Genome Biology (2021) 22:109 Page 18 of 23

variables from all the six panels that cover at least 250 kb in the CTR (Additional
file 3: Fig. S5). A very high R2 value (0.957) was observed along with a tight 95%
confidence interval (1.28–1.34) for the slope of the regression line. This revealed
a strong linear relationship between the adjust panel TMB variance and the panel
TMB mean in mutation count. Finally, an intrinsic CV for each panel could be
calculated as 1.15 divided by the square root of panel TMB mean in mutation
count.
Supplementary InformationThe online version contains supplementary material available at https://doi.org/10.1186/s13059-021-02315-0.
Additional file 1: Table S1. Detailed information for eight participating pan-cancer panels. Table S2. 95% confi-dence interval for reported sensitivity across VAF ranges for SNVs in the consensus targeted region (CTR). TableS3. 95% confidence interval for reported sensitivity in detecting known SNVs and other variants of expected VAFbetween 2.5% and 20%. Table S4. 95% confidence interval for reported sensitivity in detecting known SNVs withinthe CTR of expected VAF between 2.5% and 5% after applying the artificial VAF cutoff at 1.5%, 2.0% and 2.5%.Table S5. Sensitivity across VAF ranges for all samples after applying the artificial VAF cutoff. Table S6. 95% confi-dence interval for reported sensitivity within the CTR or HC_CR (more specifically, in HC_CR beyond the CTR) in de-tecting known positives of expected VAF between 2.5% and 20%.
Additional file 2. Supplementary Methods.
Additional file 3: Fig. S1. Concordance of average cross-lab reproducibility and intra-lab reproducibility in Phredscale across VAF ranges for samples A and C. Fig. S2. Comparison of sensitivity of different variant types acrossVAF ranges. Fig. S3. Estimation of the false positive rate by three methods. Fig. S4. Low reproducibility of falsepositive calls across library replicates. Fig. S5. Scatter plot of panel TMB mean × panel_size (x-axis) and adjustedpanel TMB variance × panel_size2 (y-axis).
Additional file 4. Review history.
AcknowledgementsWe thank our FDA colleagues Drs. Anand Pathak and Shashi Amur for providing useful feedback during study designand manuscript preparation.
Review historyThe review history is available as Additional file 4.
Peer review informationAnahita Bishop was the primary editor of this article and managed its editorial process and peer review incollaboration with the rest of the editorial team.
DisclaimersThis research includes contributions from, and was reviewed by, the FDA and the NIH. This work has been approvedfor publication by these agencies, but does not necessarily reflect official agency policy. Certain commercial materialsand equipment are identified in order to adequately specify experimental procedures. In no case does suchidentification imply recommendation or endorsement by the FDA or the NIH, nor does it imply that the itemsidentified are necessarily the best available for purpose.
Authors’ contributionsW.T., L.S., W.J., and J.X. conceived the project. B.G., D.J.J.Jr., J.C.W., W.T., L.S., W.J., and J.X. devised the experiments. N.N.and L. L. prepared the reference samples for cross-laboratory experiments. N.N., C. P-P., Z.Z., K.L., W.C., J.S.L., E.L., T.A.R.,V.K.M., C.X.,D.B., S.C., K.G., N.H., F.Q., K.W., C.A., S.H., M.J.,W.Q., A.S., Y.W., G.Z., and S.Z. coordinated laboratory experimentsand/or performed panel-specific variant calling analysis. G.C., H.A., A.B., J.B., B.B., D.J.B., A.C., C.R.C., D.C., J.C., J.C.C., D.J.C.,E.C., A.d.P., D.D., A.K.E., J.F., A.G., S.G., C.H., X.H., B.H., J.H., K.H., J.H., J.K., B.K., P.L., Q.L., W.L., Y.L., S.L., C.M., N.M., R.M-A., Q.M.,P.A.M., D.M., C.P.P., A.R., P.R., R.R., B.S., E.S., R.S., R.S., J.C.S-C., M.S., M.S.L., P.S., D.S., M.S., A.S., J.S., P.S., H.T., L.T., Y.T., V.J.T.,D.T., E.V.G., S.V., K.W., V.W., J.Y., S.H.Y., M.Z., X.Z., and C.E.M. performed laboratory experiments. B.G., D.L., Y.Z., S.W., P.R.B.,Y.Y., H.B., T.B., L.B.,C.C.,T.C., M.C., I.W.D., X.F., C.F., M.G., H.H., L.H., D.P.K., P.Ł., P.L.,Z.L., Z.L., D.B.M., T.M., B.N., B.L.P., M.P., Q.S.,T.S., S. T, D.T-M., J.T-M., B.T., N.T., C.W., J.W., Z.W., L.W., C.X., W.X., S.X., M.Y., Y.Z., and T.M. contributed to data analysis. B.G.,D.L., Y.Z., and S.W. prepared the figures. R.K., B.G., D.L., W.J., L.S., and J.X. prepared the manuscript, with support from allco-authors. All authors read and approved the final manuscript.
FundingAll SEQC2 participants freely donated their time, reagents, and computing resources for the completion and analysisof this project. Part of this work was carried out with the support of the Intramural Research Program of the NationalInstitutes of Health (to Mehdi Pirooznia), National Institute of Environmental Health Sciences (to Pierre Bushel), andNational Library of Medicine (to Danielle Thierry-Mieg, Jean Thierry-Mieg, and Chunlin Xiao). Leming Shi and YuantingZheng were supported by the National Key R&D Project of China (2018YFE0201600), the National Natural ScienceFoundation of China (31720103909), and Shanghai Municipal Science and Technology Major Project (2017SHZDZX01).
Gong et al. Genome Biology (2021) 22:109 Page 19 of 23

Donald J. Johann, Jr. acknowledges the support by FDA BAA grant HHSF223201510172C. Timothy Mercer and IraDeveson were supported by the National Health and Medical Research Council (NHMRC) of Australia grantsAPP1108254, APP1114016, and APP1173594 and Cancer Institute NSW Early Career Fellowship 2018/ECF013. This re-search has also been, in part, financially supported by the MEYS of the CR under the project CEITEC 2020 (LQ1601), byMH CR, grant No. (NV19-03-00091). Part of this work was carried out with the support of research infrastructure EATRIS-CZ, ID number LM2015064, funded by MEYS CR. Boris Tichy and Nikola Tom were supported by research infrastruc-ture EATRIS-CZ, ID number LM2018133 funded by MEYS CR and MEYS CR project CEITEC 2020 (LQ1601).The contents of the published materials are solely the responsibility of the administering institution, a participatinginstitution or individual authors, and they do not reflect the views of any funding body listed above.
Availability of data and materialsImportant data items from the consortium oncopanel sequencing effort that we intend to disclose include thefollowing: (1) NGS sequencing data [44] (in FASTQ or BAM format) from eight oncopanels for sample A, sample B,sample C, and the spike-in sample; (2) variant call results [45] (in VCF format) by the panel providers for these four sam-ples; and (3) dependent files [45] (e.g., panel BED files, genome FASTA files) for each oncopanel.
Declarations
Ethics approval and consent to participateNot Applicable.
Consent for publicationNot Applicable.
Competing interestsThe authors declare the following potential competing financial interests:Natalia Novoradovskaya, Katherine Wilkins, Anne Lucas, Scott Happe, and Carlos Pabon are all employees of AgilentTechnologies, Inc. Agilent sample B DNA reference sample is a current product and sample A DNA and sample C DNAare potential products of Agilent Technologies, Inc.
Author details1Division of Bioinformatics and Biostatistics, National Center for Toxicological Research, US Food and DrugAdministration, Jefferson, AR 72079, USA. 2Immuneering Corporation, One Broadway, 14th Floor, Cambridge, MA02142, USA. 3Agilent Technologies, 11011 N Torrey Pines Rd, La Jolla, CA 92037, USA. 4Department of InformationScience, University of Arkansas at Little Rock, 2801 S. Univ. Ave, Little Rock, AR 72204, USA. 5State Key Laboratory ofGenetic Engineering, School of Life Sciences and Shanghai Cancer Hospital/Cancer Institute, Fudan University,Shanghai 200438, China. 6Agilent Technologies, 5301 Stevens Creek Blvd, Santa Clara, CA 95051, USA. 7Research andDevelopment, Burning Rock Biotech, Shanghai 201114, China. 8Bioinformatics, Integrated DNA Technologies, Inc., 1710Commercial Park, Coralville, IA 52241, USA. 9iGeneTech, 8 Shengmingyuan Rd., Zhongguancun Life Science Park,Changping District, Beijing 100080, China. 10Illumina Inc., 5200 Illumina Way, San Diego, CA 92122, USA. 11Research andDevelopment, QIAGEN Sciences Inc., Frederick, MD 21703, USA. 12Market & Application Development Bioinformatics,Roche Sequencing Solutions Inc., 4300 Hacienda Dr, Pleasanton, CA 94588, USA. 13Thermo Fisher Scientific, 110 MillerAve, Ann Arbor, MI 48104, USA. 14Clinical Diagnostic Division, Thermo Fisher Scientific, 46500 Kato Rd, Fremont, CA94538, USA. 15Winthrop P Rockefeller Cancer Institute, University of Arkansas for Medical Sciences, 4301 W Markham St,Little Rock, AR 72205, USA. 16Departments of Medicine, Pathology, and Cancer Biology, College of Medicine and LifeSciences, University of Toledo Health Sciences Campus, 3000 Arlington Ave, Toledo, OH 43614, USA. 17NationalInstitute of Environmental Health Sciences, Research Triangle Park, NC 27709, USA. 18Department of Immunology,Genomics and Microarray Core Facility, University of Texas Southwestern Medical Center, 5323 Harry Hine Blvd, Dallas,TX 75390, USA. 19Research and Development, Roche Sequencing Solutions Inc., 500 South Rosa Rd, Madison, WI 53719,USA. 20Clinical Sequencing Division, Thermo Fisher Scientific, 180 Oyster Point Blvd, South San Francisco, CA 94080,USA. 21Marketing, Integrated DNA Technologies, Inc., 1710 Commercial Park, Coralville, IA 52241, USA. 22Icahn Instituteand Dept. of Genetics and Genomic Sciences Icahn School of Medicine at Mount Sinai, 1425 Madison Ave, New York,NY 10029, USA. 23Greenwood Genetic Center, 106 Gregor Mendel Circle, Greenwood, SC 29646, USA. 24Department ofPathology, Fudan University Shanghai Cancer Center, Fudan University, Shanghai 200032, China. 25Department ofOncology, Shanghai Medical College, Fudan University, Shanghai 200032, China. 26Institute of Pathology, FudanUniversity, Shanghai 200032, China. 27JMP Life Sciences, SAS Institute Inc., Cary, NC 27519, USA. 28Departments ofPathology and Pediatrics, University of Utah School of Medicine, Salt Lake City, UT 84108, USA. 29R&D Genomics MPS,Institute for Clinical and Experimental Pathology ARUP Laboratories, 500 Chipeta Way, Salt Lake City, UT 84108, USA.30ResearchDx, Inc., 5 Mason, Irvine, CA 92618, USA. 31Department of Computer Science, Engineering and Physics,University of Michigan-Flint, Flint, MI 48502, USA. 32Garvan Institute of Medical Research, Sydney, NSW, Australia. 33StVincent’s Clinical School, University of New South Wales, Sydney, NSW 2010, Australia. 34Department of Pathology,College of Medicine and Life Sciences, The University of Toledo, Toledo, OH 43614, USA. 35Lucas County Coroner’sOffice, 2595 Arlington Ave., Toledo, OH 43614, USA. 36Division of Gastroenterology and Hepatology, Mayo Clinic,Rochester, MN 55905, USA. 37OmniSeq, Inc. 700 Ellicott St, Buffalo, NY 14203, USA. 38Department of Physiology andBiophysics, Weill Cornell Medicine, Cornell University, New York, NY 10065, USA. 39Stanford Genome TechnologyCenter, Stanford University, Palo Alto, CA 94304, USA. 40Division of Genetic and Molecular Toxicology, National Centerfor Toxicological Research, US Food and Drug Administration, Jefferson, AR 72079, USA. 41Fondazione Bruno Kessler,38123 Trento, Italy. 42Department of Medicine, College of Medicine and Life Sciences, The University of Toledo, Toledo,OH 43614, USA. 43Institute of Medical and Molecular Genetics (INGEMM), Hospital Universitario La Paz, CIBERERInstituto de Salud Carlos III, 28046 Madrid, Spain. 44EATRIS ERIC- European Infrastructure for Translational Medicine, DeBoelelaan 1118, 1081 HZ Amsterdam, The Netherlands. 45Kinghorn Centre for Clinical Genomics, Garvan Institute of
Gong et al. Genome Biology (2021) 22:109 Page 20 of 23

Medical Research, Sydney, NSW, Australia. 46St Vincent’s Clinical School, Faculty of Medicine, University of New SouthWales, Sydney, NSW, Australia. 47Cancer Genetics Inc, 201 Route 17 N, Meadows Office Building, Rutherford, NJ 07070,USA. 48Institute for Personalized Cancer Therapy, MD Anderson Cancer Center, 6565 MD Anderson Blvd, Houston, TX77030, USA. 49Pharmaceutical Informatics Institute, College of Pharmaceutical Sciences, Zhejiang University, Hangzhou310058, Zhejiang, China. 50HK3 Lab, Milan, Italy. 51Molecular Laboratory, Prof. F. Raue, Im Weiher 12, Heidelberg,Germany. 52Agilent Technologies, 1834 State Hwy 71 West, Cedar Creek, TX 78612, USA. 53Department of Pathology,Strata Oncology, Inc., Ann Arbor, MI 48103, USA. 54Human Genome Sequencing Center, Baylor College of Medicine, 1Baylor Plaza, Houston, TX 77030, USA. 55Massachusetts General Hospital, Harvard Medical School, Boston, MA 02114,USA. 56NGS Products and Services, Integrated DNA Technologies, Inc., 1710 Commercial Park, Coralville, IA 52241, USA.57Molecular Genetics Laboratory, Molecular Diagnostics Division, London Health Sciences Centre, 800 CommissionersRd E, London, Ontario N6A5W9, Canada. 58Division of Anatomic Pathology, Mayo Clinic, 200 First Street SW, Rochester,MN 55905, USA. 59Bioinformatics Research, Institute of Molecular Biotechnology, Boku University Vienna, Vienna,Austria. 60Małopolska Centre of Biotechnology, Jagiellonian University, Krakow, Poland. 61Department of Biotechnology,Boku University, Vienna, Austria. 62Institute of Medical and Molecular Genetics (INGEMM), Hospital Universitario La Paz,IdiPaz, CIBERER Instituto de Salud Carlos III, 28046 Madrid, Spain. 63ITHACA, European Reference Network on RareCongenital Malformations and Rare Intellectual Disability, European Commission, Lille, France. 64Department ofPathology, National Cancer Center/National Clinical Research Center for Cancer/Cancer Hospital, Chinese Academy ofMedical Sciences, No.17, Panjiayuan Nanli, Chaoyang District, Beijing 100021, China. 65Center of Genome andPersonalized Medicine, Institute of Cancer Stem Cell, Dalian Medical University, Dalian 116044, Liaoning, China.66Geneis, 5 Guangshun North St., Chaoyang District, Beijing 100102, China. 67GeneSmile Ltd Co., Jiangsu CancerHospital, 42 Baiziting St., Xuanwu District, Nanjing 210009, Jiangsu, China. 68Genycell Biotech España, Calle GarridoAtienza, 18320 Santa Fe, Granada, Spain. 69CMINDS Research Center, Department of Electrical and ComputerEngineering, College of Engineering, University of Massachusetts Lowell, Lowell, MA 01854, USA. 70Department ofGenetics, University of North Carolina, 250 Bell Tower Drive, Chapel Hill, NC 27599, USA. 71Accugenomics, Inc., 1410Commonwealth Drive, Suite 105, Wilmington, NC 20403, USA. 72Translational Research Laboratory, Belfer Center forApplied Cancer Science, Dana-Farber Cancer Institute, 360 Longwood Ave, Boston, MA 02215, USA. 73Bioinformaticsand Computational Biology Laboratory, National Heart Lung and Blood Institute, National Institutes of Health,Bethesda, MD 20892, USA. 74Astrazeneca Pharmaceuticals, 35 Gatehouse Dr, Waltham, MA 02451, USA. 75Departmentof Pathology and Laboratory Medicine, Western University, London, Ontario N6A3K7, Canada. 76Institute for MolecularMedicine Finland (FIMM), Nordic EMBL Partnership for Molecular Medicine, HiLIFE Unit, Biomedicum Helsinki 2U(D302b), P.O. Box 20, (Tukholmankatu 8), FI-00014 University of Helsinki, Helsinki, Finland. 77Laboratory for MolecularGenetics, Endocrine Practice, Im Weiher 12, 69121 Heidelberg, Germany. 78Division of Systems Biology, National Centerfor Toxicological Research, US Food and Drug Administration, Jefferson, AR 72079, USA. 79Center for Bioinformatics andComputational Biology, and the Institute of Biomedical Sciences, School of Life Sciences, East China Normal University,500 Dongchuan Rd, Shanghai 200241, China. 80National Centre for Cardiovascular Research (CNIC), Madrid, Spain.81Primbio Genes Biotechnology, Building C6-501, Biolake, No.666 Gaoxin Ave., East Lake High-tech Development Zone,Wuhan 430074, Hubei, China. 82National Center for Biotechnology Information, National Library of Medicine, NationalInstitutes of Health, 8600 Rockville Pike, Bethesda, MD 20894, USA. 83Center of Molecular Medicine, Central EuropeanInstitute of Technology, Masaryk University, Kamenice 5, 625 00 Brno, Czech Republic. 84Center for Genomics, School ofMedicine, Loma Linda University, Loma Linda, CA 92350, USA. 85Division of Microbiology & Molecular Genetics,Department of Basic Sciences, School of Medicine, Loma Linda University, Loma Linda, CA 92350, USA. 86Center forIndividualized Medicine, Mayo Clinic, Scottsdale, AZ 85259, USA. 87Department of Health Sciences, Mayo Clinic,Scottsdale, AZ 85259, USA. 88Department of Molecular Pharmacology and Experimental Therapeutics, Mayo Clinic,Scottsdale, AZ 85259, USA. 89College of Chemistry, Sichuan University, Chengdu 610064, Sichuan, China. 90Science forLife Laboratory, Karolinska Institutet, Tomtebodavägen 23B, 171 65 Solna, Sweden. 91National Center for BiotechnologyInformation, National Library of Medicine, National Institutes of Health, 45 Center Drive, Bethesda, MD 20894, USA.92Department of Biostatistics, Columbia Mailman School of Public Health, 722 West 168th St., New York, NY 10032,USA. 93Center for Genomic Sciences, LKS Faculty of Medicine, The University of Hong Kong, Hong Kong, SAR, China.94Clinical Laboratory, Burning Rock Biotech, Guangzhou 510300, Guangdong, China. 95Geneplus, PKUCare IndustrialPark, Changping District, Beijing 102206, China. 96Australian Institute of Bioengineering and Nanotechnology, Universityof Queensland, Brisbane, QLD, Australia. 97Genomics and Epigenetics Theme, Garvan Institute of Medical Research,Sydney, NSW, Australia. 98Human Phenome Institute, Fudan University, Shanghai 201203, China. 99Fudan-Gospel JointResearch Center for Precision Medicine, Fudan University, Shanghai 200438, China. 100Q2 Solutions - EA Genomics,5927 S Miami Blvd, Morrisville, NC 27560, USA.
Received: 28 July 2020 Accepted: 18 March 2021
References1. Lindeman NI, Cagle PT, Beasley MB, Chitale DA, Dacic S, Giaccone G, et al. Molecular testing guideline for selection of
lung cancer patients for EGFR and ALK tyrosine kinase inhibitors: guideline from the College of American Pathologists,International Association for the Study of Lung Cancer, and Association for Molecular Pathology. J Thorac Oncol. 2013;8(7):823–59. https://doi.org/10.1097/JTO.0b013e318290868f.
2. Sosman JA, Kim KB, Schuchter L, Gonzalez R, Pavlick AC, Weber JS, McArthur GA, Hutson TE, Moschos SJ, Flaherty KT,Hersey P, Kefford R, Lawrence D, Puzanov I, Lewis KD, Amaravadi RK, Chmielowski B, Lawrence HJ, Shyr Y, Ye F, Li J,Nolop KB, Lee RJ, Joe AK, Ribas A. Survival in BRAF V600–mutant advanced melanoma treated with vemurafenib. N EnglJ Med. 2012;366(8):707–14. https://doi.org/10.1056/NEJMoa1112302.
3. Berger MF, Mardis ER. The emerging clinical relevance of genomics in cancer medicine. Nat Rev Clin Oncol. 2018;15(6):353–65. https://doi.org/10.1038/s41571-018-0002-6.
4. Cordova-Delgado M, Pinto MP, Retamal IN, Muñoz-Medel M, Bravo ML, Fernández MF, Cisternas B, Mondaca S, SanchezC, Galindo H, Nervi B, Ibáñez C, Acevedo F, Madrid J, Peña J, Koch E, Maturana MJ, Romero D, de la Jara N, Torres J,
Gong et al. Genome Biology (2021) 22:109 Page 21 of 23
Espinoza M, Balmaceda C, Liao Y, Li Z, Freire M, Gárate-Calderón V, Cáceres J, Sepúlveda-Hermosilla G, Lizana R, RamosL, Artigas R, Norero E, Crovari F, Armisén R, Corvalán AH, Owen GI, Garrido M. High proportion of potential candidatesfor immunotherapy in a Chilean cohort of gastric cancer patients: results of the FORCE1 study. Cancers. 2019;11(9):1275.https://doi.org/10.3390/cancers11091275.
5. Heeke AL, Pishvaian MJ, Lynce F, Xiu J, Brody JR, Chen W-J, et al. Prevalence of homologous recombination–relatedgene mutations across multiple cancer types. JCO Precis Oncol. 2018;2:PO.17.00286. https://doi.org/10.1200/PO.17.00286.
6. Kacew AJ, Harris EJ, Lorch JH, Haddad RI, Chau NG, Rabinowits G, LeBoeuf NR, Schmults CD, Thakuria M, MacConaill LE,Hanna GJ. Chromosome 3q arm gain linked to immunotherapy response in advanced cutaneous squamous cellcarcinoma. Eur J Cancer. 2019;113:1–9. https://doi.org/10.1016/j.ejca.2019.03.004.
7. Hiley CT, Le Quesne J, Santis G, Sharpe R, de Castro DG, Middleton G, et al. Challenges in molecular testing in non-small-cell lung cancer patients with advanced disease. Lancet. 2016;388(10048):1002–11. https://doi.org/10.1016/S0140-6736(16)31340-X.
8. Martin P, Shiau CJ, Pasic M, Tsao M, Kamel-Reid S, Lin S, Tudor R, Cheng S, Higgins B, Burkes R, Ng M, Arif S, Ellis PM,Hubay S, Kuruvilla S, Laurie SA, Li J, Hwang D, Lau A, Shepherd FA, le LW, Leighl NB. Clinical impact of mutation fractionin epidermal growth factor receptor mutation positive NSCLC patients. Br J Cancer. 2016;114(6):616–22. https://doi.org/10.1038/bjc.2016.22.
9. Groopman EE, Rasouly HM, Gharavi AG. Genomic medicine for kidney disease. Nat Rev Nephrol. 2018;14(2):83–104.https://doi.org/10.1038/nrneph.2017.167.
10. Cheng DT, Mitchell TN, Zehir A, Shah RH, Benayed R, Syed A, Chandramohan R, Liu ZY, Won HH, Scott SN, Brannon AR,O'Reilly C, Sadowska J, Casanova J, Yannes A, Hechtman JF, Yao J, Song W, Ross DS, Oultache A, Dogan S, Borsu L,Hameed M, Nafa K, Arcila ME, Ladanyi M, Berger MF. Memorial Sloan Kettering-integrated mutation profiling ofactionable cancer targets (MSK-IMPACT): a hybridization capture-based next-generation sequencing clinical assay forsolid tumor molecular oncology. J Mol Diagn. 2015;17(3):251–64. https://doi.org/10.1016/j.jmoldx.2014.12.006.
11. Gagan J, Van Allen EM. Next-generation sequencing to guide cancer therapy. Genome Med. 2015;7(1):80. https://doi.org/10.1186/s13073-015-0203-x.
12. Samstein RM, Lee C-H, Shoushtari AN, Hellmann MD, Shen R, Janjigian YY, Barron DA, Zehir A, Jordan EJ, Omuro A,Kaley TJ, Kendall SM, Motzer RJ, Hakimi AA, Voss MH, Russo P, Rosenberg J, Iyer G, Bochner BH, Bajorin DF, al-AhmadieHA, Chaft JE, Rudin CM, Riely GJ, Baxi S, Ho AL, Wong RJ, Pfister DG, Wolchok JD, Barker CA, Gutin PH, Brennan CW,Tabar V, Mellinghoff IK, DeAngelis LM, Ariyan CE, Lee N, Tap WD, Gounder MM, D’Angelo SP, Saltz L, Stadler ZK, ScherHI, Baselga J, Razavi P, Klebanoff CA, Yaeger R, Segal NH, Ku GY, DeMatteo RP, Ladanyi M, Rizvi NA, Berger MF, Riaz N,Solit DB, Chan TA, Morris LGT. Tumor mutational load predicts survival after immunotherapy across multiple cancertypes. Nat Genet. 2019;51(2):202–6. https://doi.org/10.1038/s41588-018-0312-8.
13. Chalmers ZR, Connelly CF, Fabrizio D, Gay L, Ali SM, Ennis R, et al. Analysis of 100,000 human cancer genomes revealsthe landscape of tumor mutational burden. Genome Med. 2017;9:34. https://doi.org/10.1186/s13073-017-0424-2.
14. FoundationOne. FoundationOne CDx Technical Information. https://www.accessdata.fda.gov/cdrh_docs/pdf17/P170019C.pdf. Accessed 24 Feb. 2020.
15. Omics Core by NantHealth, Inc. 510(k) Premarket Notification. https://www.accessdata.fda.gov/scripts/cdrh/cfdocs/cfPMN/pmn.cfm? ID=K190661. Accessed 24 Mar 2020.
16. PGDx elio tissue complete by Personal Genome Diagnostic, Inc. 510(k) Premarket Notification. https://www.accessdata.fda.gov/scripts/cdrh/cfdocs/cfpmn/pmn.cfm? ID=K192063. Accessed 13 Dec 2020.
17. Lemery S, Keegan P, Pazdur R. First FDA approval agnostic of Cancer site — when a biomarker defines the indication. NEngl J Med. 2017;377(15):1409–12. https://doi.org/10.1056/NEJMp1709968.
18. FDA approves third oncology drug that targets a key genetic driver of cancer, rather than a specific type of tumor.https://www.fda.gov/news-events/press-announcements/fda-approves-third-oncology-drug-targets-key-genetic-driver-cancer-rather-specific-type-tumor. Accessed 13 Mar 2020.
19. Meric-Bernstam F, Brusco L, Shaw K, Horombe C, Kopetz S, Davies MA, Routbort M, Piha-Paul SA, Janku F, Ueno N, HongD, de Groot J, Ravi V, Li Y, Luthra R, Patel K, Broaddus R, Mendelsohn J, Mills GB. Feasibility of large-scale genomictesting to facilitate enrollment onto Genomically matched clinical trials. J Clin Oncol. 2015;33(25):2753–62. https://doi.org/10.1200/JCO.2014.60.4165.
20. Gray SW, Hicks-Courant K, Cronin A, Rollins BJ, Weeks JC. Physicians’ attitudes about multiplex tumor genomic testing. JClin Oncol. 2014;32(13):1317–23. https://doi.org/10.1200/JCO.2013.52.4298.
21. Jameson GS, Petricoin EF, Sachdev J, Liotta LA, Loesch DM, Anthony SP, Chadha MK, Wulfkuhle JD, Gallagher RI, ReederKA, Pierobon M, Fulk MR, Cantafio NA, Dunetz B, Mikrut WD, von Hoff DD, Robert NJ. A pilot study utilizing multi-omicmolecular profiling to find potential targets and select individualized treatments for patients with previously treatedmetastatic breast cancer. Breast Cancer Res Treat. 2014;147(3):579–88. https://doi.org/10.1007/s10549-014-3117-1.
22. Tsongalis GJ, Peterson JD, de AFB, Tunkey CD, Gallagher TL, Strausbaugh LD, et al. Routine use of the ion torrentAmpliSeq™ Cancer hotspot panel for identification of clinically actionable somatic mutations. Clin Chem Lab Med. 2013;52(5):707–14. https://doi.org/10.1515/cclm-2013-0883.
23. Garofalo A, Sholl L, Reardon B, Taylor-Weiner A, Amin-Mansour A, Miao D, Liu D, Oliver N, MacConaill L, Ducar M, Rojas-Rudilla V, Giannakis M, Ghazani A, Gray S, Janne P, Garber J, Joffe S, Lindeman N, Wagle N, Garraway LA, van Allen EM.The impact of tumor profiling approaches and genomic data strategies for cancer precision medicine. Genome Med.2016;8(1):79. https://doi.org/10.1186/s13073-016-0333-9.
24. Kuderer NM, Burton KA, Blau S, Rose AL, Parker S, Lyman GH, Blau CA. Comparison of 2 commercially available next-generation sequencing platforms in oncology. JAMA Oncol. 2017;3(7):996–8. https://doi.org/10.1001/jamaoncol.2016.4983.
25. Garcia EP, Minkovsky A, Jia Y, Ducar MD, Shivdasani P, Gong X, Ligon AH, Sholl LM, Kuo FC, MacConaill LE, Lindeman NI,Dong F. Validation of OncoPanel: a targeted next-generation sequencing assay for the detection of somatic variants incancer. Arch Pathol Lab Med. 2017;141(6):751–8. https://doi.org/10.5858/arpa.2016-0527-OA.
26. Jones WD. SEQC2 Oncopanel sequencing working group. A verified genomic reference sample for assessingperformance of cancer panels detecting small variants of low allele frequency. Genome Biol. https://doi.org/10.1186/s13059-021-02316-z.
Gong et al. Genome Biology (2021) 22:109 Page 22 of 23

27. MAQC Consortium. The MicroArray quality control (MAQC) project shows inter- and intraplatform reproducibility ofgene expression measurements. Nat Biotechnol. 2006;24(9):1151–61. https://doi.org/10.1038/nbt1239.
28. SEQC/MAQC-III Consortium. A comprehensive assessment of RNA-seq accuracy, reproducibility and information contentby the sequencing quality control consortium. Nat Biotechnol. 2014;32(9):903–14. https://doi.org/10.1038/nbt.2957.
29. MAQC Consortium, Shi L, Campbell G, Jones WD, Campagne F, Wen Z, et al. The MicroArray Quality Control (MAQC)-IIstudy of common practices for the development and validation of microarray-based predictive models. Nat Biotechnol.2010;28(8):827–38. https://doi.org/10.1038/nbt.1665.
30. Shi L, Perkins RG, Fang H, Tong W. Reproducible and reliable microarray results through quality control: good laboratoryproficiency and appropriate data analysis practices are essential. Curr Opin Biotechnol. 2008;19(1):10–8. https://doi.org/10.1016/j.copbio.2007.11.003.
31. Xiao W, SEQC2 Somatic Mutation Working Group. Achieving reproducibility and accuracy in cancer mutation detectionwith whole-genome and whole-exome sequencing. bioRxiv. 2019. https://doi.org/10.1101/626440. Accessed 24 Feb2020.
32. Fang LT, SEQC2 Somatic Mutation Working Group. Establishing reference samples for detection of somatic mutationsand germline variants with NGS technologies. bioRxiv. 2019. https://doi.org/10.1101/625624. Accessed 24 Feb 2020.
33. Sha D, Jin Z, Budczies J, Kluck K, Stenzinger A, Sinicrope FA. Tumor mutational burden as a predictive biomarker in solidtumors. Cancer Discov. 2020;10(12):1808–25. https://doi.org/10.1158/2159-8290.CD-20-0522.
34. Novoradovskaya N, Whitfield ML, Basehore LS, Novoradovsky A, Pesich R, Usary J, Karaca M, Wong WK, Aprelikova O,Fero M, Perou CM, Botstein D, Braman J. Universal reference RNA as a standard for microarray experiments. BMCGenomics. 2004;5(1):20. https://doi.org/10.1186/1471-2164-5-20.
35. Thermo Scientific. AcroMetrix Oncology Hotspot Control Package Insert. https://www.thermofisher.com/document-connect/document-connect.html?url=https%3A%2F%2Fassets.thermofisher.com%2FTFS-Assets%2FCDD%2Fmanuals%2FMAN0010820-AMX-Oncology-Hotspot-Ctrl-EN.pdf&title=QWNyb01ldHJpeCBPbmNvbG9neSBIb3RzcG90IENvbnRyb2wgUGFja2FnZSBJbnNlcnQgW0VOXQ==. Accessed 24 Apr 2019.
36. Ellrott K, Bailey MH, Saksena G, Covington KR, Kandoth C, Stewart C, et al. Scalable open science approach for mutationcalling of tumor exomes using multiple genomic pipelines. Cell Syst. 2018;6(3):271–81.e7. https://doi.org/10.1016/j.cels.2018.03.002.
37. Campbell PJ, Getz G, Korbel JO, Stuart JM, Jennings JL, Stein LD, et al. Pan-cancer analysis of whole genomes. Nature.2020;578(7793):82–93. https://doi.org/10.1038/s41586-020-1969-6.
38. Sims D, Sudbery I, Ilott NE, Heger A, Ponting CP. Sequencing depth and coverage: key considerations in genomicanalyses. Nat Rev Genet. 2014;15(2):121–32. https://doi.org/10.1038/nrg3642.
39. Zhang Y, SEQC2 Oncopanel Sequencing Working Group. Deep oncopanel sequencing reveals fixation time- and withinblock position-dependent quality degradation in FFPE processed samples. bioRxiv. 2021. https://doi.org/10.1101/2021.04.06.438687. Accessed 8 Apr 2021.
40. Willey JC, Morrison T, Austermiller B, Crawford EL, Craig DJ, Blomquist TM, et al. Advancing quality-control for NGSmeasurement of actionable mutations in circulating tumor DNA. bioRxiv. 2021. https://doi.org/10.1101/2021.04.06.438497. Accessed 8 Apr 2021.
41. Allgäuer M, Budczies J, Christopoulos P, Endris V, Lier A, Rempel E, Volckmar AL, Kirchner M, von Winterfeld M,Leichsenring J, Neumann O, Fröhling S, Penzel R, Thomas M, Schirmacher P, Stenzinger A. Implementing tumormutational burden (TMB) analysis in routine diagnostics—a primer for molecular pathologists and clinicians. Transl LungCancer Res. 2018;7(6):703-715–715–15. https://doi.org/10.21037/tlcr.2018.08.14.
42. Buchhalter I, Rempel E, Endris V, Allgäuer M, Neumann O, Volckmar A-L, Kirchner M, Leichsenring J, Lier A, vonWinterfeld M, Penzel R, Christopoulos P, Thomas M, Fröhling S, Schirmacher P, Budczies J, Stenzinger A. Size matters:dissecting key parameters for panel-based tumor mutational burden analysis. Int J Cancer. 2019;144(4):848–58. https://doi.org/10.1002/ijc.31878.
43. Budczies J, Allgäuer M, Litchfield K, Rempel E, Christopoulos P, Kazdal D, Endris V, Thomas M, Fröhling S, Peters S,Swanton C, Schirmacher P, Stenzinger A. Optimizing panel-based tumor mutational burden (TMB) measurement. AnnOncol. 2019;30(9):1496–506. https://doi.org/10.1093/annonc/mdz205.
44. Gong B, Xu J. SEQC2 Onco-panel Sequencing Working Group - PanCancer panel Study. BioProject PRJNA677997. NCBI.2021. https://www.ncbi.nlm.nih.gov/bioproject/PRJNA677997. Accessed 26 Feb 2021.
45. Gong B, Xu J. SEQC2 Onco-panel Sequencing Working Group - PanCancer panel Study. figshare. 2021. https://figshare.com/projects/SEQC2_Onco-panel_Sequencing_Working_Group_-_PanCancer_panel_Study/94520. Accessed 25 Feb2021.
Publisher’s NoteSpringer Nature remains neutral with regard to jurisdictional claims in published maps and institutional affiliations.
Gong et al. Genome Biology (2021) 22:109 Page 23 of 23