crosstown boulevard noise analysis technical report€¦ · crosstown boulevard noise analysis...
TRANSCRIPT

Crosstown BoulevardNoise Analysis Technical ReportOklahoma City, Oklahoma
Prepared For:
Oklahoma Department of Transportation
Prepared By:
May 2014
Crosstown Boulevard
Noise Analysis Technical Report
i
Table of Contents Summary of Findings............................................................................................................... 1
1.0 Introduction ................................................................................................................... 3
2.0 Analysis Methodology .................................................................................................. 5
2.1 Federal Regulations ............................................................................................. 6
2.2 State Regulations .................................................................................................. 6
2.3 Analysis Procedure .............................................................................................. 6
2.3.1 Noise Measurement Procedure .............................................................. 7
2.3.2 Noise Modeling Procedure ..................................................................... 7
3.0 Existing Conditions ..................................................................................................... 11
4.0 Existing Noise Environment....................................................................................... 14
5.0 Future Noise Environment ......................................................................................... 15
5.1 Alternative A ...................................................................................................... 15
5.2 Alternative B ....................................................................................................... 16
5.3 Alternative C ...................................................................................................... 16
5.4 Alternative D ...................................................................................................... 17
6.0 Traffic Noise Impact .................................................................................................... 19
7.0 Consideration of Abatement ...................................................................................... 20
8.0 Construction Noise ..................................................................................................... 22
9.0 Statement to Local Officials ........................................................................................ 23
10.0 References .................................................................................................................... 24
List of Tables Table 1. FHWA Noise Abatement Criteria – Hourly Weighted Sound Level .................... 5
Table 2. Comparison of Measured to Modeled Sound Levels in the TNM® Model ........... 8
Table 3. Existing Peak Noise Hour Level ............................................................................ 14
Table 4. No-Build (Alternative A) Peak Noise Hour Level ................................................ 15
Table 5. Alternative B Peak Noise Hour Level ..................................................................... 16
Table 6. Alternative C Peak Noise Hour Level ................................................................... 17
Table 7. Alternative D Peak Noise Hour Level ................................................................... 18
List of Figures Figure 1. Noise Measurement Locations ............................................................................. 13
List of Appendices Appendix A ADT Traffic Sheets

Crosstown Boulevard Noise Analysis Technical Report
1
Summary of Findings
The purpose of this noise analysis is to assess traffic noise and its potential impact on noise-sensitive land uses near the Crosstown Boulevard study area in Oklahoma City, Oklahoma. The traffic noise study was conducted in accordance with the Oklahoma Department of Transportation (ODOT) Policy Directive “Highway Noise Abatement” C-201-3 (ODOT Noise Policy) (ODOT 2011) that follows Federal Highway Administration (FHWA) regulations as defined by 23 Code of Federal Regulations (CFR) 772 “Procedures for the Abatement of Highway Traffic Noise,” (FHWA 2010). The regulations contain noise impact criteria that establish noise exposure limits for various land use activity categories to assess noise impacts of proposed roadway improvements under the future design year worst-case traffic conditions. The noise impact assessment was primarily considered at exterior areas of frequent human use. Land uses within the study area consist of industrial and office (Activity Categories E and F) land uses with no exterior areas of frequent human use. In the noise analysis area, 13 sites were classified as either Activity Category B or C. No areas were classified as Activity Category A or D. Noise measurements were conducted at 15 representative monitoring locations identified in the study area. Short-term measurements of 15 minutes duration were collected at 15 receptor sites. All the sites represent Activity Category B or C land uses except Site 4, which is Activity Category E, and Site 13, which is open space or Activity Category G. Only Sites 4 through 15 were carried forward and analyzed for future noise impact. Site 1, 2, and 3 were outside the project limits to the west. Traffic counts were recorded simultaneously during each noise measurement at all the short-term monitoring sites. The noise measurements and traffic counts were used to validate the Traffic Noise Model 2.5 (TNM® 2.5) for its accuracy to reliably estimate noise levels at each of the 12 representative sites where traffic noise impacts were analyzed within the study area. Noise levels were predicted using 10 percent of the Average Daily Traffic (ADT) for 2015 and 2040 to represent the peak-noise hour. The peak-noise hour occurs when the highest traffic volumes are able to travel at the posted speed limit. Build Alternatives Findings For Alternatives A, B, C, and D, Sites 7 and 8 have noise levels that approach, meet, or exceed the Noise Abatement Criteria (NAC). Alternative C also raises the noise levels at Site 8A to approach, meet or exceed the NAC. Sites 4, 5, 6, 9, 10, 11, 12, 13, 14, and 15 have no noise impacts.

Crosstown Boulevard
Noise Analysis Technical Report
2
Noise Abatement Criteria and Findings
The noise modeling identified three sites with noise impacts (Sites 7, 8 and 8A). Noise
walls were only considered at the three sites where noise levels were affected by the
project. ODOT noise policy states that noise mitigation must be considered for any
receivers where there is a noise impact. However, only noise abatement measures that
are determined feasible and reasonable will be recommended. Noise abatement in the
form of noise walls was modeled for the three sites where there was a noise impact, as
described below.
For Alternatives A, B and C, at Site 7, a noise wall was modeled along the right-of-way.
It was determined that a 14-foot-tall, 399-foot-long noise wall would achieve a noise
reduction goal of at least 7 A-weighted decibels (dBA), which is considered feasible.
However, because the estimated cost of the wall is $139,755, the wall is deemed not
reasonable since Site 7 only represents one receptor and the cost of the wall would be
above the cost/benefit ratio of $30,000 per benefitted receptor.
For Alternative D, at Site 7, a noise wall was modeled along the right-of-way. It was
determined that a 10-foot-tall, 399-foot-long noise wall would achieve a noise reduction
goal of at least 7 A-weighted decibels (dBA), which is considered feasible. However,
because the estimated cost of the wall is $99,750, the wall is deemed not reasonable since
Site 7 only represents one receptor and the cost of the wall would be above the
cost/benefit ratio of $30,000 per benefitted receptor.
For Alternatives A and B, at Site 8, a noise wall was modeled along the existing fence
line and right-of-way. It was determined that a 14-foot-tall, 533-foot-long wall would
achieve a noise reduction goal of at least 7 dBA, which is considered feasible. Site 8A
was added as a benefitted receptor since the wall provided a 5 dBA reduction.
However, because the estimated cost of the wall is $186,707, the wall is deemed not
reasonable since Site 8 and 8A only represents two receptor and the cost of the wall
would be above the cost/benefit ratio of $30,000 per benefitted receptor.
For Alternative C, at Site 8 and 8A, a noise wall was modeled along the existing fence
line and right-of-way. It was determined that an 8-foot-tall, 533-foot-long noise wall
would achieve a noise reduction goal of at least 7 dBA, which is considered feasible. Site
8A was added as a benefitted receptor since the wall provided a 5 dBA reduction.
However, because the estimated cost of the wall is $106,609, the wall is deemed not
reasonable since Site 8 and 8A only represents two receptor and the cost of the wall
would be above the cost/benefit ratio of $30,000 per benefitted receptor.
For Alternative D, at Site 8, a noise wall was modeled along the existing fence line for all
four alternatives. It was determined that a noise wall did not meet feasibility criteria
because it did not provide 7dBA reduction.

Crosstown Boulevard
Noise Analysis Technical Report
3
1.0 Introduction
Noise, defined as unwanted or excessive sound, is an undesirable byproduct of modern
life. Noise criteria have been established to help protect the public health and safety and
prevent disruption of certain human activities. The criteria are based on known impacts of
noise on people, such as interference with speech or sleep, physiological responses,
hearing loss, and annoyance.
Highway traffic is a major contributor of noise and is considered to be a line source of
energy from which energy levels dissipate vertically and laterally from the roadway.
Traffic noise is not constant. It varies as each vehicle passes a point. The time-varying
characteristics of environmental noise are analyzed statistically to determine the duration
and intensity of noise exposure.
In an urban environment, noise is comprised of two distinct parts. One is ambient or
existing background noise. Wind, other natural noise, distant traffic, and other human
noise make up the acoustical environment surrounding the project. This background
sound level varies throughout the day and is generally lowest at night and highest during
the day. The other component of urban noise is intermittent and louder than background
noise. Transportation noise and local industrial noise are examples of this type of noise. It
is for these reasons that environmental noise is analyzed statistically.
Sound from highway traffic is generated primarily from a vehicle’s tires, engine, and
exhaust. This sound is commonly measured in decibels (dB) that are logarithmic units and
do not add arithmetically like the more common linear units, such as degrees used to
quantify temperature. Sound pressure levels from two equal sources add 3 dB to the
sound pressure level of just one source. For example, two trucks producing 90 dB each
combine to produce 93 dB, not 180 dB. In other words, a doubling of the noise sources
produces only a 3-dB increase in the sound pressure level. Studies have shown that this
increase is slightly perceptible by the human ear.
Sound is composed of many frequencies measured in Hertz (Hz). The healthy, young
adult ear generally responds to sound in the range of 20 to 20,000 Hz. For highway traffic
noise, because humans are not equally sensitive to all frequencies, noise is adjusted or
weighted using an A-weighted scale. The A-weighting scale is widely used in
environmental analysis because is closely resembles the nonlinearity of human hearing.
The unit of A-weighted noise is dBA. Because highway traffic sounds fluctuate over time,
an equivalent sound level is used to represent a single number to describe varying traffic
sound levels. The term Leq(h) refers to the steady-state sound level that is stated period of
time contains the same acoustic energy as the time varying sound level during the same
period. All traffic noise levels in this analysis will be expressed in dBA Leq(h).
Crosstown Boulevard
Noise Analysis Technical Report
4
The purpose of this Noise Analysis Technical Report is to assess traffic noise and its
potential impact on noise-sensitive land uses in the study area. The traffic noise study was
conducted in accordance with the ODOT Noise Policy (ODOT 2011) that follows FHWA
regulations as defined by 23 CFR 772 (FHWA 2010).
This Noise Analysis Technical Report was developed to support the analysis completed
for the Environmental Assessment for the Crosstown Boulevard. The Environmental
Assessment will include a summary of this technical report, which will be attached to the
document when it is developed.

Crosstown Boulevard
Noise Analysis Technical Report
5
2.0 Analysis Methodology
2.1 Federal Regulations
FHWA’s “Procedures for Abatement of Highway Traffic Noise” (FHWA 2010) states that a
noise impact occurs when the predicted traffic noise levels for a project approach or
exceed the NAC for the land use activity categories shown in Table 1 or there is a
substantial increase in the noise level. FHWA does not define a “substantial” noise
increase. Each state’s noise policy is required to define what levels are considered
“approaching” the NAC, and what levels are considered a “substantial” increase.
Table 1. FHWA Noise Abatement Criteria—Hourly Weighted Sound Level
Activity
Category
Leq(h)
dBA
Evaluation
Locations Description of Activity Category
A 57 Exterior
Lands on which serenity and quiet are of extraordinary
significance and serve an important public need and where
the preservation of those qualities is essential if the area is to
continue to serve its intended purpose
B1 67 Exterior Residential
C1 67 Exterior
Active sport areas, amphitheaters, auditoriums,
campgrounds, cemeteries, day care centers, hospitals,
libraries, medical facilities, parks, picnic areas, places of
worship, playgrounds, public meeting rooms, public or
nonprofit institutional structures, radio studios, recording
studios, recreation areas, Section 4(f) sites, schools, television
studios, trails and trail crossings
D 52 Interior
Auditoriums, day care centers, hospitals, libraries, medical
facilities, places of worship, public meeting rooms, public or
nonprofit institutional structures, radio studios, recording
studios, schools, and television studios
E1 72 Exterior Hotels, motels, offices, restaurants/bars, and other developed
lands, properties or activities not included in A-D or F
F - -
Agriculture, airports, bus yards, emergency services,
industrial, logging, maintenance facilities, manufacturing,
mining, rail yards, retail facilities, shipyards, utilities (water
resources, water treatment, electrical), and warehousing
G - - Undeveloped lands that are not permitted
1 Includes undeveloped lands permitted for this activity category.
Leq(h) = hourly equivalent sound level

Crosstown Boulevard
Noise Analysis Technical Report
6
2.2 State Regulations
ODOT’s Noise Policy (ODOT 2011) establishes the requirements for traffic noise analysis
for all Type I projects whether they are federally funded or state-only funded. Type I
projects are defined as a project for the construction of a highway at a new location or the
physical alteration of an existing highway that significantly changes either the horizontal
or vertical alignment or increases the number of through traffic lanes. The ODOT Noise
Policy uses the same land use categories established in the FHWA NAC and has defined a
traffic noise impact as follows:
Design year (typically 20 years into the future) traffic noise levels are predicted to
approach by 1 dB, meet, or exceed any of the FHWA NAC (Table 1), or
Predicted traffic noise levels for the design year substantially exceed existing noise by
15 dBA or more.
2.3 Analysis Procedure
The procedures used in the analyses contained in this report are consistent with
requirements and guidance provided in 23 CFR 772 and the ODOT Noise Policy. The
following is a summary of the steps taken to determine whether implementation of the
proposed project would result in traffic noise impacts:
Identify receiver locations in the project area that could be exposed to traffic noise
impacts.
Measure existing sound levels at locations in potentially affected residential areas. If
the source of noise is a highway facility, contemporaneously count traffic and
document traffic speed. Note existing environmental conditions and other dominant
or intrusive noise sources.
Digitize geometric features, including roadway lanes, receiver locations, and existing
terrain, into a three-dimensional, scaled reference coordinate system for both existing
and future project conditions.
Calibrate the traffic noise model (TNM® 2.5) using the measured sound level data,
actual traffic counts/speeds, and digitized geometric features for existing conditions.
Predict traffic noise levels using worst noise-hour traffic volumes under existing and
design-year conditions inputted into the calibrated traffic noise model (TNM® 2.5).
Determine whether traffic noise impacts would occur based on the traffic noise
modeling results for existing and design-year conditions. Where traffic noise impacts
were identified, a preliminary noise abatement design was evaluated.

Crosstown Boulevard
Noise Analysis Technical Report
7
2.3.1 Noise Measurement Procedure
Several noise-sensitive receivers in the study area were examined for future traffic noise
impacts. It was not reasonable to examine impacts for all receiver locations. Therefore, as
representative receivers, the first row of existing residential land uses located along the
right-of-way were selected because they are expected to receive the highest future noise
levels over the period covered by the analysis. Noise level measurements were conducted
using the following equipment:
Brüel and Kjær 2238 integrating sound level meter (SLM) with microphone model
4188: This is a Type 1, precision instrument that meets or exceeds the requirements for
measurement equipment used in highway impact analysis. Calibration of meter and
microphone was checked and certified on December 23, 2013, by Odin Metrology
which issued certificates numbered: 20443-15 and 20443-16.
Larson Davis Cal 200 calibrator: Calibration was certified on December 24, 2013, by
Odin Metrology, certificate number 20443-17. It was used to field-verify the laboratory
calibration of the measurement instruments before and after each measurement
period. All pre- and post-field measurement calibration verification levels were at 94.0
dB, the nominal output level of the Cal 200. The SLM response was verified with the
calibrator before and after, as well as several times during, the monitoring surveys.
Kestrel 3000 pocket weather meter: This instrument was used to collect temperature,
wind speed, wind direction, and relative humidity at each measurement location.
Traffic noise measurements were performed using the windscreen-equipped SLM
mounted on a tripod 5 feet above the local ground and at least 10 feet from any reflecting
surfaces, such as buildings, walls, or parked vehicles. Noise measurements were paused to
avoid noise contamination, such as from barking dogs, lawn mowers, and aircraft
overflights.
Traffic was simultaneously counted and vehicle speed was measured as part of the noise
survey. Three vehicle classifications were counted: automobiles, medium trucks, and
heavy trucks. A medium truck is defined as having six wheels on two axles and is
designed for the transportation of cargo. Generally, the gross vehicle weight is more than
10,000 pounds but less than 26,000 pounds. A heavy truck has three or more axles.
Generally, the gross weight is more than 26,000 pounds.
2.3.2 Noise Modeling Procedure
The existing and future year traffic noise levels were modeled using TNM® 2.5, which was
developed for complex roadway and receiver geometrics, and followed methodology in
the FHWA report, Measurement of Highway-Related Noise (FHWA 1996). TNM® 2.5 is a
computer model that calculates a predicted noise level through a series of adjustments to a
reference sound level. The source levels are calculated using the speed-dependent

Crosstown Boulevard
Noise Analysis Technical Report
8
reference noise emissions levels. TNM® 2.5 uses traffic volume, vehicle mix, vehicle speed,
and roadway geometry to compute the “hourly equivalent noise level.”
TNM® 2.5 was calibrated using the existing roadway/traffic and receiver locations. Traffic
volumes counted during the short-term measurement period were scaled up to one hour
and entered into the model. A summary of the measured and modeled noise levels used
for the model calibration is provided in Table 2. The modeled levels in TNM® 2.5 were
within ±3 dBA of the measured sound levels; therefore, the TNM® 2.5 model is considered
valid for predicting future noise levels.
The TNM® 2.5 was run with the roadway/receiver geometry and site parameters using the
hourly traffic volumes and speeds observed during the noise measurements. Only Sites 4
through 15 were carried forward and analyzed for future noise impact. Sites 1, 2, and 3
were outside the project limits to the west. Sites 14 and 15 are analyzed, but there are no
roadways near these sites currently, so sites 14 and 15 were not used to valid the TNM
model and are not included in Table 2.
Table 2. Comparison of Measured to Modeled Sound Levels in the TNM® 2.5 Model
Measurement Site Activity
Category
Measured Sound
Level dBA
Modeled
Sound
Level dBA
Measured minus
Predicted dBA
4 E 58.5 56.1 2.4
5 C 59.4 58.3 1.1 6 B 59.4 57.7 1.7 7 B 57.4 58.4 -1.0 8 C 63.6 61 2.6 9 C 57.4 55.9 1.5
10 B 59.3 58.9 0.6 11 C 59.2 56.9 2.3 12 C 58.3 58.9 -0.6 13 G 59.3 57.1 2.2
dBA = A-weighted decibel
The TNM® 2.5 was run using the same roadway/receiver geometry and traffic volumes
and speeds associated with the peak-noise-hour traffic volumes (i.e., 10 percent of the
ADT on each roadway). The 2015 ADT was used to model existing peak-noise-hour levels;
the 2040 ADT was used to predict the peak-noise-hour levels for Alternatives A, B, C, and
D. The traffic sheets with ADT volumes are provided in Appendix A.

Crosstown Boulevard
Noise Analysis Technical Report
11
3.0 Existing Conditions
Land use along the Crosstown Boulevard consists primarily of industrial and office
(Activity Categories E and F) land uses with no exterior areas of frequent human use. In
the entire project area only eight sites were classified as either Activity Category B or C.
No sites were classified as Activity Category A or D.
Traffic noise is due primarily to local street traffic (two-to-four-lane streets). Currently,
no street exists in the location proposed for Alternatives A, B, and C. Figure 1 shows the
location of the noise measurement and modeling sites listed below:
Site 4—Southwest corner of California Street and Blackwelder Avenue; the area
is an industrial and office space. Currently, the site is an empty lot just south of
the existing connection between Western Avenue and the I-40 right-of-way. The
measurement was conducted on January 7, 2014, from 10:00 to 10:15 a.m. and an
Leq of 58.5 dBA was recorded. This site is listed as a NAC Activity Category E.
Site 5—Totom Park, south of Reno Avenue between Mckinley Avenue and
Douglas Avenue. The measurement was conducted on January 7, 2014, from
10:40 to 10:55 a.m. and an Leq of 59.4 dBA was recorded. This site is listed as a
NAC Activity Category C.
Site 6—1335 West Sheridan Avenue, a two-story residential housing unit. The
site is the only occupied residential building in the area. The measurement was
conducted on January 7, 2014, from 11:30 to 11:40 a.m. and an Leq of 59.4 dBA
was recorded. This site is listed as a NAC Activity Category B.
Site 7—Single-family home on North Barauer Avenue between Sheridan Avenue
and the Crosstown Boulevard. This is the only residential land use in the area,
the rest of the area is either vacant or industrial land use. The home may no
longer be occupied. The measurement was conducted on January 7, 2014, from
11:10 to 11:25 a.m. and an Leq of 57.4 dBA was recorded. This site is listed as a
NAC Activity Category B.
Site 8—800 West California Avenue, City Rescue Mission, corner of Reno Avenue
and Classen Avenue. The measurement location was near the play area on Reno
Avenue. The measurement was conducted on January 7, 2014, from 12:50 to 1:05
p.m. and an Leq of 63.6 dBA was recorded. This site is listed as a NAC Activity
Category C.
Site 9—517 Southwest 2nd Street, Halfway House, corner of 2nd Street and
Dewey Avenue. The measurement location was near the play area on Dewey
Avenue. The measurement was conducted on January 7, 2014, from 1:20 to 1:35

Crosstown Boulevard
Noise Analysis Technical Report
12
p.m. and an Leq of 57.4 dBA was recorded. This site is listed as a NAC Activity
Category C.
Site 10—622 4th Street, single-family residences. The site is in the backyard of a
residence on the corner of 4th Street and Lee Avenue. The area is a mix of several
single-family residences and industrial land uses. The measurement was
conducted on January 7, 2014, from 1:40 to 1:55 p.m. and an Leq of 59.3 dBA was
recorded. This site is listed as a NAC Activity Category B.
Site 11—3rd Street between Hudson Street and Harvey Street, future city park.
The land use in the area is currently open space and parking lots. The
measurement was conducted on January 7, 2014, from 2:05 to 2:20 p.m. and an
Leq of 59.2 dBA was recorded. This site is listed as a NAC Activity Category C.
Site 12—Myriad Botanical Garden. Land use in the area is the Botanical Garden
and office spaces and parking lots. The measurement was conducted
approximately 100 feet from Reno Avenue between Harvey Avenue and Hudson
Avenue on January 8, 2014, from 10:10 to 10:25 a.m. and an Leq of 58.3 dBA was
recorded. This site is listed as a NAC Activity Category C.
Site 13—Open space between 3rd and 4th Streets to the north and south, and
Broadway and Robinson Avenues to the east and west. Land use in the area is
the Chesapeake Energy Arena and office spaces and parking lots. The
measurement was conducted on January 8, 2014, from 2:30 to 2:45 p.m. and an
Leq of 59.3 dBA was recorded. This site is listed as a NAC Activity Category G.
Site 14—Walking trail area of the Centennial Land Run Monument along the
Bricktown Riverwalk (north of the proposed project). Land use in the area is
park. The measurement was conducted on January 7, 2014, from 3:30 to 3:45 p.m.
and an Leq of 62.2 dBA was recorded. This site is listed as a NAC Activity
Category C.
Site 15—Walking trail area of the Centennial Land Run Monument along the
Bricktown Riverwalk (south of the proposed project). Land use in the area is
park. The measurement was conducted on January 7, 2014, from 3:05 to 3:20 p.m.
and an Leq of 64.6 dBA was recorded. This site is listed as a NAC Activity
Category C.

Crosstown Boulevard
Noise Analysis Technical Report
13
Figure 1. Noise Measurement Locations

Crosstown Boulevard
Noise Analysis Technical Report
14
4.0 Existing Noise Environment
Existing peak-hour noise levels were calculated at the 10 sites using the TNM® 2.5 model
that was validated using the field measurements listed in Table 2. The traffic volumes
used 10 percent of the 2015 ADT, as shown in Appendix A.
The existing peak-noise-hour levels are listed in Table 3. Four of the 13 sites—7, 8, 11,
and 12—are above the NAC, which is expected because all are on busy local streets in an
urban environment. Site 13 is currently not designated for any land uses and is being
treated as open space. Thus, this area is classified as Activity Category G.
Table 3. Existing Peak-Noise-Hour Level
Receptor Description Activity Category NAC Level
dBA
Existing Peak-Noise-Hour Level
(Leq dBA)
Site 4 Empty commercial
lot E 71 64.9
Site 5 Park C 66 62.6 Site 6 Multi-residential B 66 64.8
Site 7 Single-family
residential B 66 70.5
Site 8 City Rescue
Mission C 66 66.7
Site 8A* City Rescue Mission-2
C 66 65.4
Site 9 Halfway house C 66 63.4
Site 10 Single-family
residential B 66 61.2
Site 11 Park C 66 65.0 Site 12 Park C 66 65.9 Site 13 Open space G NA 66.4 Site 14 Trail/park C 66 62.2 Site 15 Trail/park C 66 64.6
dBA = A-weighted decibel; Leq = equivalent sound level; NAC = Noise Abatement Criteria; * = Modeling Site

Crosstown Boulevard
Noise Analysis Technical Report
15
5.0 Future Noise Environment
Future peak-noise-hour levels were predicted at the 13 sites for Alternatives A, B, C, and
D. The traffic volumes used 10 percent of the 2040 ADT, as shown in Appendix A.
5.1 Alternative A
Between 2015 and 2040, with no changes to the roadway system, the ADT was assumed
to grow by 1 percent. Table 4 shows the predicated 2040 peak-noise-hour levels and the
increase from 2015 peak-noise-hour levels for the 13 measurement sites. Noise levels are
predicted to increase in the range of -0.8 to 2.8 dBA. Site 7 and 8 exceeds the NAC
category B and C.
Table 4. Alternative A Peak-Noise-Hour Level
Receptor Description
2015Existing
Peak-Noise-
Hour Level
(Leq dBA)
2040 Peak-
Noise Hour-
Level
(Leq dBA)
Change in
Peak-Noise-
Hour Level
(dBA)
Impact
Type
Site 4 Empty
commercial lot 64.9 65.8 0.9 None
Site 5 Park 62.6 64.3 1.7 None
Site 6 Multi-
residential 64.8 65.3 0.5 None
Site 7 Single-family
residential 70.5 71.1 0.6
Exceeds NAC B
Site 8 City Rescue
Mission 66.7 68.5 1.8
Exceeds NAC C
Site 8A* City Rescue Mission-2
65.4 65.1 - 0.3 None
Site 9 Halfway house 63.4 64.6 1.8 None
Site 10 Single-family
residential 61.2 61.1 - 0.1 None
Site 11 Park 65.0 65.4 0.4 None Site 12 Park 65.9 65.6 - 0.3 None Site 13 Open space 66.4 67.2 0.8 None Site 14 Trail/park 62.2 65.0 2.8 None Site 15 Trail/park 64.6 63.8 - 0.8 None

Crosstown Boulevard
Noise Analysis Technical Report
16
5.2 Alternative B
Table 5 shows the predicted 2040 peak-noise-hour levels for Alternative B and the
increase from 2015 peak-noise-hour levels for the 13 measurement sites. Noise levels are
predicted to increase in the range of -0.8 to 2.8 dBA. Site 7 and 8 exceeds the NAC
category B and C.
Table 5. Alternative B Peak-Noise-Hour Level
Receptor Description
2015Existing
Peak-Noise-
Hour Level
(Leq dBA)
2040 Peak-
Noise
Hour-Level
(Leq dBA)
Change in Peak-
Noise-Hour
Level (dBA)
Impact
Type
Site 4 Empty
commercial lot
64.9 65.6 0.7 None
Site 5 Park 62.6 63.9 1.3 None
Site 6 Multi-
residential 64.8 65.3 0.5 None
Site 7 Single-family
residential 70.5 71.1 1.1
Exceeds NAC B
Site 8 City Rescue
Mission 66.7 68.8 2.1
Exceeds NAC C
Site 8A* City Rescue Mission-2
65.4 65.3 - 0.1 None
Site 9 Halfway
house 63.4 64.0 0.6 None
Site 10 Single-family
residential 61.2 61.2 0 None
Site 11 Park 65.0 65.7 0.7 None Site 12 Park 65.9 65.7 - 0.2 None Site 13 Open space 66.4 67.0 0.6 None Site 14 Trail/park 62.2 65.0 2.8 None Site 15 Trail/park 64.6 63.8 - 0.8 None
* = Modeling Site
5.3 Alternative C
Table 6 shows the predicted 2040 peak-noise-hour levels for Alternative C and the
increase from 2015 peak-noise-hour levels for the 13 measurement sites. Noise levels are
predicted to increase in the range of -0.8 to 4.7 dBA. Site 7, 8 and 8A exceeds the NAC
category B and C.

Crosstown Boulevard
Noise Analysis Technical Report
17
Table 6. Alternative C Peak-Noise-Hour Level
Receptor Description
2015 Existing
Peak-Noise-
Hour Level (Leq dBA)
2040 Peak-Noise
Hour- Level (Leq dBA)
Change in Peak-Noise-Hour Level
(dBA)
Impact Type
Site 4 Empty
commercial lot 64.9 65.7 0.8
None
Site 5 Park 62.6 63.9 1.3 None
Site 6 Multi-
residential 64.8 64.5 - 0.3
None
Site 7 Single-family
residential 70.5 70.3 - 0.2
Exceeds NAC B
Site 8 City Rescue
Mission 66.7 71.4 4.7
Exceeds NAC C
Site 8A* City Rescue Mission-2
65.4 68.5 3.1 Exceeds NAC C
Site 9 Halfway house 63.4 65.3 1.9 None
Site 10 Single-family
residential 61.2 61.9 0.7
None
Site 11 Park 65.0 65.8 0.8 None Site 12 Park 65.9 65.8 - 0.1 None Site 13 Open space 66.4 67.0 0.6 None Site 14 Trail/park 62.2 65.0 2.8 None Site 15 Trail/park 64.6 63.8 - 0.8 None
* = Modeling Site
5.4 Alternative D
Table 7 shows the predicted 2040 peak-noise-hour levels for Alternative D and the
increase from 2015 peak-noise-hour levels for the 13 measurement sites. Noise levels are
predicted to increase in the range of -0.8 to 0.2 dBA. Site 7 and 8 exceeds the NAC
category B and C.

Crosstown Boulevard
Noise Analysis Technical Report
18
Table 7. Alternative D Peak-Noise-Hour Level
Receptor Description 2015 Existing Peak-Noise-Hour Level (Leq dBA)
2040 Peak-Noise Hour
Level (Leq dBA)
Change in Peak-Noise-Hour Level
(dBA)
Impact Type
Site 4 Empty
commercial lot
64.9 64.9 0.0 None
Site 5 Park 62.6 62.7 0.1 None
Site 6 Multi-
residential 64.8 64.1 - 0.7
None
Site 7 Single-family
residential 70.5 69.7 - 0.8
Exceeds NAC B
Site 8 City Rescue
Mission 66.7 66.9 0.2
Exceeds NAC C
Site 8A* City Rescue Mission-2
65.4 65.6 0.2 None
Site 9 Halfway
house 63.4 63.4 0
None
Site 10 Single-family
residential 61.2 61.2 0
None
Site 11 Park 65.0 65.0 0 None Site 12 Park 65.9 65.9 0 None Site 13 Open space 66.4 66.5 0.1 None Site 14 Trail/park 62.2 62.2 0 None Site 15 Trail/park 64.6 64.6 0 None
* = Modeling Site

Crosstown Boulevard
Noise Analysis Technical Report
19
6.0 Traffic Noise Impact
The noise impacts for each build alternative are as follows:
Alternative A—Sites 7 and 8 have noise levels that approach, meet, or exceed the
NAC Activity Categories B and C. Sites 4, 5, 6, 9, 10, 11, 12, 13, 14, and 15 have no
noise impact.
Alternative B— Sites 7 and 8 have noise levels that approach, meet, or exceed the
NAC Activity Categories B and C. Sites 4, 5, 6, 9, 10, 11, 12, 13, 14, and 15 have no
noise impact.
Alternative C— Sites 7, 8 and 8A have noise levels that approach, meet, or exceed
the NAC Activity Categories B and C. Sites 4, 5, 6, 9, 10, 11, 12, 13, 14, and 15 have no
noise impact.
Alternative D— Sites 7 and 8 have noise levels that approach, meet, or exceed the
NAC Activity Categories B and C. Sites 4, 5, 6, 9, 10, 11, 12, 13, 14, and 15 have no
noise impact.

Crosstown Boulevard
Noise Analysis Technical Report
20
7.0 Consideration of Abatement
The noise modeling identified three sites with noise impacts (Sites 7 and 8, and 8A with
Alternative C, as shown in Tables 4-7). Noise walls were only considered at the two sites
where noise levels were affected by the project. ODOT noise policy states that noise
mitigation must be considered for any receivers where there is a noise impact. However,
only noise abatement measures that are determined feasible and reasonable will be
recommended. Noise abatement in the form of noise walls was modeled for the three
sites where there was a noise impact, as described below.
For Alternatives A, B and C, at Site 7, a noise wall was modeled along the right-of-way.
It was determined that a 14-foot-tall, 399-foot-long noise wall would achieve a noise
reduction goal of at least 7 A-weighted decibels (dBA), which is considered feasible.
However, because the estimated cost of the wall is $139,755, the wall is deemed not
reasonable since Site 7 only represents one receptor and the cost of the wall would be
above the cost/benefit ratio of $30,000 per benefitted receptor.
For Alternative D, at Site 7, a noise wall was modeled along the right-of-way. It was
determined that a 10-foot-tall, 399-foot-long noise wall would achieve a noise reduction
goal of at least 7 A-weighted decibels (dBA), which is considered feasible. However,
because the estimated cost of the wall is $99,750, the wall is deemed not reasonable since
Site 7 only represents one receptor and the cost of the wall would be above the
cost/benefit ratio of $30,000 per benefitted receptor.
For Alternatives A and B, at Site 8, a noise wall was modeled along the existing fence
line and right-of-way. It was determined that a 14-foot-tall, 533-foot-long noise wall
would achieve a noise reduction goal of at least 7 dBA, which is considered feasible. Site
8A was added as a benefitted receptor since the wall provided a 5 dBA reduction.
However, because the estimated cost of the wall is $186,707, the wall is deemed not
reasonable since Site 8 and 8A only represents two receptor and the cost of the wall
would be above the cost/benefit ratio of $30,000 per benefitted receptor.
For Alternative C, at Site 8 and 8A, a noise wall was modeled along the existing fence
line and right-of-way. It was determined that an 8-foot-tall, 533-foot-long noise wall
would achieve a noise reduction goal of at least 7 dBA, which is considered feasible. Site
8A was added as a benefitted receptor since the wall provided a 5 dBA reduction.
However, because the estimated cost of the wall is $106,609, the wall is deemed not
reasonable since Site 8 and 8A only represents two receptor and the cost of the wall
would be above the cost/benefit ratio of $30,000 per benefitted receptor.

Crosstown Boulevard
Noise Analysis Technical Report
21
For Alternative D, at Site 8, a noise wall was modeled along the existing fence line and
right-of-way. It was determined that a noise wall did not meet feasibility criteria because
it did not provide 7dBA reduction.

Crosstown Boulevard
Noise Analysis Technical Report
22
8.0 Construction Noise
In general, construction noise related to highway project is not a major issue. Sources of
noise include heavy machinery such as backhoes and scrapers, cranes, pile drivers, and
trucks transporting materials. Typically, construction noise can be minimized by
implementing time-of-day restrictions for construction operations adjacent to noise-
sensitive areas. ODOT is concerned about any special noise-sensitive land uses or
activities that could be affected by construction noise from the Crosstown Boulevard.
Any special measures that are feasible and reasonable will be added to the project plans
and specifications. No special noise-sensitive land uses or activities that could be
affected by construction noise are in proximity to the project.

Crosstown Boulevard
Noise Analysis Technical Report
23
9.0 Statement to Local Officials
Traffic noise approaching and exceeding the sound levels specified in the ODOT Noise
Policy resulting from the Crosstown Boulevard have been identified. For most projects
using the TNM® 2.5 model, and in order to aid in compatible land use planning, the
approximate distance from the centerline of the proposed roadway to the 66 dBA and 71
dBA future noise contour lines is determined and plotted on a map. However, because
this project is located in an urban environment where noise levels from the Crosstown
Boulevard and local existing roadways will combine and will both determine future
noise levels, providing distances from the project center line to the 66 or 71 dBA project
noise contour lines would not provide actual future noise levels. Thus, providing the
distances or plotting these contours would not aid in the planning process and would
likely be misleading. Therefore, they have not been provided herein.

Crosstown Boulevard
Noise Analysis Technical Report
24
10.0 References
Oklahoma Department of Transportation (ODOT). 2011. Policy Directive “Highway
Noise Abatement” C-201-3 (ODOT Noise Policy). July 13, 2011.
Federal Highway Administration (FHWA), Department of Transportation. 1996.
Measurement of Highway-Related Noise. Document number: FHWA-PD-96-046
DOT-VNTSC-FHWA-96-5. May 1996.
Federal Highway Administration (FHWA), Department of Transportation. 2010. Code of
Federal Regulations, Title 23 Part 772, “Procedures for the Abatement of
Highway Traffic Noise,” Document 23 CFR 772. July 2010.

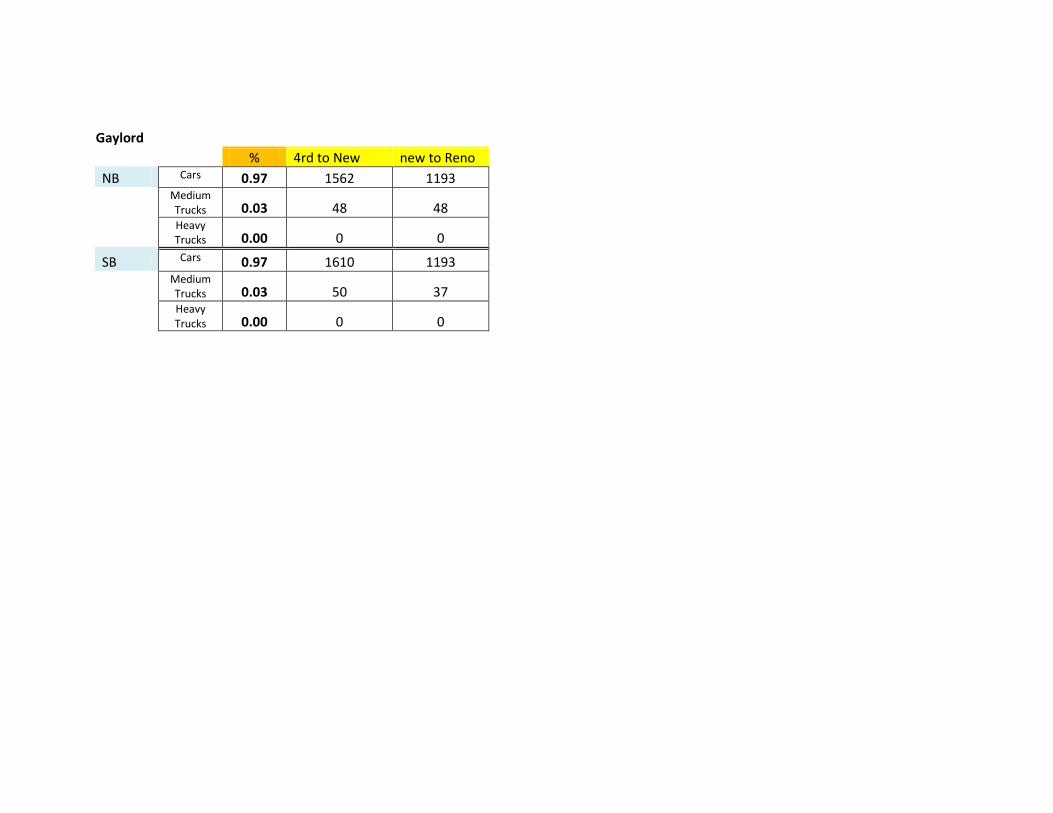
Appendix A: ADT Traffic Sheets

Alternate A - 2040 TNM Traffic
New Boulevard
%
Virginia to Klein Klein to Walker
Walker to Hudson
Hudson to Robinson
Robinson to Gaylord
WB Cars 0.88 1650 1012 1435 893 1452
Medium Trucks 0.10 188 115 163 102 165
Heavy Trucks 0.02 38 23 33 20 33
EB Cars 0.95 1781 1093 1463 1378 1568
Medium Trucks 0.04 75 46 62 58 66
Heavy Trucks 0.01 19 12 15 15 17
Reno
% % Virginia to Klein Klein to Walker Walker to Hudson Hudson to Robinson
Robinson to Gaylord
WB Cars 0.85 0.94 512 675 746 752 831
Medium Trucks 0.12 0.05 72 95 40 40 44
Heavy Trucks 0.03 0.01 16 21 8 8 9
EB Cars 0.89 0.96 532 982 1064 1017 847
Medium Trucks 0.09 0.03 52 96 37 35 29
Heavy Trucks 0.03 0.01 16 30 11 11 9

Western
% to Reno new to sheridan
NB Cars 0.99 1688 1409
Medium Trucks 0.01 17 14
Heavy Trucks 0.00 0 0
SB Cars 0.99 1800 1329
Medium Trucks 0.01 18 13
Heavy Trucks 0.00 0 0
Walker
% 3rd to New new to 2nd 2nd to Reno
NB Cars 0.99 693 1070 1116
Medium Trucks 0.01 7 11 11
Heavy Trucks 0.00 0 0 0
SB Cars 0.99 693 980 1031
Medium Trucks 0.01 7 10 10
Heavy Trucks 0.00 0 0 0
Hudson
% 4rd to New new to 2nd 2nd to Reno
NB Cars 0.99 248 802 804
Medium Trucks 0.01 3 8 8
Heavy Trucks 0.00 0 0 0
SB Cars 0.99 248 892 894
Medium Trucks 0.01 3 9 9
Heavy Trucks 0.00 0 0 0
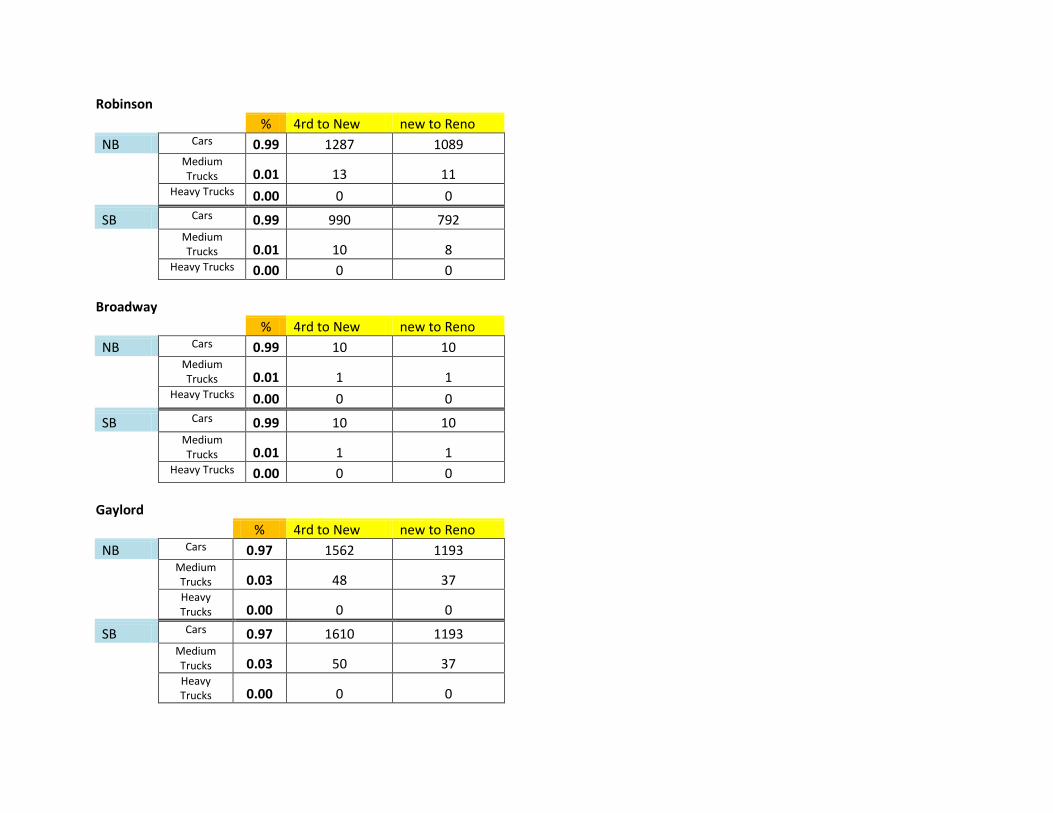
Robinson
% 4rd to New new to Reno
NB Cars 0.99 1287 1089
Medium Trucks 0.01 13 11
Heavy Trucks 0.00 0 0
SB Cars 0.99 990 792
Medium Trucks 0.01 10 8
Heavy Trucks 0.00 0 0
Broadway
% 4rd to New new to Reno
NB Cars 0.99 10 10
Medium Trucks 0.01 1 1
Heavy Trucks 0.00 0 0
SB Cars 0.99 10 10
Medium Trucks 0.01 1 1
Heavy Trucks 0.00 0 0
Gaylord
% 4rd to New new to Reno
NB Cars 0.97 1562 1193
Medium Trucks 0.03 48 37
Heavy Trucks 0.00 0 0
SB Cars 0.97 1610 1193
Medium Trucks 0.03 50 37
Heavy Trucks 0.00 0 0

Alternate B - 2040 TNM Traffic
New Boulevard
%
Virginia to Klein Klein to Walker
Walker to Hudson
Hudson to Robinson
Robinson to Gaylord
WB Cars 0.88 1650 1012 1435 893 1452
Medium Trucks 0.10 188 115 163 102 165
Heavy Trucks 0.02 38 23 33 20 33
EB Cars 0.95 1781 1093 1463 1378 1568
Medium Trucks 0.04 75 46 62 58 66
Heavy Trucks 0.01 19 12 15 15 17
Reno
% % Virginia to Klein Klein to Walker Walker to Hudson
Hudson to Robinson
Robinson to Gaylord
WB Cars 0.85 0.94 512 675 746 752 831
Medium Trucks 0.12 0.05 72 95 40 40 44
Heavy Trucks 0.03 0.01 16 21 8 8 9
EB Cars 0.89 0.96 532 982 1064 1017 847
Medium Trucks 0.09 0.03 52 96 37 35 29
Heavy Trucks 0.03 0.01 16 30 11 11 9

Western
% to Reno new to sheridan
NB Cars 0.99 1688 1409
Medium Trucks 0.01 17 14
Heavy Trucks 0.00 0 0
SB Cars 0.99 1800 1329
Medium Trucks 0.01 18 13
Heavy Trucks 0.00 0 0 Walker
% 3rd to New new to 2nd 2nd to Reno
NB Cars 0.99 693 1070 1116
Medium Trucks 0.01 7 11 11
Heavy Trucks 0.00 0 0 0
SB Cars 0.99 693 980 1031
Medium Trucks 0.01 7 10 10
Heavy Trucks 0.00 0 0 0
Hudson
% 4rd to New new to 2nd 2nd to Reno
NB Cars 0.99 248 802 804
Medium Trucks 0.01 3 8 8
Heavy Trucks 0.00 0 0 0
SB Cars 0.99 248 892 894
Medium Trucks 0.01 3 9 9
Heavy Trucks 0.00 0 0 0

Robinson
% 4rd to New new to Reno
NB Cars 0.99 1287 1089
Medium Trucks 0.01 13 11
Heavy Trucks 0.00 0 0
SB Cars 0.99 990 792
Medium Trucks 0.01 10 8
Heavy Trucks 0.00 0 0
Broadway
% 4rd to New new to Reno
NB Cars 0.99 10 10
Medium Trucks 0.01 1 1
Heavy Trucks 0.00 0 0
SB Cars 0.99 10 10
Medium Trucks 0.01 1 1
Heavy Trucks 0.00 0 0
Gaylord
% 4rd to New new to Reno
NB Cars 0.97 1562 1193
Medium Trucks 0.03 48 37
Heavy Trucks 0.00 0 0
SB Cars 0.97 1610 1193
Medium Trucks 0.03 50 37
Heavy Trucks 0.00 0 0

Alternate C - 2040 TNM Traffic
New Boulevard
%
Virginia to Klein Klein to Reno Reno to Walker Walker to Hudson
Hudson to Robinson
Robinson to Gaylord
WB Cars 0.88 1650 1012 603 1096 1144 1452
Medium Trucks 0.10 188 115 69 125 125 165
Heavy Trucks 0.02 38 23 14 25 14 33
EB Cars 0.95 1781 1093 1207 1463 1378 1568
Medium Trucks 0.04 75 46 51 62 58 66
Heavy Trucks 0.01 19 12 13 15 15 17
Reno
% %
Virginia to Klein
Western to New
New to Shartell
Shartell to Walker
Walker to Hudson
Hudson to Robinson
Robinson to Gaylord
WB Cars 0.85 0.94 512 673 1062 1062 1173 1181 1260
Medium Trucks 0.12 0.05 72 95 149 149 62 63 67
Heavy Trucks 0.03 0.01 16 21 33 33 12 13 13
EB Cars 0.89 0.96 532 1044 798 798 864 818 784
Medium Trucks 0.09 0.03 52 102 78 78 30 28 27
Heavy Trucks 0.03 0.01 16 31 24 24 9 9 8

Western
% to Reno new to sheridan
NB Cars 0.99 1688 1409
Medium Trucks 0.01 17 14
Heavy Trucks 0.00 0 0
SB Cars 0.99 1800 1329
Medium Trucks 0.01 18 13
Heavy Trucks 0.00 0 0 Shartel
% to Reno new to sheridan
NB Cars 0.99 50 30
Medium Trucks 0.01 1 0
Heavy Trucks 0.00 0 0
SB Cars 0.99 99 30
Medium Trucks 0.01 1 0
Heavy Trucks 0.00 0 0 Walker
% 3rd to New
new to 2nd
2nd to Reno
NB Cars 0.99 594 1031 1031
Medium Trucks 0.01 6 10 10
Heavy Trucks 0.00 0 0 0
SB Cars 0.99 693 881 897
Medium Trucks 0.01 7 9 9
Heavy Trucks 0.00 0 0 0

Hudson
% 4rd to New
new to 2nd
2nd to Reno
NB Cars 0.99 248 718 749
Medium Trucks 0.01 3 7 8
Heavy Trucks 0.00 0 0 0
SB Cars 0.99 248 574 592
Medium Trucks 0.01 3 6 6
Heavy Trucks 0.00 0 0 0
Robinson
% 4rd to New new to Reno
NB Cars 0.99 1287 1081
Medium Trucks 0.01 13 11
Heavy Trucks 0.00 0 0
SB Cars 0.99 990 644
Medium Trucks 0.01 10 7
Heavy Trucks 0.00 0 0
Broadway
% 4rd to New new to Reno
NB Cars 0.99 10 10
Medium Trucks 0.01 1 1
Heavy Trucks 0.00 0 0
SB Cars 0.99 10 10
Medium Trucks 0.01 1 1
Heavy Trucks 0.00 0 0
Gaylord
% 4rd to New new to Reno
NB Cars 0.97 1562 1193
Medium Trucks 0.03 48 48
Heavy Trucks 0.00 0 0
SB Cars 0.97 1610 1193
Medium Trucks 0.03 50 37
Heavy Trucks 0.00 0 0

Alternate D - 2040 TNM Traffic
California
% Western to Classen Classen to Shartel Shartel to Walker
WB Cars 0.88 1241 906 642
Medium Trucks 0.10 141 103 73
Heavy Trucks 0.02 28 21 15
EB Cars 0.95 1314 978 694
Medium Trucks 0.04 55 41 29
Heavy Trucks 0.01 14 10 7
New Boulevard
% Virginia to Klein Klein to Western
WB Cars 0.88 1473 1224
Medium Trucks 0.10 167 139
Heavy Trucks 0.02 33 28
EB Cars 0.95 1590 1321
Medium Trucks 0.04 67 56
Heavy Trucks 0.01 17 14
Reno (West of Shartel)
% Virginia to Klein Klein to Western Western to Classen Classen to Shartel
WB Cars 0.85 604 479 457 428
Medium Trucks 0.12 32 67 64 60
Heavy Trucks 0.03 6 15 14 13
EB Cars 0.89 517 660 555 445
Medium Trucks 0.09 18 64 54 44
Heavy Trucks 0.03 5 20 17 13

Reno (East of Shartel)
% Shartel to Walker Walker to Hudson Hudson to Robinson Robinson to Gaylord
WB Cars 0.94 511 993 935 828
Medium Trucks 0.05 27 53 50 44
Heavy Trucks 0.01 5 11 10 9
EB Cars 0.96 616 1012 952 844
Medium Trucks 0.03 21 35 33 29
Heavy Trucks 0.01 6 11 10 9
2nd
% Lee to Walker
WB Cars 0.99 110
Medium Trucks 0.01 1
Heavy Trucks 0.00 0
EB Cars 0.99 129
Medium Trucks 0.01 1
Heavy Trucks 0.00 0
3rd
% Lee to Walker
WB Cars 0.99 1460
Medium Trucks 0.01 15
Heavy Trucks 0.00 0
EB Cars 0.99 1284
Medium Trucks 0.01 13
Heavy Trucks 0.00 0
Western

% new to Reno Reno to CA CA to Sheridan
NB Cars 0.99 1093 1067 1027
Medium Trucks 0.01 11 11 10
Heavy Trucks 0.00 0 0 0
SB Cars 0.99 1185 1068 832
Medium Trucks 0.01 12 11 8
Heavy Trucks 0.00 0 0 0
Classen
% new to Reno Reno to CA
NB Cars 0.99 248 548
Medium Trucks 0.01 3 6
Heavy Trucks 0.00 0 0
SB Cars 0.99 222 548
Medium Trucks 0.01 2 6
Heavy Trucks 0.00 0 0
Shartel
% new to Reno Reno to CA CA to Sheridan
NB Cars 0.99 395 533 189
Medium Trucks 0.01 4 5 2
Heavy Trucks 0.00 0 0 0
SB Cars 0.99 394 533 409
Medium Trucks 0.01 4 5 4
Heavy Trucks 0.00 0 0 0
Lee
% new to Reno Reno to CA

NB Cars 0.99 126 131
Medium Trucks 0.01 1 1
Heavy Trucks 0.00 0 0
SB Cars 0.99 125 132
Medium Trucks 0.01 1 1
Heavy Trucks 0.00 0 0
Walker
% 3rd to 2nd 2nd to Reno Reno to CA Ca to Sheridan
NB Cars 0.99 658 861 1072 1044
Medium Trucks 0.01 7 9 11 11
Heavy Trucks 0.00 0 0 0 0
SB Cars 0.99 657 677 1080 926
Medium Trucks 0.01 7 7 11 9
Heavy Trucks 0.00 0 0 0 0
Hudson
% 3rd to 2nd Reno to Sheridan
NB Cars 0.99 546 782
Medium Trucks 0.01 6 8
Heavy Trucks 0.00 0 0
SB Cars 0.99 686 1093
Medium Trucks 0.01 7 11
Heavy Trucks 0.00 0 0
Robinson
% 3rd to Reno Reno to Sheridan

NB Cars 0.99 974 1060
Medium Trucks 0.01 10 11
Heavy Trucks 0.00 0 0
SB Cars 0.99 887 886
Medium Trucks 0.01 9 9
Heavy Trucks 0.00 0 0
Gaylord
% 3rd to Reno Reno to Sheridan
NB Cars 0.99 1301 1314
Medium Trucks 0.01 13 13
Heavy Trucks 0.00 0 0
SB Cars 0.99 1345 1344
Medium Trucks 0.01 14 14
Heavy Trucks 0.00 0 0