crosswell seismic imaging for deep gas reservoir characterization
TRANSCRIPT

Case History
C
GK
bfi
©
GEOPHYSICS, VOL. 73, NO. 6 �NOVEMBER-DECEMBER 2008�; P. B117–B126, 17 FIGS.10.1190/1.2980417
rosswell seismic imaging for deep gas reservoir characterization
ang Yu1, Bruce Marion2, Brad Bryans2, Pedro Carrillo2, Guo Wankui3, Pang Yanming4, andong Fanzhong4
hsvrtptvtruvwt
ostvtsuiwil
tp
ber 2008gies.com; bbrya
china.c
ABSTRACT
A gas discovery in the Shengping area of the Daqing Oil-field in China was made recently in a large-scale volcanicdepositional environment. Because gas in the heterogeneitiesof formations broken by tectonic activity and localized volca-nic eruptions is not common, researchers sought a more de-tailed reservoir characterization before developing the field.Crosswell seismic data were used to augment existing 3Dsurface seismic, log, and core data. This provided data at fivetimes the resolution of the surface seismic data to bridge thegap in resolution between surface seismic and well data.Crosswell seismic data were acquired in two wells, 832 mapart, and processed to provide images of reflectivity, veloci-ty, and formation properties from sections produced by am-plitude-versus-angle �AVA� inversion. The state of the art incrosswell seismic is summarized briefly, reviewing progressin data acquisition and data processing over several decadesof crosswell technology development. A detailed descriptionof the data acquisition and data processing applied to the datafrom the Shengping area is also given.An integrated interpre-tation of the crosswell images with the surface seismic andlog data was used to produce a more detailed geologic model.The enhanced geologic model is being used to plan strategicdevelopment of the reservoir and to evaluate possible infillwell locations.
INTRODUCTION
A new deeper gas field was discovered recently near the outeroundary of the prolific Daqing Oilfield. The newly discovered gaseld is located in a large-scale volcanic depositional environment.
Manuscript received by the Editor 3 June 2008; published online 5 Novem1KMS Technologies, Houston, Texas, U.S.A. E-mail: gang@kmstechnolo2Z-Seis Corporation, Houston, Texas, U.S.A. E-mail: [email protected] Oilfield E & D Institute, P. R. China. E-mail: pangyanming@petro2008 Society of Exploration Geophysicists.All rights reserved.
B117
The Shengping area, part of the Songliao Basin, has deep Sha-ezhi and Huoshiling dark mudstones and coal seams as a mainource of gas. Gas production zones are located in the Yingchengolcanic and glutenite formations. The Yingcheng formation is theesult of large-scale volcanic deposition. Core analysis shows thathe volcanic gas-reservoir interval has fracture zones and openores. The gas zones are shown in the logs of Figure 1 in addition tohe rock types from 2400 m to total depth �TD�. The volcanic reser-oir has fracture zones, melt pores, shrinkage joints, and other fea-ures that contribute to significant heterogeneity in the reservoir. Theelatively low-resolution surface-seismic data in Figure 2 �with anpper frequency of about 50 Hz� makes mapping the detailed reser-oir structure and its lateral extent very difficult. From analysis ofell logs, the reservoir zones are typically 3–5 m thick, well below
he resolution of surface seismic data.Researchers selected crosswell seismic data to provide higher res-
lution reservoir description, combined with existing 3D surfaceeismic, VSP, and log data. Crosswell seismic data was chosen withhese specific objectives: �1� map lateral changes and extent of reser-oir formation between wells, �2� provide critical reservoir-distribu-ion information to optimize the gas-field development plan, and �3�elect infill well locations between the existing exploration and eval-ation wells. As a location where infill well opportunities might ex-st, researchers selected the area around the SS-2-17 and SSG-2ells for reservoir characterization �see Figure 3�. Their goal was an
ntegrated interpretation using all available data to enhance the geo-ogic model of the area.
REVIEW OF THE STATE OF THEART IN CROSSWELL SEISMIC
Crosswell seismic technology has been under development sincehe early 1980s with many research groups inside major E & P com-anies involved in early experiments �Lines et al., 1993�. Initially re-
..
[email protected]; [email protected].
om.cn; [email protected].

stltfdrghrcmd
•
••••
I
•
•
••
F2
F�s
B118 Yu et al.
earchers focused on tomographic inversion of direct-path travel-ime data to produce velocity images. Early source technology wasimited in reach to about 100 m between wells, and wells had to ex-end past the reservoir interval for the tomographic image to haveull coverage. During the 1990s, researchers at Stanford Universityemonstrated reflection imaging using crosswell seismic data �Har-is et al., 1995�. Over the past 15 years, crosswell seismic technolo-y advances have occurred primarily in the area of improved down-ole sources and enhanced data processing and analysis methods. Aecent search of the online SEG database revealed 257 references torosswell seismic methods. The Daqing gas-field study is one of theost challenging large-scale projects in China to consider crosswell
ata acquisition.The benefits of advanced crosswell seismic technology include:
Improved understanding of the reservoir with impact on all phas-es of exploitation and recovery.
igure 1. Gas-formation characteristics in well logs from well SSG400 m to TD are listed.
igure 2. The relatively low-resolution surface seismic data betweenleft�, with an upper frequency of about 50 Hz �right�, makes mapptructure and lateral extent very difficult.
Increased distance between wells.Improved efficiency and lower cost.More robust processing and interpretation.Reduced impact on production operations.
nnovative technologies introduced in the past decade include:Acquisition
More powerful sources providing for operation up to 1 km be-tween wells �Antonelli et al., 2004�.Multilevel receivers for enhanced efficiency �Li and Majer,2003�.
Data processing
Fully 3D imaging framework �Washbourne et al., 2002b�.TI anisotropy estimated in inversion and applied in ray tracing�Jervis et al., 2000�.
• Pre-stack migration �Byun et al., 2001�.• Reflection tomography — no missing cover-
age at TD �Washbourne et al., 2002a�.• Crosswell amplitude decomposition and AVA
inversion �as described here�.• Difference tomography for time-lapse appli-
cations �Bryans, 2004�.• Attenuation tomography �Carrillo et al.,
2007�.
DATA ACQUISITION ANDPROCESSING METHODS
Researchers collected data from one crosswellseismic profile �survey between a pair of wells� inthe Shengping area of the Daqing Oilfield duringSeptember 2005. The crosswell seismic piezo-electric source was deployed in the SS-2-17 well�Figure 3�. A multilevel, high-frequency, down-hole hydrophone-receiver system was deployedin the SSG-2 well �Figure 3�. The distance be-tween the two wells at the surface was 832 m,which was a well separation greater than mostprevious crosswell surveys reported to date inChina. The objective imaging zone was from2500-3400 m. During data acquisition, the down-hole seismic source was positioned at depths be-tween 2154–3093 m, and the downhole seismicreceiver was positioned at depths from 2229–3366 m. Both source spacing and receiver-levelspacing were 3 m, providing a finely sampleddata set. A high degree of redundancy �fold� re-sulted for crosswell seismic tomographic inver-sion and reflection imaging. In addition, the finesampling allowed multichannel wavefield sepa-ration filtering of the time-domain crosswell seis-mic data. Because well spacing was very largecompared with normal crosswell seismic profiles,researchers used a configured downhole seismicsource to increase the energy. Two piezoelectricsources operated simultaneously in the sourcewell, resulting in a longer source with twice the
k types from
7 and SSG-2the reservoir
-2. Roc
SS-2-1ing of

oH6
abfirsflor
mtisptttsf8Fo
ipdt
curr
D
tlsctcfiwaadit�p
Ffc
Fm
Crosswell seismic reservoir characterization B119
utput. The source sweep frequency range was from 100 Hz–1000z. This source configuration is estimated to increase energy bydB and improve the signal-to-noise ratio.Operational challenges included high noise levels in the source
nd receiver wells. The major noise source was from gas movementetween different zones behind the casing. Researchers applied f-kltering to the time-domain data in the field to enhance the direct ar-ival and reflected wavefields. See Figure 4 for examples of commonource-and-receiver gathers �raw data�, where high-amplitude re-ections are identified with black arrows. There were 81,330 tracesf crosswell seismic data acquired successfully for the profile sepa-ated by 832 m.
Processing of the crosswell seismic data set is conducted in twoajor phases: tomographic inversion to produce an image of veloci-
y between the two wells and a velocity model, and reflection imag-ng. Figures 5 and 6 outline the steps in each processing phase. In thistudy, researchers used AVA gathers from the reflection-imagingrocess to invert for velocity and density sections between the wellso enable better interpretation of formation properties between thewo wells. The inversion used reflectivity at each offset location be-ween the wells as a function of angle as the input to the AVA inver-ion process. Incidence angles in the crosswell data as measuredrom the vertical are in the range of approximately 40° to more than5°, a greater-than-typical range in surface seismic AVO inversion.igure 7 illustrates an example of a crosswell AVA gather from anffset of 192.5 m from the receiver well.Based on the large vertical zone of interest for crosswell seismic
maging, reflection seismic data from above the source and receiverositions �downgoing reflections� were used in addition to reflectionata from below the source and receiver positions �upgoing reflec-ions�. This process reduces the number of levels to be acquired to
igure 3. The area around the SS-2-17 and SSG-2 wells was selectedor characterization using the crosswell seismic method and as a lo-ation where infill well opportunities might exist.
over a tall zone of interest �D’Agosto et al., 2006�. Researcherssed similar data-processing flows for both upgoing and downgoingeflection images, with the exception of the up/down reflection sepa-ation step of the wavefield separation processing.
ata processing and velocity tomographyIn the crosswell seismic tomographic processing sequence, each
race was first noise-edited with diversity stacking and crosscorre-ated with the pilot signal �sweep�. Then the correlated data weretacked to generate a 3-m depth increment in both the source and re-eiver well. Crosswell data often contain tube waves of high ampli-ude. Tube waves are strong signals that travel within the well andan affect the energy content of reflections. Tube waves were identi-ed in common source-and-receiver gathers. As a result of tube-ave noise, both coherent and random in the data, a reject filter was
pplied in two crosswell domains: common-receiver gather �CRG�nd common-source gather �CSG�. A 17-point median filter �time-omain wavefield� was designed to reject the upgoing and downgo-ng tube waves. In addition the data were zero-phase, band-pass fil-ered �time domain� with an Ormsby filter using corner frequencies225 Hz � 250 Hz � 750 Hz � 850 Hz� prior to first-arrival timeicking.
a)
b)
igure 4. Example of raw data. �a� Common-source gather. �b� Com-on-receiver gather.Arrows indicate events related to reflections.

asmfiTP3i2t
upTp�dp
fctHw�
R
VvsVtrtad
Fs
Fs
Fr
B120 Yu et al.
Then we identified and picked the crosswell seismic P-wave firstrrivals in four domains: common-receiver gather �CRG�, common-ource gather �CSG�, common-offset gather �COG� and common-id-depth gather �CMG�. The complexity of the crosswell wave-eld sometimes makes it difficult to identify the first arrivals.he four domains allow redundant confirmation of the picks. The-wave first-arrival pick times were considered as input to theD anisotropic traveltime inversion. The crosswell seismic 3D an-sotropic traveltime-tomography algorithm �Washbourne et al.,002b� produces an image of seismic velocity between wells usinghe nonlinear continuation strategy of Bube and Langan �1999�.
igure 5. Crosswell seismic data tomographic-inversion processingteps and flowchart.
igure 6. Crosswell seismic data reflection-imaging processingteps and flowchart.
Coherent wave modes in the time-domain wavefield can contrib-te noise to the final stacked image. These wave modes include com-ressional direct arrivals, shear direct arrivals and shear reflections.hese wave modes are removed through spatial filtering. In thisroject, unwanted wave modes were attenuated using spatial filtersusually f-k fan or median filters� applied in various crosswell sortomains. Wavefield-separated data were deconvolved with a zero-hase spiking filter.Reflection amplitudes recorded in crosswell seismic data are af-
ected by several factors that are not related to the reflection coeffi-ient of a reflecting horizon. The goal of amplitude normalization iso correct the amplitudes of time-domain data before mapping.ere the amplitude normalization used to balance amplitudeas computed trace-by-trace over the time window �10 ms to100 ms around the P-wave first-arrival time.
eflection imaging
The wavefield-separated crosswell seismic data in the study wereSP-CDPdepth mapped, as in offset-VSPdata processing, using theelocity model from the crosswell seismic traveltime inversion. Re-earchers carried out a post-map migration �Byun et al., 2001� on theSP-CDP-mapped data volume to collapse diffractions and produce
he final crosswell seismic reflection image. Because there is a wideange of incidence angles present in a crosswell seismic data set andhe wavelet and reflection character change with incidence angle, thengle-transformed AVA data volume is another natural domain forata analysis.Angle muting was used in this case to select angles that
igure 7. Crosswell AVA gather from an offset of 192.5 m from theeceiver well.
misdafi
A
ciwtsoTnaimtdostfipbeolfofcpwa
Ca
iWatvieaav
stpatF ge closely.
Crosswell seismic reservoir characterization B121
aintain adequate SNR while best approximat-ng the vertical incidence response. Followingtacking of the AVA data volume, we applied aepth-domain bandpass filter and short mixcross traces to improve the SNR in the stackednal reflection image.
VA reflectivity inversion
We applied amplitude compensation to therosswell data to preserve reflectivity amplitudesn the AVA gathers. Direct-arrival amplitudesere used as input to an amplitude decomposi-
ion that describes amplitude as made up ofource, receiver, and absolute offset �verticalffset � source depth � receiver depth� terms.he source-and-receiver terms take into accountear-wellbore effects such as formation imped-nce, the interfaces between fluid and casing, flu-d and cement, and cement and casing, and equip-ent effects like depth-dependent source ampli-
ude, or channel-to-channel gain and sensitivityifferences in the receiver system. The absolute-ffset term accounts for angle dependence in theource-and-receiver radiation patterns in additiono propagation effects such as transmission coef-cients, distance, and attenuation. We derivedetrophysical properties using AVA inversionased on linearized approximations to Zoeppritzquations �D’Agosto et al., 2008�. Researchersbtained dVP/VP, dVS/VS, and d� /� with a linear,east-squares inversion approach. Then the low-requency trend was added for the AVA inversionutput �VP,VS� and density inversions. The low-requency trend for VP was derived from therosswell seismic velocity image from tomogra-hic inversion. Resulting VP and density valuesere combined to generate an acoustic imped-
nce section.
rosswell seismic images, interpretationnd integration
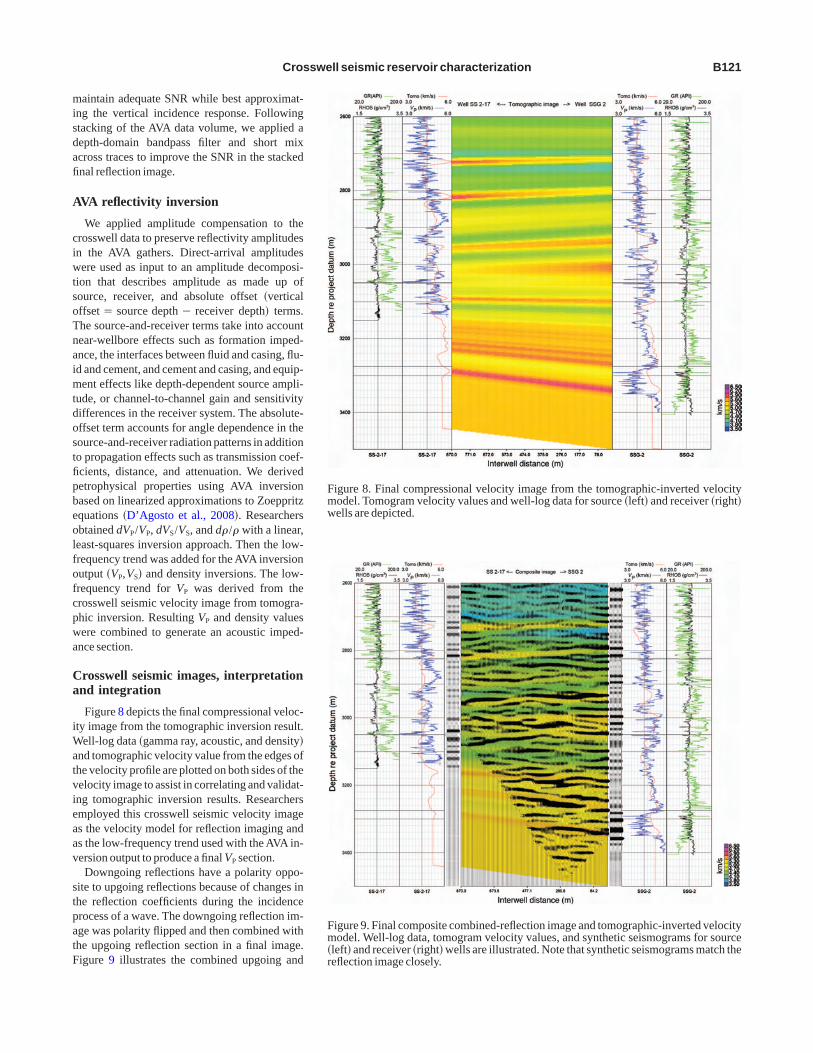
Figure 8 depicts the final compressional veloc-ty image from the tomographic inversion result.
ell-log data �gamma ray, acoustic, and density�nd tomographic velocity value from the edges ofhe velocity profile are plotted on both sides of theelocity image to assist in correlating and validat-ng tomographic inversion results. Researchersmployed this crosswell seismic velocity images the velocity model for reflection imaging ands the low-frequency trend used with the AVA in-ersion output to produce a final VP section.Downgoing reflections have a polarity oppo-
ite to upgoing reflections because of changes inhe reflection coefficients during the incidencerocess of a wave. The downgoing reflection im-ge was polarity flipped and then combined withhe upgoing reflection section in a final image.igure 9 illustrates the combined upgoing and
Figure 8. Finamodel. Tomogwells are depi
Figure 9. Finamodel. Well-l�left� and recereflection ima
l compressional velocity image from the tomographic-inverted velocityram velocity values and well-log data for source �left� and receiver �right�
cted.
l composite combined-reflection image and tomographic-inverted velocityog data, tomogram velocity values, and synthetic seismograms for sourceiver �right� wells are illustrated. Note that synthetic seismograms match the
dfrrIcst
fltsaat�ppt
oflpsttcshf
bAtws
Fwos
Fs
B122 Yu et al.
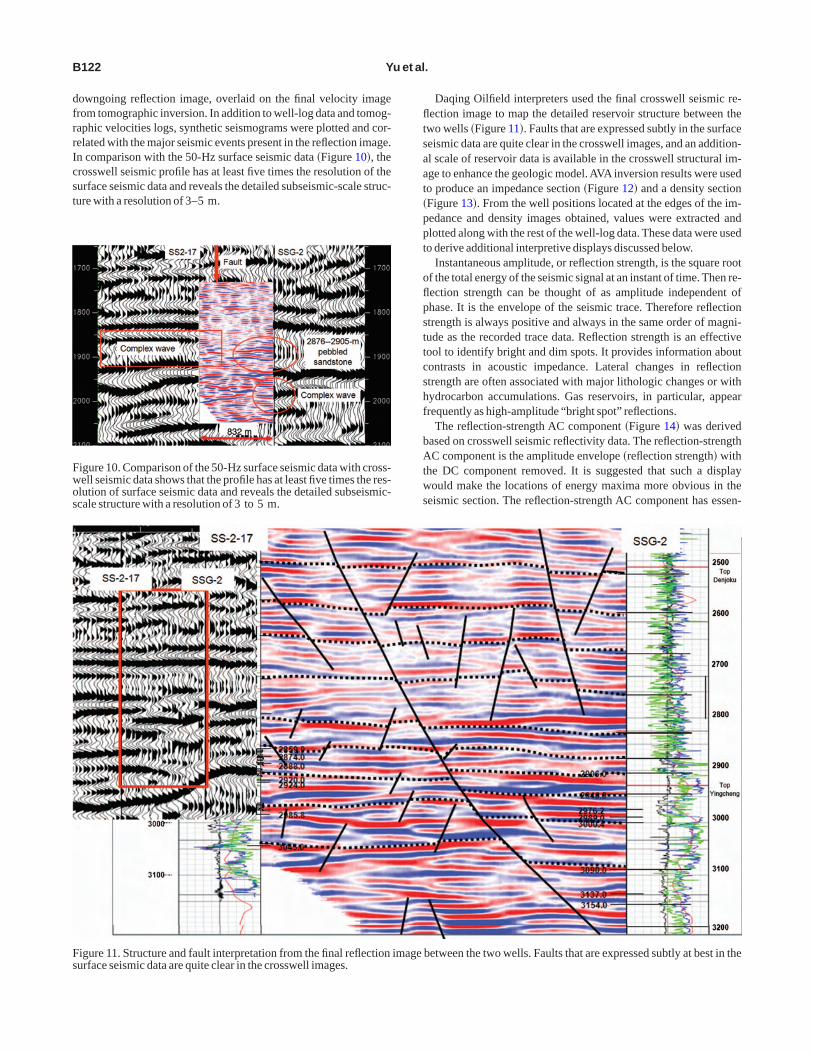
owngoing reflection image, overlaid on the final velocity imagerom tomographic inversion. In addition to well-log data and tomog-aphic velocities logs, synthetic seismograms were plotted and cor-elated with the major seismic events present in the reflection image.n comparison with the 50-Hz surface seismic data �Figure 10�, therosswell seismic profile has at least five times the resolution of theurface seismic data and reveals the detailed subseismic-scale struc-ure with a resolution of 3–5 m.
igure 10. Comparison of the 50-Hz surface seismic data with cross-ell seismic data shows that the profile has at least five times the res-lution of surface seismic data and reveals the detailed subseismic-cale structure with a resolution of 3 to 5 m.
igure 11. Structure and fault interpretation from the final reflectionurface seismic data are quite clear in the crosswell images.
Daqing Oilfield interpreters used the final crosswell seismic re-ection image to map the detailed reservoir structure between the
wo wells �Figure 11�. Faults that are expressed subtly in the surfaceeismic data are quite clear in the crosswell images, and an addition-l scale of reservoir data is available in the crosswell structural im-ge to enhance the geologic model.AVAinversion results were usedo produce an impedance section �Figure 12� and a density sectionFigure 13�. From the well positions located at the edges of the im-edance and density images obtained, values were extracted andlotted along with the rest of the well-log data. These data were usedo derive additional interpretive displays discussed below.
Instantaneous amplitude, or reflection strength, is the square rootf the total energy of the seismic signal at an instant of time. Then re-ection strength can be thought of as amplitude independent ofhase. It is the envelope of the seismic trace. Therefore reflectiontrength is always positive and always in the same order of magni-ude as the recorded trace data. Reflection strength is an effectiveool to identify bright and dim spots. It provides information aboutontrasts in acoustic impedance. Lateral changes in reflectiontrength are often associated with major lithologic changes or withydrocarbon accumulations. Gas reservoirs, in particular, appearrequently as high-amplitude “bright spot” reflections.
The reflection-strength AC component �Figure 14� was derivedased on crosswell seismic reflectivity data. The reflection-strengthC component is the amplitude envelope �reflection strength� with
he DC component removed. It is suggested that such a displayould make the locations of energy maxima more obvious in the
eismic section. The reflection-strength AC component has essen-
between the two wells. Faults that are expressed subtly at best in the
image
Crosswell seismic reservoir characterization B123
Figure 12. Final AVA-VP inverted acoustic-imped-ance image. Well-log information and AVA-VP in-verted acoustic-impedance values at wells are plot-ted on both sides of the impedance image. Note thecorrelation between impedance log �red�, sonic ve-locity log �blue�, and density log �black� between2600–3100 m �well SS-2-17� and 2600–3300 m�well SSG-2�.
Figure 13. Final AVA-inverted density image.For low-frequency content, inversion results �red�show correlation with the density log �black� be-tween 2600–3100 m �well SS-2-17� and 2600–3000 m �well SSG-2�.

tbcps
atm�rripiaYp
kd1tatw
dtwtiiPam
Ftvpp
Feoat�g
B124 Yu et al.
ially the same uses as reflection strength, but because its data hasoth positive and negative values, it can be analyzed with standardolor maps and subjected to trace mixing or other data-enhancementrocesses. Reflection-strength data, because it is only positive, is notuitable for many types of analysis and processing.
Researchers found reflection-strength AC-component data to ben indicator of volcanic formations based on well control. In addi-ion, this attribute was used to map lateral variations of lithology for-ation. The analysis showed that the Glutinite in SS-2-17 �27402862 m� and pebbled sandstone in SSG-2 �2876 � 2900 m� have
eflection-intensity changes, but they are weaker than in volcanicocks. Low-impedance zones were identified �see Figure 15�. Thempedance profile is derived from crosswell seismic data with inter-retation of gas zones based on the presence of low impedance. Us-ng the impedance profile, we can see two low-impedance zones �rednd purple� in the YC3-4 group and one low-impedance zone in theC3-3 group that are associated with the gas reservoir. One low-im-edance zone �volcanic deposit facies� in theYC4 group matches the
igure 14. Researchers used the reflection-strength AC componento analyze the quality of amplitude anomaly and to map the lateralariations of lithology formation. The reflection-strength AC com-onent is the deviation after removal of the average value �DC com-onent� of reflection strength.
igure 15. The impedance profile was used for res-rvoir prediction. Two low-impedance zones �redr purple� in the YC3-4 group and one low-imped-nce zone in the YC3-3 group were predicted fromhe impedance profile. One low-impedance zonevolcanic deposit facies� inYC4 group matched theas zone in the SSG-2 well.
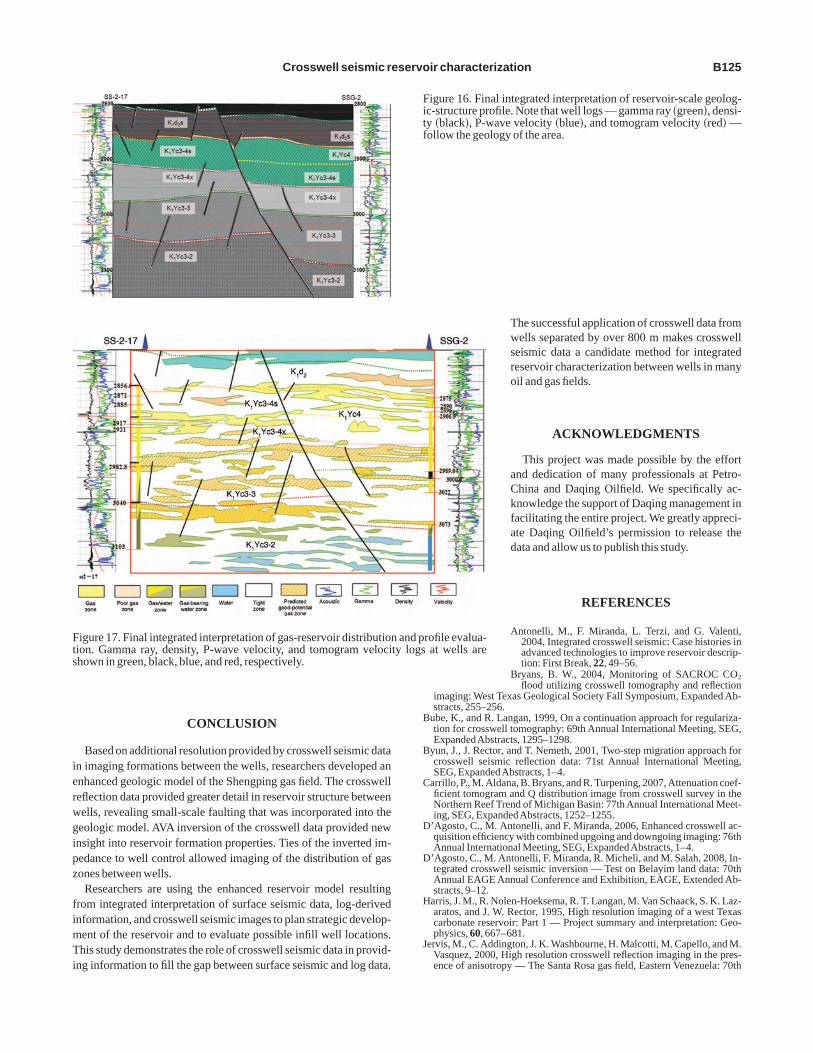
nown gas zone in the well SSG-2.An integrated interpretation pro-uced the final integrated reservoir-scale geologic model in Figure6. This detailed subseismic geologic model has at least five timeshe resolution of the geologic model produced with previously avail-ble surface seismic data. In addition to enhancing what is known ofhe reservoir, the more detailed information is used to evaluate infillell locations for gas-field development.After the integration of surface seismic data, crosswell seismic
ata, log-data interpretation, and different crosswell seismic at-ribute analyses, the final integrated gas-reservoir evaluation profileas created �see Figure 17�. During the final integration study phase,
he crosswell seismic-derived attributes of instantaneous frequency,nstantaneous phase, reflection-intensity AC component, seismicmpedance, interval velocity, density, calculated gamma, invertedoisson’s ratio, spectral decomposition, and coherence were derivednd analyzed with the reservoir-scale structural interpretation toap and describe the gas reservoir distribution between two wells.
ierwgipz
fimTi
B
B
C
D
D
H
J
Fts
Crosswell seismic reservoir characterization B125
CONCLUSION
Based on additional resolution provided by crosswell seismic datan imaging formations between the wells, researchers developed annhanced geologic model of the Shengping gas field. The crosswelleflection data provided greater detail in reservoir structure betweenells, revealing small-scale faulting that was incorporated into theeologic model. AVA inversion of the crosswell data provided newnsight into reservoir formation properties. Ties of the inverted im-edance to well control allowed imaging of the distribution of gasones between wells.
Researchers are using the enhanced reservoir model resultingrom integrated interpretation of surface seismic data, log-derivednformation, and crosswell seismic images to plan strategic develop-ent of the reservoir and to evaluate possible infill well locations.his study demonstrates the role of crosswell seismic data in provid-
ng information to fill the gap between surface seismic and log data.
igure 17. Final integrated interpretation of gas-reservoir distributioion. Gamma ray, density, P-wave velocity, and tomogram velocihown in green, black, blue, and red, respectively.
The successful application of crosswell data fromwells separated by over 800 m makes crosswellseismic data a candidate method for integratedreservoir characterization between wells in manyoil and gas fields.
ACKNOWLEDGMENTS
This project was made possible by the effortand dedication of many professionals at Petro-China and Daqing Oilfield. We specifically ac-knowledge the support of Daqing management infacilitating the entire project. We greatly appreci-ate Daqing Oilfield’s permission to release thedata and allow us to publish this study.
REFERENCES
Antonelli, M., F. Miranda, L. Terzi, and G. Valenti,2004, Integrated crosswell seismic: Case histories inadvanced technologies to improve reservoir descrip-tion: First Break, 22, 49–56.
Bryans, B. W., 2004, Monitoring of SACROC CO2flood utilizing crosswell tomography and reflection
imaging: West Texas Geological Society Fall Symposium, Expanded Ab-stracts, 255–256.
ube, K., and R. Langan, 1999, On a continuation approach for regulariza-tion for crosswell tomography: 69th Annual International Meeting, SEG,ExpandedAbstracts, 1295–1298.
yun, J., J. Rector, and T. Nemeth, 2001, Two-step migration approach forcrosswell seismic reflection data: 71st Annual International Meeting,SEG, ExpandedAbstracts, 1–4.
arrillo, P., M. Aldana, B. Bryans, and R. Turpening, 2007, Attenuation coef-ficient tomogram and Q distribution image from crosswell survey in theNorthern Reef Trend of Michigan Basin: 77th Annual International Meet-ing, SEG, ExpandedAbstracts, 1252–1255.
’Agosto, C., M. Antonelli, and F. Miranda, 2006, Enhanced crosswell ac-quisition efficiency with combined upgoing and downgoing imaging: 76thAnnual International Meeting, SEG, ExpandedAbstracts, 1–4.
’Agosto, C., M. Antonelli, F. Miranda, R. Micheli, and M. Salah, 2008, In-tegrated crosswell seismic inversion — Test on Belayim land data: 70thAnnual EAGE Annual Conference and Exhibition, EAGE, Extended Ab-stracts, 9–12.
arris, J. M., R. Nolen-Hoeksema, R. T. Langan, M. Van Schaack, S. K. Laz-aratos, and J. W. Rector, 1995, High resolution imaging of a west Texascarbonate reservoir: Part 1 — Project summary and interpretation: Geo-physics, 60, 667–681.
ervis, M., C. Addington, J. K. Washbourne, H. Malcotti, M. Capello, and M.Vasquez, 2000, High resolution crosswell reflection imaging in the pres-ence of anisotropy — The Santa Rosa gas field, Eastern Venezuela: 70th
igure 16. Final integrated interpretation of reservoir-scale geolog-c-structure profile. Note that well logs — gamma ray �green�, densi-y �black�, P-wave velocity �blue�, and tomogram velocity �red� —ollow the geology of the area.
rofile evalua-at wells are
Fitf
n and pty logs

L
L
W
W
B126 Yu et al.
Annual International Meeting, SEG, ExpandedAbstracts, 1631–1635.i, G., and E. Majer, 2003, Coiled tubing deployment makes crosswell seis-mic surveying successful in horizontal wells: The Leading Edge, 22, 454–458.
ines, L. R., M. Miller, H. Tan, R. Chambers, and S. Treitel, 1993, Integrated
interpretation of borehole and crosswell data from a west Texas field: TheLeading Edge, 12, 13–16.ashbourne, J., K. Bube, M. Antonelli, and F. Miranda, 2002a, Crosswell re-flection tomography: 72ndAnnual International Meeting, SEG, ExpandedAbstracts, 874–877.ashbourne, J., J. Rector, and K. Bube, 2002b, Crosswell traveltime tomog-
raphy in three dimensions: Geophysics, 67, 853–871.