crouching tiger, hidden dragon: what are the … tiger, hidden dragon: what are the consequences of...
TRANSCRIPT
Crouching Tiger, Hidden Dragon: What are the Consequences of China’s WTO Entry
for India’s Trade?
Valerie Cerra Sandra A. Rivera
Sweta Chaman Saxena
Paper prepared for: The 7th Annual Conference
On Global Economic Analysis
June 17-19, 2004 The World Bank Washington DC
Abstract One of the most significant recent developments in world trade has been the entry of China into the WTO. This paper examines the implications of China’s WTO accession for India’s trade, both using econometrics and computable general equilibrium (CGE) models. This paper analyzes how India stands to lose or gain from China’s entry in terms of both the direct and competitive channels.
JEL Classification Numbers: Keywords: China; India; Trade; WTO Corresponding Author: Valerie Cerra, IMF Institute; [email protected]; Sandra A. Rivera, USITC/Purdue University; Sweta Chaman Saxena, University of Pittsburg. This work is a draft please do not quote without explicit written permission of the authors. The views expressed in this paper are those of the author(s) and do not necessarily represent those of the IMF or IMF policy, nor of the USITC or any of its commissioners. Working Papers describe research in progress by the author(s) and are published to elicit comments and to further debate.
I. INTRODUCTION
China became the 143rd member of the WTO on December 11, 2001, after negotiating the terms of its entry for 15 years.1 Given the potential size of the Chinese market, this may mark a watershed event in the history of world trade. The world reaction to the Chinese entry into the WTO has been mixed. While most countries welcome the opportunities for access to China’s large domestic markets, developed countries fear that cheap Chinese imports will flood their domestic markets, and developing countries are concerned that China will undercut their export markets in the West and shrink their receipts of foreign direct investment.2 While the overall welfare effects are generally assessed to be positive, the expected impact varies by country depending on the similarity of its trade structure to China. This paper focuses on the impact of China’s entry into the WTO for India’s trade. The two neighbors are heavily populated, with over a billion people each. The Indian economy competes with China in exports of many commodities, especially labor-intensive manufactured goods such as textiles, garments, leather goods, and light machinery and in attracting FDI (Agarwal and Sahoo, 2003). The United States is the largest export destination for both countries, accounting for about 20-22 percent of their exports. Thus, India may one of the countries most likely to suffer from trade diversion to China. Conversely, India may gain from opportunities to access the Chinese market as a result of China’s commitments to reduce trade barriers.3 The paper is organized as follows. Section II provides some summary information on the protocol of China’s WTO entry. Section III compares the current structure of trade of China and India, indicating opportunities for bilateral trade expansion, and measures the extent to which the two countries compete in third markets. China’s trade liberalization raises the specter that trade in third markets could be diverted from India to China. Econometric analysis of historical patterns of trade are examined in Section IV to gauge the extent to which this trend had prevailed in the past decade. In addition to presenting the current and historical evidence on Chinese and Indian trade patterns, we conduct simulation analysis using a static computational general equilibrium model in Section V. Specifically, we use an aggregation from the Global Trade Analysis Project (GTAP) Data Base and model to investigate the global impacts of China’s WTO accession impacts India’s trade. Section VI concludes.
1 India has been an original member of the GATT (General Agreement on Trade and Tariffs)
2 Shafaeddin (2003) argues that the competitive effects of China’s accession on developing countries are exaggerated in the literature.
3 China will have to open up the domestic economy, reduce tariffs and non-tariff barriers, including quantitative restrictions on imports and eliminate price controls in domestic market (Agarwal and Sahoo 2003).
- 2 -
II. CHINA’S WTO ACCESSSION PROTOCOL
Accession will require China to substantially reduce tariffs on agricultural and industrial goods (WTO, 2001), to limit subsidies for agricultural production, and to forgo state monopolization of international trade in grain (Lin, 2001). China has agreed to phase out all quantitative restrictions on industrial products, to remove mandatory requirements for foreign investment, and to enforce property right on intellectual property. In addition, China has promised to open up its services sector (including telecom and financial services) to foreigners, and remove restrictions on trading and distribution for most products (Rumbaugh and Blancher, 2004). Chinese entry into the WTO is widely expected to provide continued impetus to trade growth. Accession is expected to help accelerate China’s integration into world agricultural trade patterns (Huang, Rozelle and Zhang, 2001), spur continued domestic reforms (Bajona and Chu, 2002), and help tear down the existing interregional trade barriers (Li, Qiu, and Sun, 2002). In return, China will receive permanent MFN status with the United States; its partners will lift most quantitative restrictions on a range of products and phase out quotas on textiles and clothing. China also gains access to the WTO dispute settlement mechanism to protect its trade interests and can participate in multilateral negotiations on trade rules and future trade liberalization. However, there are several discriminatory provisions which could limit China’s access to world markets. • Under the transitional product-specific safeguard mechanism, China’s trading partners
may impose restrictions on Chinese imports based on “market disruption or the threat of market disruption.” This provision will last 12 years after accession and contrasts with the normal WTO standard under which restrictions can be imposed on imports only if there is a more stringent test of “serious injury” or a “threat of serious injury.” In addition, the transitional safeguard mechanism can be taken by a third country—without establishing evidence of market disruption—to prevent diversion of Chinese exports due to the action of the first country.
• A special safeguard mechanism will be in place until the end of 2008 on China’s textiles
and clothing exports, even though all quotas are to be phased out by January 1, 2005. This mechanism will allow importing countries to restrict imports from China when they result in market disruption.
• WTO members can invoke antidumping and subsidy charges based on prices or costs that
prevail in other non-market economies. III. INDIA AND CHINA: TRADE STRUCTURE
The current structure of trade and recent trends in trade patterns may suggest whether India will likely benefit from China’s further integration with the world. In this section, we construct several indices for India and China. The Herfindahl index of specialization, indices of revealed comparative advantage, and our own measure of third market competition

- 3 -
provide information about current patterns of trade specialization. The Grubel-Lloyd index measures the extent of intra-industry trade, and the COS index measures the potential for direct trade. Data on trade by 6-digit HS industry subheadings was obtained from UN’s COMTRADE database, as reported by the World Bank’s World Integrated Trade Solutions.
A. Herfindahl index of specialization
The Herfindahl index measures the extent to which a country’s production or trade is diversified or specialized.
( )2jiij sH ∑≡ where
∑=
ij
i
jij
i xx
s .
where j
ix denotes country j’s exports of HS subgroup i, jis is the share of good i in country j’s
exports, where the summation is taken over all HS subgroups. H is bounded by (0,1]. A high value of H indicates that the country is specialized in the production of a few goods. The Herfindahl indices, shown in Table 1, suggest that exports of India, China, and the U.S. are relatively diversified at the subheading level.4 The degree of specialization shows no significant trends over the 1990s for any of the countries. India is least diversified of the three countries, and China is surprisingly more diversified than the U.S.
B. Revealed Comparative Advantage
Indices of revealed comparative advantage indicate the goods or groups of goods in which a country has “revealed” its comparative advantage relative to the world on the basis of actual trade.
wi
ji
ij ss
RCA ≡
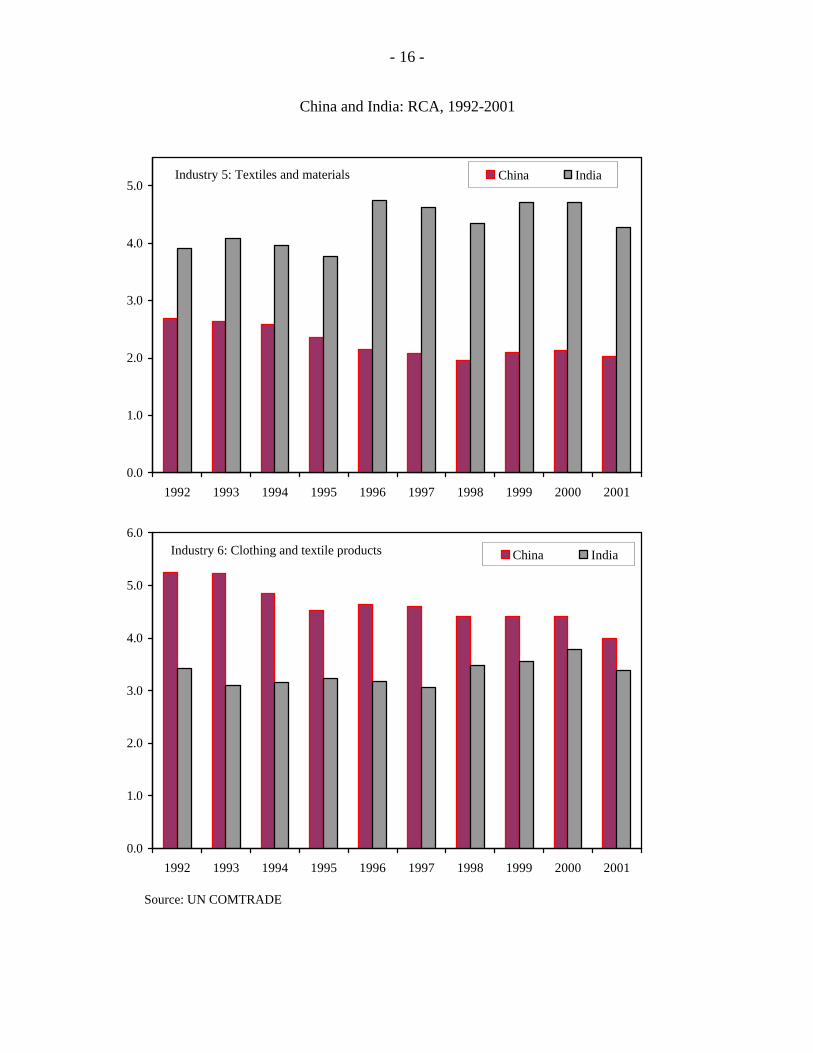
The index measures the share of good i in the exports of country j relative to the share of good i in the world’s total exports. RCAij > 1 implies that country j has a comparative advantage in the product i relative to the world. Figures 1-3 display the revealed comparative advantages of India and China in each of the one-digit HS groupings. • India, but not China, has some revealed comparative advantage (RCA) in agricultural
products (industries 0&1).
4 Given the nature of the index, trade would typically be more diversified for a finer classification than for broad industry groups. For example, at the one-digit level, India’s Herfindahl index is 0.13, or roughly five times larger than at the six-digit level.

- 4 -
• Neither China nor India has much RCA in beverages, fuels, and chemicals (industry 2), chems & pharmaceuticals (industry 3), hides & forest products (industry 4), and in articles of metal and transport vehicles (industry 8), although China has been growing fast toward the average in the latter category.
• India has RCA in metals (industry 7), while China has RCA in manufacturing of
instruments, arms, toys, and other products (industry 9). Textiles and clothing represent the area in which India and China have the predominant revealed comparative advantage (Figure 3). Even within this sector, there are areas of specialization. India has relatively higher comparative advantage in basic materials (industry 5), while China has a stronger comparative advantage in produced articles of clothing using textiles (industry 6). This pattern has been noted by other researchers. Shafaeddin (2003) points out that China and India compete in textiles and clothing, but only in limited items. India concentrates on exporting undergarments and miscellaneous textile items and China in outer-garments. India has gained comparative advantage in textiles and non-knitted undergarments, while China is strong in headgear and knitted undergarments. This pattern of specialization in textiles and clothing provides an opportunity for India to expand its trade with China. India is the world’s third largest cotton producer (after the U.S. and China) with 25 percent of the world cotton area and 15 percent of the world cotton output. India also ranks second in textile production (after China) and third in the production of filament yarn (Elbehri, Hertel and Martin 2003). Shafaeddin (2003) shows that China has been a growing importer of high-quality textiles—mainly from Japan and the newly industrialized economies—for the sale of clothing items in foreign markets. However, India has not been able to take advantage of this opportunity in part because India’s textile industry has operated under a variety of government-imposed restrictions such as export quotas on cotton and cotton yarn, and restrictions on firm size, labor utilization and importation of production materials (Elbehri, Hertel and Martin 2003). These policies have discouraged cotton exports and protected the domestic textile industry, which is the second largest employer after agriculture.
C. Index of trade competition
Although the Herfindahl index measures the degree of specialization in trade, it does not indicate whether two countries are specialized in the same or different products. We have constructed a new index based on Cerra (2004) that measures the extent to which two countries compete in world markets based on the similarity of the composition of their trade.
21
∑ −−= i
ki
ji
t
ssV
jis is the share of good i in country j’s exports. V measures the portion of trade of two
countries, j and k, that compete in world markets. If V is equal to zero, the two countries export entirely different goods. If V is equal to one, they export the same goods in identical shares of their total trade.
- 5 -
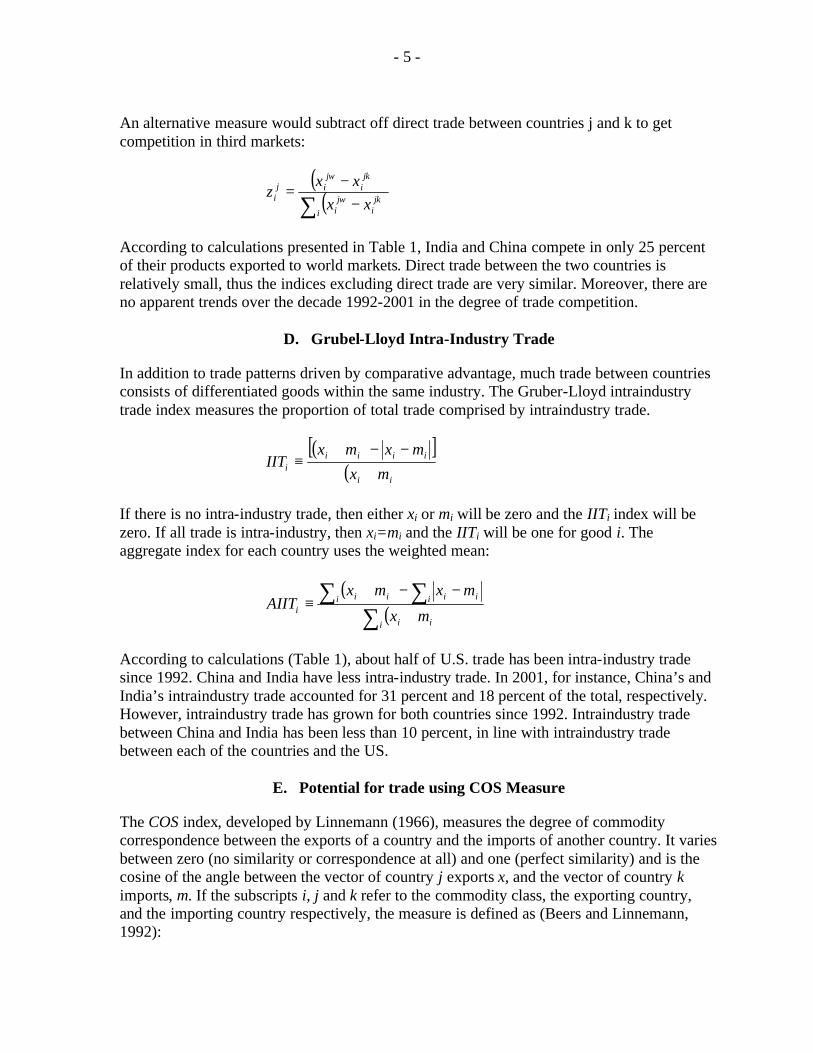
An alternative measure would subtract off direct trade between countries j and k to get competition in third markets:
( )( )∑ −
−=
ijk
ijw
i
jki
jwij
i xxxx
z
According to calculations presented in Table 1, India and China compete in only 25 percent of their products exported to world markets. Direct trade between the two countries is relatively small, thus the indices excluding direct trade are very similar. Moreover, there are no apparent trends over the decade 1992-2001 in the degree of trade competition.
D. Grubel-Lloyd Intra-Industry Trade
In addition to trade patterns driven by comparative advantage, much trade between countries consists of differentiated goods within the same industry. The Gruber-Lloyd intraindustry trade index measures the proportion of total trade comprised by intraindustry trade.
( )[ ]( )ii
iiiii mx
mxmxIIT
+
−−+≡
If there is no intra-industry trade, then either xi or mi will be zero and the IITi index will be zero. If all trade is intra-industry, then xi=mi and the IITi will be one for good i. The aggregate index for each country uses the weighted mean:
( )( )∑
∑∑+
−−+≡
i ii
i iii iii mx
mxmxAIIT
According to calculations (Table 1), about half of U.S. trade has been intra-industry trade since 1992. China and India have less intra-industry trade. In 2001, for instance, China’s and India’s intraindustry trade accounted for 31 percent and 18 percent of the total, respectively. However, intraindustry trade has grown for both countries since 1992. Intraindustry trade between China and India has been less than 10 percent, in line with intraindustry trade between each of the countries and the US.
E. Potential for trade using COS Measure
The COS index, developed by Linnemann (1966), measures the degree of commodity correspondence between the exports of a country and the imports of another country. It varies between zero (no similarity or correspondence at all) and one (perfect similarity) and is the cosine of the angle between the vector of country j exports x, and the vector of country k imports, m. If the subscripts i, j and k refer to the commodity class, the exporting country, and the importing country respectively, the measure is defined as (Beers and Linnemann, 1992):

- 6 -
∑ ∑
∑=
i iikij
iikij
ijkmx
mxCOS
22 .(
.
India’s potential to export articles of metal and transport vehicles (industry 8) has been growing. The other industry groups with the greatest potential for export are beverages, fuels, chemicals, and pharmaceuticals. In addition, there seems to be scope for India to import metals and transport vehicles, and other manufacturing goods (industry 9) from China.
IV. ECONOMETRIC ANALYSIS
China’s accession to the WTO represents a continuation of its integration into world trade. China’s trade has increased from about 10 percent of GDP in the early 1980s to 40 percent in the late 1990s (Adhikari and Yang, 2002). Chinese trade and foreign exchange systems have undergone several rounds of reform since 1978 (Cerra and Dayal-Gulati, 1999) and Chinese exports (especially the manufacturing exports) have become more market-oriented in the recent past (Cerra and Saxena, 2003). Therefore, an empirical examination of past liberalization may shed light on the degree of trade creation or trade diversion from India that may result as China gains greater market access as part of its WTO accesssion.
A. Methodology
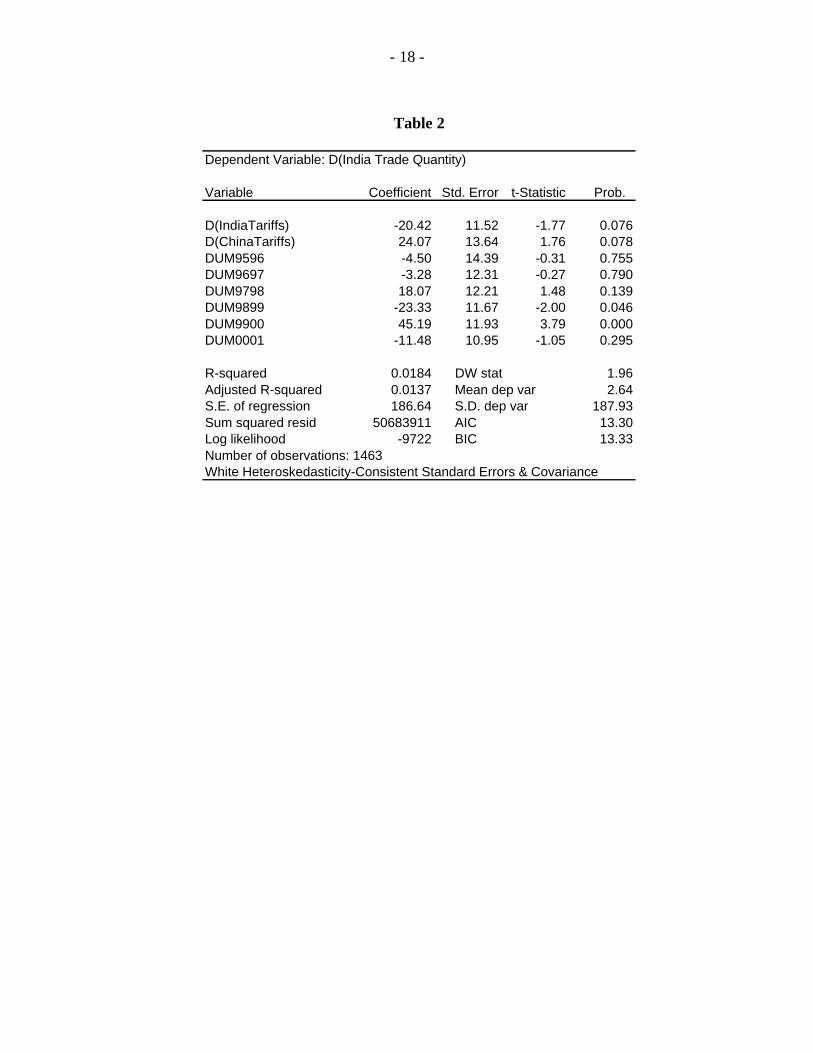
The econometric test estimates how changes in tariff rates on U.S. imports of Chinese and Indian goods impact the volume of Indian goods imported in the US. The equation is specified as follows:
Dt(Mi,US,India) = β1*Dt(Ti,US,India) + β2*Dt(Ti,US,China) + Σs(αsYs) + eit where M is the log of trade quantities, T is the tariff rate, and Y is a dummy common to all products within a time interval. Mi,US,India denotes the change in U.S. import quantities of good i from India; Ti,US,India denotes the change in U.S. tariffs on imports of Indian good i; and Ti,US,China denotes the change in U.S. tariffs on imports of Chinese good i. The main parameter of interest is β2. If β2>0, reductions in U.S. tariffs on Chinese goods divert trade from Indian goods. In addition, reductions in U.S. tariffs on imports from India are expected to increase the quantity of imports from India (β1<0).
B. Data
Import quantities are obtained from UN COMTRADE, and they are U.S. imports from India. U.S. is used as a proxy for world trade, and the U.S. is the largest trading partner of both

- 7 -
India and China.5 We used HS Combined at the subheading level (6-digits), because HS is the same classification system used for the tariff data. Tariff rates are from UN Conference on Trade and Development (UNCTAD), Trade Analysis Information System (TRAINS). The data spans 1995-2001, with 3886 product categories. However, zero tariff rates were suspect and these observations were discarded. After matching available sparse data on import quantities and tariffs, the number of total observations falls to 1463. This dataset is too unbalanced to permit estimating fixed effects in a panel regression. Therefore, the available data is stacked, with time dummies are included to identify the common constant for each time interval.
C. Econometric Results
We estimate the change in U.S. imports from India considering the influence of U.S. tariff changes on both Chinese and Indian goods. Estimation results are presented in Table 2. The coefficient estimates on changes in tariff rates are large in magnitude and significant at the 10 percent confidence level for both Indian and Chinese goods. Reductions in U.S. tariffs on Indian goods are associated with an expansion in the volume of U.S. imports from India, as theory would predict. The coefficient estimate on the change in U.S. import tariffs of Chinese goods (β2) is negative, suggesting that there is evidence of some trade diversion from India to China. The time dummies provide estimates of the average growth in import volumes over a pair of years. The R2 of the regression is fairly low, as is typically with many cross-sectional datasets. The gravity model is obviously not applicable since there is only one pair of countries in the trade volume regression.
V. GE MODEL SIMULATIONS
A. Methodology and Data
The general equilibrium model used for the analysis is derived from the Global Trade Analysis Project (GTAP), which is widely used for international trade policy analysis. We apply a modified version of the static model (Hertel and Tsigas, 1997) to an aggregation of the GTAP Data Base v. 5.4 (Dimaranan and McDougall, 2002), which combines detailed bilateral trade, transportation and protection data, and accounts for inter-regional linkages among economies and input/output data bases for inter-sectoral linkages within countries. The data base version used is the most recent available for global analysis.6 The model used herein assumes perfect competition and constant returns to scale technology.7 The database 5 We also experimented with data from the European Union; however, the available data did not display any variation between tariff changes on Chinese versus Indian goods. Thus, these variables were perfectly collinear.
6 Version 6.0 of the GTAP Data Base is expected to be released in September 2004. For more information, see www.gtap.com.

- 8 -
includes a fully specified record of trade transactions and duties among different regions for the commodities (Gehlhar et al. 1997). Following the work of Ianchovichina and Walmsley (2003), we employ a 10-region (China; Taiwan; India, Indonesia/Malaysia/Philippines; Rest of Asia; Central America and Caribbean, South America and Mexico; US; EU; and Rest of World) and 22-sector aggregation (food grains; feed grains; vegetables and fruits; oilseeds; sugar; plant fibers; livestock, meat and dairy; beverage and tobacco; other food; wood products; textiles; clothing; light manufacturing; processing industries; autos; electronics; other manufacturing; trade transportation; communications; commercial services; and other services) to conduct the scenarios.8
B. Scenarios
To evaluate the impact of China’s WTO commitments, we compare a baseline “no policy change” scenario to a full implementation of WTO commitments. Since we use the GTAP version 5 data base with a 1997 base year, the first step toward creating our baseline is to update the data base to 2002. The next step is to update relevant policy instruments, specifically the tariff rates for China in 2002 and create our baseline. Then, the updated database was used to conduct the simulation that implemented the commitments that China has agreed to execute for full WTO accession. In addition, the quota liberalizations expected from full implementation of the Agreement on Textiles and Clothing (ATC) are included.
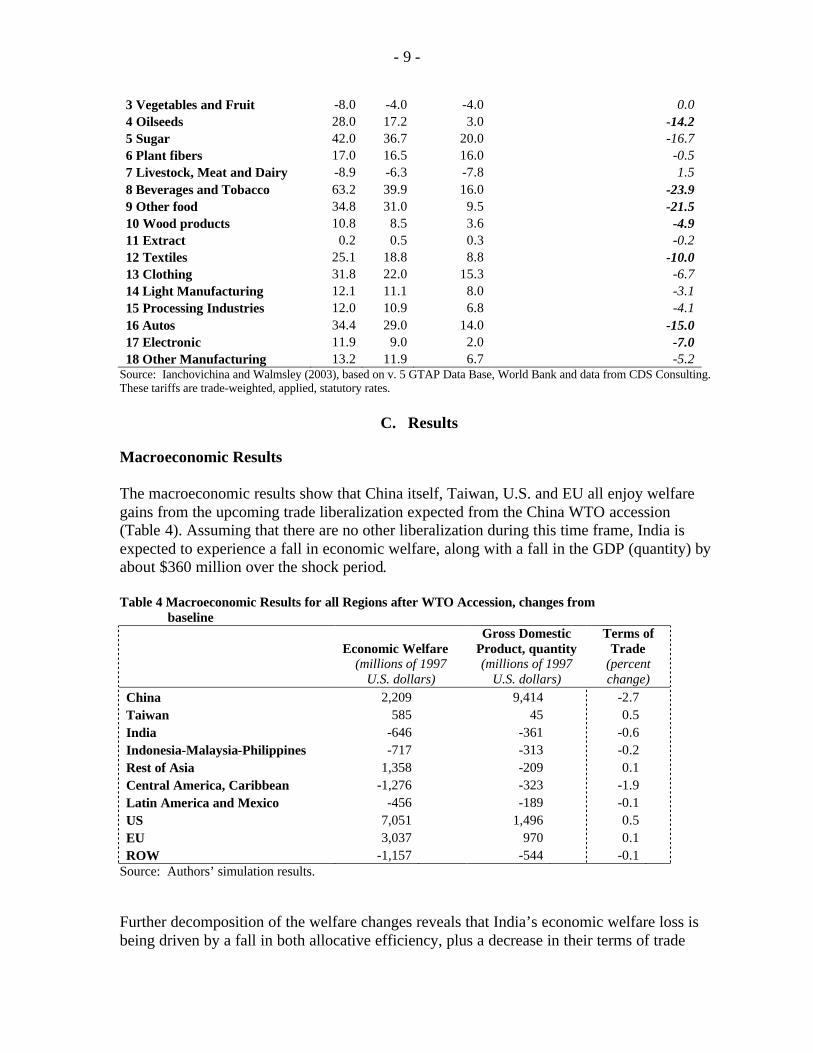
For further clarity, Table 3 illustrates how the model characterizes the protection in China for tradable goods. Over the next several years, large cuts in tariffs, especially in oilseeds, electronics, autos, other food and other manufacturing, are expected to have a huge impact for both the Chinese economy and its smaller regional trading partners. It is this final scenario that is the basis for our simulation. Table 3 China’s average Tariff rates at relevant intervals
Rate change over time frame 1997
2002
2007-2010 2002-2007/10
1 Food grains 10.6 7.6 7.6 0.0 2 Feed grains 28.0 32.0 32.0 0.0
7 Standard GTAP assumes that production and consumption decisions by each agent are made under the assumption that prices are not affected by that agent’s decision. But when these decisions are brought to the market place, they have price consequences. Prices are fixed at the individual household level and market supply and demand are sloping.
8 See Tables A1 and A2 in the appendix for the detailed concordance of sectors to aggregation.
- 9 -
3 Vegetables and Fruit -8.0 -4.0 -4.0 0.0 4 Oilseeds 28.0 17.2 3.0 -14.2 5 Sugar 42.0 36.7 20.0 -16.7 6 Plant fibers 17.0 16.5 16.0 -0.5 7 Livestock, Meat and Dairy -8.9 -6.3 -7.8 1.5 8 Beverages and Tobacco 63.2 39.9 16.0 -23.9 9 Other food 34.8 31.0 9.5 -21.5 10 Wood products 10.8 8.5 3.6 -4.9 11 Extract 0.2 0.5 0.3 -0.2 12 Textiles 25.1 18.8 8.8 -10.0 13 Clothing 31.8 22.0 15.3 -6.7 14 Light Manufacturing 12.1 11.1 8.0 -3.1 15 Processing Industries 12.0 10.9 6.8 -4.1 16 Autos 34.4 29.0 14.0 -15.0 17 Electronic 11.9 9.0 2.0 -7.0 18 Other Manufacturing 13.2 11.9 6.7 -5.2
Source: Ianchovichina and Walmsley (2003), based on v. 5 GTAP Data Base, World Bank and data from CDS Consulting. These tariffs are trade-weighted, applied, statutory rates.
C. Results
Macroeconomic Results The macroeconomic results show that China itself, Taiwan, U.S. and EU all enjoy welfare gains from the upcoming trade liberalization expected from the China WTO accession (Table 4). Assuming that there are no other liberalization during this time frame, India is expected to experience a fall in economic welfare, along with a fall in the GDP (quantity) by about $360 million over the shock period.
Table 4 Macroeconomic Results for all Regions after WTO Accession, changes from baseline
Economic Welfare Gross Domestic
Product, quantity Terms of
Trade
(millions of 1997
U.S. dollars) (millions of 1997
U.S. dollars) (percent change)
China 2,209 9,414 -2.7 Taiwan 585 45 0.5 India -646 -361 -0.6 Indonesia-Malaysia-Philippines -717 -313 -0.2 Rest of Asia 1,358 -209 0.1 Central America, Caribbean -1,276 -323 -1.9 Latin America and Mexico -456 -189 -0.1 US 7,051 1,496 0.5 EU 3,037 970 0.1 ROW -1,157 -544 -0.1
Source: Authors’ simulation results.
Further decomposition of the welfare changes reveals that India’s economic welfare loss is being driven by a fall in both allocative efficiency, plus a decrease in their terms of trade

- 10 -
(Table 5). At the sectoral level, India’s deterioration in economic welfare is being partially driven by the less favorable terms of trade in both their clothing and textile sectors (Table 6). Assuming that India does not undergo liberalization and currently has distortions, the negative allocative efficiency number indicates that the distortions are continuing to cause inefficiencies in their economy. Therefore, markets and hence resources are not moving to their most efficient allocation. The major importing regions – the U.S. and EU – gain most from the accession, with both enjoying more favorable terms of trade, motivated by the increase in terms of trade for the clothing sector. China is expected to enjoy a large increase in economic welfare, generated from significant allocative efficiency gains (Table 6). The positive allocative efficiency impact of almost $9.4 billion means that the Chinese economy realizes efficiency gains as it adjusts to world prices. The Chinese economy reallocates its resources to produce the goods that they have a comparative advantage in and import the goods that other regions are more efficient at producing. As China demands more imports and supplies, and increases its export production (textiles and clothing), the prices for Chinese exports decline and the price paid for imports into China increase: the Chinese terms of trade deteriorate, by an amount equivalent to about $7 billion.
Table 5 Welfare decomposition on all regions, millions of U.S. dollars
Region
Allocative Efficiency
effect
Terms of Trade effect
Investment- Saving price
effect Total China 9,387.3 -6,995.8 -182.2 2,209.3 Taiwan 44.7 693.7 -153.6 584.7 India -360.5 -296 10.4 -646.0 Indonesia-Malaysia-Philippine -313.1 -429 25.6 -716.6 Rest of Asia -208.9 1,465.3 101.4 1,357.8 Central America, Caribbean -321.2 -749.8 -205.1 -1276.1 Latin America and Mexico -188.9 -307.5 41 -455.5 U.S. 1,496.2 5,348.6 205.8 7,050.5 EU 969.8 2,008.3 58.8 3,036.8 ROW -544.1 -710.5 97.4 -1,157.2
Source: Authors’ simulation results The Investment-Savings (I-S) price effect examines the relative changes to the prices of investment and savings in an economy. Given that a large economy is liberalizing trade, regional investment-savings markets are expected to experience relative large price effects because incomes are changing, and so savings would change. At the same time, capital productivity is changing so investment would respond. The I-S price effect generally reinforces the terms of trade effect for most regions, as in this experiment. In the case of India, the I-S price effect is very small although positive, driven largely because investment is falling faster than savings. Since the magnitude of this effect is small, it shows that although there have been small changes in the relative prices of investment and savings, these price effects are dominated by that country’s terms of trade and allocative efficiency losses.

- 11 -
Meanwhile, the Rest of Asia region is expected to enjoy a welfare gain from the regime change, and a $5 billion dollar rise in its GDP. This composite region also experienced a favorable terms of trade change of all regions. Trade Under the WTO accession by China, India’s trade is expected to be transformed in two significant ways. First, China will likely demand less of India’s exports in several broad sectors: oilseeds, sugar, food and feed grains, and plant fibers, exports of which are expected to decline by up to 86 percent (see Elbehri, Hertel and Martin, 2003, for similar results). This change in Chinese demand for India’s exports is made up for by other increased opportunities to export in other regions (Table 7). For example, the percentage change in India’s oilseed exports is partially offset by India increasing oilseed exports to other developing regions including Indonesia-Malaysia- Philippines, Rest of Asia, and Latin America and Mexico. India’s exports in these sectors are expected to increase by about 2.5 percent over the experiment.
Second, a few regions are expected to expand their trade with India, demanding more of their exports. India is expected to export more autos, and light manufactured goods to other regions, especially to the EU, U.S., and Rest of World. Also, India is expected to increase its Chinese market share of beverages and tobacco, and increase its light manufacturing and process industries, as well as electronics exports to China. In some sectors, India is expected to successfully increase their market share and hence exports, such as in the light manufacturing, other manufacturing and electronics. Other Indian economic sectors, especially clothing, will be hurt by China’s WTO accession, as major importers such as the U.S. and EU buy more clothing from China. In this experiment, U.S. decreases its imports of Indian clothing by over 50 percent and the EU by over 11 percent. India is expected to increase its exports of both textiles and clothing to China. Although the percentage change numbers looks significant, the base level quantity numbers are very small: textiles will increase from 167.3 to 188.9 million units and clothing will increase from 12.9 to 20.1 million units. Relative to India’s overall trade numbers, the increase in clothing imports from India makes up slightly more than one percent of its change in exports over the experiment time frame.
After China’s liberalizations, India is expected to import less manufactured, raw and processed goods from most regions, and most sectors (Table 8). India will likely import less textiles and clothing from most of it trading partners, especially China (falling about 3 and 10 percent, respectively). Some interesting exceptions include imports from other developing regions including Central American and the Caribbean. Although the import growth rates from this region are largely positive and for clothing, light manufacturing and autos, the base level of imports for these regions were relatively small initially. In summary, the overall trade picture for India is expected to be somewhat discouraging on a sectoral basis, although overall it is more hopeful than many other studies suggest. Most sectors experience export growth, with the exceptions of textiles and clothing. Auto and light

- 12 -
manufacturing exports show the strongest growth, experiencing an increase in exports of over 6 percent. Balance of Trade Although examining the sectoral trade numbers might be discouraging, after China’s WTO liberalization, India’s balance of trade remains relatively unchanged, although it increases by a slim margin of under $150 million (Table 9). India is expected to export up to $400 million more other manufacturing, processed goods, and trade transport, and slightly more in several other sectors. However, if there is no change in India’s trade restrictions, it will import more clothing than it exports, which will remove the balance of trade gains from the increased exports in other sectors. For China, the large negative trade balance is being driven by it demanding more imports from every sector, save clothing. In that sector, it exports over $27 billion more than it imports; in every other sector, it is importing more than it exports, especially other manufacturing and other food. Table 9 Change in Trade Balance, millions of U.S. dollars Region Change in Trade Balance China -7,650 Taiwan 165 India 138 Indonesia-Malaysia- Philippines 87 Rest of Asia 657 Central America, Caribbean 1,504 Latin America and Mexico 700 U.S. 1,550 EU 1,221 ROW 1,629
Source: Authors’ simulation results
D. Limitations
Since this experiment was conducted using a static, rather than a dynamic model, one limitation is that the influence of growth over the experiment time frame is not considered. A dynamic model would enable us to understand the impact of growth from China’s WTO accession.9 Another limitation is that the concept of duty drawbacks are not explicitly modeled, thereby not included in this analysis. For China, duty drawbacks can represent an important revenue consideration and will be included in future experiments by the authors. Finally, the analysis may benefit from further regional disaggregation.
9 The authors intend to use the GTAP dynamic model when v. 6.0 of the GTAP Data Base is released later this year.

- 13 -
VI. CONCLUSIONS
The results of the econometric analysis provide some evidence that previous reductions in U.S. tariffs on Chinese imports have led to trade diversion from India. However, analysis of the countries’ relative trade structure also indicates that the extent of trade competition in third markets is only about 25 percent of products. Moreover, while both India and China have strong comparative advantages in textile exports, they specialize in different aspects of this broad industry group. As China expands its production and export of finished textile products, there is scope for direct trade of intermediate inputs from India to China. Several other sectors have also been identified that provide some opportunity for increasing direct trade between India and China. The results from the general equilibrium simulation model largely confirm most of these findings. India is likely to lose export shares in third markets, such as the U.S. and EU, particularly for textiles and clothing. Overall, India’s welfare is expected to decline somewhat, mainly due to loss of market share and a deterioration in terms of trade. However, the simulations also demonstrate that other sectors will likely expand to partially offset these declines.

- 14 -
China and India: RCA, 1992-2001
Source: UN COMTRADE
Industry 0: Animals and agriculture
0.0
0.5
1.0
1.5
2.0
2.5
3.0
1992 1994 1996 1998 2000
China India
Industry 1: Cereals, veg oils, and prepared foods
0.0
0.5
1.0
1.5
2.0
2.5
3.0
1992 1994 1996 1998 2000
China India
Industry 2: Beverages, fuels, and simple chemicals
0.0
0.2
0.4
0.6
0.8
1.0
1.2
1992 1994 1996 1998 2000
China India
Industry 3: Chemicals and pharmaceuticals
0.0
0.1
0.2
0.3
0.4
0.5
0.6
0.7
0.8
0.9
1.0
1992 1994 1996 1998 2000
China India

- 15 -
China and India: RCA, 1992-2001
Source: UN COMTRADE
Industry 4: Hides and forest products
0.0
0.2
0.4
0.6
0.8
1.0
1.2
1992 1994 1996 1998 2000
China India
Industry 7: Metals
0.0
0.5
1.0
1.5
2.0
2.5
3.0
3.5
1992 1994 1996 1998 2000
China India
Industry 8: Articles of metal and transport vehicles
0.0
0.1
0.2
0.3
0.4
0.5
0.6
0.7
0.8
0.9
1.0
1992 1994 1996 1998 2000
China India
Industry 9: Instruments, arms, toys, and other manufacturing
0.0
0.5
1.0
1.5
2.0
1992 1994 1996 1998 2000
China India
- 16 -
China and India: RCA, 1992-2001
Source: UN COMTRADE
Industry 5: Textiles and materials
0.0
1.0
2.0
3.0
4.0
5.0
1992 1993 1994 1995 1996 1997 1998 1999 2000 2001
China India
Industry 6: Clothing and textile products
0.0
1.0
2.0
3.0
4.0
5.0
6.0
1992 1993 1994 1995 1996 1997 1998 1999 2000 2001
China India

- 17 -
Table 1
1992 1993 1994 1995 1996 1997 1998 1999 2000 2001
India 0.028 0.032 0.029 0.028 0.021 0.021 0.028 0.036 0.026 0.025
China 0.004 0.004 0.003 0.003 0.003 0.003 0.003 0.003 0.004 0.004
United States 0.007 0.006 0.006 0.005 0.006 0.006 0.007 0.007 0.007 0.006
Total exports 0.244 0.251 0.247 0.250 0.248 0.241 0.239 0.242 0.248 0.251
Excluding direct trade 0.244 0.250 0.246 0.250 0.247 0.240 0.239 0.242 0.247 0.250
US with World 0.476 0.481 0.487 0.489 0.490 0.498 0.501 0.503 0.498 0.493
India with World 0.121 0.122 0.139 0.143 0.142 0.148 0.135 0.136 0.173 0.179
China with World 0.238 0.234 0.244 0.275 0.270 0.277 0.280 0.294 0.312 0.311
India with China 0.011 0.018 0.034 0.041 0.045 0.049 0.070 0.062 0.079 0.079
US with India 0.051 0.050 0.056 0.077 0.076 0.082 0.080 0.075 0.081 0.095
US with China 0.041 0.058 0.050 0.057 0.068 0.068 0.075 0.078 0.087 0.097
Total 0.397 0.366 0.241 0.273 0.252 0.199 0.118 0.089 0.169 0.121
Industry 0 0.019 0.020 0.043 0.034 0.021 0.024 0.031 0.021 0.020 0.027
Industry 1 0.019 0.075 0.271 0.253 0.093 0.064 0.059 0.026 0.009 0.006
Industry 2 0.797 0.872 0.671 0.708 0.630 0.622 0.542 0.424 0.727 0.433
Industry 3 0.064 0.075 0.143 0.164 0.106 0.139 0.130 0.108 0.234 0.244
Industry 4 0.032 0.031 0.026 0.045 0.022 0.027 0.028 0.026 0.034 0.034
Industry 5 0.288 0.169 0.210 0.143 0.153 0.161 0.176 0.293 0.295 0.155
Industry 6 0.009 0.011 0.010 0.016 0.016 0.027 0.055 0.062 0.069 0.095
Industry 7 0.023 0.032 0.049 0.057 0.051 0.036 0.033 0.037 0.057 0.062
Industry 8 0.266 0.116 0.221 0.309 0.300 0.472 0.542 0.547 0.643 0.682
Industry 9 0.035 0.036 0.060 0.063 0.069 0.072 0.083 0.102 0.112 0.130
Total 0.057 0.088 0.051 0.085 0.086 0.072 0.051 0.040 0.041 0.050
Industry 0 0.213 0.216 0.347 0.275 0.222 0.210 0.135 0.106 0.227 0.230
Industry 1 0.048 0.061 0.130 0.234 0.278 0.114 0.100 0.065 0.074 0.054
Industry 2 0.188 0.486 0.284 0.483 0.235 0.232 0.322 0.113 0.027 0.039
Industry 3 0.132 0.200 0.173 0.123 0.114 0.104 0.113 0.185 0.276 0.317
Industry 4 0.079 0.120 0.140 0.106 0.090 0.076 0.067 0.074 0.072 0.082
Industry 5 0.137 0.101 0.131 0.138 0.337 0.232 0.147 0.128 0.132 0.151
Industry 6 0.070 0.079 0.109 0.081 0.081 0.095 0.096 0.120 0.128 0.139
Industry 7 0.057 0.031 0.047 0.039 0.048 0.067 0.065 0.087 0.092 0.078
Industry 8 0.300 0.274 0.227 0.280 0.306 0.310 0.228 0.287 0.327 0.406
Industry 9 0.230 0.168 0.141 0.127 0.131 0.144 0.157 0.261 0.266 0.300
Gruber-Lloyd IIT Index
Herfindahl Index
Index of Trade Competition in Third Markets (China and India)
COS Measure for India's Exports
COS Measure for India's Imports
- 18 -
Table 2
Dependent Variable: D(India Trade Quantity)
Variable Coefficient Std. Error t-Statistic Prob.
D(IndiaTariffs) -20.42 11.52 -1.77 0.076D(ChinaTariffs) 24.07 13.64 1.76 0.078DUM9596 -4.50 14.39 -0.31 0.755DUM9697 -3.28 12.31 -0.27 0.790DUM9798 18.07 12.21 1.48 0.139DUM9899 -23.33 11.67 -2.00 0.046DUM9900 45.19 11.93 3.79 0.000DUM0001 -11.48 10.95 -1.05 0.295
R-squared 0.0184 DW stat 1.96Adjusted R-squared 0.0137 Mean dep var 2.64S.E. of regression 186.64 S.D. dep var 187.93Sum squared resid 50683911 AIC 13.30Log likelihood -9722 BIC 13.33Number of observations: 1463White Heteroskedasticity-Consistent Standard Errors & Covariance

- 19 -
Table 6 Terms of Trade Decomposition by Sector and Region, millions of 1997 U.S. dollars
Sector 1 China
2 Taiwan
3 India
4 Indo Malay Philipi
5 Rest of Asia
6 Cent Americ Caribb
7 Latin Ameri Mexico
8 U.S.
9 EU
10 ROW
1 Food grains 5 0 -7 -4 1 -2 -1 12 2 -2 2 Feed grains 4 -2 0 -3 -10 -1 -1 19 0 -3 3 Veggie Fruit 17 0 -4 -3 -11 -26 3 22 8 -4 4 Oilseeds -12 -6 -2 -3 -13 -2 -3 70 -17 -3 5 Sugar 3 0 -1 -1 3 -33 2 9 8 11 6 Plant fibers 12 -2 -11 -10 0 -32 -1 25 15 5 7 LivskMeaDair 16 2 -2 -1 -20 -5 -2 9 14 -11 8 Bever Tobacco 10 -2 0 -4 -8 -16 -1 3 25 -7 9 Other food -31 10 -17 -6 37 -32 2 19 31 -11 10 Wood prod 85 20 -3 -14 -20 -13 -9 -43 30 -38 11 Extract 202 1 -20 -27 -132 -30 -21 -68 -32 127
12 Textiles -1058 94 -35 -10 77 -39 1 587 308 65 13 Clothing -7336 11 -19 0 3 -67 21 5860 1403 148 14 Light Mnfg 161 12 -8 -5 -16 -14 -8 -75 -19 -30 15 Process Indus 201 103 -39 -60 86 -70 -43 -140 79 -130 16 Autos -9 1 -4 -17 256 -3 -26 -145 40 -87 17 Electronics -309 221 -5 -60 508 -9 -24 -178 -53 -73 18 Other Mnfg 599 139 -54 -105 323 -86 -98 -425 56 -342 19 Trade transpo 356 52 -40 -54 256 -164 -62 -160 -22 -192 20 Communicati 10 2 0 -1 9 -12 -3 -7 7 -5 21CommerServic 39 27 -20 -39 98 -62 -23 -28 98 -86 22 Other Service 39 12 -5 -4 39 -37 -10 -17 28 -43 Total -6996 694 -296 -429 1465 -750 -308 5349 2008 -711
Source: Authors’ simulation results.

- 20 -
Table 7 India’s change in quantity exports to all, percentage change
China Taiwan
Indo- Mal Philipp
Rest of Asia
Cen Am Caribb
Latin Am Mex U.S. EU ROW
Total 1
Foodgrains -35.4 3.4 2.9 3.2 0.9 3.4 3.1 2.8 2.6 2.6
Feedgrains -64.6 3.3 3.8 3.5 2.8 4.0 3.7 3.5 3.3 2.6
Veggie Fruit -16.3 4.2 2.3 3.8 1.6 3.4 2.7 2.8 2.6 2.5
Oilseeds -86.6 4.9 3.6 4.1 2.9 5.3 4.7 3.9 3.2 1.8
Sugar -46.2 3.9 2.4 2.4 -2.1 1.3 0.7 1.9 2.0 1.7
Plant fibers -30.9 8.0 0.5 3.7 -1.4 3.1 2.5 2.3 2.3 0.3
LivskMeatDair -1.9 5.6 2.5 3.6 -1.7 3.1 3.2 3.3 2.8 2.9
BeverTobacco 216.2 6.2 4.3 5.1 -2.9 3.6 3.6 4.3 3.6 3.4
Other food -23.3 3.4 2.0 2.8 -1.6 2.7 2.5 2.8 2.6 1.0
Wood prod 9.4 4.4 3.2 3.4 -1.8 2.3 2.6 2.8 2.6 2.8
Extract 2.0 4.4 3.5 3.4 2.0 2.3 2.5 2.6 2.7 2.9
Textiles 12.9 4.2 -4.3 2.3 -15.9 0.8 -9.7 -1.4 -1.5 -2.0
Clothing 55.7 7.6 2.1 6.6 -9.7 1.1 -56.5 -11.2 -1.3 -19.4
Light Mnfg 10.2 9.0 1.7 7.7 -0.9 5.5 6.8 5.9 5.3 6.1
Process Indus 9.1 3.6 2.1 2.5 -0.8 1.5 1.8 1.9 1.8 2.1
Autos 17.0 8.6 7.3 7.6 2.7 5.7 6.0 6.5 6.2 6.5
Electronics 12.3 1.5 2.9 2.6 -1.4 2.0 2.5 2.4 2.2 2.6
Other Mnfg 4.9 4.6 4.0 4.2 1.3 3.1 3.5 3.5 3.3 3.6
Trade transpo 6.1 4.0 2.3 2.9 -2.2 2.3 2.4 2.7 2.4 2.8
Communicatio 6.6 2.9 2.2 3.0 -3.4 2.3 2.5 2.7 2.4 2.7
CommServices 5.7 3.7 2.0 2.8 -3.1 2.0 2.2 2.4 2.2 2.3
Other Service 7.5 4.3 2.1 3.1 -4.5 2.2 2.5 2.7 2.3 2.7 1 This percentage change number was calculated from total levels simulations results data, not a summation of the corresponding percentage changes. For simulation results on levels, please contact the authors. Source: Authors’ simulation results.

- 21 -
Table 8 India’s change in quantity imports to all, percentage change
China Taiwan
Indo- Mal Philipp
Rest of Asia
Cen Am Caribb
Latin Am Mex U.S. EU ROW
Total 1
Foodgrains -8.3 -4.1 -0.6 -2.6 6.2 -1.3 -2 -1.7 -1.3 -1.4
Feedgrains -5.0 -3.8 -1.1 -2.3 4.2 -1.6 -2.1 -1.7 -1.7 0
Veggie Fruit -7.0 -3.7 -0.9 -2.5 4.6 -1.4 -2 -1.7 -1.3 -1.4
Oilseeds 5.9 -4.4 -1.8 -2.8 3.3 -2.7 -4.6 -2.3 -1.7 0
Sugar -6.5 -4.6 -0.9 -2.3 8.0 -1.2 -1.4 -1.8 -1.3 -1.4
Plant fibers -5.5 -2.0 0.7 -2.3 3.8 -1.2 -2 -1.6 -1.3 -1.8
LivskMeatDair -4.2 -4.5 -0.9 -2.7 7.8 -1.4 -1.8 -2.0 -1.5 -1.5
BeverTobacco -9.0 -5.7 -0.9 -3.3 14.7 -1.2 -1.7 -2.2 -1.5 -1.9
Other food 1.8 -3.8 -1.0 -2.4 6.9 -1.2 -1.5 -1.8 -1.3 -1.2
Wood prod -7.6 -3.9 -0.7 -2.2 9.2 -0.6 -0.9 -1.4 -0.9 -1.1
Extract -8.4 -3.6 -0.3 -1.6 9.0 0.2 -0.1 -0.6 -0.3 -0.5
Textiles -2.7 -5.6 -2.8 -4.0 6.6 -2.6 -2 -2.5 -2.7 -3.2
Clothing -10.1 -12.6 -7.2 -9.6 11.8 -6.6 4.5 -6.4 -6.8 -6.7
Light Mnfg -6.4 -4.2 1.3 -1.7 17.3 1.3 0.6 -0.1 0.9 -0.2
Process Indus -4.7 -2.5 0 -1.1 6.5 0.3 0 -0.4 -0.1 -0.5
Autos -4.7 -7.7 -1.6 -4.6 11.3 -1.2 -1.6 -2.7 -1.9 -3.3
Electronics 3.8 -2.6 0.1 -1.3 9.9 0.4 0.1 -0.4 0 -0.6
Other Mnfg -7.0 -4.4 -0.6 -2.3 10.5 -0.1 -0.5 -1.2 -0.5 -1.3
Trade transpo -8.2 -3.7 -0.1 -1.8 9.6 -0.2 -0.5 -1.0 -0.5 -1.2
Communicatio -9.1 -3.8 -0.1 -1.8 12.3 -0.2 -0.6 -1.1 -0.5 -0.8
CommServices -8.7 -3.6 0.1 -1.6 12.2 0.1 -0.4 -0.8 -0.3 -0.6
Other Service -9.0 -4.3 -0.7 -2.3 9.8 -0.7 .0 -1.5 -1.0 -1.3 1 This percentage change number was calculated from total levels simulation results data, not a summation of the corresponding percentage changes. For simulation results on levels, please contact the authors. Source: Authors’ simulation results.

- 22 -
Bibliography: Adhikari, Ramesh and Yongzheng Yang, 2002, “What will WTO Membership Mean for
China and Its Trading Partners?” Finance and Development, 39(3), 22-25. Agarwal, Pradeep and Pravakar Sahoo, 2003, “China’s Accession to WTO: Implications for
China and India,” Economic and Political Weekly, June 21, 2544-2551. Bajona, Claustre and Tianshu Chu, 2002, “Economic effects of liberalization: The Case of
China’s Accession to the World Trade Organization,” Paper presented at the Hong Kong Conference in November 2002.
Cerra, Valerie, 2004, “A New Measure of Trade Competition in Third Country Markets,” unpublished manuscript, (Washington: International Monetary Fund).
______ and Anuradha Dayal-Gulati, 1999, “China’s Trade Flows: Changing Price Sensitivities and the Reform Process,” IMF Working Paper 99/1, (Washington: International Monetary Fund).
Cerra, Valerie and Sweta C. Saxena, 2003, “How Responsive is Chinese Export Supply to Market Signals?” China Economic Review, 14(3), 350-70.
Dimaranan, B.V. and R.A. McDougall, 2002, “Global Trade Assistance and Production: The GTAP Data Base,” Center for Global Trade Analysis, Purdue University.
Elbehri, Aziz, Thomas Hertel and Will Martin, 2003, “Estimating the Impact of WTO and Domestic Reforms on the Indian Cotton and Textile Sectors: a General-Equilibrium Approach,” Review of Development Economics, 7(3), 343-59.
Elbehri, Aziz, Thomas Hertel and Will Martin, 2003, “Estimating the Impact of WTO and Domestic Reforms on the Indian Cotton and Textile Sectors: a General-Equilibrium Approach,” Review of Development Economics, 7(3), 343-59.
Gehlhar, Mark, 1997, “Historical analysis of growth and trade pattern in the Pacific Rim: An evaluation of the GTAP framework, in T.W. Hertel, ed., Global Trade Analysis: Modeling and Applications, Cambridge University Press.
Hertel, T.W., 1997, Global Trade Analysis: Modeling and Applications, Cambridge University Press.
Huang, Jikun, Scott Rozelle and Linxiu Zhang, 2001, “WTO and agriculture: radical reforms or the continuation of gradual transition,” China Economic Review, 11(4), pp. 397-401.
Ianchovicina, E. and E. Martin, 2003, “Economic Impacts of China’s Accession to the WTO” World Bank Policy Research Working Paper 3053.
Li, Jie, Larry D. Qiu and Qunyan Sun, 2002, “Interregional Protection in China: Implications of Tax Reform and Trade Liberalization,” Paper presented at the Hong Kong Conference in November 2002.
Lin, Justin Yifu, 2001, “WTO accession and China's agriculture,” China Economic Review, 11(4), pp. 405-408.
Panchmukhi, V.R., 1997, “Quantitative Methods and their Applications in International Economics,” in K.L. Krishna, ed., Econometric Applications in India, Oxford University Press, New Delhi.
Rumbaugh, Thomas, and Nicolas Blancher, 2004, “China: International Trade and WTO Accession,” IMF Working Paper 04/36, (Washington: International Monetary Fund).
Shafaeddin, S.M., 2003, “Is China’s accession to the WTO threatening exports of developing countries?” China Economic Review.

- 23 -
WTO, 2001, “WTO successfully concludes negotiations on China’s entry,” September 17, 2001, http://www.wto.org/english/news_e/pres01_e/pr243_e.htm
Yeats, Alexander, 1984, “China’s Recent Export Performance: Some Basic Features and Policy Implications,” Development and Change, Vol. 15, 1-22.
_______, 1992, “What do Alternative Measures of Comparative Advantage Reveal about the Composition of Developing Countries’ Exports?” The Indian Economic Review, Vol. 27(2), 139-54.
Yu, Wusheng and Soren E. Frandsen, 2002, “China’s WTO Commitments in Agriculture: Does the Impact Depend on OECD Agricultural Policies?” Presented at the 5th Annual Conference on Global Economic Analysis, June 5-7. www.gtap.org.

- 24 -
Table A1. Regional Aggregation Corresponding GTAP Regions used in CGE Experiment
1 China China 2 Taiwan Taiwan
3 India India
4 Indo-Malay-Philippines
Indonesia; Malaysia; Philippines
5 Rest of Asia Hong Kong, Korea, Singapore, Thailand, Vietnam, Sri Lanka; Rest of South Asia, Bangladesh
6 Central America and Caribbean
Central America and the Caribbean
7 Latin America and Mexico
Colombia; Peru; Venezuela; Rest of Andean Pact; Argentina; Brazil; Chile; Uruguay; Rest of South America; Mexico
8 U.S. United States
9 EU-15 Austria; Belgium; Denmark; Finland; France; Germany; UK; Greece; Ireland; Italy; Luxembourg; Netherlands; Portugal; Spain; Sweden
10 Rest of World Australia; New Zealand; Canada; Switzerland; Rest of EFTA; Hungary; Poland; Rest of Albania; Bulgaria; Croatia; Czech Republic; Hungary; Malta; Romania; Slovakia; Slovenia; Lithuania; Russian Federation; Rest of Former Soviet Union; Japan; Cyprus; Turkey; Rest of Middle East; Morocco; Botswana; Uganda; Rest of SSA; Malawi; Mozambique; Tanzania; Zambia; Zimbabwe; Other Southern Africa; Rest of Southern Africa Customs Union, Rest of North Africa, Rest of the World.
Source: Authors’ aggregations from GTAP data base
Table A2. Sector Aggregation
Sector Corresponding GTAP sector
1 Food grains Patty rice
2 Feed grains Wheat
3 Veggie Fruit Cereal grains, n.e.c.
4 Oilseeds Oilseeds
5 Sugar Sugar cane, sugar beat
6 Plant Fibers Crops n.e.c.
7 Livsk-Meat- Dairy Bovine cattle, sheep and goats, horses; animal products n.e.c.; raw milk; wool, silk-worm cocoons; bovine meat products; meat products n.e.c.; dairy products
8 Wood Products Forestry
9 Other Food Fishing; vegetable oils and fats;
10 Extract Coal; oil; gas; minerals n.e.c.;
11 Beverage- Tobacco Beverages and tobacco products
12 Textiles Textiles
13 Clothing Wearing apparel
14 Light Mnfg Leather products
15 Processing Petroleum, coal products
16 Autos Motor vehicles and parts
17 Other Mnfg Machinery and equipment n.e.c.; manufactures n.e.c.
18 Electronics Electronic equipment
19 Other Services Electricity; gas manufacture, distribution; water; construction;
20 Trade Transport Trade; transport nec; water transport; air transport;
21 CommerServices Communication; financial services nec; insurance; business services nec;
22 Other Services Recreational and other services; public administration, defense, education, health; dwellings. Source: Authors’ aggregations from GTAP data base