crowdsourcing bikeshare transit planning: an empirical investigation … · crowdsourcing bikeshare...
TRANSCRIPT
Crowdsourcing Bikeshare Transit Planning: An Empirical
Investigation of Washington D.C. and New York City
Joseph OwenUniversity of [email protected]
Cy NeitaUniversity of [email protected]
Jon FroehlichUniversity of Maryland
1 Abstract
Enabled by the increasingly low cost of computers and Internet connectivity, a new form of eco-friendlypublic transportation has emerged: automated bikeshare programs, where users “check out” or “check in”bicycles automatically using a membership identifier (e.g., RFID dongle). The first contemporary systembegan in Lyon, France in 2005, and bikeshare systems are available in over 712 cities worldwide as of June2014 [17]. Despite this success, bikeshare operators and city transit planners continue to face two interrelatedchallenges: determining (i) where to strategically place stations in a city and with what docking capacity,and (ii) how to load balance the system to achieve the optimal distribution of bicycles and free docking slotsat stations throughout the day.
To better understand expected demand for bikeshare services, some transportation planners are turningto Internet-mediated crowdsourcing where citizens can vote and comment on potential station placementbefore deployment. While this approach allows for large-scale and diverse input from citizens, it has notbeen fully empirically evaluated. We provide an analysis of two crowdsourced bikeshare planning efforts:14,336 votes in Washington D.C. (Capital Bikeshare) across 4,405 user-suggested stations and 65,075 votesin New York City (Citi Bike) across 10,086 user-suggested stations. We analyze the correspondence betweencrowdsourced vote data, actual station size and placement by the operator, and actual station usage, aswell as looking at temporal patterns of bicycle usage across both cities. Our preliminary findings suggestthat there appears to be a moderate correlation between crowdsourced suggestions and station usage, anda smaller but still generally present correlation between station size and station usage. Our results haveimplications for the design of future transit planning approaches and citizen crowdsourcing decision makingsystems.
2 Introduction
Bikesharing is a unique form of public transportation that has existed since 1965, but has relativelyrecently entered a new age. We are currently in the third generation of bikesharing programs, which ischaracterized primarily by an increased use of technology to improve the accessibility of the systems [10].The increased technological element to these systems also enables a level of analysis not previously possible.
Two such third generation programs, Capital Bikeshare and Citi Bike, began operations in 2008 [1] and2013 [2], respectively. Both are operated by Motivate, previously known as Alta Bicycle Share [3]. For bothbicycle share systems, crowdsourced input from the public was collected at some point during the lifetimeof the project. For Citi Bike, this input was invited between September 2011 and April 2012, before any
This paper was written to fulfill the Scholarly Paper requirement in the UMD CS MS Comps program. It was completedMay 2015.
1
stations were created [16]. Capital Bikeshare, on the other hand, did not invite suggestions on such a scaleuntil 2011, significantly after they began operations [4], and the crowdsourcing map is still available for usersto suggest stations [5].
In spite of these differences, both systems provide a great opportunity to look at the effect crowdsourcinghas on the direction taken by the operator. The combination of the crowdsourced data, the actual stationlocation data, and station usage data provides us with the ability to understand how heavily the population’srequests were considered. It also helps us to understand how much the population knows what it needs, aswell as whether the operator knows best.
Separate from the role of the crowdsourcing process, the existence of these systems allows for moregranular analysis of movement patterns in their cities. The analysis benefits from bikeshare systems havingcertain properties: there are many stations spread out fairly evenly around the city, and “routes” are entirelydetermined by the users. This is unlike a metro system, for example, where there is not a direct route betweenevery pair of stations. If someone is trying to get between two points using bikeshare, they will very likelyget on at the closest station to their source, and off at the closest station to their destination, unless theirideal start station is empty or their ideal end station is full. Another advantage is that we can see exactnumbers of people leaving from and arriving at stations. Each bike is guaranteed to be carrying one andonly one person, so the data is fully granular.
3 Related Work
The availability of rich data from bikeshare systems and from crowdsourcing implementations all over theworld has unsurprisingly resulted in different analyses from different angles by many groups and individuals.
Many researchers have looked at how crowdsourcing fits into urban planning and transportation decisions,particularly with the technology we now have access to. Brabham et al. discuss crowdsourcing methodsapplied by the Federal Transit Administration to bus stop design at the neighborhood scale [8]. Brabhamalso looks into crowdsourcing as it is used to help urban planners [7]. Evans-Cowley presents a case studyin which crowdsourcing was used to solve planning problems [11]. These papers are more focused on thebenefits—and to a lesser extent the limitations—of crowdsourcing, and discuss proposals for leveraging itto a greater extent in various contexts. However, they demonstrate the importance of crowdsourcing as anemerging strategy, and reinforce the importance of analyzing its use and its usefulness.
Other researchers have started to use transportation data to gain insights into the populations that usepublic transportation and the locations in which they exist. Neumann et al. discuss methods for detectingoccurrences of specific events, using just communication and transportation data. Specifically, they use datafrom cell phone towers and shared bicycle rentals in Barcelona to detect rainy days, holidays, and days withspecial events [15]. Somewhat similarly, but approaching from the other direction, Mahmoud et al. look atthe effects of weather, socio-demographic characteristics, land use, built environment, and levels of serviceattributes on ridership in Toronto’s bikeshare system [14].
There are also examples of predicting trends using available bikeshare data. Kaltenbrunner et al. use datafrom Barcelona’s bikesharing program to detect temporal and geographic mobility patterns. They calculateactivity cycles and produce distinctive patterns for working days and weekends, as well as how the bikesflow to and away from stations geographically. They discuss how this information could be used to predictactivity and guide future expansion [13]. Froehlich et al. also uncover temporal and spatiotemporal patternsin Barcelona’s bikeshare system. They present a prediction system with 80% accuracy up to two hours inthe future, demonstrating the strength of models produced from these patterns [12].
A particularly data-driven example of analysis comes from Borgnat et al., who uncover patterns in Lyon’sbikesharing system by analyzing it as a complex network [6]. Vogel et al. use data mining to gather largeamounts of data from Vienna’s bikesharing system, and uncover spatiotemporal patterns and relationshipsbetween station placement and usage [18]. Daddio provides an extensive empirical analysis of usage datafrom Capital Bikeshare in October 2011. He attempts to determine the association between ridership andvarious environmental and socioeconomic factors, provide recommendations for expanding the system, anddevelop a replicable framework for analyzing bikeshare data in various systems [9].
2
4 Data
The data used in this investigation is comprised mostly of three datasets. Each of these datasets isseparated between Citi Bike data and Capital Bikeshare data, but because there are roughly analogous setsfor each, we will discuss them together.
4.1 Existing Stations
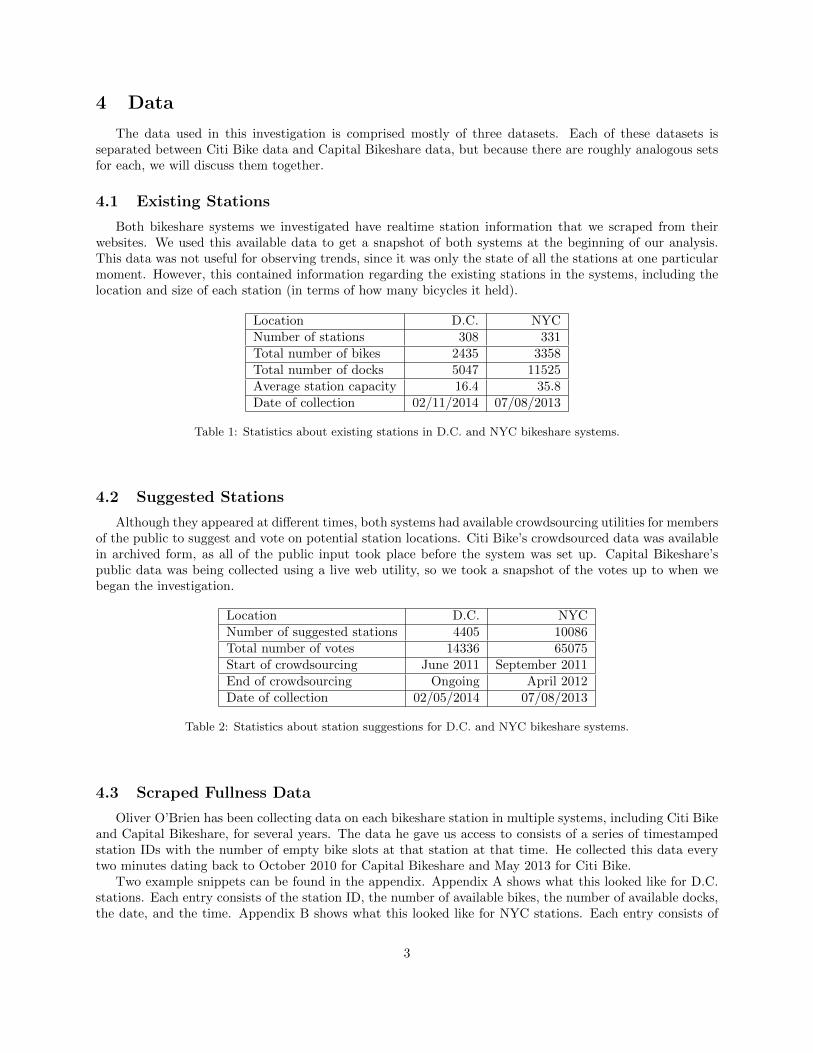
Both bikeshare systems we investigated have realtime station information that we scraped from theirwebsites. We used this available data to get a snapshot of both systems at the beginning of our analysis.This data was not useful for observing trends, since it was only the state of all the stations at one particularmoment. However, this contained information regarding the existing stations in the systems, including thelocation and size of each station (in terms of how many bicycles it held).
Location D.C. NYCNumber of stations 308 331Total number of bikes 2435 3358Total number of docks 5047 11525Average station capacity 16.4 35.8Date of collection 02/11/2014 07/08/2013
Table 1: Statistics about existing stations in D.C. and NYC bikeshare systems.
4.2 Suggested Stations
Although they appeared at different times, both systems had available crowdsourcing utilities for membersof the public to suggest and vote on potential station locations. Citi Bike’s crowdsourced data was availablein archived form, as all of the public input took place before the system was set up. Capital Bikeshare’spublic data was being collected using a live web utility, so we took a snapshot of the votes up to when webegan the investigation.
Location D.C. NYCNumber of suggested stations 4405 10086Total number of votes 14336 65075Start of crowdsourcing June 2011 September 2011End of crowdsourcing Ongoing April 2012Date of collection 02/05/2014 07/08/2013
Table 2: Statistics about station suggestions for D.C. and NYC bikeshare systems.
4.3 Scraped Fullness Data
Oliver O’Brien has been collecting data on each bikeshare station in multiple systems, including Citi Bikeand Capital Bikeshare, for several years. The data he gave us access to consists of a series of timestampedstation IDs with the number of empty bike slots at that station at that time. He collected this data everytwo minutes dating back to October 2010 for Capital Bikeshare and May 2013 for Citi Bike.
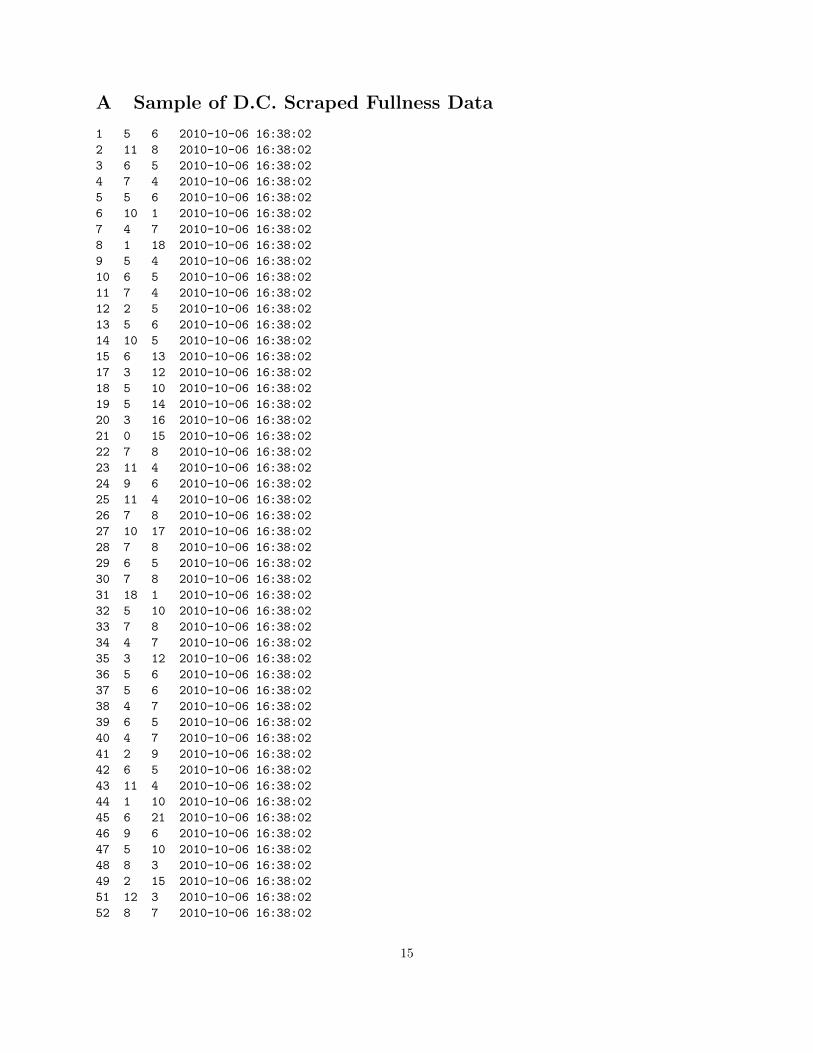
Two example snippets can be found in the appendix. Appendix A shows what this looked like for D.C.stations. Each entry consists of the station ID, the number of available bikes, the number of available docks,the date, and the time. Appendix B shows what this looked like for NYC stations. Each entry consists of
3
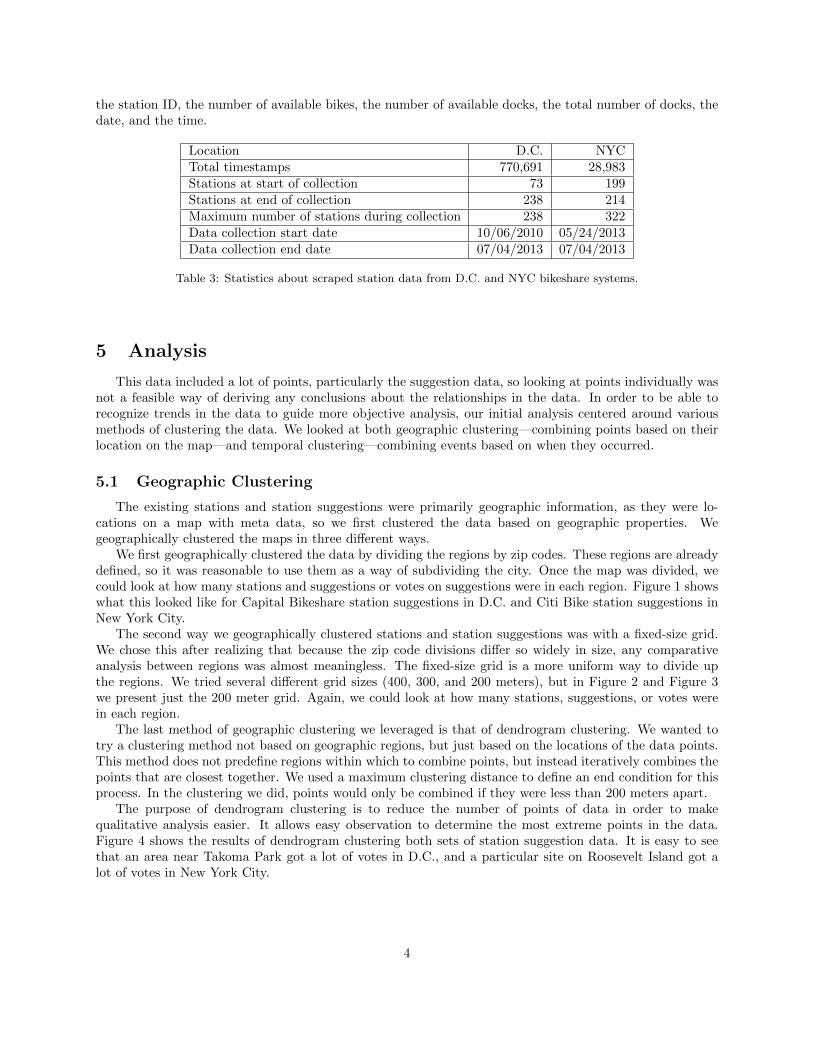
the station ID, the number of available bikes, the number of available docks, the total number of docks, thedate, and the time.
Location D.C. NYCTotal timestamps 770,691 28,983Stations at start of collection 73 199Stations at end of collection 238 214Maximum number of stations during collection 238 322Data collection start date 10/06/2010 05/24/2013Data collection end date 07/04/2013 07/04/2013
Table 3: Statistics about scraped station data from D.C. and NYC bikeshare systems.
5 Analysis
This data included a lot of points, particularly the suggestion data, so looking at points individually wasnot a feasible way of deriving any conclusions about the relationships in the data. In order to be able torecognize trends in the data to guide more objective analysis, our initial analysis centered around variousmethods of clustering the data. We looked at both geographic clustering—combining points based on theirlocation on the map—and temporal clustering—combining events based on when they occurred.
5.1 Geographic Clustering
The existing stations and station suggestions were primarily geographic information, as they were lo-cations on a map with meta data, so we first clustered the data based on geographic properties. Wegeographically clustered the maps in three different ways.
We first geographically clustered the data by dividing the regions by zip codes. These regions are alreadydefined, so it was reasonable to use them as a way of subdividing the city. Once the map was divided, wecould look at how many stations and suggestions or votes on suggestions were in each region. Figure 1 showswhat this looked like for Capital Bikeshare station suggestions in D.C. and Citi Bike station suggestions inNew York City.
The second way we geographically clustered stations and station suggestions was with a fixed-size grid.We chose this after realizing that because the zip code divisions differ so widely in size, any comparativeanalysis between regions was almost meaningless. The fixed-size grid is a more uniform way to divide upthe regions. We tried several different grid sizes (400, 300, and 200 meters), but in Figure 2 and Figure 3we present just the 200 meter grid. Again, we could look at how many stations, suggestions, or votes werein each region.
The last method of geographic clustering we leveraged is that of dendrogram clustering. We wanted totry a clustering method not based on geographic regions, but just based on the locations of the data points.This method does not predefine regions within which to combine points, but instead iteratively combines thepoints that are closest together. We used a maximum clustering distance to define an end condition for thisprocess. In the clustering we did, points would only be combined if they were less than 200 meters apart.
The purpose of dendrogram clustering is to reduce the number of points of data in order to makequalitative analysis easier. It allows easy observation to determine the most extreme points in the data.Figure 4 shows the results of dendrogram clustering both sets of station suggestion data. It is easy to seethat an area near Takoma Park got a lot of votes in D.C., and a particular site on Roosevelt Island got alot of votes in New York City.
4

Figure 1: We divided votes for suggested stations by zip code regions and shaded the regions by the number ofvotes contained in them, in order to get a sense of the relative concentrations of votes. We shaded D.C. regions (left)linearly and NYC regions (right) logarithmically by number of suggested stations as we found these scales more easilyrepresent the ranges of values in each city.
Figure 2: We then divided D.C. into 200 meter grid regions, and shaded these regions logarithmically by the numberof votes in them (left) and linearly by the number of actual stations (right). This allowed for an easier comparisonof where stations and station suggestions lie in the city.
5.2 Correlations
In order to determine if people used stations near where they requested them, and whether the operatorprioritized building stations that ended up being used, we needed to look at correlations between usage oractivity metrics and how large or requested each station was. The scraped fullness data we had access toallowed for a quantitative measure of the activity of a given station or set of stations. We look at this activitywith three slightly different activity metrics, which will be discussed in detail later. We plotted each activitymetric against two simpler metrics: the station size, which is the total number of bike docks available atthe station, and the request value, which is a quantitative measure of the extent to which the station wasrequested by station suggestion votes. The request value was calculated by totaling up a score of all nearby
5
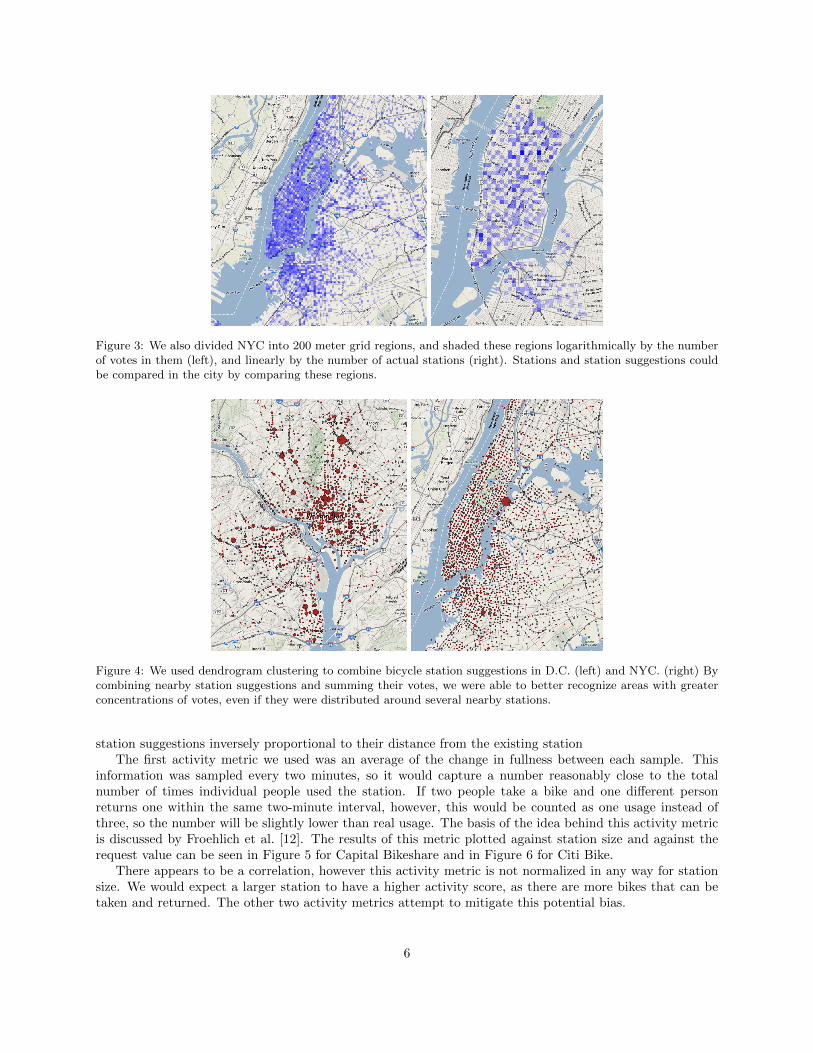
Figure 3: We also divided NYC into 200 meter grid regions, and shaded these regions logarithmically by the numberof votes in them (left), and linearly by the number of actual stations (right). Stations and station suggestions couldbe compared in the city by comparing these regions.
Figure 4: We used dendrogram clustering to combine bicycle station suggestions in D.C. (left) and NYC. (right) Bycombining nearby station suggestions and summing their votes, we were able to better recognize areas with greaterconcentrations of votes, even if they were distributed around several nearby stations.
station suggestions inversely proportional to their distance from the existing stationThe first activity metric we used was an average of the change in fullness between each sample. This
information was sampled every two minutes, so it would capture a number reasonably close to the totalnumber of times individual people used the station. If two people take a bike and one different personreturns one within the same two-minute interval, however, this would be counted as one usage instead ofthree, so the number will be slightly lower than real usage. The basis of the idea behind this activity metricis discussed by Froehlich et al. [12]. The results of this metric plotted against station size and against therequest value can be seen in Figure 5 for Capital Bikeshare and in Figure 6 for Citi Bike.
There appears to be a correlation, however this activity metric is not normalized in any way for stationsize. We would expect a larger station to have a higher activity score, as there are more bikes that can betaken and returned. The other two activity metrics attempt to mitigate this potential bias.
6

Figure 5: Station size and request value versus average total change for Capital Bikeshare stations. Both have somecorrelation, but the correlation with request value seems to be stronger than the correlation with station size.
Figure 6: Station size and request value versus average total change for Citi Bike stations. Neither correlation isespecially strong, but the correlation with request value is stronger than the correlation with station size.
The next metric we used was a Boolean metric for whether or not the fullness of the station changed atall between two samples, represented as a 1 or a 0, averaged over every sample. Because this informationwas sampled every two minutes, it seems reasonable to believe this would capture most of the times thatthe station was used, but not consider events such as a group taking several bikes at the same time as beingany different from a single person taking just one. This metric would miss occasions in which someone takesa bike just after one is returned, or returns one just after one is taken, but as long as the number of bikesat the station changes at all between samples, it counts towards the total. This weakens the power of largestations, as even if, for example, eight bikes are taken from a large station, it is considered just as much ofa change as if one bike is taken from a small station. The results of this metric plotted against station sizeand against the request value can be seen in Figure 7 for Capital Bikeshare and in Figure 8 for Citi Bike.
Somewhat surprisingly, this has almost no impact on any of the correlations. This probably means thatenough of the changes between samples were just chances of one bicycle being taken or returned that theBoolean metric and total metric measure almost the same thing.
The last activity metric treated the change between each sample as a percentage. Between each sample,the absolute value of the change in the number of bicycles was recorded as a percentage of the total numberof docks at the station, and then these values were averaged. The results of this metric, again plotted againststation size and against the request value, can be seen in Figure 9 for Capital Bikeshare and in Figure 10for Citi Bike.
This had a noticeable negative impact on the correlations between station size and activity. This makessense, as it is harder for big stations to have a significant percentage of their bikes used. More bikes wouldneed to be used for the same change percentage as just one bike use would have on smaller stations. Thenegative relationship in NYC, however, does imply that perhaps in some cases the big stations are larger
7
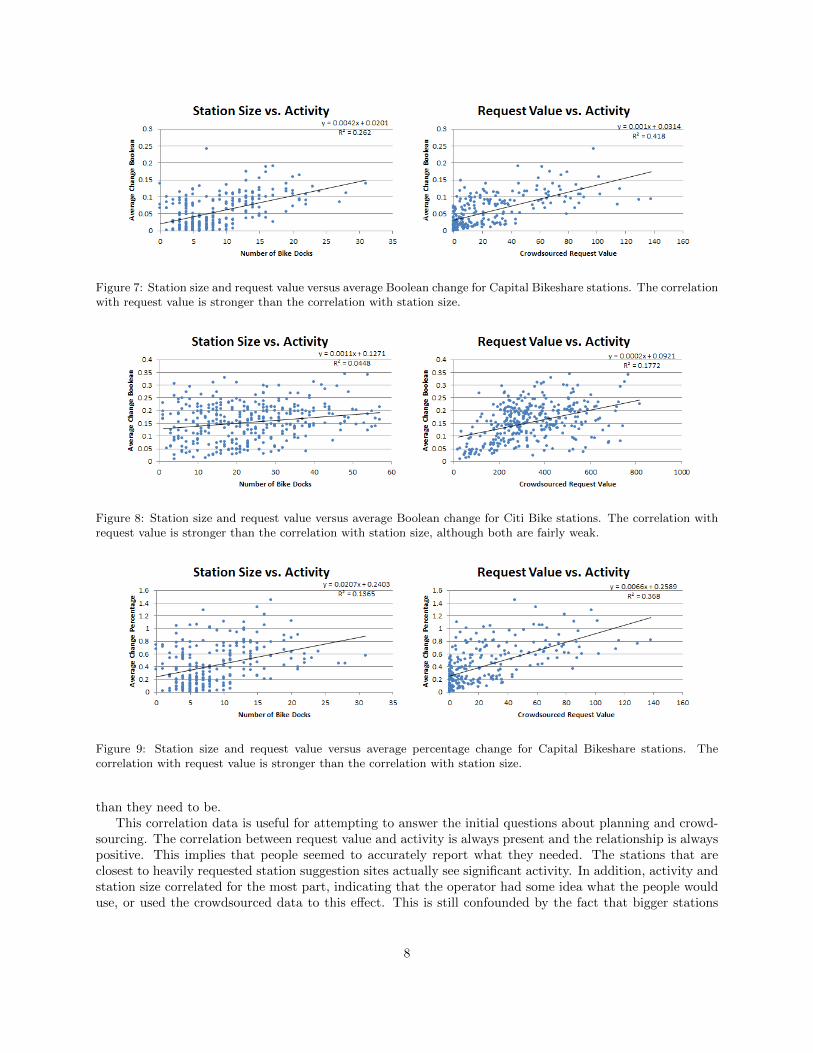
Figure 7: Station size and request value versus average Boolean change for Capital Bikeshare stations. The correlationwith request value is stronger than the correlation with station size.
Figure 8: Station size and request value versus average Boolean change for Citi Bike stations. The correlation withrequest value is stronger than the correlation with station size, although both are fairly weak.
Figure 9: Station size and request value versus average percentage change for Capital Bikeshare stations. Thecorrelation with request value is stronger than the correlation with station size.
than they need to be.This correlation data is useful for attempting to answer the initial questions about planning and crowd-
sourcing. The correlation between request value and activity is always present and the relationship is alwayspositive. This implies that people seemed to accurately report what they needed. The stations that areclosest to heavily requested station suggestion sites actually see significant activity. In addition, activity andstation size correlated for the most part, indicating that the operator had some idea what the people woulduse, or used the crowdsourced data to this effect. This is still confounded by the fact that bigger stations
8
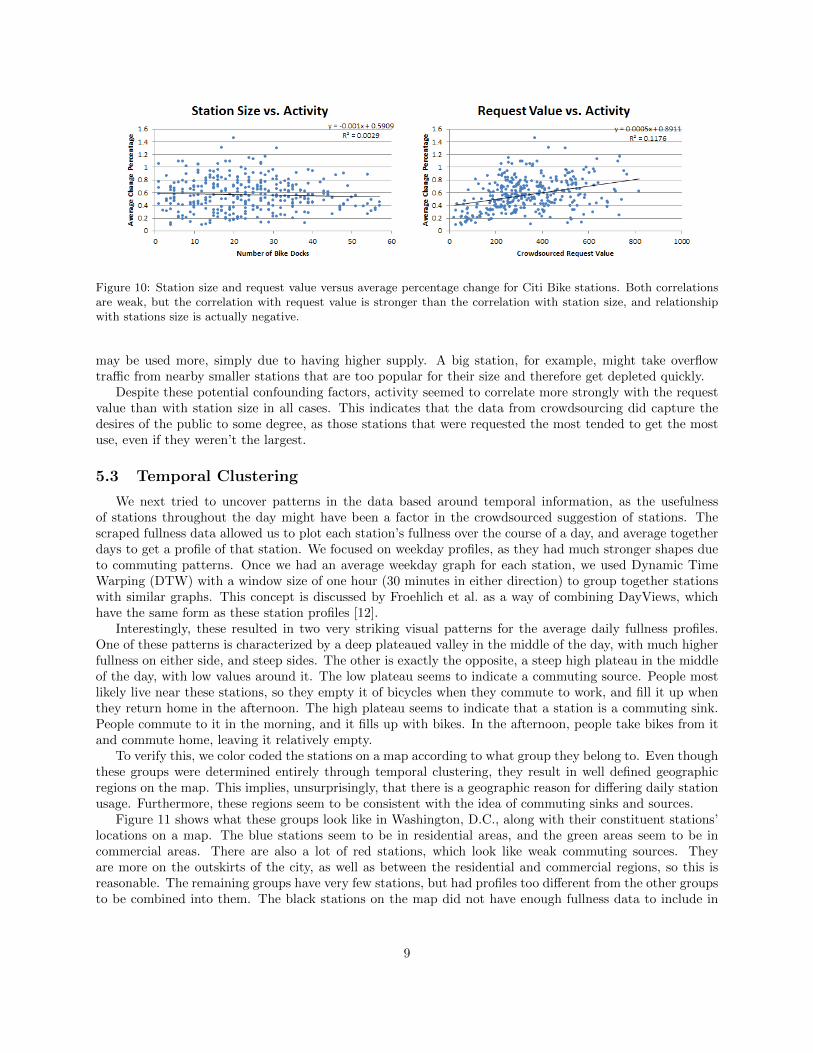
Figure 10: Station size and request value versus average percentage change for Citi Bike stations. Both correlationsare weak, but the correlation with request value is stronger than the correlation with station size, and relationshipwith stations size is actually negative.
may be used more, simply due to having higher supply. A big station, for example, might take overflowtraffic from nearby smaller stations that are too popular for their size and therefore get depleted quickly.
Despite these potential confounding factors, activity seemed to correlate more strongly with the requestvalue than with station size in all cases. This indicates that the data from crowdsourcing did capture thedesires of the public to some degree, as those stations that were requested the most tended to get the mostuse, even if they weren’t the largest.
5.3 Temporal Clustering
We next tried to uncover patterns in the data based around temporal information, as the usefulnessof stations throughout the day might have been a factor in the crowdsourced suggestion of stations. Thescraped fullness data allowed us to plot each station’s fullness over the course of a day, and average togetherdays to get a profile of that station. We focused on weekday profiles, as they had much stronger shapes dueto commuting patterns. Once we had an average weekday graph for each station, we used Dynamic TimeWarping (DTW) with a window size of one hour (30 minutes in either direction) to group together stationswith similar graphs. This concept is discussed by Froehlich et al. as a way of combining DayViews, whichhave the same form as these station profiles [12].
Interestingly, these resulted in two very striking visual patterns for the average daily fullness profiles.One of these patterns is characterized by a deep plateaued valley in the middle of the day, with much higherfullness on either side, and steep sides. The other is exactly the opposite, a steep high plateau in the middleof the day, with low values around it. The low plateau seems to indicate a commuting source. People mostlikely live near these stations, so they empty it of bicycles when they commute to work, and fill it up whenthey return home in the afternoon. The high plateau seems to indicate that a station is a commuting sink.People commute to it in the morning, and it fills up with bikes. In the afternoon, people take bikes from itand commute home, leaving it relatively empty.
To verify this, we color coded the stations on a map according to what group they belong to. Even thoughthese groups were determined entirely through temporal clustering, they result in well defined geographicregions on the map. This implies, unsurprisingly, that there is a geographic reason for differing daily stationusage. Furthermore, these regions seem to be consistent with the idea of commuting sinks and sources.
Figure 11 shows what these groups look like in Washington, D.C., along with their constituent stations’locations on a map. The blue stations seem to be in residential areas, and the green areas seem to be incommercial areas. There are also a lot of red stations, which look like weak commuting sources. Theyare more on the outskirts of the city, as well as between the residential and commercial regions, so this isreasonable. The remaining groups have very few stations, but had profiles too different from the other groupsto be combined into them. The black stations on the map did not have enough fullness data to include in
9
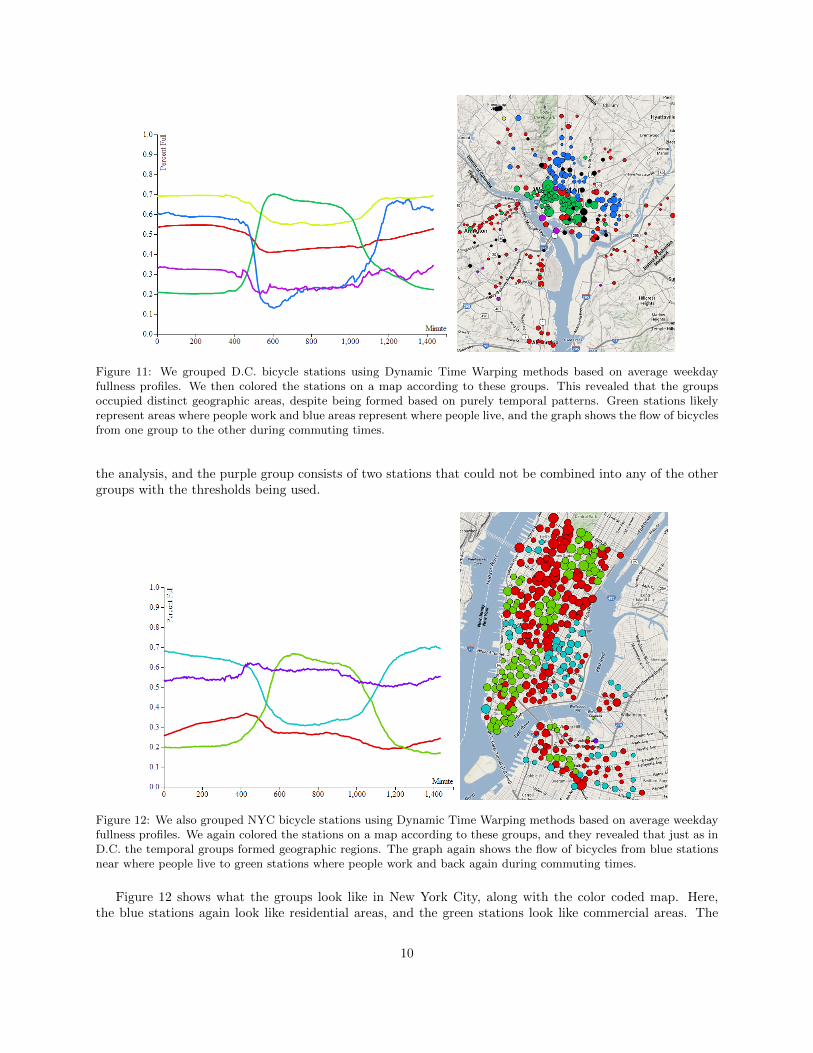
Figure 11: We grouped D.C. bicycle stations using Dynamic Time Warping methods based on average weekdayfullness profiles. We then colored the stations on a map according to these groups. This revealed that the groupsoccupied distinct geographic areas, despite being formed based on purely temporal patterns. Green stations likelyrepresent areas where people work and blue areas represent where people live, and the graph shows the flow of bicyclesfrom one group to the other during commuting times.
the analysis, and the purple group consists of two stations that could not be combined into any of the othergroups with the thresholds being used.
Figure 12: We also grouped NYC bicycle stations using Dynamic Time Warping methods based on average weekdayfullness profiles. We again colored the stations on a map according to these groups, and they revealed that just as inD.C. the temporal groups formed geographic regions. The graph again shows the flow of bicycles from blue stationsnear where people live to green stations where people work and back again during commuting times.
Figure 12 shows what the groups look like in New York City, along with the color coded map. Here,the blue stations again look like residential areas, and the green stations look like commercial areas. The
10
red stations this time follow no particularly well-defined pattern. They seem to gain bicycles very slightlyin the morning, lose them throughout the day, and then gain some back in the evening. It is possible thatthis is just an artifact of averaging together many stations that did not have strong enough patterns, so notmuch could be determined about this group. The purple group consists of just one station that could notbe combined into any of the other groups with the thresholds being used.
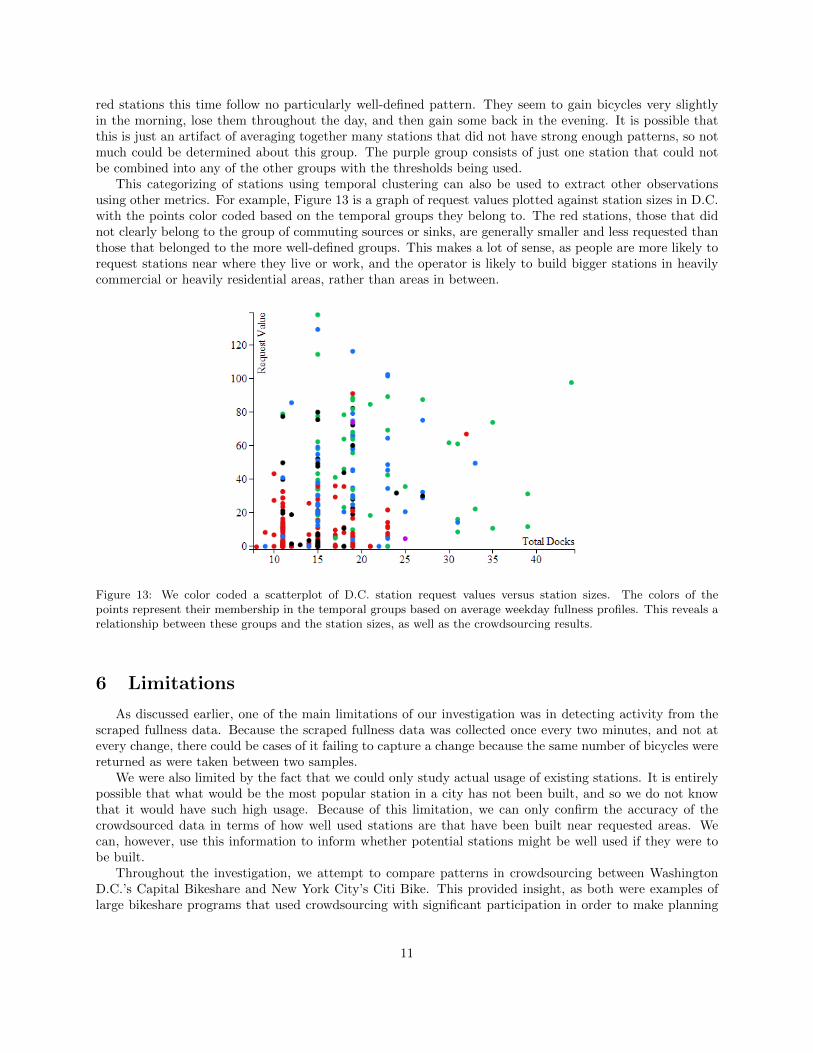
This categorizing of stations using temporal clustering can also be used to extract other observationsusing other metrics. For example, Figure 13 is a graph of request values plotted against station sizes in D.C.with the points color coded based on the temporal groups they belong to. The red stations, those that didnot clearly belong to the group of commuting sources or sinks, are generally smaller and less requested thanthose that belonged to the more well-defined groups. This makes a lot of sense, as people are more likely torequest stations near where they live or work, and the operator is likely to build bigger stations in heavilycommercial or heavily residential areas, rather than areas in between.
Figure 13: We color coded a scatterplot of D.C. station request values versus station sizes. The colors of thepoints represent their membership in the temporal groups based on average weekday fullness profiles. This reveals arelationship between these groups and the station sizes, as well as the crowdsourcing results.
6 Limitations
As discussed earlier, one of the main limitations of our investigation was in detecting activity from thescraped fullness data. Because the scraped fullness data was collected once every two minutes, and not atevery change, there could be cases of it failing to capture a change because the same number of bicycles werereturned as were taken between two samples.
We were also limited by the fact that we could only study actual usage of existing stations. It is entirelypossible that what would be the most popular station in a city has not been built, and so we do not knowthat it would have such high usage. Because of this limitation, we can only confirm the accuracy of thecrowdsourced data in terms of how well used stations are that have been built near requested areas. Wecan, however, use this information to inform whether potential stations might be well used if they were tobe built.
Throughout the investigation, we attempt to compare patterns in crowdsourcing between WashingtonD.C.’s Capital Bikeshare and New York City’s Citi Bike. This provided insight, as both were examples oflarge bikeshare programs that used crowdsourcing with significant participation in order to make planning
11
decisions. However, the uses of crowdsourcing differ significantly between the two cities, as it was used inNYC to plan Citi Bike’s initial deployment, but used in D.C. after Capital Bikeshare had been establishedfor a few years. We used the suggestion data from these two systems as if they were the same thing, but weshould expect a difference due to the difference in collection time frames.
7 Future Work
There are other bodies of data that are available, and could lead to interesting results. One body of datawe had access to but did not use in this investigation was flow data from Capital Bikeshare. This consistedof start and end points and times for every trip made by individual bikes over a period of a few years. Suchdata for Citi Bike was not available at the time of this investigation, but could possibly be requested, andeven without it some analysis could be done using the Capital Bikeshare flow data.
More analysis could also be done using the weekend fullness profiles. Currently, we have only lookedextensively at the weekday profiles, as they were more likely to capture commuting profiles, and we expectedthat commutes would guide the crowdsourced suggestions more than other temporal patterns. However,a combination of temporal and geographic analysis could reveal where people might request stations forrecreational biking on weekends, for example.
A lot more work could likely be done by opening up a dialogue with the operators of various bikesharingsystems. Offering analyses to help with the problems faced, such as load balancing and station planning, inexchange for more rich and detailed data could further the state of the research and of bikeshare programs.
8 Conclusion
Now that many cities have large bicycle sharing systems in use, there is a new body of data available forinvestigating patterns in cities. The fact that both of the bicycle sharing systems investigated in this paperalso utilized crowdsourcing for a portion of their planning increases this body of data even further. The dataenables us to look at the planning and use of these systems, as well as enabling us to look at the commutingpatterns of cities.
Exploratory analysis using geographic clustering of stations and suggestion data allowed for a broadinterpretation of where people seem to want stations, and where stations have actually been placed. Thisanalysis guided the investigation, but the later analyses revealed more interesting patterns in the data.
Furthermore, quantitative analysis revealed correlations between the use of existing bicycle stations andthe size of these stations. This indicates that the operator behind the systems knows what the populationneeds, and therefore where the larger stations should be. This is confounded by other potential reasons forbigger stations getting more traffic, including the fact that smaller stations may be depleted of bicycles moreeasily than larger stations. The investigation also revealed stronger correlations between the concentration ofsuggested station locations near a station and its use, indicating that the crowdsourced data was somethingof a predictor for bicycle use, and that the public did accurately report what it wanted in terms of stationsplacement.
Temporal clustering of fullness data enabled us to group the stations by daily commuting patterns. Thisseparated the stations into clearly defined groups, the most clear being those of commuting sources, inresidential areas, and commuting destinations (or sinks) in commercial areas. Analyzing the fullness dataover the course of the day showed that bicycles were moved by commuters from source stations to sinkstations in the morning, and back to the source stations in the afternoon. Separate geographic areas andtheir characteristics can be identified on a map based on these temporal groupings of stations. The datacan also be split along these group lines for further analysis of other metrics, including station size andcrowdsourced request values. On average, stations in the commuting source and sink groups were moreheavily requested than non-members.
Bicycle sharing systems are continuing to grow and gain users, as are crowdsourcing methods. Studyingthe intersection of them reveals interesting things about patterns in cities and the accuracy of crowdsourced
12
information. Findings like these can potentially be used to improve the mechanism for using crowdsourcingto inform decisions regarding public transportation like bikesharing.
9 Acknowledgements
We thank Oliver O’Brien for his help and data, and Dr. Neal Lathia for his help.
References
[1] About capital bikeshare, accessed 2015-04-13. http://www.capitalbikeshare.com/about.
[2] About citi bike, accessed 2015-04-13. http://www.citibikenyc.com/about.
[3] About motivate, accessed 2015-04-13. http://www.motivateco.com/about.
[4] Bike Arlington. Capital bikeshare crowdsourcing map, 2011-06-22.http://www.bikearlington.com/pages/bikesharing/capital-bikeshare-crowdsourcing-map/.
[5] Bike Arlington. Capital bikeshare “suggest a station” crowdsourcing map, accessed 2014-02-11.http://cabistations.com/.
[6] Pierre Borgnat, Celine Robardet, Patrice Abry, Patrick Flandrin, Jean-Baptiste Rouquier, and NicolasTremblay. A dynamical network view of lyon’s velo’v shared bicycle system. In Dynamics On and OfComplex Networks, Volume 2, pages 267–284. Springer, 2013.
[7] Daren C Brabham. Crowdsourcing the public participation process for planning projects. PlanningTheory, 8(3):242–262, 2009.
[8] Daren C Brabham, Thomas W Sanchez, and Keith Bartholomew. Crowdsourcing public participationin transit planning: preliminary results from the next stop design case. Transportation Research Board,2009.
[9] David William Daddio. Maximizing Bicycle Sharing: an empirical analysis of capital bikeshare usage.PhD thesis, University of North Carolina at Chapel Hill, 2012.
[10] Paul DeMaio. Bike-sharing: History, impacts, models of provision, and future. Journal of PublicTransportation, 12(4):41–56, 2009.
[11] Jennifer S Evans-Cowley. Crowdsourcing the curriculum: public participation in redesigning a planningprogram. Available at SSRN 1760525, 2011.
[12] Jon Froehlich, Joachim Neumann, and Nuria Oliver. Sensing and predicting the pulse of the city throughshared bicycling. In IJCAI, volume 9, pages 1420–1426, 2009.
[13] Andreas Kaltenbrunner, Rodrigo Meza, Jens Grivolla, Joan Codina, and Rafael Banchs. Urban cyclesand mobility patterns: Exploring and predicting trends in a bicycle-based public transport system.Pervasive and Mobile Computing, 6(4):455–466, 2010.
[14] Mohamed Salah Mahmoud, Wafic El-Assi, and P Eng. Effects of built environment and weather onbike sharing demand: Station level analysis of commercial bike sharing in toronto 2. In TransportationResearch Board 94th Annual Meeting, number 15-2001, 2015.
[15] Joachim Neumann, Manqi Zao, Alexandros Karatzoglou, and Nuria Oliver. Event detection in commu-nication and transportation data. In Pattern Recognition and Image Analysis, pages 827–838. Springer,2013.
13

[16] New York City Department of Transportation. Suggestions archive, accessed 2013-08-06.http://a841-tfpweb.nyc.gov/bikeshare/suggestion-archive/.
[17] Susan A Shaheen, Elliot W Martin, Nelson D Chan, Adam P Cohen, and Mike Pogodzinsk. Publicbikesharing in north america during a period of rapid expansion: Understanding business models,industry trends & user impacts. 2014.
[18] Patrick Vogel, Torsten Greiser, and Dirk Christian Mattfeld. Understanding bike-sharing systems usingdata mining: Exploring activity patterns. Procedia-Social and Behavioral Sciences, 20:514–523, 2011.
14
A Sample of D.C. Scraped Fullness Data
1 5 6 2010-10-06 16:38:02
2 11 8 2010-10-06 16:38:02
3 6 5 2010-10-06 16:38:02
4 7 4 2010-10-06 16:38:02
5 5 6 2010-10-06 16:38:02
6 10 1 2010-10-06 16:38:02
7 4 7 2010-10-06 16:38:02
8 1 18 2010-10-06 16:38:02
9 5 4 2010-10-06 16:38:02
10 6 5 2010-10-06 16:38:02
11 7 4 2010-10-06 16:38:02
12 2 5 2010-10-06 16:38:02
13 5 6 2010-10-06 16:38:02
14 10 5 2010-10-06 16:38:02
15 6 13 2010-10-06 16:38:02
17 3 12 2010-10-06 16:38:02
18 5 10 2010-10-06 16:38:02
19 5 14 2010-10-06 16:38:02
20 3 16 2010-10-06 16:38:02
21 0 15 2010-10-06 16:38:02
22 7 8 2010-10-06 16:38:02
23 11 4 2010-10-06 16:38:02
24 9 6 2010-10-06 16:38:02
25 11 4 2010-10-06 16:38:02
26 7 8 2010-10-06 16:38:02
27 10 17 2010-10-06 16:38:02
28 7 8 2010-10-06 16:38:02
29 6 5 2010-10-06 16:38:02
30 7 8 2010-10-06 16:38:02
31 18 1 2010-10-06 16:38:02
32 5 10 2010-10-06 16:38:02
33 7 8 2010-10-06 16:38:02
34 4 7 2010-10-06 16:38:02
35 3 12 2010-10-06 16:38:02
36 5 6 2010-10-06 16:38:02
37 5 6 2010-10-06 16:38:02
38 4 7 2010-10-06 16:38:02
39 6 5 2010-10-06 16:38:02
40 4 7 2010-10-06 16:38:02
41 2 9 2010-10-06 16:38:02
42 6 5 2010-10-06 16:38:02
43 11 4 2010-10-06 16:38:02
44 1 10 2010-10-06 16:38:02
45 6 21 2010-10-06 16:38:02
46 9 6 2010-10-06 16:38:02
47 5 10 2010-10-06 16:38:02
48 8 3 2010-10-06 16:38:02
49 2 15 2010-10-06 16:38:02
51 12 3 2010-10-06 16:38:02
52 8 7 2010-10-06 16:38:02
15
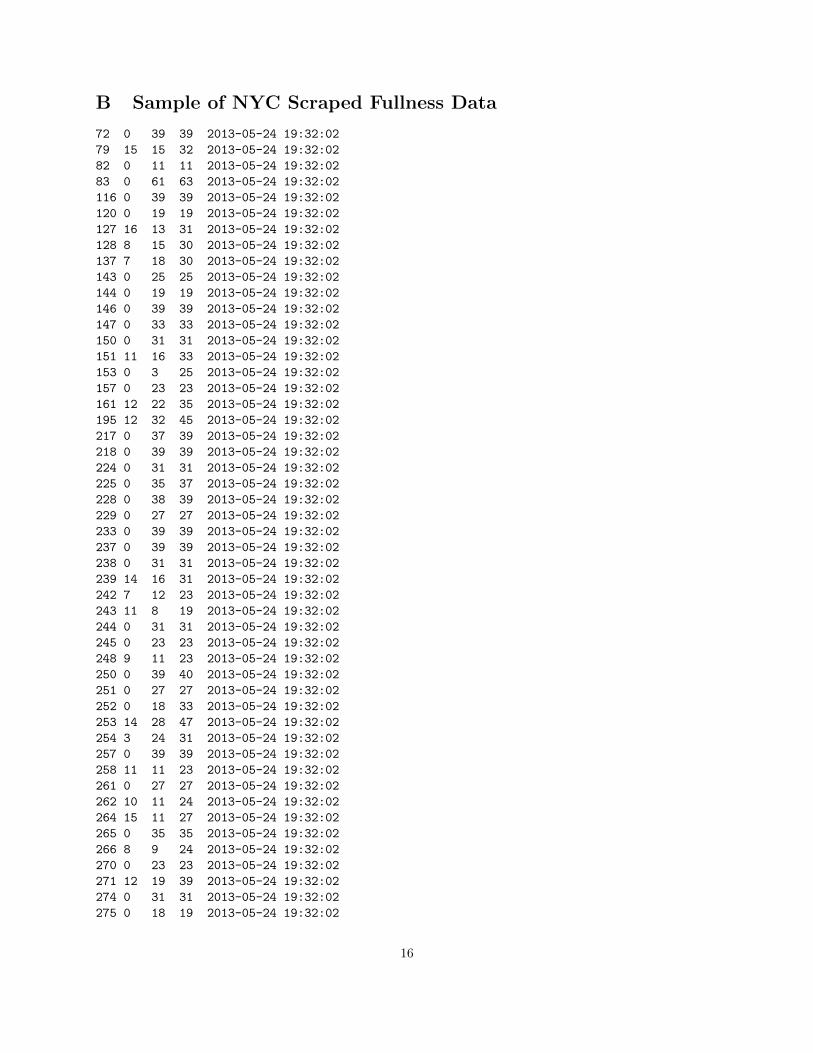
B Sample of NYC Scraped Fullness Data
72 0 39 39 2013-05-24 19:32:02
79 15 15 32 2013-05-24 19:32:02
82 0 11 11 2013-05-24 19:32:02
83 0 61 63 2013-05-24 19:32:02
116 0 39 39 2013-05-24 19:32:02
120 0 19 19 2013-05-24 19:32:02
127 16 13 31 2013-05-24 19:32:02
128 8 15 30 2013-05-24 19:32:02
137 7 18 30 2013-05-24 19:32:02
143 0 25 25 2013-05-24 19:32:02
144 0 19 19 2013-05-24 19:32:02
146 0 39 39 2013-05-24 19:32:02
147 0 33 33 2013-05-24 19:32:02
150 0 31 31 2013-05-24 19:32:02
151 11 16 33 2013-05-24 19:32:02
153 0 3 25 2013-05-24 19:32:02
157 0 23 23 2013-05-24 19:32:02
161 12 22 35 2013-05-24 19:32:02
195 12 32 45 2013-05-24 19:32:02
217 0 37 39 2013-05-24 19:32:02
218 0 39 39 2013-05-24 19:32:02
224 0 31 31 2013-05-24 19:32:02
225 0 35 37 2013-05-24 19:32:02
228 0 38 39 2013-05-24 19:32:02
229 0 27 27 2013-05-24 19:32:02
233 0 39 39 2013-05-24 19:32:02
237 0 39 39 2013-05-24 19:32:02
238 0 31 31 2013-05-24 19:32:02
239 14 16 31 2013-05-24 19:32:02
242 7 12 23 2013-05-24 19:32:02
243 11 8 19 2013-05-24 19:32:02
244 0 31 31 2013-05-24 19:32:02
245 0 23 23 2013-05-24 19:32:02
248 9 11 23 2013-05-24 19:32:02
250 0 39 40 2013-05-24 19:32:02
251 0 27 27 2013-05-24 19:32:02
252 0 18 33 2013-05-24 19:32:02
253 14 28 47 2013-05-24 19:32:02
254 3 24 31 2013-05-24 19:32:02
257 0 39 39 2013-05-24 19:32:02
258 11 11 23 2013-05-24 19:32:02
261 0 27 27 2013-05-24 19:32:02
262 10 11 24 2013-05-24 19:32:02
264 15 11 27 2013-05-24 19:32:02
265 0 35 35 2013-05-24 19:32:02
266 8 9 24 2013-05-24 19:32:02
270 0 23 23 2013-05-24 19:32:02
271 12 19 39 2013-05-24 19:32:02
274 0 31 31 2013-05-24 19:32:02
275 0 18 19 2013-05-24 19:32:02
16