crs report for congress - digital library/67531/metacrs7106/m1/1/high... · crs report for congress...
TRANSCRIPT

Congressional Research Service ˜ The Library of Congress
CRS Report for CongressReceived through the CRS Web
Order Code RL32530
World Oil Demand and the Effect on Oil Prices
August 18, 2004
Robert PirogSpecialist in Energy Economics and PolicyResources, Science, and Industry Division

World Oil Demand and the Effect on Oil Prices
Summary
The price of oil began rising in October 2003 and reached record levels in bothMay and August of 2004. As a result of these price increases, consumers’ budgetshave been under pressure, business costs have risen, and oil producers’ profits haveincreased. The 108th Congress has considered both broad energy legislation (H.R. 6),as well as more specific legislation (H.R. 4517) that address the conditions in the oiland petroleum products markets.
A long term explanatory factor for increasing oil prices could be the decline ofthe world reserve base. The reserves to production ratio is the measure whichindicates the world’s ability to maintain current production, based on provedreserves. Over the past decade there has been little change in the reserve toproduction ratio, suggesting that, at least for now, long term forces are not driving upthe price of oil.
A wide variety of cyclic and short term factors have converged in such a waythat the growth of demand has been unexpectedly high causing upward pressure onoil prices. Those factors which have been identified as contributing to the high priceof oil include the resumption of relatively rapid growth rates of gross domesticproduct in many countries around the world, a declining value of the U.S. dollar,gasoline prices, the changing structure of the oil industry, OPEC policies, and thepersistently low levels of U.S. crude oil and gasoline inventories.
Expectations concerning future market conditions are quickly embodied in oilprices formed in futures markets like the New York Mercantile Exchange. The fearof terrorism and war, uncertainty concerning the relationship between the Russiangovernment and the oil company Yukos, and other political factors are quicklyreflected in price along with real political unrest like that experienced by oilproducing Venezuela and Nigeria. Speculative buying and selling might also affectprices as financial traders adjust their investment portfolios to reflect expectedmarket conditions.
Demand patterns for world oil and oil products show significant diversity bycountry, region, and product groupings. As a result of this diversity it is not possibleto attach blame for the current level of price to any one nation, region, or productsegment. The view that the oil market is international in scope and tightlyinterrelated is enhanced by the demand data.
As a result of the integrated nature of the world oil market it is unlikely that anyone nation acting on its own can implement policies that isolate its market frombroader price behavior. As new major oil importers, notably China, and potentiallyIndia, expand their demand, the oil market likely will have to expand productioncapacity. This promises to increase the world’s dependence on the Persian Gulfmembers of the Organization of Petroleum Exporting Countries, especially SaudiArabia, and maintain upward pressure on price.
This report will be updated.

Contents
Background . . . . . . . . . . . . . . . . . . . . . . . . . . . . . . . . . . . . . . . . . . . . . . . . . . . . . . 1
Oil Prices . . . . . . . . . . . . . . . . . . . . . . . . . . . . . . . . . . . . . . . . . . . . . . . . . . . . . . . . 2
Reserves and Production . . . . . . . . . . . . . . . . . . . . . . . . . . . . . . . . . . . . . . . . . . . . 5
Price and Markets . . . . . . . . . . . . . . . . . . . . . . . . . . . . . . . . . . . . . . . . . . . . . . . . . 7Economic Growth . . . . . . . . . . . . . . . . . . . . . . . . . . . . . . . . . . . . . . . . . . . . . 8Exchange Rates . . . . . . . . . . . . . . . . . . . . . . . . . . . . . . . . . . . . . . . . . . . . . . . 9Gasoline Prices . . . . . . . . . . . . . . . . . . . . . . . . . . . . . . . . . . . . . . . . . . . . . . . 10Industry Structure . . . . . . . . . . . . . . . . . . . . . . . . . . . . . . . . . . . . . . . . . . . . . 11OPEC Policy . . . . . . . . . . . . . . . . . . . . . . . . . . . . . . . . . . . . . . . . . . . . . . . . 11Inventories . . . . . . . . . . . . . . . . . . . . . . . . . . . . . . . . . . . . . . . . . . . . . . . . . . 12Exceptional Events . . . . . . . . . . . . . . . . . . . . . . . . . . . . . . . . . . . . . . . . . . . . 14
Sectoral Demand Patterns . . . . . . . . . . . . . . . . . . . . . . . . . . . . . . . . . . . . . . . . . . 15Countries and Regions . . . . . . . . . . . . . . . . . . . . . . . . . . . . . . . . . . . . . . . . . 16Petroleum Product Demand . . . . . . . . . . . . . . . . . . . . . . . . . . . . . . . . . . . . . 17
Future Projections . . . . . . . . . . . . . . . . . . . . . . . . . . . . . . . . . . . . . . . . . . . . . . . . 18
Conclusions . . . . . . . . . . . . . . . . . . . . . . . . . . . . . . . . . . . . . . . . . . . . . . . . . . . . . 19
List of Figures
Figure 1. U.S. Spot Price of Oil, 2003-2004 . . . . . . . . . . . . . . . . . . . . . . . . . . . . 2Figure 2. U.S. Spot Market Price for Reformulated Regular Gasoline, New York
Harbor, 2003-2004 . . . . . . . . . . . . . . . . . . . . . . . . . . . . . . . . . . . . . . . . . . . . . 4Figure 3. U.S. Crude Oil Stocks Excluding Strategic Petroleum Reserve . . . . . 13
List of Tables
Table 1. Oil Reserve/Production Ratios, Selected Years . . . . . . . . . . . . . . . . . . . 6Table 2. World Demand for Oil, 2003 . . . . . . . . . . . . . . . . . . . . . . . . . . . . . . . . 16

World Oil Demand and the Effect on OilPrices
The world oil market was characterized by strong demand growth in 2003 thatcontinued through the first quarter of 2004. As a result of this growth, and theresulting high prices, consumers’ budgets were under pressure, the profits of energyproducers were up, and consuming nations again had to face the economic andpolitical costs of dependence on imported oil.
Appropriate policy responses to world oil market conditions may well dependon whether the factors that pushed the market to its current level are likely to betemporary or permanent. The lessons of past volatility in the oil market suggest thateven transitory forces and market adjustments can yield not only changing prices, butchanging patterns of consumption and production as well. Past performance alsosuggests that the expectation, or actuality, of a period of high prices or reducedavailability of supply, can change economic incentives, as both consumers andproducers adjust to the new perceived conditions.
This report analyzes the factors that have driven both demand and supply in theworld oil market in 2003 and into 2004. The report provides and analyzes basicinformation to inform debate on broad energy legislation (H.R. 6), or proposals morespecific to the petroleum and petroleum product markets (H.R. 4517).
Background
While the primary focus of this report is on conditions in the U. S. market,analyses should be carried out in the context of the larger world market. Few actionsby consuming, or producing nations, can be properly evaluated independently of theworld market. Oil is a fungible, international commodity whose ownership andultimate destination is determined by market forces once it leaves the producingcountry. No country can effectively isolate itself from changes elsewhere in themarket, nor is it likely that any nation can take actions that do not indirectly affectother nations.
Oil prices are linked, like those of other commodities, to the levels of economicactivity in the industrial nations. Demand, both from consumers and industrial users,tends to pick up when growth rates of gross domestic product increase and slowdown when those growth rates decline. As a result, oil prices tend to be volatile, atleast partly due to variations in the business cycle.
While oil markets may behave like other commodity markets much of the time,the oil market does have unique features. First, few commodity markets have aninstitution like the Organization of Petroleum Exporting Countries (OPEC). Sinceits creation in 1960, OPEC has had a variable influence on the price of oil through
CRS-2
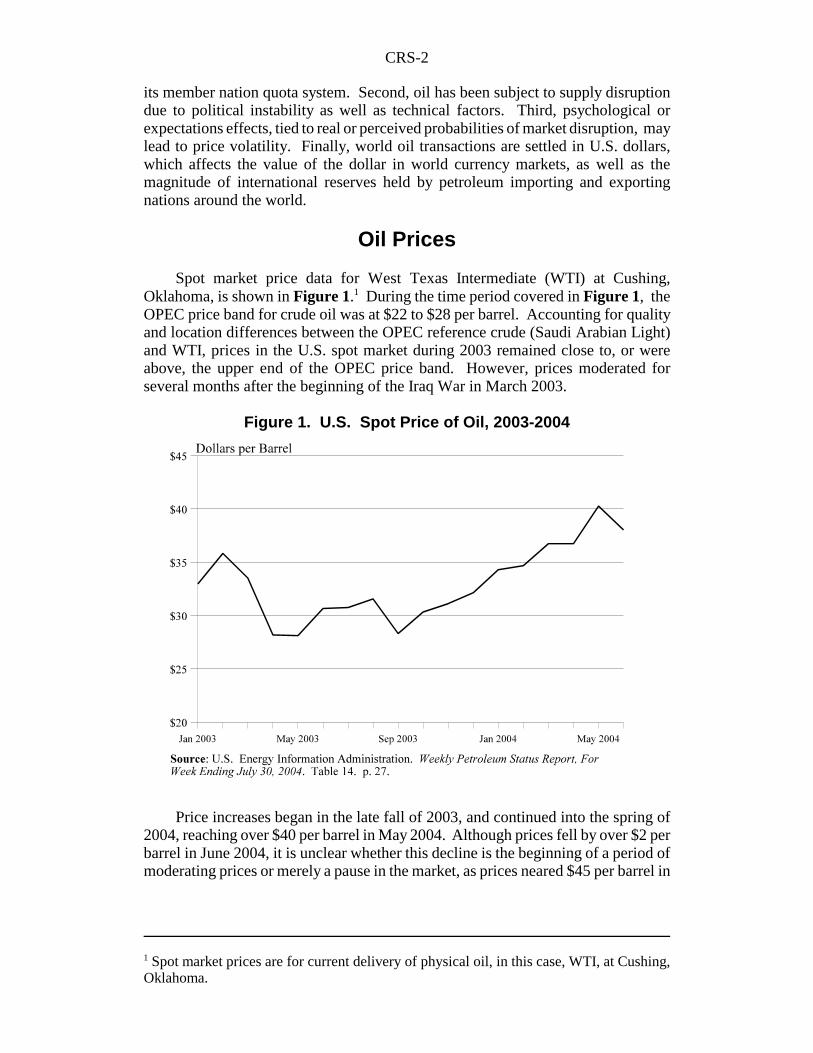
1 Spot market prices are for current delivery of physical oil, in this case, WTI, at Cushing,Oklahoma.
Figure 1. U.S. Spot Price of Oil, 2003-2004
its member nation quota system. Second, oil has been subject to supply disruptiondue to political instability as well as technical factors. Third, psychological orexpectations effects, tied to real or perceived probabilities of market disruption, maylead to price volatility. Finally, world oil transactions are settled in U.S. dollars,which affects the value of the dollar in world currency markets, as well as themagnitude of international reserves held by petroleum importing and exportingnations around the world.
Oil Prices
Spot market price data for West Texas Intermediate (WTI) at Cushing,Oklahoma, is shown in Figure 1.1 During the time period covered in Figure 1, theOPEC price band for crude oil was at $22 to $28 per barrel. Accounting for qualityand location differences between the OPEC reference crude (Saudi Arabian Light)and WTI, prices in the U.S. spot market during 2003 remained close to, or wereabove, the upper end of the OPEC price band. However, prices moderated forseveral months after the beginning of the Iraq War in March 2003.
Price increases began in the late fall of 2003, and continued into the spring of2004, reaching over $40 per barrel in May 2004. Although prices fell by over $2 perbarrel in June 2004, it is unclear whether this decline is the beginning of a period ofmoderating prices or merely a pause in the market, as prices neared $45 per barrel in

CRS-3
2 Oil Daily, Oil Nears $45/bbl on Iraqi Supply Concerns, Vol.54, No.152, August 10, 2004,p.1.3 The NYMEX trades futures contracts on crude oil. Futures contracts obligate buyers andsellers to purchase or deliver crude oil one or more months in the future. However, deliveryof crude oil rarely occurs in conjunction with futures contracts. The difference between thecontracted future price and the actual cash price when the futures contract comes due, orexpires is usually settled in cash. During the trading life of the futures contract, its valueeither increases or decreases on a daily basis depending on the current, spot value of crudeoil. Futures contracts are thought to aid in price formation in that they process currentinformation, and embody it in future price of oil. Trading in futures contracts terminates atthe close of the 3rd business day, prior to the 25th calendar day, of the month preceding thedelivery month of the contract. For example, the August 2004 contract terminated tradingon July 20, 2004. 4 Energy Information Administration, Weekly Petroleum Status Report, for the week endingJuly 30, 2004, Table 16, p.30.5 Oil Daily, Oil Futures Take a Breather After Breaching $45/bbl Mark, Vol.54, No.153,August 11, 2004,. p.3.
August.2 Some insight into future spot market prices might be gained by examiningNYMEX futures market prices.3 In the five days before it terminated trading on July20, 2004, the August 2004 contract on WTI at Cushing, Oklahoma was trading atover $40 per barrel. As of July 23, 2004 the September and October WTI futurescontracts continued to trade at over $41 per barrel on the NYMEX.4 On August 10,2004 the NYMEX futures price for crude oil traded above $45, a first in the historyof the exchange. On the same day, the spot market price for WTI was at $44.48.5
These data suggest that high crude oil prices are likely to continue for the remainderof 2004.
Figure 2 shows the behavior of spot market prices for reformulated regulargasoline at New York Harbor. The price of gasoline has shown a pattern ofmovement similar to that of oil prices.

CRS-4
6 Energy Information Administration, Weekly Petroleum Status Report, for the week endingJuly 30, 2004, Table 16, p.30.7 Oil Daily, Daily Oil and Gas Price Review, Vol.54, No.153, August 11, 2004, p.3.
Figure 2. U.S. Spot Market Price for Reformulated RegularGasoline, New York Harbor, 2003-2004
Gasoline prices peaked in February and August of 2003. They lagged oilprices, not showing price increases in the fall of 2003. However, they did follow oilprice increases throughout the spring of 2004, also peaking in May of 2004. As ofJuly 23, 2004, reformulated gasoline for August 2004 delivery was trading at $1.28per gallon, about $0.12 off the May peak.6 On August 10, 2004 the NYMEX futuresprice for gasoline in September, October, and November remained above $1.20 pergallon. The December, 2004 contract was trading at $1.18 per gallon.7 As in the oilmarket, these futures prices suggest that there is likely to be only modest, if any,moderation in gasoline prices for the rest of the year.
Conclusions concerning projected spot prices based on the trading value ofcurrent futures contracts may or may not be accurate. Futures prices process newinformation and market conditions quickly and prices can change direction on a dailybasis. The futures price on the NYMEX and other markets is conditional oninformation available today. As more information becomes available, futures priceswill adjust. However, as of August 2004, futures markets are providing littleindication that either oil or gasoline prices might decline in the near term.

CRS-5
8 As noted in the table the numbers for 1983 are not strictly comparable to those from lateryears because of the lack of clear data for the USSR. The 1983 data might be interpretedas reserves available to the market economies, as Soviet production and reserves did notenter the world oil market as a normal matter of commerce in 1983.
Reserves and Production
The long term ability of the oil market to meet demand depends on themagnitude of available reserves. An important category of reserves are provedreserves. Proved reserves are those quantities that geological and engineeringanalysis suggest can be recovered with high probability under existing technologicaland economic conditions. Proved reserves can be augmented through explorationand development of new discoveries, through technological improvements, as wellas through the existence of more favorable economic conditions. In the past, all ofthese factors have contributed to augmenting the proved reserve base.
Whether the proved reserve base grows over time or not depends in part on thelevel of production. As production proceeds, the level of proved reserves declines.As new oil discoveries are made, recovery technologies improve, or as the price ofoil rises, the stock of proved reserves increases. A standard measure of the potentialavailability of oil over time is the reserve to production ratio (R/P). The R/P can beinterpreted as the number of years that the existing reserve base can sustain thecurrent level of production. Since both proved reserves and production can changeyear-to-year, the value of the R/P is more descriptive as a measure of potential marketviability when considered over time. Table 1 shows the R/P over the past 20 yearsfor the world as well as various regions.
Table 1 shows that on the world level there appears to be little cause forconcern that oil is physically running out. While the R/P is lower in 2003 than in1993 it is actually higher than it was in 1983.8 A reasonable estimate, given thepolitical changes since 1983 might be that the ratio has remained roughly constantover the past 2 decades, leading to the inference that 2003 levels of consumptionseem to be about as sustainable as 1983 and 1993 levels of consumption were atthose times, even though 2003 world consumption levels were 17% greater thanthose of 1993.
CRS-6
9 BP Statistical Review of World Energy 2004, June 2004, pp.4-6.10 In 2003, the United States imported over 9.6 million b/d of crude oil. OPEC provided theUnited States over 4.5 million b/d of crude oil, or about 47% of total imports. Saudi Arabiaprovided about 1.7 million b/d of total U.S. imports, or about 18%. Source: EnergyInformation Administration, Petroleum Supply Monthly, July 2004, Table S3, pp.8-15.
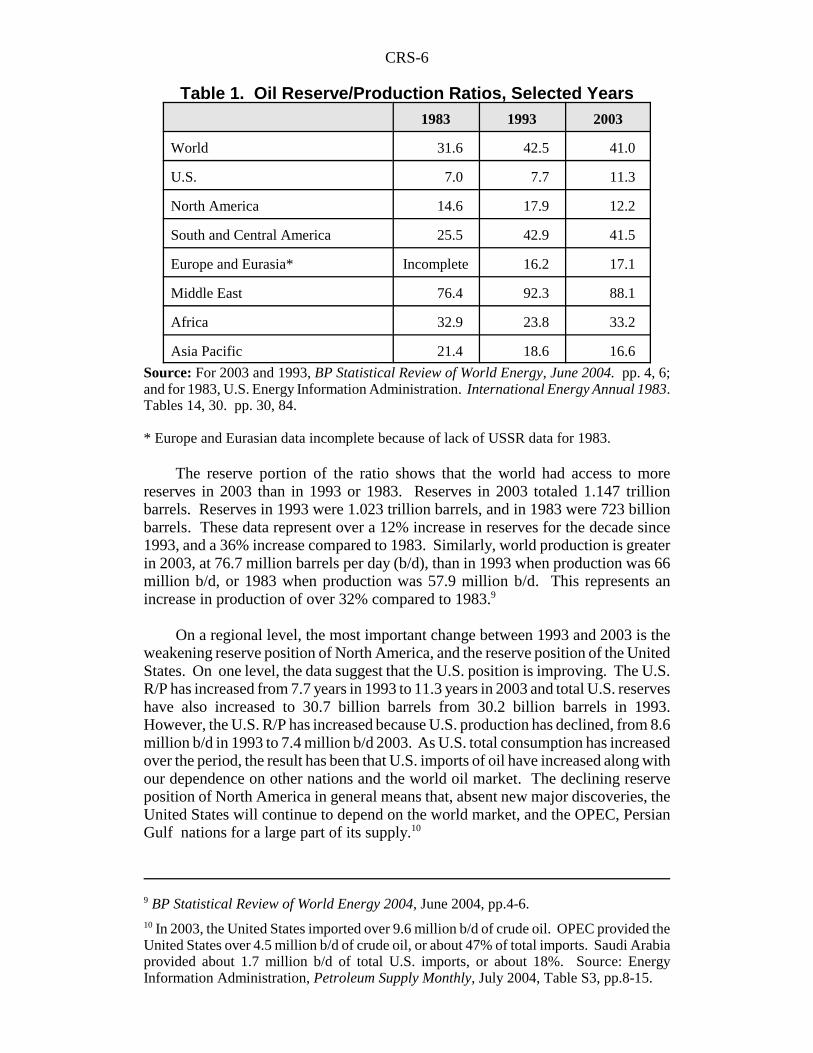
Table 1. Oil Reserve/Production Ratios, Selected Years1983 1993 2003
World 31.6 42.5 41.0
U.S. 7.0 7.7 11.3
North America 14.6 17.9 12.2
South and Central America 25.5 42.9 41.5
Europe and Eurasia* Incomplete 16.2 17.1
Middle East 76.4 92.3 88.1
Africa 32.9 23.8 33.2
Asia Pacific 21.4 18.6 16.6
Source: For 2003 and 1993, BP Statistical Review of World Energy, June 2004. pp. 4, 6;and for 1983, U.S. Energy Information Administration. International Energy Annual 1983.Tables 14, 30. pp. 30, 84.
* Europe and Eurasian data incomplete because of lack of USSR data for 1983.
The reserve portion of the ratio shows that the world had access to morereserves in 2003 than in 1993 or 1983. Reserves in 2003 totaled 1.147 trillionbarrels. Reserves in 1993 were 1.023 trillion barrels, and in 1983 were 723 billionbarrels. These data represent over a 12% increase in reserves for the decade since1993, and a 36% increase compared to 1983. Similarly, world production is greaterin 2003, at 76.7 million barrels per day (b/d), than in 1993 when production was 66million b/d, or 1983 when production was 57.9 million b/d. This represents anincrease in production of over 32% compared to 1983.9
On a regional level, the most important change between 1993 and 2003 is theweakening reserve position of North America, and the reserve position of the UnitedStates. On one level, the data suggest that the U.S. position is improving. The U.S.R/P has increased from 7.7 years in 1993 to 11.3 years in 2003 and total U.S. reserveshave also increased to 30.7 billion barrels from 30.2 billion barrels in 1993.However, the U.S. R/P has increased because U.S. production has declined, from 8.6million b/d in 1993 to 7.4 million b/d 2003. As U.S. total consumption has increasedover the period, the result has been that U.S. imports of oil have increased along withour dependence on other nations and the world oil market. The declining reserveposition of North America in general means that, absent new major discoveries, theUnited States will continue to depend on the world market, and the OPEC, PersianGulf nations for a large part of its supply.10

CRS-7
11 International Energy Agency, Paris, World Energy Investment Outlook: 2003 Insights,2003, pp.101-115.12 Ibid. pp.107-112.13 Platts, Gasoline Guide, June 25, 2004, p.1.14 Prices are for West Texas Intermediate crude oil located at Cushing Oklahoma. Analysts
(continued...)
The Middle East, and especially Saudi Arabia, continue to be the largest holdersof reserves in the world. Some of the other regional changes in the data reflectchanging national and political borders as well as oil positions. European reservesare now dominated by members of the former Soviet bloc, including Azerbaijan,Kazakhstan, Romania, and others. Overall, the data suggest the continuation of anintegrated world oil market. Any region, or nation, might well experience difficultyin trying to implement a singular oil policy, independent of the world market.
Another conclusion that might be drawn from the R/P data is that it provideslittle support for the escalated prices of the first quarter of 2004. Since little haschanged in the long term balance between reserves and production, it is unlikely thatthe R/P has been the source of upward price pressures. Long term oil prices mightbe affected by reserve and production positions in the future, but R/P ratios do notappear to be a major cause of recent oil price increases.
The world R/P has stayed roughly constant over the past 2 decades becauseinvestments have been made in exploration, development, and production. TheInternational Energy Agency estimates that over $3 trillion, or $103 billion per yearwill need to be invested in the oil sector through 2030 if its projections for increaseddemand materialize. It estimates that 70% of this total will be spent on explorationand development, with the remainder in refining, transportation and the developmentof non-conventional oil sources.11
Oil industry investment is only partly required to meet new demand. Only16% of total investment is projected to meet new demand growth. The remaining84% is required to compensate for declining production from the reserve base. Thereason so much investment is needed to compensate for declining fields lies in thedecline rates observed in producing fields. Decline rates depend on a wide varietyof factors, including geology, extraction technology, field age, and productionpolicies. Decline rates range from 4% to over 11% per year. If production levels areto be maintained, new reserves and production must continually be developed tocompensate, financed by investment in exploration and development.12
Price and Markets
After averaging about $23 per barrel for the five year period 1998 to 2002, theaverage price of oil increased to $31 in 2003. For 2004, price has remained high,reaching a peak of $42.38 per barrel on June 1.13 As of mid-July 2004, the price ofoil continued to remain close to $40 per barrel, and approached $45 per barrel inAugust 2004.14 R/P analysis showed that there has been little change in the

CRS-8
14 (...continued)frequently monitor two prices in the oil market, the spot price, and the futures price as tradedon the New York Mercantile Exchange. Both provide useful information. The spot priceis a good measure of current tightness in the physical product market. The near month andsucceeding futures prices measure the markets’ expectations for future supply and demandbalance. The two price sets are related because at expiration, the near month future pricemust equal the then current spot market price, to avoid an arbitrage opportunity.15 International Monetary Fund, World Economic Outlook 2004, April, 2004, Table 1.1, p.3.16 BP Statistical Review of World Energy 2004, June, 2004, p.9.17 Both of these reasons are relevant to current monetary policy decisions. See WashingtonPost, Predicting Growth, Fed Lifts Key Rates, August 11, 2004, p.1.18 For further analysis on the effects of oil price shocks on the macroeconomy, see MarcLabonte, The Effects of Oil Shocks on the Economy: A Review of the Empirical Evidence,CRS Report RL31608, updated June 25, 2004.
underlying long term balance in the oil market that might be used to justify highprices. However, a number of short term economic fundamentals as well as thecoincidence of a set of singular events affecting the market may have interacted insuch a way that prices were pushed up.
Economic Growth
Economic growth in oil consuming nations increases the demand for oil andpushes up oil prices. The world economy continued its recovery in 2003 and 2004with gross domestic product (GDP) growth rates increasing in many regions. Thestrongest growth performances were in oil importing United States and China, butbetter performance was also observed in Japan and Russia, as well as the emerginggrowth nations of Asia. U.S. growth was 3.1% in 2003, and forecast to reach 4.6%during 2004. Chinese economic growth was 7.4% in 2003 and projected to be 6.8%in 2004.15 In the United States, economic growth has been linked to high levels ofoil consumption, of which increasing gasoline demand is an important component.In China, expanding exports have increased the industrial demand for oil, and risingconsumer income has increased consumers’ demand for gasoline. U.S. oil demandincreased by 1.9% in 2003 to over 20 million b/d. Chinese oil demand increased by11.5% in 2003 to almost 6 million b/d.16
In both the United States and China the increase in GDP growth, and economicactivity in general, has led to increases in energy demand. However, a feedbackrelationship exists which can mitigate this effect. To the extent that oil prices rise,reflecting increased oil demand, GDP growth rates might decline for two reasons.17
If the monetary authorities interpret increasing oil costs as generalized price inflation,they may adopt restrictive monetary policies which could slow the economy’sgrowth. Also, if oil product prices rise, and consumers are unable or unwilling toreduce oil product consumption, consumers may reduce expenditures on other goodsand services, again potentially slowing the rate of GDP growth.18
While the United States and China increased their demands for crude oil andpetroleum products as a result of their GDP growth, Russia, an oil exporter,

CRS-9
19 Federal Reserve Board of Governors, Price Adjusted Major Currencies Dollar Index,available at [http://federalreserve.gov/releases/] viewed on August 10, 2004.20 The results of an appreciating currency are not all positive. Economists believe that an
(continued...)
improved its GDP growth rate as a result of the expansion of the petroleum industry.For Russia, it is likely that expansion of the oil sector led the growth in RussianGDP. This behavior is typical of nations whose oil exporting sector is a majorcomponent of their GDP. For nations in this category, high oil prices, based on risingoil demand, create an inflow of oil derived revenue, increasing GDP growth. Thedanger for these nations is that if prices go too high, and stay high, GDP growth inthe consuming nations might decline, reducing the demand and price of oil. Anadditional factor is that high prices lead to increases in exploration and developmentbudgets around the world. As new oil is found and brought to market, supplyincreases and prices might be reduced, damaging the oil exporting nation’s growthor high oil prices can make alternative fuels more competitive potentially reducingthe demand for oil.
Exchange Rates
Changes in the exchange rate of the U.S. dollar can affect the level anddistribution of world oil demand. The U.S. dollar achieved a recent peak value inFebruary of 2002. Since that time, the index measuring the value of the dollar hasdeclined by over 20%.19 The decline in the dollar’s value has not been uniformagainst all currencies. Most of the change has been against nations in the Euro area.The Japanese and some of our other Asian trading partners have intervened in thecurrency markets in an attempt to prevent the dollar from declining in value relativeto their currencies. China maintains a fixed exchange rate against the dollar; as aresult, the yuan has experienced no appreciation against the dollar.
Exchange rate variations in the U.S. dollar can affect the world price of oilbecause oil is priced in dollars and generally paid for in dollars. Several results mayfollow from this relationship. First, if the value of the dollar declines against othercurrencies the dollars received by oil exporting nations are worth less in terms ofworld purchasing power. If oil exporters are able to exert market power in settingprices, or if market conditions permit oil exporters to dictate higher prices, they haveincentives to increase the money price of oil in an attempt to preserve the purchasingpower they earn through selling a barrel of oil.
The effect of a declining dollar on oil importing consumer nations varies withrespect to how their currency has adjusted to the changing value of the dollar. Forthe United States, of course, any increase in the dollar price of oil is immediately feltas an increased price burden, possibly leading to decreases in demand. For the Euroarea consumers, the situation is different. Since the value of the euro has increasedin terms of dollars, the effect of any increase in dollar denominated oil prices is offsetby the amount of euro appreciation. For example, if the euro appreciates by the samepercent that the price of oil in dollars increases the two effects cancel each other. Theresult is that the demand for oil in the euro area is less likely to be affected by highoil prices as long as the euro appreciates.20

CRS-10
20 (...continued)appreciating currency raises the cost of that nation’s exports on the world market. This costincrease reduces their sales, and if the reduction in sales is large enough, might reduce theGDP growth in the nation with the appreciating currency.21 Energy Information Administration, A Primer on Gasoline Prices, 2004, p.2.
Nations that intervene in world currency markets to prevent the dollar fromfalling relative to their currencies, for example, Japan, Korea and Taiwan, areimplicitly choosing to forego the associated real reduction in oil prices anappreciating currency would bring, to preserve the export advantage for their goodsthat a lower exchange rate brings. Since these nations are both large oil importers aswell as major exporters on world markets, the choice can have important implicationsfor their economies. China, which maintains a fixed exchange rate against the U.S.dollar, also foregoes any exchange rate based benefit with respect to oil purchases infavor of supporting export industries.
Gasoline Prices
Crude oil is the major physical input in the production of gasoline and accountsfor over 40% of its cost.21 As a result, changes in the cost of crude oil will bereflected in gasoline prices. Recently, it might be that the relationship has beenreversed: the high price of gasoline may have become a factor in keeping the priceof oil at elevated levels, especially on the New York Mercantile Exchange(NYMEX).
Gasoline prices have achieved record levels since they began increasing in thefirst quarter of 2004. Although the rising price of crude oil is one factor, otherfactors exist which are independent of the oil market in general. The high utilizationrates of refinery capacity in the United States, the lack of investments in new refiningcapacity, the extra costs associated with producing the variety of different gasolinemixes to satisfy environmental requirements in various regions of the country, lowinventories as the summer driving season 2004 approached, and the high cost ofrefinery investment to meet both product and site environmental requirements allcontribute to the record levels of gasoline prices. Additionally, on the NYMEX acondition known as “backwardation” was common during the first half of 2004. Inthis situation the near-month futures contract, in this case regular grade gasolinedelivered to New York harbor, is persistently priced higher than the price level of thesame gasoline, scheduled for delivery months further in the future. The effect of thispricing condition is to make the acquisition of inventories in the present month moreexpensive than acquiring them further in the future. Backwardation provides anincentive to keep current inventories low. The low current inventory position thenacts as a factor keeping prices high, because low inventories are taken to beindicative of a tight supply situation in the market.
It is possible that the high price of gasoline, a price that is highly visible in theU.S. market, might contribute to keeping the price of oil high through an expectationsbased effect. Traders could hypothesize that since the price of gasoline is high, thismight be the result of tight oil markets. If not, there would be more oil refined, andgasoline produced, driving down the price. These expectations could be acted upon

CRS-11
22 United States General Accounting Office, Energy Markets Effects of Mergers and MarketConcentration in the U.S. Petroleum Industry, GAO-04-96, May, 2004. p.34.23 Ibid. p.6.24 Ibid. pp.153-158, 171-193.
through the NYMEX futures markets. This position ignores the importance of theindependent factors, cited in this report, that suggest that gasoline prices in theUnited States would likely have risen even if the price of crude oil moderated.
Industry Structure
A recent study by the Government Accountability Office (GAO) asserted thata total of over 2,600 merger transactions took place in the oil industry from 1991through 2000. These mergers fell into two main classes: asset mergers and corporatemergers. Asset mergers accounted for approximately 80% of the total, and theremaining 20% were corporate mergers. Asset mergers are defined by the GAO asone company purchasing a part, or a specific asset from another company. Forexample, Tosco Petroleum’s acquisition of Unocal’s refining and marketing assetson the West Coast in 1997 was an asset merger. Corporate mergers are defined asthose in which one company acquires the other company’s total assets, resulting inone company. Examples include Exxon-Mobil and Chevron-Texaco, whichproduced two of the super major oil companies.22
A possible outcome of mergers and acquisitions is that the resulting companies,larger and more capable of exerting market power, raise prices to the detriment ofconsumers. GAO carried out econometric analysis on a set of these mergers andfound that mergers and the resulting higher concentration ratios observed in the oilindustry resulted in wholesale price increases of about 2 cents per gallon in six of theeight specific cases it examined.23 The Federal Trade Commission and its staff havechallenged the GAO finding on methodological grounds and question the validity oftheir conclusions.24
If the mergers that took place in the U.S. oil industry did raise wholesalegasoline prices, it is possible that retail gasoline prices also increased as a result. Ifthat was so in a period when oil markets were perceived to be tight, those priceincreases might have fed back through the futures market process described in aprevious section of this report to help support high oil prices.
OPEC Policy
OPEC seeks to create favorable oil prices for its members by assigningproduction quotas to its member nations with the goal of limiting the supply of crudeoil available on the world market. The ability of the quota system to control price hasbeen questioned because of the well known propensity for OPEC members toproduce beyond their assigned production levels. Even so, the very existence ofOPEC has influenced conditions in the petroleum market as buyers and sellers awaitdecisions taken at OPEC meetings, and monitor the institution’s behavior. At certain

CRS-12
25 The OPEC 10 nations does not include Iraq which is excluded from quota restrictions.26 Oil Daily, Opec Turns Up the Volume, But Will Markets Respond in Kind?, Vol. 54, No.123, June 29, 2004. p.6.
times in its history OPEC has had relatively clear influence on oil prices, as in 1996,when a flood of Saudi crude oil came on the market and drove down prices.
In response to recent price increases, OPEC has maintained that a shortage ofcrude oil on the world market is not the reason. OPEC has asserted that the marketis well supplied, and its actual production has exceeded quota levels. OPEC officialproduction for June 2004 was announced as 25.5 million b/d by the OPEC 10, toincrease to 26 million b/d on August 1, 2004.25 Actual OPEC production for Junewas thought to exceed 29 million b/d.26
Although gross volumes are consistent with a market that is not suffering fromsupply tightness, the effects of product segmentation must be considered. Afundamental breakdown in the crude oil market exists between sweet, or low sulfurcontent, and sour, high sulfur content, oil. It may be that OPEC volumes of sourcrude make the over-all market appear in balance while a tightness in the sweet crudemarket underlies this over-all balance. Sweet crude oil is useful in efficientlyproducing the low sulfur transportation fuels, both gasoline and diesel, thatenvironmental regulations increasingly require, and is important to nations withrelatively strict air quality standards.
The role of OPEC in the 2004 market price may be more traceable to actionstaken in 2002. In 2002, OPEC production declined from an average of over 30million b/d to approximately 28.5 million b/d, a decline of some 5%. Thisproduction cutback changed the nature of the market in 2003, as economic growthbegan to recover and enhance oil demand growth. Production in 2003 not only hadto satisfy the growing demand requirements of 2003, but also to compensate for thereduced availability in 2002 which reduced inventories. The result of theseconditions is that as the market evolved in late 2003 and into 2004 with economicgrowth strengthening, persistent shortfalls in inventory levels were observed.
Inventories
The United States holds petroleum stocks in three ways. The oil industry holdsstocks of crude oil in inventory as well as stocks of petroleum products. These stocksare held to insure the efficient operation of refineries in the face of shifting seasonalproduct demand and potential disruptions in crude oil supply. Seasonal fluctuationsin product demand are managed through varying the stocks of petroleum products,mainly gasoline. If inventories of either crude oil or gasoline are low relative to thepast average, or in the perception of market traders, this is taken to be an indicationthat the market is tight, implying that demand is nearly equal to, or might evenexceed, potential supply at current price levels. As a result, upward pressure on priceoccurs, even if there is no physical shortage observable.
Figure 3 shows the behavior of crude oil stocks in the United States, excludingthe Strategic Petroleum Reserve. The level of reserves in 2003 is relatively low

CRS-13
27 Oil Daily, Analysts Weigh Impact of Fear in Oil Price, Vol.54, No.151, August 9, 2004,p.1.28 Energy Information Administration, Weekly Petroleum Status Report, for the week ending
(continued...)
Figure 3. U.S. Crude Oil Stocks Excluding StrategicPetroleum Reserve
compared to 2002. Stocks are increasing in 2004 on a month to month comparativebasis with 2003, but satisfying growing demand at the same time that stocks aregrowing contributes to the strong demand that has been a major factor in oil priceincreases. It has been reported that U.S. crude oil inventories during the last weekof July 2004 reached 298.6 million barrels, which on its own was judged to beconsistent with a price of oil of around $26 per barrel.27
Several factors have contributed to the decline in stocks held by the privatesector. A long term trend in the refining sector particularly, and the oil industry ingeneral, is cost reduction. Inventory is expensive to hold, and one way to minimizecosts is to reduce the size of inventory and expand the use of efficient inventorymanagement techniques. While this strategy benefits the profitability of thecompanies, it has the side effect of providing less of a buffer in times of surgingdemand. Second, when the futures market for commodities is in a “normal” pricerelationship, prices for future delivery tend to be somewhat higher than currentprices, making inventory accumulation economically viable. Recently, oil futuremarkets have reversed the more typical price structure, and the future price has beenlower than the current price, providing a disincentive to accumulate inventories atcurrent prices. The third factor contributing to low inventories in the private sectoris the tight market. Refineries are near full capacity production, and supplies oflight, low sulfur crude oil are perceived to be tight on the world market.28 Taken

CRS-14
28 (...continued)August 6, 2004, Table 2, p.2.29 Use of the SPR to moderate gasoline prices is discussed in Robert Bamberger and RobertPirog, The Strategic Petroleum Reserve: Possible Effects on Gasoline Prices of Selected FillPolicies, CRS Report RL32358, April 19, 2004.30 Oil Daily, Robust Demand Propels Crude Oil Past $41 Despite Solid Supply, Vol. 54, No.136, July 19, 2004, p.3.
together, this is a difficult set of circumstances within which to expand stocks of oilfor inventory. However, since inventories remain low in the view of some markettraders, they are one more factor contributing to the high price of oil.
The third way the United States holds stocks, in this case crude oil, is in theStrategic Petroleum Reserve (SPR). This government-held reserve was establishedto provide a buffer against a physical disruption in the delivery of imported crude oil.Recently, there have been calls to either suspend deliveries to the SPR, or to releaseoil from the SPR to the market with the intent of increasing market supply, reducingspeculation, and moderating prices.29
Exceptional Events
This section briefly identifies and discusses a set of factors that may exert aninfluence on oil prices, but seem to be more in the nature of a “one time” event ratherthan a trend or cyclic factor. The effect of each of these factors tends to be mademore important by the general tightness of the market. In some cases, there is aninteractive relationship between two or more of these factors, again possiblyincreasing the over-all effect on price.
The war in Iraq has contributed to high oil prices in different ways as eventshave progressed. The predominant effect of the conflict on oil prices has been anincrease in uncertainty. During the early stages of the conflict, concerns about apossible disruption of oil supply out of the Persian Gulf and disruption of Iraqiproduction due to military operations were prominent, until it became clear that themilitary would quickly oust the government of Saddam Hussein. Later, marketuncertainty revolved around the ability of Iraq to export oil in the midst of politicaltransition in which pipeline and other oil facilities were attacked by hostile groupswithin the country. Uncertainty with respect to terrorist attacks, both in Iraq, andspilling over to other Gulf nations, including Saudi Arabia, continue to unsettle theoil market and contribute to a “fear factor” being built into the price of oil.
Recent terrorist attacks in Saudi Arabia, directed at the oil industry and itspersonnel, are more than a psychological influence on the market. Recent reportshave asserted that as of July 2004, world spare production capacity was between oneand two million b/d, almost all in Saudi Arabia.30 This level of spare capacity isclose to the minimum amount required to cover a supply disruption from oneexporting nation. A major disruption in Saudi oil production would cause thatcushion to disappear and would likely cause upward volatility in world oil markets.
CRS-15
31 Oil Daily, Opec’s Output Pledge Fails to Check Price, Vol. 54. No. 140, July 23, 2004,p.1.32 Most oil bought and sold at that time was by long term contract between the majorinternational oil companies and the oil producing nations.33 International Energy Association, Oil Market Report, June 10, 2004. p.5.
The concern the market has shown regarding supply disruption has been borneout by events. Political unrest and strikes have disrupted oil exports from bothNigeria and Venezuela. Indonesian oil production has been declining, leaving itunable to meet its OPEC quota. The legal conflict between Yukos, the majorRussian oil company and the Russian government over back tax obligations threatensto bankrupt the company, or force the sale of producing assets. Markets areconcerned that bankruptcy, or significant asset sales, might lead to an oil supplycutoff, or reduction, of exports from Russia, the world’s largest non-OPECproducer.31
Another factor that some feel might be influencing the price of oil is theinfluence of financial investors and financial instruments. At the time of the first oilshock in 1973/1974, the primary market for oil price formation was the Rotterdamspot market, where physical cargoes of oil for near term delivery were bought andsold, generally by traders who had a real commodity interest in the market.32 Today,the primary market in price formation may be the NYMEX, supplemented by theInternational Petroleum Exchange (IPE). In these markets, the focus is not onphysical supply for current delivery, but on the open interest in a financial contract,generally a future or options contract, that will expire in the near month, generally themonth after the current month. The goal of financial traders is to make a profit onthe contract, which may necessitate the price of the contract rising or fallingdepending on the trader’s position in the market and current prices. The implicationof this is that financial traders may have an interest in the price moving either up ordown, almost without regard to the underlying fundamentals of the market.
The rationale for this view is that financial traders have entered the NYMEX oilmarket in large numbers seeking profits that stock and bond markets have notproduced since the boom years of the late 1990s. Profits can be earned on futuresand options markets when prices of the underlying commodities go steadily up, ordown, stay the same, or even when they exhibit more or less random volatility,depending on the strategic position the trader has created.
Sectoral Demand Patterns
Global oil demand was over 78 million b/d in 2003, an increase of about 1.7%over 2002 levels. Demand for 2004 is projected to be over 81 million b/d, anincrease of over 3% compared to 2003 levels. Demand projections for 2004 havebeen increased for nine consecutive months by the IEA since its estimate inNovember 2003.33 Within this pattern of world growth, differences among regions,as well as individual countries, exist. In addition, increased demand is not evenlyspread across the product mix that is produced at refineries.

CRS-16
Countries and Regions
As shown in Table 2, North America was the largest oil consuming region inthe world, with the United States accounting for about 83% of the total. However,growth in the region was less than world growth, and the growth in Canada, at 4.5%,was more than double that of the United States at 1.9%. Asia Pacific was the secondlargest consumer of oil, with China moving ahead of Japan in total consumption, tobe the second largest oil consuming country in the world. The Asia Pacific regionalgrowth of 4% was the highest in the world, and China had the highest yearly growthin demand of any of the major consuming countries at 11.5%.
Table 2. World Demand for Oil, 2003(millions of barrel per day)
2002 2003% Change 2003
over 2002
U.S. 19.7 20.0 1.9%
North America 23.6 24.1 2.1%
South/Central America 4.7 4.6 -1.2%
Europe/Eurasia 19.6 19.7 1.0%
Middle East 4.4 4.5 0.8%
Africa 2.5 2.6 2.2%
Asia Pacific 21.7 22.6 4.0%
Source: BP Statistical Review of World Energy, June 2004. p. 9.
European/Eurasian oil demand growth was roughly flat, with demand falling inGermany, Italy, and the United Kingdom, by -1.8%,-0.9%, and -1.8%, respectively.Within the region, most of the large gains in demand are in nations with small initialconsumption levels led by Azerbaiijan, Belarus, Austria, and Poland. These nationsaccount for 1.2% of world demand. Although lower than average European oildemand growth may be tied to levels of economic activity, they may also be tied tochanging consumption patterns and conservation, especially in Western Europewhere motor vehicle transportation costs are very high.
Russian oil consumption grew by 23,000 b/d, to 2.5 million b/d in 2003, whileproduction rose by 845,000 b/d, to over 8.5 million b/d, enhancing the nation’s roleas a major exporter. However, the Russian economy has been in trouble for manyyears. If economic growth picks up and the economy restructures and stabilizes,consumption might return to levels similar to those in 1993 when 3.8 million b/dwere consumed. Russian consumption at that level might reduce the amount of oilavailable for export, pushing other consuming nations to become increasinglydependent on Middle Eastern supplies.
The Asia Pacific region includes some nations with the highest year-to-yeargrowth rates in the world, while other nations in the region experience declining

CRS-17
34 Gasoline includes aviation and motor gasoline as well as other light distillates, middledistillates includes jet fuel, heating kerosene, and other products, fuel oil includes marinebunkers and crude oil used as a fuel, others includes refinery gas, lubricants, wax, solvents,refinery fuels and other products. 35 Product demand data for the world exclude the nations associated with the former SovietUnion.36 BP Statistical Review of World Energy, June 2004. p.12.37 Ibid.38 Imported gasoline must meet U.S. performance standards, which themselves are amultitude of federal, state, regional, and local regulations. If these requirements aredifferent than those a foreign refiner is prepared to meet, product may not be available tothe U.S. market. Foreign refiners must undertake refinery investments to adapt processesthat allow for the production of U.S. compatible fuels.
demand. In 2003, China strengthened its position as the second largest oilconsuming nation in the world by increasing its margin over Japan from only 20,000b/d in 2002, to 431,000 b/d in 2003. Given the disparity of economic growth rates,geographic and population factors, as well as the comparative density oftransportation, it seems that the Chinese lead over Japan may widen. At currentgrowth rates, a more relevant question might be when China will overtake the UnitedStates as the world’s largest consumer. This is most likely not a competition eithernation will directly benefit from winning. The United States imported about 63% ofthe oil it consumed in 2003, and production has fallen every year since 1993. Chinaimported about 45% of the oil it consumed, and production increased by only 1.5%for 2003, less than the 11.5% increase in demand. The growing demands in both theUnited States and China make it likely that the world oil market will becomeincreasingly dependent on Middle Eastern oil in the coming years and keep exertingupward pressure on price.
Petroleum Product Demand
Product demand analysis reveals that there are regional and country differencesin the mix of oil based products consumed. Gasolines, middle distillates, fuel oil,and other products are the main groups.34 At the world level, gasolines comprise31.6% of consumption, middle distillates 35.7%, fuel oil 12.2%, and other products20.5%.35,36
The consumption pattern in the United States differs from the world averages.The U.S. demand is 46.2% gasoline, 29.3% middle distillates, 3.8% fuel oil, and20.7% other products.37 This mix reflects the U.S. use of oil as a transportation fuel,with car and light truck use responsible for the relatively high gasoline percentage.The U.S. refinery industry is unable to supply adequate gasoline to the domesticmarket. As a result, imports of finished gasoline and gasoline blendstocks haveincreased to almost one million barrels per day. U.S. refineries operate at near fullcapacity, but a lack of new capacity expansion by the industry suggests furtherincreases in imported gasoline, if available on the world market.38

CRS-18
39 Oil Daily, IEA Again Lifts ‘04 Demand, Sees Slower ‘05, Vol.54, No.133, July 14, 2004,p.1.40 Oil Daily, Oil Production Capacity in Saudi Arabia Needs to Rise Soon, Vol.54, No.147,August 3, 2004, p.5.
Europe has different preferences in transportation fuels than the United States.Middle distillates dominate the European product slate at 44%, with gasoline at24.4%. These values reflect the on-going shift to diesel engines in Europeanpassenger vehicles. As product demand shifts, refiners are following by investing inthe technology needed to produce greater proportions of middle distillates and lessgasoline. As this transformation proceeds, European refiners may find that they haveless surplus gasoline available for export to the United States. This outcome couldlead to tightening U.S. gasoline markets, keeping an upward pressure on the price ofgasoline, and indirectly supporting high oil prices.
The Asian pattern of product demand, especially China’s, includes a largerportion of demand, 13.8% in the case of China, dedicated to fuel oil. This percentageis approximately three times that of the United States. The use of fuel oil in industryaccounts for the difference, as well as the lower requirements for gasoline for privateautomobile use.
Future Projections
The International Energy Agency raised its forecast for global oil demand in2004 in August for the ninth month in a row. It estimated that world demand wouldbe 81.41 million barrels per day in 2004. This value represents a growth of 2.5million barrels per day, or 3.2% above 2003 levels. It further projected that growthin 2005 would moderate somewhat, with an increase in consumption of 1.8 millionbarrels per day, or a 2.2% increase over 2004.39
In a typical manufacturing or service market, demand growth of this magnitudemight be welcomed, and met with increased job creation and facility expansion, ormore intensive use of existing facilities. Conditions in the oil and oil productsindustries might not be so accommodating. Excess capacity in the crude oil marketis low, with most estimates averaging about 1.5 million barrels per day. If we addthe increased estimate of consumption in 2004 to the projected increase in 2005 it isclear that the crude oil industry is likely to be at full production capacity through2005.
It has been reported that Aramco (Saudi Arabia) has a plan in place to expandproduction by 1 million barrels per day within a year. Non-OPEC production isexpected to increase by about 1.4 million barrels per day in 2004, but only smallerincreases are expected in 2005.40 High prices, if they persist, can be expected toincrease exploration and ultimately production in the longer term if the currentmarket follows past patterns.
The EIA’s Annual Energy Outlook, 2004 (AEO) provides a projection of U.S.energy balance out to 2025, and includes scenarios based on different market price

CRS-19
41 These prices are expressed in 2002 dollars to control for inflation. 42 Oil Daily, Analysts Weigh Impact of Fear Factor in Oil Price, Vol. 54, No. 151, August9, 2004. p.1.
assumptions. Price is taken to be an assumption, rather than a predicted value,because it is assumed to be determined on the world market. For the base case, theAEO assumes a crude oil price of $23.61 per barrel in 2010 and $26.71 per barrel in2025. For the high price case, AEO assumes a price of $32.80 per barrel in 2010 and$34.90 per barrel in 2025.41 If the factors that are influencing the current marketcontinue in the future, it may be that even the high price case assumptions are toolow.
Conclusions
The world oil market, as a result of the convergence of a number of factors, hasexperienced significant tightness since the end of 2003, continuing through August2004. Some of the factors influencing the market might be temporary, some may becyclical, and others may possibly be permanent. While the high prices that resultedfrom the tight balance between oil demand and supply caused increased energyexpenditures for consumers, business, and industry, it also led to higher incomes forenergy producers. It is possible that the economy as a whole might experiencemacroeconomic effects, not only from the high oil prices themselves, but as a resultof the monetary and fiscal policy responses that might be taken if the high pricespersist and are determined to constitute inflation.
Although it has been under pressure in 2003 and 2004, the oil market has shownthat the market process is functioning. The factors discussed in this paper thataffected oil and gasoline demand as well as the supply response of OPEC and otherproducers caused prices to rise, but there has been little, or no, evidence of physicalshortage or supply disruption.
Effective policies to mitigate high oil prices are difficult to define at the nationallevel. The price of oil is determined on a world market. It is unlikely that anyconsuming nation can insulate itself from the forces driving the world market. Forexample, if a nation decided to reduce or eliminate its direct dependence on thePersian Gulf, it might succeed in doing that by buying oil from other nations.However, this would reduce the total amount of non-Persian Gulf oil available toother nations, increasing their dependence on the region and leaving the level ofworld dependence unchanged. If political events in the Persian Gulf caused the priceof oil to rise, that price increase would be transmitted to all oil produced around theworld. It is not possible to isolate oneself from the world market, except perhaps bycutting domestic consumption to the level of domestic production.
The market in 2004 has likely been affected by a “fear factor” premium on theprice of oil, raising its price above that indicated by market fundamentals. Someestimates of the “fear factor” run as high as $15 per barrel, while others rate it at onlya few dollars, or nothing at all.42 The threat of supply disruption due to potentialterrorism or political instability appears to be the source of this price factor. An

CRS-20
43 C.J. Campbell, Industry Urged to Watch for Regular Oil Production Peaks, DepletionSignals, Oil and Gas Journal, July 14, 2003, pp.38-45.
important question is, how long this factor will influence price? In the past, fears ofpolitical instability, especially in the Persian Gulf, tended to be quelled in relativelyshort time-frames. Today, with the war on terrorism perceived as a long term reality,it may be that oil prices will incorporate a “fear factor” for a significant time.
The nature of the exploration and production cycle in the oil industry encouragesmajor swings in the price of oil even in more politically stable times. This cyclemakes it difficult for governments to time oil policies effectively. In the past, periodsof high oil prices have led to a rapid expansion of exploration, and given improvingtechnology, have led to substantial oil finds in many places in the world. As newlydiscovered extra oil comes on the market several years later, the increased supplytends to overwhelm demand, causing price to drop. While demand tends to increaseincrementally, by a few percent per year, supply tends to increase discrete amountsin response to a period of high prices. This relationship leads to cyclic pricevolatility. Set against this record is the opinion of some that world oil production issoon to peak as a result of geological factors and the likelihood that the largest oilreserves have already been discovered.43
A major continuing factor in the market is the emergence of China as a majorimporter of crude oil. In addition, the possibility exists that India, and perhaps otherAsian nations, might expand their imports of oil as industrial production expands inthose nations. Although the 2005 projection of Chinese import growth moderates toapproximately 7% from the 2003 level of 11.2%, much depends on whether oil usefor private automobiles in China expands very quickly or is moderated by thegovernment. However, either of these yearly growth rates imply stress for the worldoil market. Based on China’s consumption of almost 6 million barrels per day in2003, it may generate increases of demand of 500 thousand b/d or more in the nextfew years. In a market with very limited excess capacity, and possibly facing thediscovery of fewer giant fields, increases in demand of these magnitudes promise tokeep an upward pressure on price.
The 2004, and potentially 2005, oil markets reflect the influence of a numberof factors all of which have led to upward pressure on price. Although some of thesefactors might have been judged temporary in the past, there is a danger that in thecurrent political environment they may perpetuate themselves, keeping oil prices wellabove the OPEC price target of $22 to $28 dollars per barrel.