crude oil basicscrude oil basics oil basicscrude oil basics ... importing 2/3 of its oil...
TRANSCRIPT

1
Crude Oil BasicsCrude Oil BasicsCrude Oil BasicsCrude Oil Basics
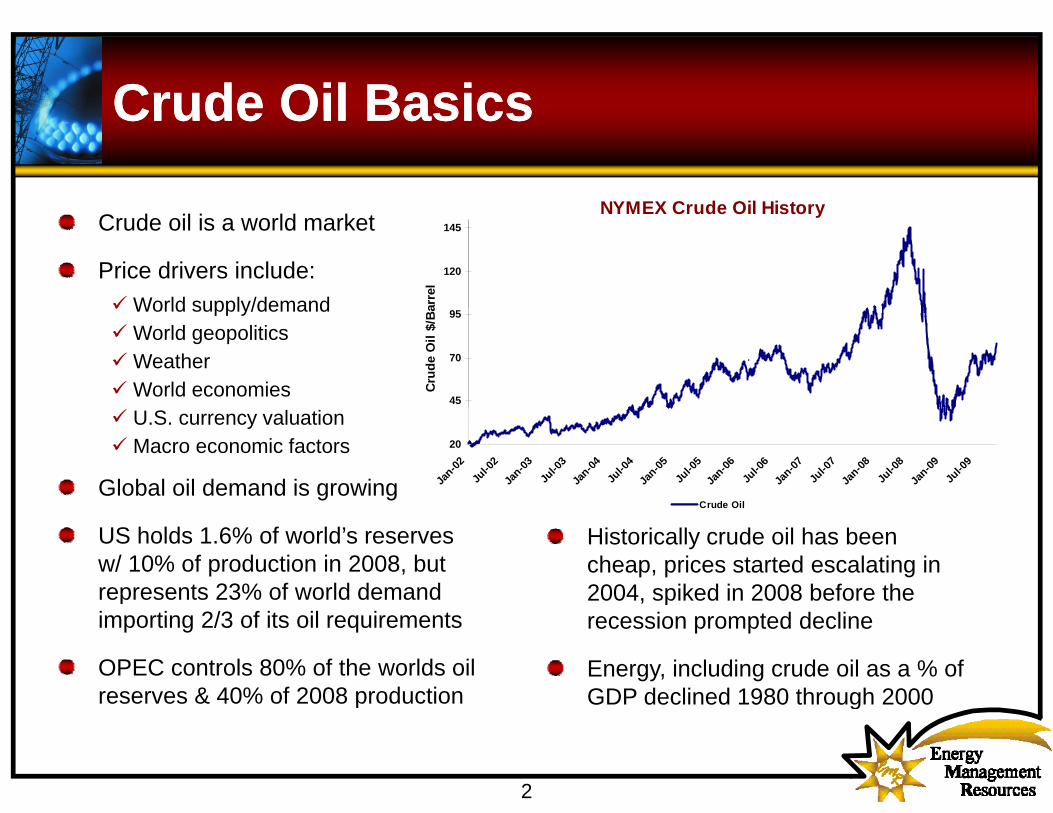
NYMEX Crude Oil HistoryCrude oil is a world market
Price drivers include:World supply/demand
NYMEX Crude Oil History
120
145
arre
l
World supply/demandWorld geopoliticsWeatherWorld economies
45
70
95
Cru
de O
il $/
Ba
.
U.S. currency valuationMacro economic factors
Global oil demand is growing
20
Jan-02
Jul-0
2Ja
n-03Ju
l-03
Jan-04
Jul-0
4Ja
n-05Ju
l-05
Jan-06
Jul-0
6Ja
n-07Ju
l-07
Jan-08
Jul-0
8Ja
n-09Ju
l-09
Crude Oil
US holds 1.6% of world’s reserves w/ 10% of production in 2008, but represents 23% of world demand
Historically crude oil has been cheap, prices started escalating in 2004, spiked in 2008 before the
Crude Oil
pimporting 2/3 of its oil requirements
OPEC controls 80% of the worlds oil reserves & 40% of 2008 production
precession prompted decline
Energy, including crude oil as a % of GDP declined 1980 through 2000
2
reserves & 40% of 2008 production GDP declined 1980 through 2000
Crude Oil: Long TermCrude Oil: Long TermCrude Oil: Long TermCrude Oil: Long Term
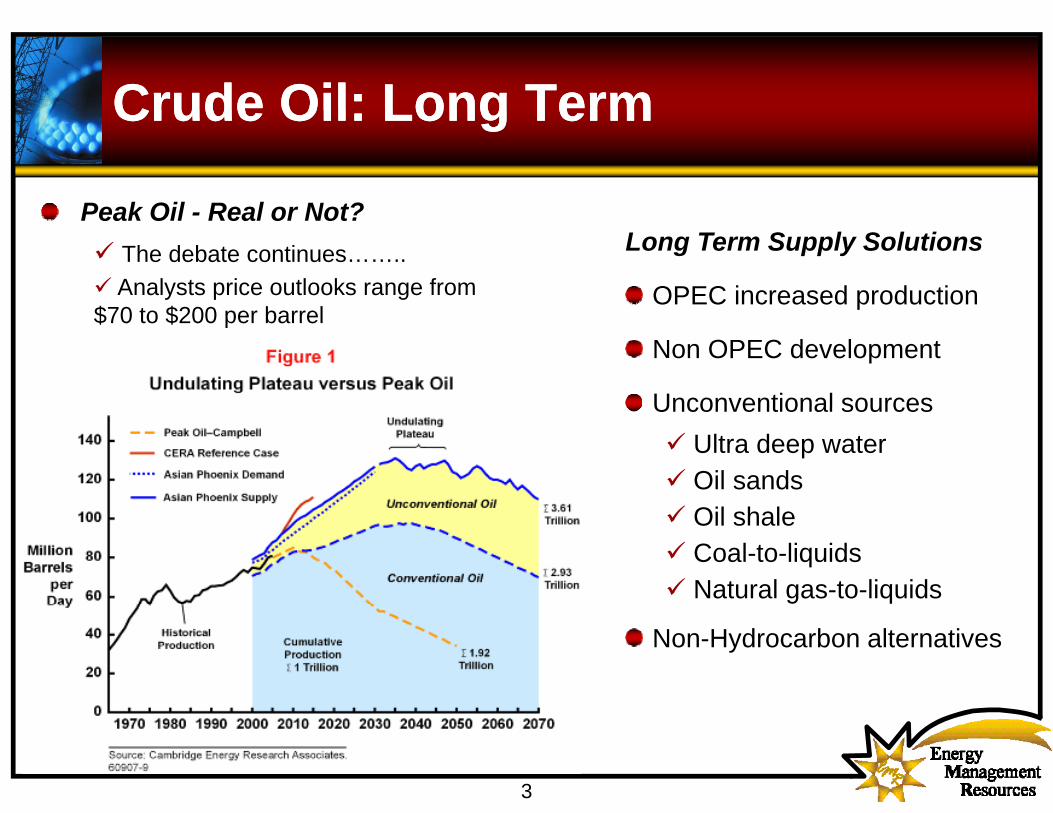
Peak Oil Real or Not?Peak Oil - Real or Not?The debate continues……..Analysts price outlooks range from
$70 t $200 b l
Long Term Supply Solutions
OPEC increased production$70 to $200 per barrel
p
Non OPEC development
Unconventional sourcesUnconventional sourcesUltra deep waterOil sandsOil shaleCoal-to-liquidsNatural gas-to-liquids
Non-Hydrocarbon alternatives
3
Crude Oil Pricing Crude Oil Pricing Macro Economic Impact Macro Economic Impact
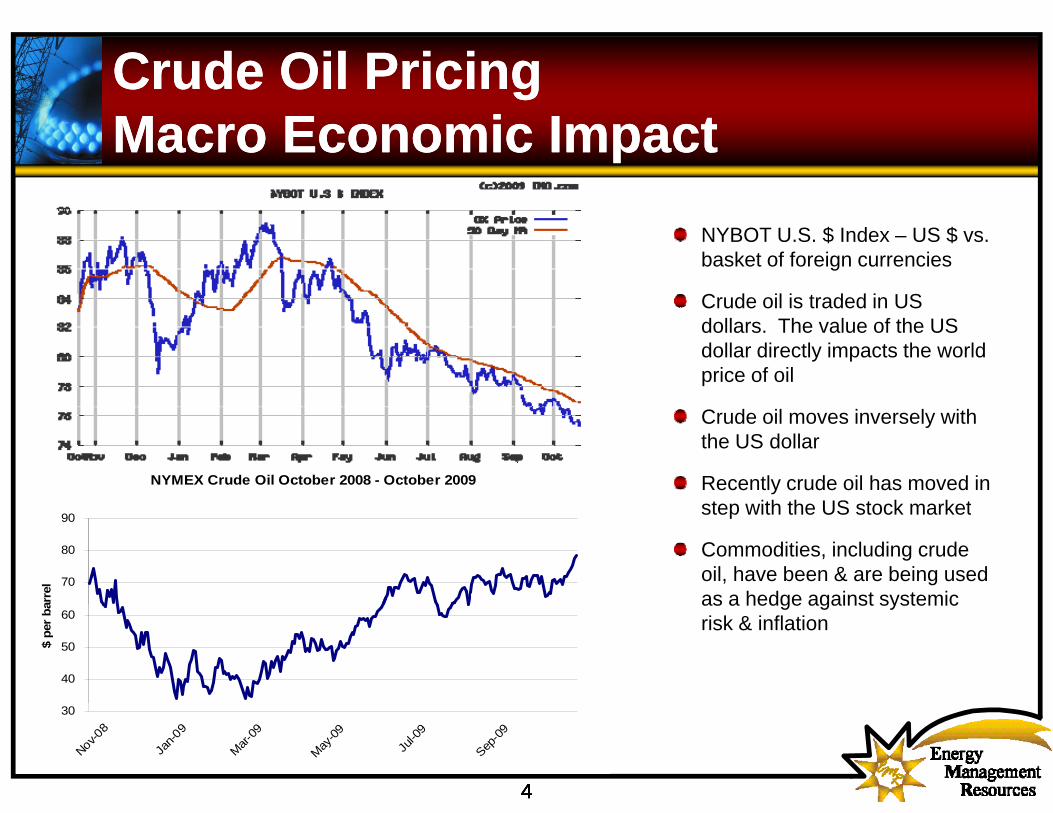
NYBOT U.S. $ Index – US $ vs. basket of foreign currencies
Crude oil is traded in USCrude oil is traded in US dollars. The value of the US dollar directly impacts the world price of oil
NYMEX Crude Oil October 2008 - October 2009
Crude oil moves inversely with the US dollar
Recently crude oil has moved in step with the US stock market
70
80
90
arre
l
step with the US stock market
Commodities, including crude oil, have been & are being used as a hedge against systemic
40
50
60
$ pe
r ba as a hedge against systemic
risk & inflation
4
30
Nov-08
Jan-0
9
Mar-09
May-09
Jul-0
9
Sep-0
9
4444
Crude Oil Pricing Crude Oil Pricing Macro Economic Impact Macro Economic Impact
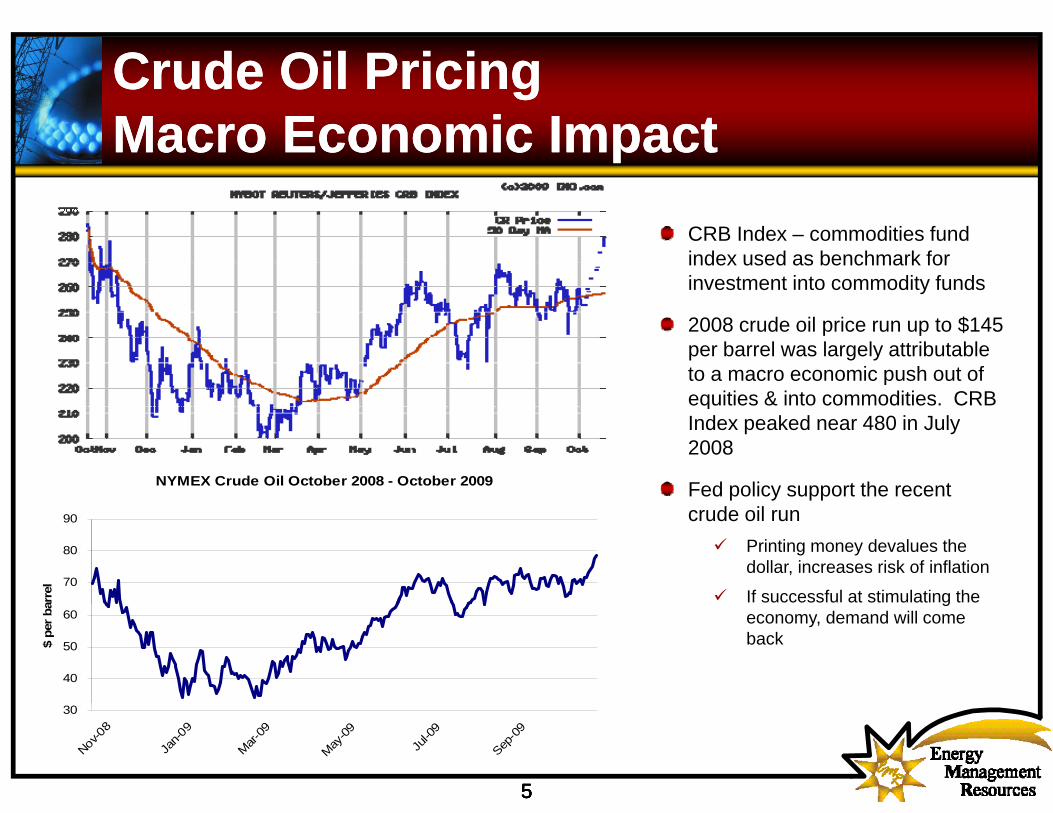
CRB Index – commodities fund index used as benchmark for investment into commodity funds
2008 crude oil price run up to $145 per barrel was largely attributable to a macro economic push out of equities & into commodities. CRB qIndex peaked near 480 in July 2008
Fed policy support the recent NYMEX Crude Oil October 2008 - October 2009
crude oil run Printing money devalues the dollar, increases risk of inflation
If successful at stimulating the 70
80
90
arre
l
geconomy, demand will come back
40
50
60
$ pe
r ba
55555
30
Nov-0
8
Jan-0
9
Mar-09
May-09
Jul-0
9
Sep-0
9
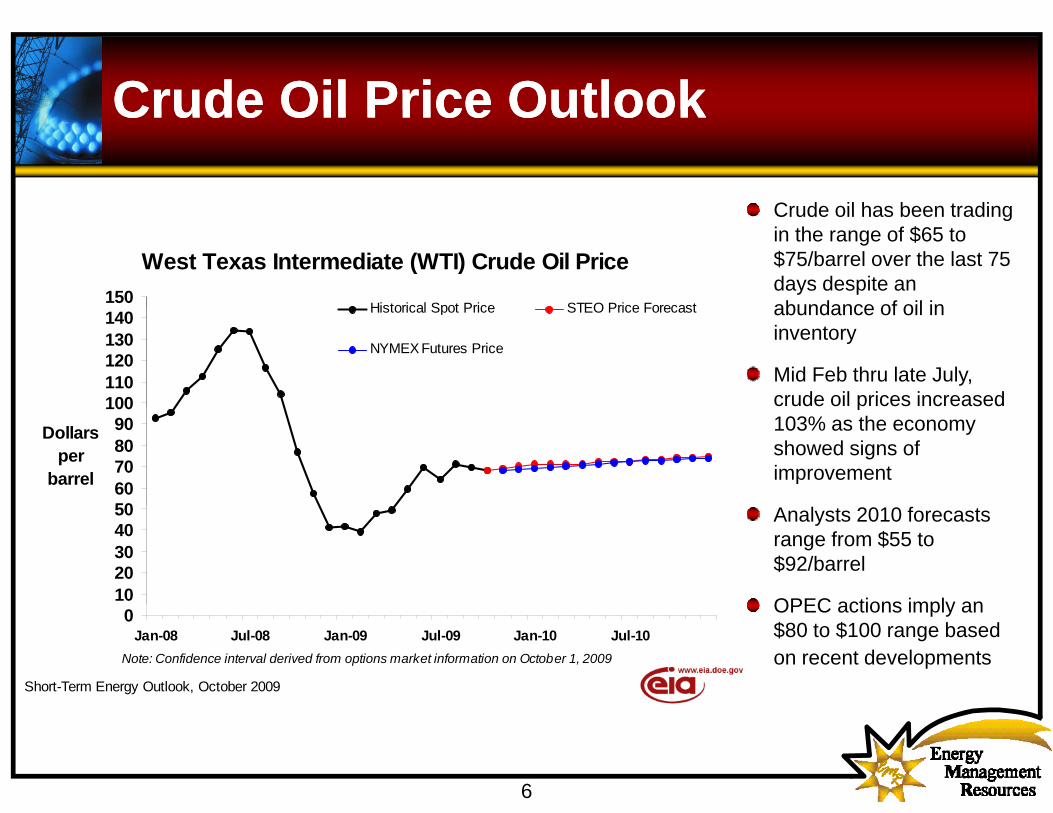
Crude Oil Price OutlookCrude Oil Price OutlookCrude Oil Price OutlookCrude Oil Price Outlook
Crude oil has been trading
West Texas Intermediate (WTI) Crude Oil Price150
Historical Spot Price STEO Price Forecast
Crude oil has been trading in the range of $65 to $75/barrel over the last 75 days despite an abundance of oil in
100110120130140 Historical Spot Price STEO Price Forecast
NYMEX Futures Price
abundance of oil in inventory
Mid Feb thru late July, crude oil prices increased
5060708090
100Dollars
perbarrel
p103% as the economy showed signs of improvement
1020304050 Analysts 2010 forecasts
range from $55 to $92/barrel
OPEC actions imply an0Jan-08 Jul-08 Jan-09 Jul-09 Jan-10 Jul-10
Short-Term Energy Outlook, October 2009
Note: Confidence interval derived from options market information on October 1, 2009
OPEC actions imply an $80 to $100 range based on recent developments
6
Refined Oil ProductsRefined Oil ProductsRefined Oil Products Refined Oil Products U.S. Gasoline and Crude Oil Prices
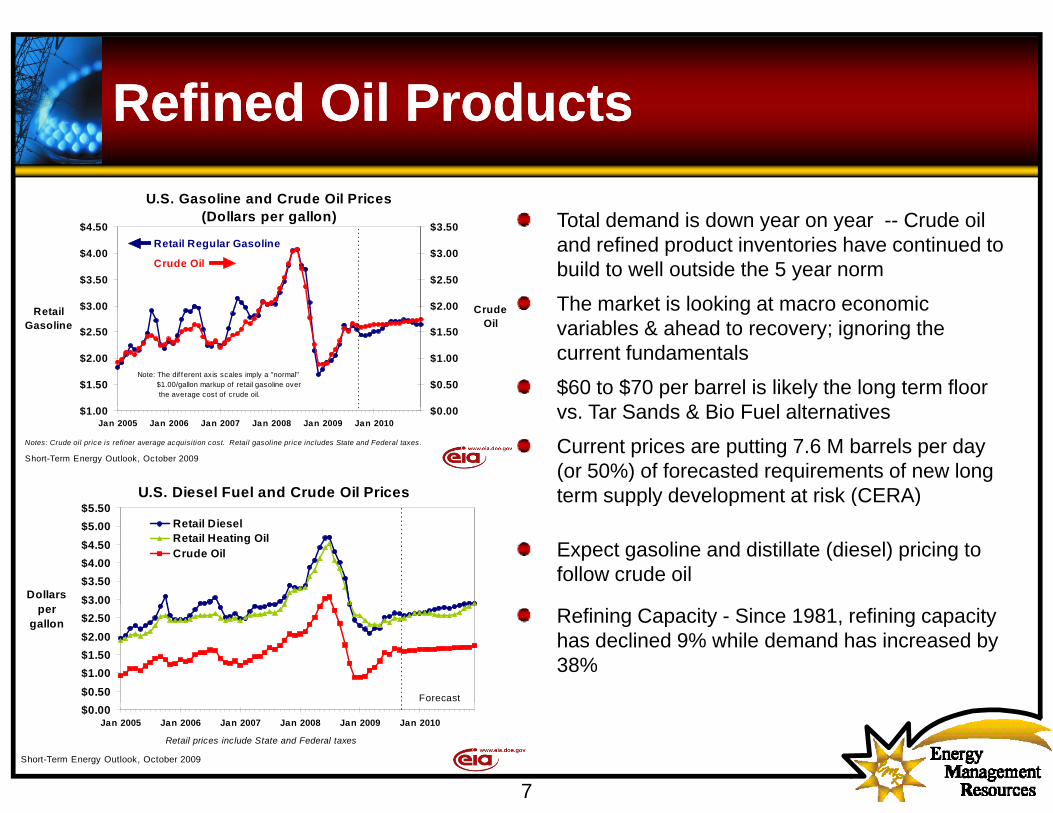
Total demand is down year on year -- Crude oil and refined product inventories have continued to build to well outside the 5 year norm
The market is looking at macro economic
(Dollars per gallon)
$3 00
$3.50
$4.00
$4.50
R t il $2 00
$2.50
$3.00
$3.50
Crude
Retail Regular Gasoline
Crude Oil
The market is looking at macro economic variables & ahead to recovery; ignoring the current fundamentals
$60 to $70 per barrel is likely the long term floor T S d & Bi F l lt ti$
$1.50
$2.00
$2.50
$3.00RetailGasoline
$
$0.50
$1.00
$1.50
$2.00 CrudeOil
Note: The dif ferent axis scales imply a "normal" $1.00/gallon markup of retail gasoline over the average cost of crude oil.
U.S. Diesel Fuel and Crude Oil Prices$5 50
vs. Tar Sands & Bio Fuel alternatives
Current prices are putting 7.6 M barrels per day (or 50%) of forecasted requirements of new long term supply development at risk (CERA)
$1.00Jan 2005 Jan 2006 Jan 2007 Jan 2008 Jan 2009 Jan 2010
$0.00
Short-Term Energy Outlook, October 2009
Notes: Crude oil price is refiner average acquisition cost. Retail gasoline price includes State and Federal taxes.
$3.00$3.50$4.00$4.50$5.00$5.50
Dollars
Retail DieselRetail Heating OilCrude Oil
pp y p ( )
Expect gasoline and distillate (diesel) pricing to follow crude oil
Forecast$0.50$1.00$1.50$2.00$2.50$
pergallon Refining Capacity - Since 1981, refining capacity
has declined 9% while demand has increased by 38%
7
$0.00Jan 2005 Jan 2006 Jan 2007 Jan 2008 Jan 2009 Jan 2010
Short-Term Energy Outlook, October 2009
Retail prices include State and Federal taxes
Natural Gas BasicsNatural Gas BasicsNatural Gas BasicsNatural Gas Basics
N t l i i il N th A i2002-2009 Prompt Month Trading History
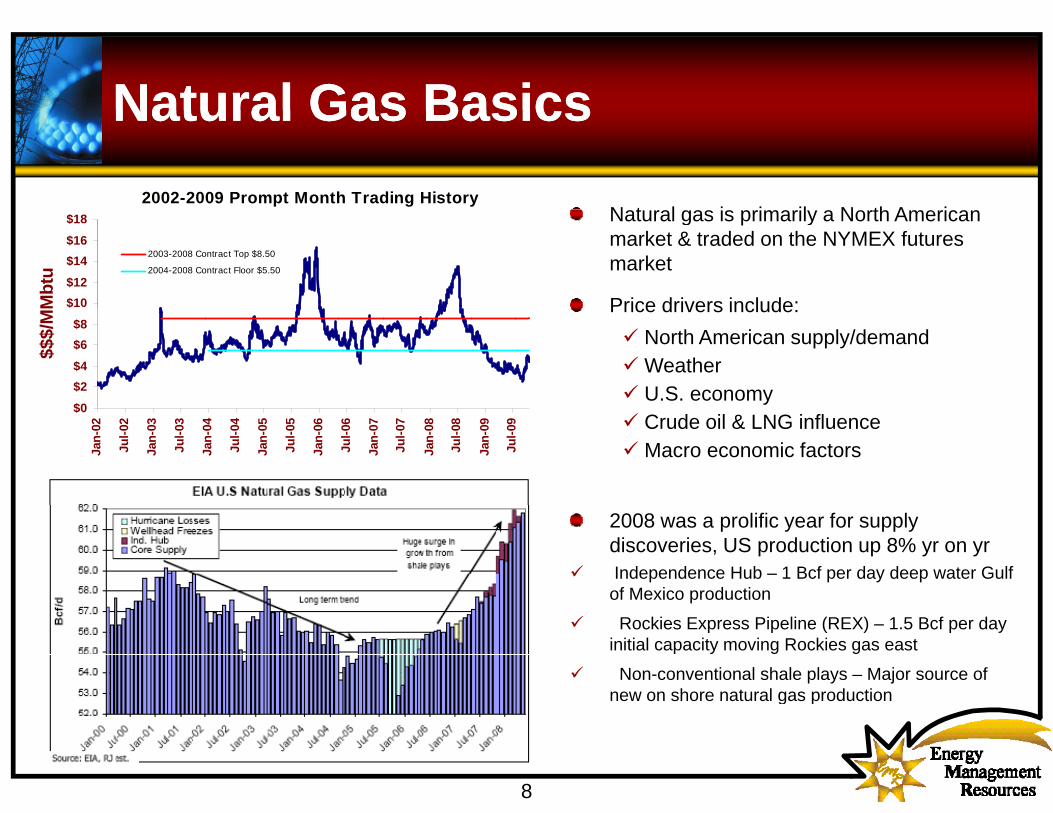
Natural gas is primarily a North American market & traded on the NYMEX futures market
Price drivers include:$10$12
$14$16
$18
Mbt
u
2003-2008 Contract Top $8.50
2004-2008 Contract Floor $5.50
Price drivers include:North American supply/demandWeatherU.S. economy
$0
$2$4
$6$8
$
$$$/
MM
Crude oil & LNG influence Macro economic factors
$0
Jan-
02
Jul-0
2
Jan-
03
Jul-0
3
Jan-
04
Jul-0
4
Jan-
05
Jul-0
5
Jan-
06
Jul-0
6
Jan-
07
Jul-0
7
Jan-
08
Jul-0
8
Jan-
09
Jul-0
92008 was a prolific year for supply discoveries, US production up 8% yr on yr Independence Hub – 1 Bcf per day deep water Gulf of Mexico production
Rockies Express Pipeline (REX) – 1.5 Bcf per day initial capacity moving Rockies gas east
Non-conventional shale plays – Major source of new on shore natural gas production
8
g p
Natural Gas Supply DevelopmentsNatural Gas Supply DevelopmentsNatural Gas Supply DevelopmentsNatural Gas Supply Developments
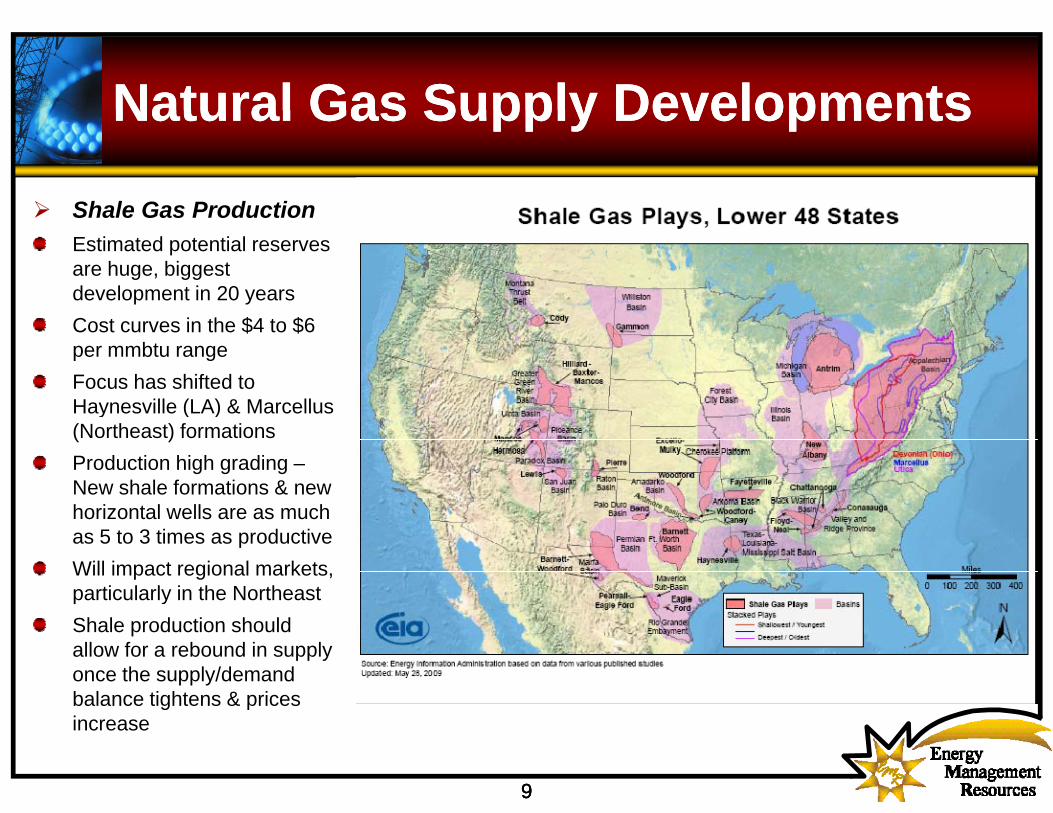
Shale Gas ProductionShale Gas Production Estimated potential reserves are huge, biggest development in 20 years Cost curves in the $4 to $6 per mmbtu range Focus has shifted to Haynesville (LA) & MarcellusHaynesville (LA) & Marcellus (Northeast) formations Production high grading –New shale formations & new h i t l ll hhorizontal wells are as much as 5 to 3 times as productiveWill impact regional markets, particularly in the Northeast yShale production should allow for a rebound in supply once the supply/demand balance tightens & prices
999
balance tightens & prices increase
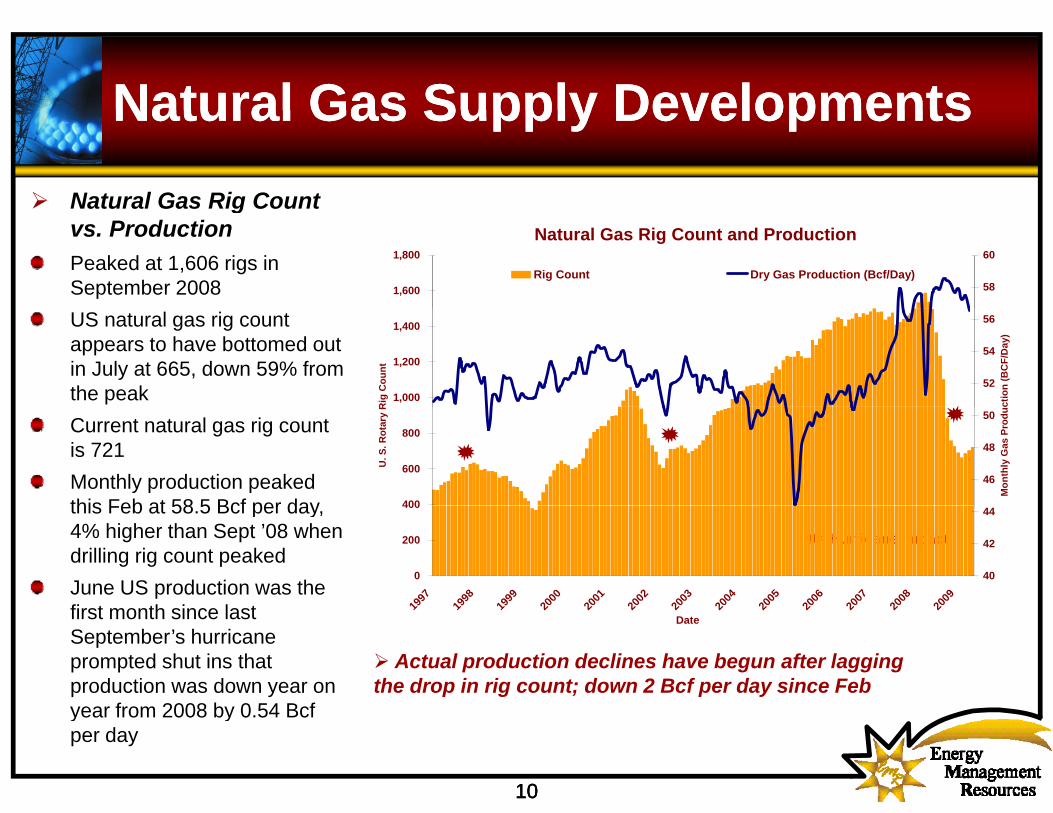
Natural Gas Supply DevelopmentsNatural Gas Supply DevelopmentsNatural Gas Supply DevelopmentsNatural Gas Supply DevelopmentsNatural Gas Rig Count gvs. Production Peaked at 1,606 rigs in September 2008
Natural Gas Rig Count and Production
1,600
1,800
58
60
Rig Count Dry Gas Production (Bcf/Day)
US natural gas rig count appears to have bottomed out in July at 665, down 59% from the peak 1,000
1,200
1,400
Rig
Cou
nt52
54
56
ctio
n (B
CF/
Day
)
Current natural gas rig countis 721 Monthly production peaked this Feb at 58 5 Bcf per day 400
600
800
U. S
. Rot
ary
R
46
48
50
Mon
thly
Gas
Pro
duc
this Feb at 58.5 Bcf per day, 4% higher than Sept ’08 when drilling rig count peaked June US production was the f
Hurricane Impact
0
200
400
1997
1998
1999
2000
2001
2002
2003
2004
2005
2006
2007
2008
2009
40
42
44
first month since last September’s hurricane prompted shut ins that production was down year on
f 2008 b 0 54 B f
Actual production declines have begun after lagging the drop in rig count; down 2 Bcf per day since Feb
19 19 19 20 20 20 20 20 20 20 20 20 20
Date
101010
year from 2008 by 0.54 Bcf per day
Natural Gas Demand DevelopmentsNatural Gas Demand DevelopmentsNatural Gas Demand Developments Natural Gas Demand Developments
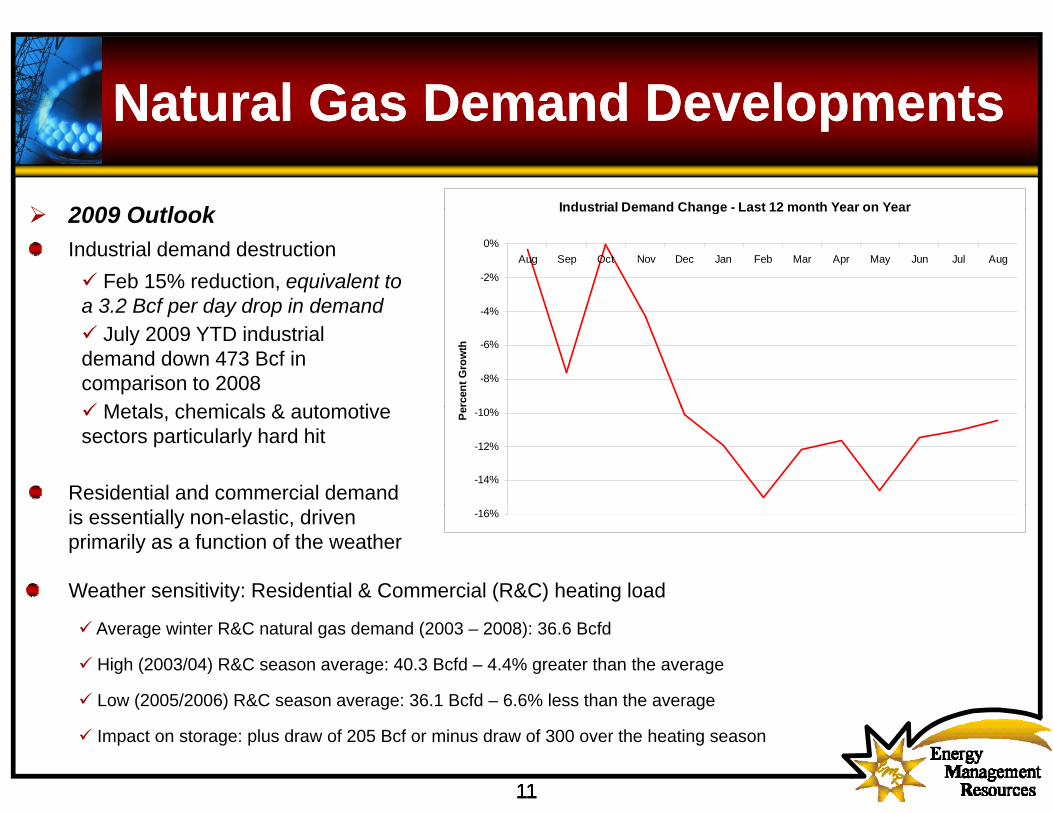
2009 O tl k Industrial Demand Change - Last 12 month Year on Year2009 OutlookIndustrial demand destruction
Feb 15% reduction, equivalent to a 3 2 Bcf per day drop in demand
Industrial Demand Change Last 12 month Year on Year
4%
-2%
0%Aug Sep Oct Nov Dec Jan Feb Mar Apr May Jun Jul Aug
a 3.2 Bcf per day drop in demandJuly 2009 YTD industrial
demand down 473 Bcf in comparison to 2008
M t l h i l & t ti
-8%
-6%
-4%
rcen
t Gro
wth
Metals, chemicals & automotive sectors particularly hard hit
Residential and commercial demand -14%
-12%
-10%Pe
is essentially non-elastic, driven primarily as a function of the weather
Weather sensitivity: Residential & Commercial (R&C) heating load
-16%
Average winter R&C natural gas demand (2003 – 2008): 36.6 Bcfd
High (2003/04) R&C season average: 40.3 Bcfd – 4.4% greater than the average
Low (2005/2006) R&C season average: 36 1 Bcfd – 6 6% less than the average
11111111
Low (2005/2006) R&C season average: 36.1 Bcfd 6.6% less than the average
Impact on storage: plus draw of 205 Bcf or minus draw of 300 over the heating season
Supply Demand Balance Supply Demand Balance Natural Gas Natural Gas
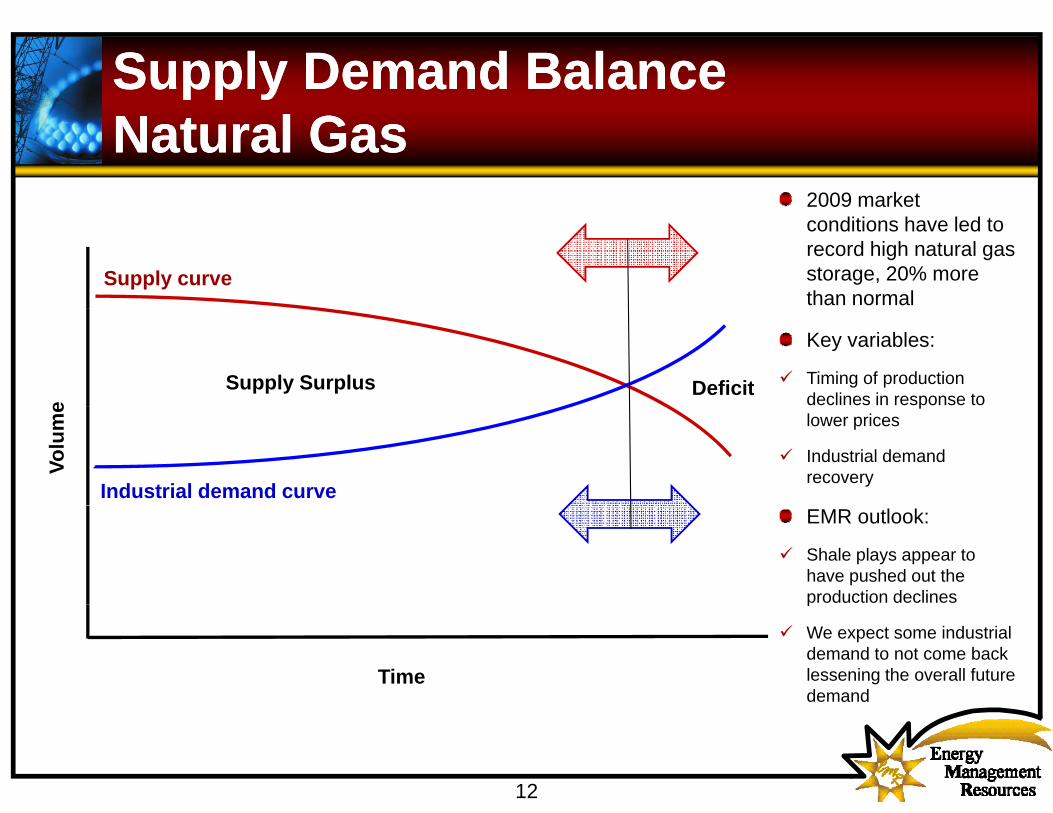
2009 market
Supply curve
conditions have led to record high natural gas storage, 20% more than normal
e
Supply Surplus Deficit
Key variables:
Timing of production declines in response to
Volu
me
Industrial demand curve
plower prices
Industrial demand recovery
EMR outlook:
Shale plays appear to have pushed out the production declines
Time
p
We expect some industrial demand to not come back lessening the overall future demand
12
Natural Gas Price OutlookNatural Gas Price OutlookNatural Gas Price Outlook Natural Gas Price Outlook
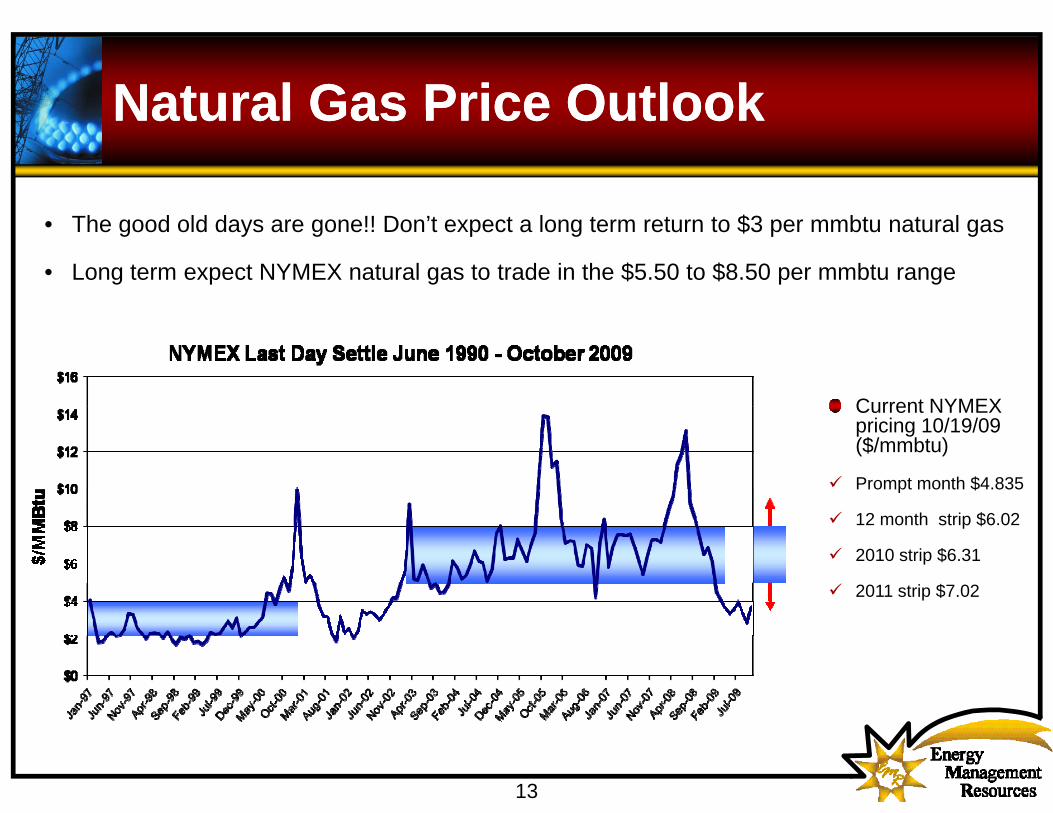
• The good old days are gone!! Don’t expect a long term return to $3 per mmbtu natural gas
• Long term expect NYMEX natural gas to trade in the $5.50 to $8.50 per mmbtu range
Current NYMEXCurrent NYMEX pricing 10/19/09 ($/mmbtu)
Prompt month $4.835
12 month strip $6.02
2010 strip $6.31
2011 strip $7.02
13
Electricity BasicsElectricity BasicsElectricity BasicsElectricity Basics
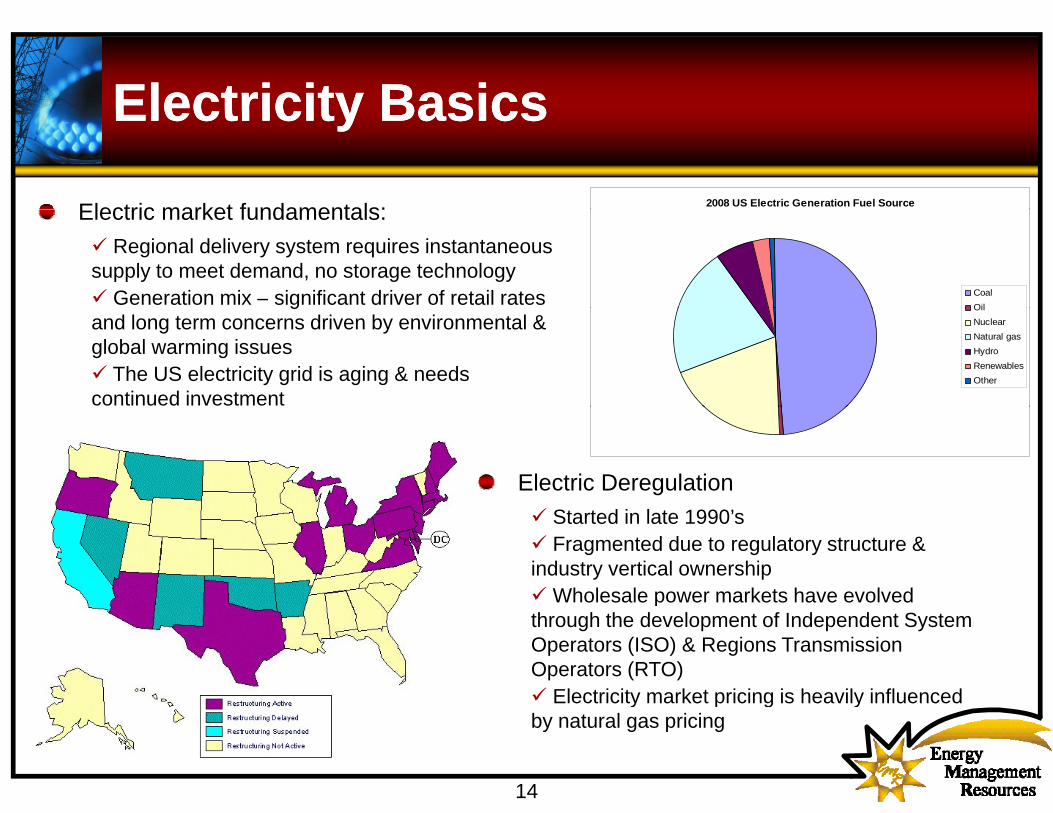
Electric market fundamentals: 2008 US Electric Generation Fuel SourceElectric market fundamentals:Regional delivery system requires instantaneous
supply to meet demand, no storage technology Generation mix – significant driver of retail rates Coal
Oilgand long term concerns driven by environmental & global warming issues
The US electricity grid is aging & needs continued investment
OilNuclearNatural gas HydroRenewablesOther
Electric Deregulation Started in late 1990’s Fragmented due to regulatory structure &
industry vertical ownership Wholesale power markets have evolved p
through the development of Independent System Operators (ISO) & Regions Transmission Operators (RTO)
Electricity market pricing is heavily influenced
14
Electricity market pricing is heavily influenced by natural gas pricing
Electricity Market DevelopmentsElectricity Market DevelopmentsElectricity Market Developments Electricity Market Developments
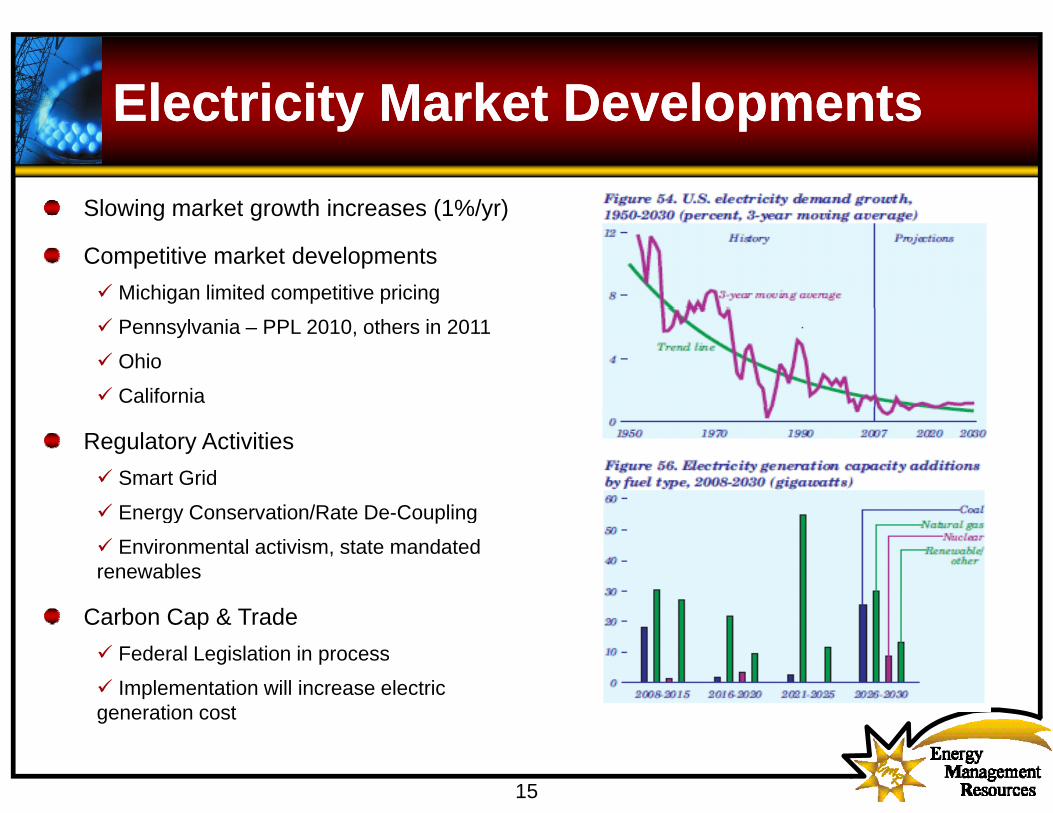
Slowing market growth increases (1%/yr)Slowing market growth increases (1%/yr)
Competitive market developments Michigan limited competitive pricing
Pennsylvania – PPL 2010, others in 2011
Ohio
California
Regulatory ActivitiesSmart Grid
E C ti /R t D C liEnergy Conservation/Rate De-Coupling
Environmental activism, state mandated renewables
Carbon Cap & TradeFederal Legislation in process
Implementation will increase electric
15
generation cost
Electricity Price OutlookElectricity Price OutlookElectricity Price Outlook Electricity Price Outlook
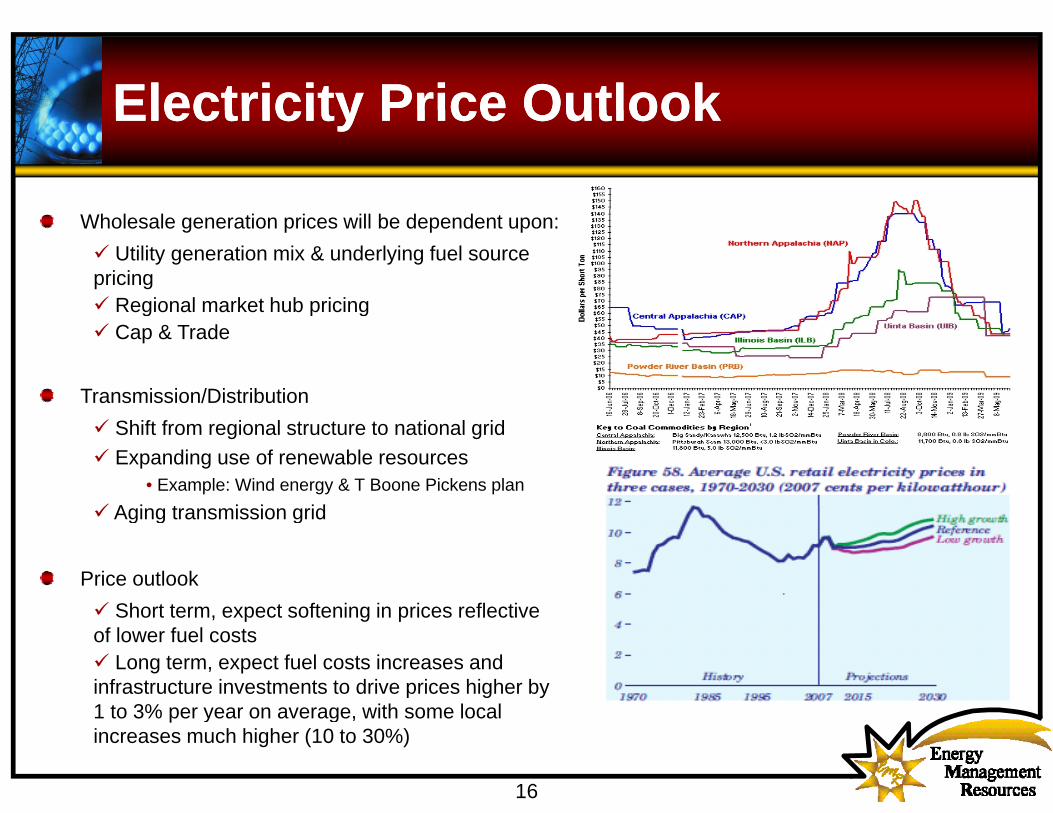
Wholesale generation prices will be dependent upon:Utility generation mix & underlying fuel source
pricing Regional market hub pricingRegional market hub pricingCap & Trade
Transmission/Distribution Shift from regional structure to national grid Expanding use of renewable resources
• Example: Wind energy & T Boone Pickens plan A i t i i idAging transmission grid
Price outlook Sh t t t ft i i i fl tiShort term, expect softening in prices reflective
of lower fuel costsLong term, expect fuel costs increases and
infrastructure investments to drive prices higher by
16
1 to 3% per year on average, with some local increases much higher (10 to 30%)

Questions/Questions/C t t I f ti f F ll UC t t I f ti f F ll UContact Information for Follow UpContact Information for Follow Up
Questions
Contact Information for Follow UpRich Rogers
Vice President Sales & Marketing
p
Vice President Sales & Marketing816-883-1018
Client Confidential – For use by EMR Clients only. This Update is provided for informational and discussion purposes only. The contents are not intended to be used as investment advice or recommendations of any buy
17
or sell strategies. The information contained herein is believed to be reliable, but EMR does not represent that it is complete or fully accurate. Clients should use the information in this Update as a part of an independent analysis of the market.