crudes oils & refining – outlook and impacts of … oils & refining – outlook and...
TRANSCRIPT

1
Crudes Oils & Refining – Outlook and Impacts of Regulations
Martin Tallett EnSys Energy
1775 Massachusetts Avenue, Lexington, MA 02420, USA(781) 274 8454
www.ensysenergy.com
Crude Oil Quality Association (COQA)Houston, October 28 2010

2
Overview
• Global downstream outlook– Where we are - Recession’s impacts– Drivers in future supply, demand, refining– Potential legislative impact – marine fuels– Implications for heavy/opportunity crudes
• Energy / climate legislation– Status & prospects: Europe, USA and other regions– Potential to re-arrange refining and oil markets– Implications for heavy/opportunity crudes
• Summary comments

3
EnSys Energy• 40 years of experience – refining, engineering back
grounds• Focus on regional and especially global integrated
studies using our WORLD model– Bottom up detail matched to top down scenarios

4
WORLD Model Overview

5
Global Modeling “Total Liquids”• WORLD calculates 22 global refining regions and
captures their interactions on a global scale
Study used version with US sub-regional refining detail

6
‐14
‐12
‐10
‐8
‐6
‐4
‐2
0
2
2006 2008 2010 2015 2020 2025 2030
million bp
d
Projected Demand LossAEO 2009 Stimulus ‐ AEO 2007
Recession’s Impacts - Demand Loss• 4 million bpd demand loss for 2010, 8 million for
2015/2020 versus prior expectation
4
8

7
Recession’s Impacts -Refining economics reverse - again
• Refining’s golden age short-lived
‐50
‐40
‐30
‐20
‐10
0
10
20
30
40
50
3/1/20
00
3/1/20
01
3/1/20
02
3/1/20
03
3/1/20
04
3/1/20
05
3/1/20
06
3/1/20
07
3/1/20
08
3/1/20
09
$
/
bbl
Differentials ‐ Recent History (USGC)
Gasoline ‐ Crude
Diesel ‐ Gasoline
Crude ‐ Resid
Now Back to slack
Wide light-heavy crude differentials, high margins

8
Recession’s Impacts -Pre-recession refinery projects still under way• Announced refinery projects have steadily
risen:
– early 2007 - 14 mb/d– early 2008 - 20 mb/d– early 2009 - 35 mb/d
• 6 mbpd actual expansions expected by 2015– Mainly capacity already under construction – Sustains capacity overhang, low utilizations
Source: OPEC World Oil Outlook 2009

9
Recession’s Impacts - Capacity Overhang
• Implication is significant refinery closures – Emphasis on USA, Europe, Japan
• Refineries that are smaller, inefficient, gasoline oriented, no specialty products/petrochemical integration, no geographic protection, no local crude
– n.b. 200,000bpd / 10 mtpa is no longer “big”
– 3+ million bpd of closures needed to restore regional refinery utilizations to 80-85% level by 2015
• This would not be the first time– 1980’s global capacity dropped by 9 mbd from 82 to 73 mbd

10
Recession’s Impacts – Growing Competition• Increasing inter-regional competition for
product markets:– Capacity surpluses / imbalances in USA and Europe
• US product exports have nearly doubled since 2005• Europe drive to export gasoline
– New large scale export refining capacity• India: Reliance / Essar• Middle East: ARAMCO
– High crude prices make product/crude relatively cheaper to move long distance
• Effect augmented by short term tanker over-supply, depressed freight rates
11
Looking Ahead- Baseline Outlook is Tough
• Severe reversal for refiners from growth/tightness to surplus/poor margins
– Collapsing demand has lead to an oversupply of product
– Continued refinery investments and biofuels growth are exacerbating excess refining capacity
– Prospects for poor margins and closures –especially OECD / Atlantic Basin

12
1
1.1
1.2
1.3
33
33.5
34
34.5
35
2005 2010 2015 2020 2025 2030
Sulphur %API
Global crude quality outlook
API
Sulphur
Looking ahead –Global crude slate quality relatively stable
– Slowly declining proportion of sweet/light crudes
– Slowly rising heavy – Oil sands / Ven
Orinoco offsetting dropping Mex/Ven conventional
– Gradually rising proportion of medium gravity
– Rising opportunity crude volumes
Source: OPEC World Oil Outlook 2009
Global Crude Quality Outlook
Includes condensates
0%10%20%30%40%50%60%70%80%90%100%
2010 2015 2020 2025 2030
Global Crude Supply (Excluding Condensates)
Medium (incl SCO)
Heavy (incl oil sands)
Light/sweet

13
Looking ahead –Non-crudes grow in importance• Strong growth of NGL’s, condensates, biofuels• Rising proportion of non-crudes in total supply
Source: OPEC World Oil Outlook 2009
0
4
8
12
16
2007 2010 2015 2020 2025 2030
mb
/d
Outlook for NGLs* supply to 2030, by region
FSU
Middle East
Asia
North America
Latin America
Africa
Europe
* Including other natural gas based streams like hydrogen, methanol and petrochemical returns.
0
2
4
6
8
2005 2010 2015 2020 2025 2030
mb/
d
Outlook for GTL/CTL, Biofuels Supply to 2030
CTL
GTL
Biodiesel
Ethanol

14
Looking ahead –Non-crudes cut refining, upgrading needs
• Non-crudes:– Are mainly light
clean streams– Satisfy around half
of the growth in liquids demand
– Reduce need for refinery production and upgrading

15
Looking Ahead –Demand growth emphasizes distillates• Projected to resume growth dominance – n.b. marine
fuels
‐2
0
2
4
6
8
10
12
14
Ethane/LPG
Naphtha Gasoline Jet/Kero
Diesel/Gasoil
Residual fuel*
Other products**
mb/d
2008 projections
2009 projections
Global product demand changes between 2008 and 2030
* Includes refinery fuel oil.** Includes bitumen, lubricants, waxes, still gas, coke, sulphur, direct use of crude oil etc.
Source: OPEC World Oil Outlook 2009

16
Looking Ahead –Land-based fuels quality tightening continues
• OECD regions relatively stable at ULS standards, but:
– US, possible “national clean gasoline”, EPA revised ozone standard
– Europe: Euro VI, marine fuel ECA’s, in port rule
• Non-OECD progressively moving to EURO III/IV/V standards

17
Looking Ahead –Demand Growth is in non-OECD
• Atlantic basin demand flat • Bulk of growth in Pacific basin
Source: OPEC World Oil Outlook 2009

18
Looking Ahead - Marine fuels regs could have massive impact on demand / quality• Official statistics seriously understate global marine
fuel consumption– Recent work by Navigistics
& others estimates demand at around 370 million tpa (6.7 mmbpd) twice that reported by the IEA
– assessment is supported by IMO
– Implication is around 450 mmtpa, 8.2 mmbpd, by 2020 of which 6 mmbpd is IFO
– IEA acknowledge the issue– misreported barrels
Navigistics Rigorous Methodology

19
Looking Ahead - Marine fuels regs could have massive impact on the downstream• Recent MARPOL AnnexVI regulations set out a
timetable for improved marine fuel environmental performance – standards are SOx, PM, NOx
– Today’s MGO/MDO can readily be desulfurized to 0.1/0.5%
– But IFO must be converted to distillate to meet 0.1/0.5%

20
Looking Ahead - Marine fuels regs could have massive impact on the downstream• Annex VI rule is clearly written but leaves open major
uncertainties:1. Future extent of ECA’s2. Timing of global 0.5% rule (2020 / 2025?)3. Potential extent of compliance by use of low sulfur fuel versus on-
board scrubbing• Current scrubber sea trials could mean their commercial
potential will be clearer with the next 1-2 years– Scrubbers could enable SOx standards to be fully met with existing fuel
mix, may be needed for PM– Outlook is anything from limited fuel change (0.1% MGO/MDO for current
ECA’s) to total IFO conversion– Uncertainty leads to “wait and see” by refiners and shippers– But implementation by 2020/2025 requires long lead times

21
Looking Ahead - Marine fuels regs could have massive impact on the downstream
• Depending on scrubber success, refiners are likely to see eitherpartial or total shift from IFO (residual) bunkers to marine distillate
– Studies by EnSys for EPA, API and IMO showed related additional upgrading capacity needed
– Still substantial even if conversion only partial
– Major implications for upgrading capacity, utilization, coke production
EnSys WORLD Model EnSys IMO 11/2007 Report
Current Estimate
IFO converted 2020 mmtpa 381 354IFO converted 2020 mmbpd 6.75 6.2
Global refining capacity impacts million bpcdcrude distillation 1.6 1.5vacuum distillation 5.8 5.4coking 2.5 2.3hydro-cracking 6.7 6.2sulfur tons pd 28,140 26,150
Incremental investment $bn $150 $150+(1)
Incremental pet coke output million tpa 47 43
Impacts of Total Global IFO Conversion to Marine Distillate
(1) Construction costs have since risen

22
Looking ahead –Refining margins depend on configuration
• Gasoline/naphtha projected to be in surplus, depressed margins, distillate re-strengthens
Source: OPEC World Oil Outlook 2009
Made little difference whether refinery
produced gasoline or distillate
Makes major difference whether refinery produces gasoline or distillate

23
Looking ahead –Refining margins depend on configuration• Unlike pre 2005, distinct margin differences depending
on whether refinery emphasizes gasoline or distillates– Upgrading:
• FCC, coking surplus, lower margins– FCC increasing resid feed, distillate yield
• Hydro-cracking / distillates in demand, higher margins– High crude prices relative to gas, coal/coke create incentives
for less carbon rejection, more hydrogen addition
– Quality:• Premiums remain for high quality products
– Scale:• Larger refineries (300,000 – 600,000 bpd) drive economies of
scale (e.g. Reliance)

24
Looking ahead –Relative crude, gas, coal prices a driver
• Potential for continued high price of raw material (crude) relative to coal/fuel grade coke, natural gas alters historical relationships
– Makes carbon rejection (coking, FCC) less attractive
– Hydrogen addition (hydro-cracking / HDS) more attractive
– Which also fits with trend to distillates and LS/ULS products
Constant dollar prices for US crude, coal, gas
Crude:NGSOutlook: 12 – 16:1Recent history 8-9:1Btu equivalent 6:1
25
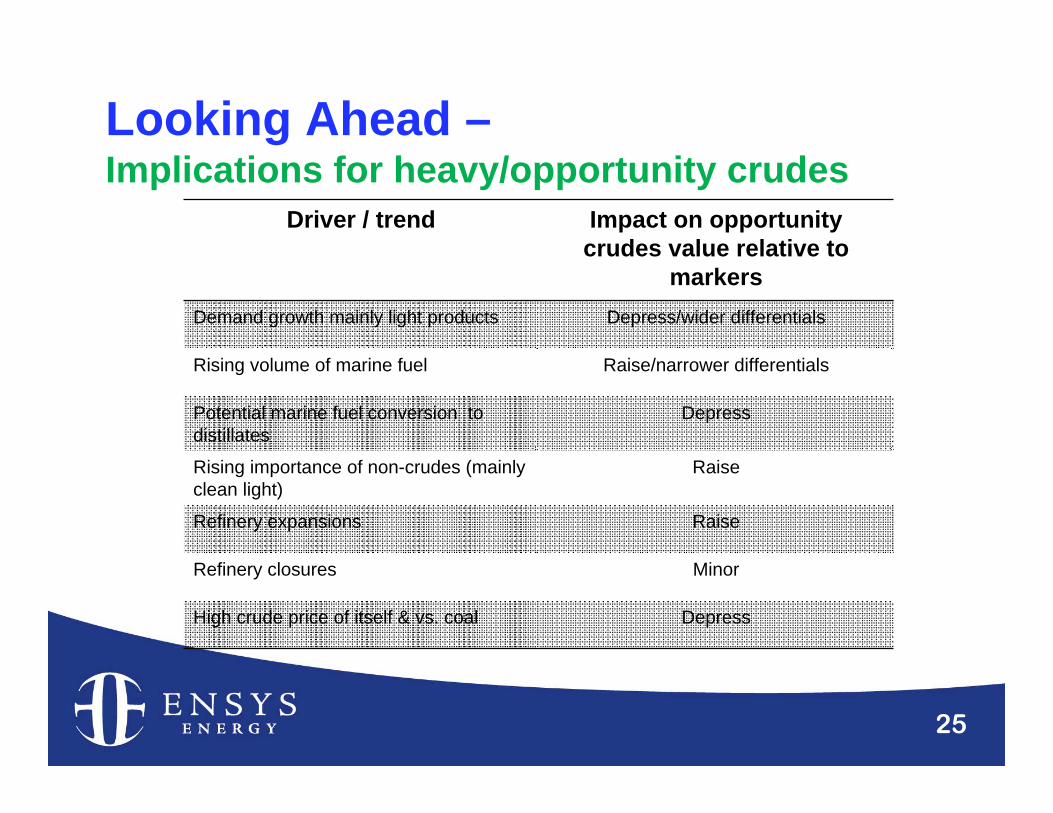
Looking Ahead –Implications for heavy/opportunity crudes
Driver / trend Impact on opportunity crudes value relative to
markersDemand growth mainly light products Depress/wider differentials
Rising volume of marine fuel Raise/narrower differentials
Potential marine fuel conversion to distillates
Depress
Rising importance of non-crudes (mainly clean light)
Raise
Refinery expansions Raise
Refinery closures Minor
High crude price of itself & vs. coal Depress

26
Energy/Climate Policy –Regulatory Emphasis is Shifting• 1990’s / early 2000’s
– Strong emphasis on fuels qualities / air emissions controls:
• US: RFG/oxy/ULSG/D EU: Euro III/IV/V• SOx, NOx, CO, HC, toxics, ozone, PM• Other regions: adopting Euro standards• Marine fuels: MARPOL Annex VI
• Mid / late 2000’s– Energy efficiency – GHG emissions– Energy security
Inherent conflict as fuels quality regs lead to more refinery processing

27
Energy/Climate Policy- Europe• Climate Action & Renewable Energy Package “20
20 by 2020”– 20% renewables by 2020– 20% GHG reduction below 2005 by 2020– Expand Emissions Trading System (EU ETS)
• Vehicles Emissions Performance Standards– 40% CO2 emissions reduction in new vehicles by 2020
• Fuel Quality Directive (Dec 2008)– Reduction in life cycle greenhouse gas emissions from
energy supplied• “binding target” of 6% possibly going to 10% by 2020
» 2012 review• 10% ethanol in gasoline, inland waterway fuel 10ppm Jan
2011
28
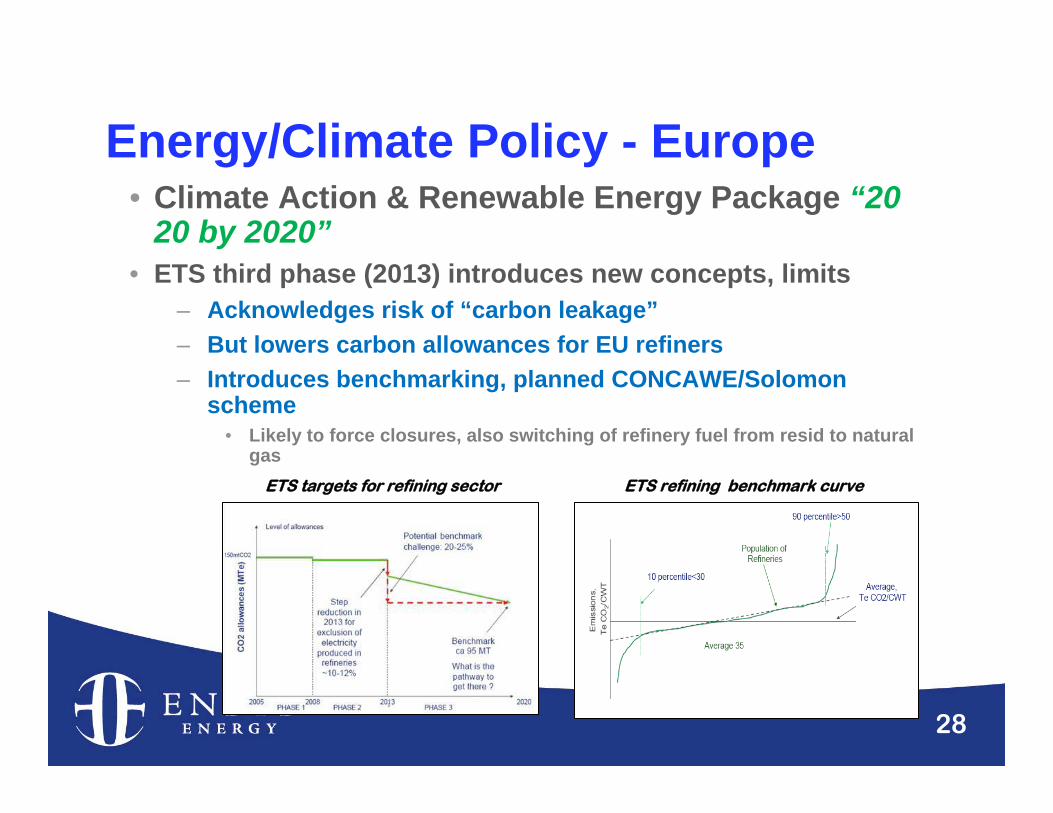
Energy/Climate Policy - Europe• Climate Action & Renewable Energy Package “20
20 by 2020”• ETS third phase (2013) introduces new concepts, limits
– Acknowledges risk of “carbon leakage”– But lowers carbon allowances for EU refiners– Introduces benchmarking, planned CONCAWE/Solomon
scheme• Likely to force closures, also switching of refinery fuel from resid to natural
gasETS refining benchmark curve ETS targets for refining sector

29
Energy/Climate Policy - Japan• Long history of climate action & efficiency
– 1997 Keidanren voluntary cap & trade– 2005 voluntary ETS, expanded 2008
• Covers 70% of industry– 2009 Innovation for Green Economy & Society Bill
• Stimulate energy efficiency, nuclear, renewables– 2010 draft comprehensive cap & trade legislation
• Carbon tax starting 2011, opposed by industry
• 2010 Refinery upgrading rule– METI rule requires refiners in Japan to increase resid
upgrading ratios – and/or close distillation capacity• Impact uncertain but primary effect could be closures
– Up to 1.3 million bpd needed to balance supply and demand

30
Energy/Climate Policy - China• Has opposed emissions cap
– But moving to increase energy efficiency, renewables• Wind, solar – but also CTL output
– Experimenting with cap & trade, carbon tax schemes– Goal to cut carbon intensity 40-45% by 2020
• Stimulate energy efficiency, nuclear, renewables
• Kyoto signatory but wait & see pending US legislation– Most provinces – but not Alberta – potentially covered
under US/Canada Western Climate Initiative– Focus more on carbon tax than cap & trade– BC initiative
Energy/Climate Policy - Canada

31
Energy/Climate Policy - USA• Multiple initiatives
– Administration “command & control”• RFS-2, CAFE, EPA GHG Tailoring Rule, (EPA ozone)
– Federal cap & trade• Passed house May 2009, apparently dead in Senate
– States/Regions cap & trade• California, western states, midwest, northeast
– Federal & States Low Carbon Fuel Standard• California: AB32• Northeast states: MoU Dec 2009• EISA 2007: Section 526, federal fuels
» (was component of W-M – could reappear)
32
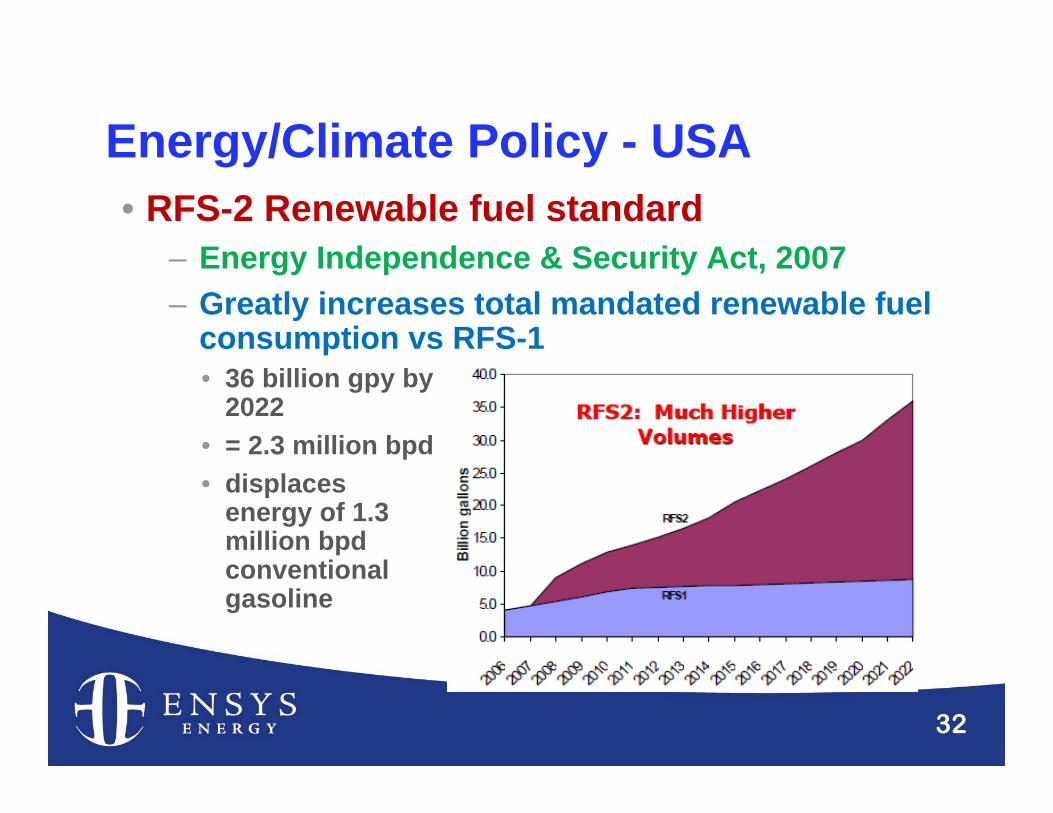
Energy/Climate Policy - USA• RFS-2 Renewable fuel standard
– Energy Independence & Security Act, 2007– Greatly increases total mandated renewable fuel
consumption vs RFS-1• 36 billion gpy by
2022• = 2.3 million bpd• displaces
energy of 1.3 million bpd conventional gasoline

33
Energy/Climate Policy - USA• National Fuel Efficiency Program
– Obama Administration, May 2009– Requires 35.5 mpg “CAFE” national new vehicle
standard by 2016• Compares to
28.2 2009 CAFE standard and about 25 mpg in 2009 for total US light vehicle fleet
• Equates to approx EU fleet today
0
5
10
15
20
25
30
35
40
2012 2013 2014 2015 2016
Average Required Fuel Economy (mpg) under Proposed Standards
Passenger Cars
Light Trucks
Combined

34
Energy/Climate Policy - USA• EPA
– Mandatory CO2 reporting from 2010• Foundation for GHG programs
– GHG Tailoring Rule (NPRM Sept 30th 2009)• Supreme Court ruled CO2 comes under Clean Air Act• First phase 14,000 large emitters > 25,000 tpy CO2 e• 68% of stationary source emissions
– Revised Ozone Rule (NPRM Jan 6th 2010)• 65-70 instead of 75 ppb standard• Aug 31st, 2010 - EPA target for Final Rule • August 2011 – final area designations• Implementation: 2014 – 2031 depending on severity• Implications for NOx, VOC, more low RVP gasoline
35
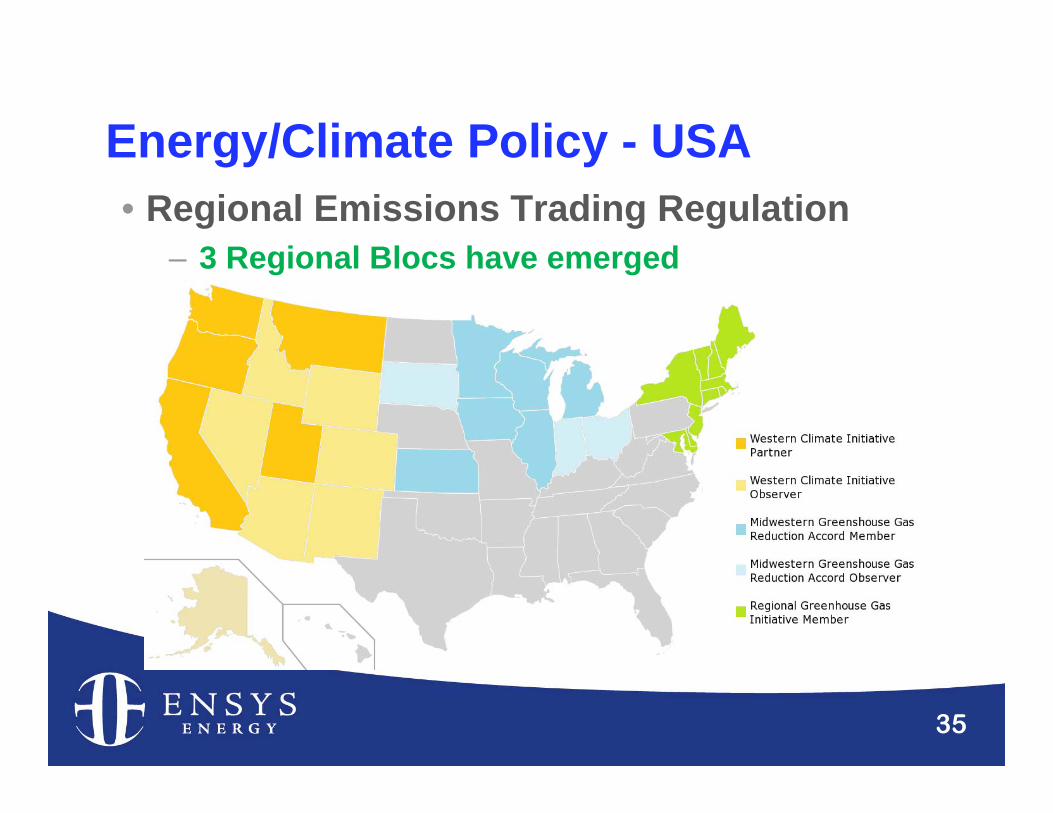
Energy/Climate Policy - USA• Regional Emissions Trading Regulation
– 3 Regional Blocs have emerged

36
Energy/Climate Policy - USA• Several initiatives include Low Carbon Fuel
Standard (LCFS) • Energy Independence & Security Act, Sec. 526
– Fuels to military, other Federal agencies must have life cycle GHG emissions <= conventional
• California AB32 – Cuts carbon intensity 10% by 2020
• Requires assessment of CO2 footprint on life-cycle “well to wheels” basis (not just fuel carbon content)
• Northeast & mid-Atlantic (11) States• Memo of Understanding, Dec 29th 2009

37
Energy/Climate Policy - USALCFS: Combustion is primary life cycle GHG contributor
Source: “Development of Baseline Data andAnalysis of Life Cycle GreenhouseGas Emissions of Petroleum-BasedFuels”, NETL, Nov 2008

38
Energy/Climate Policy - USA• LCFS: but much of focus has been on production

39
Energy/Climate Policy - USA• Federal climate bills
– Waxman-Markey, House Bill, passed May 2009• “American Clean Energy and Security Act ”• Cap & trade
– Kerry-Boxer, Senate Bill, drafts Sept, Nov 2009• “Clean Energy Jobs and American Power Act”• On-going negotiations• Passage of cap & trade bill questionable in 2010

40
Climate Legislation is Likely to Re-arrange Oil Markets• Carbon allowance costs / taxes will act to raise
refinery energy/hydrogen efficiencies but scope is limited
– Several areas of potential exist:• Heat integration, co-generation• New technologies for heat exchanger cleaning / performance and for inspection• Process catalysts operating at lower P, T, H2 consumption• H2 plant higher efficiencies, (possible CCS)
– But high crude/fuel prices arguably will drive part of this anyway– Potential may be 10% to possibly 20% over time– Cannot “wish away” the energy/H2/processing disadvantages of
heavy/opportunity crudes

41
Climate Legislation is Likely to Re-arrange Oil Markets• Depending on the way legislation is written,
could relocate refining capacity over time– Generally out of OECD into non-OECD regions
• Results from EnSys’ 2009 study of Waxman-Markey for the API illustrate
– Produce more refinery CO2 “leakage” than reduction
0.0
2.0
4.0
6.0
8.0
10.0
12.0
14.0
16.0
18.0
2015 2020 2030
million bp
d
Estimated US Refinery Throughputs
Baseline
Basic Case
No International / Limited Case
52.054.056.058.060.062.064.066.068.070.072.0
2015 2020 2030
million bp
d
Estimated non ‐ US Refinery Throughputs
Baseline
Basic Case
No International / Limited Case
Source: EnSys study of Waxman-Markey for the API 2009
42
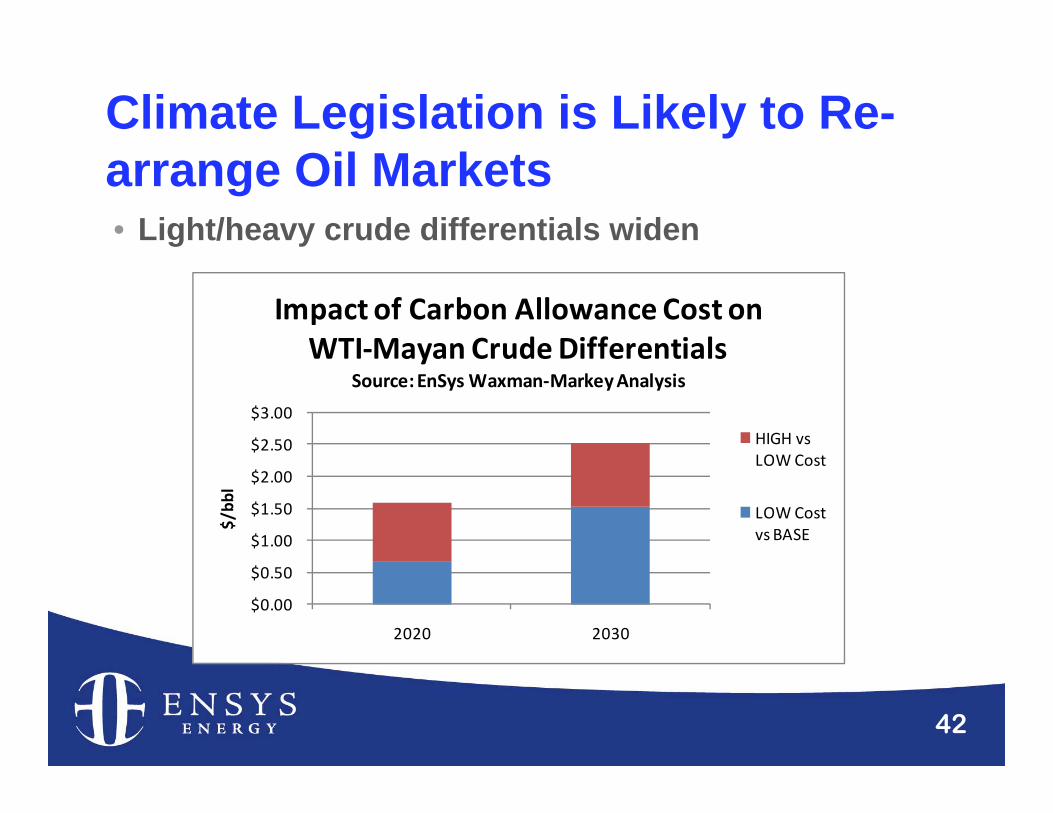
Climate Legislation is Likely to Re-arrange Oil Markets• Light/heavy crude differentials widen
$0.00
$0.50
$1.00
$1.50
$2.00
$2.50
$3.00
2020 2030
$/bb
l
Impact of Carbon Allowance Cost on WTI‐Mayan Crude Differentials
Source: EnSys Waxman‐Markey Analysis
HIGH vs LOW Cost
LOW Cost vs BASE

43
Climate Legislation is Likely to Re-arrange Oil Markets• Carbon regime regions, e.g. US, Europe, likely to take
in more light, sweet crude, less heavy, sour– Changed crude trading patterns – Less upgrading in carbon region refineries– Investments in heavy crude refineries hardest hit
• LCFS likely to further extend these impacts– e.g. Canadian oil sands, Ven syncrudes to US
$0 $10 $20 $30 $40 $50 $60 $70 $80
Base Low Cost High Cost
$(20
07) billion
Impacts of Carbon Cost on Refining Investments ‐ to 2020
Source: EnSys Waxman‐Markey Analysis
Large/Heavy
Medium/Cracking
Small

44
Climate Legislation is Likely to Re-arrange Oil Markets• Carbon regimes (and the often related
transport efficiency measures) cut demand– IPCC scenarios show the potential for demand reduction and
differences between OECD and non-OECD
– A recent EPA study projected potential for US transport fuel demand reduction of 4-7 mmbpd by 2030 versus “reference” outlook
– Adding demand and price differential factors together, carbon legislation could cut opportunity crude production
20
30
40
50
60
70
2008 2010 2012 2014 2016 2018 2020 2022 2024 2026 2028 2030
mb/d
OECD oil demand under Alternative Scenarios, 2008‐2030
Higher growth scenarioReference caseLower growth scenarioCategory III concentration stabilization scenarioCategory II concentration stabilization scenario
20
30
40
50
60
70
2008 2010 2012 2014 2016 2018 2020 2022 2024 2026 2028 2030
mb/d
Non‐OECD oil demand under Alternative Scenarios, 2008‐2030
Higher growth scenario
Reference case
Lower growth scenario
Category III concentration stabilization scenario
Category II concentration stabilization scenario
50
60
70
80
90
100
110
120
2008 2010 2012 2014 2016 2018 2020 2022 2024 2026 2028 2030
mb/d
Global oil demand under Alternative Scenarios, 2008‐2030
Higher growth scenarioReference caseLower growth scenarioCategory III concentration stabilization scenarioCategory II concentration stabilization scenario
global OECD Non OECD

45
Climate Legislation - Implications for heavy/opportunity crudes
Climate legislation impact Impact on opportunity crudes
Crude valuations:Shift to reflect carbon content / LCFS profile
Heavy / opp crudes values drop relative to markers / light sweet
Crude trade:Incentives to move heavy/opp crudes out of carbon regime regions, light sweet crudes in, medium grade (Middle East) crudes balance
Latin American crudes to China, India, other?
Canadian oil sands to Asia?California heavy grades to Asia?
Crude runs:Potentially cut in carbon regime areas, increased outside
Reinforces potential routing changes for heavy / opp crudes
Supply/demand:Carbon regimes aim to cut oil products demand, raise alternative fuels supply
Reduced need for, value of / production of heavy / opp crudes

46
Summary Comments2010/2012: Key time• We are in a period of exceptional uncertainty and
potential for change• 2010-2012 could be a key period for achieving some
form of clarification:– Hopefully post-recession economic growth more set– Production/exports progress: WCSB, ESPO, Orinoco, Kuwait, Iraq– Marine fuels – scrubbing potential, ship efficiency/CO2 measures – Progress in EU on new carbon rules and implementation– Japan, Australia, China initiatives– US new energy legislation, Federal “energy” else regional??
• A clearer picture for crude producers & refiners 2+/-years from now?

47
Thank you !
Martin Tallett EnSys Energy
1775 Massachusetts Avenue, Lexington, MA 02420, USA(781) 274 8454
www.ensysenergy.com