crumbling concrete estimated cost for replacing · pdf file05.09.2016 · 5...
TRANSCRIPT
Development and Application of a Model to Estimate Costs to Replace Failing Residential Foundations in Connecticut
September 5, 2016
James Mahoney Ellington, CT
In Association with the Connecticut Coalition Against Crumbling Basements

2
Disclaimer
The contents of this report reflect the views of the author who is responsible for the facts and the accuracy of the data presented herein. The contents do not represent the views of the author’s employer at the time of writing of this document. The estimates provided in this analysis are intended solely for purposes of understanding the magnitude of the issue discussed herein. The results are concepts and provide a methodology for further identifying areas where further refinement is required. If additional information becomes available, the models and estimates can be further refined.
3
EXECUTIVE SUMMARY
This paper outlines the background of the failing residential foundation issue in at least 20 municipalities located in North Central / Northeastern Connecticut (in total, home to 11% of Connecticut’s overall population), as well as the development and application of a simple mathematical model to estimate the costs (in 2016 dollars) to replace the residential failed/failing foundations. The model presented herein was developed using publically available data from sources that include the Connecticut Department of Economic and Community Development, US Census, correspondence between State entities, various media pieces and the concrete / construction industry. It is noted that additions to existing homes and repairs made to existing home foundations are not considered herein, as the publicly available data only references new housing permits. In addition, concrete used in the construction of commercial properties, public buildings (e.g., schools), roads, bridges, septic tanks, concrete driveways, swimming pools, footings for decks, sidewalks, stamped concrete patios, and other concrete products are not included in this analysis. Costs associated with the foundations affected in Massachusetts are also not included. Based on the model inputs and assumptions outlined herein, the estimated cost to
replace affected foundations for residential dwellings is well above $1 billion
dollars for the region; this only represents costs tallied for the 20 Connecticut
municipalities that are currently known to be affected. This is likely a conservative cost estimate.
This estimate does not take into account the indirect costs to homeowners that
are associated with trying to remedy this problem including, but not necessarily
limited to: legal fees, engineers’ fees, the costs for conducting petrographic
analysis, building permit fees and interest on loans.
All residents of the 20 identified Connecticut municipalities are affected whether
or not they are impacted directly by this problem. The loss of property value will cause a drop in the Grand Lists of the affected communities, resulting in an increase in taxes, a reduction in services, or a combination thereof. The reduction of property values caused by uncertainty within the housing market, mortgage defaults, bankruptcies and abandoned properties will likely result in widespread suppression of real estate values that could last a generation. There are very few “slow-motion disasters” of a similar financial magnitude and
duration that have occurred in the United States. What can be concluded is that the order of magnitude of the financial remedy for
this problem is very large and will require the collaboration of both the public and
private sectors to resolve.

4
The following recommendations are made:
• It is recommended that the State of Connecticut obtain records from JJ Mottes from the years 1983 through April 2016 and provide written notification to all potentially affected property owners.
• To understand the magnitude of the public safety issue associated with the potential failures of septic tanks and other pre-cast products produced by JJ Mottes, it is recommended that the State obtain and make public the records of sale of these items.
• It is recommended that the State of Connecticut develop a standard regarding the allowable percentage of deleterious materials (pyrrhotite included) contained in aggregate used in the making of concrete.
• Further, it is recommended that a petrographic analysis of aggregates being
used for concrete be performed by a certified laboratory at least every two years and that the petrographic test results be filed with the Connecticut Department of Consumer Protection to ensure that the standard for deleterious materials is met.
• It is recommended that local, State and Federal officials interface with officials in
Massachusetts to determine potential solutions that will serve to aid the greater affected region.
• In order to restore confidence in the real estate market in the affected areas and
to protect property values, it is recommended that there be a requirement that concrete cores be tested for all foundations installed from 1983 through April 2016 in order for them to be salable. Associated “sub-requirements” and exceptions are also presented in the Recommendations section of this report.
• It is recommended that the State of Connecticut request the core testing results
that have been collected by the insurance companies. This represents a significant amount of data which could be used to better understand the scope of this issue.
5
Background: In North Central / Northeastern Connecticut, there have been a significant number of concrete foundations that have exhibited a unique pattern of cracking that ultimately leads to homes becoming unsafe. These foundations were poured starting in the early 1980s and the problem has been formally recognized in foundations poured as late as 2003. The common thread in these foundations appears to be the source of the concrete. The ready mix concrete used in many, if not all, of the foundations reported as exhibiting this problem came from the Joseph J. Mottes Company (JJ Mottes) in Stafford, CT. According to the JJ Mottes website (a “live” website until recently), they are purveyors of ready mix concrete as well as precast products such as septic tanks and other septic drainage structures (e.g., dry wells, infiltration galleries). Through a study being conducted by the Connecticut Department of Consumer Protection, it has been determined that the aggregate used to make the concrete came from Becker’s Quarry (owned by the same family as JJ Mottes) in nearby Willington, CT. It has been determined that the Becker’s Quarry aggregate contains the iron sulfide mineral pyrrhotite. When pyrrhotite oxidizes in the presence of water and oxygen, it releases sulfates, which cause the formation of new, secondary minerals (1). These newly formed minerals occupy more space than the original materials contained within the concrete. As the concrete swells in response to the secondary mineral formation, this creates an internal tensile stress within the concrete. Ultimately, the swelling causes the concrete to crack, resulting in the characteristic “map cracking” that is indicative of this problem. This cracking continues to worsen until such time that the foundation becomes unstable. Typically, it takes more than ten years from the time of the concrete placement for the symptoms of this problem (i.e., the cracking) to become visible, as failure of the concrete occurs from the interior to the outward surfaces. The author has received a petrographic analysis report for a detached garage foundation (unsealed frost walls) poured in 2013. The results, although characterized as inconclusive, do show areas with high levels of ettringite within the air voids (even closing up some of the smaller voids), which may be indicative of sulfate attack; especially for such young concrete. In addition, it was noted in the report that a small portion of the aggregate particles has slightly de-bonded from the cement paste on typically one face of the particle. This may be indicative of the expansion of the cement paste. This same phenomenon was noted to exist in the concrete core samples collected from the author’s house foundation which was characterized definitively as suffering from sulfate attack, likely as the result of the presence of pyrrhotite in the aggregate. Pyrrhotite and marcasite (both iron sulfide minerals) were also discovered in the aggregate as part of the petrographic analysis performed on the concrete core taken from the detached garage, further confirming that this problem should be considered present in concrete poured through 2013. Further, it was reported on February 23,

6
2016 that JJ Mottes continued to purchase their aggregate from Becker’s Quarry at least through that date (2). This corroborates the September 22, 2015 statement from JJ Mottes’ Secretary, John Patton, that they have not changed their materials or processes since the 1990s (3). As such, the author has assumed that concrete poured by JJ Mottes through 2015 is potentially affected.
To date, this problem has been confirmed in 20 municipalities in North Central / Northeastern Connecticut (4). These Connecticut municipalities include:
Andover Mansfield Ashford Somers Bolton South Windsor Coventry Stafford East Hartford Suffield East Windsor Tolland Ellington Union Enfield Vernon Glastonbury Willington Manchester Woodstock
Figure 1 shows the municipalities affected, highlighted in blue. Note that additional Connecticut municipalities may be added to the list above as the true geographic extent of this problem is determined.

7
Figure 1 – Municipalities Where Crumbling Foundations Have Been Confirmed
JJ Mottes also delivered concrete to municipalities in Massachusetts. In fact, it has been reported that residential foundations in the following six Massachusetts towns are affected: East Longmeadow; Hampton; Monson; Palmer; Ware and Wales (5). In addition, it has been reported that JJ Mottes delivered concrete from Springfield to Charleton, MA (5). However, the focus of this analysis is solely on residences in Connecticut. According to the 2015 United States (US) Census, the combined population of the above-referenced 20 Connecticut municipalities is just under 400,000, which represents 11.1% of Connecticut’s population. Objective:
The objective of this white paper is to estimate the potential number of residential homes in Connecticut with foundations containing JJ Mottes concrete and to provide a preliminary estimate of the potential costs of replacing the affected foundations. This will be accomplished using publicly available information to make these estimations. If actual data were available from JJ Mottes, these estimates could be refined. Also, as data is collected and compiled by each municipality, the estimates can be refined to hone the “order of magnitude” costs presented herein to more precise numbers. Based on the fact that this paper was authored in August 2016 and the housing permit data was not yet publically available for this year as a whole, this model assumes that residences constructed from 1983 through 2015 were potentially impacted.

8
For purposes of the analysis and estimation, all new residential housing permits issued in any given year were modeled as single-family houses. This assumption was made for consistency purposes throughout the calculations, as it was not possible to account for all of the potential configurations of the residential multi-unit buildings constructed. Additions to existing homes and repairs made to existing home foundations are not considered herein as the publicly available data is not compiled in the same manner as for new housing permits. In order to obtain the data for additions and repairs, the building records in each municipality for each of the years of interest will need to be researched. In addition, concrete used in the construction of commercial properties, public buildings (e.g., schools), roads, bridges, septic tanks, concrete driveways, swimming pools, footings for decks, sidewalks, stamped concrete patios and other items constructed with concrete are not included in this analysis. Methodology:
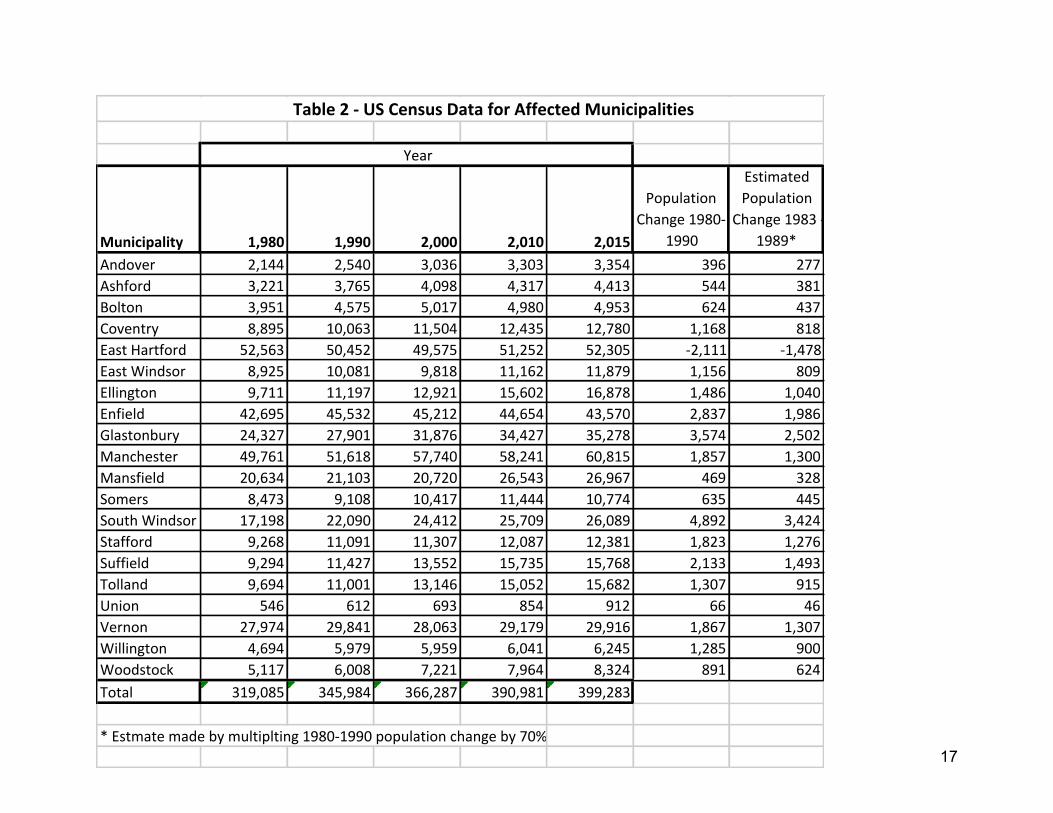
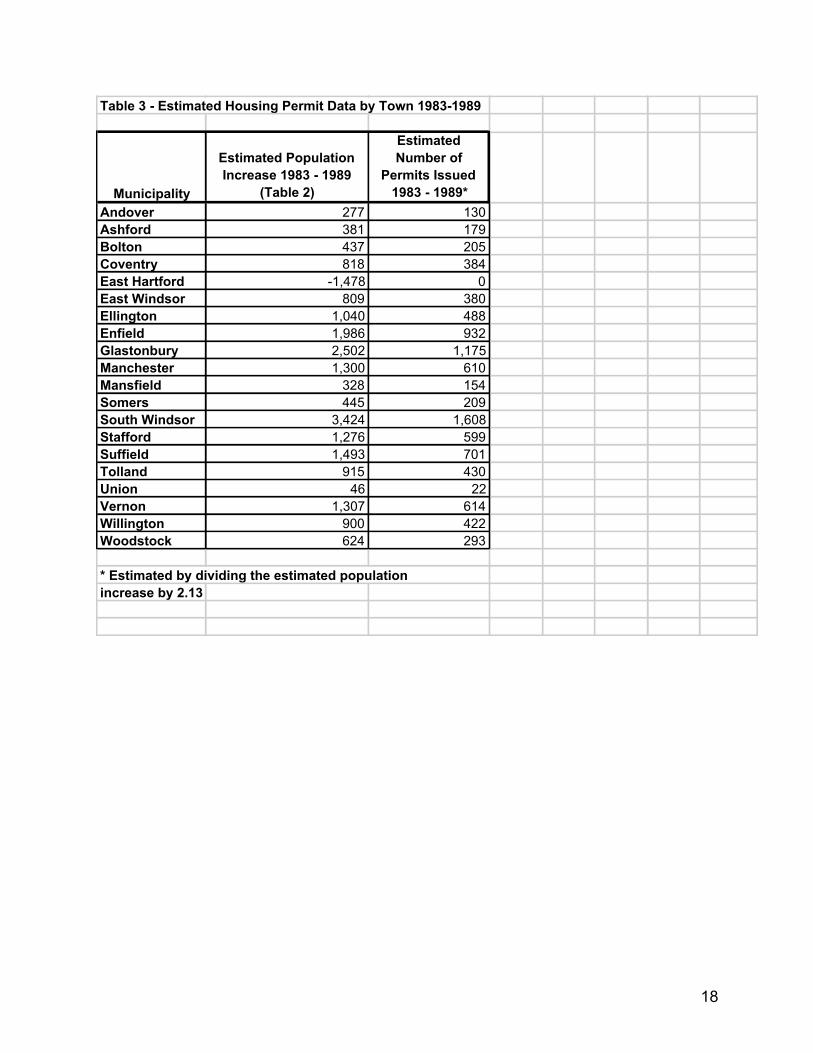
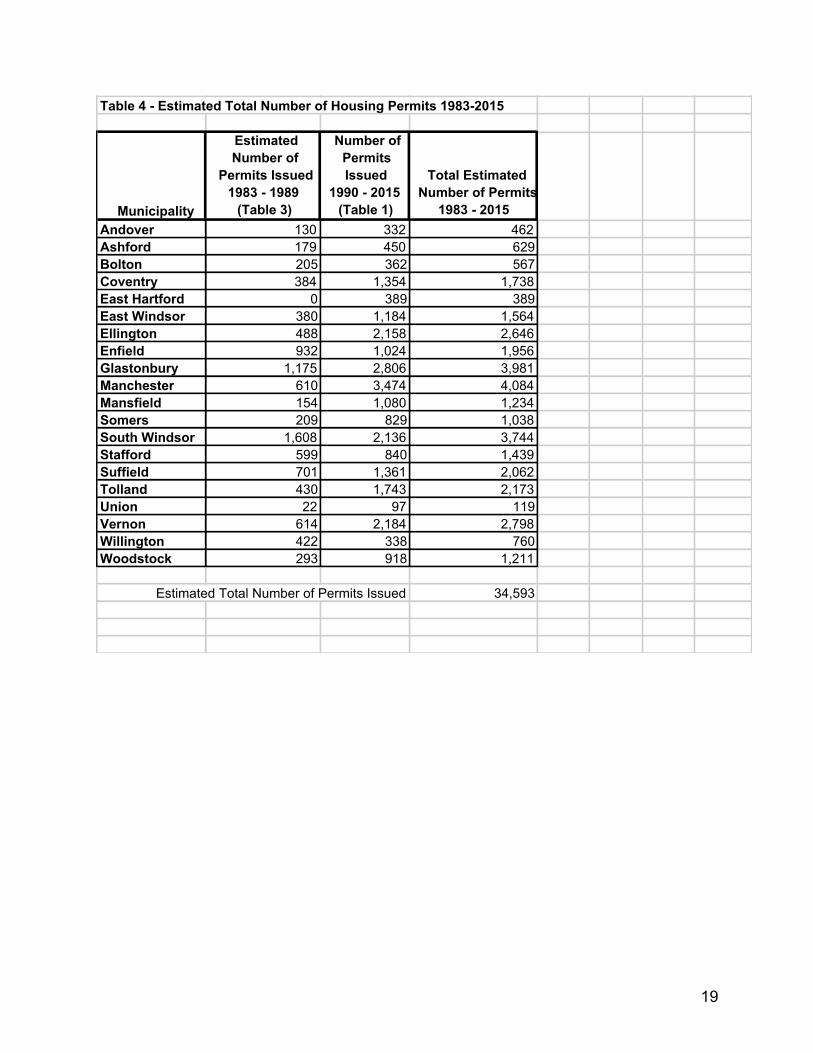
Estimating the Number of New Homes Built Between 1983 and 2015 Information was gathered on the number of housing permits issued between 1983 and 2015 in the 20 municipalities identified as having failing foundations. The Connecticut Department of Economic and Community Development (DECD) published data on housing permits issued from 1990 through 2015 on their website (6) and this data was used for the specifics required for this analysis. Table 1 contains the data from the DECD for the years 1990 through 2015. The housing data for the period 1983 through 1989 were not readily available and therefore, the number of permits issued was extrapolated from the population data. Table 2 contains the US Census data for the years of interest. As there is no data available to determine the rate of population change that occurred during the decade between 1980 and 1990, it was assumed that the rate of change was linear for the 10-year period. For the affected municipalities, the population increases from 1980 to 1990 were calculated. The population increase for each municipality was then multiplied by 70% to account for the seven years from 1983 through 1989. An assumption was made that the population increases in each municipality were directly related to an increase in the residential housing inventory from new construction. To compute how many new permits the population increase translated to, the population increase was divided by an estimate of the average number of people living in a single household. This estimate was developed by dividing the population increase by the number of permits issued from 1990 through 2015, resulting in 2.13 people per permit. Assuming that this ratio was similar for the years 1983 through 1989, the number of permits was estimated by dividing the population increase by 2.13 for each municipality. Table 3 shows the

9
estimated number of residential housing permits issued by each town from 1983 through 1989. Note that there was an anomaly in the East Hartford data. Since the population decreased from 1980 to 1990, the model yielded a negative number of housing permits. Since it is not possible to have a negative number of housing permits, the value for East Hartford was changed to reflect zero permits issued between 1983 and 1989. This is not to imply that no new construction took place in East Hartford during these years, but for modeling purposes, the number of permits was assumed to be zero in order to be conservative. The estimated total number of residential permits issued (per municipality) for the period of 1983 through 2015 can be seen in Table 4. Estimating Percentage of New House Foundations with Concrete from JJ Mottes
Fresh concrete has a limit as to how far it can be trucked before it begins to “set” or harden, therefore impacting its long-term performance. The American Society for Testing and Materials (ASTM) specification C-94 (Standard Specification for Ready-
Mixed Concrete) limits the time from when water is initially added to the cement to the discharge of the concrete from the truck to 90 minutes. This makes the geographic distance from the point of production to the point of placement a strong factor in determining which concrete producers are used at the time of construction. There are many other factors that may influence which concrete supplier is chosen by a contractor. These factors include pricing and production/trucking capacity. It was not possible to isolate the analysis on pricing or the production capacity for each of the concrete suppliers in the area for this analysis, as this information is not publicly available. For this analysis, geographic location was used as a predictor of the likelihood of a particular concrete supplier being chosen for projects in a given municipality. Ideally, the location of every placement of concrete made during this period would be known and could be factored into the analysis, but that information does not exist, nor would it be practical or feasible to obtain this information. In lieu of this data, the distance from the production facility to each municipality’s Town Hall was used, taking into account that most Town Halls are reasonably centralized within the geographic boundaries of the municipalities. These distances (in mileage) between the concrete production facilities and Town Halls were calculated using Google Maps and, as a consistency measure, the shortest distances were always chosen (even if the route was not necessarily conducive to travel with concrete mixing trucks). It is understood that this neglects the effects of using highways versus secondary roads for expeditious travel, but it was determined that analyzing route choice options for delivery was beyond the scope of this analysis. For this analysis, the street addresses for seven concrete batch plants were identified, as follows:

10
• Andrew Ansaldi Company at 186 Bidwell Street, Manchester, CT • Builders Concrete at 40 Adams Street, Manchester, CT • Builders Concrete East at 79 Boston Post Road, North Windham, CT • Enfield Transit Mix at 84 Broad Brook Road, Enfield, CT • JJ Mottes at Meadow Lane, Stafford Springs, CT • Jolley Concrete at 42 Junior Avenue, Danielson, CT • Tilcon-Roncari at 60 South Main Street, East Granby
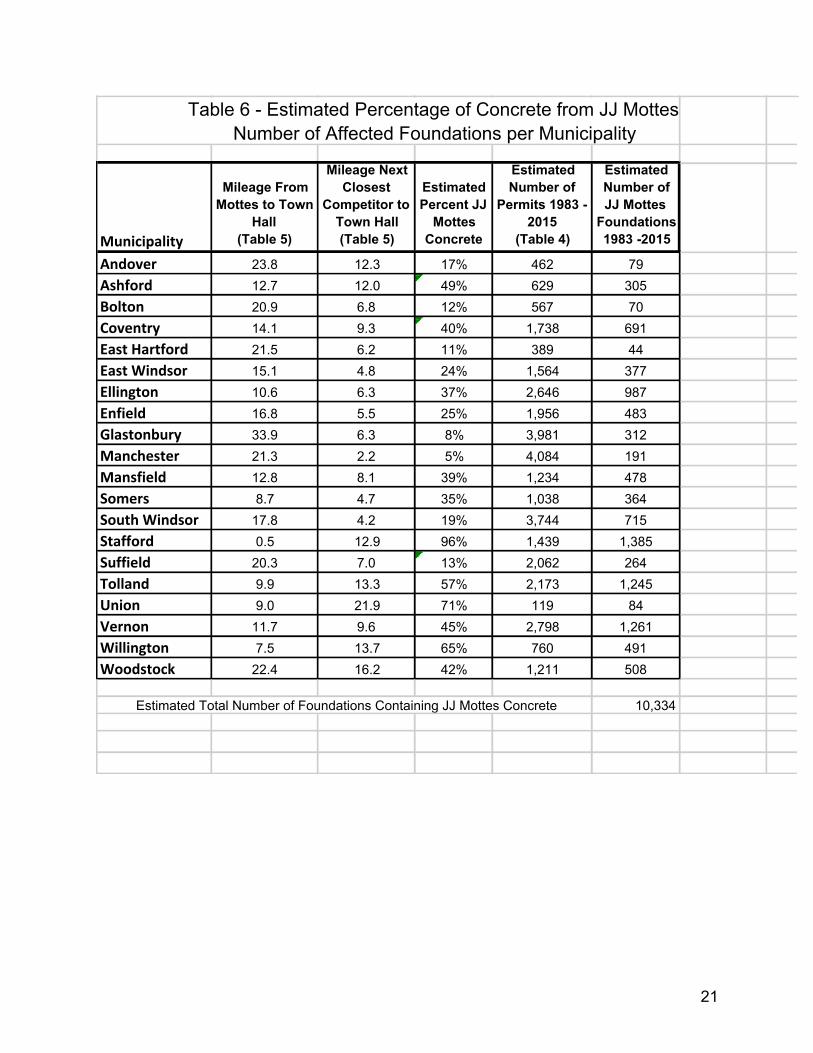
While it is acknowledged that there are other suppliers of concrete that deliver to the impacted areas, the distances of their plants from the affected areas were great enough that their lack of inclusion was not thought to significantly impact the estimation using the selected methodology. Table 5 shows the distances in miles between these suppliers and the respective Town Halls. A mathematical model was developed to estimate the number of foundations placed using JJ Mottes concrete. As this is intended to be an estimate, a relatively simple mathematical approximation was developed using the mileages presented in Table 5. To make the model relatively simple, it was assumed that for each municipality, there were two primary suppliers of concrete and that the market would be divided in half and then adjusted according to the ratio of the proximity of the concrete producers to the municipality. As the focus of this analysis is to estimate the number of potential foundations impacted by failing concrete supplied by JJ Mottes, they were always considered to be one of the two suppliers. An additional modification of the model (described later in this paper) was then made for the municipalities on the periphery of the affected area, as JJ Mottes likely represented a considerably smaller market-share in those municipalities. The model used for calculating the percentage of foundations (per municipality) containing concrete produced by JJ Mottes (% JJ Mottes) is as follows:
% JJ Mottes = [0.5 + 0.5*(Mnc – MMottes)/(Mnc+MMottes)]*100 Where: Mnc = Mileage to Next Closest Producer MMottes = Mileage to Mottes Concrete
It is assumed that there are two major suppliers (one of which is JJ Mottes) for each municipality
and the market is split in half, represented by the 0.5 with an adjustment for geographic locations
of each supplier by 0.5*(Mnc – MMottes)/(Mnc+MMottes).
As an example: % JJ Mottes (for Stafford) = [0.5+0.5*(12.9-0.5)/(12.9+0.5)]*100 = 96.2% Additionally, for municipalities that are located more than 20 miles away from JJ Mottes’ facility and where there was a competitor more than 10 miles closer to the municipality, the % JJ Mottes was divided by two to better represent the expected market-share (thereby, more strongly favoring the closer geographic competitor).
11
Ideally, in any model development, there is a data set that could be used to calibrate the model. In this situation, such a data set either does not exist or the concrete suppliers are not willing to make this information public (note that the State may be able to obtain information from suppliers). As such, this methodology is likely conservative, with a reasonable probability that this is an underestimate of the number of foundations containing JJ Mottes concrete. Table 6 contains the estimated percentage of foundations containing concrete produced by JJ Mottes in each municipality and the estimated number of residential foundations containing JJ Mottes concrete that were poured from 1983 through 2015. The estimated numbers of affected foundations in Manchester and South Windsor appear to be low based on anecdotal evidence. This may be reflective of more ideal routes of travel (i.e., I-84 allows for quick travel from Stafford Springs to the Manchester - South Windsor area). Again, as the purpose of this analysis is to provide an estimate of the potential replacement costs for the region, adjustments to the model are difficult without additional data. The limited data that is publicly available indicates that the estimates presented herein for the numbers of potentially affected foundations are conservative. In a letter dated February 3, 2016 from the Town of Union to property owners identified as possibly being affected by the concrete problem, it was stated that over 80 property owners within the town with concrete foundations poured between the years of 1983 and 1999 may be affected (7). Using the methodology described herein, an estimated 65 houses1 constructed over that period may be impacted by the concrete problem. It is unclear if the Town of Union included additions to existing homes or repairs made to existing houses in stating that over 80 property owners’ foundations may be affected. In addition, JJ Mottes has stated that they made more than 10,000 concrete placements from 1998 through mid-2015 (the date of an NBC 30 news report). These placements included residential, commercial, municipal and state projects (8). While not all of those placements were at residential properties, it would stand to reason that a significant number of them were on residential projects. The number provided by JJ Mottes does not include any concrete placements from 1983 through 1997, an additional 15 years that are not accounted for. Assuming that their business volume was approximately the same from 1983 through 1997 as it was from 1998 through 2015, then the number of overall concrete placements would be approximately 20,000. In the estimation performed in the analysis presented herein, just 10,000 concrete pours were identified. Therefore, based on the information from the Town of Union and JJ Mottes’ own statements, it appears that the estimates provided in this analysis are conservative (considerably lower) as compared to the amount of JJ Mottes concrete that actually has been placed. 1 The estimate of 65 houses that may be affected is derived by adding the numbers of permits issued in Union between the years 1990 and 1999 (from Table 1 – 43 permits) to the estimated number of permits issued from 1983 through 1989 (from Table 3 – 22 permits).
12
Cost Estimation for Replacing Varying Percentages of Impacted Foundations and
Footings
The cost for replacing foundations and footings will vary greatly from home to home based on many factors, including, but not necessarily limited to: the size of the home, type of foundation/basement, accessibility around the home, damage to the structure from foundation shifting, removal of porches and decks, damage to hardscaping such as sidewalks and patios, and landscaping replacement. Therefore, it is difficult to put a standard price on what it would cost to return a home to its original condition with a sound foundation and footings. At this point in time, it is also difficult to know exactly what percentage of foundations will need to be replaced. Table 7 provides total foundation replacement costs (2016 dollars) by municipality for various replacement percentages based on what is assumed to be an average foundation and footing replacement. The basis for this assumed foundation and footing replacement cost is explained below and noted at the bottom of Table 7. An average value of $150,000 for foundation and footing replacements was selected based on cost estimates ranging from $125,000 to as much as $250,000 (9). In addition, an average value of $10,000 was used for the removal and reconnection of all the mechanicals in the basement, including the removal and reinstallation of a heating oil tank (9). A value of $15,000 was used for the removal of lally columns and replacing concrete floors (9). The “miscellaneous house repairs” value of $5,000 included any repairs necessitated from the shifting foundation and repair of any damage remaining after the house is returned to the new foundation. These estimates do not include costs associated with the demolition and replacement of finished basements. The estimated cost of hardscaping replacements assumed that sidewalks in close proximity to a house, patios and paved driveways will need to be repaired or replaced. The relocation cost estimate included 4 months of rent, the costs of renting storage for items displaced from the basement, as well as moving necessary belongings to a rental property and back. Given the apparent conservative nature of the estimated number of homes affected, it would seem plausible that the percentage of replacements would be in the 50% - 80% range as shown on Table 7. Based on this, the estimated cost to replace affected
foundations for residential dwellings is well above $1 billion dollars for the region
and again, this only represents costs tallied for the 20 Connecticut municipalities. Affected Massachusetts municipalities are not included in this estimate.
Discussion and Conclusions: While this estimation is far from an exact calculation of the costs associated with the concrete foundation replacements, it is likely a conservative estimate based upon
13
publically available information and reasonable assumptions. The magnitude of the problem in terms of direct costs, likely in excess of $1 billion dollars, for homeowners to repair their residences is astounding. This estimate does not take into account the indirect costs to homeowners that are associated with trying to remedy this problem including, but not necessarily limited to: legal fees, engineers’ fees, the costs for conducting petrographic analysis, building permit fees and interest on loans. To put this estimate into perspective, the clean-up of the nuclear disaster at Three Mile Island cost approximately $1 billion dollars (actual costs), which translates to $1.7 billion dollars (in 2016 dollars; as adjusted for inflation) (10). Additionally, there are those costs that are not monetary in nature; there is the psychological and physical toll that this problem is taking on people. These aspects of the problem are impossible to quantify; however, this author argues that they are not insignificant. All residents of these 20 Connecticut municipalities identified above are affected whether or not they are impacted directly by this problem. The loss of property value will cause a drop in the Grand Lists of the affected communities, resulting in an increase in taxes, a reduction in services, or a combination thereof. The reduction of property values affecting all property owners, no matter when their foundations were poured, caused by uncertainty within the housing market, mortgage defaults, bankruptcies and abandoned properties will likely result in widespread suppression of real estate values that could last a generation. In addition to affecting resale values of properties in these towns, it will affect people’s ability to use the equity in their homes to meet life’s needs, such as paying for college tuition for their children, performing renovations, or supporting them in their retirement years. For individual homeowners to rectify this problem, it will require a very large sum of money (which most homeowners do not have) to repair their homes and in some cases, the cost of repairs is more than the value of the home itself. The financial uncertainty that failing foundations has brought to the affected region along with the long-duration nature of this problem, is unprecedented in Connecticut’s history. There are very few
“slow-motion disasters” of a similar financial magnitude and duration that have
occurred in the United States.
This problem is not very “photogenic”; it is unlike other disasters such as hurricanes, tornados, wildfires or earthquakes where it only takes a couple of pictures to understand the need for help. This disaster is not depicted or represented by an iconic photo that serves to rally support for aid from others near and far, but it has become apparent help from all levels of government is warranted. As indicated above, this analysis is intended to provide an overall order of magnitude of the failing foundation problem. It is not intended to be specific, as there are very many unknowns associated with the scope of this problem. However, what can be
concluded is that the order of magnitude of the financial remedy for this problem

14
is very large and will require the collaboration of both the public and private
sectors to resolve.
Recommendations:
The following are recommendations stemming not only from this analysis of potential direct costs associated with the replacement of failing foundations in Connecticut, but from consideration of other widely discussed elements of this issue.
• In order to increase the accuracy of this or any other estimates of the costs to replace failed or failing foundations, it is recommended that the State of Connecticut obtain records from JJ Mottes regarding all locations to which they supplied concrete from the years 1983 through the date on which they agreed not to supply concrete for residential projects (April 26, 2016). Upon obtaining those records, it is incumbent upon the State to provide written notification to all potentially affected homeowners, commercial real estate owners and municipalities in which JJ Mottes concrete was used. This would allow for estimates to include not only the concrete supplied for new construction, but also for additions and repairs.
• Further, to understand the magnitude of the public safety issue associated with the potential failures of septic tanks and other pre-cast products produced by JJ Mottes, it is recommended that the State obtain and make public the records of sale of these items.
• It is recommended that the State of Connecticut develop a standard regarding
the allowable percentage of deleterious materials (pyrrhotite included) contained in aggregate used in the making of concrete.
• Further, it is recommended that a petrographic analysis of aggregates being
used for concrete be performed by a certified laboratory at least every two years and that the petrographic test results be filed with the Connecticut Department of Consumer Protection to ensure that the standard for deleterious materials is met.
• As acknowledged earlier in this paper, the analysis conducted herein presents an
estimated cost (likely a conservative estimate) to replace impacted residential foundations only in the 20 affected towns identified thus far in Connecticut. It is recommended that local, State and Federal officials interface with officials in Massachusetts to determine potential solutions that will serve to aid the greater affected region.
• In order to restore confidence in the real estate market in the affected areas, to
protect property values, and to reduce the potential for litigation between buyers, sellers and real estate representatives, it is recommended that there be a requirement that concrete cores be tested for all foundations installed between

15
the years 1983 through April 2016 (the month that JJ Mottes voluntarily ceased supplying concrete for residential purposes) in order for them to be salable. Further, it is recommended as part of this requirement that the results be recorded at the Town Hall of the respective municipality in which the home is located. An alternative to coring the foundation is an affidavit signed by the builder that would be filed as part of the building records identifying the concrete supplier used for the construction of the home. An appropriate exemption to this requirement would be a record of the foundation being replaced and associated proof of the supplier of the concrete that would be filed with the building records.
• It is apparent that insurance companies as well as banks/mortgage companies
will be or will need to be participants in a financial resolution to the problem of crumbling foundations.
• It is recommended that the State of Connecticut request the core testing results
that have been collected by the insurance companies. This represents a significant amount of data which could be used to better understand the scope of this issue. This data could be “blinded”, so as to eliminate the addresses of where the cores were taken, but would include basic information such as the municipality in which a given core was collected and the year the concrete was poured. As it is in everyone’s best interest to work toward solving this problem, it would be beneficial for the insurance companies to provide this data.
• The following information would improve the estimate of residential foundations
impacted by the failing foundation problem:
o Getting a specific breakdown for each municipality of the number of single family houses, condominium units and additions built during the period of 1983 to 2016.
o Information on the builder of each structure may be able to be used to refine the estimated number of foundations poured by different concrete suppliers (assuming cooperation from the builders).
o Obtaining information from concrete suppliers on the number of foundations poured during the period of interest.
o Obtaining the results from the concrete core testing being performed by insurance companies.

16
Municipality 1990 1991 1992 1993 1994 1995 1996 1997 1998 1999 2000 2001 2002 2003 2004 2005 2006 2007 2008 2009 2010 2011 2012 2013 2014 2015 Total
Andover 20 16 18 8 10 22 36 26 24 20 14 8 16 13 23 13 8 8 4 4 3 0 7 5 2 4 332Ashford 24 19 32 52 12 18 14 16 32 17 22 21 28 25 28 17 23 11 9 9 4 4 3 3 5 2 450Bolton 4 8 15 17 21 21 27 20 26 37 21 16 11 6 15 8 22 12 4 6 9 5 7 12 7 5 362Coventry 67 65 79 96 66 50 74 58 65 67 80 60 52 58 50 56 68 34 15 25 34 17 24 29 33 32 1,354East Hartford 15 40 39 20 7 1 4 3 4 6 11 8 8 5 18 14 79 36 11 31 7 2 11 3 3 3 389East Windsor 33 10 8 19 47 51 61 22 28 17 50 62 57 53 96 83 64 108 107 50 77 21 19 18 10 13 1,184Ellington 41 28 39 51 50 47 74 73 162 138 129 84 143 122 74 122 120 95 87 72 27 108 36 40 84 112 2,158Enfield 90 30 58 48 27 48 47 84 86 63 32 30 50 50 57 50 24 17 15 9 12 2 9 7 63 16 1,024Glastonbury 73 129 159 203 188 148 170 164 246 187 124 128 102 74 113 79 141 88 40 27 48 38 40 31 25 41 2,806Manchester 111 92 135 85 104 68 135 321 483 147 54 110 190 140 128 253 270 362 22 10 20 13 17 21 65 118 3,474Mansfield 26 58 43 65 49 50 38 45 58 86 46 72 46 69 55 52 68 42 20 22 16 7 14 11 14 8 1,080Somers 21 19 30 31 31 17 38 34 43 57 58 48 48 41 24 35 31 46 25 16 14 71 12 11 13 15 829South Windsor 68 106 143 113 113 78 99 124 134 100 64 71 167 171 163 68 38 47 115 20 17 14 15 20 25 43 2,136Stafford 62 33 40 35 44 30 32 29 37 50 43 44 49 57 65 47 49 25 11 14 12 7 8 8 7 2 840Suffield 22 25 27 33 35 27 53 71 196 90 83 68 86 80 70 88 65 31 28 24 21 24 25 29 27 33 1,361Tolland 31 48 74 115 97 86 82 104 137 149 153 92 98 95 87 95 57 55 18 10 10 8 8 10 17 7 1,743Union 3 2 2 3 7 9 0 5 8 4 5 6 6 6 3 8 5 2 3 3 0 3 1 1 1 1 97Vernon 30 17 23 14 16 19 29 27 31 60 62 150 183 163 192 220 191 183 84 27 51 90 102 35 10 175 2,184Willington 19 10 25 17 22 15 15 12 14 10 17 28 25 20 26 19 12 3 5 12 4 2 3 1 2 0 338Woodstock 52 24 39 39 32 27 33 42 52 37 50 67 73 61 84 77 30 27 13 9 13 3 8 9 7 10 918Totals 812 779 1,028 1,064 978 832 1,061 1,280 1,866 1,342 1,118 1,173 1,438 1,309 1,371 1,404 1,365 1,232 636 400 399 439 369 304 420 640 25,059
Source: Census
Compiled by DECD Research
Table 1 - Annual Housing Permit Data by Town from 1990 through 2015
17
Municipality 1,980 1,990 2,000 2,010 2,015
PopulationChange1980-
1990
EstimatedPopulation
Change1983-1989*
Andover 2,144 2,540 3,036 3,303 3,354 396 277Ashford 3,221 3,765 4,098 4,317 4,413 544 381Bolton 3,951 4,575 5,017 4,980 4,953 624 437Coventry 8,895 10,063 11,504 12,435 12,780 1,168 818EastHartford 52,563 50,452 49,575 51,252 52,305 -2,111 -1,478EastWindsor 8,925 10,081 9,818 11,162 11,879 1,156 809Ellington 9,711 11,197 12,921 15,602 16,878 1,486 1,040Enfield 42,695 45,532 45,212 44,654 43,570 2,837 1,986Glastonbury 24,327 27,901 31,876 34,427 35,278 3,574 2,502Manchester 49,761 51,618 57,740 58,241 60,815 1,857 1,300Mansfield 20,634 21,103 20,720 26,543 26,967 469 328Somers 8,473 9,108 10,417 11,444 10,774 635 445SouthWindsor 17,198 22,090 24,412 25,709 26,089 4,892 3,424Stafford 9,268 11,091 11,307 12,087 12,381 1,823 1,276Suffield 9,294 11,427 13,552 15,735 15,768 2,133 1,493Tolland 9,694 11,001 13,146 15,052 15,682 1,307 915Union 546 612 693 854 912 66 46Vernon 27,974 29,841 28,063 29,179 29,916 1,867 1,307Willington 4,694 5,979 5,959 6,041 6,245 1,285 900Woodstock 5,117 6,008 7,221 7,964 8,324 891 624Total 319,085 345,984 366,287 390,981 399,283
*Estmatemadebymultiplting1980-1990populationchangeby70%
Year
Table2-USCensusDataforAffectedMunicipalities
18
Table 3 - Estimated Housing Permit Data by Town 1983-1989
Municipality
Estimated Population Increase 1983 - 1989
(Table 2)
Estimated Number of
Permits Issued 1983 - 1989*
Andover 277 130Ashford 381 179Bolton 437 205Coventry 818 384East Hartford -1,478 0East Windsor 809 380Ellington 1,040 488Enfield 1,986 932Glastonbury 2,502 1,175Manchester 1,300 610Mansfield 328 154Somers 445 209South Windsor 3,424 1,608Stafford 1,276 599Suffield 1,493 701Tolland 915 430Union 46 22Vernon 1,307 614Willington 900 422Woodstock 624 293
* Estimated by dividing the estimated populationincrease by 2.13
19
Table 4 - Estimated Total Number of Housing Permits 1983-2015
Municipality
Estimated Number of
Permits Issued 1983 - 1989
(Table 3)
Number of Permits Issued
1990 - 2015 (Table 1)
Total Estimated Number of Permits
1983 - 2015Andover 130 332 462Ashford 179 450 629Bolton 205 362 567Coventry 384 1,354 1,738East Hartford 0 389 389East Windsor 380 1,184 1,564Ellington 488 2,158 2,646Enfield 932 1,024 1,956Glastonbury 1,175 2,806 3,981Manchester 610 3,474 4,084Mansfield 154 1,080 1,234Somers 209 829 1,038South Windsor 1,608 2,136 3,744Stafford 599 840 1,439Suffield 701 1,361 2,062Tolland 430 1,743 2,173Union 22 97 119Vernon 614 2,184 2,798Willington 422 338 760Woodstock 293 918 1,211
Estimated Total Number of Permits Issued 34,593

20
Municipality JJ MottesAnsaldi
ConcreteBuilders Concrete
Builders Concrete
EastEnfield
Transit MixJolley
ConcreteTilcon-Roncari
Andover 23.8 12.9 13.2 12.3 21.7 N/A 33.9Ashford 12.7 22.6 24.5 12.0 25.1 N/A 38.2Bolton 20.9 6.8 7.8 16.2 17.6 N/A 27.9Coventry 14.1 13.7 14.0 9.3 19.9 N/A 34.7EastHartford 21.5 6.2 6.8 29.4 16.9 N/A 17.6EastWindsor 15.1 14.3 11.3 28.5 4.8 N/A 13.7Ellington 10.6 15.2 11.7 23.5 6.3 N/A 19.0Enfield 16.8 19.9 18.5 35.1 5.5 N/A 13.2Glastonbury 33.9 9.2 8.8 27.2 6.3 N/A 24.2Manchester 21.3 2.2 2.9 22.8 15.8 N/A 24.0Mansfield 12.8 17.9 18.2 8.1 21.8 N/A 38.9Somers 8.7 21.5 18.0 27.5 4.7 N/A 18.4SouthWindsor 17.8 6.5 4.2 26.8 11.1 N/A 17.3Stafford 0.5 23.9 21.5 22.3 12.9 N/A 34.7Suffield 20.3 20.8 19.3 39.1 8.8 N/A 7.0Tolland 9.9 15.4 15.5 16.7 13.3 N/A 31.2Union 9.0 30.8 29.4 23.4 21.9 27.5 N/AVernon 11.7 12.4 11.9 20.4 9.6 N/A 24.0Willington 7.5 19.9 21.2 13.7 19.7 N/A 33.6Woodstock 22.4 43.0 39.4 23.6 35.2 16.2 N/AN/A-NotApplicableduetoDistance
Source:GoogleMaps
Table 5 - Mileage from Concrete Producers to Town Halls
21
Municipality
Mileage From Mottes to Town
Hall (Table 5)
Mileage Next Closest
Competitor to Town Hall (Table 5)
Estimated Percent JJ
Mottes Concrete
Estimated Number of
Permits 1983 - 2015
(Table 4)
Estimated Number of JJ Mottes
Foundations 1983 -2015
Andover 23.8 12.3 17% 462 79Ashford 12.7 12.0 49% 629 305Bolton 20.9 6.8 12% 567 70Coventry 14.1 9.3 40% 1,738 691EastHartford 21.5 6.2 11% 389 44EastWindsor 15.1 4.8 24% 1,564 377Ellington 10.6 6.3 37% 2,646 987Enfield 16.8 5.5 25% 1,956 483Glastonbury 33.9 6.3 8% 3,981 312Manchester 21.3 2.2 5% 4,084 191Mansfield 12.8 8.1 39% 1,234 478Somers 8.7 4.7 35% 1,038 364SouthWindsor 17.8 4.2 19% 3,744 715Stafford 0.5 12.9 96% 1,439 1,385Suffield 20.3 7.0 13% 2,062 264Tolland 9.9 13.3 57% 2,173 1,245Union 9.0 21.9 71% 119 84Vernon 11.7 9.6 45% 2,798 1,261Willington 7.5 13.7 65% 760 491Woodstock 22.4 16.2 42% 1,211 508
Estimated Total Number of Foundations Containing JJ Mottes Concrete 10,334
Table 6 - Estimated Percentage of Concrete from JJ Mottes and Number of Affected Foundations per Municipality

22
10% 20% 30% 40% 50% 60% 70% 80% 90% 100%
Andover 1,700,000 3,400,000 5,100,000 6,800,000 8,500,000 10,200,000 11,800,000 13,500,000 15,200,000 16,900,000Ashford 6,600,000 13,100,000 19,700,000 26,300,000 32,800,000 39,400,000 46,000,000 52,500,000 59,100,000 65,700,000Bolton 1,500,000 3,000,000 4,500,000 6,000,000 7,500,000 9,000,000 10,500,000 12,000,000 13,500,000 15,000,000Coventry 14,800,000 29,700,000 44,500,000 59,400,000 74,200,000 89,100,000 103,900,000 118,800,000 133,600,000 148,500,000East Hartford 900,000 1,900,000 2,800,000 3,700,000 4,700,000 5,600,000 6,600,000 7,500,000 8,400,000 9,400,000East Windsor 8,100,000 16,200,000 24,300,000 32,400,000 40,600,000 48,700,000 56,800,000 64,900,000 73,000,000 81,100,000Ellington 21,200,000 42,400,000 63,600,000 84,800,000 106,100,000 127,300,000 148,500,000 169,700,000 190,900,000 212,100,000Enfield 10,400,000 20,700,000 31,100,000 41,500,000 51,900,000 62,200,000 72,600,000 83,000,000 93,400,000 103,700,000Glastonbury 6,700,000 13,400,000 20,100,000 26,800,000 33,500,000 40,200,000 46,900,000 53,600,000 60,400,000 67,100,000Manchester 4,100,000 8,200,000 12,300,000 16,400,000 20,600,000 24,700,000 28,800,000 32,900,000 37,000,000 41,100,000Mansfield 10,300,000 20,600,000 30,900,000 41,100,000 51,400,000 61,700,000 72,000,000 82,300,000 92,600,000 102,800,000Somers 7,800,000 15,700,000 23,500,000 31,300,000 39,100,000 47,000,000 54,800,000 62,600,000 70,400,000 78,300,000South Windsor 15,400,000 30,700,000 46,100,000 61,500,000 76,800,000 92,200,000 107,600,000 122,900,000 138,300,000 153,700,000Stafford 29,800,000 59,600,000 89,400,000 119,100,000 148,900,000 178,700,000 208,500,000 238,300,000 268,100,000 297,900,000Suffield 5,700,000 11,400,000 17,100,000 22,700,000 28,400,000 34,100,000 39,800,000 45,500,000 51,200,000 56,800,000Tolland 26,800,000 53,600,000 80,300,000 107,100,000 133,900,000 160,700,000 187,400,000 214,200,000 241,000,000 267,800,000Union 1,800,000 3,600,000 5,400,000 7,200,000 9,000,000 10,900,000 12,700,000 14,500,000 16,300,000 18,100,000Vernon 27,100,000 54,200,000 81,300,000 108,400,000 135,500,000 162,700,000 189,800,000 216,900,000 244,000,000 271,100,000Willington 10,600,000 21,100,000 31,700,000 42,300,000 52,800,000 63,400,000 73,900,000 84,500,000 95,100,000 105,600,000Woodstock 10,900,000 21,900,000 32,800,000 43,700,000 54,600,000 65,600,000 76,500,000 87,400,000 98,300,000 109,300,000
Total $222,200,000 $444,400,000 $666,500,000 $888,500,000 $1,110,800,000 $1,333,400,000 $1,555,400,000 $1,777,500,000 $1,999,800,000 $2,222,000,000
Average Cost for Foundation and Footing Replacement $150,000Removal and Reinstallation of Mechanicals $10,000
Replacing Lally Columns and Concrete Floors $15,000Miscellaneous House Repairs Following Foundation Replacement $5,000
Hardscape Replacement $20,000Landscape Replacement $5,000
Temporary Relocation Costs $10,000
Total Average Replacement Cost $215,000
% of Mottes Foundations Needing Replacement
Table 7 - Estimated Costs per Town for Foundation Replacements (2016 Dollars)
23
References: (1) George Jepsen – Attorney General, Consumer Protection Investigation of Crumbling Concrete Home Foundations, Letter to Connecticut Governor Malloy and Department of Consumer Protection Commissioner, July 7, 2016. (2) Erik Bednar, Company blames concrete installers -- J.J. Mottes spokesman says crumbling foundations not its fault, Journal Inquirer, February 23, 2016. (3) George Colli and David Michnowicz Interview with John Patton, NBC Connecticut, http://www.nbcconnecticut.com/troubleshooters/Crumbling-Foundations-JJ-Mottes-Company-Speaks-John-Patton-Concrete-328588251.html, September 22, 2015. (4) William Neal, Residential Engineering Services, LLC, July 26, 2016. (5) George Colli, Crumbling concrete causing headaches for Massachusetts homeowners, WFXT Fox 25, http://www.fox25boston.com/news/crumbling-concrete-causing-headaches-for-mass-homeowners/278960552, May 13, 2016. (6) Connecticut Department of Economic and Community Development, Connecticut Housing Data, http://www.ct.gov/ecd/cwp/view.asp?a=1106&q=250640. (7) Andy Goodhall, Letter from the Town of Union, dated February 3, 2016, http://www.unionconnecticut.org/news.php?table=news&id=592 (8) George Colli, NBC Connecticut, http://www.nbcconnecticut.com/troubleshooters/Troubleshooters-Investigation-Crumbling-Foundations-Home-Basement-Concrete-318061181.html, July 22, 2015. (9) Don Childree, Don Childree General Contracting, South Windsor, CT, email dated August 7, 2016. (10) Ralph Vartabedian, Nuclear accident in New Mexico ranks among the costliest in U.S. history, Los Angeles Times, August 22, 2016.