crystal reports - sep16 · iseq 20 leveraged 5,002.47 5,246.19 6,865.54 -243.72 -4.65% -1,863 ......
TRANSCRIPT

ISEQ Equity Index%Change
2016Absolute Chg 2016
%ChangeSEP-16
Absolute ChgSEP-16
Value31-AUG-16
Value30-SEP-16
Value31-DEC-15
ISEQ IndexOverall 6,034.83 6,170.42 %-11.14-756.85%-2.20-135.596,791.68Financial 245.99 265.50 %-44.06-193.75%-7.35-19.51439.74General 8,669.14 8,830.64 %-7.37-690.18%-1.83-161.509,359.32Small Cap 2,431.01 2,403.27 %-1.09-26.88%1.1527.742,457.89ESM 1,898.72 1,946.51 %-13.49-295.96%-2.46-47.792,194.68ISEQ20 984.38 1,007.54 %-12.60-141.86%-2.30-23.161,126.24ISEQ 20 Leveraged 5,002.47 5,246.19 %-27.14-1,863.07%-4.65-243.726,865.54ISEQ 20 Capped 1,287.42 1,314.83 %-14.69-221.76%-2.08-27.411,509.18
ISEQ Return IndexOverall 12,700.36 12,946.21 %-9.98-1,408.00%-1.90-245.8514,108.36Financial 601.35 649.03 %-44.03-473.11%-7.35-47.681,074.46General 15,378.43 15,614.08 %-6.06-991.35%-1.51-235.6516,369.78Small Cap 3,468.40 3,427.25 %-0.64-22.18%1.2041.153,490.58ESM 2,151.43 2,201.21 %-12.81-315.99%-2.26-49.782,467.42ISEQ20 1,293.35 1,320.00 %-11.46-167.47%-2.02-26.651,460.82ISEQ 20 Capped 1,658.88 1,689.73 %-13.34-255.37%-1.83-30.851,914.25
ISEQ Bond IndexValue
30-SEP-16%Change
2016Absolute Chg 2016
%ChangeSEP-16
Absolute ChgSEP-16
Value31-DEC-15
Value31-AUG-16
ISEQ Bond Index118.68121.97 %0.17 3.29All Bond %2.77121.77 0.2093.1290.49 %-0.33 -2.63Under 3 %-2.8390.80 -0.30
106.02104.08 %-0.26 -1.94Under 5 %-1.83104.35 -0.27115.47116.25 %0.07 0.78Under 10 %0.67116.17 0.08128.11138.22 %0.55 10.115 Plus %7.89137.45 0.76131.76154.07 %0.74 22.3210 Plus %16.94152.94 1.14
ISEQ Return Bond Index195.87206.32 %0.35 10.45All Bond %5.34205.60 0.72142.93143.54 %0.02 0.61Under 3 %0.43143.52 0.02167.14169.31 %0.09 2.16Under 5 %1.29169.16 0.15185.75192.09 %0.30 6.34Under 10 %3.41191.51 0.58215.50236.72 %0.60 21.225 Plus %9.85235.31 1.41232.42275.25 %0.63 42.8310 Plus %18.43273.52 1.73
28 Anglesea StreetDublin 2, IrelandT +353 1 617 4200
F +353 1 677 6045
www.ise.ie
September 2016
Monthly Report
Trading Days Information
2016
September 22 Days
191 Days
Page 1 of 23
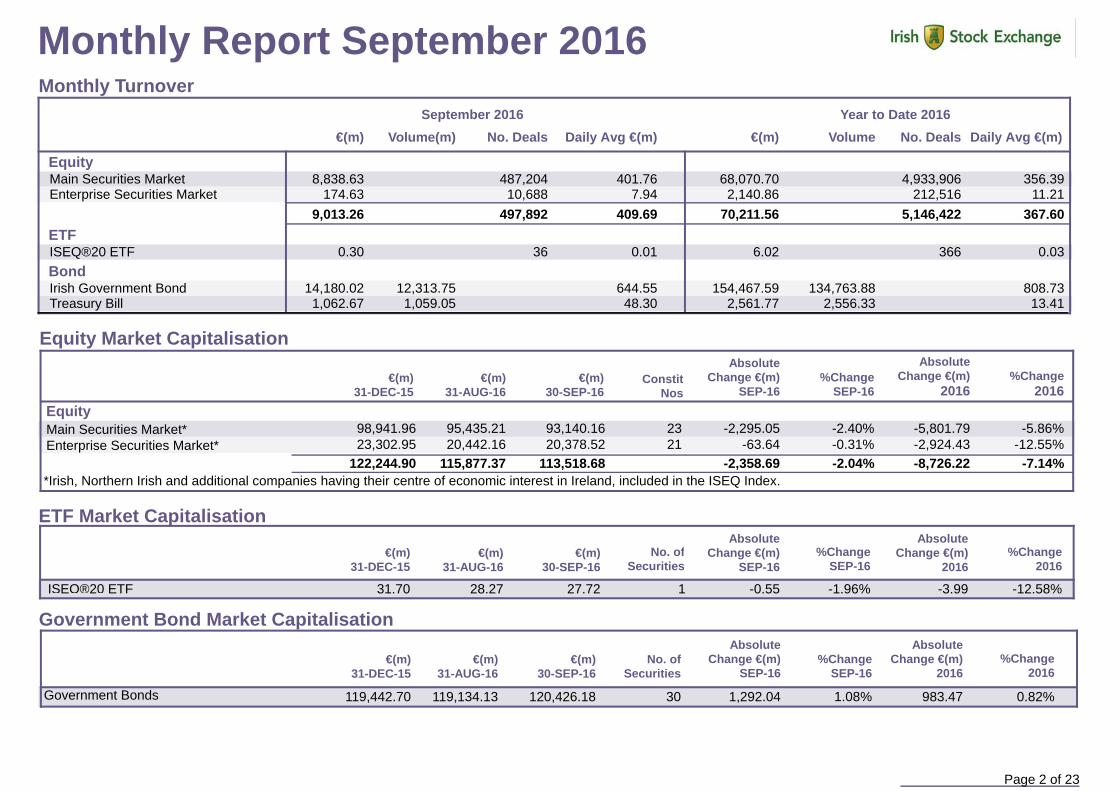
Monthly Report September 2016Monthly Turnover
Daily Avg €(m)Volume€(m)Daily Avg €(m)Volume(m)€(m) No. Deals No. DealsYear to Date 2016September 2016
Equity68,070.70 356.39Main Securities Market 4,933,9068,838.63 487,204 401.76
2,140.86 11.21Enterprise Securities Market 212,516174.63 10,688 7.949,013.26 409.69 70,211.56 367.60497,892 5,146,422
ETF6.02 0.03ISEQ®20 ETF 3660.30 36 0.01
Bond154,467.59 808.73134,763.88Irish Government Bond 14,180.02 12,313.75 644.55
2,561.77 13.412,556.33Treasury Bill 1,062.67 1,059.05 48.30
Equity Market Capitalisation
%Change2016
AbsoluteChange €(m)
2016%Change
SEP-16
AbsoluteChange €(m)
SEP-16Constit
Nos€(m)
30-SEP-16€(m)
31-AUG-16€(m)
31-DEC-15Equity
98,941.96 95,435.21 93,140.16 23 -2,295.05 %-2.40 -5,801.79 %-5.86Main Securities Market*23,302.95 20,442.16 20,378.52 21 -63.64 %-0.31 -2,924.43 %-12.55Enterprise Securities Market*
122,244.90 113,518.68 -2,358.69 -8,726.22115,877.37 %-2.04 %-7.14*Irish, Northern Irish and additional companies having their centre of economic interest in Ireland, included in the ISEQ Index.
ETF Market Capitalisation
%Change2016
AbsoluteChange €(m)
2016%Change
SEP-16
AbsoluteChange €(m)
SEP-16No. of
Securities€(m)
30-SEP-16€(m)
31-AUG-16€(m)
31-DEC-15
31.70 28.27 27.72 1 -0.55 %-1.96 -3.99 %-12.58ISEQ®20 ETF
€(m)31-DEC-15
%Change2016
AbsoluteChange €(m)
2016%Change
SEP-16
AbsoluteChange €(m)
SEP-16No. of
Securities€(m)
30-SEP-16€(m)
31-AUG-16
Government Bond Market Capitalisation
119,442.70 119,134.13 120,426.18 30 1,292.04 %1.08 983.47 %0.82Government Bonds
Page 2 of 23

Monthly Report September 2016ISEQ Overall Index
Cumulative% Change
CumulativeChange
%Change on Previous
Day
Change on Previous
Day
Index Value
Date
31-AUG-16 6,170.4201-SEP-16 19.57 0.32% 19.57 0.32% 6,189.9902-SEP-16 109.32 1.77% 128.89 2.09% 6,299.3105-SEP-16 15.75 0.25% 144.64 2.34% 6,315.0606-SEP-16 -49.53 -0.78% 95.11 1.54% 6,265.5307-SEP-16 13.80 0.22% 108.91 1.77% 6,279.3308-SEP-16 7.40 0.12% 116.31 1.88% 6,286.7309-SEP-16 -104.11 -1.66% 12.20 0.20% 6,182.6212-SEP-16 -44.60 -0.72% -32.40 -0.53% 6,138.0213-SEP-16 -26.96 -0.44% -59.36 -0.96% 6,111.0614-SEP-16 -9.75 -0.16% -69.11 -1.12% 6,101.3115-SEP-16 27.50 0.45% -41.61 -0.67% 6,128.8116-SEP-16 -17.36 -0.28% -58.97 -0.96% 6,111.4519-SEP-16 -2.29 -0.04% -61.26 -0.99% 6,109.1620-SEP-16 -32.27 -0.53% -93.53 -1.52% 6,076.8921-SEP-16 17.60 0.29% -75.93 -1.23% 6,094.4922-SEP-16 59.26 0.97% -16.67 -0.27% 6,153.7523-SEP-16 -44.89 -0.73% -61.56 -1.00% 6,108.8626-SEP-16 -93.92 -1.54% -155.48 -2.52% 6,014.9427-SEP-16 -24.25 -0.40% -179.73 -2.91% 5,990.6928-SEP-16 48.70 0.81% -131.03 -2.12% 6,039.3929-SEP-16 -41.34 -0.68% -172.37 -2.79% 5,998.0530-SEP-16 36.78 0.61% -135.59 -2.20% 6,034.83
2016Change%Change
SEP-16-135.59
%-2.20-756.85
%-11.14
5,950
6,000
6,050
6,100
6,150
6,200
6,250
6,300
6,350
01-S
EP02
-SEP
05-S
EP06
-SEP
07-S
EP08
-SEP
09-S
EP12
-SEP
13-S
EP14
-SEP
15-S
EP16
-SEP
19-S
EP20
-SEP
21-S
EP22
-SEP
23-S
EP26
-SEP
27-S
EP28
-SEP
29-S
EP30
-SEP
6,329.90 (06-Sep-16) 5,898.99 (30-Sep-16)Month High: Month Low:
6,791.68 (04-Jan-16)High 2016: Low 2016: 5,286.65 (24-Jun-16)
Constituents = 44 Constituent Mkt Cap = €113,518.68m
Page 3 of 23

Monthly Report September 2016ISEQ Financial Index
439.74
265.50245.99
Index Value (31-DEC-15)
Index Value (31-AUG-16)Index Value (30-SEP-16)
2016
Change%Change %-7.35 %-44.06
-193.75-19.51
SEP-16
230
235
240
245
250
255
260
265
270
275
01-S
EP02
-SEP
05-S
EP06
-SEP
07-S
EP08
-SEP
09-S
EP12
-SEP
13-S
EP14
-SEP
15-S
EP16
-SEP
19-S
EP20
-SEP
21-S
EP22
-SEP
23-S
EP26
-SEP
27-S
EP28
-SEP
29-S
EP30
-SEP
271.88 (05-Sep-16) 225.37 (30-Sep-16)Month High: Month Low:
446.30 (05-Jan-16) Low 2016: 213.63 (03-Aug-16)High 2016:
Constituents = 5
Constituent Mkt. Cap = €23,667.60m
ISEQ Small Cap Index
2,400
2,410
2,420
2,430
2,440
2,450
2,460
2,470
2,480
01-S
EP02
-SEP
05-S
EP06
-SEP
07-S
EP08
-SEP
09-S
EP12
-SEP
13-S
EP14
-SEP
15-S
EP16
-SEP
19-S
EP20
-SEP
21-S
EP22
-SEP
23-S
EP26
-SEP
27-S
EP28
-SEP
29-S
EP30
-SEP
Constituent Mkt Cap = €19,004.49m
Constituents = 21
2,517.78 (11-Jan-16)High 2016: Low 2016: 2,141.29 (03-Aug-16)
2,502.43 (26-Sep-16) 2,377.51 (16-Sep-16)Month High: Month Low:
2,457.89
2,403.272,431.01
Index Value (31-DEC-15)Index Value (31-AUG-16)Index Value (30-SEP-16)
2016Change
%Change %1.15 %-1.09-26.8827.74
SEP-16
Page 4 of 23

Monthly Report September 2016ISEQ General Index
9,359.32
8,830.64
8,669.14
Index Value (31-DEC-15)
Index Value (31-AUG-16)
Index Value (30-SEP-16)
2016
Change
%Change %-1.83 %-7.37
-690.18-161.50
SEP-16
Constituents = 39
Constituent Mkt. Cap = €89,851.08m
9,091.55 (06-Sep-16) 8,507.25 (30-Sep-16)Month High: Month Low:
9,359.32 (04-Jan-16)High 2016: Low 2016: 7,477.22 (24-Jun-16)
8,600
8,650
8,700
8,750
8,800
8,850
8,900
8,950
9,000
9,050
9,100
01-S
EP02
-SEP
05-S
EP06
-SEP
07-S
EP08
-SEP
09-S
EP12
-SEP
13-S
EP14
-SEP
15-S
EP16
-SEP
19-S
EP20
-SEP
21-S
EP22
-SEP
23-S
EP26
-SEP
27-S
EP28
-SEP
29-S
EP30
-SEP
ISEQ ESM Index
1,880
1,900
1,920
1,940
1,960
1,980
01-S
EP02
-SEP
05-S
EP06
-SEP
07-S
EP08
-SEP
09-S
EP12
-SEP
13-S
EP14
-SEP
15-S
EP16
-SEP
19-S
EP20
-SEP
21-S
EP22
-SEP
23-S
EP26
-SEP
27-S
EP28
-SEP
29-S
EP30
-SEP
Constituent Mkt Cap = € 20,378.52m
Constituents = 21
2,212.64 (04-Jan-16)High 2016: Low 2016: 1,711.42 (07-Jul-16)
1,981.94 (09-Sep-16) 1,864.08 (16-Sep-16)Month High: Month Low:
2,194.68
1,946.51
1,898.72
Index Value (31-DEC-15)
Index Value (31-AUG-16)
Index Value (30-SEP-16)
2016
Change
%Change %-2.46 %-13.49
-295.96-47.79
SEP-16
Page 5 of 23

Monthly Report September 2016ISEQ 20 Index
Constituent Mkt Cap = € 75,787.33
1,126.24
1,007.54
984.38
Index Value (31-DEC-15)
Index Value (31-AUG-16)
Index Value (30-SEP-16)
2016
Change
%Change %-2.30 %-12.60
-141.86-23.16
SEP-16
871.72 (27-Jun-16) 1,123.29 (05-Jan-16)High 2016: Low 2016:
970
980
990
1,000
1,010
1,020
1,030
1,040
01-S
EP02
-SEP
05-S
EP06
-SEP
07-S
EP08
-SEP
09-S
EP12
-SEP
13-S
EP14
-SEP
15-S
EP16
-SEP
19-S
EP20
-SEP
21-S
EP22
-SEP
23-S
EP26
-SEP
27-S
EP28
-SEP
29-S
EP30
-SEP 1,034.94 (06-Sep-16) 960.76 (30-Sep-16)Month High: Month Low:
Constituents = 20
ISEQ 20 Leveraged Index6,865.54
5,246.19
5,002.47
Index Value (31-DEC-15)
Index Value (31-AUG-16)
Index Value (30-SEP-16)
2016
Change
%Change %-4.65 %-27.14
-1,863.07-243.72
SEP-16
Constituents = 20
Constituent Mkt Cap = € 75,787.33
5,532.69 (06-Sep-16) 4,765.37 (30-Sep-16)Month High: Month Low:
3,903.83 (24-Jun-16) 6,865.64 (04-Jan-16)High 2016: Low 2016:
4,900
5,000
5,100
5,200
5,300
5,400
5,500
5,600
01-S
EP02
-SEP
05-S
EP06
-SEP
07-S
EP08
-SEP
09-S
EP12
-SEP
13-S
EP14
-SEP
15-S
EP16
-SEP
19-S
EP20
-SEP
21-S
EP22
-SEP
23-S
EP26
-SEP
27-S
EP28
-SEP
29-S
EP30
-SEP
Page 6 of 23
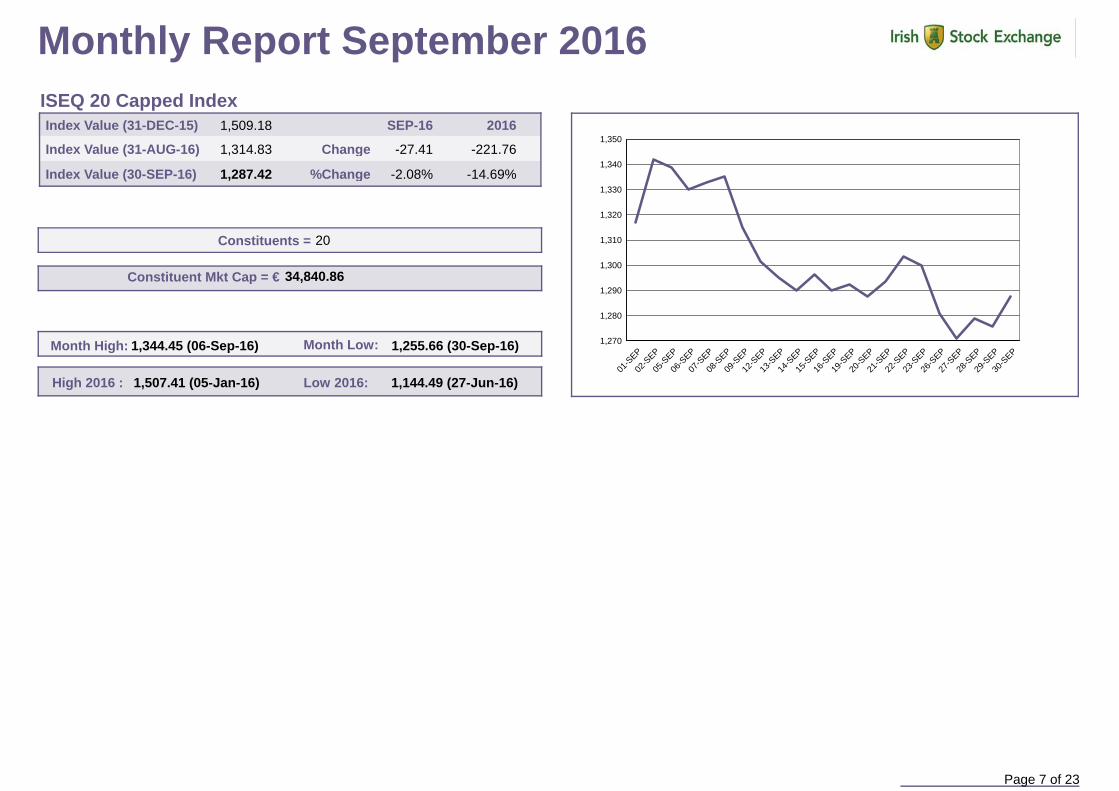
Monthly Report September 2016ISEQ 20 Capped Index
1,509.18
1,314.83
1,287.42
Index Value (31-DEC-15)
Index Value (31-AUG-16)
Index Value (30-SEP-16)
2016
Change
%Change %-2.08 %-14.69
-221.76-27.41
SEP-16
Constituents = 20
Constituent Mkt Cap = € 34,840.86
1,344.45 (06-Sep-16) 1,255.66 (30-Sep-16)Month High: Month Low:
1,144.49 (27-Jun-16)1,507.41 (05-Jan-16)High 2016 : Low 2016:
1,270
1,280
1,290
1,300
1,310
1,320
1,330
1,340
1,350
01-S
EP02
-SEP
05-S
EP06
-SEP
07-S
EP08
-SEP
09-S
EP12
-SEP
13-S
EP14
-SEP
15-S
EP16
-SEP
19-S
EP20
-SEP
21-S
EP22
-SEP
23-S
EP26
-SEP
27-S
EP28
-SEP
29-S
EP30
-SEP
Page 7 of 23

Monthly Report September 2016
0
2,000
4,000
6,000
8,000
10,000
30/09
/2013
29/11
/2013
31/01
/2014
31/03
/2014
30/05
/2014
31/07
/2014
30/09
/2014
28/11
/2014
30/01
/2015
31/03
/2015
29/05
/2015
31/07
/2015
30/09
/2015
30/11
/2015
29/01
/2016
31/03
/2016
31/05
/2016
29/07
/2016
30/09
/2016
OVERALL FINANCIAL GENERAL
0
2,000
4,000
6,000
8,000
10,000
30/09
/2015
30/10
/2015
30/11
/2015
31/12
/2015
29/01
/2016
29/02
/2016
31/03
/2016
29/04
/2016
31/05
/2016
30/06
/2016
29/07
/2016
31/08
/2016
30/09
/2016
OVERALL FINANCIAL GENERAL
ISEQ Overall,Financial and General over 12 Months to SeptemberISEQ Overall, Financial and General over 36 Months to September
ISEQ Small Cap and ESM over 12 Months to September ISEQ 20, Capped and Leveraged over 12 months to September
0
1,000
2,000
3,000
4,000
5,000
6,000
7,000
30/09
/2015
30/10
/2015
30/11
/2015
31/12
/2015
29/01
/2016
29/02
/2016
31/03
/2016
29/04
/2016
31/05
/2016
30/06
/2016
29/07
/2016
31/08
/2016
30/09
/2016
ISEQ 20 LEVERAGED CAPPED
1,800
2,000
2,200
2,400
2,600
2,800
30/09
/2015
30/10
/2015
30/11
/2015
31/12
/2015
29/01
/2016
29/02
/2016
31/03
/2016
29/04
/2016
31/05
/2016
30/06
/2016
29/07
/2016
31/08
/2016
30/09
/2016
SMALLCAP ESM
Page 8 of 23

Monthly Report September 2016Market Capitalisation Overall, Financial and General Indices (€m)
0K
20K
40K
60K
80K
100K
120K
140K
30/09/2015 30/10/2015 30/11/2015 31/12/2015 29/01/2016 29/02/2016 31/03/2016 29/04/2016 31/05/2016 30/06/2016 29/07/2016 31/08/2016 30/09/2016
OVERALL FINANCIAL GENERAL
0K
5K
10K
15K
20K
25K
30K
35K
40K
45K
30/09/2015 30/10/2015 30/11/2015 31/12/2015 29/01/2016 29/02/2016 31/03/2016 29/04/2106 31/05/2016 30/06/2016 29/07/2016 31/08/216 30/09/2016
SMALLCAP ESM
Market Capitalisation Small Cap and ESM Indices (€m)
0K
20K
40K
60K
80K
100K
30/09/2015 30/10/2015 30/11/2015 31/12/2015 29/01/2016 29/02/2016 31/03/2016 29/04/2016 31/05/2016 30/06/2016 29/07/2016 31/08/2016 30/09/2016
ISEQ20 CAPPED LEVERAGED
Market Capitalisation ISEQ 20, Capped and Leveraged Indices (€m)
Page 9 of 23

Monthly Report September 2016ISEQ Total Return Index Overall Return Index
FinancialReturnDate
Overall Return
GeneralReturn
Small CapReturn
ESMReturn
ISEQ20Return
ISEQ 20CappedReturn
12,990.11 655.35 15,659.91 3,454.66 2,219.3501-SEP-16 1,325.62 1,693.3213,219.53 661.46 15,945.91 3,479.59 2,214.1102-SEP-16 1,349.99 1,725.1613,252.58 634.94 16,034.46 3,487.40 2,200.6705-SEP-16 1,352.40 1,721.3713,148.63 619.03 15,927.59 3,452.02 2,234.2406-SEP-16 1,342.27 1,709.8813,177.61 612.25 15,976.76 3,444.70 2,226.5507-SEP-16 1,345.45 1,713.6613,221.29 640.18 15,984.86 3,442.58 2,213.0108-SEP-16 1,351.55 1,718.5113,002.33 639.90 15,702.25 3,468.31 2,203.6309-SEP-16 1,329.82 1,692.0212,908.54 654.49 15,555.73 3,449.60 2,180.0612-SEP-16 1,319.05 1,675.1012,851.85 634.02 15,517.89 3,474.60 2,186.8513-SEP-16 1,312.71 1,666.8912,831.34 621.78 15,512.57 3,434.97 2,142.2414-SEP-16 1,309.73 1,660.3412,889.82 611.83 15,605.39 3,445.65 2,178.8515-SEP-16 1,315.41 1,668.7712,853.31 604.93 15,570.14 3,427.42 2,143.3416-SEP-16 1,312.02 1,660.5212,848.49 599.80 15,572.80 3,445.61 2,169.5419-SEP-16 1,311.52 1,663.2712,780.61 599.45 15,485.64 3,449.16 2,175.3220-SEP-16 1,304.08 1,657.0912,817.63 601.16 15,530.55 3,447.50 2,171.2321-SEP-16 1,307.82 1,664.9112,943.14 619.16 15,661.63 3,511.58 2,172.9222-SEP-16 1,318.69 1,677.8312,848.72 600.68 15,571.57 3,536.44 2,164.8923-SEP-16 1,308.52 1,673.3612,651.18 570.97 15,367.65 3,485.86 2,147.8426-SEP-16 1,290.42 1,649.0712,600.19 562.90 15,315.70 3,470.04 2,149.9227-SEP-16 1,283.31 1,636.2712,702.60 570.84 15,434.35 3,503.43 2,176.1928-SEP-16 1,292.62 1,646.2312,622.95 573.86 15,326.13 3,523.77 2,168.6729-SEP-16 1,284.36 1,643.6512,700.36 601.35 15,378.43 3,468.40 2,151.4330-SEP-16 1,293.35 1,658.88
12,600
12,700
12,800
12,900
13,000
13,100
13,200
13,300
01-S
EP02
-SEP
05-S
EP06
-SEP
07-S
EP08
-SEP
09-S
EP12
-SEP
13-S
EP14
-SEP
15-S
EP16
-SEP
19-S
EP20
-SEP
21-S
EP22
-SEP
23-S
EP26
-SEP
27-S
EP28
-SEP
29-S
EP30
-SEP
Page 10 of 23

Monthly Report September 2016Financial Return Index General Return Index
560
580
600
620
640
660
680
01-S
EP02
-SEP
05-S
EP06
-SEP
07-S
EP08
-SEP
09-S
EP12
-SEP
13-S
EP14
-SEP
15-S
EP16
-SEP
19-S
EP20
-SEP
21-S
EP22
-SEP
23-S
EP26
-SEP
27-S
EP28
-SEP
29-S
EP30
-SEP 15,300
15,400
15,500
15,600
15,700
15,800
15,900
16,000
16,100
01-S
EP02
-SEP
05-S
EP06
-SEP
07-S
EP08
-SEP
09-S
EP12
-SEP
13-S
EP14
-SEP
15-S
EP16
-SEP
19-S
EP20
-SEP
21-S
EP22
-SEP
23-S
EP26
-SEP
27-S
EP28
-SEP
29-S
EP30
-SEP
ESM Return IndexSmall Cap Return Index
3,420
3,440
3,460
3,480
3,500
3,520
3,540
01-S
EP02
-SEP
05-S
EP06
-SEP
07-S
EP08
-SEP
09-S
EP12
-SEP
13-S
EP14
-SEP
15-S
EP16
-SEP
19-S
EP20
-SEP
21-S
EP22
-SEP
23-S
EP26
-SEP
27-S
EP28
-SEP
29-S
EP30
-SEP 2,140
2,160
2,180
2,200
2,220
2,24001
-SEP
02-S
EP05
-SEP
06-S
EP07
-SEP
08-S
EP09
-SEP
12-S
EP13
-SEP
14-S
EP15
-SEP
16-S
EP19
-SEP
20-S
EP21
-SEP
22-S
EP23
-SEP
26-S
EP27
-SEP
28-S
EP29
-SEP
30-S
EP
Page 11 of 23
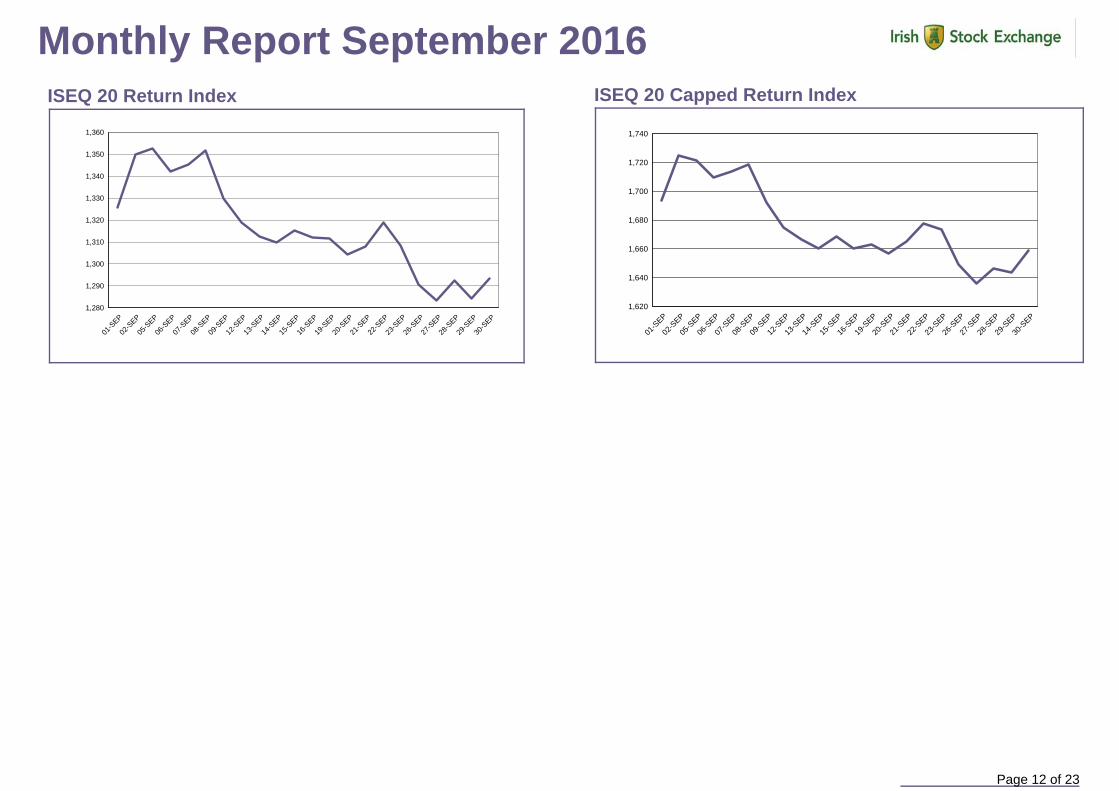
Monthly Report September 2016ISEQ 20 Return Index
1,280
1,290
1,300
1,310
1,320
1,330
1,340
1,350
1,360
01-S
EP02
-SEP
05-S
EP06
-SEP
07-S
EP08
-SEP
09-S
EP12
-SEP
13-S
EP14
-SEP
15-S
EP16
-SEP
19-S
EP20
-SEP
21-S
EP22
-SEP
23-S
EP26
-SEP
27-S
EP28
-SEP
29-S
EP30
-SEP
ISEQ 20 Capped Return Index
1,620
1,640
1,660
1,680
1,700
1,720
1,740
01-S
EP02
-SEP
05-S
EP06
-SEP
07-S
EP08
-SEP
09-S
EP12
-SEP
13-S
EP14
-SEP
15-S
EP16
-SEP
19-S
EP20
-SEP
21-S
EP22
-SEP
23-S
EP26
-SEP
27-S
EP28
-SEP
29-S
EP30
-SEP
Page 12 of 23

Monthly Report September 2016
120.80
121.00
121.20
121.40
121.60
121.80
122.00
122.20
01-S
EP
05-S
EP
07-S
EP
09-S
EP
13-S
EP
15-S
EP
19-S
EP
21-S
EP
23-S
EP
27-S
EP
29-S
EPAll Bond Index
Cumulative % Change
CumulativeChange
%Change on Previous
Day
Change on Previous
Day
Index Value
Date
31-AUG-16 121.7701-SEP-16 -0.32 -0.26% 19.57 0.32% 121.4502-SEP-16 -0.08 -0.07% 128.89 2.09% 121.3705-SEP-16 0.20 0.16% 144.64 2.34% 121.5706-SEP-16 0.29 0.24% 95.11 1.54% 121.8507-SEP-16 0.25 0.21% 108.91 1.77% 122.1008-SEP-16 -0.20 -0.16% 116.31 1.88% 121.9009-SEP-16 -0.56 -0.46% 12.20 0.20% 121.3412-SEP-16 -0.23 -0.19% -32.40 -0.53% 121.1113-SEP-16 0.00 0.00% -59.36 -0.96% 121.1214-SEP-16 -0.04 -0.03% -69.11 -1.12% 121.0715-SEP-16 -0.15 -0.12% -41.61 -0.67% 120.9216-SEP-16 0.22 0.18% -58.97 -0.96% 121.1419-SEP-16 -0.07 -0.06% -61.26 -0.99% 121.0720-SEP-16 0.32 0.27% -93.53 -1.52% 121.3921-SEP-16 -0.15 -0.12% -75.93 -1.23% 121.2522-SEP-16 0.44 0.37% -16.67 -0.27% 121.6923-SEP-16 -0.04 -0.03% -61.56 -1.00% 121.6526-SEP-16 0.13 0.10% -155.48 -2.52% 121.7827-SEP-16 0.13 0.11% -179.73 -2.91% 121.9128-SEP-16 0.02 0.01% -131.03 -2.12% 121.9229-SEP-16 -0.01 -0.01% -172.37 -2.79% 121.9130-SEP-16 0.06 0.05% -135.59 -2.20% 121.97
Mkt. Cap = €119,278.52m
Constituents = 13
118.68
121.77
121.97
Index Value (31-DEC-15)
Index Value (31-AUG-16)
Index Value (30-SEP-16)
2016
Change
%Change %0.17 %2.77
3.290.20
SEP-16
Page 13 of 23

Monthly Report September 2016All Bond Index Return
202.50
203.00
203.50
204.00
204.50
205.00
205.50
206.00
206.50
01-S
EP
05-S
EP
07-S
EP
09-S
EP
13-S
EP
15-S
EP
19-S
EP
21-S
EP
23-S
EP
27-S
EP
29-S
EP
Cumulative % Change
CumulativeChange
%Change on Previous
Day
Change on Previous
Day
Index Value
Date
31-AUG-16 205.6001-SEP-16 -0.67 -0.55% 19.57 0.32% 204.9302-SEP-16 -0.12 -0.10% 128.89 2.09% 204.8105-SEP-16 0.39 0.32% 144.64 2.34% 205.2006-SEP-16 0.49 0.41% 95.11 1.54% 205.6907-SEP-16 0.43 0.35% 108.91 1.77% 206.1208-SEP-16 -0.31 -0.26% 116.31 1.88% 205.8109-SEP-16 -0.92 -0.75% 12.20 0.20% 204.9012-SEP-16 -0.32 -0.26% -32.40 -0.53% 204.5813-SEP-16 -1.62 -1.34% -59.36 -0.96% 202.9614-SEP-16 1.59 1.31% -69.11 -1.12% 204.5515-SEP-16 -0.23 -0.19% -41.61 -0.67% 204.3116-SEP-16 0.38 0.31% -58.97 -0.96% 204.6919-SEP-16 -0.06 -0.05% -61.26 -0.99% 204.6320-SEP-16 0.55 0.46% -93.53 -1.52% 205.1821-SEP-16 -0.23 -0.19% -75.93 -1.23% 204.9622-SEP-16 0.75 0.62% -16.67 -0.27% 205.7123-SEP-16 -0.05 -0.04% -61.56 -1.00% 205.6626-SEP-16 0.27 0.22% -155.48 -2.52% 205.9227-SEP-16 0.23 0.19% -179.73 -2.91% 206.1628-SEP-16 0.04 0.04% -131.03 -2.12% 206.2029-SEP-16 -0.00 -0.00% -172.37 -2.79% 206.2030-SEP-16 0.12 0.10% -135.59 -2.20% 206.32
195.87
205.60
206.32
Index Value (31-DEC-15)
Index Value (31-AUG-16)
Index Value (30-SEP-16)
2016Change
%Change %0.35 %5.34
10.450.72SEP-16
Constituents = 13
Mkt. Cap = €121,888.44m
Page 14 of 23

Monthly Report September 2016
90.48
90.52
90.56
90.60
90.64
90.68
90.72
90.76
01-S
EP05
-SEP
07-S
EP09
-SEP
13-S
EP15
-SEP
19-S
EP21
-SEP
23-S
EP27
-SEP
29-S
EP
143.36
143.40
143.44
143.48
143.52
143.56
143.60
01-S
EP05
-SEP
07-S
EP09
-SEP
13-S
EP15
-SEP
19-S
EP21
-SEP
23-S
EP27
-SEP
29-S
EP
104.00
104.05
104.10
104.15
104.20
104.25
104.30
104.35
01-S
EP05
-SEP
07-S
EP09
-SEP
13-S
EP15
-SEP
19-S
EP21
-SEP
23-S
EP27
-SEP
29-S
EP
168.90
168.95
169.00
169.05
169.10
169.15
169.20
169.25
169.30
169.35
169.40
01-S
EP
05-S
EP
07-S
EP
09-S
EP
13-S
EP
15-S
EP
19-S
EP
21-S
EP
23-S
EP
27-S
EP
29-S
EP
Under 3 Bond Index Under 3 Bond Index Return Under 5 Bond Index Under 5 Bond Index Return
115.70
115.80
115.90
116.00
116.10
116.20
116.30
116.40
01-S
EP05
-SEP
07-S
EP09
-SEP
13-S
EP15
-SEP
19-S
EP21
-SEP
23-S
EP27
-SEP
29-S
EP
190.80
191.00
191.20
191.40
191.60
191.80
192.00
192.20
01-S
EP05
-SEP
07-S
EP09
-SEP
13-S
EP15
-SEP
19-S
EP21
-SEP
23-S
EP27
-SEP
29-S
EP
136.00
136.40
136.80
137.20
137.60
138.00
138.40
01-S
EP05
-SEP
07-S
EP09
-SEP
13-S
EP15
-SEP
19-S
EP21
-SEP
23-S
EP27
-SEP
29-S
EP
229.00
230.00
231.00
232.00
233.00
234.00
235.00
236.00
237.00
01-S
EP
05-S
EP
07-S
EP
09-S
EP
13-S
EP
15-S
EP
19-S
EP
21-S
EP
23-S
EP
27-S
EP
29-S
EP
Under 10 Bond Index Under 10 Bond Index Return 5 Plus Bond Index 5 Plus Bond Index Return
10 Plus Bond Index
149.00
150.00
151.00
152.00
153.00
154.00
155.00
01-S
EP05
-SEP
07-S
EP09
-SEP
13-S
EP15
-SEP
19-S
EP21
-SEP
23-S
EP27
-SEP
29-S
EP
10 Plus Bond Index Return
252.00
256.00
260.00
264.00
268.00
272.00
276.00
01-S
EP05
-SEP
07-S
EP09
-SEP
13-S
EP15
-SEP
19-S
EP21
-SEP
23-S
EP27
-SEP
29-S
EP
Page 15 of 23

Monthly Report September 2016Equity Dividend Details
Security NameNet
Div €(c) TaxTax
CreditGross
Div €(c)Payment
DateIssuer NameEx-Div
DateRecord Dt/Curr
Code Coupon No
09-SEP-1608-SEP-16 30-SEP-16GBPOrd SharesPADDY POWER BETFAIR PLC 40.0000W30-SEP-1629-SEP-16 28-OCT-16EUROrdinary SharesSMURFIT KAPPA GROUP PLC 22.0000W09-SEP-1608-SEP-16 04-NOV-16EUROrdinary SharesCRH PLC 18.8000W09-SEP-1608-SEP-16 15-OCT-16EUR5% Cum PrefCRH PLC 3.1750W09-SEP-1608-SEP-16 05-OCT-16EUR7% A Cum PrefCRH PLC 4.4450W23-SEP-1622-SEP-16 07-OCT-16EURUnits (Comp 1 Ordinary Share
of Eur 0.065 and up to 10 Red Shares (Nil Issued))
IRISH CONTINENTAL GROUP PLC 3.8200W
02-SEP-1601-SEP-16 26-SEP-16EUROrdinary SharesMINCON GROUP PLC - ESM 1.0000W02-SEP-1601-SEP-16 23-SEP-16EUROrdinary SharesKINGSPAN GROUP PLC 10.0000W16-SEP-1615-SEP-16 07-OCT-16EUROrdinary SharesFYFFES PLC - ESM 0.9032W16-SEP-1615-SEP-16 14-OCT-16EUROrdinary SharesTOTAL PRODUCE PLC - ESM 0.8096W02-SEP-1601-SEP-16 27-SEP-16EUROrdinary SharesHOSTELWORLD GROUP PLC 4.8000W
Page 16 of 23

Monthly Report September 2016Market Turnover (€ million)
Individual Irish Government Bonds Turnover MSM, ESM & Grey MarketVolume (m)Turnover €(m)Stock
4.50 per cent Treasury Bond 2020 200.08 170.17Floating Rate Treasury Bond due 2051 0.00 0.003.90 per cent Treasury Bond 2023 585.71 465.612.00% Treasury Bond 2045 1,509.50 1,275.714.40 per cent Treasury Bond 2019 486.87 429.615.50 per cent Treasury Bond 2017 1,228.21 1,154.33Floating Rate Treasury Bond due 2043 0.00 0.00Floating Rate Treasury Bond due 2053 0.00 0.000.80 per cent Treasury Bond 2022 584.67 554.163.40% Treasury Bond 2024 1,010.61 812.785.00 per cent Treasury Bond 2020 281.44 230.73EUR100000000 2.350% Notes due 01 April 2116 0.00 0.00Floating Rate Treasury Bond due 2045 0.00 0.00Floating Rate Treasury Bond due 2047 0.00 0.00Floating Rate Treasury Bond due 2049 0.00 0.002.4 per cent Treasury Bond 2030 774.08 635.911.00 per cent Treasury Bond 2026 4,679.55 4,417.234.50 per cent Treasury Bond 2018 745.68 676.355.40 per cent Treasury Bond 2025 1,780.21 1,248.215.90 per cent Treasury Bond 2019 239.05 199.96
14,105.64 12,270.75Total:
Turnover €(m)Date283.6601-SEP-16235.4302-SEP-16161.4505-SEP-16255.8306-SEP-16361.8907-SEP-16335.9008-SEP-16362.0809-SEP-16404.0112-SEP-16334.2313-SEP-16341.3614-SEP-16273.7715-SEP-16
3,044.9916-SEP-16235.8719-SEP-16193.4020-SEP-16310.8321-SEP-16221.4422-SEP-16276.2323-SEP-16286.8126-SEP-16287.6627-SEP-16200.6828-SEP-16222.8329-SEP-16382.9130-SEP-16
Total:Daily Average:
9,013.26409.69
Turnover €(m)Date0.0101-SEP-160.0402-SEP-160.0105-SEP-160.0106-SEP-160.0207-SEP-160.0108-SEP-160.0009-SEP-160.0812-SEP-160.0813-SEP-160.0014-SEP-160.0015-SEP-160.0016-SEP-160.0119-SEP-160.0020-SEP-160.0021-SEP-160.0022-SEP-160.0023-SEP-160.0326-SEP-160.0027-SEP-160.0128-SEP-160.0029-SEP-160.0030-SEP-16
Total:Daily Average:
0.300.01
Exchange Traded Funds
Volume (m)Turnover €(m)StockTreasury Bill 19.09.2016 30.00 30.00Treasury Bill 18.09.17 998.62 995.05Treasury Bill 19/12/16 34.04 34.00
1,062.67 1,059.05Total:
Individual Irish Government Treasury Bills Turnover
5.92 per cent Amortising Bond 2042 (issued 2013) 0.00 0.005.92 per cent Amortising Bond 20 January 2037 0.00 0.005.92 per cent Amortising Bond 20 September 2047 0.00 0.005.72 per cent Amortising Bond 20 July 2027 0.00 0.005.82 per cent Amortising Bond 20 March 2032 0.00 0.005.92 per cent Amortising Bond 2047 (issued 2013) 0.00 0.005.92 per cent Amortising Bond 20 May 2042 74.38 43.005.92 per cent Amortising Bond 2037 (issued 2013) 0.00 0.005.72 per cent Amortising Bond 2027 (issued 2013) 0.00 0.005.82 per cent Amortising Bond 2032 (issued 2013) 0.00 0.00
74.38 43.00Total:12,313.75Total: 14,180.02
Page 17 of 23

Monthly Report September 2016
Irish Government Bonds by Maturity Volume
TotalVolume
12+ YearsVolume
7-12 YearsVolume
3-7 YearsVolume
0-3 YearsValueTotal
Value12+ Years
Value7-12 Years
Value3-7 Years
Value0-3 Years
Date
80.14 112.01 330.16 168.45 690.7671.79 94.43 273.08 141.80 581.0901-SEP-1630.72 20.30 242.61 121.58 415.2127.82 16.63 189.15 102.03 335.6402-SEP-1654.45 23.70 381.01 43.40 502.5649.82 20.59 314.66 36.76 421.8305-SEP-16
153.40 117.29 288.39 139.11 698.18135.71 95.95 255.35 115.31 602.3106-SEP-167.64 74.00 458.22 91.35 631.206.92 59.55 397.66 75.44 539.5807-SEP-16
25.58 66.52 2,422.00 134.30 2,648.4023.28 55.44 2,237.67 110.71 2,427.0908-SEP-1614.46 60.93 411.68 324.67 811.7413.37 51.67 336.14 275.96 677.1409-SEP-16
4.42 168.11 229.65 109.25 511.424.00 140.72 194.24 93.25 432.2012-SEP-1659.44 27.58 89.06 44.76 220.8454.33 23.71 70.35 38.20 186.5813-SEP-16
315.03 80.54 94.63 93.10 583.31295.48 74.06 81.06 78.10 528.7014-SEP-16201.80 98.12 194.53 27.79 522.24189.57 85.73 182.79 23.64 481.7215-SEP-16172.61 111.23 57.11 18.17 359.12161.91 92.52 50.08 15.43 319.9416-SEP-16
3.25 29.13 59.71 17.80 109.893.02 24.01 49.90 14.96 91.8919-SEP-16113.24 59.99 168.10 25.80 367.13106.29 49.90 150.76 22.11 329.0620-SEP-16241.90 80.68 499.83 203.11 1,025.52218.14 66.69 406.65 172.37 863.8521-SEP-16
41.21 113.86 259.55 99.27 513.8937.23 100.29 220.16 82.79 440.4722-SEP-16110.24 106.92 210.54 101.19 528.8899.92 92.70 183.90 84.00 460.5223-SEP-16
3.06 111.45 85.14 61.68 261.332.80 97.69 72.10 51.12 223.7126-SEP-16354.45 81.64 289.71 122.91 848.71326.03 70.60 251.34 101.72 749.7027-SEP-16171.34 103.49 207.94 118.31 601.08156.63 91.78 160.91 97.52 506.8428-SEP-16
29.80 142.40 221.16 160.25 553.6126.54 129.56 187.08 131.40 474.5929-SEP-16272.59 101.05 269.64 57.34 700.62249.70 86.43 213.18 47.00 596.3130-SEP-16
2,460.76 1,890.95 7,470.36 2,283.57 14,105.64Total: 1,911.621,620.632,260.30 12,270.756,478.21103.80339.5685.95111.85 641.17Daily Average: 86.89294.4673.66 557.76102.74
17%
@0-3 Years
16%
@12+ Years
13%
@3-7 Years
53%
@7-12 Years
@0-3 Years@12+ Years@3-7 Years@7-12 Years
Page 18 of 23

Monthly Report September 2016
2013€(m)
2014€(m)
2015€(m)
2016€(m)
Month
7,241.11 6,555.15 4,812.855,677.81January11,072.76 7,831.13 4,609.345,857.62February7,390.19 9,518.49 4,889.476,309.44March7,042.38 6,752.31 6,067.094,517.78April6,517.99 6,044.49 5,456.194,756.18May9,570.24 7,298.31 3,964.124,643.27June6,829.49 5,958.21 3,911.175,056.88July5,534.14 6,285.18 4,146.065,041.29August9,013.26 7,475.10 4,762.897,533.91September
7,313.08 4,907.485,526.09October7,633.64 5,334.184,646.86November5,473.38 4,714.383,911.58December
84,138.47 57,575.22367.60 331.25 249.92 226.67
Total:Daily Average:
63,478.7170,211.56
Monthly Equity Market Turnover
0
4,000
8,000
12,000
16,000
20,000
01/20
0006
/2000
11/20
0004
/2001
09/20
0102
/2002
07/20
0212
/2002
05/20
0310
/2003
03/20
0408
/2004
01/20
0506
/2005
11/20
0504
/2006
09/20
0602
/2007
07/20
0712
/2007
05/20
0810
/2008
03/20
0908
/2009
01/20
1006
/2010
11/20
1004
/2011
09/20
1102
/2012
07/20
1212
/2012
05/20
1310
/2013
03/20
1408
/2014
01/20
1506
/2015
11/20
1504
/2016
09/20
16
2016Volume (m)
2015€(m)
2013€(m)
2014€(m)
2016€(m)
Month
33,801.39 37,485.84 15,233.5830,247.36 44,517.35January21,935.41 13,353.60 5,725.2719,061.09 36,756.18February20,081.74 17,852.70 7,869.3217,443.38 24,178.87March15,341.08 13,652.39 6,459.8513,298.16 18,685.14April14,366.16 24,031.89 5,755.2912,671.78 18,856.62May17,531.15 18,576.99 7,192.2615,354.66 17,323.82June10,422.55 21,006.80 4,023.418,883.69 13,502.90July
8,307.21 17,548.34 5,863.686,987.29 9,261.88August15,242.69 19,569.78 9,136.0113,372.80 18,144.29September
22,364.28 8,038.9620,034.63October35,270.50 7,453.0712,679.91November16,074.37 10,988.3411,176.20December
245,117.79 256,787.48 93,739.04822.14 965.03 1,010.97 369.05
Total:Daily Average: 718.95
137,320.21157,029.36
0
5,000
10,000
15,000
20,000
25,000
30,000
35,000
40,000
45,000
01/20
0006
/2000
11/20
0004
/2001
09/20
0102
/2002
07/20
0212
/2002
05/20
0310
/2003
03/20
0408
/2004
01/20
0506
/2005
11/20
0504
/2006
09/20
0602
/2007
07/20
0712
/2007
05/20
0810
/2008
03/20
0908
/2009
01/20
1006
/2010
11/20
1004
/2011
09/20
1102
/2012
07/20
1212
/2012
05/20
1310
/2013
03/20
1408
/2014
01/20
1506
/2015
11/20
1504
/2016
09/20
16
Monthly Market Turnover for Irish Government Bonds (€ million)*
*Includes Irish Treasury Bills.
Page 19 of 23

Monthly Report September 2016Individual Company Data for Main Securities Market - Equity
Beta CoeffISEQ Weighting
SEP-16*Volume (m)
SEP-16Mkt Turnover €(m)SEP-16
% Change Absolute ChangeShare Price €CSEP-16SEP-1631-AUG-1631-DEC-15 30-SEP-16Company Name ISIN YTD YTD
MarketCap €(m)
YTD YTD30
days250
days30-SEP-16
0.520.1647.652.220.860.052IE0003073255 22 -0.1 0.5 %-4 %29 76.47AMINEX PLC 0.05is0.740.599.091.44345.7554.453,971CH0043238366 3,5604,725 410.5 -754.2 %12 %-16 3,495.54ARYZTA AG 3.94i1.831.3534,383.522,751.348,102.05520.0219IE0030606259 2034 -1.6 -15.2 %-8 %-45 6,019.57BANK OF IRELAND 5.71i0.400.55268.3314.08990.3952.38369IE00B010DT83 379371 -10.0 -2.3 %-3 %-1 1,165.58C&C GROUP PLC 1.25i1.181.02524.38148.0713,987.064,365.992,977IE0001827041 3,0352,670 -58.5 306.5 %-2 %11 24,722.31CRH PLC 28.16i0.931.43243.0820.181,056.3882.10410IE00BJMZDW83 435550 -25.0 -140.0 %-6 %-25 750.16DALATA HOTEL GROUP
PLC0.85i
0.320.2933.072.07104.897.39360IE0000527006 328315 32.0 45.0 %10 %14 266.54DATALEX PLC 0.17is0.000.000.000.001,442GB0002374006 1,4421,442 0.0 0.0 %0 %0 36,298.59DIAGEO PLC
0.370.1110.190.6065.294.07655IE0003290289 707661 -52.0 -6.0 %-7 %-1 227.06FBD HOLDINGS PLC 0.17i0.590.78126.2312.372,164.32205.541,713IE0000669501 1,7071,695 5.5 17.5 %0 %1 5,069.70GLANBIA PLC 3.64i0.560.17608.6160.43869.3387.88146IE00BBR67J55 147159 -1.8 -13.8 %-1 %-9 990.66GREEN REIT PLC 1.09i0.460.19769.2381.451,003.46113.68137IE00BGHQ1986 140141 -2.7 -3.8 %-2 %-3 939.07HIBERNIA REIT PLC 1.04i0.520.081.260.013.750.03223GB00BYYN4225 224307 -1.0 -84.2 %0 %-27 213.12HOSTELWORLD GROUP
PLC0.24i
0.520.8837.863.0280.565.68190IE0002325243 197223 -7.0 -33.0 %-4 %-15 200.28IFG GROUP PLC 0.20i0.260.45675.6918.48101.762.3713IE00B59HWB19 1417 -1.2 -4.4 %-9 %-26 173.32INDEPENDENT NEWS &
MEDIA PLC0.10is
0.791.57191.3112.29924.8256.21437IE00BLP58571 472541 -35.0 -104.4 %-7 %-19 814.40IRISH CONTINENTAL GROUP PLC
0.79i
0.320.11311.7636.22350.1842.82118IE00BJ34P519 117117 0.9 0.9 %1 %1 491.64IRISH RESIDENTIAL PROPERTIES REIT PLC
0.47i
0.080.8945.260.713.612.53360IE00BDC5DG00 3111 49.0 359.4 %16 %57,043 394.57KENMARE RESOURCES PLC
0.26is
0.430.6086.609.156,725.42684.597,416IE0004906560 7,6187,631 -202.0 -215.0 %-3 %-3 13,050.88KERRY GROUP PLC 12.82i1.271.81192.8018.104,330.68442.262,398IE0004927939 2,4582,431 -60.0 -33.0 %-2 %-1 4,309.80KINGSPAN GROUP PLC 3.98i0.941.1677.194.479,469.57469.0210,070IE00BWT6H894 10,71512,310 -645.0 -2,240.0 %-6 %-18 8,433.94PADDY POWER BETFAIR
PLC9.49i
1.351.21204.0116.78462.0332.29206IE00BWB8X525 200460 5.5 -254.6 %3 %-55 934.40PERMANENT.TSB GROUP HOLDINGS PLC
0.27i
1.370.95845.2380.2110,934.421,028.431,216IE00BYTBXV33 1,1991,501 16.5 -285.5 %1 %-19 15,698.34RYANAIR HOLDINGS PLC 17.06i1.011.36306.8226.796,720.81577.401,990IE00B1RR8406 2,2102,354 -220.0 -364.0 %-10 %-15 4,702.82SMURFIT KAPPA GROUP
PLC5.25i
0.000.000.000.00414GB0008847096 414414 0.0 0.0 %0 %0 32,176.97TESCO PLC5.880.5414.821.45301GB0001500809 255223 45.6 77.2 %18 %35 2,740.24TULLOW OIL PLC0.180.000.600.00357GB00BDGT1X16 357245 0.0 112.1 %0 %46 249.70WIRELESS GROUP PLC
NOTES*Weighting shows the percentage of ISEQ market capitalisation of each stock. *All companies marked with an 'i' are included in the ISEQ Overall Index. *All companies marked with 'is' are included in the ISEQ Overall Index AND the ISEQ Small Cap Index.
Page 20 of 23

Monthly Report September 2016
Volume (m)SEP-16
Mkt Turnover €(m)SEP-16
% Change Absolute ChangeShare Price €CSEP-16SEP-1631-AUG-1631-DEC-15 30-SEP-16Company Name ISIN YTD YTD
MarketCap €(m)
YTD YTD30-SEP-16
ISEQ Weighting
SEP-16*
Beta Coeff250day
30 days
0.400.025.590.241,260IE0000020408 1,3001,655 -40.0 -395.0 %-3 %-24ABBEY PLC - ESM 271.22 0.08 -0.42 0.38is1.010.057.070.31600IE00BYSZ9G33 600666 0.0 -66.0 %0 %-10ALLIED IRISH BANKS PLC - ESM 16,286.29 0.02 -0.94 0.25is0.970.350.110.0821GB00BDD1LS57 253 -4.0 17.9 %-16 %577AMRYT PHARMA PLC - ESM 43.75 0.02 -1.16 0.59is
31.8213.53142.0061.30444IE00BXC8D038 470570 -26.0 -126.0 %-6 %-22APPLEGREEN PLC - ESM 356.18 0.13 0.70 0.38is0.100.000.030.0043IE00BZ4BTZ13 4360 0.0 -17.0 %0 %-28CONROY GOLD & NATURAL RESOURCES
PLC - ESM4.74 0.00 0.03is
10.561.4158.417.87560IE0007214426 533630 27.0 -70.0 %5 %-11CPL RESOURCES PLC - ESM 171.05 0.12 0.92 0.30is1.220.146.790.75565IE0002184616 560605 4.9 -39.8 %1 %-7DONEGAL INVESTMENT GROUP PLC - ESM 55.30 0.06 -0.01 0.00is0.040.020.140.07364GB00BY7QYJ50 3500 14.0 364.0 %4 %0DRAPER ESPRIT PLC - ESM 148.050.390.130.030.015CA3060711015 511 -0.1 -6.1 %-2 %-55FALCON OIL & GAS LTD - ESM 45.160.350.008.120.042,296GB0031477770 2,3902,106 -94.5 189.5 %-4 %9FIRST DERIVATIVES PLC - ESM 565.67 0.43 0.66 0.43i
95.815.99140.659.25148IE0003295239 155151 -7.4 -3.4 %-5 %-2FYFFES PLC - ESM 486.96 0.47 -1.36 0.27i0.530.010.200.0150GB00BGCC6189 5146 -1.0 4.0 %-2 %9GAN PLC - ESM 35.030.730.050.010.000IE00B1FR8863 11 -0.4 -0.3 %-57 %-50GREAT WESTERN MINING CORPORATION
PLC - ESM0.79 0.00 1.42 1.65is
1.450.000.010.001IE00B01ZSK94 11 0.0 0.3 %0 %33KARELIAN DIAMOND RESOURCES PLC - ESM
3.81 0.00 -0.28 -0.19is
0.020.000.350.071,570IE00BJYS1G50 1,4501,730 120.0 -160.0 %8 %-9MAINSTAY MEDICAL INTERNATIONAL PLC - ESM
103.73 0.03 -0.22 0.05is
2.260.0229.730.251,350IE00BVGC3741 1,4001,061 -50.0 289.0 %-4 %27MALIN CORPORATION PLC - ESM 529.67 0.16 0.02 0.01is43.150.5730.190.4171IE00BD64C665 7265 -1.0 6.0 %-1 %9MINCON GROUP PLC - ESM 149.48 0.06 -0.53 -0.08is
118.196.27704.8934.55562IE00B1WV4493 581755 -18.1 -192.6 %-3 %-26ORIGIN ENTERPRISES PLC - ESM 706.25 0.79 0.64 0.64i30.943.990.590.093IE0006627891 22 0.2 0.8 %8 %44ORMONDE MINING PLC - ESM 12.29 0.01 2.97 -0.13is
2.250.070.220.0113IE00B4XVDC01 158 -2.0 5.0 %-13 %63OVOCA GOLD PLC - ESM 10.60 0.00 0.84 -0.08is18.451.460.490.043IE00B0Q82B24 33 0.3 0.4 %12 %16PETRONEFT RESOURCES PLC - ESM 20.37 0.02 1.22 1.47is12.882.941.850.3411IE00B66B5T26 1321 -1.7 -9.9 %-13 %-47PROVIDENCE RESOURCES PLC - ESM 66.34 0.08 -0.38 1.27is
166.2336.31254.3158.83165IE00B1HDWM43 160147 5.1 17.6 %3 %12TOTAL PRODUCE PLC - ESM 526.04 0.51 -0.34 0.24i0.550.000.170.0032GB00B9275X97 320 0.0 32.0 %0 %0VENN LIFE SCIENCES HOLDINGS PLC - ESM 19.284.091.040.510.118IE00B1G17W46 1313 -4.8 -5.3 %-38 %-40ZAMANO PLC - ESM 7.96 0.00 -2.83 0.16is
NOTES*Weighting shows the percentage of ISEQ market capitalisation of each stock. *All companies marked with an 'i' are included in the ISEQ Overall and ESM Indices.*All companies marked with 'is' are included in the ISEQ Overall Index AND the ISEQ Small Cap Index.
Individual Company Data for Enterprise Securities Market
Volume (m)SEP-16
Mkt Turnover €(m)SEP-16
% Change Absolute ChangeShare Price €CSEP-16SEP-1631-AUG-1631-DEC-15 30-SEP-16Company Name ISIN YTD YTD
MarketCap €(m)
YTD YTD30-SEP-16NAV AUM
SEP-16 SEP-166.020.301,205IE00BVFB1H83 1,2291,378 -24.1 -173.4 %-2 %-13WisdomTree Issuer Plc 27.72 12.04 27,503,4000.480.02
Individual Company Data for Main Securities Market - ETF
Page 21 of 23

Monthly Report September 2016
Date Company Action New Capital (€) Existing Capital (€) Money Raised (€)
FIRST DERIVATIVES PLC - ESM Exercise of Options 2,652,90014-Sep-2016FYFFES PLC - ESM Placing 47,175,000 47,175,00020-Sep-2016WIRELESS GROUP PLC Exercise of Options 4,525,62429-Sep-2016
Equity Investment Flows
GlossaryNew Capital Value of newly issued shares (Capital increase) - Monetary value of shares issued through a capital increase, by both newly listed companies and already listed companies.
Existing Capital Value of already issued shares (Sale) - Monetary value of public/secondary offers through a sale of already issued shares, by both newly listed companies and already listed companies.
Money Raised The aggregated amount of actual money raised (gross proceeds) by companies admitted to listing and trading on the ISE in a specific period through various share issuances.
Page 22 of 23

Monthly Report September 2016
527 1,294 6,6971,821 Funds Subfunds ClassesTotal Funds/Subfunds (incl Umbrella Funds)Investment Funds
% of TotalNo of Funds & Subfunds % of Total % of TotalNo. of ClassesNo. of FundsIreland 273 5,496%51.80 %82.071,400 %76.88Bahamas 1 4%0.19 %0.061 %0.05Bermuda 42 133%7.97 %1.9948 %2.64British Virgin Islands 25 177%4.74 %2.6438 %2.09Cayman Islands 116 669%22.01 %9.99148 %8.13Delaware 3 3%0.57 %0.043 %0.16Guernsey 14 83%2.66 %1.2431 %1.70Jersey 36 85%6.83 %1.27119 %6.53Mauritius 5 5%0.95 %0.077 %0.38Other 5 12%0.95 %0.185 %0.27Luxembourg 4 26%0.76 %0.3917 %0.93Malta 2 3%0.38 %0.043 %0.16Singapore 1 1%0.19 %0.011 %0.05
527 6,697 Total: %100 %1001,821 %100
Total Securities Currently listed at the end of September 2016
Fund - Summary Statistics
% of Total % of Total % of TotalNo of Funds & SubFundsLegal Structure No of SubfundsNo of FundsInvestment Company 459 1,1141,573 %87.10 %86.09%86.38Unit Trust 38 127165 %7.21 %9.81%9.06Limited Partnership 2 02 %0.38 %0.00%0.11CCF 4 711 %0.76 %0.54%0.60Existing Company 1 12 %0.19 %0.08%0.11ICAV 4 1519 %0.76 %1.16%1.04Other 9 413 %1.71 %0.31%0.71PCC 4 1216 %0.76 %0.93%0.88SPC 6 1420 %1.14 %1.08%1.10
527 1,294Total: 1,821 %100 %100%100
Debt Securities - Summary Statistics Debt Security Debt Non-Debt Programme
Issuers* Programme Issuers TranchesTotal End of September 2016New September 2016 New Year To Date 2016
28,3173,18126
262
7388
54*These figures include approved Programmes with no securities issued from them.
5174,578
Page 23 of 23The Irish Stock Exchange plc is regulated by the Central Bank of Ireland.