crystallisation and chain conformation of long chain n-...
TRANSCRIPT

Crystallisation and chain conformation of long chain n-alkanes.
GORCE, Jean-Philippe.
Available from Sheffield Hallam University Research Archive (SHURA) at:
http://shura.shu.ac.uk/19705/
This document is the author deposited version. You are advised to consult the publisher's version if you wish to cite from it.
Published version
GORCE, Jean-Philippe. (2000). Crystallisation and chain conformation of long chain n-alkanes. Doctoral, Sheffield Hallam University (United Kingdom)..
Copyright and re-use policy
See http://shura.shu.ac.uk/information.html
Sheffield Hallam University Research Archivehttp://shura.shu.ac.uk
REFERENCE
Fines are charged at 50p per hour
b\w\o^s^f^ u \ o |

ProQuest Number: 10697005
All rights reserved
INFORMATION TO ALL USERS The quality of this reproduction is dependent upon the quality of the copy submitted.
In the unlikely event that the author did not send a com ple te manuscript and there are missing pages, these will be noted. Also, if material had to be removed,
a note will indicate the deletion.
uestProQuest 10697005
Published by ProQuest LLC(2017). Copyright of the Dissertation is held by the Author.
All rights reserved.This work is protected against unauthorized copying under Title 17, United States C ode
Microform Edition © ProQuest LLC.
ProQuest LLC.789 East Eisenhower Parkway
P.O. Box 1346 Ann Arbor, Ml 48106- 1346

CRYSTALLISATION AND CHAIN
CONFORMATION OF LONG CHAIN N-ALKANES
Jean-Philippe Gorce
A thesis submitted in partial fulfilment of the requirements of
Sheffield Hallam University for the degree of
Doctor of Philosophy
June 2000

\ V - \ ^

Declaration
The work described in this thesis was carried out by the author in the Materials
Research Institute, Sheffield Hallam University, between October 1995 and June 2000.
The author declares this work has not been submitted for any other degree. The work is
original except where acknowledged by reference.
A u th o r:
(Jean-Philippe Gorce)
Supervisor:
(Doctor Steve Spells)
Acknowledgements
First of all, I would like to thank my supervisor, Doctor Steve Spells from Sheffield
Hallam University, for his support and advice throughout this project. Of course, I
would like to thank Professor Jack Yarwood from Sheffield Hallam University and
Doctor Marcel Besnard from the University of Bordeaux I (France) for the opportunity
they gave me to get involved in this research project. I also want to thank Doctor Goran
Ungar and Mr Xiangbing Zeng from the University of Sheffield for their helpful
discussions and help with setting up the X-ray experiments.
Secondly, I would like to thank all my colleagues at Sheffield Hallam University and
specially the ones from the Polymer group : Declan Forde, Stephane Moyses, Sandry
Coutry and Sujeewa De Silva.
Finally, my warmest thanks go to Michele, Robert and Delphine.
Abstract
Hydrocarbon chains are a basic component in a number of systems as diverse as biological membranes, phospholipids and polymers. A better understanding of the physical properties of n-alkane chains should provide a better understanding of these more complex systems. With this aim, vibrational spectroscopy has been extensively used. This technique, sensitive to molecular details, is the only one able to both identify and quantify conformational disorder present in paraffinic systems. To achieve this, methyl deformations have been widely used as “internal standards” for the normalisation of peak areas. However, in the case of n-alkanes with short chain length, such as n-C44H90 for example, the infrared spectra recorded at liquid nitrogen temperature and reported here show the sensitivity of these latter peaks to the various crystal structures formed. Indeed, the main frequencies of the symmetric methyl bending mode were found between 1384 cm'1 and 1368 cm'1 as a function of the crystal form. Changes in the frequency of the first order of the L.A.M. present in the Raman spectra were also observed. At higher temperatures, non all-trans conformers, inferred from different infrared bands present in the wagging mode region, were found to be essentially placed at the end of the n-alkane chains. At the monoclinic phase transition, the concentration of end-gauche conformers, proportional to the area of the infrared band at 1342 cm'1, increases abruptly. On the contrary, in the spectra recorded at liquid nitrogen temperature no such band is observed.We also studied the degree of disorder in two purely monodisperse long chain n-alkanes, namely n-C198H398 and n-C246H494. The chain conformation as well as the tilt angle of the chains from the crystal surfaces were determined by means of low frequency Raman spectroscopy and S.A.X.S. measurements on solution-crystallised samples. The increase in the number of end-gauche conformers which was expected to occur with the increase of the tilt angle as a function of the temperature was not detected due to a perfecting of the crystals. Indeed, due to successive heating and cooling to -173°C, the concentration of non all-trans conformers was found to decrease within the crystals. Their numbers were found to be up to six times higher in n-C198H398 crystallised in once folded form than when crystallised in extended form. The C-C stretching mode region of the spectra was used to identify the chain conformation and to estimate the length of the all-trans stem passing through the crystal layers at -173°C. The transition between once folded and extended form crystals was indicated by the presence of additional bands in this region at 1089 cm'1, 1078 cm'1 and 1064 cm'1. Some of those bands may be related to the fold itself. At the same time, a strong decrease of the intensity of the infrared bands present in the wagging mode region was observed.Finally, the triple layered structure proposed on the basis of X-ray measurements obtained from the crystals of a binary mixture of long chain n-alkanes, namely n-C162H326 and n-C246H494, was confirmed from the study of the C-C stretching mode region of the infrared spectra.
Table of contents
Table of Contents
TABLE OF C O N T E N T S..................................................................................................................................................... I
I INTRO DUCTIO N ................................................................................................................................................................1
1.1 INtroductioN to Polymers................................................................................................................................... l1.2 Molecular structures iN polymers................................................................................................................l
1.2.1 Rotational Isomeric States........................................................................................................................31.2.2 Helices.............................. ........................................................................................................................... 51.2.3 Coils..............................................................................................................................................................5
1.2.3.1 Ideal chains...................................................................................................................................................... 61.2.3.2 Expanded chains........................ 7
1.2.4 The Ising-chain...........................................................................................................................................81.3 Crystal structures iN polymers...................................................................................................................... 8
1.3.1 Crystallisation from dilute solutions.....................................................................................................101.3.2 Crystallisation from concentrated solutions andfrom the melt.......................................................121.3.3 Crystallisation with orientation.............................................................................................................121.3.4 Degree o f crystallinity............................................................................................................................ 12
1.4 Polymer crystallisatioN.'!.................................................................................................................................131.4.1 The crystalline m odel............................................................................................................................. 131.4.2 Growth theories........................................................................................................................................13
1.5 LoNg chaiNs of N -alkaNes : a N ideal model for polymer crystallisatioN ...............................191.5.1 Synthesis.....................................................................................................................................................191.5.2 Crystallisation behaviour...................................................................................................................... 20
1.5.2.1 Initial stages of crystallisation..................................................................................................................... 211.5.2.2 Crystallisation rate minima..........................................................................................................................231.5.2.3 Crystal morphologies....................................................................................................................................241.5.2.4 Molecular Folds............................................................................................................................................ 25
1.6 A im aNd objectives.................................................................................................................................................28
II T E C H N IQ U E S.................................................................................................................................................................31
II. 1 D iffereNtial ScaNNiNg Calorimetry ...................................................................................................... 3 111.2 Small a Nd W ide ANgle X -ray ScatteriNg techNiques.......................................................................3111.3 V ibratioNal spectroscopy............................................................................................................................... 33
11.3.1 The Born-Oppenheimer approximation..............................................................................................3511.3.2 The Quantum Mechanical Harmonic Oscillator..............................................................................3611.3.3 Absorption and emission o f radiation.................................................................................................38
11.3.3.1 Einstein coefficients.................................................................................................................................... 3811.3.4 Vibrational infrared spectroscopy: selection rules......................................................................... 39II. 3.5 Raman scattering............................................................................................................................... 41
11.3.5.1 Low frequency Raman Longitudinal Acoustic Modes (L.A.M.)...........................................................4511.3.6 Vibrations ofpolyatomic molecules and polymers........................................................................47
11.3.6.1 Calculation of methylene vibrational frequencies................................................................................... 47II. 3.7 Dispersive and Fourier transform spectrometers.............................................................................48
III SHORT CHAIN N-ALK ANE CRYSTALS : N-C44H 90...................................................................................54
III. 1 INtroductioN ......................................................................................................................................................54III.2 BackgrouNd ........................................................................................................................................................ 55
III. 2.1 Methyl deformation modes in the infrared spectra o f n-paraffins : H-C-H bending (symmetric U, asymmetric a), C-H stretching (symmetric r +, asymmetric r ~) and rocking (f3) modes...................................................................................................................................................................55
Table of contents
777.2.2 Carbon-carbon stretching modes and methylene deformation modes (rocking-twisting, twisting-rocking, wagging, bending and C-H stretching modes) in the infrared spectra o f n-paraffins......................................................................................................................................................................... 58III. 2.3 Structural studies....................................................................................................................................... 61
111.3 ExperimeNtal sectioN....................................................................................................................................... 62III. 3.1 X -ray Scattering.........................................................................................................................................62III. 3.2 Differential Scanning C alorim etry...................................................................................................... 62III. 3.3 F.T.I.R ............................................................................................................................................................62III. 3.4 Low frequency Raman Spectrom eter...................................................................................................67III. 3.5 Samples......................................................................................................................................................... 67
111.4 Results ..................................................................................................................................................................... 68111.4.1 X -ray scattering results................................................................................................................................ 68
111.4.1.1 Sample Al : 1.3% solution, crystallised at 25^0, lightly pressed...................................................... 68111.4.1.2 Sample A2 : 1.3% solution, crystallised at 250c, heavily pressed.....................................................69111.4.1.3 Sample Al cooled down from the melt at 2®C per hour.......................................................................69111.4.1.4 Sample A3 : 0.45% in solution, crystallised at 250(3, mat not pressed at all....................................69111.4.1.5 Sample A3 : 0.45% in solution, crystallised at 25^(3, mat lightly pressed........................................69
777.4.2 D.S.C. results...................................................................................................................................................69111.4.2.1 Sample A l : 1.3% solution, crystallised at 250c, lightly pressed.....................................................69111.4.2.2 Sample D : 1.3% solution, lightly pressed............................................................................................. 71
III. 4.3 Infrared and Raman Spectroscopy results.............................................................................................. 72111.4.3.1 Sample A l : 1.3% solution, crystallised at 25^0, lightly pressed..................................................... 72
III.4.3.1 .a High temperature infrared spectra............................................................................................... 72777.4.3.7.a. 7 Wagging mode region............................................................................................................. 72111.4.3.1.a.2 Methylene rocking mode region............................................................................................ 75
111.4.3.1.b Low temperature infrared spectra....................................................................................................77111.4.3.1.b.l Wagging mode region............................................................................................................. 771114.3.1.b.2 Methylene rocking mode region............................................................................................ 80111.4.3.1.b.3 Methyl rocking mode region.................................................................................................. 82
111.4.3.2 Sample A2 : 1.3% solution, crystallised at 25^0, heavily pressed..................................................... 83111.4.3.2.a High temperature infrared spectra.................................................................................................. 83
111.4.3.2.a.l Wagging mode region............................................................................................................. 83111.4.3.2.a.2 Methylene rocking mode region.............................................................................................86
111.4.3.2.b Low temperature infrared spectra....................................................................................................87111.4.3.2.b.l Wagging mode region............................................................................................................. 87111.4.3.2.b.2 Methylene rocking mode region................................................................................ 89111.4.3.2.b.3 Methyl rocking mode region.................................................................................................. 91
111.4.3.3 Samples A3.............................................................................. 92111.4.3.4 Sample B : 0.265% in solution, cooling rate of OJ^C/minute, n-C44H90 crystals are deposited on aKBr plate................................................................................................................................................................. 94
1114.3.4.0.1 Wagging mode region............................................................................................................. 951114.3.4.0.2 Methyl rocking mode region...................................................................................................961114.3.4.0.3 Methyl C-H stretching mode region...................................................................................... 971114.3.4.0.4 Raman spectroscopy................................................................................................................ 99
111.4.3.5 Sample C : 0.325% in solution, crystallised at 25^C directly on the KBr plate...............................100111.4.3.5.a Wagging mode region..................................................................................................................... 101111.4.3.5.b Methyl rocking mode region..........................................................................................................106111.4.3.5.C Methyl C-H stretching mode region.............................................................................................. 107111.4.3.5.d Raman spectroscopy........................................................................................................................109
111.4.3.6 n-C4 4 H9 o in liquid state..........................................................................................................................110111.5 Sum m ary aNd coNclusioNs.......................................................................................................................... 112
IV PURE LONG CHAIN N-ALKANES : N-C198H39g AND N-C246H494................................................... 1 15
IV. 1 BackgrouNd ....................................................................................................................................................115IV.2 ExperimeNtal sectioN....................................................................................................................................118
IV. 2.1 F.T.I.R..............................................................................................................................................................118IV. 2.2 Raman spectroscopy........................................................................................................... 118IV. 2.3 Small Angle X -ray Scattering............................................................................................................... 119IV.2.4 Sample preparation ......................................................................................................................................119
IV.3 RESULTS................................................................................................................................................................120

Table of contents
IV.3.1 Sample (1) : n-CiQRHiQR crystallised in once fo lded form ............................................................120IV.3.1.1 S.A.X.S. measurements........................................................................................................................... 120IV.3.1.2 Raman spectroscopy................................................................................................................................120
IV.3.1.2.a Low frequency Raman spectrum...................................................................................................123IV.3.1.3 Conclusion................................................................................................................................................ 124IV.3.1.4 Tilting of the n-alkane chains................................................................................................................. 124
IV.3.1.4.a Tilting as a function of the annealing temperature......................................................................124IV.3.1.4.a.l S.A.X.S. measurements......................................................................................................... 125IV.3.1.4.a.2 Low frequency Raman spectrum.......................................................................................... 126IV. 3.1.4. a. 3 Summary............................................................................................................................. 127IV.3.1.4.a.4 Infrared Spectroscopy............................................................................................................ 128
IV.3.1.4.a.4.1 Highest temperature spectra......................................................................................... 128IV.3.1.4.a.4.2 Low temperature spectra...............................................................................................133
IV.3.1.4.a.5 Interpretation........................................................................................................................... 142IV.3.1.4.b Tilting of n-alkane chains at 95^C................................................................................................143
IV.3.1.4.b.l S.A.X.S. measurements..........................................................................................................144IV. 3.1.4.b.2 Infrared spectroscopy : low temperature spectra............................................................ 145IV.3.1.4.b.3 Interpretation........................................................................................................................... 148
IV.3.1.4.c Conclusion........................................................................................................................................150IV.3.1.5 Transition from n-Ci9 gH3 9 8 in once folded to extended form.........................................................151
IV.3.1.5.a S.A.X.S. experiments......................................................................................................................151IV.3.1.5.b Infrared spectroscopy......................................................................................................................151
IV.3.1.5.b.l Low temperature infrared spectra.........................................................................................151IV.3.1.5.b.2 Series of elevated temperature infrared spectra.................................................................. 155
IV.3.1.5.C Conclusion........................................................................................................................................158IV.3.2 Sample (2) : n -C jg s^ 3 9 8 crystallised in extendedform .................................................................159
IV.3.2.1 S.A.X.S. measurements........................................................................................................................... 159IV.3.2.2 Raman Spectroscopy................................................................................................................................160IV.3.2.3 Infrared Spectroscopy.............................................................................................................................. 163
IV.3.2.3.a Low temperature spectra.................................................................................................................163IV.3.2.3.b Elevated temperature spectra......................................................................................................... 175IV.3.2.3.C Series of elevated temperature infrared spectra........................................................................... 179
IV.3.2.4 Conclusion................................................................................................................................................ 182IV.3.3 Number o f specific conformers in n -C jgsH ^ gs crystals...............................................................183IV. 3.4 Spectral subtraction .................................................................................................................................184IV. 3.5 Sample (3) : n -C 246^494 crystallised in once fo ld ed fo rm ............................................................186
IV.3.5.1 S.A.X.S. measurements........................................................................................................................... 186IV.3.5.2 Low frequency Raman spectroscopy..................................................................................................... 187IV.3.5.3 Infrared spectroscopy...............................................................................................................................188
IV.3.5.3.a Methylene wagging mode region.................................................................................................. 188IV.3.5.3.b C-C stretching mode region........................................................................................................... 196IV.3.5.3.c Conclusion........................................................................................................................................198
V BRANCH ED AND M IXTURES O F LO NG CH AIN N -A L K A N E S........................................................ 199
V .l B ackgrouNd .......................................................................................................................................................... 199V.2 SAMPLE PREPARATION...........................................................................................................................................201V.3 Results.................................................................................................................................................................... 202
V.3.1 Sample (4) : Cg^H ig2~CH (CH s)-Cg4H J89 crystallised in once fo ld ed fo rm ...........................202V.3.1.1 Low frequency Raman spectrum............................................................................................................. 202V.3.1.2 S.A.X.S. measurements............................................................................................................................ 203V.3.1.3 Infrared spectroscopy ....................................................................................................................203
V.3.1.3.a Methylene wagging mode region................................................................................................... 203V.3.1.3.b Conclusion.........................................................................................................................................207V.3.1.3.C C-C stretching mode region............................................................................................................ 208
V.3.2 Comparison o f the infrared spectra o f sam ples (4) and (5)..............................................................210V.3.2.1 Methylene wagging mode region............................................................................................................ 210V.3.2.2 C-C stretching mode region..................................................................................................................... 214
V.3.3 Comparison o f the infrared spectra o f sam ples (4) and (1)..............................................................217V.3.3.1 Methylene wagging mode region............................................................................................................ 217V.3.3.2 C-C stretching mode region..................................................................................................................... 221
V.3.4 Comparison o f the infrared spectra o f sam ples (5) and (1)..............................................................222
iii

Table of contents
V.3.4.1 Methylene wagging mode region........................................................................................................... 222V.3.4.2 C-C stretching mode region.....................................................................................................................226
V.3.5 Conclusion.............................................................................................................................................227V.3.6 Sample (6) : 1:1 binary mixture o f n-C246H494 and n -C j62^ 326- .........................................225
V.3.6.1 Infrared spectrum of sample (6) recorded at -1730C................................................................... 228V.3.6.2 Effects of heating at a variable rate........................................................................................................ 232V.3.6.3 Heating at constant rate............................................................................................................................234
V.3. 7 Conclusion.............................................................................................................................................237
VI CONCLUSION.................................................................................................................................................. 239
REFERENCES........................................................................................................................................................ 250
iv

Chapter I / Introduction
I INTRODUCTION
1.1 Introduction to Polymers.
Polymers are used in all the area of our life. They have become essential in
communication, transportation, textiles, design and medicine. Biological polymers such
as DNA and proteins are present in all living beings. The first polymers used and
processed by mankind were natural biological ones such as wool and rubber. For
example, Charles Goodyear improved the elastic properties of natural rubber in the
1840’s. Few years later, polymers such as ebonite were commercialised. In the 1910’s,
the first synthetic polymers such as bakelite and rubber were produced and
commercialised. From then, polymer industry has shown intensive growth and a better
understanding of polymer materials has become essential.
Polymer science is divided into the study of synthesis, processing, properties and
structure. In the last of these, which will be our main concern in this work, the
molecular and crystal structure is studied using techniques such as x-ray scattering,
infrared and Raman spectroscopy, differential scanning calorimetry, optical and electron
microscopy, electron diffraction, light scattering and density.
1.2 Molecular structures in polymers.
Polymers are macromolecules with a regularly repeating structure. Polymers can be
linear or branched. In the latter, side chains are bonded to the main chain at branch
points and the polymer is designated a branched polymer. Also, when multiple bonding
occurs between the neighbouring chains, the polymer is said to be crosslinked and to
have formed a network polymer. Polymers are formed by monomers, which are the
repeat units of the chains, linked by primary bonds. When the macromolecules are
formed by one species of monomer (...a-a-a-a-a-a-a-a-a... for example) the polymer can
be designated by the term homopolymer. When they are formed by more than one
monomer (...b-b-b-a-a-b-a-b-b... for example) the polymer can be designated by the term
copolymer. Polymers can be synthesised through chemical reactions generally called
1
Chapter I / Introduction
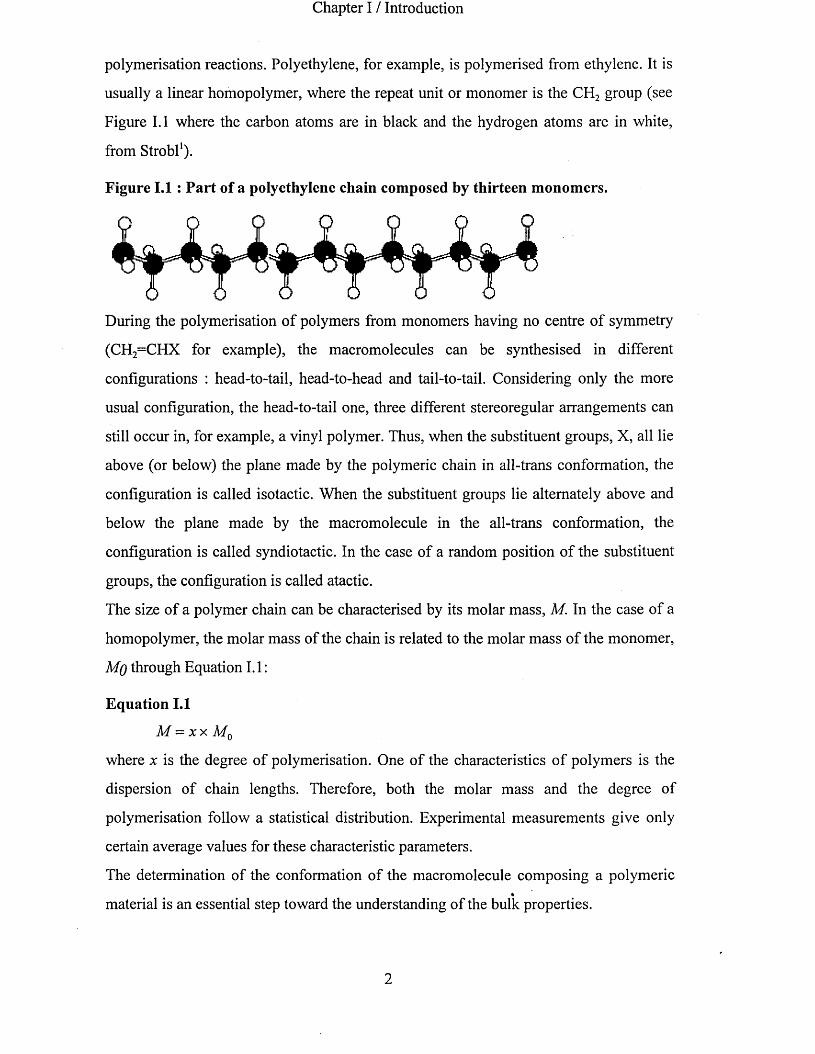
polymerisation reactions. Polyethylene, for example, is polymerised from ethylene. It is
usually a linear homopolymer, where the repeat unit or monomer is the CH2 group (see
Figure 1.1 where the carbon atoms are in black and the hydrogen atoms are in white,
from Strobl1).
Figure 1.1 : Part of a polyethylene chain composed by thirteen monomers.
During the polymerisation of polymers from monomers having no centre of symmetry
(CH2=CHX for example), the macromolecules can be synthesised in different
configurations : head-to-tail, head-to-head and tail-to-tail. Considering only the more
usual configuration, the head-to-tail one, three different stereoregular arrangements can
still occur in, for example, a vinyl polymer. Thus, when the substituent groups, X, all lie
above (or below) the plane made by the polymeric chain in all-trans conformation, the
configuration is called isotactic. When the substituent groups lie alternately above and
below the plane made by the macromolecule in the all-trans conformation, the
configuration is called syndiotactic. In the case of a random position of the substituent
groups, the configuration is called atactic.
The size of a polymer chain can be characterised by its molar mass, M. In the case of a
homopolymer, the molar mass of the chain is related to the molar mass of the monomer,
Mo through Equation 1.1:
Equation 1.1
M = x x M 0
where x is the degree of polymerisation. One of the characteristics of polymers is the
dispersion of chain lengths. Therefore, both the molar mass and the degree of
polymerisation follow a statistical distribution. Experimental measurements give only
certain average values for these characteristic parameters.
The determination of the conformation of the macromolecule composing a polymeric*
material is an essential step toward the understanding of the bulk properties.
2
Chapter I / Introduction
1.2.1 Rotational Isomeric States.
In the case of a linear flexible polymer molecule (the polyethylene molecule in Figure
LI for example) changes in the valence angles and bond lengths are very limited but
changes in the torsion angles along the backbone of the molecule can occur. In the last
case, the overall shape of the molecule is not conserved and can transform the linear
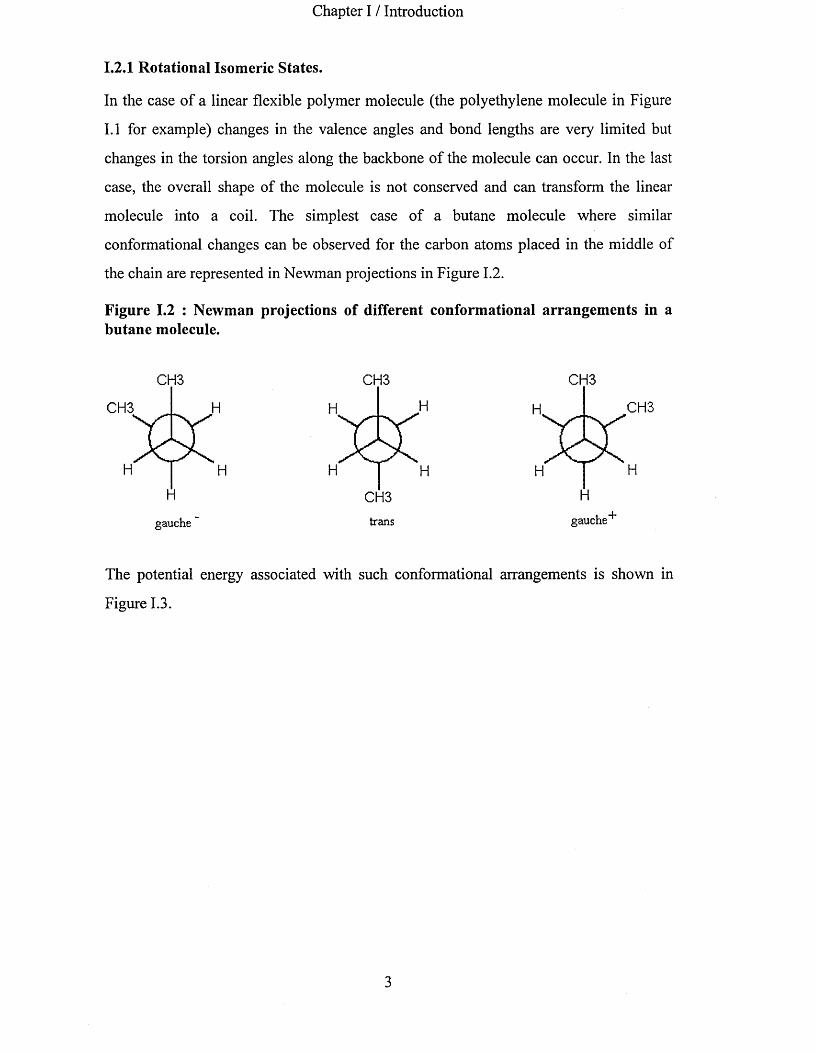
molecule into a coil. The simplest case of a butane molecule where similar
conformational changes can be observed for the carbon atoms placed in the middle of
the chain are represented in Newman projections in Figure 1.2.
Figure 1.2 : Newman projections of different conformational arrangements in a butane molecule.
CH3 CH3 CH3
gauche
CH3
CH3
gauche ~
The potential energy associated with such conformational arrangements is shown in
Figure 1.3.
3
Chapter I / Introduction
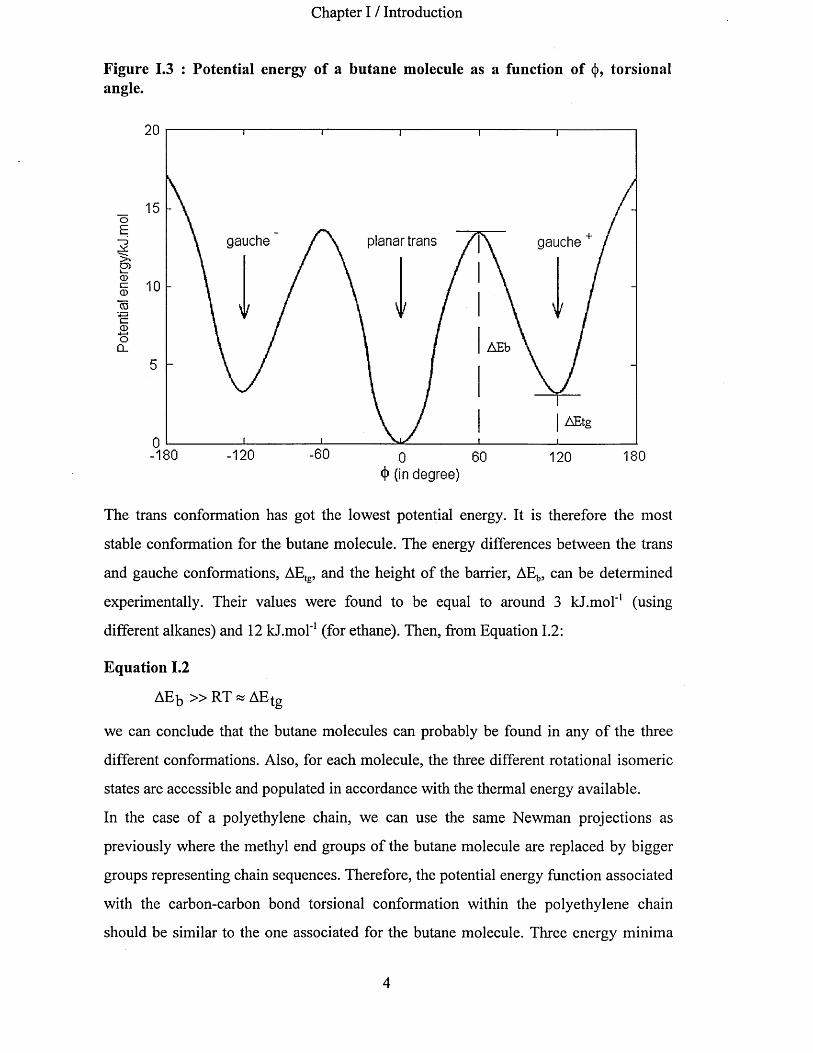
Figure 1.3 : Potential energy of a butane molecule as a function of (|), torsional angle.
oE
o>I—CDCZCD
ro4—>cCD4—1oCL
20
15
planar transgauche gauche
10
AEb5
AEtg
0 L- -180 -60-120 18060 1200
§ (in degree)
The trans conformation has got the lowest potential energy. It is therefore the most
stable conformation for the butane molecule. The energy differences between the trans
and gauche conformations, AEtg, and the height of the barrier, AEb, can be determined
experimentally. Their values were found to be equal to around 3 kJ.mol'1 (using
different alkanes) and 12 kJ.mol'1 (for ethane). Then, from Equation 1.2:
Equation 1.2
AEb » RT « AE g
we can conclude that the butane molecules can probably be found in any of the three
different conformations. Also, for each molecule, the three different rotational isomeric
states are accessible and populated in accordance with the thermal energy available.
In the case of a polyethylene chain, we can use the same Newman projections as
previously where the methyl end groups of the butane molecule are replaced by bigger
groups representing chain sequences. Therefore, the potential energy function associated
with the carbon-carbon bond torsional conformation within the polyethylene chain
should be similar to the one associated for the butane molecule. Three energy minima
4

Chapter I / Introduction
should be present for the three rotational isomeric states, the energy of the trans
conformation being the lowest one. Small differences in the values of AEt{, and AEb
found previously are expected. Thus, gauche', trans and gauche+ bond conformations
should be present along the polymeric chain. For each bond, the three rotational
isomeric states will be accessible and populated as a function of the thermal energy
available. In the case of a polyethylene chain with a degree of polymerisation x, the
number of rotational isomeric states accessible is 3(x'3). Nevertheless, the most stable
conformation for the polyethylene chain is when all the internal carbon-carbon bonds
are in the trans conformation. When the chain is in this all-trans conformation, it is also
said to be in a planar zigzag conformation (see Figure 1.1). This chain structure can be
observed within oligomer crystals too, where the chain lengths are monodisperse with
up to a few hundred repeat units.
1.2.2 Helices.
In some cases, polymer chains inside crystals adopt helix conformations. Indeed, it is
the case of polytetrafluoroethylene for example, where fluorine atoms have replaced the
hydrogen atoms present in the polyethylene chain shown in Figure 1.1. If the chain stays
in an all-trans conformation, there is a strong repulsive force between second nearest
CF2 group neighbours. Therefore, each carbon-carbon bond along the chain twists from
the trans conformation by an identical angle to accommodate the bigger CF2 groups and
form a helix. At the same time, this effect increases the rotational energy associated with
each carbon-carbon bond. Nevertheless, at a fixed torsional angle of 16.5° an energy
minimum is found. Polytetrafluoroethylene adopts a 13/6-helix conformation below
19°C. This notation indicates that 13 CF2 groups are found along 6 turns of 360°.
1.2.3 Coils.
In fluid states, each bond within a macromolecule can quite easily reach any of the
rotational isomeric states available. Then, instead of the structural properties of
polymers on a microscopic level, theories have been developed at lower resolution
where any macromolecule can be seen as a random coil-like form without
5
Chapter I / Introduction
differentiation of the chemical structure. Parameters related to the chain flexibility and
the distribution of chain conformations need to be considered in order to model the
global chain properties. In order to achieve this, the chain is divided into n segments of
length 1, without any restriction of angle between them. This is the so-called freely
jointed segment chain. A similar situation is found in the motion of a Brownian particle
suspended in a liquid. Therefore, instead of using statistical parameters related to the
coil itself, we can determine distribution functions of the segments of the chain which
will follow a Gaussian function as in the well known case of the Brownian particle.
Nevertheless, contrary to this last case, two different segments along the polymeric
chain cannot occupy the same location. Thus, the volume of the segments of the chain
need to be considered. This “excluded volume” limitation, which is a long range
interaction effect in polymers, made scientists wonder if macromolecules with Gaussian
properties exist at all. In two cases, experiments confirmed the existence of Gaussian
chains : polymer chains in Theta solvent (where the excluded volume interactions
vanished) and in the melt (chains with zero volume). In all the other cases where the
volume of the segments of the chain has to be considered, dimensions of the coil are
larger than the ones estimated by using Gaussian distribution functions.
Therefore, on a scale where their chemical structure can be ignored, polymer chains
with similar behaviour can be divided into two groups : Gaussian or ideal chains and
expanded chains.
1.2.3.1 Ideal chains.
If we apply the freely jointed segment model to an ideal polymer chain (x segments of
length 1, without any restriction of angle between them), a distribution function of the
end-to-end distance, r, following a Gaussian function can be calculated. From this
calculation, Equation 1.3 relates r0, the size of a polymer chain, more exactly the square
root of the mean square of the end-to-end distance r, to the number of chain segments, x:
Equation 1.3
( r2) l/2 = lxm
6

Chapter I / Introduction
One can remark that because a Gaussian distribution is asymptotic to the x axis, the
distribution of end-to-end distance vectors of an ideal polymeric chain do not reach zero
for distance above the chain length. It is why exact distribution functions for finite chain
lengths are also available especially in the case of the study of polymer chains submitted
to very large deformations.
1.2.3.2 Expanded chains.
In the case of expanded chains, the interaction energy is always repulsive between two
monomers along the chain. Therefore, the chain becomes expanded and due to the
decreasing number of accessible rotational isomeric states, the conformational entropy
decreases. Then, a retracting force is produced which will compensate at equilibrium the
repulsive force due to the excluded volume interactions.
De Gennes successfully solved the problem of excluded volume in macromolecules in
1972. A general feature for all the expanded chains was revealed : their distribution
functions follow simple power laws. rF, also called the Flory-radius, is related to the
diameter of the volume occupied by an expanded polymer chain and is related to the
number of monomers per chain, x, and the monomer length, 1F, by Equation 1.4:
Equation 1.4
Also, in the case of a polymer chain in a solvent, the size of the expanded chain is
related to its unperturbed dimension in Equation 1.5 by the coefficient a :
Equation 1.5
The value of the expansion factor a will depend on the nature of the solvent and will
vary as a function of the temperature. For a = l, the chain adopts its unperturbed
dimensions. This occurs at the Flory temperature 0 and the solvent is called a 0 solvent.
7

Chapter I / Introduction
1.2.4 The Ising-chain.
The Ising-chain, also known as the Rotational Isomeric State (RIS) model, is based on
the one dimensional Ising-model and is well known in statistical mechanics. Each one
of the conformational states possible for all the rotational isomeric states accessible to
each internal backbone bond represents the particle of the Ising-model and is able to
occupy states, interacting only with the nearest pairs. In this model, only the trans,
gauche' and gauche+ conformers are considered. The internal energy or entropy of a
polymeric chain can therefore be described by taking in account the short range
interactions present in the chain. One of these present in polyethylene chains and called
the pentane interaction occurs between the first and fifth carbon atoms of the sequence
trans-gauche+-gauche*-trans. The RIS model developed by Flory2 (1969) successfully
took account of this situation and can be used to determine thermodynamic functions
and specific structural properties of polymeric chains. Because the RIS-model is based
on the microstructure of the polymer chains and short range interactions, it provides a
good understanding of ideal chain properties only.
1.3 Crystal structures in polymers.
In the simplest case of monodisperse oligomers the generic name for low molecular
weight polymers, crystallisation from solution or melt occurs through the separation of
the chains from each other and by their successive attachments in a helical conformation
(zigzag chain) onto the growing lateral crystal surface. The crystal layers composed of
these chains in helical conformations with their ends at the crystal surfaces forms
lamellar shaped crystals, the size of which is of the order of few tens of micrometers
laterally and few hundred Angstroms thick (see chapter III, optical photographs III. 1
and III.2). These materials are almost purely crystalline.
In the case of polymers with molecular weight distribution, x-ray diffraction and density
experiments have shown that many polymers are semi-crystalline. Their x-ray patterns
show regular rings superimposed on a diffuse background indicating the presence of
both randomly oriented crystalline regions and amorphous materials. The crystalline
regions are usually few hundred Angstroms in thickness. The chain length of the
8
Chapter I / Introduction
polymers is long enough to go through several crystalline and amorphous regions. For a
semi-crystalline polymer, the chains within the crystalline regions preferentially adopt
the helical conformations (extended or helix forms). The amorphous regions are
composed of the parts of the chains which cannot escape, for kinetic reasons, from the
entanglement of the chains present in the fluid state, the chain ends, some branch groups
or any local conformations which resist the transition to the helical forms. In fact, the
formation and the structure of polymer crystals is strongly dependent upon kinetic
considerations rather than by the laws of equilibrium thermodynamics. Indeed, the
formation of a crystal structure by a polymer can be allowed for thermodynamic reasons
but may not be achieved for kinetic ones. For example, rapidly cooling down a
crystalline polymer originally in the melt can, in some cases, produce a fully amorphous
material.
Polymer crystals involved the side-by-side packing of the polymeric chains which lie in
one specific direction within a regular three dimensional structure. The crystal structure
can be identified by its repeating unit, namely the unit cell. This latter corresponds to the
minimum number of segments of the polymer chains needed to reconstruct the full
crystal structure by its translation. There are seven different shapes of unit cell which
characterised seven crystal systems: triclinic, monoclinic, orthorhombic, tetragonal,
trigonal and cubic. For each crystal system, the unit cell is identified by the length of
three axis (a, b and c) and by the three angles between these axis (a, p, y). The
symmetry of the crystal structure formed by the packing of the segments of the
polymeric chains present within the unit cell can be assigned to one of the 230 space
groups existing. In the case of polyethylene for example, the most common structure is
the one where the chains take the all-trans conformation and lie parallel to each other in
the c direction within an orthorhombic crystal structure assigned to the Pnam space group.
The unit cell is defined by a=7.418 A, b=4.946 A and c=2.546 A and a=p=y=90°.
9
Chapter I / Introduction
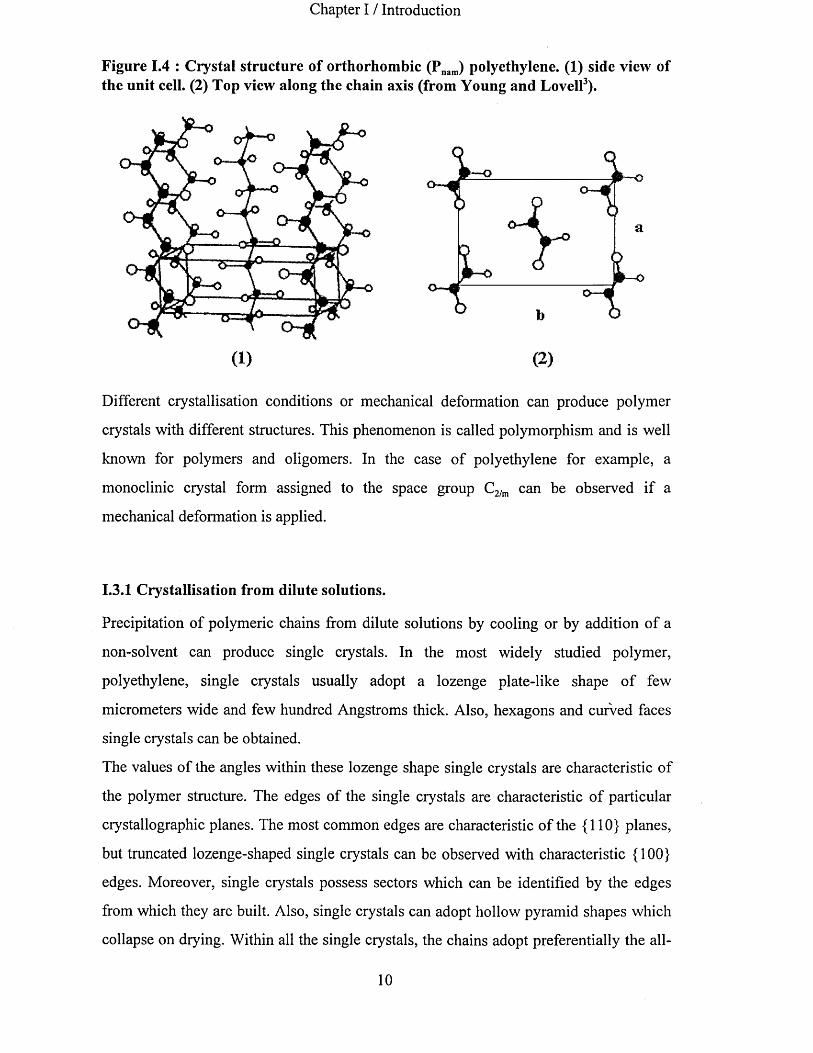
Figure 1.4 : Crystal structure of orthorhombic (Pnam) polyethylene. (1) side view of the unit cell. (2) Top view along the chain axis (from Young and Lovell3).
Different crystallisation conditions or mechanical deformation can produce polymer
crystals with different structures. This phenomenon is called polymorphism and is well
known for polymers and oligomers. In the case of polyethylene for example, a
monoclinic crystal form assigned to the space group C2/m can be observed if a
mechanical deformation is applied.
1.3.1 Crystallisation from dilute solutions.
Precipitation of polymeric chains from dilute solutions by cooling or by addition of a
non-solvent can produce single crystals. In the most widely studied polymer,
polyethylene, single crystals usually adopt a lozenge plate-like shape of few
micrometers wide and few hundred Angstroms thick. Also, hexagons and curved faces
single crystals can be obtained.
The values of the angles within these lozenge shape single crystals are characteristic of
the polymer structure. The edges of the single crystals are characteristic of particular
crystallographic planes. The most common edges are characteristic of the {110} planes,
but truncated lozenge-shaped single crystals can be observed with characteristic {100}
edges. Moreover, single crystals possess sectors which can be identified by the edges
from which they are built. Also, single crystals can adopt hollow pyramid shapes which
collapse on drying. Within all the single crystals, the chains adopt preferentially the all-
(i) (2)
10
Chapter I / Introduction
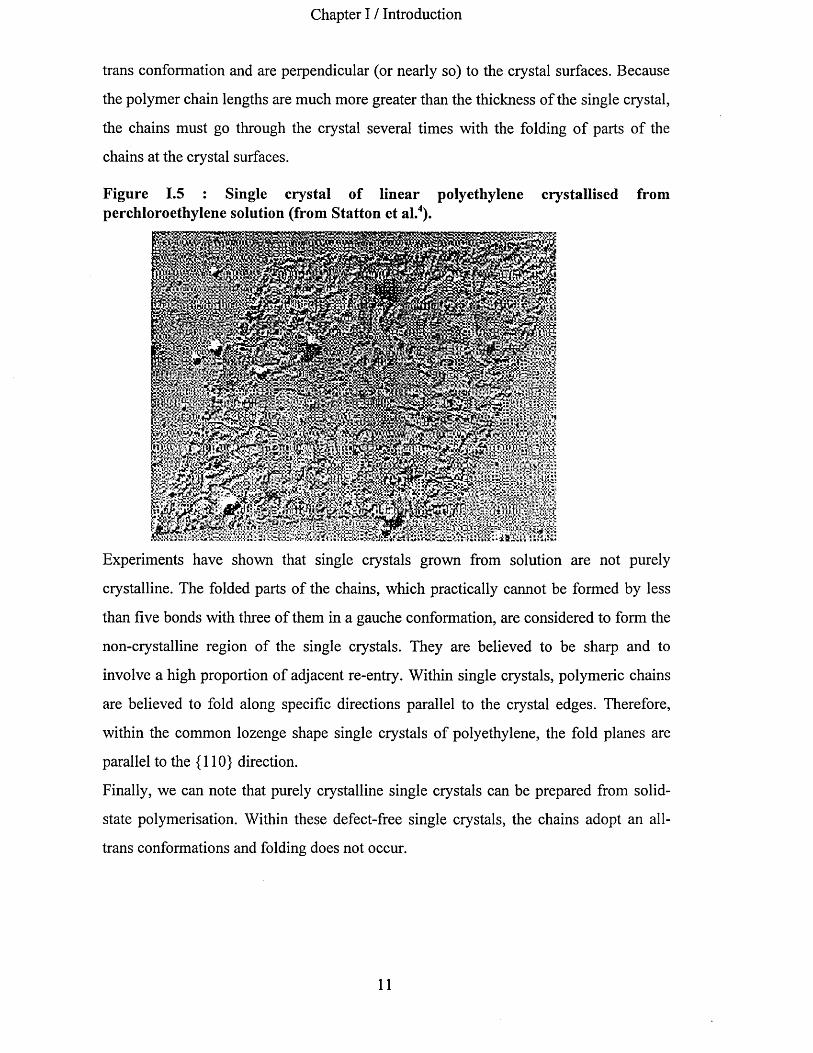
trans conformation and are perpendicular (or nearly so) to the crystal surfaces. Because
the polymer chain lengths are much more greater than the thickness of the single crystal,
the chains must go through the crystal several times with the folding of parts of the
chains at the crystal surfaces.
Figure 1.5 : Single crystal of linear polyethylene crystallised fromperchloroethylene solution (from Statton et al.4).
Experiments have shown that single crystals grown from solution are not purely
crystalline. The folded parts of the chains, which practically cannot be formed by less
than five bonds with three of them in a gauche conformation, are considered to form the
non-crystalline region of the single crystals. They are believed to be sharp and to
involve a high proportion of adjacent re-entry. Within single crystals, polymeric chains
are believed to fold along specific directions parallel to the crystal edges. Therefore,
within the common lozenge shape single crystals of polyethylene, the fold planes are
parallel to the {110} direction.
Finally, we can note that purely crystalline single crystals can be prepared from solid-
state polymerisation. Within these defect-free single crystals, the chains adopt an all-
trans conformations and folding does not occur.
11
Chapter I / Introduction
1.3.2 Crystallisation from concentrated solutions and from the melt.
When crystallisation occurs at higher concentrations, more complex crystal structures
are observed such as twinned crystals, dendritic growths, spiral growths, steps,
dislocation networks and Moire patterns. In the case of crystallisation from the melt,
very characteristic spherical objects, the size of which varies from a few micrometers up
to millimetres can be observed by optical microscopy. During crystallisation from the
melt, nuclei are first observed and these grow in size to form spherulites. Their growth
rate is constant until they make contact with their neighbours. It is possible to
differentiate adjacent spherulites which have nucleated in the same time from the ones
which have not. Indeed, in the first case, linear bondaries are observed where spherulites
come into contact. In the second case, curved bondaries are observed. Using polarised
light, spherulites show a very characteristic Maltese cross. This is due to an optical
anisotropy effect related to the orientation of the polymeric chains found to be
perpendicular to the radius of the spherulites. For polyethylene using optical microscopy
with polarised light, a regular circular extinction pattern can also be observed. This
latter is due to a regular rotation of the chain axis and the layer normal about the radius
of the spherulites.
1.3.3 Crystallisation with orientation.
The application of stress on polymeric materials during crystallisation produces specific
crystal morphologies with their own physical properties. Inside the crystals, the chains
tend to align in the direction of the applied stress. If stirring is applied during
crystallisation from a solution of polyethylene for example, a peculiar crystal
morphology is obtained consisting of a central backbone used as the nucleus for
lamellar overgrowths. This is known as the shish-kebab morphology.
1.3.4 Degree of crystallinity.
The degree of crystallinity affects the physical and mechanical properties of a polymeric
material. It is one of the parameters needed to identify a polymer. Several methods can
be used to estimate it, none of them giving exactly the same result.
12

Chapter I / Introduction
Due to the higher density of the crystalline regions compared to the amorphous ones (a
difference of about 20%), the degree of crystallinity can be determined by density
measurements using flotation experiments. Wide Angle X-ray Scattering can also be
used to determine the degree of crystallinity of a polymer. W.A.X.S. data usually take
the form of a spectrum where the intensity of the diffracted x-ray beam is plotted against
the diffraction angle 20. The area of a broad band proportional to the amount of
amorphous material present in the sample can be calculated. The area of sharp peaks
proportional to the amount of crystalline material is also needed.
1.4 Polymer crystallisation.
The earlier stage of the study of polymer crystallisation has been developed around the
discovery of the structure of polymer single crystals formed from solution, as shown in
Figure 1.5 and described previously. Then, it was followed by Keller’s concept5 of
polymer crystallisation by chain folding. Since the discovery of chain folding in
polymer crystals, several crystallisation theories have been developed to explain the
growth of these crystals and the subject is still widely debated.
1.4.1 The crystalline model.
The crystal can be schematically represented by a single layer where molecules are
parallel to each other and traverse the lamella perpendicular to the crystal surfaces. Any
loose parts of the chains, chain ends and folds are outside the crystal layer. The folds are
predominantly adjacent and their lengths may vary.
1.4.2 Growth theories
Growth theories can be divided into two main categories based on thermodynamic
considerations and kinetics. Among the earlier, Peterlin6 (1960) assumes that the crystal
reaches a minimum free energy state. This model does not take in account the folds
formed during polymer crystallisation. Also, Sadler7 developed a theory which applies
to rough and curved single crystals grown from solution or extracted from the melt. He
13
Chapter I / Introduction
proposed an entropic barrier model8 leading to the correct growth laws for these rough
crystals. The latter, among which the nucleation theory was developed first by Hoffman
and Lauritzen9 (1960), have received a more general acceptance. They are based on the
assumption that free energy barriers are too high for equilibrium and that during
crystallisation the preferred crystal thickness is the one which maximises the growth rate
of the crystals. In these models, crystallisation of polymers is a two step process. During
the first step, also called primary isothermal crystallisation, the temperature of the melt
or solution is fixed below the melting point and nucleation followed by the growth of
ordered regions occurs. Then, during the second step, called secondary crystallisation,
the cooling of the material below its primary temperature of crystallisation forms
additional crystallites. Therefore, polymer crystallisation is not instantaneous and in
fact, the time to reach its completion can be indefinite.
During the primary isothermal crystallisation, the rate of the crystallisation can be
obtained experimentally by determining, for example, the variation of the specific
volume of the material as a function of time at a fixed crystallisation temperature. Thus,
the rate of crystallisation is defined by the inverse of the time needed to reach one-half
of the total volume change.
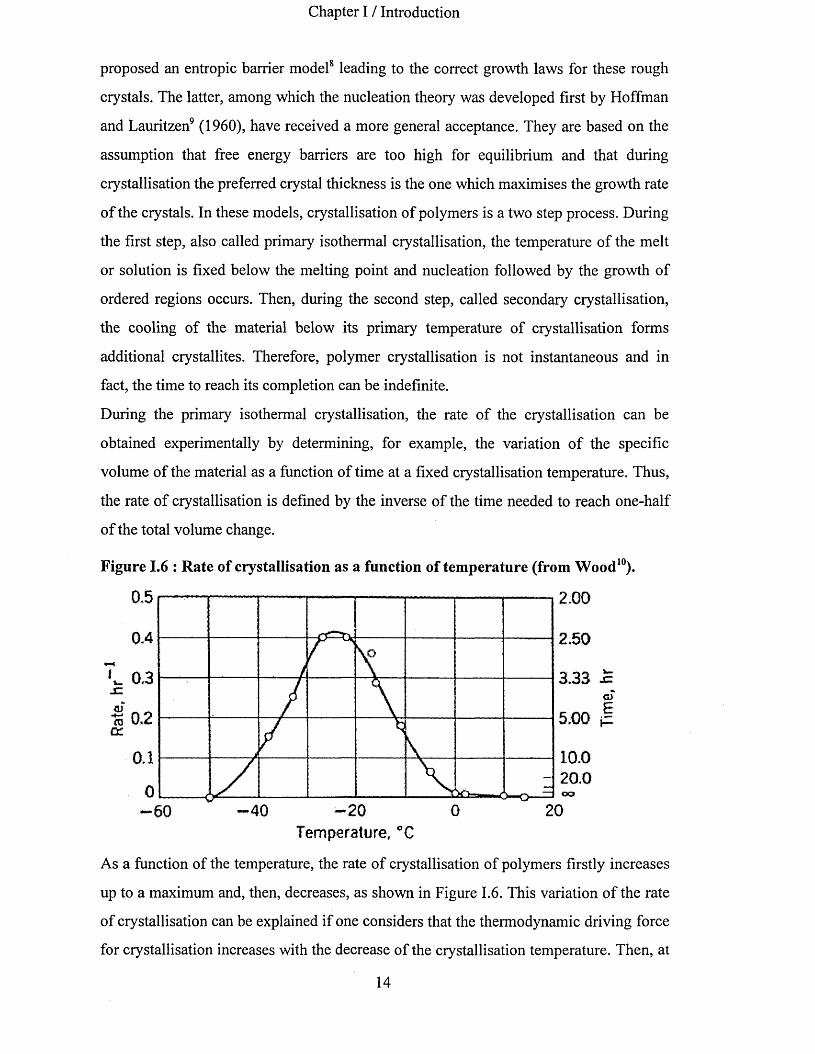
Figure 1.6 : Rate of crystallisation as a function of temperature (from Wood10).
L 0,3JZ
% 0.2 cc
0.1
5,00
10.020.0CO
20 2040 060Temperature, °Q
As a function of the temperature, the rate of crystallisation of polymers firstly increases
up to a maximum and, then, decreases, as shown in Figure 1.6. This variation of the rate
of crystallisation can be explained if one considers that the thermodynamic driving force
for crystallisation increases with the decrease of the crystallisation temperature. Then, at
14

Chapter I / Introduction
a low enough temperature, the viscosity will become sufficiently high to overcome the
still increasing driving force allowing the transport of materials at the growth point.
From this point, the rate of crystallisation will be progressively reduced with the
crystallisation temperature. Also, in the case of a given polymer, the rate of
crystallisation of a lower molar mass sample will be higher than its higher molar mass
counterpart. If the variation of the specific volume of a polymer is plotted as a function
of log time, then the shape of the curves are similar for each different temperature and
can be superposed by a translation along the abscissa. These curves follow Equation 1.6
known as Avrami’s equation :
Equation 1.6
In — ktnWcv K o - V 0 y
where ¥«» Vf and V0 are specific volumes at the times indicated by the subscripts, Wc is
the weight fraction of crystallised material, A: is a constant describing the rate of
crystallisation and n known as the Avrami exponent, is characteristic of the nucleation
and growth mechanism. The experimental determination of the Avrami exponent and its
interpretation may be difficult, specially when secondary crystallisation occurs.
The thickness, dc, of the crystallites formed during the primary crystallisation of
polyethylene from the melt, is inversely proportional to the supercooling determined by
the difference of temperature between the melting temperature, Tm and the chosen
crystallisation temperature, T, as described by Equation 1.7 and as shown by Figure 1.7:
Equation 1.7
d c C n = ^ r L f + B 2Jm 1
where Bj and B2 are two constants.
15

Chapter I / Introduction
Figure 1.7 : Thickness of the lamellar crystals of polyethylene, dci as a function of the supercooling (from Barham et al.11).
24 22 20
^ 18 I 1614 12 108
5 10 15 20 25 30 35 40 45 50 55 60
T -Tjn
Leung et al12. have studied isothermal crystallisation of low molecular weight
polyethylene single crystals from solution. The lamellar thickness was found to decrease
continuously with the crystallisation temperature. For the higher molecular weight
polyethylene samples (M>11600), a continuous increase of the growth rate as a function
of the crystallisation temperature was observed. On the contrary, for the lower
molecular weight materials (M=3100 and M=4050), a discontinuity in the growth rate
versus the crystallisation temperature was observed. This unusual behaviour is
consistent with previous work realised on low molecular weight poly(ethyleneoxide)13
which has shown several discontinuities in the growth rate of melt-crystallised samples
as a function of the crystallisation temperature. As we will see below, these
discontinuities correspond to a change in the conformation of the chains deposited on
the growth surfaces. Therefore, in the case of PE3100 for example, the discontinuity in
the growth rate observed near 74°C is due to the change between once folded and twice
folded chain conformations. Reducing the temperature from the melting point, the
polymeric chains crystallise in an extended conformation and the rate of crystallisation
strongly decreases. Because polymer crystallisation is first controlled by kinetics, the
crystallites formed at a fixed temperature are the ones which have the highest growth
rate. In the case of poly(ethyleneoxide)13 with a molecular weight of M=6000, the
growth rates of the crystallites formed from the melt were measured by optical
microscopy and are plotted as a function of the temperature of crystallisation in Figure
1.8. In addition, the chain conformation for different temperature regions is shown.
Therefore, near to the melting point, we first observe the increase of the growth rate
16

Chapter I / Introduction
with the supercooling for crystallites in extended chain form. This sample can be
crystallised in extended chain conformation near to the melting point due to its low
molecular weight and, therefore, due to the shortness of its chains. Then, just below
60°C, a discontinuity in the growth rate is observed, characteristic of a change in the
crystallite structure. Crystallites in once folded form are the ones which have the highest
growth rate from this temperature and they are the ones preferred during the
crystallisation process. However, their melting point is lower and they are less
thermodynamically stable than the extended form. Then, the growth rate of these
crystallites in once folded form increases with the supercooling.
Figure 1.8 : Growth rate of poly(ethyleneoxide) (molecular weight equal to 6000) as a function of temperature, with crystals of different chain conformations (respectively extended, once-folded, twice folded) from Kovacs et al.13.
46 48 50 52 54 56 58 60 62 64
T (degree Celsius)
Once again, a discontinuity is found near 56°C. This time, it is due to a transition
between the once folded to the kinetically preferred twice folded crystallites. Finally, a
third transition is observed between the twice folded and multi-folded crystallites. This
last region of the diagram is characteristic of high molecular weight polymer behaviour.
Indeed, as observed previously in Figure 1.7, the growth rate varies continuously with
the supercooling in this last region. Therefore, in the case of low polydispersity and low
molecular weight PEO, a discontinuity of the thickness of the crystal layers formed
from the melt and equal to integral fractions of the chain length is observed as a function
17
Chapter I / Introduction
of the temperature of crystallisation. This polymeric material was the first one to show
quantised chain folding during crystallisation from the melt14.
Within nucleation theories, a barrier is involved and must be overcome in order to
deposit an initial nucleus. In these theories, the size of this initial nucleus has to be
larger than a critical size to observe the crystal growth. The critical size decreases with
the increase of the supercooling and then, leads to the increase in overall growth rate.
Lauritzen and Hoffman have developed a well established Nucleation theory which
envisages three regimes of crystallisation, giving different temperature dependence of
the growth rates. Within the first regime, also known as the mononucleation regime, the
growth rate is proportional to the width of the substrate. Within the second regime, also
known as the polynucleation regime, several nucleation events give rise to simultaneous
growth at different points on the substrate also called patches. Within the third regime,
both the additions and subtractions at the end of the patch, also called fluctuations, are
so frequent that patches have a low probability to spread before meeting another
nucleus.
After the isothermal primary crystallisation, further crystallisation is going on if the
material is cooled down below its primary crystallisation temperature. Indeed, after the
primary crystallisation, crystallites are separated from each others by amorphous
materials. The distance between the crystallites is comprised between a lower and upper
limit, the upper one being approximately equal to twice the lower one. Cooling down
the material will form new crystallites of lower crystal thickness within the thickest
amorphous regions of the sample without additional nucleus formation. Then, on further
cooling, the next thinner amorphous regions will be occupied by new crystallites with
thinner crystal layers than the previous ones. This process, occurring during the
secondary crystallisation and leaving the primary crystallites unchanged, is known as
the insertion mode.
Low molecular weight fractions of PEO were the first polymeric materials to provide
experimental data related to quantised lamellar thickness during polymer crystallisation
from the melt. The transitions between the different quantised lamellar thicknesses as a
function of the crystallisation temperature were demonstrated to result from crystal
growth kinetics. Experimental determination of the free energy of a once folded chain
18

Chapter I / Introduction
within a crystal gave the possibility to determine that only a few monomers were
involved in the fold. The fold was expected to linked the nearest or next nearest
neighbour chains. The chain ends are at the crystal surfaces. Even if low molecular
weight PEO is, at the moment, the only polymer showing such crystal thickness
behaviour as a function of the crystallisation temperature, it should not be unique. The
other example of low molecular weight polyethylene, where discontinuity in the growth
rate as a function of the crystallisation temperature was also observed, indicates that this
phenomenon is a general behaviour of flexible, low molecular weight polymeric
materials with low polydispersity.
Since long chain n-alkanes, n-CnH2n+2, with up to n = 390 were synthesised by Bidd and
Whiting15, new purely monodisperse materials have become available to study
crystallisation by chain folding. Indeed, materials from 150 up to 390 carbon atoms per
chain were found to crystallise by quantised chain folding as a function of the
supercooling with up to four folds per chain in the case of the longest n-alkane
available16.
1.5 Long chains of n-alkanes : an ideal model for polymer crystallisation.
1.5.1 Synthesis.
In 1985, Bidd and Whiting synthesised essentially pure n-alkanes following the
procedure shown in Figure 1.9. They started with 12-Bromododecanal ethylene acetal
which gave, after deprotection, an aldehyde ( 1 ) while reaction with triphenylphosphine
gave the phosphonium bromide (2). The reaction of (1), (2) and potassium carbonate in
the presence of 18-crown-6 to generate the ylide in situ in tetrahydrofuran, gave the
chain doubled C2 4 bromo acetal (3). The repetition of the reaction sequence with (3)
gave the second chain doubled product C4 8 bromo acetal, which was converted to C9 6
bromo acetal, then to C1 9 2 bromo acetal and finally to C3 8 4 bromo acetal.
19
Chapter I / Introduction
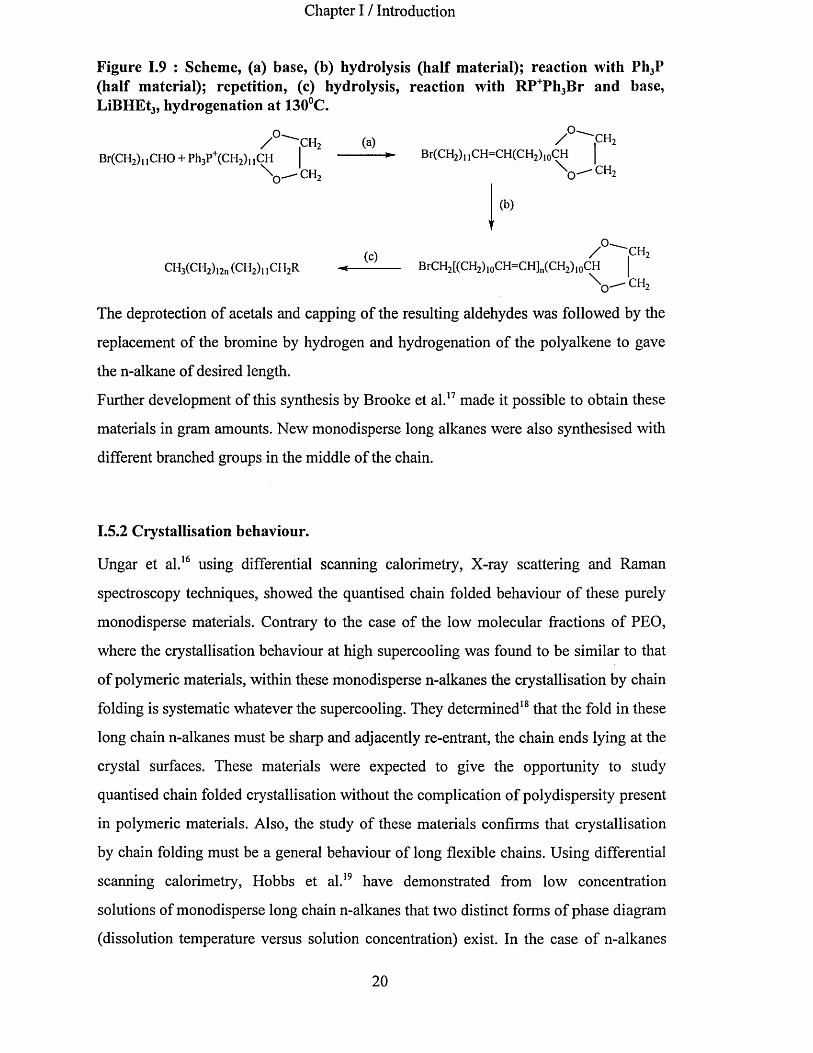
Figure 1.9 : Scheme, (a) base, (b) hydrolysis (half material); reaction with Ph3P (half material); repetition, (c) hydrolysis, reaction with RP+Ph3Br and base, LiBHEt3, hydrogenation at 130°C.
/ ° ,CH2 (a) / ,CH2Br(CH2) 11CHO + Ph3P+(CH2) 11CH ► Br(CH2)n CH=CH(CH2)10CH |
\ - c h 2 \ - c h 2
(b)v
(C) / ° ^ , C H 2CH3(CH2)12n (CH2), ,CH2R BrCH2[(CH2),0CH=CH]n(CH2) 10CH |
\ _ - c h 2
The deprotection of acetals and capping of the resulting aldehydes was followed by the
replacement of the bromine by hydrogen and hydrogenation of the polyalkene to gave
the n-alkane of desired length.
Further development of this synthesis by Brooke et al. 1 7 made it possible to obtain these
materials in gram amounts. New monodisperse long alkanes were also synthesised with
different branched groups in the middle of the chain.
1.5.2 Crystallisation behaviour.
Ungar et al. 1 6 using differential scanning calorimetry, X-ray scattering and Raman
spectroscopy techniques, showed the quantised chain folded behaviour of these purely
monodisperse materials. Contrary to the case of the low molecular fractions of PEO,
where the crystallisation behaviour at high supercooling was found to be similar to that
of polymeric materials, within these monodisperse n-alkanes the crystallisation by chain
folding is systematic whatever the supercooling. They determined1 8 that the fold in these
long chain n-alkanes must be sharp and adjacently re-entrant, the chain ends lying at the
crystal surfaces. These materials were expected to give the opportunity to study
quantised chain folded crystallisation without the complication of polydispersity present
in polymeric materials. Also, the study of these materials confirms that crystallisation
by chain folding must be a general behaviour of long flexible chains. Using differential
scanning calorimetry, Hobbs et al. 1 9 have demonstrated from low concentration
solutions of monodisperse long chain n-alkanes that two distinct forms of phase diagram
(dissolution temperature versus solution concentration) exist. In the case of n-alkanes
20

Chapter I / Introduction
with less than 160 carbon atoms per chain, a classical form of the phase diagram is
observed when the dissolution temperature increases with the solution concentration. In
the case of n-alkanes with more than 2 0 0 carbon atoms per chain, a polymeric form of
the phase diagram is determined where the dissolution temperature is not affected by the
solution concentration. This is expected to be due to locally higher concentrations where
molecules are partially attached to a crystal.
1.5.2.1 Initial stages of crystallisation.
With the help of real time small angle X-ray scattering techniques using a synchrotron
X-ray source, the first stage of crystallisation of a monodisperse long chain n-alkane, n-
C2 4 6 H4 9 4 , from the melt was studied20. It was found out that non integer fractions (NIF)
of the chain length were initially formed during crystallisation from the melt, and then
were transformed to once folded or extended form crystals by respectively thinning or
thickening processes (see Figure 1.10). The presence of this NIF form in the initial
crystallisation from the melt indicates that kinetics favour this structure which is less
thermodynamically stable than the extended or once folded crystal forms. It can be
remarked that, in the NIF form, a higher degree of disorder is present in the interface
layers. Zeng and Ungar2 1 determined by inverse Fourier transformation the electron
density profiles of the NIF and extended forms formed during the initial stage of the
melt-crystallisation of long n-alkanes n-C1 6 2 H326, n-C 1 9 4 H3 9 0 and n-C2 4 6 H494. They found
high and low density regions with sharp boundaries representing respectively the
crystalline and interface layers. In the case of the extended form crystals, the density
profiles matched the crystal thickness of this structure for the chains tilted by about 35°
from the crystal surfaces. The value of the tilt angle is characteristic of the n-alkane
crystals and is due to the shift of each chain by one CH2 group along the chain axis. It is
believed to create a greater surface area for the disordered chain ends. The electron
density determined for the interface layers was estimated to correspond to a truly
amorphous phase. In the case of the NIF form crystals, the density profiles indicated a
crystal thickness equal to half the value of the extended form crystal structure with the
chains tilted by about 35° from the crystal surfaces. The thickness of the interface layers
was estimated to vary between 1 and 3 nm in the case of the extended form crystals and
21

Chapter I / Introduction
between 6 to 8 nm in the case of the NIF form crystals as a function of both the n-alkane
chain lengths and crystallisation temperatures. In the latter structure, approximately half
the chains are in once folded form within the crystal layers and tilted by 35° from the
crystal surfaces. The others only traverse the crystal layers once and are also tilted by
35° from the crystal surfaces. In the NIF form, the crystallinity is estimated to be less
than 66% due to an alternation of truly crystalline and amorphous layers. A model
structure was determined for the NIF form and its subsequent transformation to one of
the quantised folded forms (once folded or extended) and is shown in Figure 1.10.
Figure 1.10 : Schematic representation of the different structures obtain from melt- crystallised long chain n-alkanes.
Extended NIF/mm//.. Once Folded
/ W M
Thickening Thinning
Finally, Zeng and Ungar observed a decrease of the average layer periodicity of the NIF
form crystals with decreasing temperature and increasing time. This effect was
explained by a thinning of the amorphous layers whereas the thickness of the crystal
layers stays constant. It was thought to occur by a progressive migration of the cilia
present initially in the interface layers towards the crystal layers. Both real time Raman
Longitudinal Acoustic Mode (LAM) spectroscopy and X-ray scattering techniques have
confirmed2 2 this explanation. Indeed, in the case of isothermally melt crystallised n-
C2 4 6 H4 9 4 , the first order of the LAM, characteristic of the number of carbon atoms
present in the all-trans part of the chains traversing the crystal layers was initially
observed at 20 cm'1, corresponding to 123 carbon atoms, very nearly exactly half the
chain. The intensity of this Raman band increased with time at this constant frequency,
indicating an increasing number of crystalline units within the crystal layers in the once
folded chain conformation. Nevertheless, in the case of shorter melt-crystallised n-
alkanes, such as n-C2 I0 H4 2 2 and n-C 1 9 8 H398, a more complex triple layer phase was
observed after the formation of the initial NIF structure. It is believed to be formed by a
22
Chapter I / Introduction
stacking of extended form chains aligned with once folded ones. This model is
supported by small angle X-ray scattering and by the spectrum of n - C 21oH 422 obtained by
real time Raman LAM spectroscopy in which two bands are observed at 11.7 cm' 1 and
23.6 cm'1, characteristic respectively of the extended and once folded chains traversing
the crystal layers.
I.5.2.2 Crystallisation rate minima.
Ungar and Keller2 0 noticed that during crystallisation from the melt of n-C2 4 6 H4 9 4 , the
D.S.C. cooling scan showed unusual behaviour within the extended chain crystallisation
range. Further investigations2 3 , 2 4 , 2 5 on a full range of monodisperse long chain n-alkanes
using D.S.C., S.A.X.S., phase contrast and polarised optical microscopy techniques
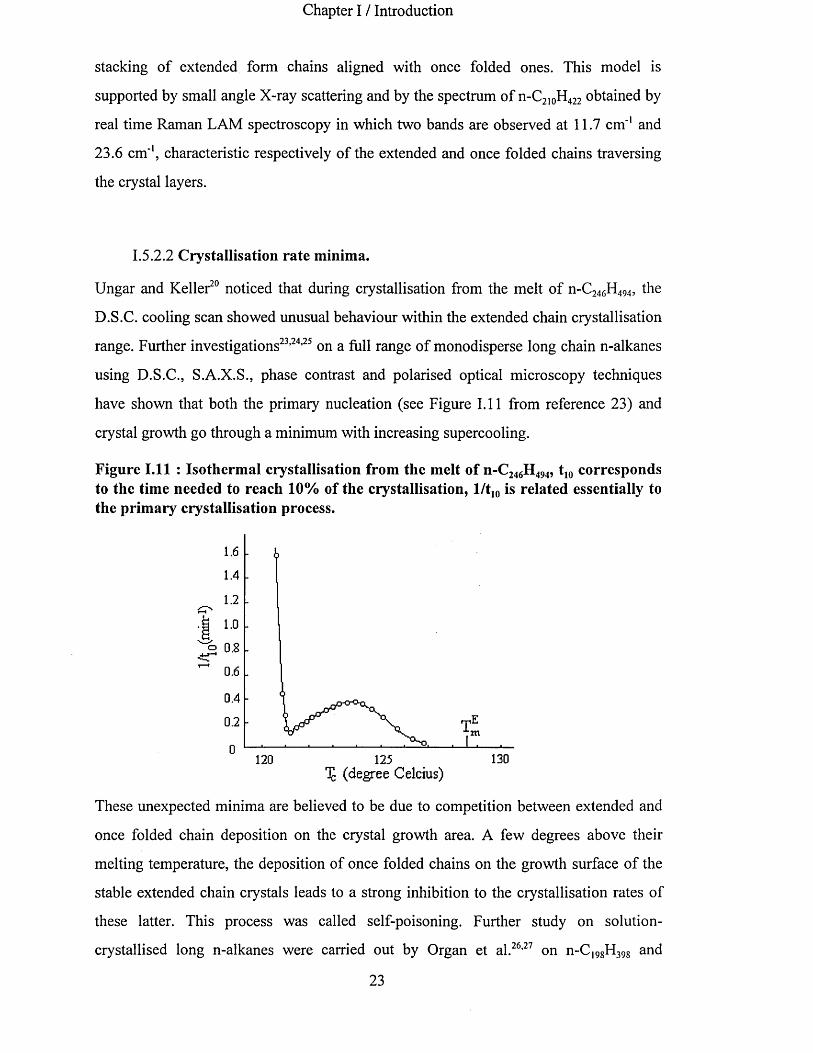
have shown that both the primary nucleation (see Figure 1.11 from reference 23) and
crystal growth go through a minimum with increasing supercooling.
Figure 1.11 : Isothermal crystallisation from the melt of n-C246H494, t10 corresponds to the time needed to reach 10% of the crystallisation, l /t10 is related essentially to the primary crystallisation process.
1.4
|H
o
0.4
0.2 m
130120 125TJ (degree Celcius)
These unexpected minima are believed to be due to competition between extended and
once folded chain deposition on the crystal growth area. A few degrees above their
melting temperature, the deposition of once folded chains on the growth surface of the
stable extended chain crystals leads to a strong inhibition to the crystallisation rates of
these latter. This process was called self-poisoning. Further study on solution-
crystallised long n-alkanes were carried out by Organ et al. 2 6 , 2 7 on n-C|9 8 H3 g 8 and
23
Chapter I / Introduction
confirmed the presence of these crystallisation rate minima. Once folded n-C1 9 8 H3 9 8
crystals in solution were found to transform to the extended form by isothermal
thickening. Isothermal thickening is well known in the case of polyethylene
crystallisation from the melt but does not occur from solution crystallisation.
Furthermore, kinetic measurements of the isothermal thickening as a function of the
crystallisation temperature shown an unexpected maximum. This effect is believed to be
due to an increasing rate of extended chain nucleation with decreasing solution
concentration. Therefore, at higher crystallisation temperatures, the concentration of
once folded chains in solution is higher, thus, reducing the rate of extended chain
nucleation. Finally, models2 8 and theoretical revisions2 9 , 3 0 were proposed for the growth
of low molecular weight polymers and monodisperse long chain n-alkane crystals in
particular.
1.5.2.3 Crystal morphologies.
Very regular polymer crystals can be obtained from solution crystallisation. Organ et
al. 2 7 , 3 1 used electron microscopy techniques to study solution-crystallised n-C 1 9 8 H3 9 8
single crystals prepared from toluene under different experimental conditions. They all
gave thin lamellae crystals. Shadowing techniques were used to determine the crystal
thickness induced by the different chain conformations. This technique indicated the
quantised nature of the crystal thickness as already observed by S.A.X.S. and Raman
LAM spectroscopy techniques. Furthermore, isothermal thickening was observed and
thickness are again integral fractions of the extended chain length. Different crystal
morphologies were obtained as a function of experimental conditions. They were found
to be similar to the case of short n-alkanes and polyethylene. Electron diffraction
patterns and dark field images were obtained and indicated a similar orthorhombic
crystal structure to polyethylene (see Figure 1.4). The alkane chains were found to be
perpendicular to the crystal surfaces. Crystal decoration with polyethylene revealed
particular crystal sectorisations. The fold direction was found to be parallel to the {110}
crystal faces.
Using polarised optical microscopy techniques and electron microscopy, Bassett at
al . 3 2 , 3 3 studied the relationship between spherulitic growth and chain conformations in
24

Chapter I / Introduction
melt-crystallised n-C2 9 4 H590. The presence of spherullites was found to depend on the
presence of once-folded chain conformations, the presence of impurities not being a
prerequisite. Indeed, in the case of the crystallisation of once folded molecules, half the
chains were at one time in the melt and formed a cilium. On the other hand, extended
chains are not expected to provide such a cilium during their crystallisation from the
melt and therefore do not allow the presence of spherulites. This explanation strongly
supports the idea of dependence of spherulitic crystallisation on pressure from
molecular cilia. Furthermore, different organisations of the lamellar structure of
extended chain crystals and spherulites within once folded chain crystals are observed
by electron microscopy. A study of a broader range of monodisperse long chain n-
alkanes was realised by Vaughan et al. 3 4 using transmission optical microscopy with
polarised light.
1.5.2.4 Molecular Folds.
Over the years, the determination of the structure and orientation of the fold during the
crystallisation of flexible polymeric materials, especially polyethylene, has been a
central issue in polymer science. A model where the folding parts of the chains are seen
as tight and adjacently re-entrant has won broader acceptance, at least in the case of
solution crystallised polymers The purely monodisperse long chain n-alkanes were the
first materials which give the opportunity to unambiguously verify this model. The
combination of D.S.C., X-ray scattering, Raman LAM spectroscopy and electron
microscopy techniques1 8 definitively demonstrate the existence of sharp chain refolding
within monodisperse long chain n-alkanes. The folds must be composed of a minimum
number of CH2 groups and are preferentially oriented along the {1 1 0 } growth plans.
Transmission Electron Microscopy with self-decoration techniques3 1 provides evidence
of fold regularity and preference for the folds to lie parallel to the particular {1 1 0 }
growth planes of polyethylene crystals. Neutron scattering gives evidence of the stem
arrangement in similar samples (not for n-alkanes yet). Among the different techniques
available to study the {1 1 0 } folds in polyethylene and long chain n-alkanes, computer
simulations using molecular dynamics have been widely used. (Note that in the
following parts of this thesis, the gauche+ conformers will be represented by “ g ” and
25

Chapter I / Introduction
gauche' ones by “ g’ ”). Initial work from Frank showed that the (110) fold cannot be
simply composed of g, g’ and t bonds, particularly if the number of carbon atoms is
small. Indeed, additional stem twists and slight alterations in intersegment distance are
required to make this path correspond to a fold along ( 1 1 0 ) in the polyethylene lattice.
The most recent of these works realised by Chum et al . 3 5 determined five lowest energy
{1 1 0 } fold conformations, the most stable being composed of the following successive
chain conformers (g’g’g g t g). Only 1.7 kcal/mol differentiates this last fold
conformation from the highest energy one. The two lowest fold conformations are
within 1 kcal/mol of each other but one additional carbon atom is present within the fold
in the later. This implies that more than one type of fold conformation could be present
in polyethylene crystals, and therefore in long chain n-alkanes. One possible {110} fold
conformation is shown in Figure 1.12.
Figure 1.12 : {110} fold conformation in long chain n-alkanes.
Atomic force microscopy3 6 was used to observe directly the arrangements of the folds
on the surface of folded chain polyethylene crystals. Local variations in the orientation
and shapes of the spots forming the images were interpreted as due to the presence of
different fold conformations in these polyethylene crystals.
Finally, vibrational spectroscopy, and in particular infrared spectroscopy, was found to
be a powerful tool in the identification of the fold conformations. Indeed, the methylene
wagging mode region of the infrared spectra of hydrocarbon compounds contains
26

Chapter I / Introduction
information about the non-planar chain conformations including the folds. The
identification of infrared bands due to the folds in long chain n-alkanes will be used here
to study chain folded crystallisation in general. The identification of conformational
isomers in hydrocarbon chain compounds by infrared spectroscopy has been reported by
Snyder3 7 from the study of the shortest chains of the n-alkane family in the liquid state.
He assigned several localised methylene modes of vibration in the limited wagging
mode region between 1400 cm* 1 and 1300 cm*1. He ascribed the bands at 1368 cm' 1 and
1308 cm* 1 to methylene sequences involving gtg and gtg’ conformations, a band at 1352
cm* 1 to a methylene sequence involving gg conformations and a band at 1344 cm ' 1 to
end gauche conformations. These different conformers are represented in Figure 1.13 in
the case of a short n-alkane chain (from Maroncelli et al.38).
Figure 1.13 : Different non-all trans conformers detectable by infrared spectroscopy.
all trans end gauche gtg' kink double gauche
From these assignments, Snyder and Schachtschneider3 9 , 4 0 also calculated the normal
modes of vibration of an infinite hydrocarbon chain using various gauche/trans
sequences. On the other hand, Zerbi and co-workers41,42, using the same force field,
calculated the density of states in model systems. The nature of the fold surface in
polyethylene and long chain n-alkanes has been subject to numerous infrared
spectroscopic studies. Computerised Fourier transform spectrometers allowed the use of
spectral subtraction and self-deconvolution techniques with confidence. Thus, Painter
27
Chapter I / Introduction
and co-workers4 3 , 4 4 reported an analysis of methylene wagging and rocking modes of
vibration in the infrared spectra of polyethylene single crystals where they discussed the
assignment of the band at 1346 cm ' 1 to the regular, tight fold structure. Spells et al. 4 5
reported a study of polyethylene single crystals obtained at different crystallisation
temperatures in the methylene wagging mode region of the infrared spectra. They
associated, as Painters and co-workers43,44, a band at 1346 cm* 1 with regular tight
folding. However, they pointed out that folds along different directions, such as the
{2 0 0 } or {1 0 0 } ones, are possible in polyethylene crystals in addition to the {1 1 0 } fold.
These could give additional infrared peaks in the region from 1342 cm ' 1 to 1348 cm"1.
Ungar and Organ46, using spectral subtraction and self-deconvolution techniques,
reported the infrared spectra of the pure {1 1 0 } fold itself present in the orthorhombic
crystals of the monodisperse long chain n-alkane n-C 1 9 8 H3 9 8 at room temperature and
110K. They confirmed previous assignments of the 1346 cm ' 1 band to a regular re-entry
{110} fold type as well as bands at 1298 cm ' 1 and 1369-1370 cm'1. Moreover, Hagele
and co-workers4 7 calculated the defect density of states of the tight {1 1 0 } fold in
polyethylene using the Green’s function method. They confirmed the assignment of the
1346 cm' 1 and 1295 cm ' 1 bands to the regular {110} fold. Using the same method, they
also calculated4 8 the eigenvectors of vibrating polyethylene chains with {2 0 0 } and
{1 1 0 } folds.
1.6 Aim and objectives.
Our aim is to study, by means of vibrational spectroscopy, disorder in these highly
ordered materials which are purely monodisperse long chain n-alkanes. Infrared
spectroscopy is the only experimental technique able to characterise specific types of
conformational disorder present in paraffmic materials in both qualitative and
quantitative ways. It is sensitive to molecular details rather than overall variations such
as electron density (S.A.X.S.) or stem length (L.A.M.). For example, infrared
spectroscopy3 8 has been used to study disorder through premelting phase transitions
occurring in odd n-alkanes from n-C1 7 H3 6 to n-C2 9 H60. Also, Maroncelli et al . 4 9 have
studied the distribution of non all-trans conformers as a function of position along the
hydrocarbon chains.
28
Chapter I / Introduction
First, we report D.S.C. and X-ray scattering measurements to determine the phase
transition temperatures and to distinguish the different crystal forms present in a short
chain n-alkane, namely n-C4 4 H9 0 crystallised from solution. Short chain n-alkanes are
known to crystallise only in an extended chain conformation with their methyl end
groups at the crystal surfaces. They form very perfect lamellar crystal structures. Then,
we show the use of infrared spectroscopy to characterise the amount of disorder within
different crystal structures of n-C4 4 H9 0 crystallised form solution under different
experimental conditions. The intensity and frequency of different infrared bands present
in the wagging mode region of the spectra were studied with reference to this “perfect”
crystalline structure. The use of the symmetric methyl deformation band (usually
assigned at 1378 cm ' 1 in the infrared spectra of paraffmic materials) for spectral
normalisation is discussed. The sensitivity of the infrared bands ascribed to the modes
of vibration of the methyl end groups and present outside the wagging mode region of
the spectra is analysed as a function of the crystal structures.
Secondly, the study of purely monodisperse long chain n-alkanes, namely n-C 1 9 8 H3 9 8 and
n-C2 4 6 H494, was undertaken taking in consideration the latest results obtained on n-
C4 4 H90. These long paraffins were crystallised from solution in extended and/or once
folded forms. S.A.X.S. measurements, low frequency Raman and infrared spectroscopy
were used to investigate the crystal organisation of these long paraffins. Spectral
subtractions were used to obtain the spectrum of the pure fold region. The numbers of
specific non all-trans conformers present in n-C 1 9 8 H3 9 8 crystals in both extended and
once folded forms were estimated. Differences in the carbon-carbon stretching mode
region of extended and once folded forms are analysed. The transition from once folded
to extended form crystals was also monitored by infrared spectroscopy. Finally, the
tilting of the n-alkane chains within the crystal layers was investigated by means of
infrared and low frequency Raman spectroscopy and S.A.X.S. techniques.
Changes in the fold conformation due to the presence of branch groups in the middle of
a long chain alkane, namely C9 6 H 1 9 3 CH(CH3 )C9 4 H ] 8 9 and
C9 6 H 1 9 3 CH(CH2 CH2 CH2 CH3 )C9 4 H189, were analysed by means of infrared and low
frequency Raman spectroscopy and S.A.X.S. techniques. The carbon-carbon stretching
mode region of their infrared spectra was studied. With the aim of estimating the effect
29

Chapter I / Introduction
of polydispersity on the crystal structures of these long chain n-alkanes, an appropriate
binary mixture of n-C2 4 6 H4 9 4 and n-C 1 6 2 H3 2 6 was prepared from the melt. The heating of
this mixture from room temperature above the melting point using different rates was
investigated by infrared spectroscopy and with the help of the results obtained by the
S.A.X.S. technique50.
30

Chapter II / Techniques
II TECHNIQUES
II. 1 Differential Scanning Calorimetry.
The determination of the enthalpy changes when heating, annealing or crystallising a
sample can provide useful information about the actual mechanism occurring during one
of such heat treatments. During a D.S.C. experiment, the temperature of a sample and
reference holder is controlled and follows a pre-recorded program as a function of time.
The temperature of the sample and the reference holders are constantly compared.
Heating power is applied to both holders to keep them at the same temperature at all
times. When the sample undergoes a phase transition, a difference in the power applied
to the sample and reference holders is noticed. Therefore, a D.S.C. trace consists of this
difference between the applied power to both holders as a function of time. During a
phase transition, a peak is observed in this curve, and its area provides the means of
measuring the enthalpy change during this transition. The melting of a sample is
characterised by a large endotherm, as are the transitions between different crystal
structures within a sample. On the other hand, recrystallisation will be characterised by
an exotherm.
II.2 Small and Wide Angle X-ray Scattering techniques.
X-ray diffraction techniques are a powerful tools in the determination of the degree of
order within structures the size of which is comparable to the wavelength of the
radiation, i.e. one to several hundred Angstroms. In the case of polymer crystals, the
distance between the atoms is of the same order than the wavelengths of the X-rays.
Strong diffraction patterns are observed in specific directions, and are due to the
interferences occurring between the X-rays scattered by each atom. The specific
scattering X-ray directions are related to the shape and size of the crystal unit cell of the
lattice. The intensity in each scattered direction is dependent upon the atomic
arrangement in the lattice. Small scattering angles (below 5°) are used to get information
31
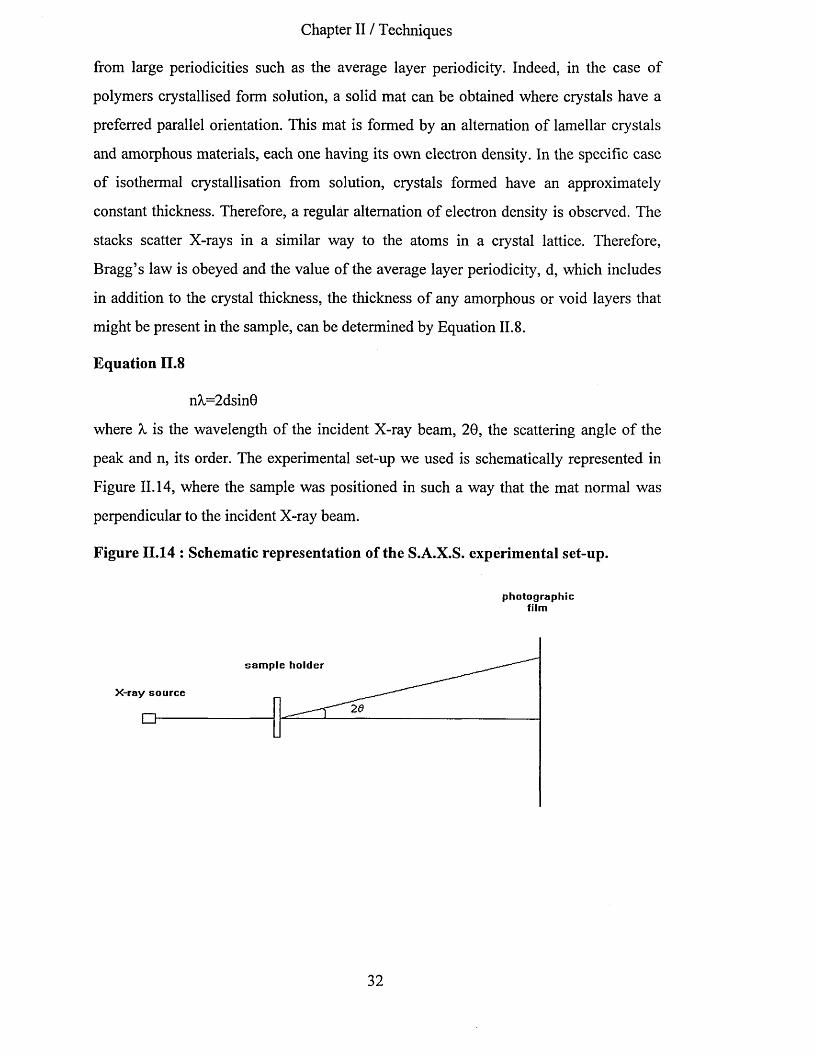
Chapter II / Techniques
from large periodicities such as the average layer periodicity. Indeed, in the case of
polymers crystallised form solution, a solid mat can be obtained where crystals have a
preferred parallel orientation. This mat is formed by an alternation of lamellar crystals
and amorphous materials, each one having its own electron density. In the specific case
of isothermal crystallisation from solution, crystals formed have an approximately
constant thickness. Therefore, a regular alternation of electron density is observed. The
stacks scatter X-rays in a similar way to the atoms in a crystal lattice. Therefore,
Bragg’s law is obeyed and the value of the average layer periodicity, d, which includes
in addition to the crystal thickness, the thickness of any amorphous or void layers that
might be present in the sample, can be determined by Equation II.8 .
Equation II.8
nA,=2 dsin0
where X is the wavelength of the incident X-ray beam, 20, the scattering angle of the
peak and n, its order. The experimental set-up we used is schematically represented in
Figure 11.14, where the sample was positioned in such a way that the mat normal was
perpendicular to the incident X-ray beam.
Figure 11.14 : Schematic representation of the S.A.X.S. experimental set-up.
p ho to g rap h icfilm
s a m p le h o ld e r
X-ray so u rc e26
32
Chapter II / Techniques
The distance between the sample holder and the photographic film is known. The
scattering angle 20, is determined from the measurement of the diameter of the rings
observed on the photographic film. Then, knowing the wavelength of the X-ray beam A,
the average layer periodicity d can be determined.
For the wider scattering angles, information from the spatial arrangements of the atoms
is obtained. In relation to any crystal lattice defined by a , b and c , a reciprocal lattice
present in a reciprocal space is employed to simplify the understanding of X-ray
diffraction by single crystals. This reciprocal lattice is defined by a*, b *and c*in
reciprocal space where a* _ ^ b* = ^ A^ and c* = - A^ and where V is theV V V
volume of the unit cell. A set of (hkl) planes is known as Miller planes and h, k and 1 as
the Miller indices. A given set of (hkl) planes in the direct lattice is represented by a
lattice point in the reciprocal lattice. Moreover, in the reciprocal lattice, the vector
s{hkl) defined from this point lattice to the origin is perpendicular to the set of parallel
(hkl) planes in the real space. Its magnitude is equal to the reciprocal of the interplane
spacing, — . The interplanar spacing of a particular set of Miller planes is given by the dhkl
Bragg’s law defined in Equation II . 8 where d=dhkl. Certain hkl reflection will be absent
for which there will be a systematic relationship in the h, k or 1 indices. These space
group extinctions are helpful to deduce a space group symmetry of a structure. Then, the
measured d-spacing are compared with those calculated for various set of (hkl) planes of
unit cells with different structures and dimensions.
II.3 Vibrational spectroscopy.
Vibrational spectroscopy allows the study of a wide range of chemical and physical
behaviour. In a typical spectrum, the intensity is plotted as a function of the frequency
of the electromagnetic radiation. The rate at which a molecule makes a transition from
one energy level to another is proportional to the intensity. The energy difference
between the initial and final energy levels are directly linked to the frequency. In the
absence of any incident electromagnetic radiation, molecules possess quantised energy
33
Chapter II / Techniques
levels which are the solutions of the time-independent Schrodinger equation shown in
Equation II.9
Equation II.9
HYn = En'J'n
where n stands for a quantum number or set of quantum numbers, x¥ n represent the
wavefunctions satisfying the equation, En represent the energy states of the system and
H called the Hamiltonian for the system.
The Hamiltonian is equal to the sum of the operators for the kinetic energy 7\ and
potential energy V as shown in Equation 11.10
Equation 11.10
H = T + V
The wavefunction ^ characterises the state of the system. When multiplied by its
complex conjugate, it (shown in Equation II. 11) is known as the probability density.
Equation 11.11
XT/*XI/ = III/ P n n I n|
In a three dimensional space, the probability to find a particle over all space is unity as
shown in Equation 11.12
Equation 11.12
J T > ndx = l
Also, if two different states correspond to different energy levels, the eigenfunctions
must be orthogonal. This is defined by Equation 11.13
Equation 11.13
J4 '*Y mdx = 0 i f En * E m
Then, if the eigenfunctions of Equation II.9 can be found, other physical properties can
be predicted. These physical properties can also be associated with Hermitian operators.
Thus, the average value of a physical property A can be estimated when the system is in
state n following
34

Chapter II / Techniques
Equation 11.14
(A) = J%*AYndT
where A is now the operator for the quantity A. Incident electromagnetic radiation can
induce the transition between energy levels E; and Ef characterised by the wavefunctions
T'i and T'f with a certain transition probability. The transition probability is proportional
to the square of the magnitude of the transition moment, the later being defined by
Equation 11.15
|T|if = J'PfT'i'jdq
where T is the operator involved in the interaction phenomenon.
Apart from the few simplest cases such as a particle in a box, the rigid rotator and the
harmonic oscillator (which provide the basis for approximating the translational,
vibrational and rotational energies of molecules) the exact solutions of the Schrodinger
equation can not be determined theoretically. On the other hand, spectroscopy gives
access to these energy levels experimentally.
II.3.1 The Born-Oppenheimer approximation.
For a polyatomic molecule, the Hamiltonian H is equal to the sum of the kinetic energy
operator for the nuclei and electrons and the potential energy operators for the
Coulombic interactions electron-electron, electron-nuclear and nuclear-nuclear. The
Born-Oppenheimer approximation allows to write the total wavefunction 'F present in
the Schrodinger equation, as a product of the electronic and nuclear wavefunctions due
to the much slower nuclear motion than that of the electrons. Furthermore, the nuclear
wavefunction can be factorised into vibrational and rotational parts. Therefore, the total
wavefunction can be factorised as follows
Equation 11.16
Xij = % x % x %
and the total energy can be treated additively as follows
35

Chapter II / Techniques
Equation 11.17
E = E e + Ev + E r
This result is the reason for which electronic, vibrational and rotational spectroscopy
can be treated separately.
II.3.2 The Quantum Mechanical Harmonic Oscillator.
Let consider a diatomic molecule, the mass of the atoms being m, and m2, where the
between the atoms is Re. The displacement of the bond length R from its equilibrium
position Re is chosen to be denoted x=R-Re. Then, the Hamiltonian for this system is
defined by Equation 11.18 where h = h /2 n , h being the Planck constant, jj is the
reduced mass and k a force constant which measures the stiffness of the spring.
Equation 11.18
The eigenvalues of this Hamiltonian are the harmonic oscillator energy levels defined
by Equation 11.19 and represented in Figure 11.15.
Equation 11.19
where v is a quantum number (0, 1, 2,..., co) and vq is the frequency defined by Equation
11.20.
Equation 11.20
energy of the ground state is required by the uncertainty principle also known as the
Heinsenberg uncertainty principle defined by Equation 11.21
bond is believed to be equivalent to a Hooke’s law spring. At equilibrium, the distance
( 0 E v =^V + -jhD 0
We can notice that the lowest energy for the system is equal to “ hity. The nonzero
36
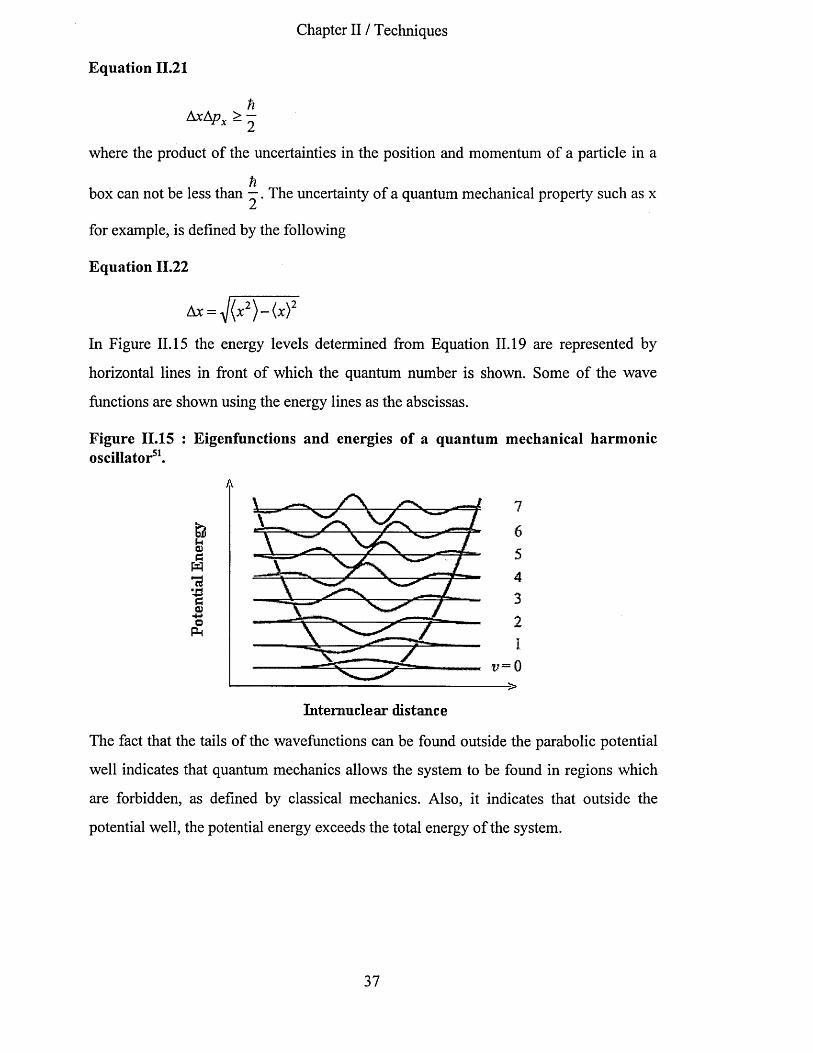
Chapter II / Techniques
Equation 11.21
hAx&px > -
where the product of the uncertainties in the position and momentum of a particle in a
nbox can not be less than —. The uncertainty of a quantum mechanical property such as x
for example, is defined by the following
Equation 11.22
Ax = yj(x2) - { x )2
In Figure 11.15 the energy levels determined from Equation 11.19 are represented by
horizontal lines in front of which the quantum number is shown. Some of the wave
functions are shown using the energy lines as the abscissas.
Figure 11.15 : Eigenfunctions and energies of a quantum mechanical harmonic oscillator51.
u<DaW13■■a
0 )
Interim clear distance
The fact that the tails of the wavefunctions can be found outside the parabolic potential
well indicates that quantum mechanics allows the system to be found in regions which
are forbidden, as defined by classical mechanics. Also, it indicates that outside the
potential well, the potential energy exceeds the total energy of the system.
37

Chapter II / Techniques
II.3.3 Absorption and emission of radiation.
Electromagnetic radiation is composed of oscillating electric and magnetic fields. These
fields can exert torques on the electric and magnetic multipoles of molecules, causing
energy to be absorbed by matter. On the other hand, the oscillation of the charge
distribution of a molecule creates emission of electromagnetic radiation.
II.3.3.1 Einstein coefficients.Three different processes can occur between two stationary states, namely states 1 and 2
with E2>Ej : induced absorption, induced emission and spontaneous emission. The first
two processes require the presence of a radiation field of frequency v, in such way that
AE=E2 -E1=hv. The last, introduced by a quantum mechanical treatment, occurs in the
absence of a radiation field. The rate of both absorption and emission are proportional to
the energy per unit volume per unit frequency interval as shown in Equation 11.23 :
Equation 11.23
du
The rate of an upward transition will be equal to
where B2 1 is the same Einstein coefficient than B12, A2 1 is the second Einstein coefficient
and N 2 is the population of state 2.
When the populations of both states have reached an equilibrium, N, and N 2 are related
through the Boltzmann distribution law :
Equation 11.24
w , 2 = ~ d f =N,Bi2p(u)
where B 1 2 is a first Einstein coefficient and N, is the population of state 1.
Similarly, the rate of an downward transition will be equal to
W2i — ^ — N 2 B2 Jp(u) + N 2 A 2 1
38

Chapter II / Techniques
where g,- is the number of states at the energy level i, also called degeneracy, k is the
Boltzmann constant and T is the temperature in Kelvin.
At equilibrium, and in the presence of a radiation of frequency v,
Equation 11.25
N,B 1 2 p(u) = N 2 B2 1 p(u) + N 2 A 2 1
Also, the energy density of the radiation is defined by
Equation 11.26
87thu3 1p(o) = c 3 e h u / k T _ j
Therefore, solving Equation 11.25 using Equation 11.24, we get
Equation 11.27
pM = A 21
O JlL ho/kT p, B 1 2 e - B 2i 8 2
Equation 11.26 and Equation 11.27 are in agreement if
Sib 1 2 = 8 2 B 2
and
A 2 i 87iho
B 2 1 c3
This last equation indicates that spontaneous emission increases rapidly relative to
induced emission as the frequency increases.
II.3.4 Vibrational infrared spectroscopy : selection rules.
As mentioned above, to be able to observe any infrared absorption by a material, the
incident radiation field of frequency v must satisfy the equation hv=AE, where AE
corresponds to the energy difference between lower (indexed by v) and upper (indexed
by v’) vibrational states characterised by the vibrational wavefunctions 'Ey and 'Ey..
Then, in order for a transition to occur, the transition probability Pvv* defined earlier in
Equation II.9 as the square of magnitude of the transition moment, must be different
39

Chapter II / Techniques
from zero. In the case of vibrational infrared spectroscopy, the operator involved in the
interaction phenomenon is ju , the electric dipole moment operator defined by :
where ^ and q are the charge and the position vector of the ith particle. Therefore, the
transition probability is defined in Equation 11.28 by :
Equation 11.28
If we come back to the case of the harmonic oscillator approximation treated in the
previous paragraph for a diatomic molecule, then Equation 11.28 can be rewritten as
must be different from zero. If the dipole moment is nil such as in the case of a
homonuclear molecule, then the transition moment is nil and all transitions are
forbidden. In the case of an heteronuclear diatomic molecule, the dipole moment is non
zero and varies with x. This variation can be expressed in a Taylor series expansion for
positions near to the equilibrium position such that
where pe is the equilibrium (i.e. static) dipole moment. Therefore, the transition moment
can be expressed by
Equation 11.29
where Rv.v is the transition moment vector.
The transition probability is related to the B2 1 Einstein coefficient through
where x , the displacement of the intemuclear distance from equilibrium, is equal to R-
Re. In order for this transition to occur, the transition moment RvV equal to | vF*'pvFvdx
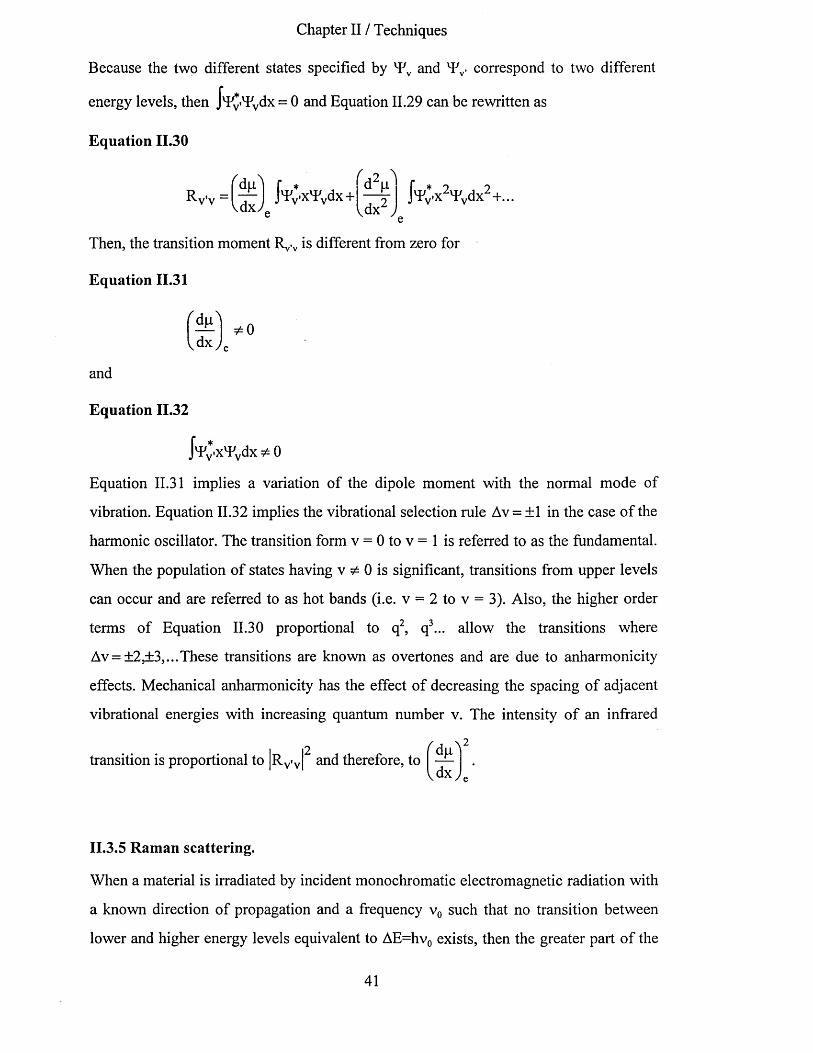
Chapter II / Techniques
Because the two different states specified by and TV correspond to two different
energy levels, then jr^T'ydx = 0 and Equation 11.29 can be rewritten as
Equation 11.30
R v 'v -dp RVdx1 •, ‘ v v
xvE,dx+V p A
vdx2 /R x 2 'Fvdx2+...
Then, the transition moment Ryv is different from zero for
Equation 11.31
^dp^vd x ,
and
Equation 11.32
R x ¥ vd x * 0
Equation 11.31 implies a variation of the dipole moment with the normal mode of
vibration. Equation 11.32 implies the vibrational selection rule Av = ±1 in the case of the
harmonic oscillator. The transition form v = 0 to v = 1 is referred to as the fundamental.
When the population of states having v ^ 0 is significant, transitions from upper levels
can occur and are referred to as hot bands (i.e. v = 2 to v = 3). Also, the higher order
terms of Equation 11.30 proportional to q2, q3... allow the transitions where
Av = ±2,±3,...These transitions are known as overtones and are due to anharmonicity
effects. Mechanical anharmonicity has the effect of decreasing the spacing of adjacent
vibrational energies with increasing quantum number v. The intensity of an infrared
transition is proportional to Rv'v and therefore, to^dpR 2
v d x /e
II.3.5 Raman scattering.
When a material is irradiated by incident monochromatic electromagnetic radiation with
a known direction of propagation and a frequency v0 such that no transition between
lower and higher energy levels equivalent to AE=hv0 exists, then the greater part of the
41

Chapter II / Techniques
radiation intensity passes through the sample with the same direction of propagation as
determined that the intensity of the scattered light is proportional to the frequency of the
incident radiation (v0) to the power four. The frequency of most of the scattered
radiation is identical to that of the incident monochromatic radiation. Nevertheless,
some of the scattered radiation possesses frequencies vs different from v0. The
frequencies vs are dependent on the frequency of the incident radiation v0. Therefore, the
intensity of a Raman spectrum is dependent on both the incident and scattered radiation
frequency. Nevertheless, the frequency shift between the incident and scattered radiation
A v = \vx - va | is characteristic of the molecular properties of the material studied. This
is why the intensity of the scattered light is usually plotted as a function of the
frequency shift between the incident and scattered radiation. The property of the sample
which determines the degree of Raman scattering is the polarisability. The polarisability
can be defined as a measure of the ability of an electron cloud surrounding nuclei in a
molecule to be deformed by an electric field. The polarisability a is an anisotropic
property of matter and as such is a tensor property. It can be represented by a matrix.
Therefore, when monochromatic radiation falls on a material, the oscillating electric
field of the radiation E induces in the material an electric dipole fiin£j which is related to
E by the polarisability tensor a as follows :
In the case of classical mechanics and considering the vibrational motion of a molecule
then
Equation 11.33
the incident radiation with no frequency change : it is called the transmitted radiation.
The radiation which is turned back in the opposite direction to the incident radiation
with the same frequency is known as the reflected radiation. Finally, a part of the
intensity of the incident radiation is scattered in all directions. Lord Rayleigh in 1871
and q, the normal co-ordinate of one of the vibration modes, is defined as
42
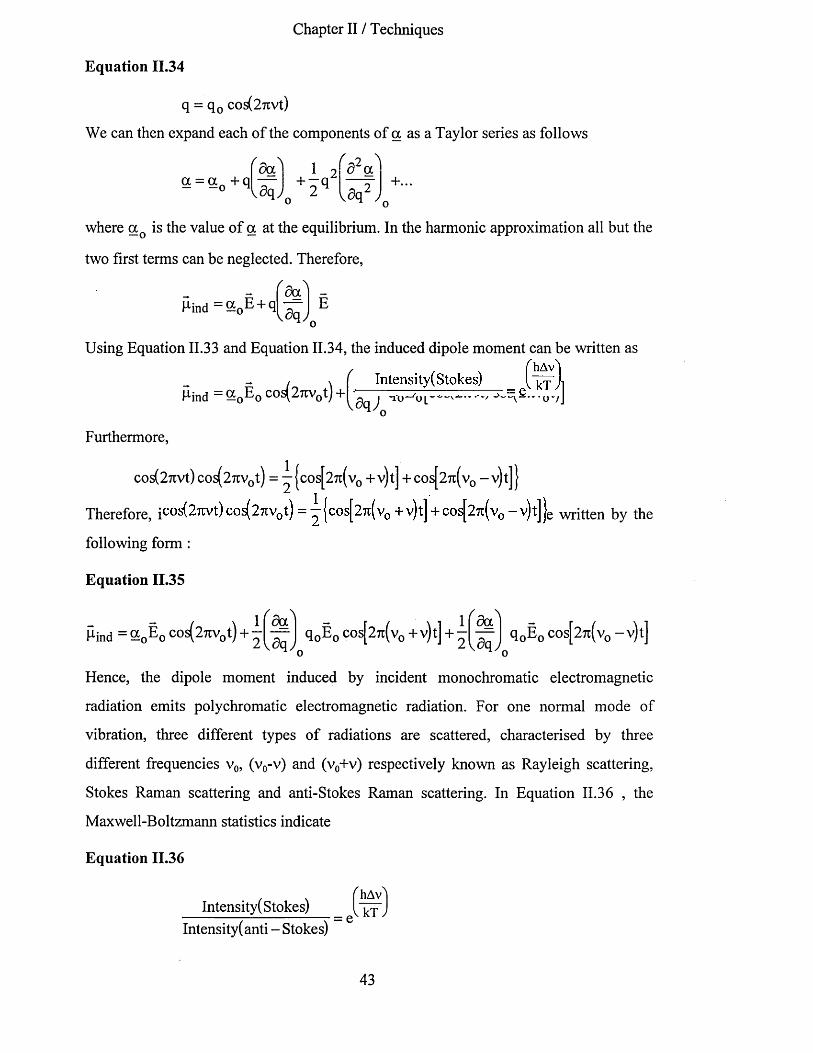
Chapter II / Techniques
Equation 11.34
q = q 0 cos(27rvt)
We can then expand each of the components of a as a Taylor series as follows
where a Q is the value of a at the equilibrium. In the harmonic approximation all but the
two first terms can be neglected. Therefore,
Using Equation 11.33 and Equation 11.34, the induced dipole moment can be written as
Therefore, in Equation 11.35 the induced dipole moment can finally be written by the
following form :
Equation 11.35
Hence, the dipole moment induced by incident monochromatic electromagnetic
radiation emits polychromatic electromagnetic radiation. For one normal mode of
vibration, three different types of radiations are scattered, characterised by three
different frequencies v0, (v0 -v) and (v0 +v) respectively known as Rayleigh scattering,
Stokes Raman scattering and anti-Stokes Raman scattering. In Equation 11.36 , the
Maxwell-Boltzmann statistics indicate
Equation 11.36
Furthermore,
cos(27ivt) cos(27iv0t) = —|cos[27t(v0 +v)t] + cos[27i(v0 - v ) t }
Intensity! Stokes) ( kT ) Intensity! anti - Stokes)
43

Chapter II / Techniques
that the intensity of the anti-Stokes Raman bands will be always less intense than their
Stokes counterparts.
As in the previous case of vibrational infrared spectroscopy, quantum mechanics is used
to determined the selection rules of the allowed transitions which may occur in Raman
spectroscopy. Once again, we have to define a transition probability which is equal to
the square of the magnitude of the transition moment. This time, the transition moment
will depend on the induced dipole moment operator as shown below
Equation 11.37
Ry'v = J'^v'Aind'^v^
Then, in considering the vibrational motion of a molecule with q, the normal co-ordinate
of one of the vibrational modes, the transition moment defined in Equation 11.37 can be
written as/ \ f O '\
RV'V ~da 1 -
kdq.-* f * d a - f * 9 oE JvFv'qvFvdq + — = E J% .q 2 vFvdq2+...
dq
Then, the transition moment R ^ is different from zero for
Equation 11.38
^da^
dtu „
and
Equation 11.39
1 %* q ^ d q * 0
Equation 11.38 implies a variation of the polarisability tensor with the normal mode of
vibration. Equation 11.39 implies the vibrational selection rule Av = ±1 in the case of the
harmonic oscillator. The intensity of a Raman transition is proportional to
(v0 -v ) 4 n v| r vJ 2.
44

Chapter II / Techniques
II.3.5.1 Low frequency Raman Longitudinal Acoustic Modes (L.A.M.).A series of low frequency bands can be observed in the Raman spectra of hydrocarbon
chain crystals and other polymers. The Raman frequency shift of these bands Av, was
found to vary inversely with the chain length. Mizushima and Shimanouchi52 have
shown using a semi-empirical approach that the Raman frequency shift of these bands
- - vmAv was similar to the wavenumber vm (vm = — where vm is the frequency and c the
0
light velocity) found using classical mechanics in the case of a string of spring-coupled
masses undertaking small longitudinal displacements and defined by :
Equation 11.40
m fE vm 2cLr \ p
where E is the Young’s elastic modulus, p is the density, m is the vibration order and Lr
the length of the chain at equilibrium. Therefore, the Raman frequency shift of the first
order of these L.A. modes corresponds to the wavenumber v\ of the first order of the
symmetric, accordion-like motion of the zigzag carbon backbone of hydrocarbon chain
crystals as shown in Figure II. 1653.
Figure 11.16 : Longitudinal Acoustic accordion mode of an extended normal hydrocarbon chain.
A V v W s V \
The length of the all-trans hydrocarbon chain Lr, can be determined from the Raman
frequency shift of the first order of the L.A. mode present in the low frequency Raman
spectra. This length can correspond also to the crystal lamellar thickness of the sample if
the chains are perpendicular to the crystal surfaces. Equation 11.40 is rewritten54 in
Equation 11.41 as follows :
Equation 11.41
3169
45
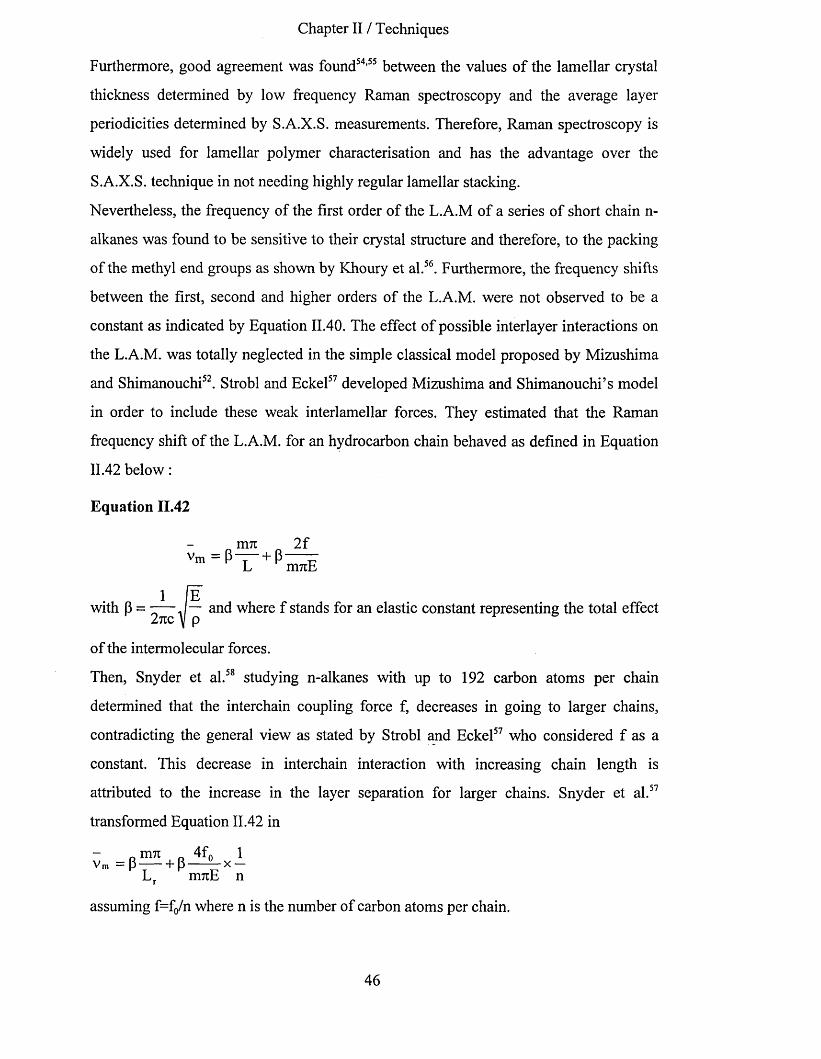
Chapter II / Techniques
Furthermore, good agreement was found54,55 between the values of the lamellar crystal
thickness determined by low frequency Raman spectroscopy and the average layer
periodicities determined by S.A.X.S. measurements. Therefore, Raman spectroscopy is
widely used for lamellar polymer characterisation and has the advantage over the
S.A.X.S. technique in not needing highly regular lamellar stacking.
Nevertheless, the frequency of the first order of the L.A.M of a series of short chain n-
alkanes was found to be sensitive to their crystal structure and therefore, to the packing
of the methyl end groups as shown by Khoury et al.56. Furthermore, the frequency shifts
between the first, second and higher orders of the L.A.M. were not observed to be a
constant as indicated by Equation 11.40. The effect of possible interlayer interactions on
the L.A.M. was totally neglected in the simple classical model proposed by Mizushima
and Shimanouchi52. Strobl and Eckel57 developed Mizushima and Shimanouchi’s model
in order to include these weak interlamellar forces. They estimated that the Raman
frequency shift of the L.A.M. for an hydrocarbon chain behaved as defined in Equation
11.42 below :
Equation 11.42
nur 2fVm = p T T + p ^
1 [ewith p = ^ J — and where f stands for an elastic constant representing the total effect
of the intermolecular forces.
Then, Snyder et al.58 studying n-alkanes with up to 192 carbon atoms per chain
determined that the interchain coupling force f, decreases in going to larger chains,
contradicting the general view as stated by Strobl and Eckel57 who considered f as a
constant. This decrease in interchain interaction with increasing chain length is
attributed to the increase in the layer separation for larger chains. Snyder et al.57
transformed Equation 11.42 in
a mn 4f0 1v m = P ----+ P— —x -Lr nrnE n
assuming f=f0/n where n is the number of carbon atoms per chain.
46
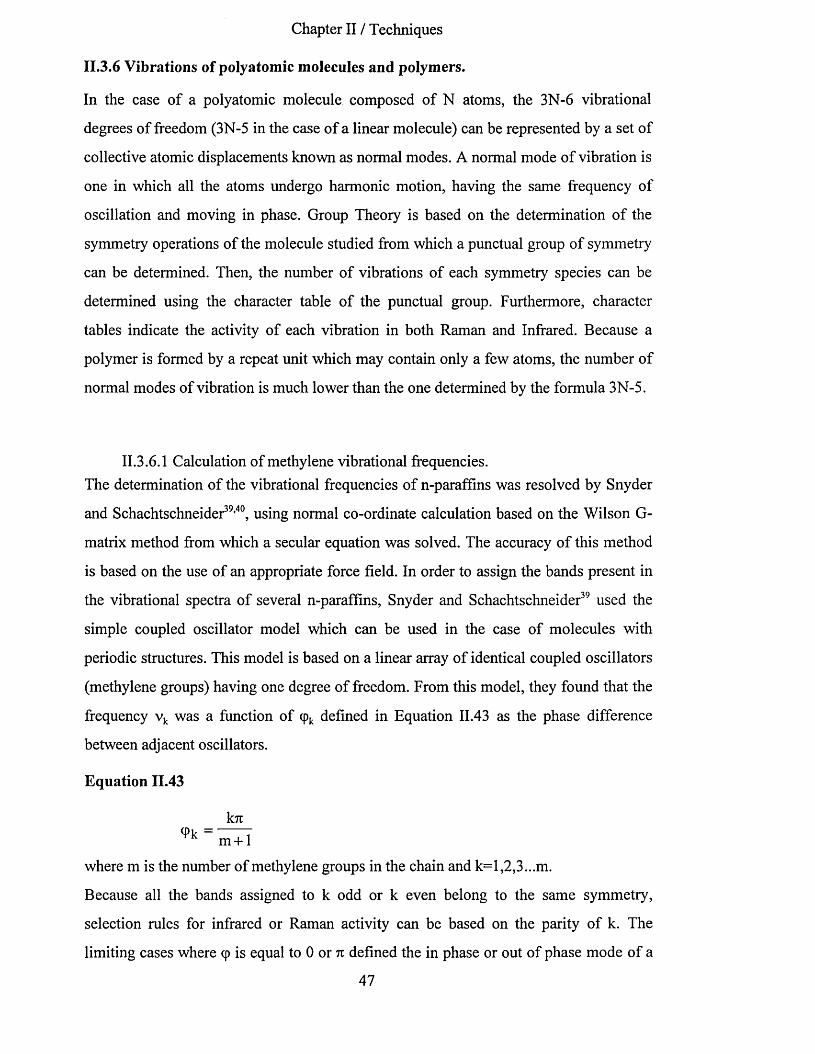
Chapter II / Techniques
II.3.6 Vibrations of polyatomic molecules and polymers.
In the case of a polyatomic molecule composed of N atoms, the 3N-6 vibrational
degrees of freedom (3N-5 in the case of a linear molecule) can be represented by a set of
collective atomic displacements known as normal modes. A normal mode of vibration is
one in which all the atoms undergo harmonic motion, having the same frequency of
oscillation and moving in phase. Group Theory is based on the determination of the
symmetry operations of the molecule studied from which a punctual group of symmetry
can be determined. Then, the number of vibrations of each symmetry species can be
determined using the character table of the punctual group. Furthermore, character
tables indicate the activity of each vibration in both Raman and Infrared. Because a
polymer is formed by a repeat unit which may contain only a few atoms, the number of
normal modes of vibration is much lower than the one determined by the formula 3N-5.
II.3.6.1 Calculation of methylene vibrational frequencies.The determination of the vibrational frequencies of n-paraffins was resolved by Snyder
and Schachtschneider39,40, using normal co-ordinate calculation based on the Wilson G-
matrix method from which a secular equation was solved. The accuracy of this method
is based on the use of an appropriate force field. In order to assign the bands present in
the vibrational spectra of several n-paraffins, Snyder and Schachtschneider39 used the
simple coupled oscillator model which can be used in the case of molecules with
periodic structures. This model is based on a linear array of identical coupled oscillators
(methylene groups) having one degree of freedom. From this model, they found that the
frequency vk was a function of (pk defined in Equation 11.43 as the phase difference
between adjacent oscillators.
Equation 11.43
k7i
where m is the number of methylene groups in the chain and k=l,2,3...m.
Because all the bands assigned to k odd or k even belong to the same symmetry,
selection rules for infrared or Raman activity can be based on the parity of k. The
limiting cases where cp is equal to 0 or n defined the in phase or out of phase mode of a
47
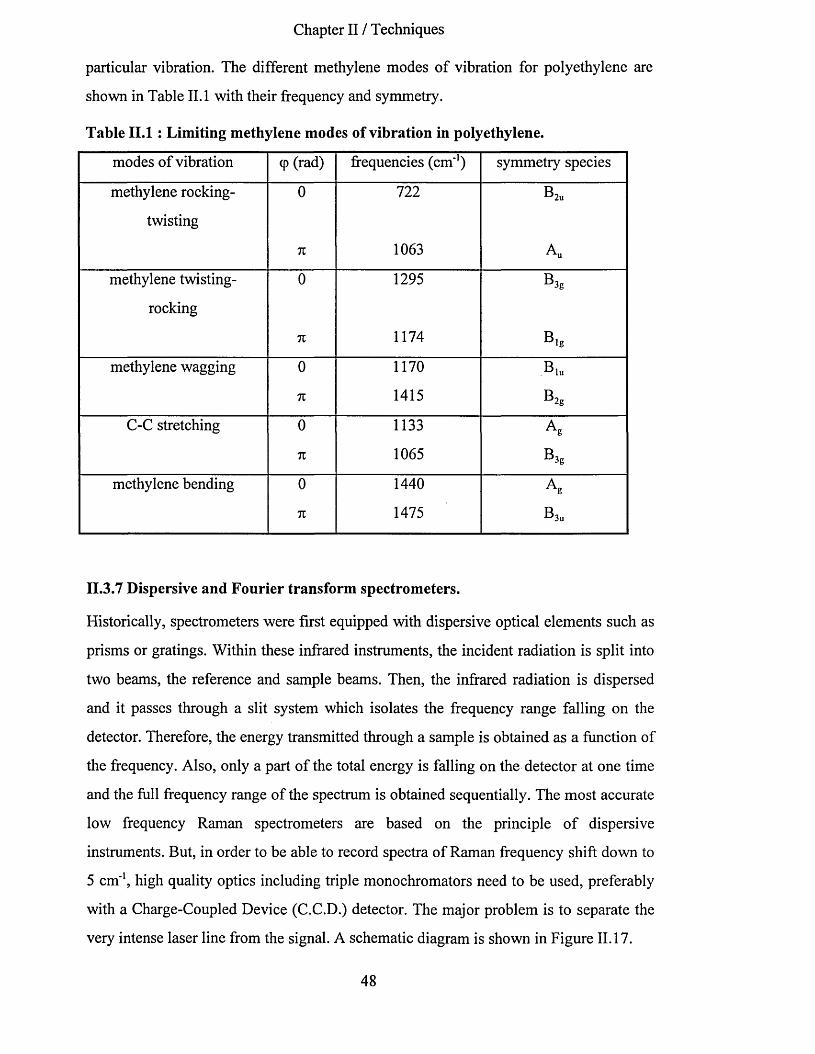
Chapter II / Techniques
particular vibration. The different methylene modes of vibration for polyethylene are
shown in Table II. 1 with their frequency and symmetry.
Table II. 1 : Limiting methylene modes of vibration in polyethylene.
modes o f vibration cp (rad) frequencies (cm'1) symmetry species
methylene rocking- 0 722 B2„
twisting
71 1063 Au
methylene twisting- 0 1295 B3g
rocking
n 1174 b ,6
methylene wagging 0 1170 Biu
71 1415 b 26
C-C stretching 0 1133 Ae
71 1065 b 38
methylene bending 0 1440 Ag
71 1475 B3u
II.3.7 Dispersive and Fourier transform spectrometers.
Historically, spectrometers were first equipped with dispersive optical elements such as
prisms or gratings. Within these infrared instruments, the incident radiation is split into
two beams, the reference and sample beams. Then, the infrared radiation is dispersed
and it passes through a slit system which isolates the frequency range falling on the
detector. Therefore, the energy transmitted through a sample is obtained as a function of
the frequency. Also, only a part of the total energy is falling on the detector at one time
and the full frequency range of the spectrum is obtained sequentially. The most accurate
low frequency Raman spectrometers are based on the principle of dispersive
instruments. But, in order to be able to record spectra of Raman frequency shift down to
5 cm'1, high quality optics including triple monochromators need to be used, preferably
with a Charge-Coupled Device (C.C.D.) detector. The major problem is to separate the
very intense laser line from the signal. A schematic diagram is shown in Figure 11.17.
48

Chapter II / Techniques
Figure 11.17 : Schematic diagram of a dispersive Raman spectrometer.
LASERSample
Triplemonochromator
C C D detector
Fourier Transform Infra-Red (F.T.I.R.) spectrometers allow a continuous detection of all
the transmitted energy simultaneously. They are based on the Michelson interferometer
and became widely used with the discovery of the fast Fourier transform59 algorithm and
the development of powerful microcomputers. Within a Michelson interferometer, the
incident infrared beam is first split into two beams. One of these infrared beams reaches
a movable mirror. This provide a variable optical path between the two infrared beams.
Then, these two beams are recombined so that the energy falling on the detector is
obtained as a function of the optical path difference. A Michelson interferometer is
schematically represented in Figure 11.18.
49
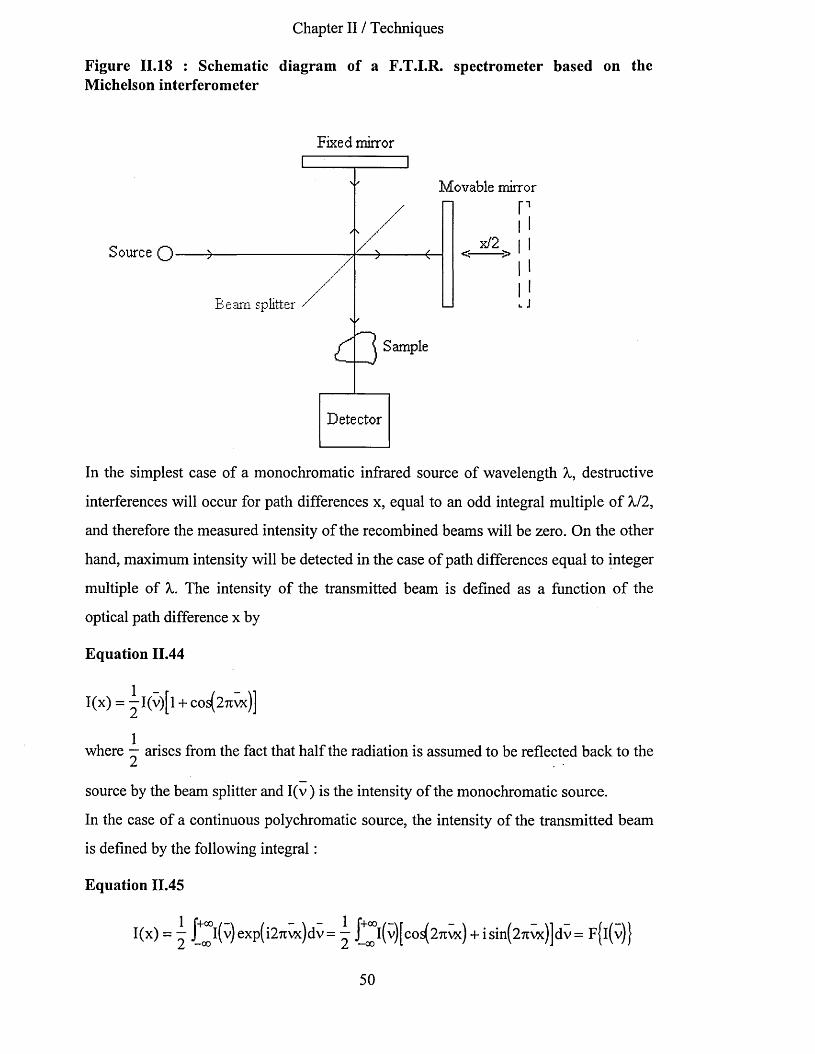
Chapter II / Techniques
Figure 11.18 : Schematic diagram of a F.T.I.R. spectrometer based on the Michelson interferometer
Fixed mirror
M ovable mirror
x/2Source Q
B e a m sp litte r
Sample
D etector
In the simplest case of a monochromatic infrared source of wavelength X, destructive
interferences will occur for path differences x, equal to an odd integral multiple of X/2,
and therefore the measured intensity of the recombined beams will be zero. On the other
hand, maximum intensity will be detected in the case of path differences equal to integer
multiple of X. The intensity of the transmitted beam is defined as a function of the
optical path difference x by
Equation 11.44
100 = 2 1(v)[l + cos(2™)]
where — arises from the fact that half the radiation is assumed to be reflected back to the
source by the beam splitter and I(v ) is the intensity of the monochromatic source.
In the case of a continuous polychromatic source, the intensity of the transmitted beam
is defined by the following integral:
Equation 11.45
Kx) = 2 J ool(v)exp(i27ivx)dv= — J Qol(v)[cos(27r\x) + isin(27tvx)]dv= F|l(v)|
50

Chapter II / Techniques
where F{ } stands for “Fourier transform o f’.
The real part of Equation 11.45 is referred as the interferogram. Additional factors such
as detector response or beam splitter efficiency affect the amplitude of the
interferogram. For this reason, the interferogram is defined as
I(x) = £ B(v)coJ(27rvx)dv
where B(v) , the spectral density amplitude, takes into account the characteristics of the
instrument. Also, the spectral density amplitude (i.e. the infrared spectrum) is
determined by the inverse Fourier transform of the interferogram and, neglecting the
imaginary p art:
B(v)= J+oQI(x)cos(27ivx)dx
Practically, the resolution of this last equation requires the digitalisation of the collected
interferograms. The sampling interval is controlled using a second interferogram of a
monochromatic source (He-Ne laser, X=632.8nm). A third interferogram produced by a
white light source allows the determination of the first collection point of the main
interferogram. The sampling interval Ax, defines the highest wavenumber which may be
studied following
1Vmax ~ 2Ax
In the case of He-Ne laser with a sampling every 632.8 nm, vmax=7960 cm"1. This
maximum frequency is well above the frequency range used in our experiments. In
order to calculate the Fourier transform, the interferogram must be integrated for minus
to plus infinity. Because the data are collected only over the optical retardation of the
mirror, the interferogram is truncated abruptly. Therefore, the interferogram is
multiplied by an apodization function (triangular, Bessels or sine functions) which
reduces gradually to zero the wings of the interferogram.
In order to identify the position and area of infrared bands which may be overlapped in a
spectrum, curve fitting and peak-narrowing methods can be used. Infrared and Raman
peaks are known to be closely similar to Lorentzian line shape such as :
51

Chapter II / Techniques
where v0 is the wavenumber at the line centre, w is the width at half height and I0 the
peak maximum. If a region of an infrared or Raman spectrum corresponds to the
overlapping of a known number of Lorentzian bands, then computer programs can be
or combinations of Lorentzian and Gaussian lineshapes.
The number of peaks present in a spectrum can be estimated using the derivative
technique and by deconvolution methods. An estimate can be made from the second
derivative of the spectrum. The peaks present in the derivative spectrum are narrower
than in the original one and therefore overlapping bands may be separated. The second
method called deconvolution is a technique to narrow the peaks by determining their
real lineshape. Fourier self-deconvolution is used to remove a contributing lineshape
from a band profile which produces an apparent improvement of the resolution. It can
be written mathematically as E(v)=E’(v)*E0(v)
where E(v) is the observed spectrum, E0(v) is the lineshape to be removed and E’(v) is
the improved spectrum. By taking the inverse Fourier transform of E(v), we get
noise in the desired spectrum E’(v), an apodization function, D(x) has to be used and
Equation 11.46 is rewritten as
used to fit the spectrum in order to find the values of the centre, width at half heights
and heights of these bands. Also, other lineshape bands can be used in a curve-fitting
procedure such as the Gaussian form defined by :
I(x)=I’(x)*I„(x)
where I stands for interferogram. Therefore,
Equation 11.46
where I’(x) is the inverse Fourier transform of E’(v). Due to an amplification of the
52

Chapter II / Techniques
, v l(x)D(x) l(x)D(x)I0(x) _ F"1 {E0(v)}
and E’(v)=F{I’(x)}.
Finally, several advantages make the choice of an F.T.I.R. spectrometer preferable over
the use of a dispersive instrument. The first advantage is known as Fellgetf s advantage.
All the spectral elements defined in Equation 11.47 are measured simultaneously.
Equation 11.47
A v r
where N is the number of spectral elements, vh and v l are respectively the highest and
lowest wavenumbers of the spectrum and A v r is the resolution.
The second advantage is known as the Jacquinot advantage and is related to the fact that
the full energy throughput reaches the detector without attenuation due to slits or
dispersive optical elements.
A third advantage of F.T.I.R. spectrometers over dispersive instruments is the Conne’s
advantage. It is related to the high accuracy of frequency measurement of the F.T.I.R.
spectrometers due to the use of a laser frequency as internal standard.
Finally, within F.T.I.R. spectrometers the spectral resolution is constant as a function of
the frequency.
53
Chapter III / Short chain n-alkane crystals : n- c 44h 90
III SHORT CHAIN N-ALKANE CRYSTALS : N-C44H90
III.l Introduction.
Hydrocarbon chains are a basic component in a number of systems as diverse as
polymers, biological membranes, fuels or lipids. The conformation of the hydrocarbon
chain components is believed to play a leading part in most of the physical behaviour
characterising these systems. A better understanding of the physical properties of n-
alkane chains should provide a better understanding of these more complex systems.
Furthermore, the shorter members of the n-alkane family which do not have the
additional complication of chain folds should be the best starting point of such a study.
Short chain n-alkanes crystallise in thin lozenge shapes. Their most stable chain
conformation is the all-trans conformation. The ends of the chains (methyl groups) are
at the crystal surfaces. The chain axes are parallel to each other inside the same crystal
layer. Their crystal structure depends on the number and on the odd or even number of
carbon atoms per chain as well as the temperature. At low temperature, the subcell of
the stable crystal structure for n-alkane chains with an odd number of carbon atoms is
orthorhombic. In the case of n-alkane chains with an even number of carbon atoms
lower than 26, the crystal subcell is triclinic. Above 26 carbon atoms, the crystal subcell
is monoclinic60.
The number of pre-melting phase transitions undergone by n-alkane crystals has been
found to depend on this odd-even effect and on the chain length. Different kinds of
rotational isomers identifiable by infrared spectroscopy can be used to follow these
solid-solid phase transitions.
In this chapter, we report changes occurring in the infrared spectra of n-C44H90 crystals
as functions of the temperature, pressure and crystallisation parameters. The crystal
structures and the layer spacing have been determined by the means of Wide Angle X-
ray Scattering and Small Angle X-ray Scattering measurements.
54

Chapter III / Short chain n-alkane crystals : n-C44H90
III.2 Background.
III.2.1 Methyl deformation modes in the infrared spectra of n-paraffins : H-C-H bending (symmetric U, asymmetric a), C-H stretching (symmetric r +, asymmetric r') and rocking (P) modes.With the aim of interpreting the infrared spectrum of polyethylene, Krimm et al.61 used
group theory in analysing the infrared spectra of several crystalline n-alkanes in
different states. Also, they gave a review of the divergent assignments of the methylene
wagging modes and, particularly, of the 1375 cm’1 band. They ascribed the 1375 cm'1
band present in the spectra of crystalline n-paraffins to the symmetric methyl bending
mode. Nevertheless, an additional band at 1369 cm'1 (polarised in the a direction), more
intense than the band at 1375 cm*1 (polarised in the b direction), is observed in the
spectrum of a single crystal of n-C36H74 in monoclinic form. Moreover, no band was
detected at 1375 cm*1 in the spectra of a series of even n-alkanes (n-C18H38, n-C28H58 and
n-C30H62) but a single band was observed at 1369 cm'1. In these spectra, they ascribed
the band at 1369 cm'1 to a methylene wagging mode and try to correlate changes in the
intensity of the 1375 cm'1 band with changes in crystal structure. They also reported the
decrease of the intensity of the symmetric methyl bending mode on melting in the case
of polyethylene62. Finally, they reported the seven fundamental modes of vibration
assigned to the methyl groups : the symmetric and asymmetric C-H stretching modes
were found at respectively 2872 cm'1 and 2962 cm'1, the symmetric and asymmetric
bending modes were found at respectively 1375 cm'1 and 1460 cm*1, the out of plane
rocking mode at 890 cm'1 and the in plane wagging mode at 1128 cm'1. The methyl
twisting mode was expected to be too weak to observed if not infrared inactive.
Novak and Solovev63 reported the temperature dependence of the 1352 cm'1 and 1341
cm*1 infrared band intensities as related to the presence of rotational isomers in short
chain n-alkanes. They determined differences in the energies of rotational isomers.
Importantly, they pointed out the possible displacement of the methyl deformation band
to the higher frequencies, from 1370 cm'1 to 1378 cm'1, when going from crystalline to
liquid short chain n-alkanes. They suggested that this may be explained by a change in
the methyl environment.
Oetjen et al.64 have determined the infrared spectra of n-octane in liquid and gas phases.
From their work, the methyl deformation band may be assigned respectively at 1381
55
Chapter III / Short chain n-alkane crystals : n-C44H90
cm'1 and 1385 cm'1. Hence, a progression appears with frequency increasing from solid
to liquid and finally to gas phase.
Nielsen and Holland65 ascribed, by means of a polarised infrared beam and a reflecting
microscope, the symmetrical methyl deformation band at 1368 cm'1 and 1370 cm'1 (as
well as the bands already known at 1378 cm'1 and 1374 cm'1) respectively in the spectra
of the crystalline n-C36H74 and n-C46H94 in monoclinic structures at room temperature.
The two lowest frequency bands were found to be polarised perpendicular to the chain
axis even though the two highest ones were found to be polarised partly perpendicular
and partly parallel to the chain axis. They differentiated the infrared band at 1369 cm'1
in liquid short chain n-alkanes ascribed to a methylene wagging mode from the one in
solid short chain n-alkanes ascribed to the symmetrical methyl deformation.
At the same time, Snyder66 reported a list of absorption band frequencies for crystalline
n-alkanes from the infrared spectra recorded at -180°C (from n-C20H42 to n-C30H62)
mixed in potassium bromide pressed disks.
In the case of the n-alkanes with an even number of carbon atoms per chain, Snyder
assigned the band between 1365 cm'1 and 1368 cm'1 to the symmetric methyl bending
mode. Two additional bands near 1373 cm*1 and 1385 cm'1 are present in all their
spectra. In the spectra of the triclinic crystal structure, the out of plane methyl rocking
mode is assigned to a single band near 893 cm'1. In the monoclinic crystal structure, this
mode is ascribed to a doublet at 889 cm'1 and 893 cm'1.
In the case of the n-alkanes with an odd number of carbon atoms per chain and,
therefore, in an orthorhombic crystal structure, the author ascribed the band found
between 1373 cm'1 and 1376 cm'1 to the symmetric methyl bending mode. Two
additional bands near 1367 cm'1 and 1385 cm'1 are present in all their spectra. A doublet
at 891 cm'1 and 894 cm'1 is ascribed to the out of plane methyl rocking mode. In all the
n-alkane spectra, from n-C20H42 to n-C30H62 , the asymmetric methyl bending mode is
assigned at 1465 cm'1.
In the second part of this paper published in 1961, Snyder67 studied the splitting of
infrared bands caused by intermolecular interactions in the orthorhombic, monoclinic
and triclinic n-alkane crystal structures.
56
Chapter III / Short chain n-alkane crystals : n-C44H90
In a following paper Snyder and Schachtschneider39 extended their work by an infrared
study of shorter chain n-alkanes, from n-C3H8 to n-C19H40 (n-alkane vapour deposited on
a cooled CsBr window and warmed up). For n-alkanes with a chain length down to 11
carbon atoms, the assignment of the out of plane methyl rocking mode is identical to the
one of the earlier paper67. On the other hand, the authors reported their difficulty in
assigning a “ characteristic frequency” for the methyl symmetric mode usually ascribed
at 1375 cm*1. They proposed a frequency range between 1360 cm*1 and 1380 cm'1 where
the methyl symmetric bending mode and the methylene wagging mode are coupled.
Furthermore, they no longer assign the asymmetric methyl bending mode to a single
band at 1465 cm*1, but proposed a spectral range between 1440 cm*1 and 1468 cm*1
where this mode is coupled with the methylene bending mode.
Using a polarised infrared beam and a reflecting microscope, Holland and Nielsen68
revealed or confirmed the assignment of different infrared bands present in the spectra
of even n-alkanes in different crystal structures. For any even or odd n-alkane crystals in
an orthorhombic structure, they assigned the single band at 1378 cm'1 to the symmetric
methyl deformation mode. Furthermore, in the case of n-C24H50 in the orthorhombic
crystal structure, they assigned the band at 887 cm*1 to the in-plane methyl rocking
mode.
In the spectra of n-C36H74 in a monoclinic crystal structure, they ascribed the bands at
1368 and 1378 cm*1 to the in- and out-of-phase symmetrical deformation mode of
adjacent methyl groups. A band at 890 cm*1 was ascribed to the in-plane rocking methyl
mode. Two bands at 1447 cm'1 and 1457 cm*1 were ascribed with uncertainty to the
asymmetric methyl deformation mode. Because the infrared spectra had been recorded
at room temperature, the splitting of the methyl rocking mode was too small to be
observed.
Finally, in the spectra of n-C18H38 in a triclinic crystal structure, a single band at 1368
cm'1 was assigned to the symmetrical methyl deformation. A band at 890 cm*1 was
ascribed to the in-plane rocking methyl mode. Two bands at 1453 cm*1 and 1466 cm*1
were ascribed respectively to the out-of-plane and in-plane asymmetric methyl
deformation mode.
57

Chapter III / Short chain n-alkane crystals : n-C44H90
Kobayashi et al.69 identified a different orthorhombic form in n-C36H74 crystals, which
they called orthorhombic II. This form was differentiated from the usual orthorhombic
form (called orthorhombic I) and the monoclinic form by means of vibrational
spectroscopy and X-ray diffraction. Indeed, they reported differences in the band
frequencies characteristic of the methyl group vibration modes in the infrared spectra
and of the longitudinal acoustic (L.A.) mode in the low frequency Raman spectra. These
differences characterise the non equivalence of the interlayer stacking in all these
structures.
In a monoclinic crystal structure, two bands at 1374 cm'1 and 1372 cm'1 were ascribed to
the methyl symmetric bending modes respectively polarised in the a and b directions. In
an orthorhombic II crystal structure, two bands at 1382 cm'1 and 1370 cm'1 were
ascribed to the methyl deformation modes respectively polarised in the a and b
directions. In the orthorhombic I form , a single band at 1376 cm'1 was ascribed to the
overlapped a and b polarised bands.
The methyl C-H stretching region of infrared spectra of crystalline n-alkanes has been
studied by MacPhail et al.70,71 in the early eighties. They reported splittings and
frequency changes in the infrared spectra due to temperature effects, methyl
environments or phase transitions. They ascribed the in-plane and out-of-plane
asymmetric stretching modes to respectively the 2962 cm"1 and 2952 cm'1 bands and the
methyl symmetric stretching mode to 2870 cm'1.
III.2.2 Carbon-carbon stretching modes and methylene deformation modes (rocking-twisting, twisting-rocking, wagging, bending and C-H stretching modes) in the infrared spectra of n-paraffins.In crystalline n-paraffins, the frequencies at which the C-C stretching and the methylene
rocking, twisting, wagging and bending modes occur are confined to quite well defined
regions of the infrared spectra : respectively between 950 cm'1 and 1150 cm'1, 720 cm'1
and 1050 cm'1, 1170 cm'1 and 1300 cm'1, 1175 cm'1 and 1415 cm'1 and finally around
1470 cm'1. Most of these modes are non-localised and give rise to band progressions.
Each mode of these progressions is characterised by a relative phase difference between
the motion of adjacent methylene groups composing the n-alkane molecule. This phase
difference is proportional to an integer, k. In the case of the methylene rocking mode for
58
Chapter III / Short chain n-alkane crystals : n-C44H90
example, and considering an n-alkane chain in an all-trans conformation, the infrared
active vibrations are ascribed to any members of this mode characterised by an odd
integer k. The strongest infrared band of the methylene rocking mode is the one near
725 cm'1 characterised by k=l, and where the adjacent methylene groups vibrate all
approximately in phase. The frequencies of these progression bands are also related to
the number of methylene groups composing the n-alkane molecules. Therefore, the
length of the chains in the all-trans conformation within an n-alkane crystal can be
estimated knowing the frequency of each progression band and the integer, k,
characteristic of each one of these bands. Of particular interest over the years has been
the study of the splitting of the 725 cm'1 band and other members of the progression
which have been found to be sensitive to intermolecular effects and crystal
structures66,72. Thus, among a series of n-alkanes from n-C3H8 to n-C30H62, Snyder72
studied with more attention the behaviour of the splitting of these band progressions in
the case of samples in monoclinic, orthorhombic and triclinic crystal structures. Apart
from the triclinic form, splitting was observed. Also, in a series from n-C20H42 to n-
C30H62 in orthorhombic form, a decrease of the splitting of these bands occurs from the
doublet k=l toward higher frequencies, up to a limit after which this splitting finally
increases towards higher frequencies. Differences in the splitting behaviour of these
rocking modes have also been noticed in n-alkanes in orthorhombic and monoclinic
forms39. Thus, the study of these band progressions could be useful in identifying the
structure of crystalline n-paraffins. Moreover, the study of the methylene mode region
can be helpful for the detection of gauche conformers within the n-alkane chains.
Indeed, the presence of the even members of the band progressions in the infrared
spectra of n-alkanes has been associated with gauche conformers, more probably
concentrated at the end of the chains.
The behaviour of the splitting of the band progressions related to the methylene twisting
modes present between 1170 cm'1 and 1300 cm'1 has been analysed too40. But, due to the
weaker intensity of these bands, their study is more difficult.
The methylene bending modes have been ascribed to two components at around 1475
cm'1 and 1462 cm'1 for n-C23H48 and n-C29H60 in the orthorhombic form and n-C28H58 in
the monoclinic form40. Instead of these, a single band at 1474 cm'1 was observed in the
59
Chapter III / Short chain n-alkane crystals : n-C44H90
infrared spectrum of n-C24 H50 in triclinic form67. These values are in good agreement
with the ones found by Holland and Nielsen68.
Snyder37 wrote in 1967 a fundamental publication on which most of the conformational
studies using infrared spectroscopy on hydrocarbon chain compounds are based. He
reported a full interpretation of most of the infrared bands present in the spectra of n-
paraffins between 700 cm'1 to 1500 cm'1. This interpretation is based on the
identification of localised modes of vibration in the shortest chains of the n-alkane
family in the liquid state linked with some specific conformations of these chains. The
presence of these localised modes of vibration in the spectra of the longest chains of n-
alkanes allows one to determine the conformation of some segments of these chains. In
particular, Snyder ascribed in the limited wagging mode region between 1400 cm'1 and
1300 cm'1 the bands at 1368 cm'1 and 1308 cm'1 to sequences involving gtg and gtg’
conformations, a band at 1352 cm'1 to a sequence involving gg conformations and a
band at 1344 cm'1 to end gauche conformations. These will be used intensively in future
chapters of this thesis.
Also, in the rocking-twisting mode region of the infrared spectra, bands at around 878
cm'1 and 960 cm'1 were assigned to vibrations involving -CH2-CH3 groups in a -t-g
conformation. Additional bands at around 1078 cm'1 and 1164 cm'1 were ascribed to end
gauche conformers38.
Finally, in a study on crystalline n-paraffins from n-C16H34 to n-C22H26 in the all trans
chain conformation Snyder et al.71 ascribed the anti-symmetric, symmetric fundamental
and symmetric Fermi resonance methylene C-H stretching modes for the planar carbon
skeleton to the bands at 2915 cm'1, 2846 cm'1 and 2890 cm'1 respectively. The
symmetric C-H stretching mode involving the terminal methylene group has been
ascribed to a band at 2859 cm'1. The anti-symmetric and symmetric Fermi resonance
methylene C-H stretching modes have been found to be sensitive to crystal structure.
Indeed, these two bands have shifted towards higher frequencies, respectively by 1 cm*1
and 4 cm'1, from the spectrum of n-C20H42 in triclinic form to the spectrum of n-C21H44 in
orthorhombic form. Unfortunately, the saturation of the intensity of these infrared bands
in the spectra shown in this work did not allow us to study with confidence this
methylene stretching region.
60

Chapter III / Short chain n-alkane crystals : n-C44H90
111.2.3 Structural studies.
Ranby et al.73 used electron microscopy and small angle X-ray scattering to study n-
C44H90, n-C82H166 and polyethylene crystallised from solution in different solvents and at
different crystallisation temperatures. They reported the long spacing of n-C44H90
crystallised from C2C14 and n-butyl acetate respectively at 18°C and 35°C to be equal to
58.3 A. The calculated chain length for n-C44H90 was 58.13 A. The crystal structure was
considered to be the Pca2, orthorhombic form.
Later, Nyburg and Potworowski74 reported the four “key” crystal structures based on the
triclinic n-C18H38, monoclinic n-C36H74, orthorhombic n-C36H74 and orthorhombic n-
C23H48 which can be used as structural patterns to predict the crystal structure of any n-
alkanes.
Boistelle et al.75 reported a new orthorhombic crystal structure, space group Pbca with
Z=4, being a polytypic modification of the monoclinic structure of n-C28H58 and n-
C36H74 crystallised at room temperature from light petroleum solutions. This new
orthorhombic structure was reported to be a stacking of monoclinic layers, each
following one being the image of the other through a rotation about a twofold axis
perpendicular to the (001) plane. In each layer, n-alkane chains are inclined from the
normal to (001) plane with an angle of nearly 30°. In the monoclinic and new
orthorhombic crystal structures, the stacking of the terminal CH2 and CH3 groups were
reported to be closely similar.
Craig et al.76 have used high resolution synchrotron X-ray powder diffraction on the
series C13H28-C60H122. Of particular interest here, they reported the unit-cell parameters
for n-C44H90 in the orthorhombic Pbca structure, which involves two layers in
monoclinic P2,/a form related by a twofold rotation about their c-axis. This structure is
differentiable from the orthorhombic Pca2, form by its shorter c-axis length due to the
tilting of the chains.
Ishikawa et al.77 studied the structure of n-C19H40, n-C24H50, n-C32H66 and n-C44H90
crystals by means of variable temperature solid-state high resolution I3C NMR
spectroscopy. They reported the 13C chemical shift values of the internal CH2 groups and
terminal CH2 and CH3 groups for these n-alkanes as functions of the temperature and
61
Chapter III / Short chain n-alkane crystals : n-C44H9o
crystal structures. In particular, they found a gradual decrease towards the chain ends of
the ,3C chemical shift differences between the internal CH2, terminal CH2 and CH3
group peaks of the orthorhombic and triclinic n-alkane forms. In the case of n-C44H90, a
transition to an “intermediate” phase was found at 70°C, the sample being originally in
an orthorhombic crystal structure. This transition was characterised by a shift upfield of
the terminal CH2 and CH3 group peaks. By contrast, the 13C chemical shift of the
internal CH2 group is unchanged.
III.3 Experimental section.
111.3.1 X-ray Scattering.
Small and wide angle x-ray scattering (S.A.X.S. and W.A.X.S.) patterns from powder
samples were recorded with an image plate area detector (MarResearch) using graphite-
monochromatised CuKa radiation. Dr Goran Ungar and Mr Xiangbing Zeng did the
measurements at Sheffield University. Samples in capillaries were held in a custom-
built temperature cell controlled to within 0.1 °C. The beampath up to the beamstop was
flushed with N2.
111.3.2 Differential Scanning Calorimetry.
We used a Mettler Differential Scanning Calorimeter 30 equipped with a low
temperature cell and coupled to a Mettler-Toledo TA8000 thermal analysis system. We
used 40 pi aluminium crucibles (ME-27331) to carry out the experiments. The heating
rate used during the experiment was 2°C per minute.
111.3.3 F.T.I.R.
Transmission infrared spectra were recorded between 700 cm'1 and 4000 cm'1 with 1
cm'1 resolution and typically 200 scans using a Mattson instrument 6020 F.T.I.R.
spectrometer based on a Michelson interferometer equipped with a cooled pyroelectric
detector doped with mercury cadmium telluride. One of the advantages of Fourier
Transform spectrometers over dispersive instruments is the accuracy of the control of
62

Chapter III / Short chain n-alkane crystals : n-C44H90
the wavelength. Thus, confident subtractions between spectra can be performed using
Fourier Transform spectrometers.
Samples held between two potassium bromide plates were installed in a Graseby/Specac
cryostat P/N21500 equipped with a heating cell, a temperature controller P/N20120 and
a vacuum pump to evacuate the cryostat allowing us to work in a temperature range
between -173°C and 90°C at +/_ 1°C. We had to calibrate the Graseby/Specac temperature
controller P/N20120 of the heating cell. This calibration was done in the real
experimental conditions. The cell was cooled down to -173°C and heated successively
from this temperature to four higher ones at 120°C, 126°C, 135°C and 144°C. To verify
the accuracy of the temperature controller P/N20120, a thermocouple was placed
between the KBr plates, at the sample position, with a thermally conducting gel to
improve the contact with the thermocouple. We used a nickel-chromium and nickel-
aluminium thermocouple. This thermocouple was plugged into a temperature controller
Fluka 51. We were able to determine from the temperature calibration that ninety
minutes were needed in such a process to reach an equilibrium temperature. The graphs
below show the temperature at the sample position determined by the temperature
controller Fluka 51 as a function of time for the different temperatures given by the
temperature controller P/N20120.
63
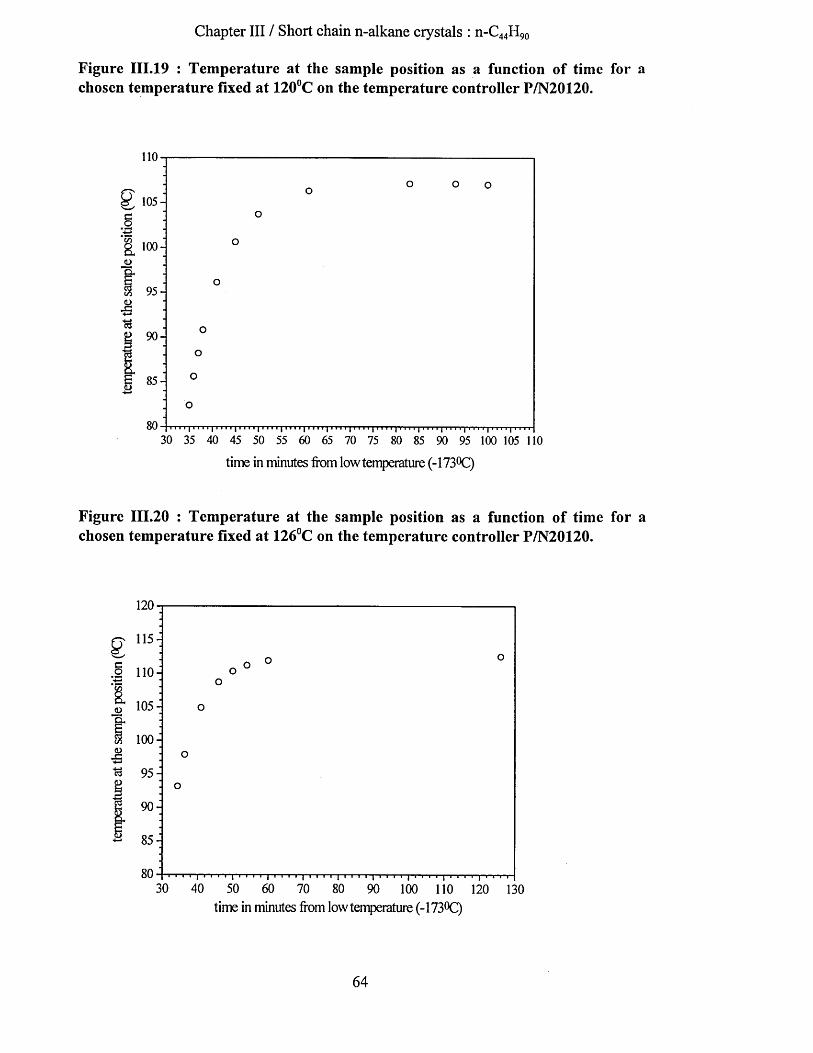
Chapter III / Short chain n-alkane crystals : n-C44H90
Figure 111.19 : Temperature at the sample position as a function of time for a chosen temperature fixed at 120°C on the temperature controller P/N20120.
80 I i i i i | i i i i | ■ ■ ■ ■ | ■ ■ ■ ■ | ■ ■ ■ ■ | i i ■ i | i i 1 1 [ i . i i | ■ ■ ■ ■ [ i i i i | ■ i ■ | ■ ■ ■ ■ [ ■ i i ■ [ r . l r | ■ ■ ■ ■ [ i
30 35 40 45 50 55 60 65 70 75 80 85 90 95 100 105 110
time in minutes from low temperature (-173°Q
Figure 111.20 : Temperature at the sample position as a function of time for a chosen temperature fixed at 126°C on the temperature controller P/N20120.
120-
£ 115-
r:•2£3 110-
£L.£3 105-
1 100-
-B95-
I90-
4-» 85-
80-30 40 50 60 70 80 90 100 110 120 130
time in minutes from low temperature (-173°Q
64
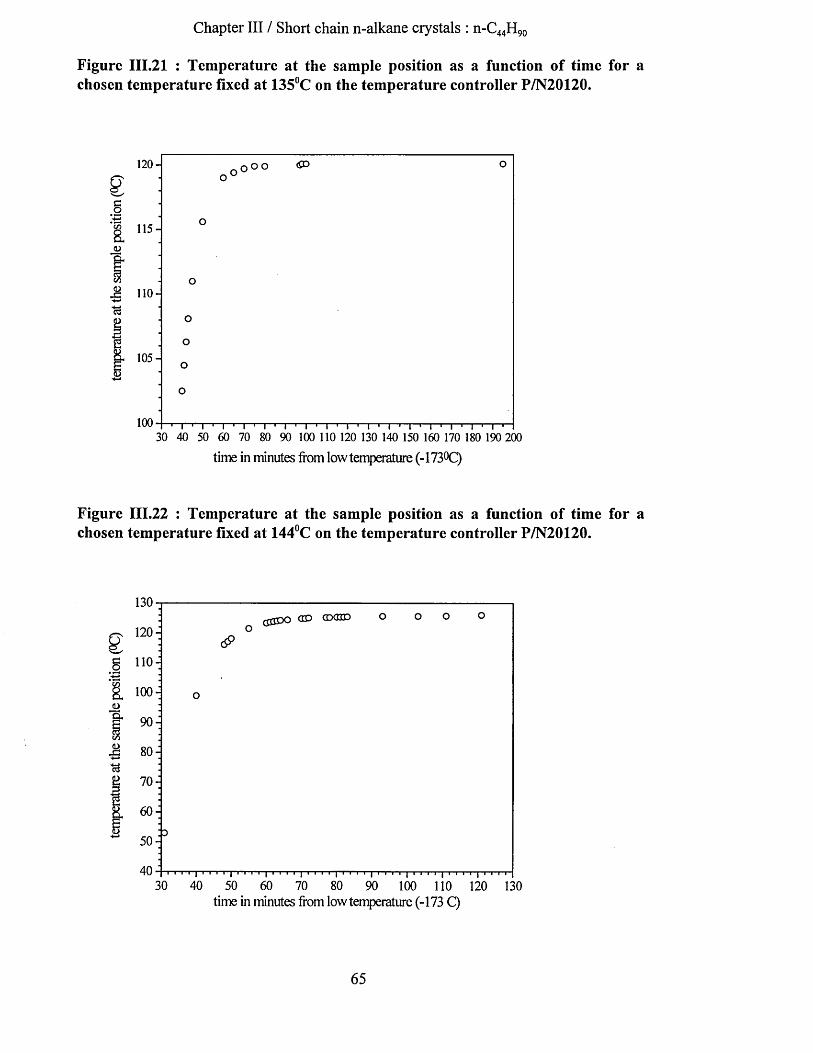
Chapter III / Short chain n-alkane crystals : n-C44H90
Figure 111.21 : Temperature at the sample position as a function of time for a chosen temperature fixed at 135°C on the temperature controller P/N20120.
g8a<u
JB
i ■ i ■ i ■ i ■ i ■ i ■ i ■ i ■ i ■ • i ■ i ■ i ■ i ■ i ■ i30 40 50 60 70 80 90 100 110 120 130 140 150 160 170 180 190 200
time in minutes from low temperature (-173°Q
Figure 111.22 : Temperature at the sample position as a function of time for a chosen temperature fixed at 144°C on the temperature controller P/N20120.
130(Jflp O (ED (DQ33D
g ^g* 110:
100 -
<L>90-
70-
60-
~ 50-
30 40 50 60 70 80 90 100 110 120 130time in minutes from low temperature (-173 Q
65
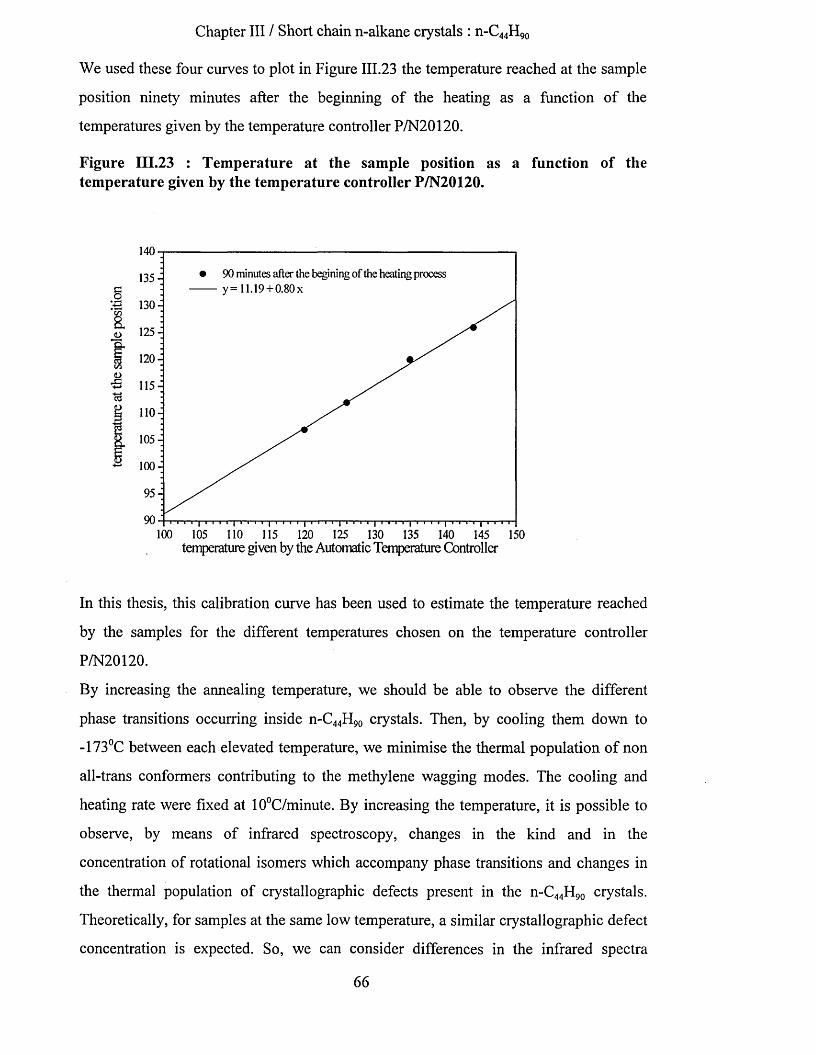
Chapter III / Short chain n-alkane crystals : n-C44H90
We used these four curves to plot in Figure 111.23 the temperature reached at the sample
position ninety minutes after the beginning of the heating as a function of the
temperatures given by the temperature controller P/N20120.
Figure 111.23 : Temperature at the sample position as a function of the temperature given by the temperature controller P/N20120.
140
• 90 minutes after the begining of the heating process y= 11.19 + 0.80x
135 -je :o
i3 o -
& :o 125 -
120 -
(D'B 115-
110 -
105 -
* 100 -
95-
100 105 110 115 120 125 130 135 140 145 150temperature given by the Automatic Temperature Controller
In this thesis, this calibration curve has been used to estimate the temperature reached
by the samples for the different temperatures chosen on the temperature controller
P/N20120.
By increasing the annealing temperature, we should be able to observe the different
phase transitions occurring inside n-C44H90 crystals. Then, by cooling them down to
-173°C between each elevated temperature, we minimise the thermal population of non
all-trans conformers contributing to the methylene wagging modes. The cooling and
heating rate were fixed at 10°C/minute. By increasing the temperature, it is possible to
observe, by means of infrared spectroscopy, changes in the kind and in the
concentration of rotational isomers which accompany phase transitions and changes in
the thermal population of crystallographic defects present in the n-C44H90 crystals.
Theoretically, for samples at the same low temperature, a similar crystallographic defect
concentration is expected. So, we can consider differences in the infrared spectra
66
Chapter III / Short chain n-alkane crystals : n-C44H90
recorded at -173°C as due almost exclusively to changes in structure rather than the
thermal population of rotational isomers present in the crystals. Finally, in this study the
infrared spectra are shown without normalisation. In all the cases, the thickness of the
compared samples was believed to be a constant through the experiments performed.
Indeed, the temperature range used here to observe the phase transitions occurring in n-
C44H90 crystals is believed to be narrow enough to prevent any major changes in the
volume of the sample holders (KBr plates and metal cylinder) and in the density of the
samples.
111.3.4 Low frequency Raman Spectrometer.
Raman measurements on a Jobin-Yvon T6400 spectrometer were made by Dr. N. A.
Tuan (Jobin-Yvon, Paris). The spectrometer was equipped with a CCD detector. Low
frequency Raman spectra were recorded using 2 cm'1 resolution.
111.3.5 Samples.
The n-tetratetracontane, n-C44H90, sample was purchased from the Aldrich Chemical
company. Its purity was 99%. Toluene Aristar quality grade was used for crystallisation.
Samples were prepared by crystallisation in solution following four different
procedures.
Samples A were prepared by crystallisation of n-C44H90 in toluene using different
cooling rates and concentrations. The solution and the suspension obtained were filtered
at room temperature and the solid was allowed to sediment to form a mat. This mat was
left to dry at room temperature and atmospheric pressure for at least 48 hours. The
sample was used as it was, lightly pressed (pressure applied over the sample surface
lower than 0.4 ton per cm2) or heavily pressed (pressure applied over the sample surface
between 0.8 and 1.2 ton per cm2) as necessary and installed between two KBr plates
inside the sample holder.
Samples B were prepared by crystallisation of n-C44H90 in toluene using different
cooling rates. Crystals in suspension were dropped onto a KBr plate using a pipette.
67

Chapter III / Short chain n-alkane crystals : n-C44H90
After the evaporation of the toluene, a second KBr plate was deposited on the first one
and the assembly was installed inside the sample holder.
Samples C were prepared by dissolving n-C44H90 in toluene and by depositing a droplet
of this clear solution onto a KBr plate at room temperature. After evaporation of the
toluene, a second KBr plate was deposited on the first one and the assembly was
installed inside the sample holder.
Samples D were prepared by dissolving n-C44H90 in toluene and by dropping this clear
solution on a filter paper at room temperature. After crystallisation on the filter paper
the solid was allowed to sediment to form a mat. This mat was left to dry at room
temperature and atmospheric pressure for at least 48 hours. This mat was lightly pressed
(pressure applied over the sample surface lower than 0.4 ton per cm2) and installed
between two KBr plates inside the sample holder.
III.4 Results.
III.4.1 X-ray scattering results.
All the x-ray scattering measurements have been done in the Department of Engineering
Materials, University of Sheffield by Mr X. Zeng. The same samples were used to carry
out the infrared experiments.
III.4.1.1 Sample A1 : 1.3% solution, crystallised at 25°C, lightly pressed.
This sample was studied by S.A.X.S. at several elevated temperatures : 25°C, 47°C,
63°C, 71°C, 79°C and 83°C. Up to 71°C, a strong diffraction pattern peak was found
corresponding to a long spacing of 52.0 A and a weak one corresponding to a long
spacing of 58.0 A. Crystals are essentially in a monoclinic {011} structure with some
trace of orthorhombic I form. After heating up to 79°C or higher, the long spacing was
55.0 A, which indicated a pure monoclinic {101} structure.
68

Chapter III / Short chain n-alkane crystals : n-C44H90
111.4.1.2 Sample A2 : 1.3% solution, crystallised at 25°C, heavily pressed.
Measurements were done at room temperature. At low angles, the diffraction pattern
peak was very weak. At wide angles, the diffraction pattern was found similar to a
triclinic form structure with some trace of monoclinic {011} form.
111.4.1.3 Sample A1 cooled down from the melt at 2°C per hour.
This sample was studied by S.A.X.S. at several elevated temperatures : 48°C, 71°C and
79°C. Up to 71°C, the diffraction pattern peak was found to correspond to a long spacing
of 57-58 A. Crystals are essentially in orthorhombic I form. Heating up to 79°C,
corresponding long spacing was 56.0 A. This value is believed to be characteristic of a
tilted orthorhombic I form. After 30 minutes at 79°C, the long spacing was 55.0 A
which indicated a pure monoclinic {101} structure.
111.4.1.4 Sample A3 : 0.45% in solution, crystallised at 25°C, mat not pressed at all.
Measurements were done at room temperature. Two diffraction pattern peaks were
found corresponding to long spacings of 51.5 A and of 58.0 A. Crystals are in the
monoclinic {011} and orthorhombic I forms.
111.4.1.5 Sample A3 : 0.45% in solution, crystallised at 25°C, mat lightly pressed.
Measurements were done at room temperature. At low angles, two diffraction peaks
were found corresponding to long spacing of 52.0 A and of 58.0 A. Crystals are in
monoclinic {011} and orthorhombic I forms. But, at wide angles, the diffraction pattern
was found to correspond approximately to a triclinic structure.
III.4.2 D.S.C. results.
III.4.2.1 Sample A1 : 1.3% solution, crystallised at 25°C, lightly pressed.
A phase transition was observed from S.A.X.S. measurements between 71°C and 79°C
on sample (Al). This transition occurs between the monoclinic {011} form (long
69
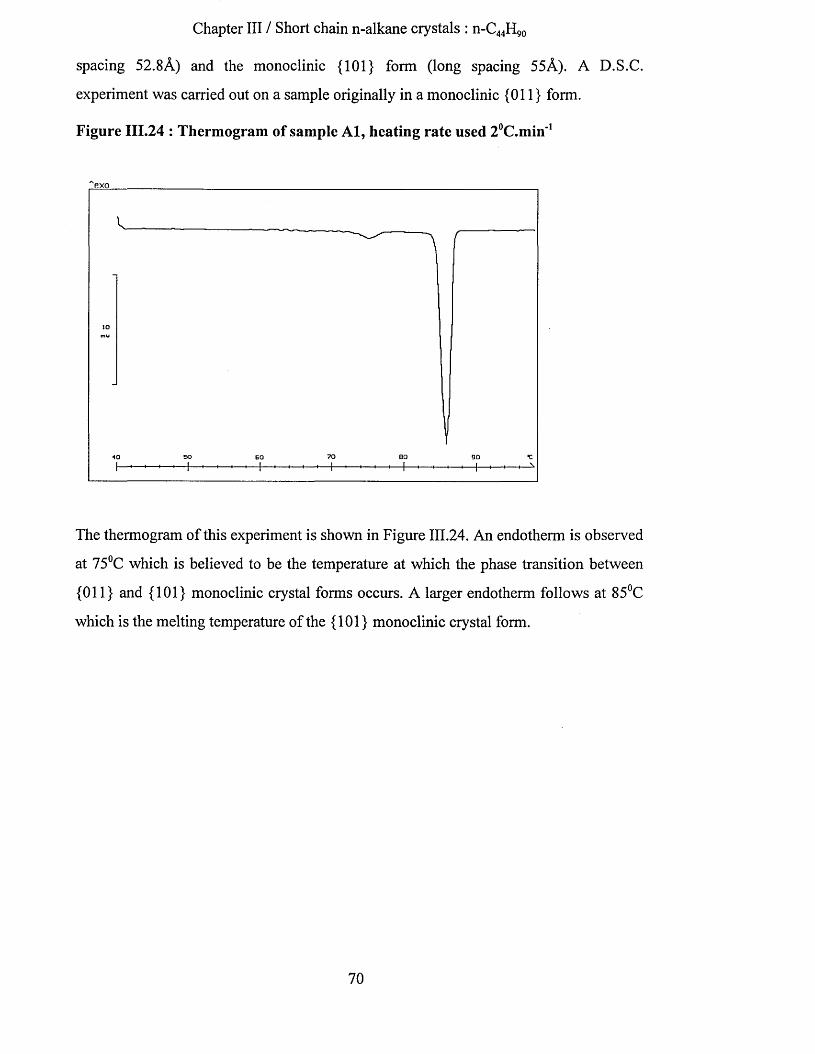
Chapter III / Short chain n-alkane crystals : n- C44H90
spacing 52.8A) and the monoclinic {101} form (long spacing 55A). A D.S.C.
experiment was carried out on a sample originally in a monoclinic {011} form.
Figure 111.24 : Thermogram of sample A l, heating rate used Z^.min'1
^exo
The thermogram of this experiment is shown in Figure 111.24. An endotherm is observed
at 75°C which is believed to be the temperature at which the phase transition between
{011} and {101} monoclinic crystal forms occurs. A larger endotherm follows at 85°C
which is the melting temperature of the {101} monoclinic crystal form.
70

Chapter III / Short chain n-alkane crystals : n-C44H90
III.4.2.2 Sample D : 1.3% solution, lightly pressed.
Figure 111.25 : Thermogram of sample D, heating rate used 2°C.min‘1
bxd
50 BO
In the thermogram shown in Figure 111.25, no endotherm is detected below 80°C.
Nevertheless, a strong endotherm with two maxima at 84.5°C and 85°C is observed.
From these observations, we can conclude that sample D was not originally in a
monoclinic {011} crystal form. Nevertheless, the presence of the two maxima in the
thermogram indicates the melting temperatures of crystals in two different structures.
71

Chapter III / Short chain n-alkane crystals : n-C44H90
III.4.3 Infrared and Raman Spectroscopy results.
III.4.3.1 Sample A1 : 1.3% solution, crystallised at 25°C, lightly pressed.
III.4.3.1 .a High temperature infrared spectra.
III.4.3.1.a.l Wagging mode region.
Figure 111.26 : F.T.I.R. spectra of sample A1 as a function of the temperature, after baseline subtraction
0.30-
0.25-
0.20 -
§0.15-
o0.10 -
0.05-
0.0013601400 1380 1340 1320 1300 1280 1260
wavenumbers
Figure 111.26 shows the wagging mode region of the infrared spectra recorded at 41°C,
63°C, 79°C and 83°C. This region of the infrared spectrum is the fingerprint of specific
nonplanar alkane chain conformations. It is remarkable to see how low the absorbance is
in this region. It is characteristic of a primarily all-trans chain conformation.
Increasing the temperature from 63°C to 79°C, the strongest band, ascribed to the methyl
symmetric bending mode, is shifted to higher frequencies, from 1372 cm’1 to 1378 cm’1.
Also, it is important to notice the increase of the intensity of the 1342 cm'1 band
assigned to the end gauche defect modes. In the spectra recorded at the two lowest
temperatures, a shoulder at 1378 cm'1 is present.
72

Chapter III / Short chain n-alkane crystals : n-C44H90
Second derivatives, deconvolutions and curve fitting procedures have been used to
determine more accurately the frequencies and areas of the different bands present in the
spectra. In all the cases, we tried to use the minimum number of bands to perform the
curve fitting procedures. The result of this work is shown in Table III.2.
Table III.2 : Curve fitting results obtained from the infrared spectra of sample A1 recorded at elevated temperatures
T=41°C T=63°C T=79°C T=83°Ccm'1 area cm'1 area cm'1 area cm'1 area
1384.8 0.22 1384.3 0.25666 1386.1 0.30461 1386.1 0.3051377.5 1.269 1377.5 1.312 1378.2 2.267 1378.2 2.3001371.2 1.431 1371.3 1.201 1370.7 0.347 1370.6 0.3241365.4 0.570 1365.4 0.536 1365.4 0.209 1365.4 0.2431355.5 0.121 1355.5 0.116 1358.8 . 0.144 1358.8 0.1511349.2 0.080 1349.2 0.084 1351.3 0.083 1351.3 0.0901342.6 0.049 1342.6 0.070 1341.7 0.150 1341.6 0.163
In Figure III.27, the scaled areas of the major bands (maximum value arbitrarily fixed to
one) are drawn versus the temperature. The lines connecting the points are drawn only
for clarification of the trends.
73
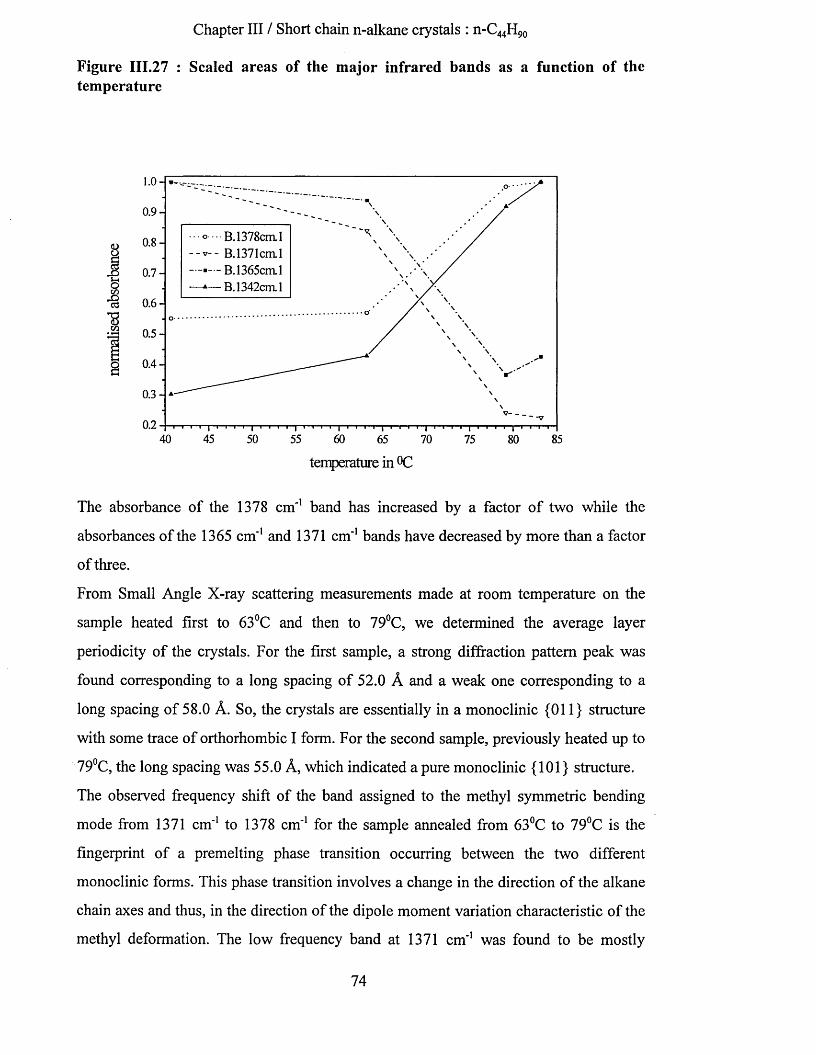
Chapter III / Short chain n-alkane crystals : n-C44H9o
Figure 111.27 : Scaled areas of the major infrared bands as a function of the temperature
1.0 4
0.9-
o B. 1378cm 1 -v- - B.1371cml
B. 1365cm 1 B.1342cm l
§
1 0 1 :^ 0.6 -•8■M 0.5 -
0.4-8 v0.3-
0.26040 45 50 55 70 8565 75 80
temperature in °C
The absorbance of the 1378 cm'1 band has increased by a factor of two while the
absorbances of the 1365 cm'1 and 1371 cm'1 bands have decreased by more than a factor
of three.
From Small Angle X-ray scattering measurements made at room temperature on the
sample heated first to 63°C and then to 79°C, we determined the average layer
periodicity of the crystals. For the first sample, a strong diffraction pattern peak was
found corresponding to a long spacing of 52.0 A and a weak one corresponding to a
long spacing of 58.0 A. So, the crystals are essentially in a monoclinic {011} structure
with some trace of orthorhombic I form. For the second sample, previously heated up to
79°C, the long spacing was 55.0 A, which indicated a pure monoclinic (101} structure.
The observed frequency shift of the band assigned to the methyl symmetric bending
mode from 1371 cm'1 to 1378 cm'1 for the sample annealed from 63°C to 79°C is the
fingerprint of a premelting phase transition occurring between the two different
monoclinic forms. This phase transition involves a change in the direction of the alkane
chain axes and thus, in the direction of the dipole moment variation characteristic of the
methyl deformation. The low frequency band at 1371 cm'1 was found to be mostly
74

Chapter III / Short chain n-alkane crystals : n-C44H90
polarised in the b direction. The high frequency band at 1378 cm'1 was found to be
mostly polarised in the a direction69.
A band is already present at 1378 cm'1 in the spectra recorded at the two lowest
temperatures for crystals in monoclinic {011} structure. The increase of its absorbance
compared with the 1365 cm'1 and 1371 cm'1 bands may support the assignment of this
band to a symmetric methyl deformation mode polarised in a different direction than the
one at 1371 cm'1 but still in crystals with a monoclinic {011} structure. Alternatively,
the band at 1378 cm'1 may be the signature of a small proportion of crystals with an
orthorhombic structure
The increase by a factor of 2.1 of the absorption of the band ascribed to the end-gauche
defect mode at 1342 cm'1 is an additional sign of the premelting phase transition
occurring between 63°C and 79°C. Therefore, we do not expect to find more than around
one end gauche conformer per chain within crystals in the monoclinic {011} form at
this first temperature, since the maximum value obtainable is two such defects per
molecule.
I l l 4.3.1. a. 2 Methylene rocking mode region.
The methylene rocking mode region of the high temperature spectra is shown in Figure
III.28 (spectra have been translated upwards for a more convenient presentation) :
75
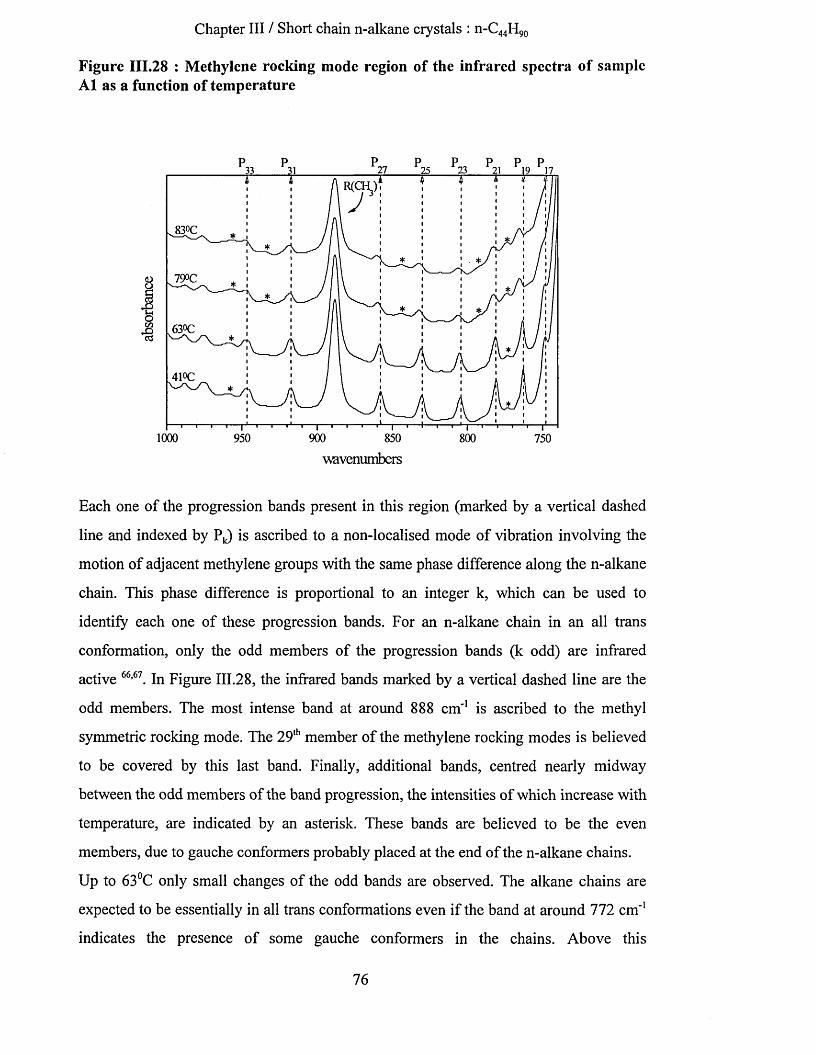
Chapter III / Short chain n-alkane crystals : n-C44H90
Figure 111.28 : Methylene rocking mode region of the infrared spectra of sample A1 as a function of temperature
£
oon■8
1000 950 900 850 800 750
wavenumbers
Each one of the progression bands present in this region (marked by a vertical dashed
line and indexed by Pk) is ascribed to a non-localised mode of vibration involving the
motion of adjacent methylene groups with the same phase difference along the n-alkane
chain. This phase difference is proportional to an integer k, which can be used to
identify each one of these progression bands. For an n-alkane chain in an all trans
conformation, only the odd members of the progression bands (k odd) are infrared
active 66,67. In Figure 111.28, the infrared bands marked by a vertical dashed line are the
odd members. The most intense band at around 888 cm'1 is ascribed to the methyl
symmetric rocking mode. The 29th member of the methylene rocking modes is believed
to be covered by this last band. Finally, additional bands, centred nearly midway
between the odd members of the band progression, the intensities of which increase with
temperature, are indicated by an asterisk. These bands are believed to be the even
members, due to gauche conformers probably placed at the end of the n-alkane chains.
Up to 63°C only small changes of the odd bands are observed. The alkane chains are
expected to be essentially in all trans conformations even if the band at around 772 cm'1
indicates the presence of some gauche conformers in the chains. Above this
76

Chapter III / Short chain n-alkane crystals : n-C44H90
temperature, a shift of the odd bands towards higher wavenumbers occurs with a clear
decrease in intensity. This shift in frequency could be indicative of a change in the
crystal structure.
111.4.3.1.b Low temperature infrared spectra.
111.4.3.1.b.l Wagging mode region.
Figure 111.29 : Low temperature F.T.I.R. spectra of sample A1 as a function of the annealing temperature, after baseline subtraction
0.50
0.45-— ■ cooled down from 83°C cooled down from 79°C— cooled down from 63°C— cooled down from 41 °C
0.40-
0.35-
0.30-3
0.25-
0.20 -
cd0.15-
0. 10 -
0.05-
0.0012601360 1340 1320 1300 12801400 1380
wavenumbers
Figure 111.29 shows the wagging mode region of the infrared spectra recorded at -173°C,
the sample successively cooled down between annealing at each higher temperature.
None of the characteristic wagging bands of any rotational isomers has a strong enough
intensity to be detectable. In particular, the 1341 cm'1 band, characteristic of the
presence of the end gauche defect conformations, is not detected in any of these last
spectra. By comparison, its intensity had increased with temperature in the spectra
recorded from 41°C to 83°C. However, a strong band at 1368 cm'1 with a shoulder at
1371 cm'1 and a weaker one at 1379 cm-1 are present in the two spectra recorded at
-173°C, after the sample had been cooled down from the first two lower temperatures
77

Chapter III / Short chain n-alkane crystals : n-C44H90
(41°C and 63°C). A medium band at 1370 cm'1, an unresolved one at 1374 cm'1 and a
medium one at 1379 cm'1 are characteristic of the two spectra recorded at -173°C, after
cooling the sample from 79°C and 83°C.
Second derivatives, deconvolutions and curve fitting procedures have been used to
determine with accuracy the frequency and area of the different bands present in the
spectra. The result of this work is shown in Table III.3.
Table III.3 : Curve fitting results obtained from the infrared spectra of sample A1 recorded at -173°C
cooled down from 41°C
cooled down from 63°C
cooled down from 79°C
cooled down from 83°C
cm'1 area cm'1 area cm'1 area cm'1 area1378.9 0.458 1379 0.438 1379 1.144 1379 1.0961376.2 0.281 1376.3 0.285 1376.7 0.451 1376.8 0.4161373.3 0.213 1373.4 0.241 1373.6 0.612 1373.6 0.5661371 0.960 1371.1 0.595 1369.9 1.112 1369.9 1.2971368 2.133 1367.9 2.2831363.9 0.118 1364 0.062 1365 0.052 1365 0.0231362 0.046 1362 0.058
In Figure 111.30 the scaled areas of the major bands (maximum value arbitrarily fixed to
one) are drawn versus the temperature. The lines connecting the points are drawn only
for clarification of the trends. We consider that the bands at 1371 cm'1 in the spectra of
the sample cooled down from 41°C and 63°C and at 1370 cm'1 in the spectra of the
sample cooled down from 79°C and 83°C are the same.
78

Chapter III / Short chain n-alkane crystals : n-C44H90
Figure 111.30 : Scaled areas of the major bands present in the low temperature infrared spectra of sample A1 as a function of the annealing temperature
1.0 -.✓/
0.9-
3
CD
£0.7-
1 0.6 -• B.1379cm 1 — B.1376cm l ■-- B .l373cm 1 1— B. 1370cm 1 :— B. 1368cm 1
0.5-
0.4-
0.36040 45 65 70 80 8550 55 75
temperature in °C
No S.A.X.S. measurements were done at low temperature. But, from the above
observations, it is clear that the alkane chains are, inside the different crystal structures,
in a rigorously all-trans conformation. No changes in the normalised absorbance of the
band ascribed to the end gauche conformers are detected at this low temperature as a
function of the crystal structure. The phase transition strongly affects the intensity and
the frequency at which the band ascribed to the methyl symmetric bending mode occurs
in the infrared spectra. Figure 111.30 shows that the major changes occur between 63°C
and 79°C. Indeed, the band at 1368 cm*1 which is the strongest one in the spectra of
sample A1 disappears through the monoclinic phase transition. This band may be a
fingerprint of the monoclinic {011} crystal structure at low temperature. A band of
constant integrated absorbance is present at around 1379 cm'1 in the spectra of sample
A1 cooled down from 41°C and 63°C. This weak band may be assigned to the
orthorhombic I crystal form present in the sample at -173°C. After annealing at 79°C,
the intensities of the bands at 1379 cm*1 and 1373 cm'1 increase by a factor of
respectively 2.5 and 2. The higher frequency band at 1379 cm'1 and with less certainty
the one at 1373 cm'1 may be fingerprints of the monoclinic {101} crystal structure at
79

Chapter III / Short chain n-alkane crystals : n-C44H90
low temperature. The intensity of the 1371 cm'1 band decreases when the temperature is
increased between 41°C to 63°C. This is followed by an increase of the intensity above
64°C with a small shift towards lower frequency : this band at 1370 cm'1 may also be a
fingerprint of the monoclinic {101} crystal structure at low temperature. Again, a
change in the direction of the variation of the dipole moment induced by the methyl
vibration mode through the monoclinic phase transition may explain some of the
changes observed in the infrared spectra.
III.4.3J.b.2 Methylene rocking mode region.
The methylene rocking mode region of the low temperature spectra is shown in Figure
111.31 (spectra have been translated upwards for a more convenient presentation):
Figure 111.31 : Methylene rocking mode region of the low temperature infrared spectra of sample A1 as a function of the annealing temperature
cooled down from 83°C
cooled down from 79°C
01 cooled down from
63°C
cooled down from 41°C
1000 950 900 850 800 750
wavenumbers
In the spectra recorded at -173°C shown in Figure 111.31, only the odd members of the
band progression are present. These bands are marked by a vertical dashed line and are
labelled by Pk. The lowest frequency component of each band progression has been
chosen to identify each member of the progression. At -173°C, none of the characteristic
80
Chapter III / Short chain n-alkane crystals : n-C44H90
bands assigned to gauche conformers is present in the spectra. Thus, the n-alkane chains
are in a pure extended form whatever the crystal structure. Also, at this low temperature,
the splitting of the progression bands can be observed. The splitting of these infrared
bands is a characteristic of the monoclinic and orthorhombic crystal structures. The
splitting of these bands decreases first, going from the 17th member of the progression to
a frequency limit at around 815 cm'1, and then, increases again, going from this
frequency limit to the higher members of the progression. Also, the relative intensities
of band progression components differ from one to the other. Going to the {101}
monoclinic phase, the relative intensity of the component centred at the higher
wavenumber increases compared to the lower one. The position of these maxima could
be used to identify the crystal structure of this n-alkane sample. Also, it can be noticed
that in some cases more than two components can be observed.
Within the methylene rocking mode region of the infrared spectra shown above, a band
at around 888 cm*1 is ascribed to the methyl rocking mode.
81
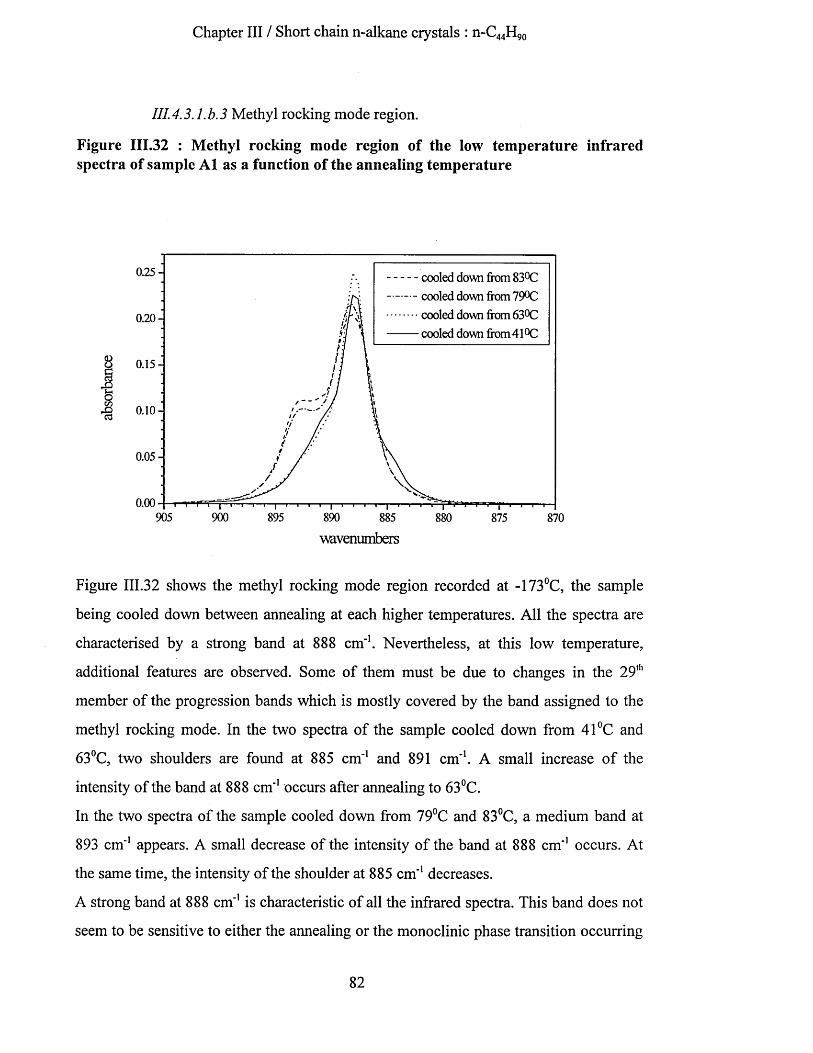
Chapter III / Short chain n-alkane crystals : n-C44H90
III.4.3.Lb.3 Methyl rocking mode region.
Figure 111.32 : Methyl rocking mode region of the low temperature infrared spectra of sample A1 as a function of the annealing temperature
0.25- cooled down from 83°C cooled down from 79°C cooled down from 63°C cooled down from41°C
0.20 -
§ 0.15 -
oon•8 o.io-
0.05-
0.00905 900 895 890 885 880 875 870
wavenumbers
Figure 111.32 shows the methyl rocking mode region recorded at -173°C, the sample
being cooled down between annealing at each higher temperatures. All the spectra are
characterised by a strong band at 888 cm*1. Nevertheless, at this low temperature,
additional features are observed. Some of them must be due to changes in the 29th
member of the progression bands which is mostly covered by the band assigned to the
methyl rocking mode. In the two spectra of the sample cooled down from 41°C and
63°C, two shoulders are found at 885 cm"1 and 891 cm*1. A small increase of the
intensity of the band at 888 cm*1 occurs after annealing to 63°C.
In the two spectra of the sample cooled down from 79°C and 83°C, a medium band at
893 cm*1 appears. A small decrease of the intensity of the band at 888 cm*1 occurs. At
the same time, the intensity of the shoulder at 885 cm*1 decreases.
A strong band at 888 cm'1 is characteristic of all the infrared spectra. This band does not
seem to be sensitive to either the annealing or the monoclinic phase transition occurring
82

Chapter III / Short chain n-alkane crystals : n-C44H90
between 63°C and 79°C. Nevertheless, the infrared spectra of the sample cooled down
from 63°C and 79°C can be easily differentiated by a medium band at 893 cm'1 which
may be characteristic of the final monoclinic {101} form.
The shoulder at 885 cm'1 may be a fingerprint of the small quantity of orthorhombic I
crystals present in the sample as found by S.A.X.S. measurements. Crystals in an
orthorhombic I structure are transformed to a monoclinic {101} structure by annealing.
III.4.3.2 Sample A2 : 1.3% solution, crystallised at 25°C, heavily pressed.
III.4.3.2.a High temperature infrared spectra
III. 4.3.2. a. 1 Wagging mode region.
Figure 111.33 : F.T.I.R. spectra of sample A2 as a function of temperature, after baseline subtraction
0.10-]
0.09-
0.08-
0.07-
^ 0.06 -
J 0.05 -
§ 0.04-
0.03-
0.02 -
0 .0 1 -
0.001400 1380 1360 1340 1300 12601320 1280
wavenumbers
Figure 111.33 shows the wagging mode region of the infrared spectra recorded at 42°C,
69°C, 74°C and 75°C. Again, the most intense bands and the most sensitive to
temperature changes are ascribed to the methyl deformation modes. Nevertheless, a
small increase in the intensity of the 1341 cm'1 band occurs with the increase in
temperature.
83

Chapter III / Short chain n-alkane crystals : n-C44H90
Contrary to the spectrum of sample A1 recorded at the first elevated temperature, the
spectrum of sample A2 recorded at 42°C is characterised by two just resolved bands of
nearly equal intensities at 1371 cm'1 and 1378 cm'1. The increase in temperature is
accompanied by a decrease of the intensity of the 1371 cm'1 band followed, from 74°C,
by an increase of the 1378 cm'1 band intensity. It should be noted that the highest
temperature at which the sample was annealed is 75°C. In the case of sample A l, the
phase transition between the two monoclinic forms was found to occur at around 75°C.
Second derivatives, deconvolutions and curve fitting procedures have been used to
determine with accuracy the frequency and area of the different bands present in the
spectra. The result of this work is shown in Table III.4.
Table III.4 : Curve fitting results obtained from the infrared spectra of sample A2 recorded at elevated temperatures
T=42°C T=69°C T=74°C T=75°Ccm'1 area cm'1 area cm'1 area cm'1 area
1386 0.081 1386.4 0.079 1386.6 0.085 1386.2 0.1111377.9 0.716 1377.7 0.757 1377.9 0.774 1378.1 0.8101371.2 0.543 1371.3 0.263 1371.1 0.255 1371.2 0.2001365 0.247 1366.3 0.244 1365.3 0.184 1365.3 0.1871353.5 0.092 1354.6 0.077 1354 0.082 1354 0.0701342.2 0.038 1342.2 0.059 1342.2 0.070 1342.2 0.0771331.1 0.012 1331.1 0.006 1331.1 0.008 1331.1 0.006
In Figure 111.34 the scaled areas of the major bands are drawn versus the temperature.
84

Chapter III / Short chain n-alkane crystals : n-C44H90
Figure 111.34 : scaled areas of the major infrared bands as a function of temperature
B. 1378cm. 1 B.1371cml B.l342cm 1
0.40-0.35 -| i - I I 'I I 11 " I I I I i i | . . r — i— J — I— I I— I— j— I— I— I— r — p - i — 1 I— I—
40 45 50 55 60 65 70 75 80
temperature in °C
From S.A.X.S. measurements on sample A2 crystals before heating, we were able to
determine the average layer periodicity of the crystals and so, to determine the crystal
subcell. These data showed both triclinic and monoclinic {011} forms.
By applying pressure to the sample, we partially transformed the n-C44H90 crystal
structure to a triclinic form. The strong band at 1378 cm'1, in addition to the one at 1371
cm'1 found in the spectrum recorded at the lowest temperature, can be considered as
characteristic of this last crystal structure.
Nevertheless, a phase transition can still be observed when increasing the temperature.
A similar dependence of the infrared band behaviour with temperature seems to occur as
in the case of sample A l. In particular, the increase of the 1341 cm'1 band intensity with
temperature tends to show again an increase in the number of gauche conformations at
the end of the alkane chains.
85

Chapter III / Short chain n-alkane crystals : n-C44H90
III. 4.3.2. a. 2 Methylene rocking mode region.
The methylene rocking mode region of the high temperature spectra is shown in Figure
III.35 (spectra have been translated upwards for a more convenient presentation):
Figure 111.35 : Methylene rocking mode region of the infrared spectra of sample A2 as a function of temperature
R(CH,
§
1000 950 900 850 800 750
wuvenumbers
In Figure 111.35, the infrared bands marked by a vertical dashed line are assigned to the
odd band progression. They are labelled by Pk. The strongest band of this region
labelled by R(CH3), is ascribed to the methyl rocking mode and is centred at 888 cm'1.
The bands marked with an asterisk are ascribed to non all-trans chain conformations.
They are observed in the spectrum recorded at 42°C and, thus, indicate the presence of
gauche conformers before any annealing, most probably positioned at the end of the
chains. The band at around 955 cm'1 is a localised band and is assigned to the specific
end gauche conformers. Through the annealing process, an increase in the intensity of
the bands assigned to the gauche conformers is observed. At the same time, a decrease
in absorbance and a broadening of the odd bands occurs. Nevertheless, no clear shift in
86

Chapter III / Short chain n-alkane crystals : n-C44H90
the position of the odd bands is detected. This is further evidence of a partial phase
transition to the monoclinic {101} form.
111.4.3.2.b Low temperature infrared spectra.
111.4.3.2.b.l Wagging mode region.
Figure 111.36 : Low tem perature F.T.I.R. spectra of sample A2 as a function of the annealing temperature, after baseline subtraction
0.150-
cooled down from 75°C cooled down from 74°C cooled down from 69°C cooled down from 42°C
0.125-
0.100-
30.075 -
o£a 0.050-
0.025-
0.0001400 13601380 1340 1320 1300 1280 1260
wavenumbers
Figure 111.36 shows the wagging mode region of the infrared spectra recorded at -173°C,
the sample being cooled down between each of the higher temperatures. No band
ascribed to any rotational isomer was detectable.
Up to 74°C, the predominant band of the spectra is the one at 1368 cm'1 with a shoulder
at 1371 cm'1. A less intense but well resolved band is at 1378 cm'1. Compared to the
spectrum of the sample A l, this last band is more intense. Above 74°C, a reversal in the
intensity of the bands at 1368 cm'1 and 1378 cm'1 occurs. A clear shoulder is still present
at 1371 cm'1.
87
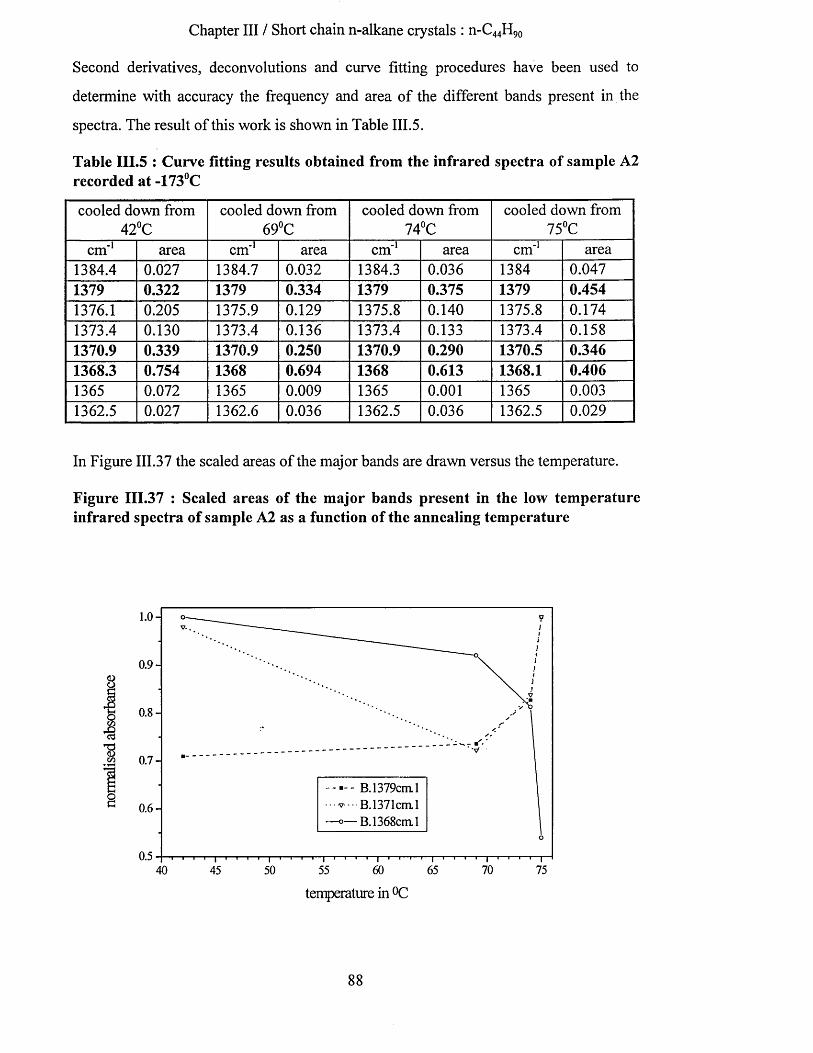
Chapter III / Short chain n-alkane crystals : n-C44H90
Second derivatives, deconvolutions and curve fitting procedures have been used to
determine with accuracy the frequency and area of the different bands present in the
spectra. The result of this work is shown in Table III.5.
Table III.5 : Curve fitting results obtained from the infrared spectra of sample A2 recorded at -173°C
cooled down from 42°C
cooled down from 69°C
cooled down from 74°C
cooled down from 75°C
cm'1 area cm'1 area cm'1 area cm'1 area1384.4 0.027 1384.7 0.032 1384.3 0.036 1384 0.0471379 0.322 1379 0.334 1379 0.375 1379 0.4541376.1 0.205 1375.9 0.129 1375.8 0.140 1375.8 0.1741373.4 0.130 1373.4 0.136 1373.4 0.133 1373.4 0.1581370.9 0.339 1370.9 0.250 1370.9 0.290 1370.5 0.3461368.3 0.754 1368 0.694 1368 0.613 1368.1 0.4061365 0.072 1365 0.009 1365 0.001 1365 0.0031362.5 0.027 1362.6 0.036 1362.5 0.036 1362.5 0.029
In Figure III.37 the scaled areas of the major bands are drawn versus the temperature.
Figure 111.37 : Scaled areas of the major bands present in the low tem perature infrared spectra of sample A2 as a function of the annealing temperature
1.0 -
0.9-
3
B. 1379cm. 1 ' - B. 1371cm. 1 »— B.l368cm 1
8 0.6 -
0.560 65 70 7540 50 5545
temperature in °C
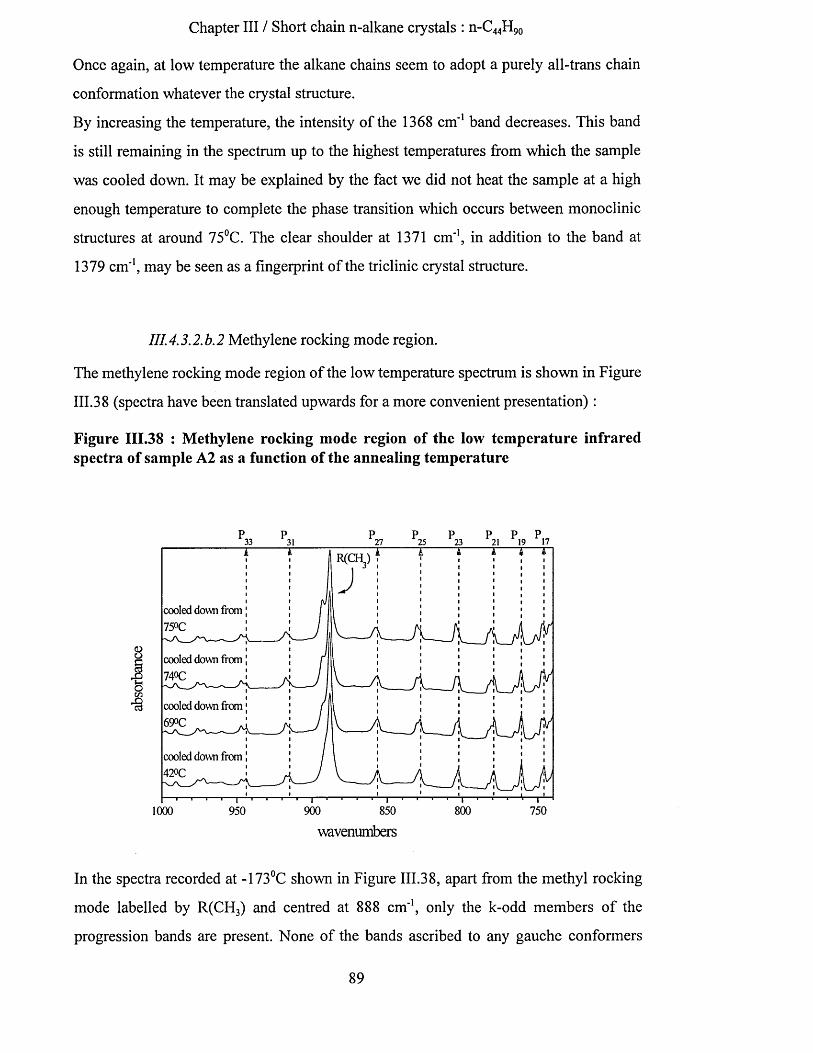
Chapter III / Short chain n-alkane crystals : n-C44H90
Once again, at low temperature the alkane chains seem to adopt a purely all-trans chain
conformation whatever the crystal structure.
By increasing the temperature, the intensity of the 1368 cm'1 band decreases. This band
is still remaining in the spectrum up to the highest temperatures from which the sample
was cooled down. It may be explained by the fact we did not heat the sample at a high
enough temperature to complete the phase transition which occurs between monoclinic
structures at around 75°C. The clear shoulder at 1371 cm'1, in addition to the band at
1379 cm'1, may be seen as a fingerprint of the triclinic crystal structure.
I ll 4.3.2. b. 2 Methylene rocking mode region.
The methylene rocking mode region of the low temperature spectrum is shown in Figure
111.38 (spectra have been translated upwards for a more convenient presentation):
Figure 111.38 : Methylene rocking mode region of the low temperature infrared spectra of sample A2 as a function of the annealing temperature
33
cooled down from J75«C :
1 cooled down from |
ooncooled down from;
- A
cooled down from |42°C !
1000 950
25 23P P P
21 19 17
R(CH ) 7
■> \
V_i A— A__1 I 1 I I1 I I I I1 I I I I
900 850
wavenumbers
In the spectra recorded at -173°C shown in Figure III.38, apart from the methyl rocking
mode labelled by R(CH3) and centred at 888 cm'1, only the k-odd members of the
progression bands are present. None of the bands ascribed to any gauche conformers
89
Chapter III / Short chain n-alkane crystals : n-C44H90
was detected. Hence, at -173°C, the n-alkane chains are in a pure extended form
whatever the crystal structure. Again, the splitting of some infrared bands is observed.
This splitting increases when going from around 850 cm'1 towards higher and lower
frequencies. This splitting is characteristic of the monoclinic and orthorhombic crystal
structures. In crystalline n-alkanes in the triclinic form, there is only one molecule per
unit cell and, therefore, no splitting of infrared bands can be observed. Thus here, the
sample is not in a pure triclinic form as suggested by the S.A.X.S. measurements. Also,
the relative intensity of the components of the band progression differs from one band to
the other. But, for each band, the different components are present in the spectrum of the
sample annealed up to 75°C. This strongly suggests that up to 75°C the sample is
composed of several crystal forms.
90

Chapter III / Short chain n-alkane crystals : n-C44H90
III. 4.3.2. b. 3 Methyl rocking mode region.
Figure 111.39 : Methyl rocking mode region of the low temperature infrared spectra of sample A2 as a function of the annealing temperature
o.io- cooled down from 75°C cooled down from 74°C cooled down from 69°C cooled down from42°C
0.08-
§ 0.06-
0.04-
0.02-
0.00895900 890 885 880 875 870905
wavenumbers
Figure 111.39 shows the rocking methyl mode region of the infrared spectra recorded at
low temperature, -173°C, for the sample cooled down successively from 42°C, 69°C,
74°C and 75°C. A strong band at 888 cm'1 is present in all these spectra.
The spectrum of the sample cooled down from 42°C can be easily differentiated from
the others by a broad unresolved component at around 885 cm'1 and by a clear shoulder
present at 891 cm'1. Indeed, in the three other spectra the components at 885 cm'1 and
891 cm"1 are very much reduced and a well resolved band at 893 cm'1 is present. The
intensity of this last band increases with the temperature at which the sample has been
heated.
From S.A.X.S. measurements, we have determined the original crystal structures as
being triclinic and monoclinic {011}. By annealing, a phase transition should occur to
the monoclinic {101} crystal form.
91

Chapter III / Short chain n-alkane crystals : n-C44H90
Again, the band at 888 cm*1 does not appear to be sensitive to the annealing process. On
the contrary, the presence of the 891 cm*1 shoulder in the spectrum of the sample cooled
down from 42°C may be a fingerprint of the monoclinic {011} subcell structure.
Changes in the infrared spectra recorded at -173°C, the sample being cooled down from
higher temperatures, may indicate a phase transition occurring between 42°C and 69°C.
This phase transition may be characterised by the decrease in intensity of the bands near
885 cm*1 and at 891 cm*1 and the increase of the intensity of the band at 893 cm'1. In the
infrared spectrum of the sample cooled down from 42°C, the broader component at
around 885 cm'1 may be a fingerprint of the triclinic structure. On the other hand, the
presence of the 893 cm*1 band may be ascribed to the monoclinic {101} subcell
structure.
III.4.3.3 Samples A3.
A3 : 0.45% in solution, crystallised at 25°C, mat not pressed at all.
A3’ : 0.45% in solution, crystallised at 25°C, mat lightly pressed (pressure applied over
the sample surface lower than 0.4 ton per cm2).
In Figure 111.40, spectra of sample A3 and A3’ recorded at respectively -102°C and
-173°C are shown.
92

Chapter III / Short chain n-alkane crystals : n-C44H90
Figure 111.40 : Low temperature F.T.I.R. spectra of sample A3 and A3’
sample A3 sample A3'
1400 1380 1360 1340 1320 1300 1280 1260
wavenumbers
Figure 111.40 shows the low temperature infrared spectra of samples A3 and A3’
recorded in the wagging mode region. Because sample A3 has not been pressed at all,
the thickness and the effect of scattering from the surface caused a poor quality
spectrum. Nevertheless, we can easily notice the principal difference between the two
spectra with the presence of the strong single band at 1384 cm'1. The bands ascribed to
the non all-trans chain conformation show a very low absorbance.
Kobayashi et al. ascribed two bands at 1382 cm'1 and 1370 cm'1 in the infrared spectra
of n-C36H74 crystals in the orthorhombic II form to the methyl symmetric bending
modes. By the mean of S.A.X.S. measurements, it was found that sample A3 was
formed of at least two types of crystals : orthorhombic I and monoclinic {011}
structures. Kobayashi et al report that the S.A.X.S. technique is unable to detect the
presence of crystals in orthorhombic II form. The 1384 cm'1 band in the spectra of
sample A3 may be a finger print of crystals in an orthorhombic II structure.
By pressing the sample, S.A.X.S. measurements on A3’ indicated the presence of
crystals in the triclinic structure in addition to the monoclinic and orthorhombic I forms.
On the other hand, the absence of the 1384 cm'1 band in the spectrum of sample A3 may
indicate the disappearance of crystals in orthorhombic II form under pressure.
93

Chapter III / Short chain n-alkane crystals : n-C44H99
Again, due to the low intensity of the bands assigned to gauche conformers, the alkane
chains seem to be in a predominantly extended form at low temperature whatever the
crystal structure. The behaviour of the 1384 cm’1 band with applied pressure may be
interpreted in terms of changes in the packing of the crystal layers, causing changes in
the arrangement of the methyl groups at the interfaces of these crystal layers.
1.1.1.1 Sample B : 0.265% in solution, cooling rate of 0.3°C/minute, n-C44H9o crystals are deposited on a KBr plate.
Photograph III. 1 :
The study of sample B under an optical microscope using white light and a
magnification of 500 gave us additional information on the macroscopic structure of this
sample. In photograph III.l, the white horizontal line corresponds roughly to 50 pm.
Photograph III.l shows a part of a lozenge-shaped crystal multilayer. Several
photographs were taken with the microscope focused on different layers of this large
structure. The picture shows that each layer is characterised by a different colour
(different greyscale in this black and white reproduction). A periodic succession of
colours was followed through successive crystal layers.
In the bottom right side of the picture, small lozenge shaped crystals are seen. A fracture
is visible along the long diagonal of the lozenges.
94

Chapter III / Short chain n-alkane crystals : n-C44H90
III 4.3.4. a. 1 Wagging mode region.
Figure 111.41 : Low temperature F.T.I.R. spectra of sample B as a function of the annealing temperature, after baseline subtraction
0.008
— cooled down from 79°C • • • cooled down from 71°C- * cooled down from41°C
0.007-
0.006-
0.005-
§0.004-
0.003-
0.002-
0.001-
0.000-11370 1365 136013751380
wavenumbers
Figure 111.41 shows the low temperature spectra of sample B cooled down from 41°C,
71°C and 79°C. A strong single band at 1368 cm"1 is characteristic of the two first
spectra. The intensity of this band is strongly affected by the increase of the temperature
above 71°C. The spectrum of the sample cooled down from 79°C shows a broad band
with three maxima at around 1379 cm"1, 1376 cm"1 and 1370 cm"1, which are not fully
resolved.
Additional S.A.X.S. measurements made on a sample originally in an orthorhombic I
crystal form (long spacing 58.0A) showed a phase transition at around 79°C. At this
temperature, tilting of the n-alkane chains is first observed (long spacing 56.0A)
followed, if annealed for a long enough time, by a transition to the monoclinic {101}
form (long spacing 55.0A). With the help of photograph 1 (multilayer structure) and
with the observations made on the infrared spectra recorded at low temperature (a strong
band at 1368 cm"1 which disappears above 79°C) we may conclude that the initial crystal
95

Chapter III / Short chain n-alkane crystals : n-C44H90
structure of sample B is mostly monoclinic {011}. Also, the small band at around 1376
cm'1 may be indicative of the presence of the orthorhombic I crystal form. The phase
transition occurring between 71°C and 79°C should involve the transition from the
monoclinic {011} to the monoclinic {101} forms. Nevertheless, the clear band at 1376
cm'1 in the spectrum of the sample cooled down from the highest temperature indicates
the presence of some crystals remaining in orthorhombic I form.
III. 4.3.4. a. 2 Methyl rocking mode region.
Figure 111.42 : Methyl rocking mode region of the low temperature infrared spectra of sample B as a function of the annealing temperature, after baseline subtraction
0.005
cooled down from 79°C
cooled down from 71°C
cooled down from41°C0.004-
0.003-£
01
0.002 -
0.001 -
0.000894 893 892 891 890 889 888 887 886 885 884 883 882
wavenumbers
Figure 111.42 shows the methyl rocking mode region of the infrared spectra recorded at
-173°C of sample B cooled down from 41°C, 71°C and 79°C. The intensity of these
spectra in this region is very low. The three spectra are characterised by a band at 888
cm'1. Small changes in the shape of this band can be observed with the increase in
temperature. Firstly, by increasing the temperature up to 71°C, a small increase in the
intensity of this band is observed. Secondly, after annealing to 79°C, the width of this
band increases. In this last spectrum, no shoulder was found at 884 cm'1.
96
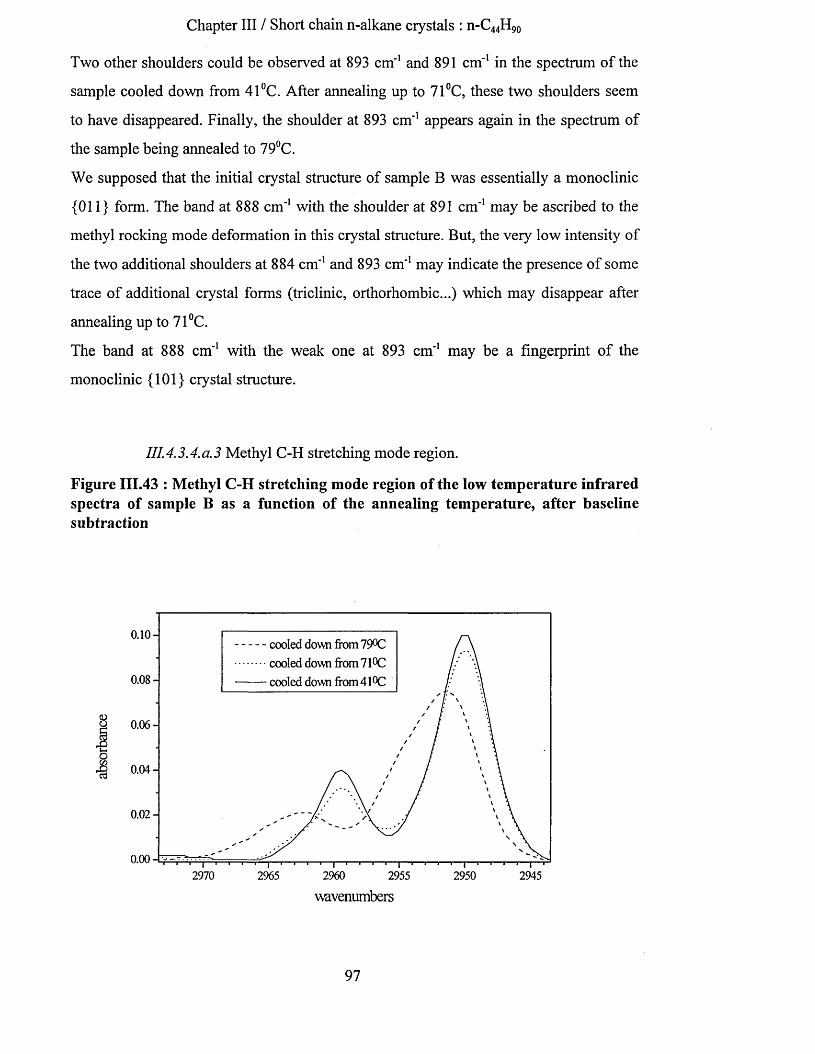
Chapter III / Short chain n-alkane crystals : n-C44H90
Two other shoulders could be observed at 893 cm'1 and 891 cm'1 in the spectrum of the
sample cooled down from 41°C. After annealing up to 71°C, these two shoulders seem
to have disappeared. Finally, the shoulder at 893 cm'1 appears again in the spectrum of
the sample being annealed to 79°C.
We supposed that the initial crystal structure of sample B was essentially a monoclinic
{011} form. The band at 888 cm'1 with the shoulder at 891 cm'1 may be ascribed to the
methyl rocking mode deformation in this crystal structure. But, the very low intensity of
the two additional shoulders at 884 cm'1 and 893 cm'1 may indicate the presence of some
trace of additional crystal forms (triclinic, orthorhombic...) which may disappear after
annealing up to 71°C.
The band at 888 cm'1 with the weak one at 893 cm'1 may be a fingerprint of the
monoclinic {101} crystal structure.
III. 4.3.4. a. 3 Methyl C-H stretching mode region.
Figure 111.43 : Methyl C-H stretching mode region of the low temperature infrared spectra of sample B as a function of the annealing temperature, after baseline subtraction
o.io-cooled down from 79°C cooled down from 71°C cooled down from 41°C0.08-
§ 0.06-
0.04-cd
0.02 -
0.002970 2965 2960 2955 29452950
wavenumbers
97

Chapter III / Short chain n-alkane crystals : n-C44H90
Figure 111.43 shows the methyl C-H stretching region of the infrared spectra of sample B
recorded at -173C, the sample successively cooled down between annealing at each
higher temperature. In the spectra of sample B cooled down from 41°C and 71°C, two
bands at 2959 cm'1 and 2950 cm'1 are found. A small decrease in the intensity occurs
after annealing to 71°C. After annealing to 79°C, a shift of these two bands is observed
towards higher frequencies. These two major bands are now centred at 2962 cm'1 and
2951 cm'1. A shoulder is found on this last band at 2955 cm'1. The splitting of the two
major bands increases from 9 cm'1 to 11 cm'1 in the spectra of the sample cooled down
respectively from 71°C and 79°C.
The two major bands centred around 2962 cm'1 and 2952 cm'1 were ascribed by
MacPhail et al.71 to respectively the in-plane and out-of-plane methyl asymmetric
stretching modes. They reported that the frequencies and the splitting of these two bands
can change due to temperature effects, methyl environments or phase transitions. All the
infrared spectra were recorded at the same temperature, -173°C, so changes occurring in
the infrared spectra cannot be due to temperature effects. The shift to the higher
frequencies as well as the increase of the splitting of the two bands ascribed to the
methyl C-H stretching modes may be explained by the phase transition occurring
between the two monoclinic forms between 71°C and 79°C. The phase transition may
also induce changes in the methyl environment.
98

Chapter III / Short chain n-alkane crystals : n-C44H90
III 4.3.4. a. 4 Raman spectroscopy.
Figure 111.44 : Low frequency Raman spectrum of sample B recorded at room temperature
24000
22000
20000
18000
16000
■ts 14000
12000 L.AJVL 1 58.1 cnr110000
8000L.A.M. 3
6000
4000
100180 160 140 120 80 60 40 20200
Delta Wavenumbers
Khoury et al.56 reported the effects of polymorphism on the L.A.M. frequencies of two
short n-alkanes n-C36H74 and n-C94H190. Depending on crystallisation conditions, these n-
alkanes can crystallise in orthorhombic form, in monoclinic {011} form or, in the case
ofn-C94H190, in monoclinic {201} form.
The low frequency Raman spectra of n-C94H190 recorded at 297K show bands at 26.2
cm'1, 26.2 cm'1 and 27.7 cm'1 ascribed to the first order of the L.A.M., respectively for
the sample in orthorhombic I, monoclinic {011} and monoclinic {201} forms. Hence,
first order of the L.A.M. is shifted to higher frequency by 1.5 cm'1 when going from
orthorhombic I to monoclinic {201} form.
The low frequency Raman spectra of n-C36H74 recorded at 297K show bands at 66.1 cm'1
and 68.8 cm'1 ascribed to the first order of the L.A.M., respectively for the sample in
orthorhombic I and monoclinic {011} forms. The first order of the L.A.M. is shifted to
99

Chapter III / Short chain n-alkane crystals : n-C44H90
higher frequency by 2.7 cm'1 when going from orthorhombic I to monoclinic {011}
form.
Strobl and Eckel57 reported the frequency of the first order of the L.A.M. for n-C44H90
crystals in orthorhombic I form at 55.7 cm'1.
Figure 111.44 shows the low frequency Raman spectrum of sample B recorded at room
temperature. In the spectrum, the bands indicated by an asterisk are assigned to cosmic
ray spikes. The first order of the L.A.M. is observed at 58.1 cm'1. A shift to higher
frequency of 2.4 cm'1 is found, comparing our result with that of Strobl and Eckel. This
shift is comparable with the one found by Khoury et al. for n-C36H74 crystals in
orthorhombic I and monoclinic {011} forms.
III.4.3.5 Sample C : 0.325% in solution, crystallised at 25°C directly on the KBr plate.
Photogragh III.2 :
The study of sample C under an optical microscope using white light and a
magnification of 500 gave us additional information on the macroscopic structure of this
sample. In photograph III.2, the white horizontal line corresponds roughly to 50 pm.
Photograph III.2 shows some lozenge shaped crystals formed by monolayers (by
monolayers we mean only that the thickness is uniform all over the crystal surface,
although the crystals are not necessarily one molecule thick). This structure is believed
to be adopted by crystals in orthorhombic II form. Also, aggregates of crystals are seen
at the bottom of photograph III.2.
100

Chapter III / Short chain n-alkane crystals : n-C44H90
III.4.3.5.a Wagging mode region.
Figure 111.45 : F.T.I.R. spectra of sample C as a function of temperature, after baseline subtraction
0.0065
8
•a
0.0060-
0.00550.0050
0.0045-0.0040-
0.00350.0030-
0.0025-
0.0020-
0.0015
0.0010-0.0005-0.0000 I I I I
1390 1380 1370 1360 1350
wavenumbers1340
As can be seen from the photograph III.2, sample C is not homogeneous. Crystals were
not covering all the area of the incident infrared beam. Also, the thickness of this sample
was small. These points explain the poor quality of these spectra. Nevertheless, it can be
remarked that none of the bands related to any rotational isomers are intense enough to
be clearly distinguished in these spectra recorded at higher temperatures. The alkane
chains seem to be in an all-trans conformation.
Figure 111.45 shows a clear decrease of the intensity of the band at 1384 cm'1 between
40°C and 67°C. Above 67°C, the intensity of the band at 1378 cm'1 increases.
Second derivatives, deconvolutions and curve fitting procedures have been used to
determine with accuracy the frequency and area of the different bands present in the
spectra. The result of this work is shown in Table III.6.
101

Chapter III / Short chain n-alkane crystals : n-C44H90
Table III.6 : Curve fitting results obtained from the infrared spectra of sample C recorded at elevated temperatures
T=40°C T=67°C T=79°Ccm'1 area cm'1 area cm'1 area
1387.6 0.002 1387.6 0.002 1387.6 0.0021383.7 0.023 1383.3 0.013 1383.3 0.0111377.3 0.037 1377.5 0.035 1377.9 0.0421370.7 0.007 1370.7 0.006 1370.7 0.009
In Figure 111.46 the scaled areas of the major bands are drawn versus the temperature,
confirming the observations reported above.
Figure 111.46 : Scaled areas of the major infrared bands as a function of temperature
1.0 -
0.9-
0.8 -
1rQ§ °-6:
^ 0.5-
^ 0.4-
0.3-— Band 1383.5 ‘— Band 1377.50.2 -
0.060 65 80 8535 50 55 70 7540 45
temperature in °C
102
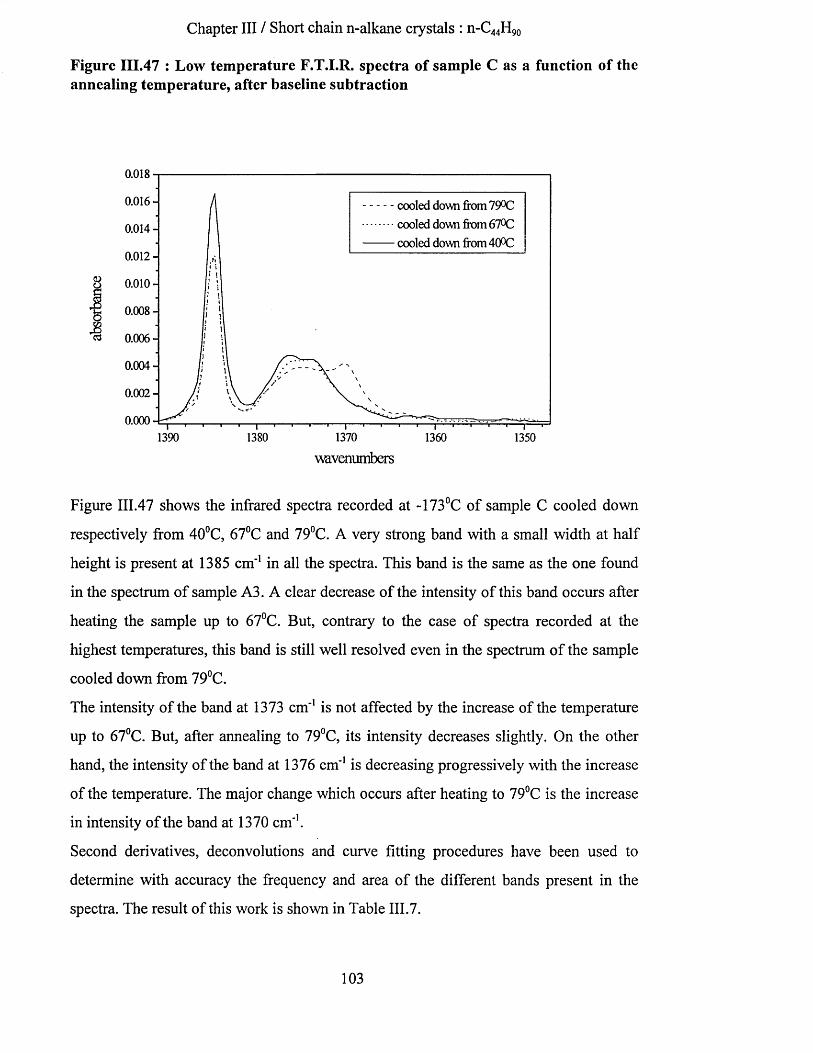
Chapter III / Short chain n-alkane crystals : n-C44H90
Figure 111.47 : Low temperature F.T.I.R. spectra of sample C as a function of the annealing temperature, after baseline subtraction
0.018
0.016- cooled down from 79°C cooled down from 67°C cooled down from 40°C
0.014-
0.012 -
0.008-&£ 0.006-co
0.004-
0.002 -
0.0001390 1380 1370 1360 1350
wuvenumbers
Figure 111.47 shows the infrared spectra recorded at -173°C of sample C cooled down
respectively from 40°C, 67°C and 79°C. A very strong band with a small width at half
height is present at 1385 cm'1 in all the spectra. This band is the same as the one found
in the spectrum of sample A3. A clear decrease of the intensity of this band occurs after
heating the sample up to 67°C. But, contrary to the case of spectra recorded at the
highest temperatures, this band is still well resolved even in the spectrum of the sample
cooled down from 79°C.
The intensity of the band at 1373 cm'1 is not affected by the increase of the temperature
up to 67°C. But, after annealing to 79°C, its intensity decreases slightly. On the other
hand, the intensity of the band at 1376 cm'1 is decreasing progressively with the increase
of the temperature. The major change which occurs after heating to 79°C is the increase
in intensity of the band at 1370 cm'1.
Second derivatives, deconvolutions and curve fitting procedures have been used to
determine with accuracy the frequency and area of the different bands present in the
spectra. The result of this work is shown in Table III.7.
103
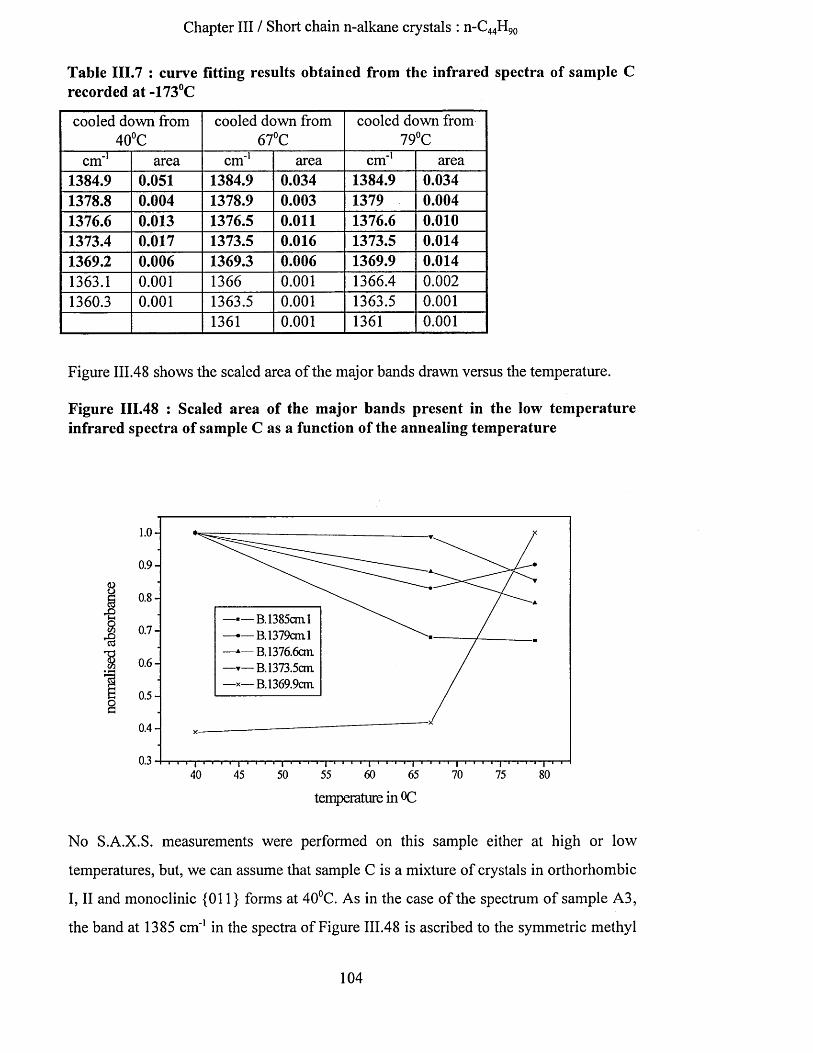
Chapter III / Short chain n-alkane crystals : n-C44H90
Table III.7 : curve fitting results obtained from the infrared spectra of sample C recorded at -173°C
cooled down from 40°C
cooled down from 67°C
cooled down from 79°C
cm'1 area cm'1 area cm'1 area1384.9 0.051 1384.9 0.034 1384.9 0.0341378.8 0.004 1378.9 0.003 1379 0.0041376.6 0.013 1376.5 0.011 1376.6 0.0101373.4 0.017 1373.5 0.016 1373.5 0.0141369.2 0.006 1369.3 0.006 1369.9 0.0141363.1 0.001 1366 0.001 1366.4 0.0021360.3 0.001 1363.5 0.001 1363.5 0.001
1361 0.001 1361 0.001
Figure 111.48 shows the scaled area of the major bands drawn versus the temperature.
Figure 111.48 : Scaled area of the major bands present in the low temperature infrared spectra of sample C as a function of the annealing temperature
1.0 -
0.9-
i1
0.6 -
— — B. 1385cm 1 — B. 1379cm 1 —A— B. 1376.6cm —▼— B. 1373.5cm —x— B. 1369.9cm
0.5-
0.4-
60 65 70 8040 45 50 55 75
temperature in °C
No S.A.X.S. measurements were performed on this sample either at high or low
temperatures, but, we can assume that sample C is a mixture of crystals in orthorhombic
I, II and monoclinic {011} forms at 40°C. As in the case of the spectrum of sample A3,
the band at 1385 cm'1 in the spectra of Figure 111.48 is ascribed to the symmetric methyl
104
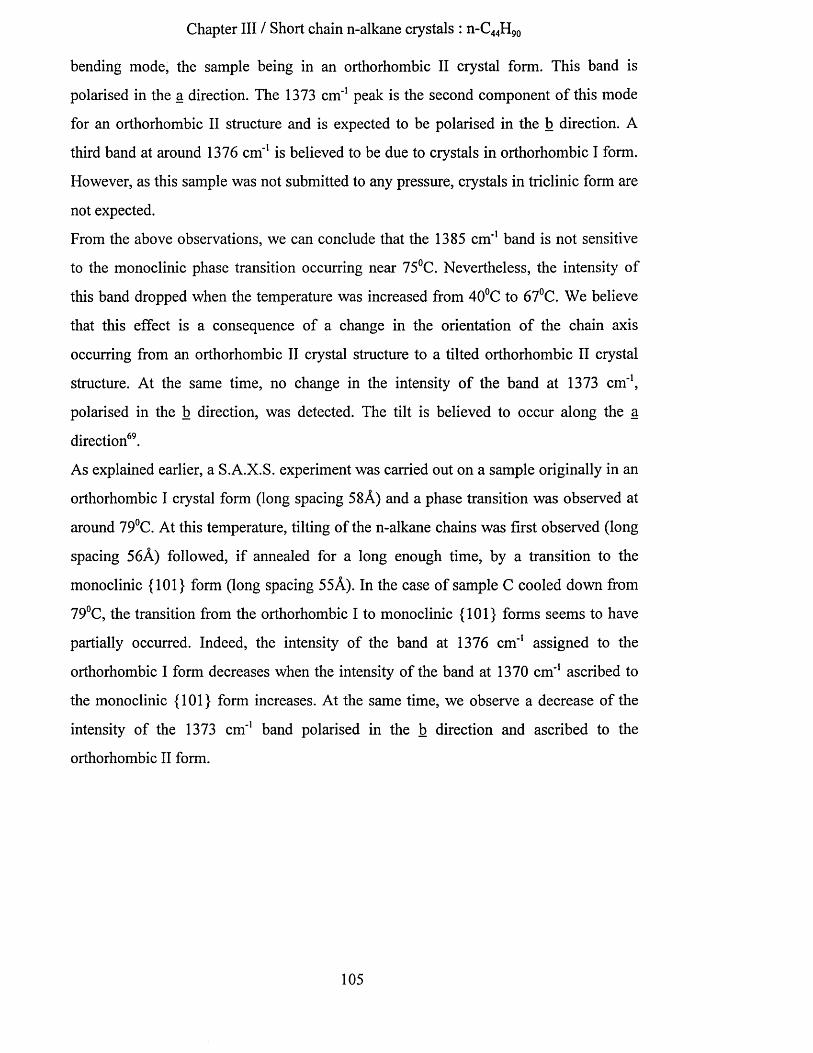
Chapter III / Short chain n-alkane crystals : n-C44H90
bending mode, the sample being in an orthorhombic II crystal form. This band is
polarised in the a direction. The 1373 cm'1 peak is the second component of this mode
for an orthorhombic II structure and is expected to be polarised in the b direction. A
third band at around 1376 cm'1 is believed to be due to crystals in orthorhombic I form.
However, as this sample was not submitted to any pressure, crystals in triclinic form are
not expected.
From the above observations, we can conclude that the 1385 cm'1 band is not sensitive
to the monoclinic phase transition occurring near 75°C. Nevertheless, the intensity of
this band dropped when the temperature was increased from 40°C to 67°C. We believe
that this effect is a consequence of a change in the orientation of the chain axis
occurring from an orthorhombic II crystal structure to a tilted orthorhombic II crystal
structure. At the same time, no change in the intensity of the band at 1373 cm'1,
polarised in the b direction, was detected. The tilt is believed to occur along the a
direction69.
As explained earlier, a S.A.X.S. experiment was carried out on a sample originally in an
orthorhombic I crystal form (long spacing 5 8A) and a phase transition was observed at
around 79°C. At this temperature, tilting of the n-alkane chains was first observed (long
spacing 5 6A) followed, if annealed for a long enough time, by a transition to the
monoclinic {101} form (long spacing 55 A). In the case of sample C cooled down from
79°C, the transition from the orthorhombic I to monoclinic {101} forms seems to have
partially occurred. Indeed, the intensity of the band at 1376 cm"1 assigned to the
orthorhombic I form decreases when the intensity of the band at 1370 cm'1 ascribed to
the monoclinic {101} form increases. At the same time, we observe a decrease of the
intensity of the 1373 cm'1 band polarised in the b direction and ascribed to the
orthorhombic II form.
105

Chapter III / Short chain n-alkane crystals : n-C44H90
III.4.3.5.b Methyl rocking mode region.
Figure 111.49 : Methyl rocking mode region of the low temperature infrared spectra of sample C as a function of the annealing temperature, after baseline subtraction
0.008
cooled down from 79°C cooled down from 67°C cooled down from 40°C0.006-
§0.004-
om%
0.002-
0.000900 895 890 885 880 875
wavenumbers
Figure III.49 shows the methyl rocking mode region of the infrared spectra recorded at
-173°C of sample C cooled down from 40°C, 67°C and 79°C. The major band of this
region is the one at 889 cm"1 in the spectrum of sample C cooled down from 40°C and
67°C. A very small shift of this band towards lower frequencies (888 cm"1) is
accompanied by a small decrease of its intensity after cooling down from 79°C. In the
spectrum of sample C cooled down from 40°C, a clear shoulder at 893 cm"1 is present.
Its intensity first drops by around half its value after heating up to 67°C and then,
increases again after heating up to 79°C.
From the above observations, we ascribed the band at 889 cm"1 to the orthorhombic II
crystal structure. This band is believed to be polarised in the b direction. We ascribed
the band at 893 cm"1 present in the spectra of sample C cooled down from 40°C and
67°C to the second component of the methyl rocking mode in the orthorhombic II
crystal structure. This band is believed to be polarised in the a direction.
106(
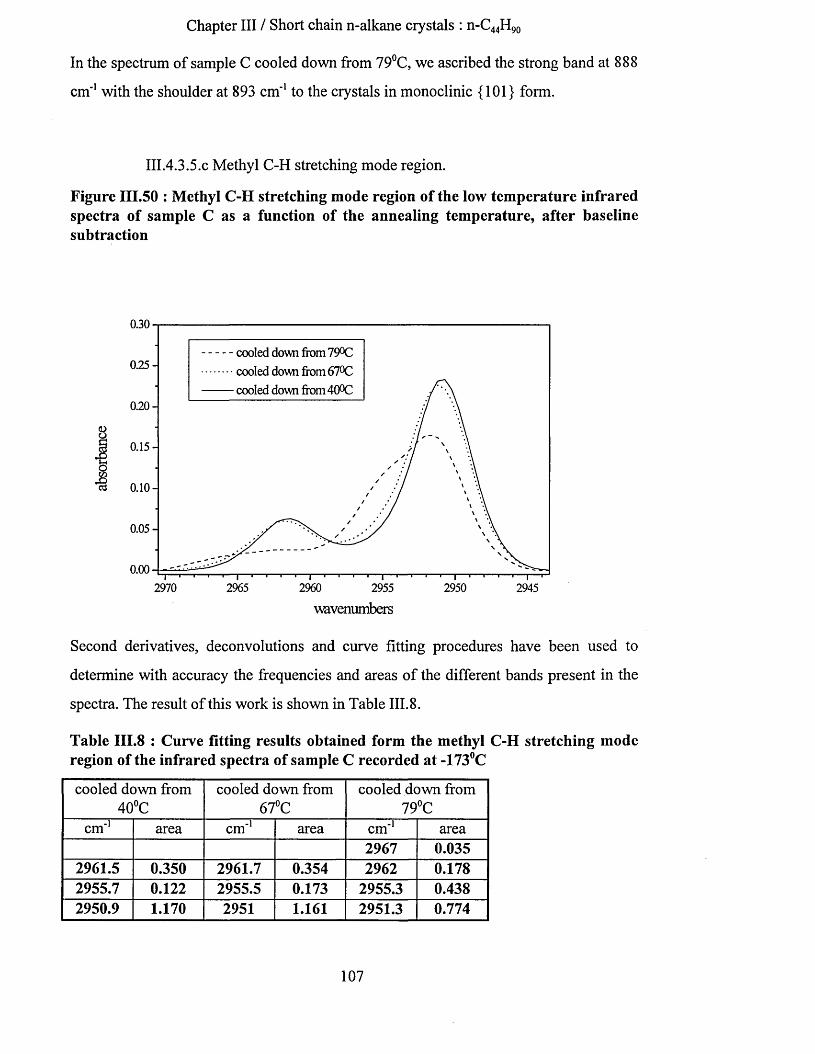
Chapter III / Short chain n-alkane crystals : n-C44H90
In the spectrum of sample C cooled down from 79°C, we ascribed the strong band at 888
cm'1 with the shoulder at 893 cm'1 to the crystals in monoclinic {101} form.
III.4.3.5.C Methyl C-H stretching mode region.
Figure 111.50 : Methyl C-H stretching mode region of the low temperature infrared spectra of sample C as a function of the annealing temperature, after baseline subtraction
0.30
cooled down from 79°C cooled down from 67°C cooled down from 40°C
0.25-
0.20 -
a§ 0.15 -
oJ3ca 0.10-
0.05-
0.002970 2965 2960 2955 2950 2945
'wavenumbers
Second derivatives, deconvolutions and curve fitting procedures have been used to
determine with accuracy the frequencies and areas of the different bands present in the
spectra. The result of this work is shown in Table III.8.
Table III.8 : Curve fitting results obtained form the methyl C-H stretching mode region of the infrared spectra of sample C recorded at -173°C
cooled down from 40°C
cooled down from 67°C
cooled down from 79°C
cm'1 area cm'1 area cm'1 area2967 0.035
2961.5 0.350 2961.7 0.354 2962 0.1782955.7 0.122 2955.5 0.173 2955.3 0.4382950.9 1.170 2951 1.161 2951.3 0.774
107
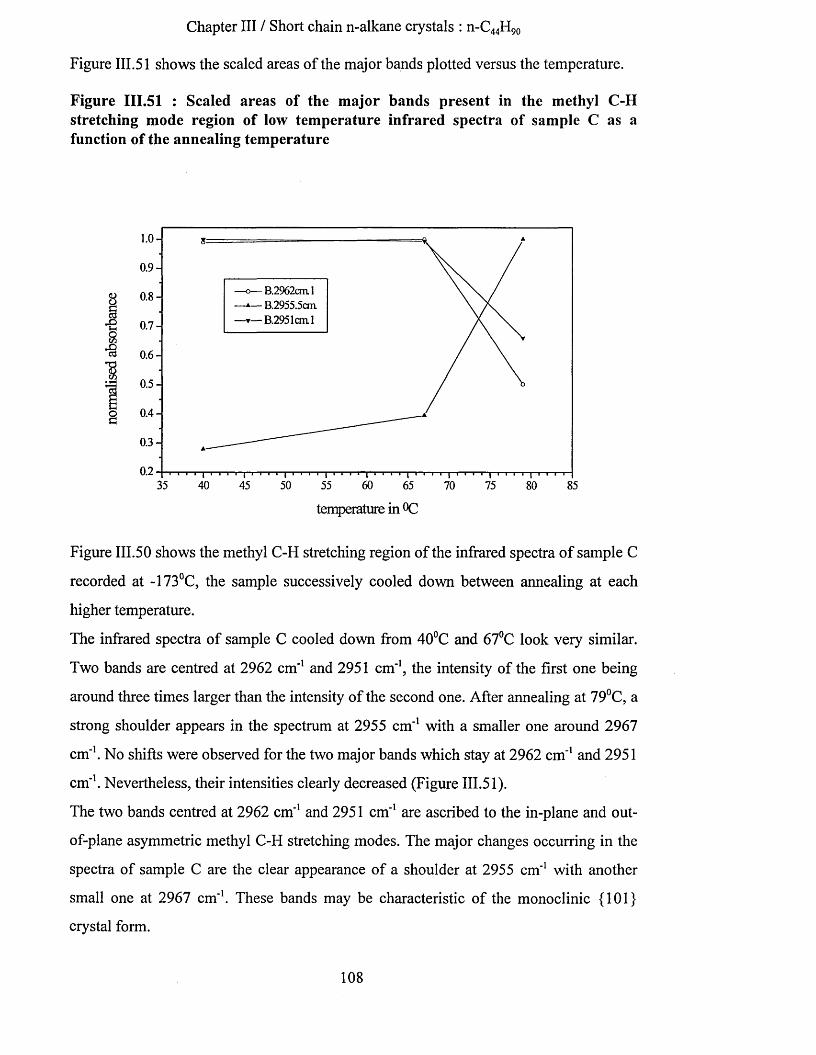
Chapter III / Short chain n-alkane crystals : n-C44H90
Figure III.51 shows the scaled areas of the major bands plotted versus the temperature.
Figure 111.51 : Scaled areas of the major bands present in the methyl C-H stretching mode region of low temperature infrared spectra of sample C as a function of the annealing temperature
1.0-
0.9-
>— B.2962cml k— B.2955.5cm r— B.2951cml
g 0.8-
- e 0 .7 - g
0.6 -
0.5-
0.4-
0.3-
0.235 50 6040 45 55 65 70 8575 80
temperature in °C
Figure 111.50 shows the methyl C-H stretching region of the infrared spectra of sample C
recorded at -173°C, the sample successively cooled down between annealing at each
higher temperature.
The infrared spectra of sample C cooled down from 40°C and 67°C look very similar.
Two bands are centred at 2962 cm'1 and 2951 cm'1, the intensity of the first one being
around three times larger than the intensity of the second one. After annealing at 79°C, a
strong shoulder appears in the spectrum at 2955 cm'1 with a smaller one around 2967
cm'1. No shifts were observed for the two major bands which stay at 2962 cm'1 and 2951
cm'1. Nevertheless, their intensities clearly decreased (Figure 111.51).
The two bands centred at 2962 cm'1 and 2951 cm'1 are ascribed to the in-plane and out-
of-plane asymmetric methyl C-H stretching modes. The major changes occurring in the
spectra of sample C are the clear appearance of a shoulder at 2955 cm'1 with another
small one at 2967 cm'1. These bands may be characteristic of the monoclinic {101}
crystal form.
108

Chapter III / Short chain n-alkane crystals : n-C44H90
III.4.3.5.d Raman spectroscopy.
Figure 111.52 : Low frequency Raman spectrum of sample C recorded at room temperature
7000
6500
6000
5500
£ 5000
4500LA.M.1 60.3 cm-14000
3500
—i i i i l i i i i I i i i i i i i i i I—3000200 160 80180 120 100 60140 40 20
Delta Wavenumbers
Figure 111.52 shows the low frequency Raman spectrum of a single n-C44H90 crystal
recorded at room temperature. In the spectrum, the bands indicated by an asterisk are
assigned to cosmic ray spikes. The frequency of the first order of the L.A.M. is found at
60.3 cm'1. Due to the poor quality of this spectrum, this last value should be taken with
some care. Nevertheless, compared to Strobl and Eckel’s value for a sample in the
orthorhombic form, a shift to higher frequencies of 4.6 cm'1 is observed. So, the crystal
structure of sample C is unlikely to be orthorhombic. Moreover, this frequency is 2.2
cm'1 higher than the one found for sample B, which is supposed to be in a monoclinic
{011} form. Also, splitting of the L.A.M. has been reported69 in the case of crystalline
n-alkanes in orthorhombic II form. Again, the poor quality of the spectrum may not
allow its detection here.
109

Chapter III / Short chain n-alkane crystals : n-C44H90
III.4.3.6 n-C44H90 in liquid state.
Crystals of n-C44H90 were annealed to 87°C. At this temperature, this n-alkane is in the
liquid state. An infrared spectrum was recorded at 87°C and the wagging mode region,
characteristic of specific gauche conformers, is shown in Figure 111.53.
Figure 111.53 : F.T.I.R. spectrum of liquid n-C44H90 recorded at 87°C
0.10
0.09- gtg/gtg1 conformers
^ gg conformers0.08-
0.07-
0.06-§
0.05-
01
0.04-
0.03-
0.02 -
0.01 -
0.00 -
1390 1380 1370 1360 1350 1340 1330 1320 1310 1300 1290 1280 1270 1260
wavenumbers
Second derivatives, deconvolutions and curve fitting procedures have been used to
determine with accuracy the frequency and area of the different bands present in the
spectra. The result of this work is shown in Table III.9 where it is compared with the
result obtained from the spectrum of sample A l recorded at 83°C.
110

Chapter III / Short chain n-alkane crystals : n-C44H90
Table III.9 : Curve fitting result obtained from the infrared spectrum of n-C44H90 recorded at 87°C compared with the result obtained from the spectrum of sample A l recorded at 83°C.
83°C 87°Ccm'1 area cm'1 area
1386.1 0.305 1385 0.0331378.2 2.300 1377.9 0.6061370.6 0.324 1367.9 0.7251365.4 0.243 1361 0.2381358.8 0.1511351.3 0.090 1352.1 0.7821341.6 0.163 1340.9 0.314
In the two cases, the sample areas, the thicknesses, the temperature at which the spectra
were recorded and the physical states were different. We can observe that the integrated
absorbance of the bands at around 1378 cm'1, assigned to the methyl symmetric bending
mode, is approximately four times greater in the spectrum of n-C44H90 recorded at 83°C
than in the spectrum recorded at 87°C. In order to compare the two spectra, we chose to
use the methyl symmetric bending band as an internal standard. Then, we can ratio its
integrated absorbance against that of the band at 1341 cm'1. This ratio is respectively
equal to 1.93 and 14.13 in the case of n-C44H90 annealed at 83°C and 87°C. From this
result, we can conclude that there are approximately 7 times more end-gauche
conformers in the liquid state than at 83°C, where the sample Al was found to be in a
monoclinic {101} crystal form.
I l l
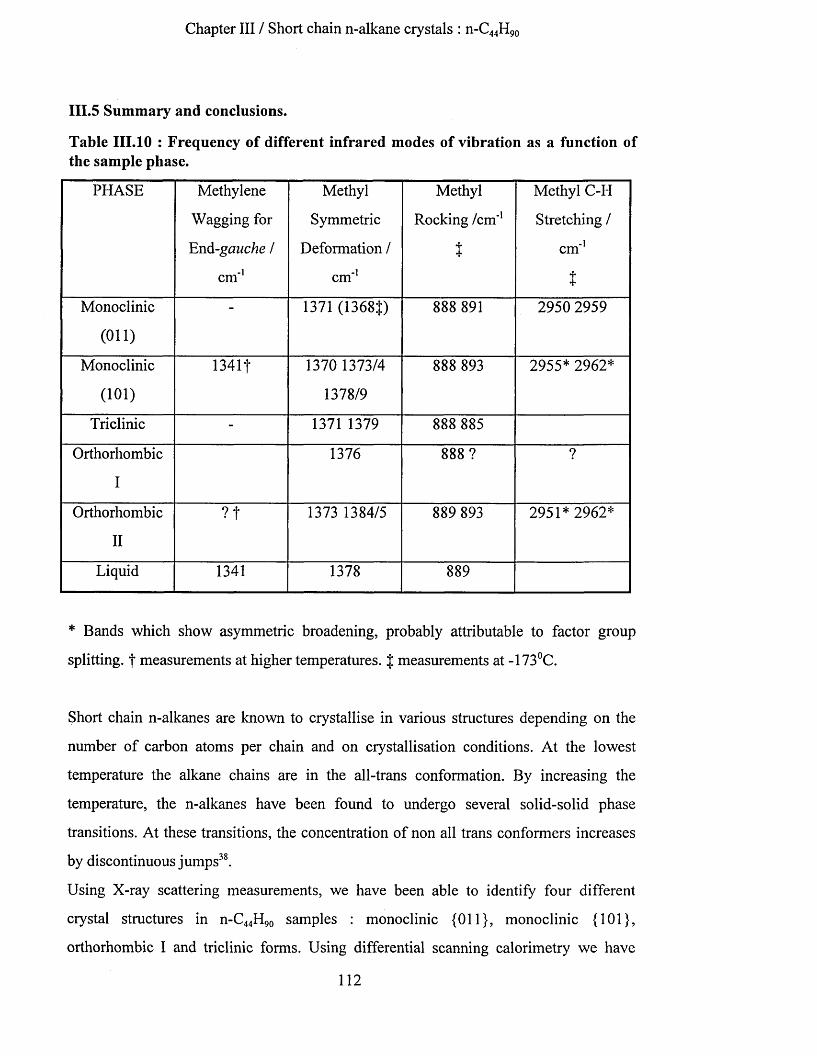
Chapter III / Short chain n-alkane crystals : n-C44H90
III.5 Summary and conclusions.
Table 111.10 : Frequency of different infrared modes of vibration as a function of the sample phase.
PHASE Methylene
Wagging for
End -gauche /
cm'1
Methyl
Symmetric
Deformation /
cm'1
Methyl
Rocking /cm'1
t
Methyl C-H
Stretching /
cm'1
t
Monoclinic
(Oil)
1371 (1368J) 888 891 2950 2959
Monoclinic
(101)
1341f 1370 1373/4
1378/9
888 893 2955* 2962*
Triclinic - 1371 1379 888 885
Orthorhombic
I
1376 888 ? ?
Orthorhombic
II
? f 1373 1384/5 889 893 2951* 2962*
Liquid 1341 1378 889
* Bands which show asymmetric broadening, probably attributable to factor group
splitting. | measurements at higher temperatures. { measurements at -173°C.
Short chain n-alkanes are known to crystallise in various structures depending on the
number of carbon atoms per chain and on crystallisation conditions. At the lowest
temperature the alkane chains are in the all-trans conformation. By increasing the
temperature, the n-alkanes have been found to undergo several solid-solid phase
transitions. At these transitions, the concentration of non all trans conformers increases
by discontinuous jumps38.
Using X-ray scattering measurements, we have been able to identify four different
crystal structures in n-C44H90 samples : monoclinic {Oil}, monoclinic {101},
orthorhombic I and triclinic forms. Using differential scanning calorimetry we have
112

Chapter III / Short chain n-alkane crystals : n-C44H90
determined the temperature at which the solid-solid phase transition between the
monoclinic {011} and the monoclinic {101} forms occurs. We have also shown that
different crystal forms present in the same sample could be differentiated in a
thermogram by the difference of their melting temperatures.
Thus, knowing the crystal structures of some of our n-C44H90 samples, we have
undertaken the study of n-C44H90 by the means of infrared and Raman spectroscopy. The
different infrared active modes of vibration involving the methyl groups have shown a
strong sensitivity to the n-alkane crystal structure (see Table III. 10). Measurements
made at the lowest temperature (-173°C) have uncovered the multi-component character
of most of these modes66,67,39 , polarised along the different axes of the crystal unit cell.
Splittings of the band progressions assigned to different methylene modes of vibration
has been observed too. The changes observed in the relative intensities of band
components gives a tool to study the processes involved in the solid-solid phase
transitions in crystalline n-alkanes. For example, tilting of the n-alkane chains inside
crystals in the orthorhombic II form has been suggested responsible for the observed
changes in intensity of the a and b polarised bands at 1385 cm*1 and 1373 cm*1, ascribed
to the methyl symmetric bending mode. Thus, this study shows that phase transitions
occurring in n-C44H90 can be identified using infrared spectroscopy. Moreover, we can
observe changes outside the transition regions and monitor the presence of gauche
conformers at particular positions along the molecules. Also, these results confirm in the
case of short chain crystalline n-alkanes, the close relationship between the packing of
the methyl end groups and the crystal structure. Methyl end group vibrations can be
considered as a powerful conformational probe in the structural study of hydrocarbon
chain compounds.
Low frequency Raman spectra of n-C44H90 in monoclinic {101} and orthorhombic II
crystal structures have been recorded. Differences in the position of the first order of the
Longitudinal Acoustic Mode have been observed. The frequency at which the L.A.M.
occurs is also sensitive to the n-alkane crystal structure.
We have taken a particular interest in the wagging mode region of the infrared spectra.
At the lowest temperature, the symmetric methyl bending mode was found in the region
between 1385 cm*1 and 1368 cm*1. Snyder39 reports frequencies ranging between 1380
113

Chapter III / Short chain n-alkane crystals : n-C44H90
cm'1 and 1360 cm'1. This region overlaps the band at 1369 cm'1 ascribed to the wagging
mode of methylene groups involved in gtg and gtg’ conformers. This is relevant to
studies where the aim is the estimation of disorder in hydrocarbon chain compounds.
Also, the band progressions assigned to the different methylene modes of
vibrations,66,67,39 and observed in the infrared spectra of crystalline n-C44H90, may be used
to determine the number of methylene groups, and therefore, the number of carbon
atoms involved in this co-operative motion characteristic of n-alkane chains in an all
trans conformation. This additional information could be compared to the value of the
average layer periodicity determined by S.A.X.S. experiments and to the number of
carbon atoms ascribed to the Longitudinal Acoustic Modes determined by low
frequency Raman spectroscopy.
On the other hand, at the highest temperatures, the methyl and methylene modes present
in the infrared spectra of n-C44H90 shown non-resolved and broader components. At the
same time, additional bands ascribed to gauche conformers are observed. In the solid
state, the gauche conformers observed are situated at the ends of the n-alkane chains38.
At the phase transition between the two monoclinic forms, the concentration of end
gauche conformers, proportional to the area of the infrared band at 1342 cm'1, increases
abruptly. The chain end disorder is an essential characteristic of the solid-solid phase
transition process.
Finally, in the liquid state, gtg and gtg’ conformers, ascribed to the infrared band at
1369 cm'1, are observed in addition to the end-gauche conformers. The number of end-
gauche conformers present in liquid state at 87°C is found to be approximately 7 times
greater than in crystals in a monoclinic {101} form at 83°C. This ratio was determined
using the integrated absorbance of the band present at 1378 cm'1 assigned to the methyl
symmetric bending mode and used as an internal standard. In the infrared spectra
recorded at high temperature, the 1378 cm'1 band is at a high enough frequency to
differentiate it from any methylene wagging modes.
114

Chapter IV / Pure long chain n-alkanes : n-C198H398 and n-C246H494
IV PURE LONG CHAIN N-ALKANES : N-C198H398 AND N-C246H494
IV. 1 Background.
Polymers usually crystallise from either melt or solution in thin and lamellar-shaped
crystals with their long chains passing several times through the crystal layers by means
of chain folding. In the case of polyethylene for example, inside each crystal layer, the
polymer chains are parallel to each other and preferentially adopt an all-trans
conformation. The lamellar thickness is typically between 100 and 200 carbon atoms.
On the contrary, short molecules do not crystallise by chain folding.
Fifteen years ago, purely uniform long chain n-alkanes having 102, 150, 198, 246 and
390 carbon atoms were synthesised by Bidd and Whiting78 and became available in
small quantities (hundreds of mg). Among these materials, the n-alkane with the
shortest chain length was found to crystallise only in extended form. On the contrary,
materials from 150 up to 390 carbon atoms per chain were found to crystallise by chain
folding with up to four folds per chain in the case of the longest n-alkane available16.
The thickness of the n-alkane crystal layers was found to depend on the crystallisation
temperature as in the case of polymers. However, the thickness was found to take some
discrete values equal to the extended chain length of the molecule divided by an integer
n, with n < 5. Thus, in the case of long chain n-alkanes crystallised from solution, the
crystallisation temperature, the concentration of the solution and the solvent used are
three parameters which are used to control the alkane chain conformation46,79.
Using two complementary techniques, low frequency Raman spectroscopy and Small
Angle X-ray Scattering, it was shown that the fold is sharp and thus, adjacently re
entrant with the end groups at the crystal surface16,18,54. The crystals preferentially adopt
an orthorhombic subcell structure with the chains in an all-trans conformation. These
materials were found to be nearly totally crystallised. Also Organ and Keller31, using
electron microscopy on n-C198H398 crystallised from solution in once folded form,
reported that crystals preferentially adopted a lozenge shaped morphology with the folds
along the {110} direction.
115

Chapter IV / Pure long chain n-alkanes : n-C198H398 and n-C246H494
These long chain n-alkanes are a link between short molecules and polymers. They are
an ideal model to study polymer crystallisation and, more generally, any complex
system containing hydrocarbon chains such as biological membranes, phospholipids or
fatty acids.
In this work, our aim was to study, by means of vibrational spectroscopy, disorder in
these highly ordered materials which are purely monodisperse long chain n-alkanes.
Infrared spectroscopy has been intensively used elsewhere to identify and quantify
conformational disorder present in paraffinic materials. For example, infrared
spectroscopy has been used to study changes in disorder through premelting phase
transitions occurring in odd n-alkanes from n-C17H36 through to n-C29H6038. Also, the
distribution of defects along the hydrocarbon chains can be studied. Thus, Maroncelli,
Strauss and Snyder49 reported the non-uniform distribution of defects along the chains of
n-C21H44 and n-C29H60 crystals. They showed that the number of gauche conformations
increases exponentially toward the chain ends. Using Molecular Dynamics simulations,
Wunderlich et al.80 reported especially the positional disorder and the distribution of end
gauche defects within crystals of long methylene sequences under different
experimental conditions. They related the higher concentration of gauche defects at the
chain ends to the diffusion of the chains along their long axes.
A recent computer modelling study of the {110} adjacent re-entry fold in polyethylene
molecules has been done by Chum et al.37. They reported five lowest energy fold
conformations within a range of just 1.7 kcal/mol. The second lowest energy fold
conformation, within 1 kcal/mol of the lowest one (approximately ggg’g’tg’), had the
same number of gauche conformations but in different positions. These results show
that more than one {110} fold type may be present in polyethylene crystals and, thus, in
long chain n-alkane crystals. Using atomic force microscopy, Patil and Reneker36
examined folded chain lamellar crystals of polyethylene. Folds with different
orientations and structures were detected. In earlier works by Frank81, Flory82 or
Bassett83 discussions about the different arrangements of folds within polymer crystals
were made without direct experimental evidence about the folds. In particular, Frank
demonstrated the impossibility of a fold involving solely trans and gauche bonds.
116

Chapter IV / Pure long chain n-alkanes : n-C198H398 and n-C246H494
In this chapter, we report studies of the degree of disorder in different uniform long
chain n-alkanes crystallised from solution by means of vibrational spectroscopy. The
wagging mode region between 1260 cm'1 and 1400 cm'1, well known to contain
localised modes of vibrations ascribed to methylene groups involved in non all-trans
planar zigzag chain conformations, was investigated. In order to minimise the thermal
population of defects within n-alkane crystals, FTIR measurements were done at the
same low temperature, -173°C, using a cryostat cooled down with liquid nitrogen.
Infrared spectra of n-C198H398 crystallised in once folded and extended forms were
analysed after annealing at different higher temperatures. The tilting of the once folded
n-C198H398 alkane chains from the crystal surfaces was determined using both S.A.X.S.
and low frequency Raman spectroscopy. The identification of the progression bands
assigned to the C-C stretching modes of vibration and observed between 1133 cm'1 and
1050 cm'1 in the low temperature infrared spectra of these long chain n-alkanes is used
to estimate the number of carbon atoms involved in this co-operative motion
characteristic of n-alkane chains in all-trans conformation. In chapter III, we have
shown that most of the infrared bands present in the spectrum of n-C44H90 and assigned
to vibrations involving methyl end groups were sensitive (in terms of both frequency
and intensity) to crystal structures and tilting of the alkane chains. In particular, the
methyl symmetric bending mode was found in a frequency range between 1384 cm'1 and
1368 cm'1. This band is found at 1377 cm'1 in the infrared spectra of crystals in an
orthorhombic structure. Therefore, the consideration of this methyl mode of vibration
for spectral normalisation must involve an awareness of its conformational sensitivity to
chain end environments. In this chapter, exclusively dedicated to long chain n-alkanes in
an orthorhombic subcell structure, the methyl symmetric bending mode is found at 1377
cm'1. Nevertheless, tilting of the alkane chains and the transition from once folded to
extended forms may affect the chain ends environment or the crystal surfaces and,
therefore, affect the absorbance of this last band. When normalisation was not needed,
we tried to find the infrared band which was least affected by structural changes. Among
these bands, the one present at 2670 cm'1 has been chosen. When normalisation was
needed and when low temperature (-173°C) infrared spectra were available, we used the
integrated area of the band present at 2670 cm'1 in these spectra as an internal standard.
117

Chapter IV / Pure long chain n-alkanes : n-C198H398 and n-C246H494
Its integrated area was also used to normalise the spectra recorded at the highest
temperatures. When low temperature spectra were not available, we used the methyl
symmetric bending mode as an internal standard. Also, in this chapter, spectral
subtraction was used to obtain a “ fold “ spectrum. This lead to an evaluation of the
different conformations composing the fold. Moreover, an estimate of the number of
specific conformations per molecule is presented in the case of n-C198H398 crystallised in
once folded and extended forms. Finally, the transformation to the extended form of n-
C246H494 originally crystallised in once folded form is reported.
IV.2 Experimental section.
IV.2.1 F.T.I.R.
Transmission infrared spectra were recorded between 700 cm'1 and 4000 cm'1 with 1
cm'1 resolution and 200 scans using a computerised (First version 1.70 software)
Mattson Galaxy 6020 F.T.I.R. spectrometer based on a Michelson interferometer
equipped with a cooled pyroelectric detector doped with mercury cadmium telluride.
Samples held between two potassium bromide plates were installed in a Graseby/Specac
cryostat P/N21500 equipped with a heating cell and a temperature controller P/N20120.
A vacuum pump allowed the cryostat to be evacuated, enabling us to work in a
temperature range between -173°C and 140°C at 7 . 1°C.
Infrared spectra were recorded for samples successively annealed at higher temperatures
and then cooled down to -173°C. In this process, the cooling rate was 10°C/minute.
IV.2.2 Raman spectroscopy.
Low frequency Raman spectra were recorded at room temperature between 550 cm'1 and
5 cm'1 on a Dilor XY triple monochromater spectrometer equipped with a 514.5 nm
Laser source, a variable slit aperture and a CCD detector. These measurements were
done at the Technical University of Warsaw (measurements by Dr S. J. Spells and Dr
W. Gembicki).
118
Chapter IV / Pure long chain n-alkanes : n-C198H398 and n-C246H494
Also, Raman spectra between 3790 cm'1 and 400 cm*1 using 4 cm*1 resolution were
recorded at room temperature on a Renishaw Ramanscope 2000 spectrometer equipped
with a 514.5 nm Laser source, a microscope sample stage with a magnification of 200
and a CCD detector.
IV.2.3 Small Angle X-ray Scattering.
We used a Rigaku-Denki instrument with a copper Ka X-ray tube, a sample holder,
pinhole collimation (diameter 0.3mm) and a camera. The camera was under vacuum and
comprised a photographic film holder in front of which was fixed a beam stop. The
distance between the sample and the photographic films was measured. These
measurements were done in the Department of Engineering Materials, University of
Sheffield (courtesy of Dr. G. Ungar).
IV.2.4 Sample preparation.
Samples were synthesised by Brooke et al.17 We crystallised them from solution in
Aristar grade toluene and prepared them as follows:
(1) n-CI98H39g crystallised from 1.4% w/v solution in toluene at 73.2 7. 0.4 °C for 90
minutes to obtain crystals in the once folded chain conformation, and then filtered. The
resulting mat was allowed to dry before pressing (pressure applied over the sample
surface lower than 0.4 ton per cm2).
(2) n-C198H398 crystallised from 0.8% 7 V solution in toluene at 81.5 7. 0.4 °C for 6 hours
to obtain crystals in the extended chain conformation, and then filtered. The resulting
mat was allowed to dry before pressing (pressure applied over the sample surface lower
than 0.4 ton per cm2).
(3) n-C246H494 crystallised from 1.35% 7 V solution in toluene at 81.6 7. 0.4 °C for 90
minutes to obtain crystals in the once folded chain conformation, and then filtered. The
resulting mat was allowed to dry before pressing (pressure applied over the sample
surface lower than 0.4 ton per cm2).
Using Small Angle X-ray Scattering, we determined the average layer periodicity of the
different crystals, and so, the nature of their chain conformations. In addition to the
119
Chapter IV / Pure long chain n-alkanes : n-C,9gH398 and n-C246H494
crystal thickness, the average layer periodicity includes the thickness due to the fold or
due to any amorphous layers which may be present in the sample. Using the relationship
between carbon number and chain length reported by Broadhurst60, values of the crystal
thickness for n-C198H398 in once folded and extended chain conformations were
calculated and found to be equal respectively to 127 A and 254 A. The S.A.X.S. layer
periodicities corresponding respectively to samples (1) and (2) were found to be 124.7
7. 1.1 A and 253.3 7. 1.3 A. These values are in good agreement with the calculated
ones.
The calculated values of the crystal thickness for n-C246H494 in once folded and extended
chain conformations are respectively 158 A and 314 A. The layer periodicity
corresponding to sample (3) was found to be 158.6 7.1.7 A, in good agreement with the
calculated value for the once folded form.
IV.3 RESULTS.
IV.3.1 Sample (1) : n-C198H398 crystallised in once folded form.
IV.3.1.1 S.A.X.S. measurements.As noted above, the experimental layer periodicity was found to be in good agreement
with the calculated one. Therefore, within each crystal layer of sample (1), the alkane
chains are in the once folded form with the chain axis perpendicular to the crystal
surfaces.
IV.3.1.2 Raman spectroscopy Figure IV.54 shows the Raman spectrum of sample (1) recorded at room temperature
between 1650 cm'1 and 850 cm'1.
120

Chapter IV / Pure long chain n-alkanes : n-C198H398 and n-C246H494
Figure IV.54 : Raman spectrum of sample (1) recorded at room temperature between 1650 cm'1 and 850 cm'1
15000
14000
13000
12000
11000
10000
9000£.g 8000
7000
6000
5000
4000
3000
The Raman bands present in the spectrum of sample (1) shown in Figure IV.54 are
assigned in Table IV. 11 :
Table IV .ll : Assignment of the Raman bands present in the spectrum of sample (1)
1063 crrr1
1416cm-1
1462 cm-1
1600 1500 1400 1300 1200 1100 1000 900
Raman shift (crrr1)
Raman shift (cm'1) assignment
1462 methylene bending mode84
1440 methylene bending mode84
1416 methylene bending mode84, characteristic of the orthorhombic subcell packing85
1371 methylene wagging mode85
1295 in-phase methylene twisting mode40
1169 out-of-phase methylene rocking mode40
1129 in-phase C-C stretching mode40
1063 out-of-phase C-C stretching mode 85
121

Chapter IV / Pure long chain n-alkanes : n-C198H398 and n-C246H494
Additional bands at 1082 cm'1 and 1305 cm'1 (not detected here) present in the Raman
spectra of polyethylene were ascribed85 respectively to the out-of-phase C-C stretching
mode and in-phase methylene twisting mode involved in the non all-trans part of the
polymer chains.
In Figure IV.55, the C-H stretching region of the Raman spectrum of sample (1) is
shown.
Figure IV.55 : Raman spectrum of sample (1) recorded at room temperature between 3100 cm'1 and 2500 cm'1
32000-
28000-
24000-
20000-
2903 crrr11 16000-
12000-
8000-
4000
3100 3050 3000 2950 2900 2850 2800 2750 2700 2650 2600 2550 2500
Raman shift (cnr1)
The Raman active bands at 2847 cm'1 and 2881 cm'1 are ascribed86,87 respectively to the
symmetric and antisymmetric methylene C-H stretching modes. In this spectrum, the
intensity of the band at 2881 cm'1 is saturated. The bands present in the Raman spectrum
at 2903 cm'1 and 2929 cm'1 are also associated with the symmetric and antisymmetric
methylene C-H stretching modes but, in this case, are the result of Fermi resonance86,87.
A weak band at around 2721 cm'1 has not been assigned previously. In the C-H
2850 Istretching region, the ratio of the intensities of some of these bands (e.g.L
or 2890T■2930 A2850
have been used to study structure and conformational changes in hydrocarbon chain
systems such as polyethylene88 and biological membranes89.
122

Chapter IV / Pure long chain n-alkanes : n-C198H398 and n-C246H494
Also, no bands at around 1030 cm'1, 1604 cm'1 and 3056 cm'1, ascribed90 to fundamental
modes of vibration of toluene, were detected in these Raman spectra. This result
strongly suggests the absence of any trace of remaining solvent in the n-alkane samples.
IV.3.1.2.a Low frequency Raman spectrum.In Figure IV.56, the low frequency Raman spectrum of sample (1) recorded at room
temperature is shown.
Figure IV.56 : Low frequency Raman spectrum of sample (1) recorded at room temperature, shown after baseline subtraction
13000 12000 11000 10000 9000 8000
£* 7000 'cq 6000B 5000 ,S 4000
3000 2000 1000
0-1000 -2000
150 140 130 120 110 100 90 80 70 60 50 40 30 20
Raman shift (cm-1)
The first and third orders of the Longitudinal Acoustic modes of vibration are present at
respectively 25 cm'1 and 70.9 cm'1. These “accordion-like” modes of vibration were
discovered by Mizushima and Shimanouchi52. Since then, they have been used as a
complementary technique with S.A.X.S. measurements to determine the length of the
part of the n-alkane chain in an all trans conformation (called the stem) inside the
crystals of paraffinic compounds54,57. Using Av (in cm'1), the Raman shift of the first
order of the L.A. mode, the length of the all-trans stem LR (in A), characteristic of the
lamellar crystals can be determined using Equation IV.4854:
LA.M.3 70.9 crrr1
123

Chapter IV / Pure long chain n-alkanes : n-Ci98H398 and n-C246H494
Equation IV.48
_ 3169 R “ A -A v
The number of carbon atoms present in the all trans stem of length LR can be determined
using Equation IV.4960:
Equation IV.49
n c = ^ c 1.27
Thus, the number of carbon atoms involved in the all-trans stem characteristic of the
lamellar crystals of sample (1) was found to be equal to 98. The number of carbon
atoms within the n-C198H398 chain involved in this L.A. mode therefore corresponds to
almost exactly a half of the chain. Hence, inside the crystals of sample (1), the n-alkane
chains are in the once folded conformation.
IV.3.1.3 Conclusion.From the values of the average layer periodicity of the crystal layers determined by
S.A.X.S. and the number of carbon atoms involved in the extended part of the n-alkane
chains present in sample (1) determined by low frequency Raman spectroscopy, we
conclude that inside sample (1), the n-alkane chains are in the once folded conformation
with the chain axis perpendicular to the crystal surfaces and the folds exactly in the
middle of the chains.
IV.3.1.4 Tilting of the n-alkane chains.
IV.3.1.4.a Tilting as a function of the annealing temperature.By increasing the temperature above 90°C, the n-alkane chains present in the crystal
layers of sample (1) were expected to tilt from the crystal surfaces. Also, the tilt angle
was expected to increase with increasing temperature79. We used S.A.X.S.
measurements to determine the average layer periodicities of the sample (1) crystals
after annealing at each elevated temperature. We used low frequency Raman
spectroscopy to determine the frequency of the longitudinal acoustic mode, from which
the number of carbon atoms involved in this mode of vibration can be estimated22,54,57.
124
Chapter IV / Pure long chain n-alkanes : n-C198H398 and n-C246H494
Once the infrared spectra of sample (1) successively annealed at higher temperatures
and then cooled down to -173°C were all recorded, we used this final sample to perform
S.A.X.S. experiments and record the low frequency Raman spectrum. A different
sample was used to determine by S.A.X.S. measurements the layer periodicity of
sample (1) annealed at 95°C.
IV.3.1.4.a. 1 S.A.X.S. measurements.Sample (1) was annealed to 95°C and 110°C. At these temperatures the layer
periodicities were found to be equal respectively to 120.8 7. 0.8 A and 120.6 7. 0.7 A.
These values were determined using a densitometer to plot the intensity of the scattered
X-rays versus the distance from the centre of the photographic film. Then, we digitised
these plots (see Figure IV.57). Baselines were subtracted to remove the scattering
background and curve fitting procedures were used to determine with accuracy the
position of the maximum intensity of the peaks of diffraction (see Figure IV.57 for
example where the black curve represents the Lorentzian function used for the curve
fitting procedure). The distance between these peaks is directly related to the average
layer periodicity of the crystals which can be determined using the Bragg’s equation.
125

Chapter IV / Pure long chain n-alkanes : n-C198H398 and n-C246H494
Figure IV.57 : Intensity of the scattered X-rays versus position on the photographic film for sample (1) annealed at 95°C, after baseline subtraction.
.ta2 -
O o o
6 10 1210 - 8 - 6 - 4 -2 0 2 4 8
peak position (cm)
By comparison with the S.A.X.S. periodicity of the unannealed sample, for annealing to
95°C, the alkane chains are estimated to be tilted from the crystal surfaces at an angle of
15 7. 3 °. Once the n-alkane chains are tilted, no increase in the value of the tilt angle
was observed with the increase of annealing temperature.
IV 3.1.4. a. 2 Low frequency Raman spectrum.The low frequency Raman spectrum recorded at room temperature of sample (1) after
being annealed at 110°C is shown in Figure IV.58 after baseline subtraction.
126
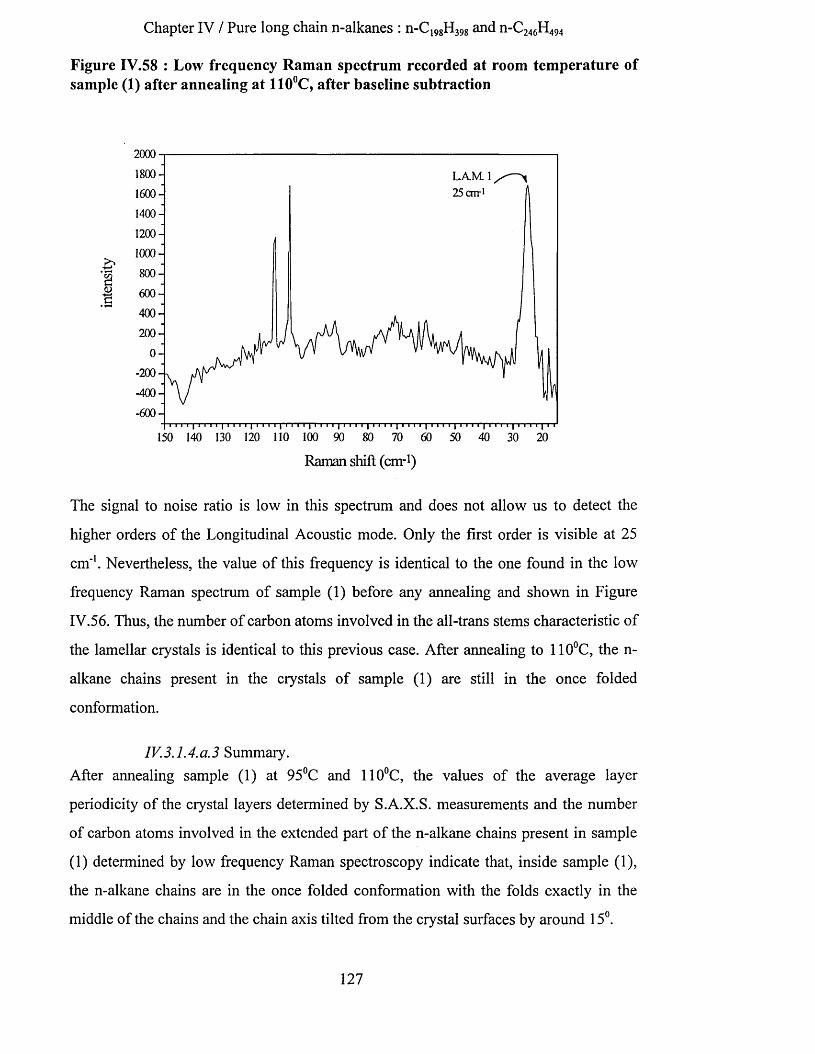
Chapter IV / Pure long chain n-alkanes : n-C198H398 and n-C246H494
Figure IV.58 : Low frequency Raman spectrum recorded at room temperature of sample (1) after annealing at 110°C, after baseline subtraction
2000
1800-
1600 -
1400-
1200 -
1000-
800-s<u 600-
400-
200 -
0-- 200 -
-400-
-600-
150 140 130 120 110 100 90 80 70 60 50 40 30 20
Raman shift (cm-1)
The signal to noise ratio is low in this spectrum and does not allow us to detect the
higher orders of the Longitudinal Acoustic mode. Only the first order is visible at 25
cm'1. Nevertheless, the value of this frequency is identical to the one found in the low
frequency Raman spectrum of sample (1) before any annealing and shown in Figure
IV.56. Thus, the number of carbon atoms involved in the all-trans stems characteristic of
the lamellar crystals is identical to this previous case. After annealing to 110°C, the n-
alkane chains present in the crystals of sample (1) are still in the once folded
conformation.
IV. 3.1.4. a. 3 Summary.After annealing sample (1) at 95°C and 110°C, the values of the average layer
periodicity of the crystal layers determined by S.A.X.S. measurements and the number
of carbon atoms involved in the extended part of the n-alkane chains present in sample
(1) determined by low frequency Raman spectroscopy indicate that, inside sample (1),
the n-alkane chains are in the once folded conformation with the folds exactly in the
middle of the chains and the chain axis tilted from the crystal surfaces by around 15°.
127

Chapter IV / Pure long chain n-alkanes : n-C198H398 and n-C246H494
IV 3.1.4. a. 4 Infrared Spectroscopy.Sample (1), originally crystallised in the once folded form with the all-trans chains
perpendicular to the surface of the crystal layers, was annealed at successively higher
temperatures from 51°C to 95°C and 110°C, and then cooled down to -173°C. As noted
above, after annealing at 95°C, the alkane chains were found to be tilted from the crystal
surfaces at an angle of 15 +/_ 3 °. The presence of tilted chains inside the n-alkane
crystals of sample (1) was expected to lead to an increase of the number of crystal
defects placed at the end of the chains. Investigations were carried out using F.T.I.R.
spectroscopy.
IV.3.1.4.a.4.1 Highest temperature spectra.Figure IV.59 shows the methylene wagging mode region of the infrared spectra of
sample (1) recorded at 51°C, 95°C and 110°C. Between each one of these temperatures,
the sample was cooled down to -173°C. Linear baselines have been used with reference
points of 1391 cm'1, 1324.9 cm'1 and 1280.1 cm'1.
Figure IV.59 : F.T.I.R. spectra of sample (1) as a function of temperature
0.045-
0.040-
0.035 -
0.030
§ 0.025 ~-
0.020 -
0.015 -
0.010-
0.005-
0.0001390 1380 1370 1360 1350 1340 1330 1320 1310 1300 1290
wavenumbers
128

Chapter IV / Pure long chain n-alkanes : n-C198H398 and n-C246H494
The most intense band at 1377 cm'1 is ascribed to the symmetric methyl bending mode
of vibration. Most of the other bands are ascribed to localised methylene modes. Indeed,
the band at 1354 cm*1 is ascribed to gg conformers, the shoulder at 1341 cm*1 is assigned
to end gauche conformers and the bands at 1369 cm'1 and 1307 cm'1 are ascribed to
gtg/gtg’ conformers. Increasing the temperature from 51°C to 110°C is followed by a
decrease of the absorbance of some of the infrared bands assigned to non all-trans
conformers. This unexpected effect may indicate that the concentration of non all-trans
conformers present in the sample is not only temperature dependent but also time
dependent. This is the first sign of perfecting of the n-alkane crystals.
Second derivatives, deconvolutions and curve fitting procedures were used for the
region between 1391 cm'1 and 1328.8 cm'1 (Table IV. 12) and from 1328.8 cm'1 to
1280.1 cm'1 (Table IV. 13) to determine with accuracy the frequencies and areas of these
different bands. The minimum number of components within the infrared spectra to
provide a satisfactory fit has been used for these procedures.
Table IV. 12 : Curve fitting results performed on the higher frequency part of the infrared spectra of sample (1) recorded at elevated temperatures
areawavenumbers
cm'1T=51°C T=95°C T=110°C
1386 0.0173 0.0179 0.02481378 0.3399 0.3049 0.3015
1369.9 0.2052 0.1773 0.16671363.5 0.1892 0.2020 0.21101353.8 0.1876 0.1940 0.18111347.2 0.1036 0.0938 0.06841341.1 0.0728 0.0776 0.08291333.4 0.0073 0.0083 0.0008
129

Chapter IV / Pure long chain n-alkanes : n-C198H398 and n-C246H494
Table IV. 13 : Curve fitting results performed on the lower frequency part of the infrared spectra of sample (1) recorded at elevated temperatures
areawavenumbers
cm'1T=51°C T=95°C T=110°C
1316 0.02814 0.03614 0.051451310 0.05608 0.06171 0.073801302 0.07947 0.08740 0.1078
1295.4 0.04978 0.04519 0.044171289.7 0.01958 0.02446 0.03196
Some of the bands present in Table IV. 12 (bold type) and Table IV. 13 are shown
respectively in Figure IV.60 and Figure IV.61 where their integrated absorbance
(maximum value arbitrarily fixed to one) is plotted against the temperature at which the
sample was annealed. The lines connecting the points are drawn only for clarification of
the trends.
Figure IV.60 : Scaled area of the major infrared bands present in the higher frequency part of the spectra as a function of the temperature
1.00-
0.95-
8 0.90-
§ ass:•8 :*8 o.8o:
‘••■•B. 1378cm.B. 1369.9cm.
1— B. 1363.5cm '— B. 1353.8cm --B .1347 .2 cm »— B.1341.1cm
0.75-s0.70-
0.6550 55 60 65 70 75 80 85 90 95 100 105 110 115
temperature in °C
130
Chapter IV / Pure long chain n-alkanes : n-C198H398 and n-C246H494
In Figure IV.60, the variation as a function of the annealing temperature of the
normalised integrated absorbance of the bands at 1341.1 cm'1, 1363.5 cm'1 and 1378
cm'1 is limited to around 10% of their maximum values. The normalised absorbance of
the two bands at 1341.1 cm'1 (ascribed to the end gauche conformers) and 1363.5 cm'1
increases progressively with the increase of the temperature. At the same time, the
normalised absorbance of the band at 1378 cm'1 assigned to the symmetric methyl
bending mode decreases. This last band, which has been used in the past as a reference
band, shows here a sensitivity to the annealing temperature. The band which is the least
sensitive to the annealing process is the one at 1353.8 cm'1 ascribed to gg conformers.
Its normalised absorbance varies within 7% of its maximum value.
On the other hand, the normalised absorbance of the two bands at 1347.2 cm'1 and
1369.9 cm*1 decreases more significantly with the increase of the temperature,
respectively by around 35% and 20% of their maximum values. These bands are
ascribed respectively to the fold itself and to the gtg/gtg ’ conformers. So, by increasing
the temperature up to 110°C, we observe a decrease in the number of gtg/gtg’
conformers present originally within the n-alkane chains. Also, it seems that the number
of folded chains present originally in the crystal layers decreases even though the
temperature at which melting of the folded chain conformation occurs has not been
reached. Changes in the conformation of the fold, due perhaps to the presence of tilted
chains inside the crystal layers, may also involve a decrease in the intensity of this band
at 1347.2 cm'1.
131

Chapter IV / Pure long chain n-alkanes : n-C198H398 and n-C246H494
Figure IV.61: Scaled area of the major infrared bands present in the lower frequency part of the spectra as a function of the temperature
1.00 H
0.95 •;
0.90
g 0.85 -j
J 0.80-j
8 0.75 -I•ea :13 ■cn♦
' • •B. 1378cm ■— B.1316cm > B.1310cmk— B.1302cm »— B. 1295.4cm
B. 1289.7cm
0.65 -i
0.60
0.55 -j
0.50 ■:
0.4550 55 60 65 70 75 80 85 90 95 100 105 110 115
temperature in °C
In Figure IV.61, the variation as a function of the temperature of the normalised
integrated absorbance of the infrared bands present in the lower frequency part of the
wagging mode region is shown. The normalised absorbance of all the bands but the one
at 1295.4 cm'1 ascribed to the slightly off zone centre methylene wagging mode46,
increases by up to 45% of their maximum values with the increase of the temperature. A
strong increase is observed after heating to 110°C. Moreover, the normalised absorbance
of the bands at 1302 cm'1 and 1310 cm'1, components of the broader band at 1306 cm'1
usually ascribed to the gtg/gtg’ conformers, increases by around 20%. This variation is
in contradiction with the observation made at higher frequency where the normalised
absorbance of the band at 1369.9 cm'1, also ascribed to gtg/gtg’ conformers, was
decreasing. This experiment may point out the non-equivalence of the bands at 1369.9
cm'1 arid at 1306 cm'1. Different proportions of gtg and gtg’ giving rise to these two
bands may explain this effect.
132
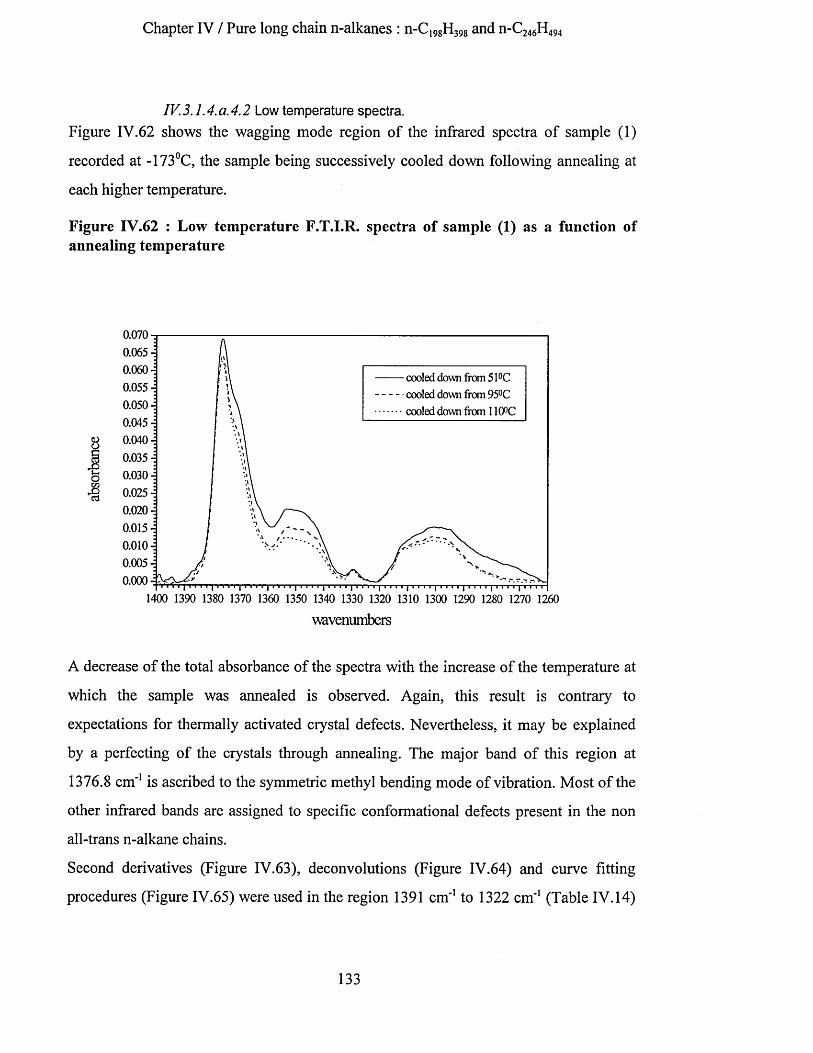
Chapter IV / Pure long chain n-alkanes : n-C198H398 and n-C246H494
IV3.1.4.a.4.2 Low temperature spectra.Figure IV.62 shows the wagging mode region of the infrared spectra of sample (1)
recorded at -173°C, the sample being successively cooled down following annealing at
each higher temperature.
Figure IV.62 : Low temperature F.T.I.R. spectra of sample (1) as a function of annealing temperature
0.070-0.065-0.060-0.0550.050-0.045-
K 0.040-
'fi 0.035
o 0.030-
■8 0.025-0.020-0.0150.010-0.005-0.000-E
cooled down from 51°C cooled down from 95°C cooled down from 110°C
1400 1390 1380 1370 1360 1350 1340 1330 1320 1310 1300 1290 1280 1270 1260
wavenumbers
A decrease of the total absorbance of the spectra with the increase of the temperature at
which the sample was annealed is observed. Again, this result is contrary to
expectations for thermally activated crystal defects. Nevertheless, it may be explained
by a perfecting of the crystals through annealing. The major band of this region at
1376.8 cm'1 is ascribed to the symmetric methyl bending mode of vibration. Most of the
other infrared bands are assigned to specific conformational defects present in the non
all-trans n-alkane chains.
Second derivatives (Figure IV.63), deconvolutions (Figure IV.64) and curve fitting
procedures (Figure IV.65) were used in the region 1391 cm'1 to 1322 cm'1 (Table IV. 14)
133
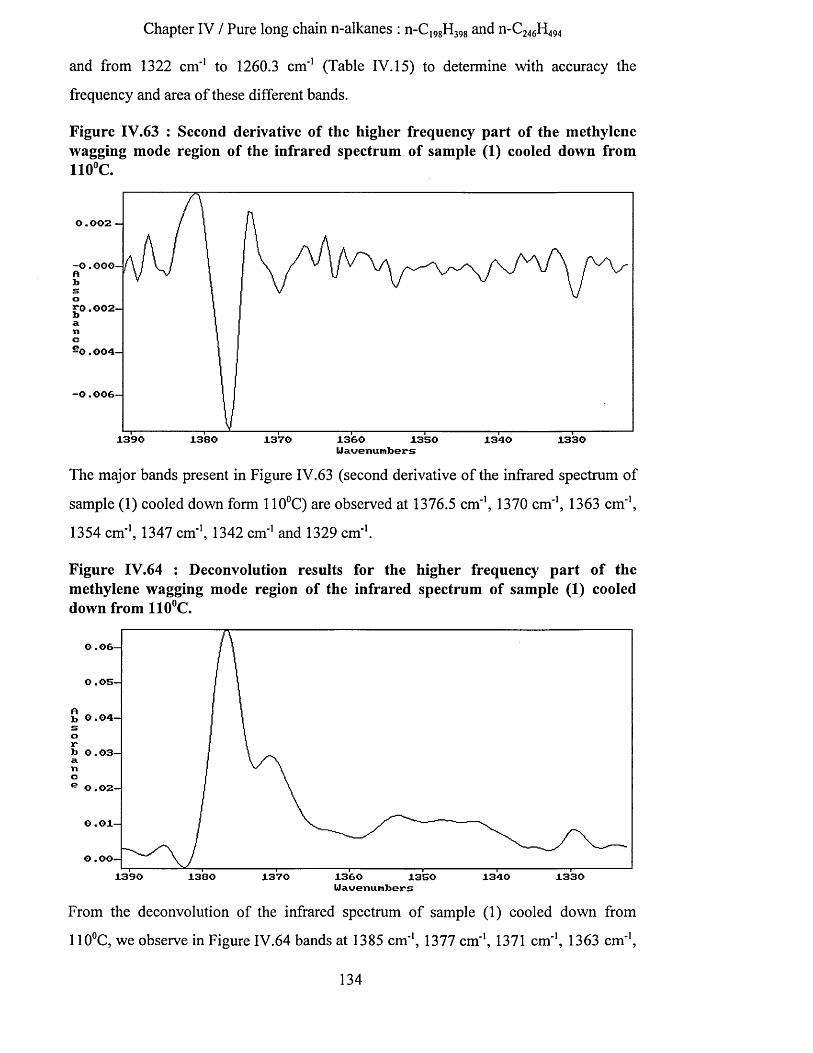
Chapter IV / Pure long chain n-alkanes : n-C198H398 and n-C246H494
and from 1322 cm'1 to 1260.3 cm'1 (Table IV. 15) to determine with accuracy the
frequency and area of these different bands.
Figure IV.63 : Second derivative of the higher frequency part of the methylene wagging mode region of the infrared spectrum of sample (1) cooled down from 110°C.
0 .002 -
- O . O O O -
£ 0 . 002-
—O.004-
-O.006-
1390 1380 1370 1360 1350 13301340Uauenumbers
The major bands present in Figure IV.63 (second derivative of the infrared spectrum of
sample (1) cooled down form 110°C) are observed at 1376.5 cm'1, 1370 cm'1, 1363 cm'1,
1354 cm'1, 1347 cm'1, 1342 cm'1 and 1329 cm'1.
Figure IV.64 : Deconvolution results for the higher frequency part of the methylene wagging mode region of the infrared spectrum of sample (1) cooled down from 110°C.
0.06-
O .05-
b 0.04-
b 0.03-
O .02-
O .01-
0 . 00-1390 1380 13301370 1350 1340
Uauenumbers
From the deconvolution of the infrared spectrum of sample (1) cooled down from
110°C, we observe in Figure IV.64 bands at 1385 cm*1, 1377 cm'1, 1371 cm'1, 1363 cm'1,
134

Chapter IV / Pure long chain n-alkanes : n-C^gK^g and n-C246H494
1354 cm'1, 1347 cm'1, 1342 cm'1 and 1329 cm'1. For the deconvolution, we chose to use
for each band a Lorentzien function with full width at half height of 5.2 cm'1, a Bessel
apodization function and a enhancement factor of 1.6.
Figure IV.65 : Curve fitting obtained from the higher frequency part of the methylene wagging mode region of the infrared spectrum of sample (1) cooled down from 110°C.
© .o s -
original spectrumo .05-
curve fitting result
g 0 .04-Sorto 0 .03- a n c6 0 . 02-
0 . 01-
1360 1350 13301390 1380 1370 1340Uauenunbers
The result of the curve fitting procedure carried out on the infrared spectrum of sample
(1) cooled down from 110°C is shown in Figure IV.65. The use of Gaussian functions in
this procedure has been found to give better results than the use of Lorentzian functions.
Table IV.14 : Curve fitting results performed on the higher frequency part of the infrared spectra of sample (1) recorded at -173°C
areawavenumbers
cm'1cooled down from T=51°C
cooled down from T=95°C
cooled down from T=110°C
1384.6 0.02553 0.00776 0.017991376.5 0.47213 0.43657 0.439051370.1 0.26374 0.2284 0.194241363.8 0.15762 0.11091 0.102691353.4 0.2073 0.13555 0.116031346.4 0.09256 0.08358 0.061911341 0.08268 0.05863 0.04618
1329.2 0.0186 0.01559 0.01314
135
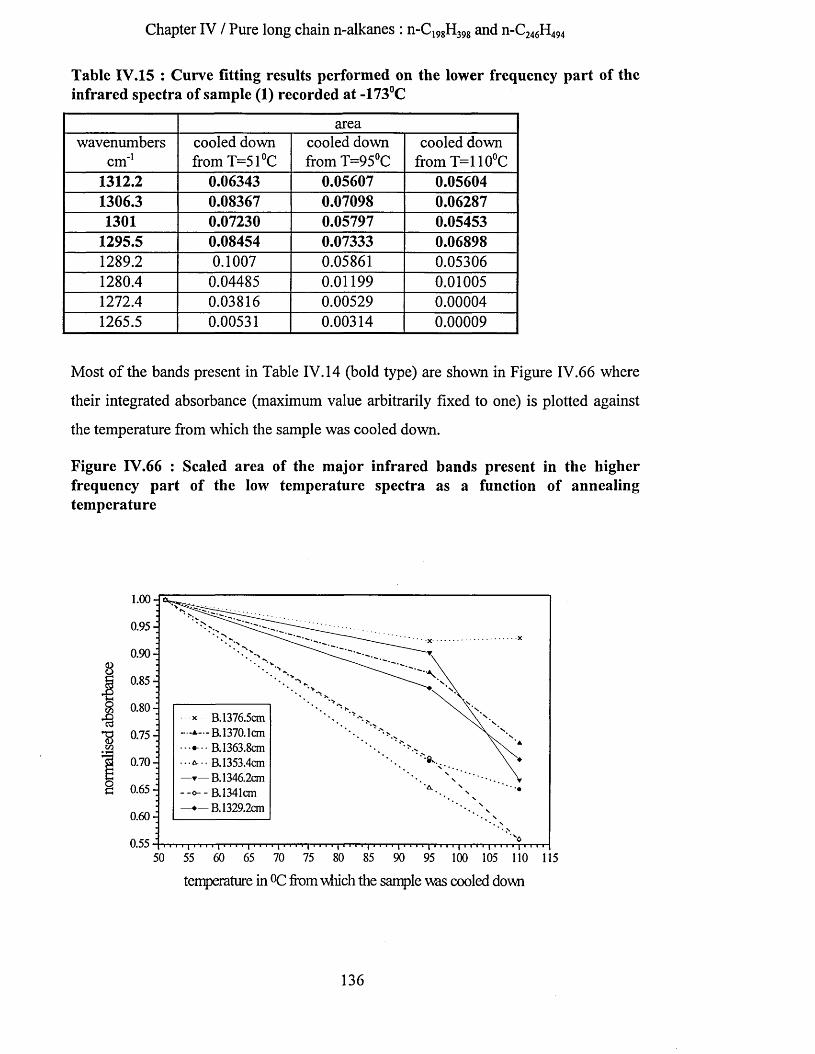
Chapter IV / Pure long chain n-alkanes : n-C198H398 and n-C246H494
Table IV.15 : Curve fitting results performed on the lower frequency part of the infrared spectra of sample (1) recorded at -173°C
areawavenumbers
cm'1cooled down from T=51°C
cooled down from T=95°C
cooled down from T=110°C
1312.2 0.06343 0.05607 0.056041306.3 0.08367 0.07098 0.062871301 0.07230 0.05797 0.05453
1295.5 0.08454 0.07333 0.068981289.2 0.1007 0.05861 0.053061280.4 0.04485 0.01199 0.010051272.4 0.03816 0.00529 0.000041265.5 0.00531 0.00314 0.00009
Most of the bands present in Table IV. 14 (bold type) are shown in Figure IV.66 where
their integrated absorbance (maximum value arbitrarily fixed to one) is plotted against
the temperature from which the sample was cooled down.
Figure IV.66 : Scaled area of the major infrared bands present in the higher frequency part of the low temperature spectra as a function of annealing temperature
o• i13<Z)
0.65-
0.60-
0.55
x B. 1376.5cm —A-B.1370.lcm ••••••• B. 1363.8cm• B.1353.4cm—▼— B. 1346.2cm -_o-- B.1341cm — B. 1329.2cm
0.80-
0.90-
0.85-
0.75-
0.70-
0.95-
1.00-4
50 55 60 65 70 75 80 85 90 95 100 105 110 115
temperature in °C from vdiich the sample was cooled down
136
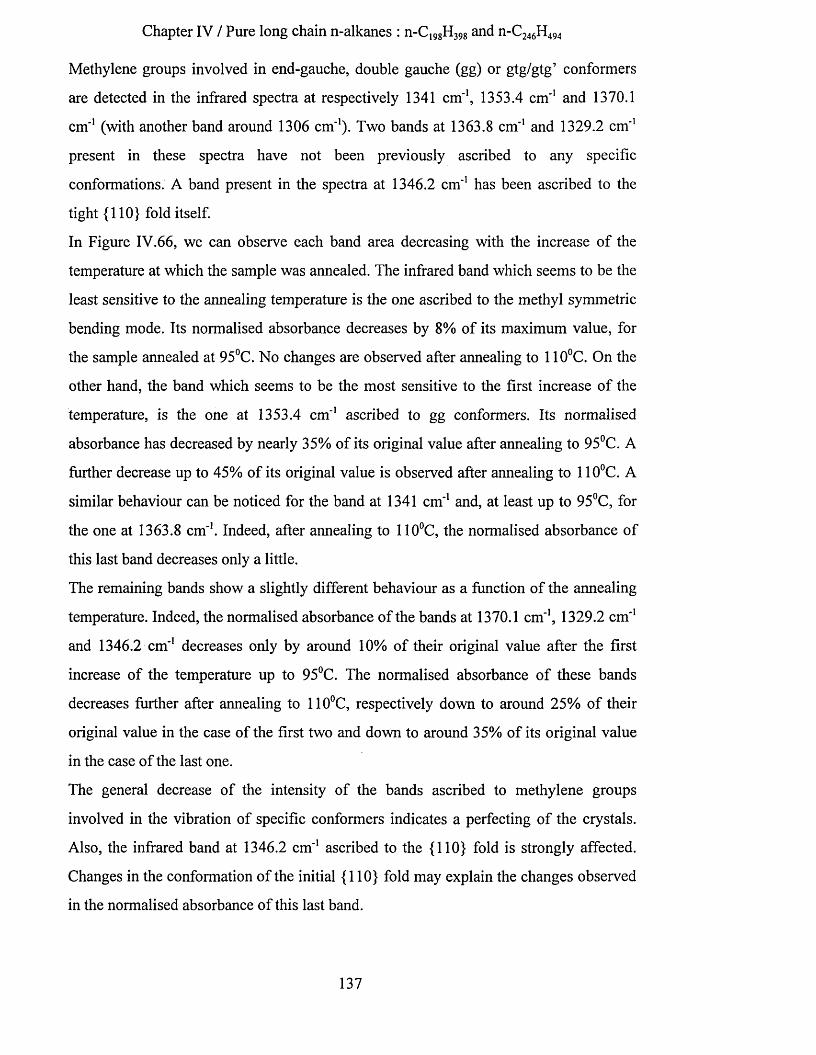
Chapter IV / Pure long chain n-alkanes : n-C19gH398 and n-C246H494
Methylene groups involved in end-gauche, double gauche (gg) or gtg/gtg’ conformers
are detected in the infrared spectra at respectively 1341 cm'1, 1353.4 cm'1 and 1370.1
cm'1 (with another band around 1306 cm'1). Two bands at 1363.8 cm'1 and 1329.2 cm'1
present in these spectra have not been previously ascribed to any specific
conformations. A band present in the spectra at 1346.2 cm'1 has been ascribed to the
tight {110} fold itself.
In Figure IV.66, we can observe each band area decreasing with the increase of the
temperature at which the sample was annealed. The infrared band which seems to be the
least sensitive to the annealing temperature is the one ascribed to the methyl symmetric
bending mode. Its normalised absorbance decreases by 8% of its maximum value, for
the sample annealed at 95°C. No changes are observed after annealing to 110°C. On the
other hand, the band which seems to be the most sensitive to the first increase of the
temperature, is the one at 1353.4 cm'1 ascribed to gg conformers. Its normalised
absorbance has decreased by nearly 35% of its original value after annealing to 95°C. A
further decrease up to 45% of its original value is observed after annealing to 110°C. A
similar behaviour can be noticed for the band at 1341 cm'1 and, at least up to 95°C, for
the one at 1363.8 cm'1. Indeed, after annealing to 110°C, the normalised absorbance of
this last band decreases only a little.
The remaining bands show a slightly different behaviour as a function of the annealing
temperature. Indeed, the normalised absorbance of the bands at 1370.1 cm'1, 1329.2 cm*1
and 1346.2 cm'1 decreases only by around 10% of their original value after the first
increase of the temperature up to 95°C. The normalised absorbance of these bands
decreases further after annealing to 110°C, respectively down to around 25% of their
original value in the case of the first two and down to around 35% of its original value
in the case of the last one.
The general decrease of the intensity of the bands ascribed to methylene groups
involved in the vibration of specific conformers indicates a perfecting of the crystals.
Also, the infrared band at 1346.2 cm'1 ascribed to the {110} fold is strongly affected.
Changes in the conformation of the initial {110} fold may explain the changes observed
in the normalised absorbance of this last band.
137
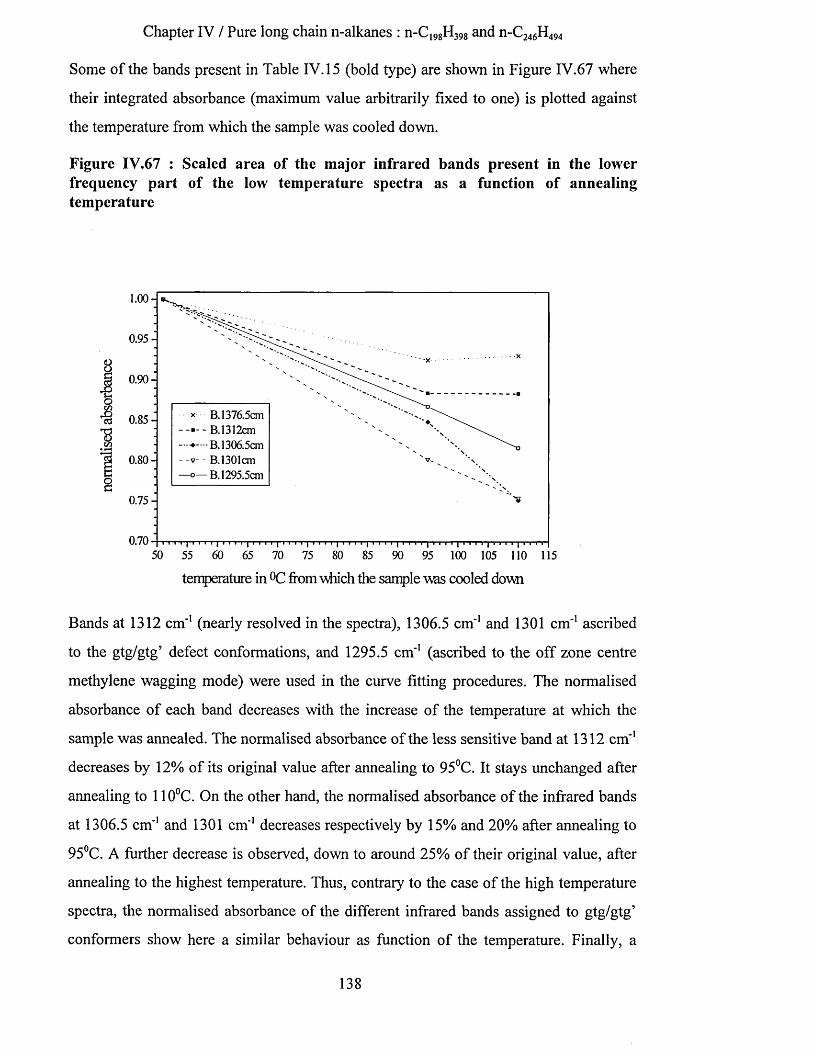
Chapter IV / Pure long chain n-alkanes : n-CI9gH398 and n-C246H494
Some of the bands present in Table IV. 15 (bold type) are shown in Figure IV.67 where
their integrated absorbance (maximum value arbitrarily fixed to one) is plotted against
the temperature from which the sample was cooled down.
Figure IV.67 : Scaled area of the major infrared bands present in the lower frequency part of the low temperature spectra as a function of annealing temperature
1 .0 0 -
0.95-
0.90-
* B.1376.5cm- — -B.1312cm —^—•B. 1306.5cm- -v- - B.1301cm —o— B. 1295.5cm
0.85-
0.80-
0.75-
0.7050 55 60 65 70 75 80 85 90 95 100 105 110 115
temperature in °C from which the sample was cooled down
Bands at 1312 cm'1 (nearly resolved in the spectra), 1306.5 cm'1 and 1301 cm'1 ascribed
to the gtg/gtg’ defect conformations, and 1295.5 cm'1 (ascribed to the off zone centre
methylene wagging mode) were used in the curve fitting procedures. The normalised
absorbance of each band decreases with the increase of the temperature at which the
sample was annealed. The normalised absorbance of the less sensitive band at 1312 cm'1
decreases by 12% of its original value after annealing to 95°C. It stays unchanged after
annealing to 110°C. On the other hand, the normalised absorbance of the infrared bands
at 1306.5 cm'1 and 1301 cm'1 decreases respectively by 15% and 20% after annealing to
95°C. A further decrease is observed, down to around 25% of their original value, after
annealing to the highest temperature. Thus, contrary to the case of the high temperature
spectra, the normalised absorbance of the different infrared bands assigned to gtg/gtg’
conformers show here a similar behaviour as function of the temperature. Finally, a
138
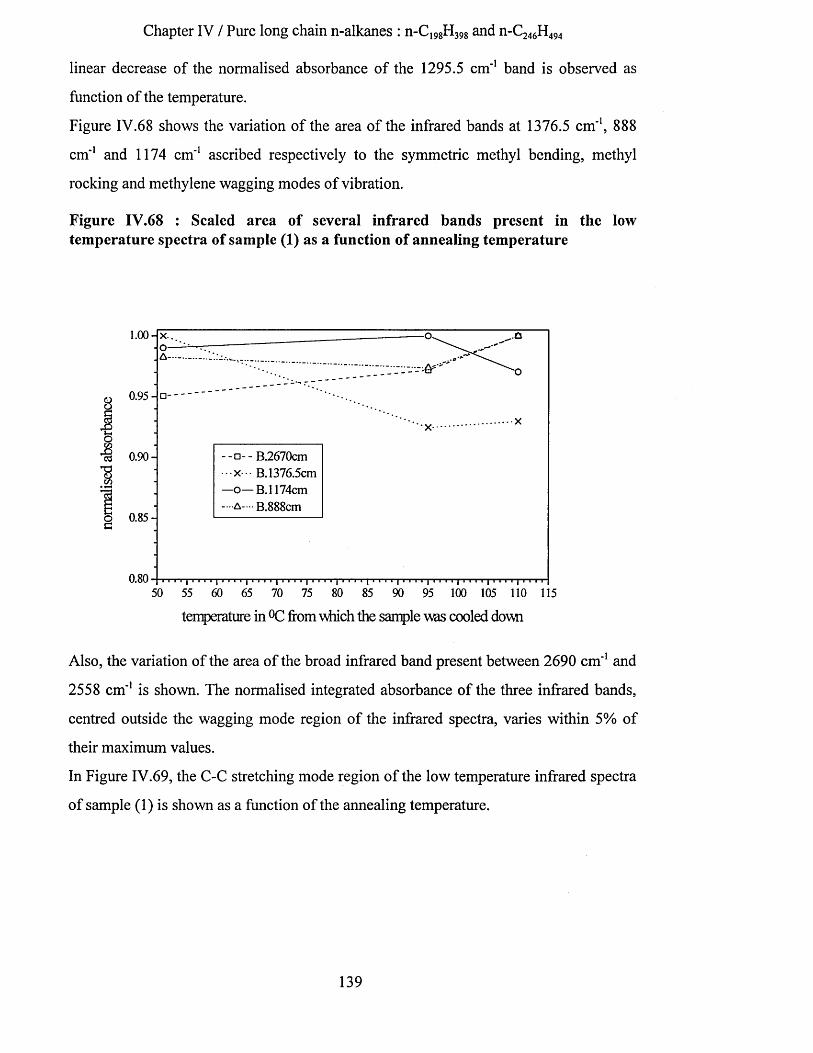
Chapter IV / Pure long chain n-alkanes : n-C198H398 and n-C246H494
linear decrease of the normalised absorbance of the 1295.5 cm'1 band is observed as
function of the temperature.
Figure IV.68 shows the variation of the area of the infrared bands at 1376.5 cm'1, 888
cm'1 and 1174 cm'1 ascribed respectively to the symmetric methyl bending, methyl
rocking and methylene wagging modes of vibration.
Figure IV.68 : Scaled area of several infrared bands present in the low temperature spectra of sample (1) as a function of annealing temperature
1.0 0 -
g 0.95-
o£ - - B.2670cm
-x B. 1376.5cm —o — B. 1174cm - -a - - B.888cm
-CU 0.90-
1 :
5 0.85 -G
0.8050 55 60 65 70 75 80 85 90 95 100 105 110 115
temperature in °C from which the sample was cooled down
Also, the variation of the area of the broad infrared band present between 2690 cm'1 and
2558 cm'1 is shown. The normalised integrated absorbance of the three infrared bands,
centred outside the wagging mode region of the infrared spectra, varies within 5% of
their maximum values.
In Figure IV.69, the C-C stretching mode region of the low temperature infrared spectra
of sample (1) is shown as a function of the annealing temperature.
139

Chapter IV / Pure long chain n-alkanes : n-C198H398 and n-C246H494
Figure IV.69 : Low temperature infrared spectra of the C-C stretching mode region of sample (1)
(c ) : cooled down from 110°C (b ): cooled down from 104°C (a ): cooled down from 51°C
§
I
1140 1130 1120 1110 1100 1090 1080 1070 1060 1050 1040
wavenumbers
The band progression region is limited by two extreme bands at 1133 cm'1 and 1050
cm'1 ascribed37 respectively to the in-phase stretching of all C-C bonds and the
methylene twisting fundamental. Each one of the progression bands present in this
region (crossed by a vertical dotted line) is ascribed to non-localised mode of vibration
involving the motion of adjacent carbon atoms with the same phase difference along the
n-alkane chain. The band marked by an asterisk at 1056 cm'1, present in the spectrum of
sample (1) cooled down from 51°C may be related to a distorted methylene twisting
mode characteristic of imperfect crystal forms which may have been formed during the
sample preparation (crystallisation from solution and pressure applied over the sample
surface lower than 0.4 ton per cm2). The disappearance of this band, in addition to a
better resolution of the progression bands, may be seen as a perfecting of the once
folded crystals inside which the concentration of remaining non-all trans conformers,
which may be present in the extended part of the n-alkane chains, decreases. Finally,
one can observe two different regions within the spectra. Above 1100 cm'1, the
progression bands are observed. Below this frequency, three broad bands at around 1089
cm'1, 1078 cm'1 and 1064 cm'1 are observed. The bands at 1078 cm'1 and 1064 cm'1 were
140

Chapter IV / Pure long chain n-alkanes : n-C198H398 and n-C246H494
ascribed by Krimm et al.61 to C-C stretching modes, the first one being a fingerprint of
gauche conformers present in the sample. Moreover, Wolf et al.47 have calculated by the
Green’s function method the localised mode frequencies of a tight {110} fold in
polyethylene. They assigned an infrared band at 1082.5 cm'1 to the {110} folds. Thus, in
the lowest frequency part of the infrared spectra of sample (1) shown in Figure IV.69,
some of the bands may be due to the presence of the {110} folds or some disorder at the
ends of the chains.
Finally, we tried to identify each one of the progression bands present in this region. To
achieve this, we used the frequency-phase curve for the C-C stretching modes of short
chain n-alkanes from n-C20H42 to n-C30H62 determined by Snyder and
Schachtschneider39. Then, from the frequency of each progression band present in the
spectra of Figure IV.69 we were able to determine each phase difference. The phase
difference cpk, is related to the number of carbon atoms nc, involved in the vibration of
the chains and an integer k, characteristic of each progression band by the equation :
Equation IV.50
kX7 l9k = ------- 7
n c - l
Therefore, estimates for both the best series of k values and the number of carbon atoms
involved in the extended part of the n-alkane chains were determined. To achieve this,
we first chose an estimated number of carbon atoms present in the extended part of the
n-alkane chains. In each case, we began with the highest possible number of carbon
atoms (e.g. 99 for n-C198H398 in once folded form). Then, a series of k values is
determined using Equation IV.50. We determined from this series the numbers of
successive decreasing integers going from the highest k value to the lowest one. This
completed the first step of the operation. Then, we went again through the full process
using for an estimated number of carbon atoms, one less than the previous case (e.g. 98
for n-Ci98H398 in once folded form). A new series of k values was determined. The
numbers of successive decreasing integers k was noted, completing the second step in
the operation. On average, less than twenty steps are used. Once the best fit of
frequencies was determined, we used the k values to determine using once again
Equation IV.50, an average number of carbon atoms involved in the all-trans part of the
141

Chapter IV / Pure long chain n-alkanes : n-C198H398 and n-C246H494
n-alkane chains. A 7. 1 error bar is estimated for the values of the integers k. In the case
of sample (1), the average number of carbon atoms involved in the extended part of the
n-alkane chains was estimated to be equal to 90 7. 16. The frequency of each of these
progression bands is plotted against the integer k, in Figure IV.70. Also, the frequency
of each of these bands was fitted by a third order polynomial curve Y, shown by the
black line.
Figure IV.70 : Frequency of the progression bands ascribed to the C-C stretching mode against k, integer, for sample (1) cooled down from 110°C.
11302 5 -
1120-
15-1110 -
1105 -1100 -
095-1090 -1085-1080-1075-1070-1065-
sample (1) cooled down from 110°C Y = 1133.5 + 1.687*X- 0.966*X2 +46.57* 10-3*X3
" I I I I I I I I M i l l
15 20
k25 30 35 40
IV.3.1.4.a.5 Interpretation.The tilting of the chains inside the crystals of sample (1) was expected to lead to an
increase in the number of defects present in the n-alkane chains, and more especially at
the chain ends.
In the low temperature spectra, a general decrease of the absorbance of all the bands
present in the methylene wagging mode region was observed. Particularly, the
normalised absorbance of the bands ascribed to the end gauche and gg conformers
decreases by around 45% of their initial values through the heating process.
Furthermore, the normalised absorbance of the band assigned to the {110} fold also
142

Chapter IV / Pure long chain n-alkanes : n-C198H398 and n-C246H494
decreases by nearly 35% of its initial value. These results are opposite to the ones
expected for thermally activated crystal defects.
On the other hand, in the high temperature spectra, the absorbance of the band ascribed
to the end gauche conformers is found to increase by around 10% of its original value
with the increase in temperature. This increase may be linked with the tilting of the n-
alkane chains inside the crystal layers. Also, the absorbance of the bands ascribed to the
gtg/gtg’ conformers in the low frequency part of the spectra decreases by around 20%
with the annealing temperature while the absorbance of the one at higher frequency
increases by around 25%. This observation indicates the non equivalence of the high
and low frequency bands both previously ascribed to the gtg/gtg’ conformers.
Nevertheless, a greater decrease of the normalised absorbance (35% of its initial value)
is noted for the band ascribed to the {110} fold. This may be explained by a change in
the conformation of the original {110} fold. Also, it may be explained by a partial
transformation from folded to extended chain conformations due to the increase of the
annealing temperature. Contrary to previous work79, no increase of the tilt angle was
observed with the increase of the annealing temperature. Differences in the sample
preparations may explain this difference. Indeed, our samples are thin films produced by
applying slight pressure to a mat formed after crystallisation from solution, whereas for
previous studies no applied pressure was needed79.
Nevertheless, all the above observations seem to indicate a perfecting process of the n-
alkane crystals occurring at elevated temperatures This may predominate over the
formation of chain end defects due to the chain tilting, masking the latter effect in the
infrared data.
IV.3.1.4.b Tilting of n-alkane chains at 95°C.In a previous work79, an n-C198H398 sample crystallised from solution in once folded form
was heated from room temperature to the melting point at 5°C per minute. Above 90°C,
the n-alkane chains were found to tilt from the crystal surfaces. Using S.A.X.S.
measurements, the tilt angle was found to be around 3° at 90°C. Moreover, by increasing
further the temperature, the tilt angle was found to increase up to 24° at around 116°C.
143
Chapter IV / Pure long chain n-alkanes : n-C198H398 and n-C246H494
In order to observe by the means of vibrational spectroscopy conformational changes
associated with the tilting of n-alkane chains from the crystal surfaces, we prepared a
sample containing the lowest possible number of crystal defects. To achieve this,
sample (1) was annealed at 85°C for 20 hours before cooling it down to -173°C. Doing
so, we hoped to obtain crystals with the highest degree of perfection in the once folded
form with the n-alkane chain axis still perpendicular to the surface of the crystal layers.
Then, after heating this sample to 95°C for around 2 minutes, 10 minutes and 64 hours
respectively, it was successively cooled down to -173°C. Doing so, we hoped to obtain
tilted n-alkane chains in the once folded form. Therefore, changes observed in the
infrared spectrum of sample (1) cooled down from the highest temperature could be
assigned to differences in the concentration of rotational isomers due to the chain tilt
rather than to changes in the concentration of crystallographic defects and non all-trans
conformers due to the increase of the thermal population of rotational isomers with
increasing the annealing temperature. For a similar sample heated at 95°C, Boda79 found
that the n-alkane chains were tilted from the crystal surfaces with an angle near to 7°.
IV.3.1.4.b.l S.A.X.S. measurements.Sample (1) was annealed at 95°C for 2 minutes, 10 minutes and 64 hours. The layer
periodicities were found to be equal respectively to 124.3 7_ 0.6 A, 120.5 7. 1.7 A and
120.5 7. 0.6 A. After annealing at 85°C for 20 hours and cooling down to -173°C,
sample (1) was believed to be in a once folded conformation with the chain axis
perpendicular to the crystal surfaces, the fold in the middle of the chains and also, with
the lowest possible concentration of crystallographic defects. After annealing at 95°C for
around 2 minutes, no tilt angle was detected from S.A.X.S. measurements. After 10
minutes and 64 hours at 95°C, the n-alkane chains are still in the once folded form but
they were now tilted from the crystal surfaces with an angle close to 14.9° with errors,
respectively, of 7.5° and 7.3°. Within the experimental errors, no differences in the tilt
angle of the n-alkane chains were found after 10 minutes and 64 hours at 95°C.
144
Chapter IV / Pure long chain n-alkanes : n-C19gH398 and n-C246H494
IV3.1.4.b.2 Infrared spectroscopy : low temperature spectra.Infrared spectra were recorded at -173°C on cooling sample (1) after annealing at
successively higher temperatures. After each stage, a part of sample (1) was taken away
from the sample holder to perform S.A.X.S. experiments. Therefore, due to the
displacement of the sample during this manipulation, the area sampled by the infrared
beam will have changed. To be able to compare the intensity differences of the different
infrared spectra we need to use a reference band which is not sensitive to changes in the
chain conformation. We have not succeeded in finding such a band in the infrared
spectra of n-paraffins. Nevertheless, we chose to use the integrated area of the broad
band between 2689.9 cm'1 and 2557.8 cm'1 to normalise the different spectra of sample
(1) recorded at -173°C. Indeed, in the infrared spectra recorded at -173°C, the area of
this band has been found to vary by less than 5% over a range of samples and annealing
process. This broad band is certainly one of the least sensitive infrared bands to changes
in chain conformation and crystal structure. The methylene wagging mode region of
these normalised spectra is shown in Figure IV.71 after baseline subtraction. A
combination of linear baselines was used, with reference points of 1391 cm'1, 1322 cm'1
and 1260.3 cm*1.
145

Chapter IV / Pure long chain n-alkanes : n-C198H398 and n-C246H494
Figure IV.71 : Low temperature F.T.I.R. spectra of sample (1) as a function of annealing temperature
0.11
0.10
0.09
0.08
0.07
| 0.06
0.05
0.04CO0.03
0.02
0.01
0.001390 1380 1370 1360 1350 1340 1330 1320 1310 1300 1290 1280 1270 1260
wavenumbers
The absorbance of the different bands present in this region of the spectra increases with
both the annealing temperature and the initial time spent at that temperature. Indeed, the
overall absorbance in the wagging mode region is highest after annealing 10 minutes at
95°C. Nevertheless, a decrease of the overall intensity in this region is observed with
increasing time spent at 95°C. After 64 hours annealing at 95°C, the overall absorbance
of the spectrum of sample (1) has decreased and is now the lowest of the series. The
increase followed by the decrease of the overall absorbance of the infrared spectra
through the isothermal annealing process can be easily observed by looking at the
absorbance of the bands at around 1353 cm'1, 1347 cm'1 and 1341 cm'1. Second
derivatives, deconvolutions and curve fitting procedures were therefore monitored firom
1391 cm'1 to 1322 cm'1 (Table IV. 16) to determine with accuracy the frequency and area
of all the different bands.
(a) cooled down after annealing at 85°C for 20 hours(b) cooled down after annealing at 95°C for 2 minutes(c) cooled down after annealing at 95°C for 10 minutes(d) cooled down after annealing at 95°C for 64 hours
146
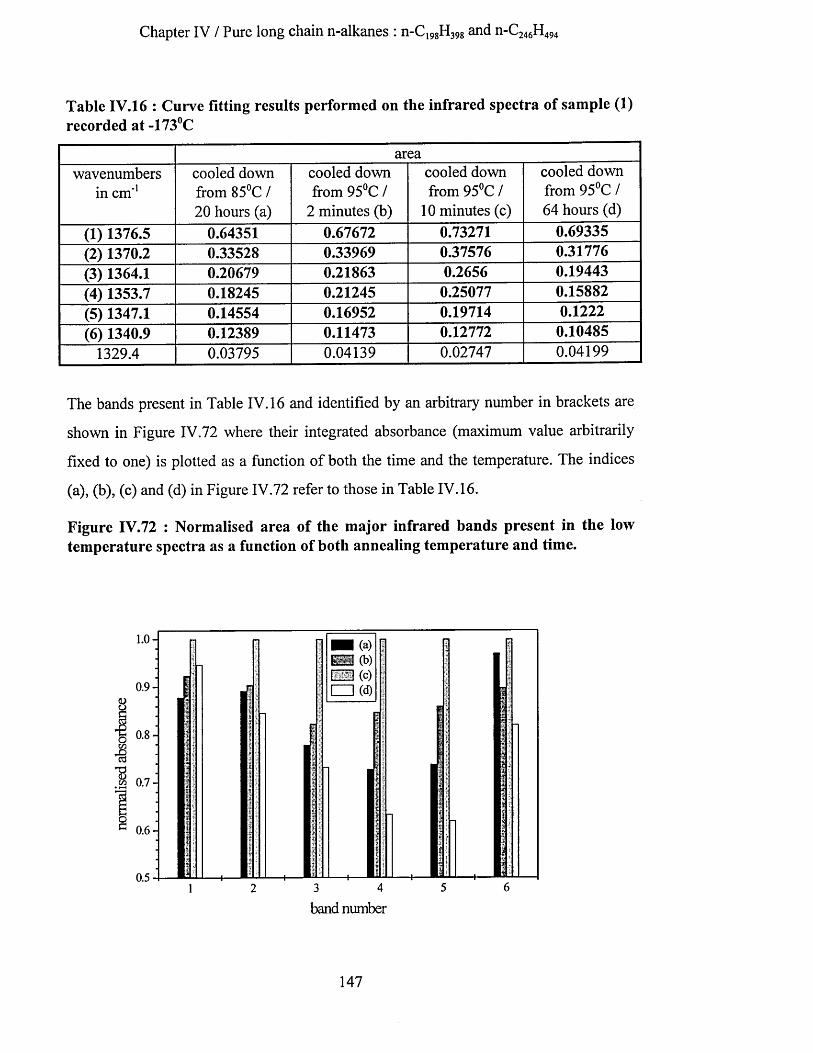
Chapter IV / Pure long chain n-alkanes : n-C198H398 and n " C 2 4 6 H t94
Table IV.16 : Curve fitting results performed on the infrared spectra of sample (1) recorded at -173°C
areawavenumbers
in cm'1cooled down from 85°C / 20 hours (a)
cooled down from 95°C /
2 minutes (b)
cooled down from 95°C /
10 minutes (c)
cooled down from 95°C / 64 hours (d)
(1) 1376.5 0.64351 0.67672 0.73271 0.69335(2) 1370.2 0.33528 0.33969 0.37576 0.31776(3) 1364.1 0.20679 0.21863 0.2656 0.19443(4) 1353.7 0.18245 0.21245 0.25077 0.15882(5) 1347.1 0.14554 0.16952 0.19714 0.1222(6) 1340.9 0.12389 0.11473 0.12772 0.10485
1329.4 0.03795 0.04139 0.02747 0.04199
The bands present in Table IV.16 and identified by an arbitrary number in brackets are
shown in Figure IV.72 where their integrated absorbance (maximum value arbitrarily
fixed to one) is plotted as a function of both the time and the temperature. The indices
(a), (b), (c) and (d) in Figure IV.72 refer to those in Table IV.16.
Figure IV.72 : Normalised area of the major infrared bands present in the low temperature spectra as a function of both annealing temperature and time.
0 5 1 MM , UN , iil_l]_, 1:111 , lid I , Mi1 2 3 4 5 6
band number
147
Chapter IV / Pure long chain n-alkanes : n-C,98H398 and n-C246H494
We can observe in Figure IV.72 that the increase of the annealing temperature from
85°C to 95°C (up to 10 minutes) is reflected in the infrared spectra (a), (b) and (c) by an
increase of the integrated normalised absorbance of most the bands assigned to non all
trans conformers and so, by an increase in their concentrations in sample (1). But, a
small decrease of the absorbance (6%) of the 1341 cm'1 band assigned to the end gauche
conformers is observed going from spectrum (a) to spectrum (b). Nevertheless, in all the
cases, the highest value of the normalised absorbance is observed in the spectrum of the
sample after annealing at 95°C for 10 minutes. Indeed, even in the case of the 1341 cm'1
band, the normalised absorbance increases by 2%. Then, as observed directly from the
spectra of Figure IV.71, Figure IV.72 confirms that the normalised absorbance of the
bands assigned to non all trans conformers is at its lowest value in the spectrum of the
sample after annealing at 95°C for 64 hours. Thus, after annealing at the higher
temperature and for the longest time, the concentration of non all-trans conformers has
decreased below the initial concentration observed after annealing at 85°C for 20 hours.
It is interesting to note that the normalised absorbance of the band ascribed to the
symmetric methyl bending mode at 1376 cm'1 follows a similar pattern. Indeed, the
normalised absorbance increases with both the increase of the annealing temperature
and the time spent at this temperature. Nevertheless, there is a difference in behaviour,
since in the spectrum (d) the normalised absorbance of this band decreases but does not
reach its minimum value.
IV 3.1.4.b.3 Interpretation.The increase in temperature from 85°C to 95°C for 2 minutes causes an increase of the
absorbance of most of the bands present in the methylene wagging mode region of the
infrared spectrum recorded at -173°C. S.A.X.S. experiments have shown that, at this
point, the n-alkane chains are still perpendicular to the crystal surfaces. The increase we
observe in the concentration of non all-trans conformers may be due to the increase of
the thermal population of rotational isomers occurring at this higher temperature.
Leaving the sample at the same temperature (95°C) but for a longer time (10 minutes), a
strong increase of the absorbance of all the bands is observed. From S.A.X.S.
experiments we know that the n-alkane chains are now tilted form the crystal surfaces.
148
Chapter IV / Pure long chain n-alkanes : n-C198H398 and n-C246H494
They are still in a once folded chain conformation. At least two explanations may be
offered. First, the jump in the normalised absorbance of all the infrared bands may be
linked to the tilting of the n-alkane chains in sample (1). In this way, tilting of the chains
inside n-alkane crystals occurs through a disordering process which allows the
formation of the tilt. This disorder does not preferentially affect the ends of the n-alkane
chains. On the other hand, the previous annealing of sample (1) at 95°C for 2 minutes
may not have been long enough to allow thermal equilibrium to take place. Therefore,
the increase in absorbance may be expected at this point, as thermal equilibrium is
approached.
Leaving the sample at 95°C for the longest time (64 hours), a general decrease of the
absorbance is observed. Furthermore, at this point, the absorbance of each infrared band
assigned to non all-trans conformers is at its lowest value for this sequence of
measurements. From S.A.X.S. experiments, we know that the n-alkane chains are tilted
from the crystal surfaces with the same angle as found for the previous annealing time.
Also, the chains are still in the once folded chain conformation. This decrease can thus
be explained, once again, by a perfecting of the n-alkane crystals in the last stage of this
experiment. Therefore, the presence of tilted chains inside n-alkane crystals does not
induce a higher concentration of non all-trans conformers, either inside or at the ends of
the chains. On the other hand, the onset of tilted n-alkane chains occurs through a
temporary increase of the concentration of these conformers.
Furthermore, this experiment shows that the structure of once folded n-alkane crystals
inside which the chains are perpendicular to the crystal surfaces may have intrinsically
higher probabilities for non all-trans conformers than once folded n-alkane crystals with
the chains tilted from the crystal surfaces. Thus, the tilting of the chains inside n-alkane
crystals may be seen as a process by which n-alkane chains tend to adopt a more perfect
conformation, the nearest possible to the all-trans form. Finally, the tilting of the n-
alkane chains from the crystal surfaces may change the conformation of the {110} fold
present initially in the middle of the chains. This may explain the observed decrease of
the absorbance of the infrared band ascribed to the {110} folds. As no low frequency
Raman spectra were recorded for sample (1) after annealing at 95°C for 64 hours, the
number of carbon atoms composing the all-trans stems characteristic of the lamellar
149

Chapter IV / Pure long chain n-alkanes : n-C198H398 and n-C246H494
crystals has not been determined. Changes in the lamellar thickness may also have
occurred in the final annealing stage.
IV.3.1.4.C Conclusion.We tried to observe conformational changes related to the tilting of the n-alkane chains
inside the crystals of sample (1) using infrared spectroscopy. Infrared spectra were
recorded at elevated temperatures and at -173°C. Also, chain conformation and tilt angle
were determined by low frequency Raman spectroscopy and S.A.X.S. measurements
carried out at room temperature. Contrary to the results obtained in previous work, the
value of the angle by which the n-alkane chains tilt from the crystal surfaces was not
found to increase with increasing annealing temperature. A 15° tilt angle was found in
all the cases. The degree of disorder in the n-alkane crystals was found to be dependent
on the annealing temperature and on the period of time spend at this temperature. By
successively increasing the annealing temperature and cooling down sample (1) to
-173°C, we observed a perfecting of the crystals which may predominate over the
formation of non all-trans conformers due to the chain tilting. Therefore, we tried to
obtain the most perfect crystals possible by annealing sample (1) at 85°C for 20 hours.
Then, we increased the annealing temperature up to 95°C for different periods of time.
At this temperature, tilting of the n-alkane chains was believed to occur. For the shorter
period of time, no chain tilt was detected by a S.A.X.S. experiment but, nevertheless, an
increase in the number of non all-trans conformers was observed by infrared
spectroscopy. Then, after a longer time at the same temperature, a strong increase in the
number of these conformations was detected and n-alkane chains were found to be tilted
from the crystal surfaces by around 15°. Finally, after the longest time spent at 95°C, a
general decrease in the number of non all-trans conformers was observed by infrared
spectroscopy, S.A.X.S. measurements indicating that n-alkane chains were remaining
tilted from the crystal surfaces by an angle of 15°. Thus, the tilting of the n-alkane
chains seems to occur in a two step process. First, an increase of the disorder is
necessary to create tilted chains. Secondly, once the chains are tilted, they try to adopt a
more stable conformation. By doing so, the concentration of defects present in the n-
150
Chapter IV / Pure long chain n-alkanes : n-C198H398 and n-C246H494
alkane chains is reduced. Also, changes in the initial {110} fold conformations seem to
occur.
IV.3.1.5 Transition from n-C198H398 in once folded to extended form.After annealing sample (1) at 110°C, n-alkane chains were found to tilt from the crystal
surfaces with an angle near to 15°. The transformation from folded to extended crystals
is expected around 119°C, followed by the formation of the tilted extended form.
Previous works have shown that extended chains formed through this transition were
tilted20,25’79,91 from the crystal surfaces by an angle of approximately 35°. Also, the
melting point of the extended form crystals was determined16 to be 126.7 7. 0.3 °C. In
order to study this transition, we annealed sample (1) successively at 112°C and 124°C,
in each case followed by cooling down to -173°C.
IV.3.1.5.a S.A.X.S. experiments.After annealing sample (1) at 112°C, we believe that the n-alkane chains were in a tilted
once folded conformation. After annealing at the highest temperature, 124°C, we used
S.A.X.S. measurements to determine the layer periodicity. It was found to be equal to
248.1 7. 1.3 A. The alkane chains were thus in the extended form with the chain axis
tilted from the crystal surfaces with an angle approximating 12 7. 3 °. Once again, the
value of the tilt angle is smaller than the one expected, on the basis of previous work79.
IV.3.1.5.b Infrared spectroscopy.
IV3.1.5.b.l Low temperature infrared spectra.The methylene wagging mode region of the infrared spectra of sample (1) recorded at
-173°C is shown in Figure IV.73.
151

Chapter IV / Pure long chain n-alkanes : n-C198H398 and n-C246H494
Figure IV.73 : Low temperature F.T.I.R. spectra of sample (1) cooled down from 112°C and 124°C
(b ): cooled down from 124°C (a ): cooled down from 112°C
1390 1380 1370 1360 1350 1340 1330 1320 1310 1300 1290 1280 1270 1260
wavenumbers
The low temperature infrared spectrum of sample (1) cooled down from 112°C is
believed to be characteristic of n-C198H398 samples in tilted once folded form. The low
temperature infrared spectrum of sample (1) cooled down from 124°C is believed to be
characteristic of n-C198H398 samples in tilted extended form. In both cases, a strong band
is present at 1376.5 cm*1 and is ascribed to the methyl symmetric bending mode. Also,
two weak bands at 1329 cm*1 and 1312 cm*1 are present in both spectra. On the other
hand, a clear difference in the intensity of the bands present in the spectra at around
1370 cm'1, 1354 cm*1 and 1346 cm'1 can be observed. The intensity of these bands,
assigned respectively to the gtg/gtg’ conformers, gg conformers and {110} fold
conformation, is greater in the spectrum of sample (1) cooled down from 112°C.
Therefore, from the above observation it seems that the extended and once folded forms
can be identified from their low temperature infrared spectra. A more precise
comparison of the concentration of non all-trans conformers present in n-C198H398
extended and folded form crystals will be presented later in this chapter.
Due to the poor quality of the infrared spectrum below 1200 cm'1 of sample (1) cooled
down from 112°C, we used in the following section the infrared spectrum of sample (1)
152
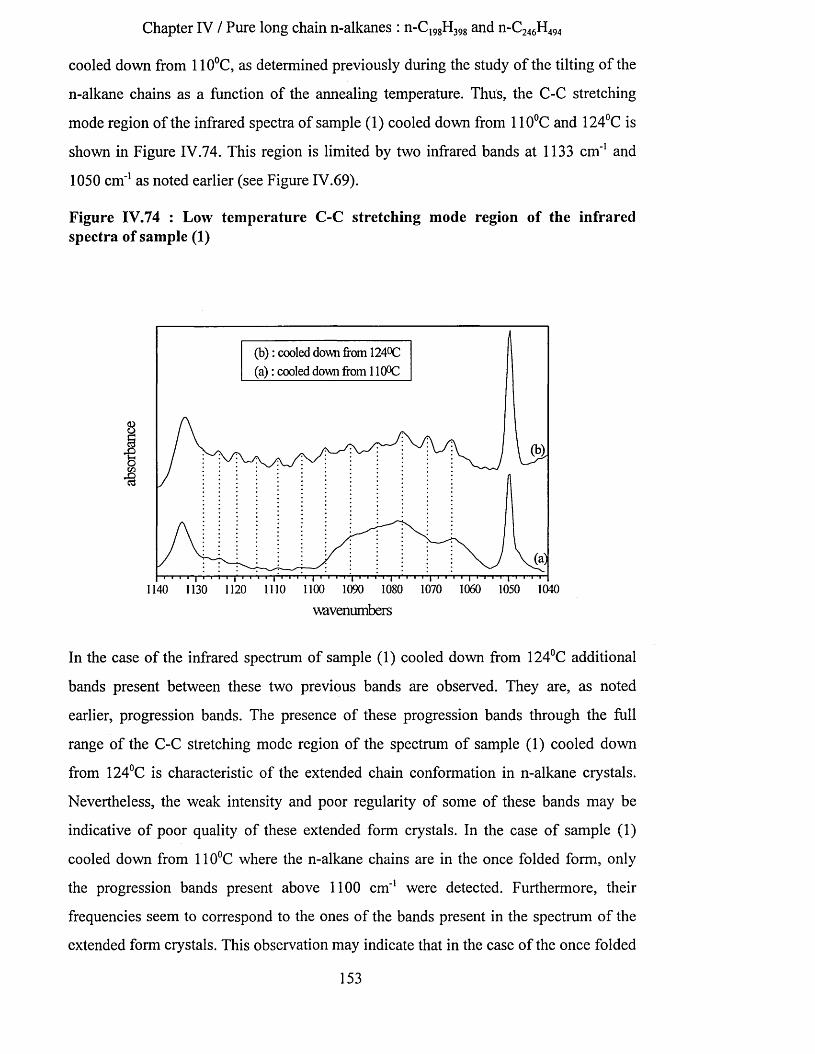
Chapter IV / Pure long chain n-alkanes : n-C198H398 and n-C246H494
cooled down from 110°C, as determined previously during the study of the tilting of the
n-alkane chains as a function of the annealing temperature. Thus, the C-C stretching
mode region of the infrared spectra of sample (1) cooled down from 110°C and 124°C is
shown in Figure IV.74. This region is limited by two infrared bands at 1133 cm'1 and
1050 cm'1 as noted earlier (see Figure IV.69).
Figure IV.74 : Low temperature C-C stretching mode region of the infrared spectra of sample (1)
(b ): cooled down from 124°C (a ): cooled down from 110°C
§
1140 1130 1120 1110 1100 1090 1080 1070 1060 1050 1040
wavenumbers
In the case of the infrared spectrum of sample (1) cooled down from 124°C additional
bands present between these two previous bands are observed. They are, as noted
earlier, progression bands. The presence of these progression bands through the full
range of the C-C stretching mode region of the spectrum of sample (1) cooled down
from 124°C is characteristic of the extended chain conformation in n-alkane crystals.
Nevertheless, the weak intensity and poor regularity of some of these bands may be
indicative of poor quality of these extended form crystals. In the case of sample (1)
cooled down from 110°C where the n-alkane chains are in the once folded form, only
the progression bands present above 1100 cm'1 were detected. Furthermore, their
frequencies seem to correspond to the ones of the bands present in the spectrum of the
extended form crystals. This observation may indicate that in the case of the once folded
153

Chapter IV / Pure long chain n-alkanes : n-C198H398 and n-C246H494
form sample, the two all-trans parts of the chains going through the crystal layers and
linked by the {110} folds correspond to the progression bands observed at the same
frequencies in the case of the extended form sample. Indeed, in the infrared spectrum of
n-C198H398 crystallised in extended form, where the number of carbon atoms present in
the all-trans part of the chains going through the crystal layers is similar to the one
present in n-C198H398 in once folded form, the value of the frequency shift between each
successive progression band should be about twice the value found in the last case.
Finally, the virtual absence of the broad bands at around 1089 cm*1, 1078 cm*1 and 1064
cm*1 in the spectrum of sample (1) cooled down from 124°C seems to support the
assignment of these bands to gauche conformers present at the crystal surfaces of the
sample and, perhaps for some of them, more specifically to the {110} fold.
In the case of sample (1) cooled down from 124°C, estimates of both the best series of k
values and the number of carbon atoms involved in the extended part of the n-alkane
chains were determined. A 7.1 error bar is estimated for the values of the integers k. The
average number of carbon atoms involved in the extended part of the n-alkane chains
was estimated to be equal to 191 7. 8. The frequency of each of these progression bands
is plotted against k, integer, in Figure IV.75. Also, the frequency of each of these bands
was fitted by a third order polynomial curve Y, shown by a black line.
154

Chapter IV / Pure long chain n-alkanes : n-C,9gH398 and n-C246H494
Figure IV.75 : Frequency of the progression bands ascribed to the C-C stretching mode against k, integer, for sample (1) cooled down from 124°C.
o sample (1) cooled down from 124°C Y = 1133.7 + 0.63*X -0.195*X2 + 3.15*10-3*X3
IV 3.1.5. b. 2 Series of elevated temperature infrared spectra.Sample (1) was annealed at 110°C for one hour. Then, it was heated up from 110.4°C to
121.6°C with a heating rate of 0.4°C/minute. A spectrum was recorded every four
minutes (or every 1.6°C). It took a total of three minutes fifty five seconds to record the
run. The full series of infrared spectra is shown in Figure IV.76.
155
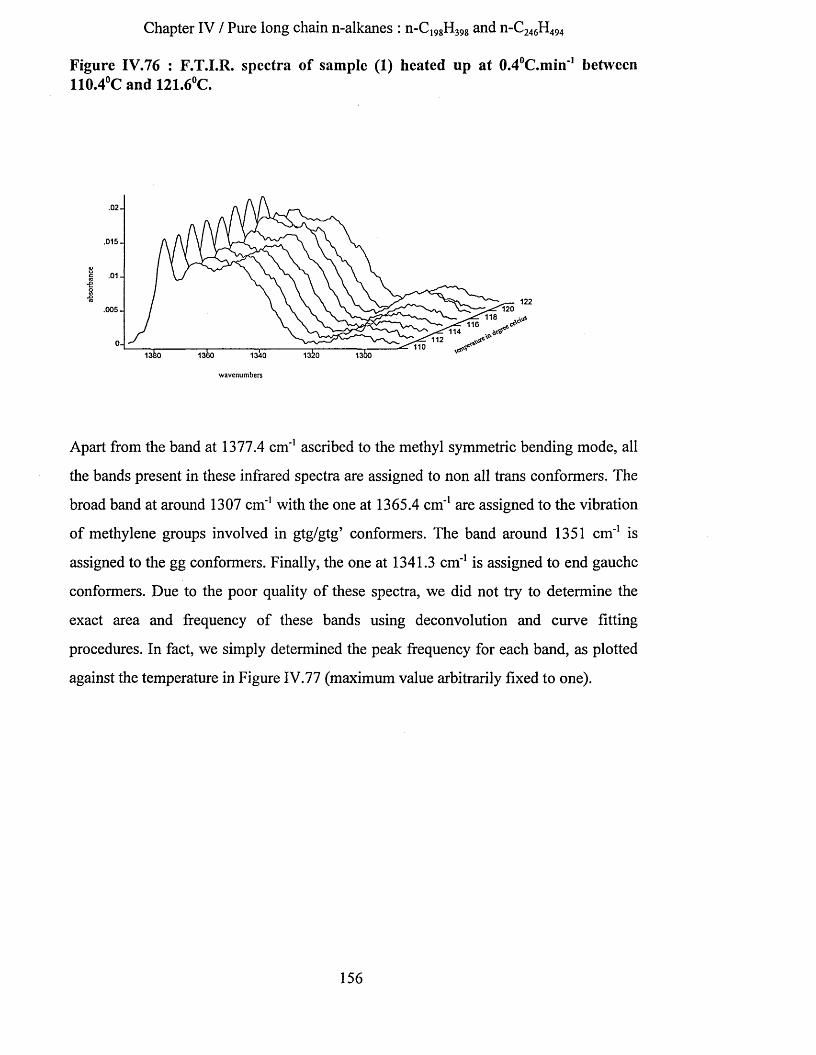
Chapter IV / Pure long chain n-alkanes : n-C198H398 and n-C246H494
Figure IV.76 : F.T.I.R. spectra of sample (1) heated up at 0.4°C.min'! between 110.4°C and 121.6°C.
.0 2 -
.015-
Sc•g
.0 1 -
o122
^ 120 ^118 , 116 ^
<e*6
.005 .
1141120- 110
13&0 13&0 130 13f)01340
w avenum bers
Apart from the band at 1377.4 cm'1 ascribed to the methyl symmetric bending mode, all
the bands present in these infrared spectra are assigned to non all trans conformers. The
broad band at around 1307 cm'1 with the one at 1365.4 cm"1 are assigned to the vibration
of methylene groups involved in gtg/gtg’ conformers. The band around 1351 cm'1 is
assigned to the gg conformers. Finally, the one at 1341.3 cm'1 is assigned to end gauche
conformers. Due to the poor quality of these spectra, we did not try to determine the
exact area and frequency of these bands using deconvolution and curve fitting
procedures. In fact, we simply determined the peak frequency for each band, as plotted
against the temperature in Figure IV.77 (maximum value arbitrarily fixed to one).
156

Chapter IV / Pure long chain n-alkanes : n-C198H398 and n-C246H494
Figure IV.77 : Normalised maximum intensity of the major bands present in the infrared spectra of sample (1) heated from 110.4°C to 121.6°C at 0.4°C/minute
1.0 0 -
a0.95-
0 .90-
0 .85-
B. 1377.4cm k— B. 1365.4cm
B. 1350.9cm — B. 1341.3cm
0.80-
0.75110 111 112 113 114 115 116 117 118 119 120 121 122
temperature in °C
The normalised peak height of the 1377.4 cm'1 band varies within 5% of its maximum
value over the temperature range used. In the wagging mode region, this infrared band is
the least sensitive to the increase in temperature. At the same time, the normalised peak
height of the band at 1350.9 cm'1 ascribed to the gg conformers increases by roughly
10% of its maximum value. Its maximum is reached at 118.4°C. Indeed, a further
increase of the temperature above 118.4°C is followed by a decrease of its normalised
intensity. The normalised peak height of the band at 1365.4 cm'1 ascribed to gtg/gtg’
conformers increases by around 15% of its maximum value between 110.4°C and
121.6°C. Its maximum is reached at 118.4°C. In the case of the 1307 cm'1 band (not
plotted in Figure IV.77 to improve the clarity of the figure) also ascribed to gtg/gtg’
conformers, the normalised peak height was found to increase by more than 60% of its
maximum value over the temperature range used. Its maximum is reached, once again,
at 118.4°C. Above 118.4°C, a decrease of the peak height by around 50% of its
maximum value is detected. On the other hand, the normalised peak height of the
1341.3 cm'1 band assigned to the end gauche conformers decreases by around 20% with
157

Chapter IV / Pure long chain n-alkanes : n-C,98FI398 and n-C246H494
increasing temperature up to 120°C. In the last spectrum recorded at 121.6°C, its value
finally increases by around 15%.
By increasing the temperature up to 119°C, the temperature at which the transition
occurs, the number of the non all-trans conformers positioned in the interior of the n-
alkane chains increases. The highest concentration of non all trans conformers is
detected at the transition temperature. Within a few degrees above this transition, the
concentration of these conformers is reduced. On the other hand, the concentration of
end gauche conformers does not follow the same pattern. Indeed, a decrease in the
concentration of end gauche conformers by nearly 20% of its maximum value is
observed with the increase in temperature up to 120°C. Once again, this observation is
contradictory to the results which were expected on the basis of thermally activated non
all-trans conformers.
IV .3 .1 .5 .C ConclusionUsing F.T.I.R spectroscopy we can identify, from the methylene wagging mode region
of the low temperature spectra, once folded crystals from the extended form. Indeed, the
absorbance of the infrared bands assigned to the methylene groups involved in non all-
trans conformers is clearly lower in the case of the extended form crystals. Moreover, in
the next section, we will use this region of the infrared spectra to estimate the disorder
present in each of the different crystal forms. Also, in the wagging mode region of the
infrared spectra recorded at elevated temperatures, the absorbances of the bands
assigned to non all-trans conformers are found to be sensitive to the phase transition
occurring between the two different crystal forms. At this transition, a maximum in the
absorbance of the bands ascribed to non all-trans conformers placed in the interior of the
n-alkane chains is observed. On the other hand, the absorbance of the band assigned to
end gauche conformers decreases up to the transition. The transition from once folded to
extended chain crystals thus occurs through a disordering process involving essentially
the internal bonds of the n-alkane chains. Also, at the transition, the disorder reaches a
local maximum.
By studying the C-C stretching mode region of the low temperature infrared spectra we
can differentiate the once folded form crystals from the extended form. Indeed, the
158

Chapter IV / Pure long chain n-alkanes : n-C198H398 and n-C246H494
presence of progression bands through the full region and the absence of infrared bands
at around 1078 cm'1 and 1064 cm'1 are a fingerprint of the extended chain crystals. Also,
from the identification of each one of these progression bands, we estimate the number
of carbon atoms involved in the extended part of the n-alkane chains in both once folded
and extended forms to be respectively 90 7_ 16 and 191 7 .8. These numbers of carbon
atoms can be compared with the ones determined from both low frequency Raman
spectroscopy and S.A.X.S. measurements. In the case of the once folded crystals, the
numbers of carbon atoms determined by S.A.X.S. measurements and Raman
spectroscopy are respectively 97 7. 1 and 98 7. 2. In the case of the extended form
crystals, the numbers of carbon atoms determined from the S.A.X.S. experiment is 194
7. 1. Thus, infrared spectroscopy, S.A.X.S. techniques and low frequency Raman
spectroscopy give similar results for the number of carbon atoms present in the chain
stem of both once folded and extended form crystals
IV.3.2 Sample (2): n-C,98H398 crystallised in extended form.
IV.3.2.1 S.A.X.S. measurements.The calculated value of the crystal thickness for n-C198H398 in the extended chain
conformation is 254 A. The layer periodicity corresponding to sample (2) was found to
be equal to 253.3 7 .1.3 A. This value is in very good agreement with the calculated one.
Within sample (2) crystals, n-alkane chains are in an extended form with the chain axis
perpendicular to the crystal surfaces. We note that three orders of diffraction were
observed on the S.A.X.S. patterns for an exposure time of 25 hours.
S.A.X.S. measurements were made on sample (2) annealed at 115°C. The average layer
periodicity was found to be equal to 253.7 7. 1.2 A. This value is similar to the original
one. At least up to 115°C, n-alkane chains within the crystals of sample (2) are in the
extended form with the chain axis perpendicular to the surface of the crystal layers. Up
to nine orders of diffraction were observed on the S.A.X.S. patterns of this last sample
for an exposure time of 24 hours. The higher number of orders of diffraction in the
sample annealed at 115°C could be explained by a more perfect crystal stacking. This
159

Chapter IV / Pure long chain n-alkanes : n-C198H398 n-C246H494
may indicate a higher regularity of crystals and amorphous layers which become more
perfectly superposed after annealing at 115°C.
IV.3.2.2 Raman Spectroscopy.The Raman spectrum of sample (2) recorded at room temperature between 1650 cm'1
and 850 cm'1 is shown in Figure IV.78.
Figure IV.78 : Raman spectrum of sample (2) recorded at room temperature
10000- 1293 cm-1
9000-
8000-
7000-
1414 crrr16000-1460 crrr1
5000-889 cm-1
4000-
3000-
200016501600 1550 1500 1450 1400 1350 1300 12501200 1150 11001050 1000 950 900 850
Raman shift (cnr1)
The Raman bands present in the spectrum of sample (2) shown in Figure IV.78 are
assigned in Table IV. 17.
160

Chapter IV / Pure long chain n-alkanes : n-C198H398 and n-C246H494
Table IV.17 : Assignment of the Raman bands present in the spectrum of sample
Raman shift (cm’1) assignment
1460 methylene bending mode84
1439 methylene bending mode84
1414 methylene bending mode84, characteristic of the orthorhombic subcell packing85
1368 methylene wagging mode85
1293 in-phase methylene twisting mode40
1167 out-of-phase methylene rocking mode40
1128 in-phase C-C stretching mode85
1060 out-of-phase C-C stretching mode 85
889 methyl rocking mode92
The C-H stretching region of the Raman spectrum of sample (2) is shown in Figure
IV.79.
Figure IV.79 : Raman spectrum of sample (2) recorded at room temperature between 3100 cm’1 and 2500 cm'1
22000
20000
18000
16000-
14000-
’§ 12000-JD j
10000M8000- 2906 cm-'
6000-
4000-
2000-
3100 3050 3000 2950 2900 2850 2800 2750 2700 2650 2600 2550 2500
Raman shift (cm*1)
161
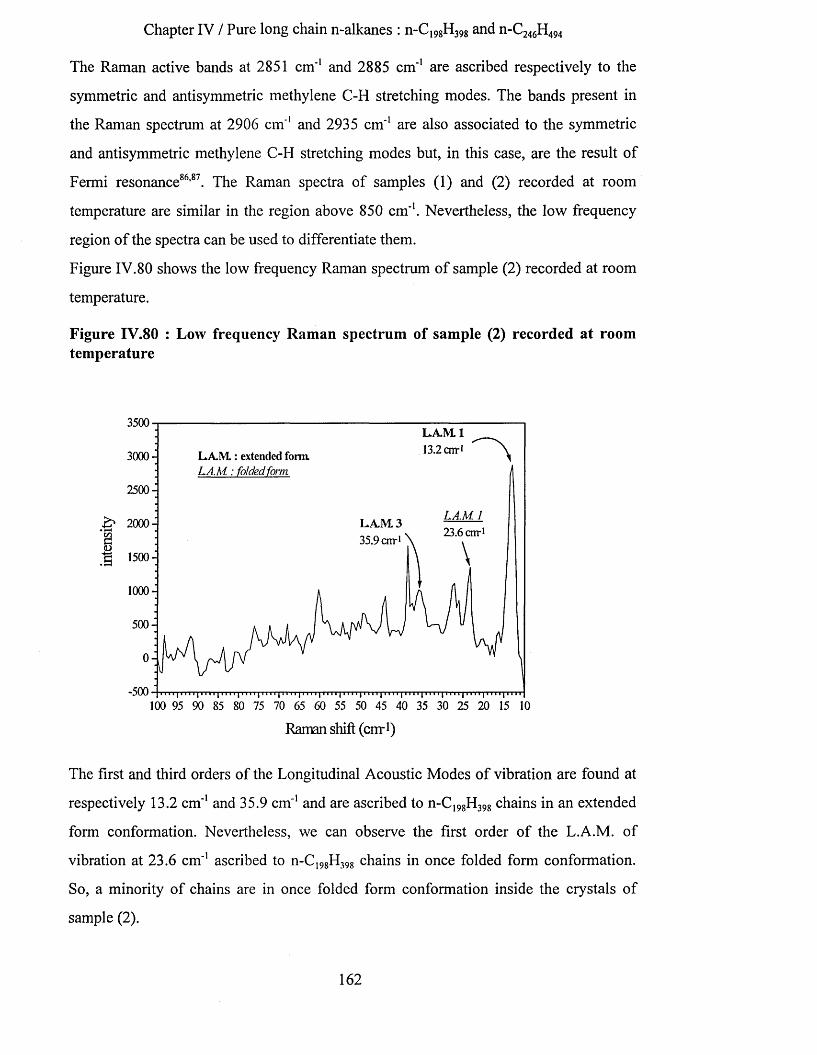
Chapter IV / Pure long chain n-alkanes : n-CI9gH398 and n-C246H494
The Raman active bands at 2851 cm'1 and 2885 cm'1 are ascribed respectively to the
symmetric and antisymmetric methylene C-H stretching modes. The bands present in
the Raman spectrum at 2906 cm'1 and 2935 cm'1 are also associated to the symmetric
and antisymmetric methylene C-H stretching modes but, in this case, are the result of
Fermi resonance86,87. The Raman spectra of samples (1) and (2) recorded at room
temperature are similar in the region above 850 cm'1. Nevertheless, the low frequency
region of the spectra can be used to differentiate them.
Figure IV.80 shows the low frequency Raman spectrum of sample (2) recorded at room
temperature.
Figure IV.80 : Low frequency Raman spectrum of sample (2) recorded at room temperature
3500L.A.M. 113.2 cm-i3000- L.A.M : extended form.
L.A.M.: folded form
2500-
L A M 1& 2000 -
% : <D‘ 1500 -
1000-
500-
0-
-500100 95 90 85 80 75 70 65 60 55 50 45 40 35 30 25 20 15 10
Raman shift (cnr1)
The first and third orders of the Longitudinal Acoustic Modes of vibration are found at
respectively 13.2 cm'1 and 35.9 cm'1 and are ascribed to n-C,98H398 chains in an extended
form conformation. Nevertheless, we can observe the first order of the L.A.M. of
vibration at 23.6 cm'1 ascribed to n-C198H398 chains in once folded form conformation.
So, a minority of chains are in once folded form conformation inside the crystals of
sample (2).
162
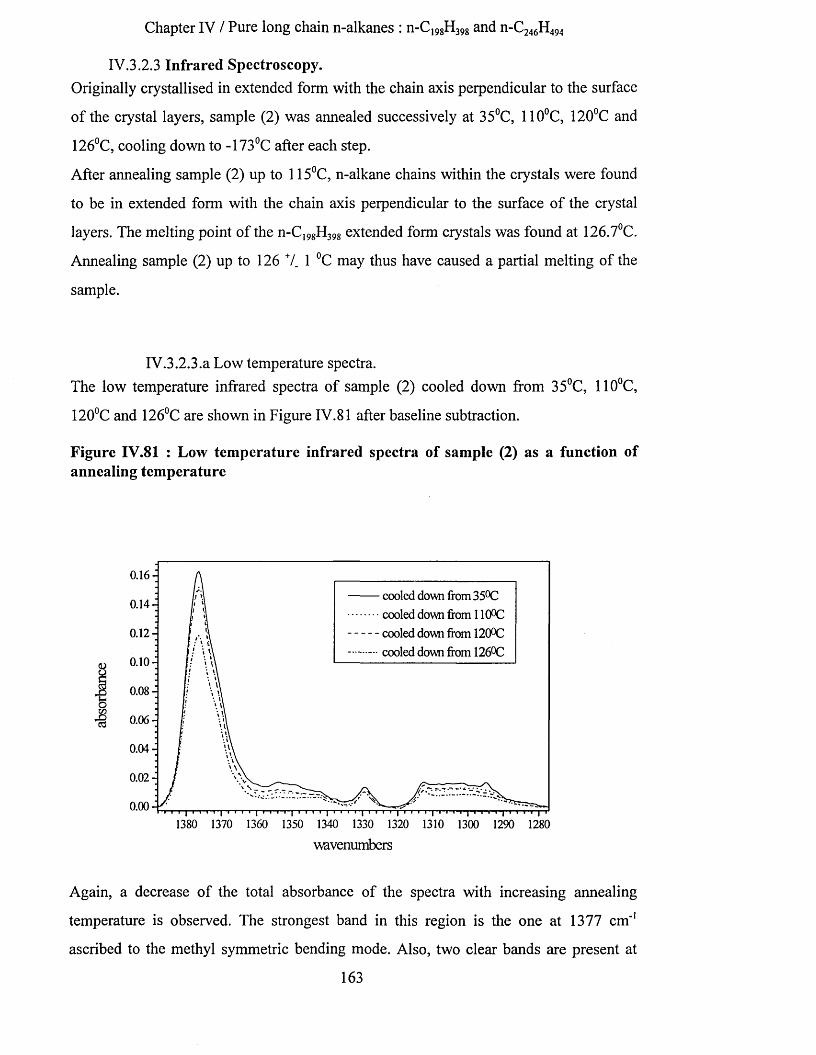
Chapter IV / Pure long chain n-alkanes : n-C198H398 and n-C246H494
IV.3.2.3 Infrared Spectroscopy.Originally crystallised in extended form with the chain axis perpendicular to the surface
of the crystal layers, sample (2) was annealed successively at 35°C, 110°C, 120°C and
126°C, cooling down to -173°C after each step.
After annealing sample (2) up to 115°C, n-alkane chains within the crystals were found
to be in extended form with the chain axis perpendicular to the surface of the ciystal
layers. The melting point of the n-CI98H398 extended form crystals was found at 126.7°C.
Annealing sample (2) up to 126 7_ 1 °C may thus have caused a partial melting of the
sample.
IV.3.2.3.a Low temperature spectra.The low temperature infrared spectra of sample (2) cooled down from 35°C, 110°C,
120°C and 126°C are shown in Figure IV.81 after baseline subtraction.
Figure IV.81 : Low temperature infrared spectra of sample (2) as a function of annealing temperature
0. 12 -
0.10-
0.08-
0.06-
0.04-
0.02 -
0.00
cooled down from 35°C cooled down from 110°C cooled down from 120°C cooled down from 126°C
0.16-
0.14-
1380 1370 1360 1350 1340 1330 1320 1310 1300 1290 1280
wavenumbers
Again, a decrease of the total absorbance of the spectra with increasing annealing
temperature is observed. The strongest band in this region is the one at 1377 cm'1
ascribed to the methyl symmetric bending mode. Also, two clear bands are present at
163

Chapter IV / Pure long chain n-alkanes : n-C198H398 and n-C246H494
1329 cm'1 and 1312 cm'1. Compared to the spectra of Figure IV.62, we notice here a
weaker intensity of the bands ascribed to the non all-trans conformers. Second
derivatives, deconvolutions and curve fitting procedures were used in the wagging mode
region between 1388.1 cm'1 and 1323 cm'1 (Table IV. 18) and between 1323 cm'1 and
1277.2 cm'1 (Table IV. 19).
Table IV.18 : Frequency and area of the infrared bands determined by curve fitting procedures on low temperature spectra of sample (2)
areawavenumbers
cm'1cooled down from T=35°C
cooled down from T=110°C
cooled down from T=120°C
cooled down from T=126°C
1377 1.2405 1.1531 1.1556 0.92941370.7 0.3766 0.3741 0.3597 0.28671364.2 0.2174 0.1227 0.1429 0.08801353.7 0.1468 0.0936 0.1106 0.06361346 0.0651 0.0580 0.0459 0.03601341 0.0706 0.0387 0.0526 0.0365
1329.4 0.0710 0.0430 0.0671 0.0463
Table IV.19 : Frequency and area of the infrared bands determined by curve fitting procedures on low temperature spectra of sample (2)
areawavenumbers
cm'1cooled down from T=35°C
cooled down from T=110°C
cooled down from T=120°C
cooled down from T=126°C
1312.6 0.0921 0.0660 0.0662 0.04911308.5 0.0469 0.0364 0.0412 0.02501305.7 0.0322 0.0232 0.0266 0.02081302 0.0950 0.0781 0.0751 0.0447
1298.2 0.0321 0.0284 0.0105 0.01141294.9 0.0586 0.0485 0.0656 0.05181288.8 0.0297 0.0268 0.0327 0.02051283.1 0.0128 0.0223 0.0142 0.0308
The bands present in Table IV.18 are shown in Figure IV.82 and Figure IV.83 where
their integrated absorbance (maximum value arbitrarily fixed to one) is plotted against
the temperature from which the sample was cooled down.
164
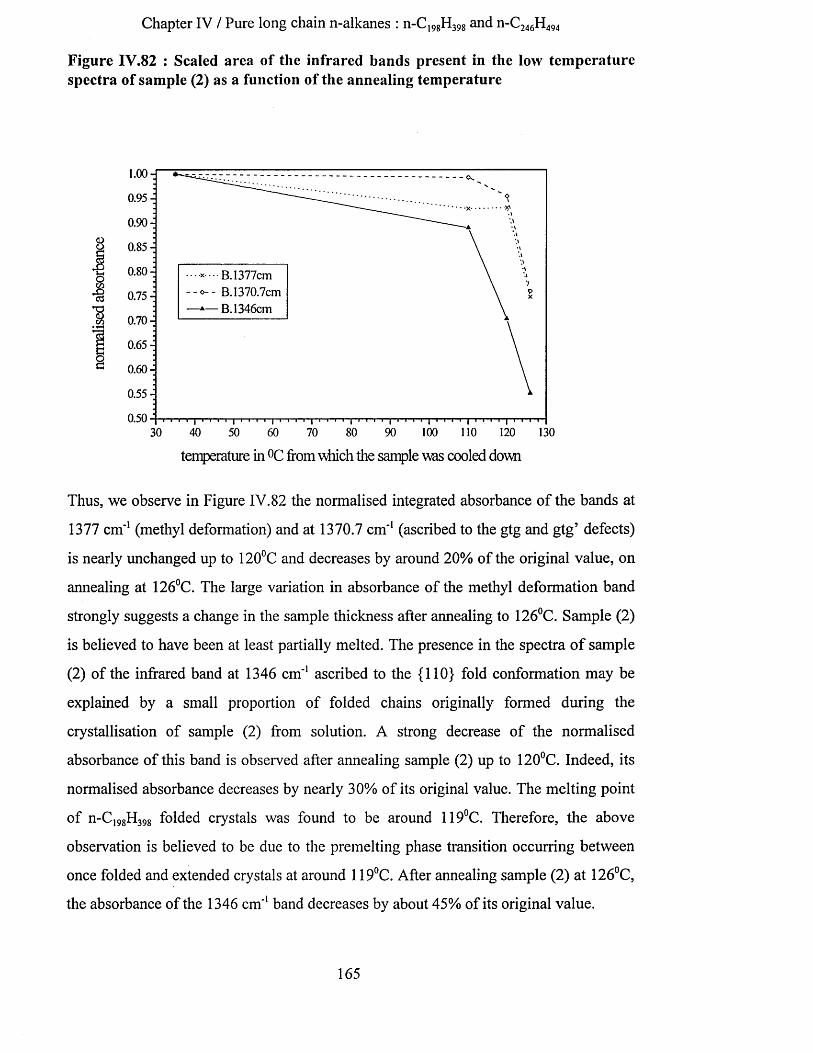
Chapter IV / Pure long chain n-alkanes : n-C198H398 and n-C246H494
Figure IV.82 : Scaled area of the infrared bands present in the low tem perature spectra of sample (2) as a function of the annealing temperature
1.00-J0.95-
0.90-i
U 0.85
0.80- b. 1377cm B. 1370.7cm
— A— B. 1346cm0.75-
0.70-
0.65-
8 0.60-
0.55-
0.5090 100 110 120 13030 40 50 60 70 80
temperature in °C from which the sample was cooled down
Thus, we observe in Figure IV.82 the normalised integrated absorbance of the bands at
1377 cm'1 (methyl deformation) and at 1370.7 cm'1 (ascribed to the gtg and gtg’ defects)
is nearly unchanged up to 120°C and decreases by around 20% of the original value, on
annealing at 126°C. The large variation in absorbance of the methyl deformation band
strongly suggests a change in the sample thickness after annealing to 126°C. Sample (2)
is believed to have been at least partially melted. The presence in the spectra of sample
(2) of the infrared band at 1346 cm'1 ascribed to the {110} fold conformation may be
explained by a small proportion of folded chains originally formed during the
crystallisation of sample (2) from solution. A strong decrease of the normalised
absorbance of this band is observed after annealing sample (2) up to 120°C. Indeed, its
normalised absorbance decreases by nearly 30% of its original value. The melting point
of n-C198H398 folded crystals was found to be around 119°C. Therefore, the above
observation is believed to be due to the premelting phase transition occurring between
once folded and extended crystals at around 119°C. After annealing sample (2) at 126°C,
the absorbance of the 1346 cm'1 band decreases by about 45% of its original value.
165

Chapter IV / Pure long chain n-alkanes : n-Ci98H398 and n-C246H494
In Figure IV.83, the variation of the normalised integrated absorbance of the bands at
1364.2 cm'1, 1353.7 cm'1, 1341 cm'1 and 1329 cm'1 can be observed.
Figure IV.83 : Scaled area of the infrared bands present in the low temperature spectra of sample (2) as a function of the annealing temperature
B.1377cm B. 1364.2cm B. 1353.7cm B.1341cm B. 1329.4cm
30 40 50 60 70 80 90 100 110 120 130
temperature in °C from which the sample was cooled down
After annealing to 110°C, the area of each of these bands decreases by around 40% of
their original values. Apart from the band at 1329 cm'1, all the others are assigned to non
all-trans conformers. Therefore, the strong decrease of the normalised absorbance
indicates a decrease in the concentration of the conformers related to these bands within
the n-alkane crystals. Furthermore, after annealing at 126°C, the absorbance of the bands
at 1364.2 cm*1 and 1353.7 cm'1 decreases by nearly 60% of their original values.
Through the annealing and cooling of sample (2), a perfecting of the n-alkane crystals
occurs. Nevertheless, a clear increase in the absorbance of these four infrared bands is
observed on annealing at 120°C. As explained earlier, a phase transition between once
folded and extended form crystals occurs at around 119°C. Therefore, at this transition,
the degree of disorder reaches a local maximum. Also, the sample requires some time at
the temperature to reach thermal equilibrium. Therefore, the increase of the normalised
absorbance of the bands present in Figure IV.83, may be caused by this premelting
166

Chapter IV / Pure long chain n-alkanes : n-C198H398 and n-C246H494
phase transition. Also, this effect may be enhanced if the sample spent different times at
the chosen temperatures.
Some of the bands present in Table IV. 19 (bold type) are shown in Figure IV.84 and
Figure IV.85 where their integrated absorbance (maximum value arbitrarily fixed to
one) is plotted against the temperature from which the sample was cooled down.
Figure IV.84 : Scaled area of the infrared bands present in the low temperature spectra of sample (2) as a function of the annealing temperature
1.00 d
0.95 d
0.90
g 0.85
J 0.80-i
1 0J5i0.70-
B. 1377cm - B.1312.6cm
— B. 1302cm0.65 ■;
0.60 ■:S
0.55 -j
0.50
0.4560 70 80 90 100 110 120 13030 40 50
temperature in °C from which the sample was cooled down
The scaled areas of the bands at 1312.6 cm'1 and 1302 cm'1 decreased by around 20% of
their maximum values after annealing to 110°C. The largest decrease, nearly 50%,
occurs after annealing to 126°C. Once again, this effect is believed to be linked to the
thinning of the sample occurring through its partial melting.
167
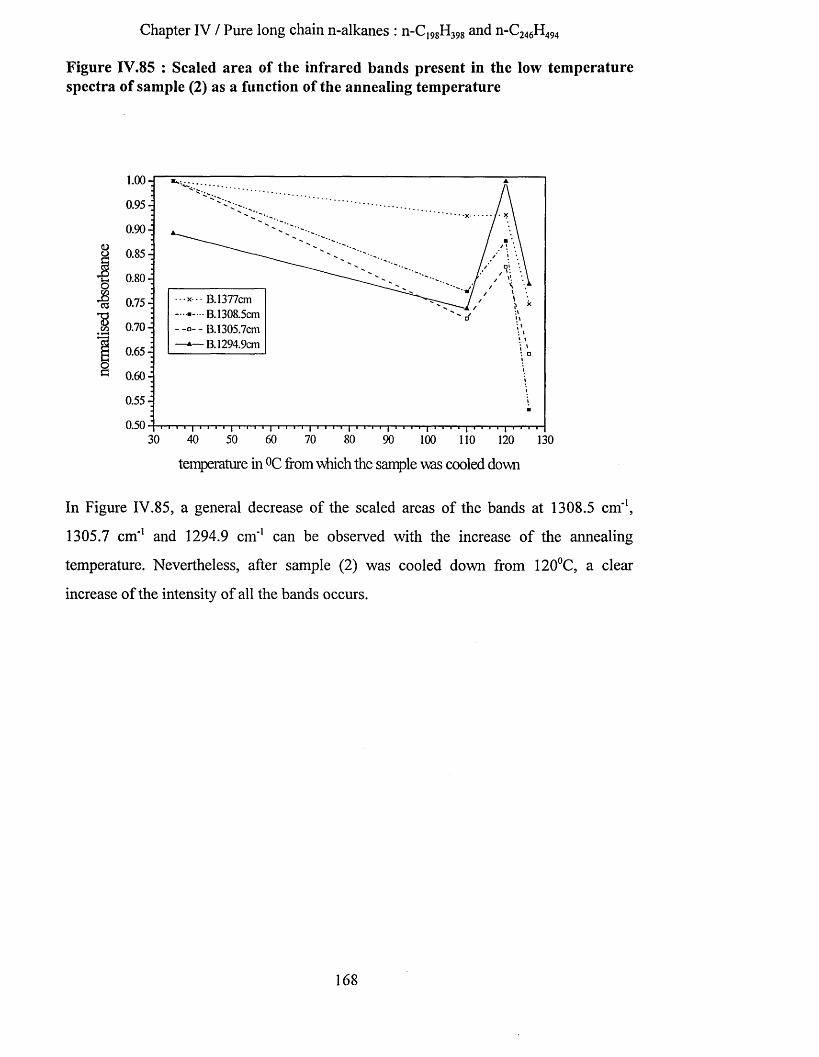
Chapter IV / Pure long chain n-alkanes : n-C198H398 and n-C246H494
Figure IV.85 : Scaled area of the infrared bands present in the low temperature spectra of sample (2) as a function of the annealing temperature
1.00-1
0.95-
0.90
2 0.85
a o.8o- o :*ci 0.75-j
% a 7 ° - i
B. 1377cm B. 1308.5cm
- - B.1305.7cm l— B. 1294.9cmB 0.65 -i
Q :c 0.60-
0.55-
0.5030 40 50 60 70 80 90 100 110 120 130
temperature in °C from which the sample was cooled down
In Figure IV.85, a general decrease of the scaled areas of the bands at 1308.5 cm"1,
1305.7 cm'1 and 1294.9 cm'1 can be observed with the increase of the annealing
temperature. Nevertheless, after sample (2) was cooled down from 120°C, a clear
increase of the intensity of all the bands occurs.
168

Chapter IV / Pure long chain n-alkanes : n-C198H398 and n-C246H494
Figure IV.86 : Scaled area of some infrared bands present in the low temperature spectra of sample (2) as a function of the annealing temperature
1.00-
0.95-•\x
8 :| 0.90-
S0.85 -
*8w’’1 0.80-
x B. 1377cm — a — B.888cm - - o - - B. 1174cm —□— area.2670cm
0.75-
0.7030 40 50 60 70 80 90 120 130
temperature in °C from which the sample was cooled down
In the case of sample (2), no tilting of the n-alkane chains inside the crystal layers was
expected with the increase in temperature below the melting point. No change in the
original value of the average layer periodicity of sample (2) was observed after
annealing up to 115°C. The presence of the {110} fold band at 1346 cm'1 can be
explained by the formation of a minority of folded chains during the initial
crystallisation from solution. This is supported by the presence of the first order of the
L.A. mode at 23.6 cm'1 in the low frequency Raman spectrum of sample (2) in Figure
IV.80. The strong decrease of the absorbance of the 1346 cm'1 band after annealing to
120°C may be explained by the melting, occurring around 119°C, of crystals inside
which the alkane chains were in a once folded form conformation. Also, an unexpected
increase of the absorbance of the bands represented in Figure IV.83 and Figure IV.85
was observed, on cooling down from 120°C. This too may be due to the folded chain
premelting phase transition, possibly combined with the fact that the sample may not
have spent the same times at the chosen temperatures.
Figure IV.86 shows the variation of the area of different infrared bands (maximum value
arbitrarily fixed to one), as a function of the temperature at which the sample was
169

Chapter IV / Pure long chain n-alkanes : n-C198H398 and n-C246H494
annealed. All but one is centred outside the wagging mode region of the infrared
spectra. The infrared bands at 888 cm'1 and 1174 cm'1 are ascribed respectively to the
methyl rocking and methylene wagging modes of vibration. The variation of the area of
a broad band between 2690 cm'1 and 2558 cm'1 and centred around 2670 cm'1 is also
plotted. The maximum area of each band was arbitrarily fixed equal to one. The area of
each of these infrared bands decreases strongly after annealing to 126°C. Changes in the
density or thickness of the sample may have occurred, through the partial melting,
which was suggested earlier. In order to compensate for the thinning of the sample due
to its partial melting, we decided to normalise the low temperature infrared spectra
shown in Figure IV.81 using the area of the band which was the least sensitive to the
annealing of sample (2). The broad band centred at 2670 cm'1 is the one chosen. Indeed,
its normalised area varies within less than 5% of its original value, for low temperature
data. The original spectra of sample (2) cooled down from 35°C, 110°C, 120°C and
126°C were thus multiplied respectively by 1.0144, 1, 1.0293 and 1.1647. The
normalised low temperature infrared spectra of sample (2) are shown in Figure IV.87.
Figure IV.87 : Low temperature F.T.I.R. spectra of sample (2) normalised using the area of the 2670 cm'1 band.
'o(Z)%
cooled down from 35°C cooled down from 110°C cooled down from 120°C cooled down from 126°C
0.09-
0.05-0.04-0.03-
0.0
1380 1370 1360 1350 1340 1330 1320 1310 1300 1290 1280
wavenumbers
170
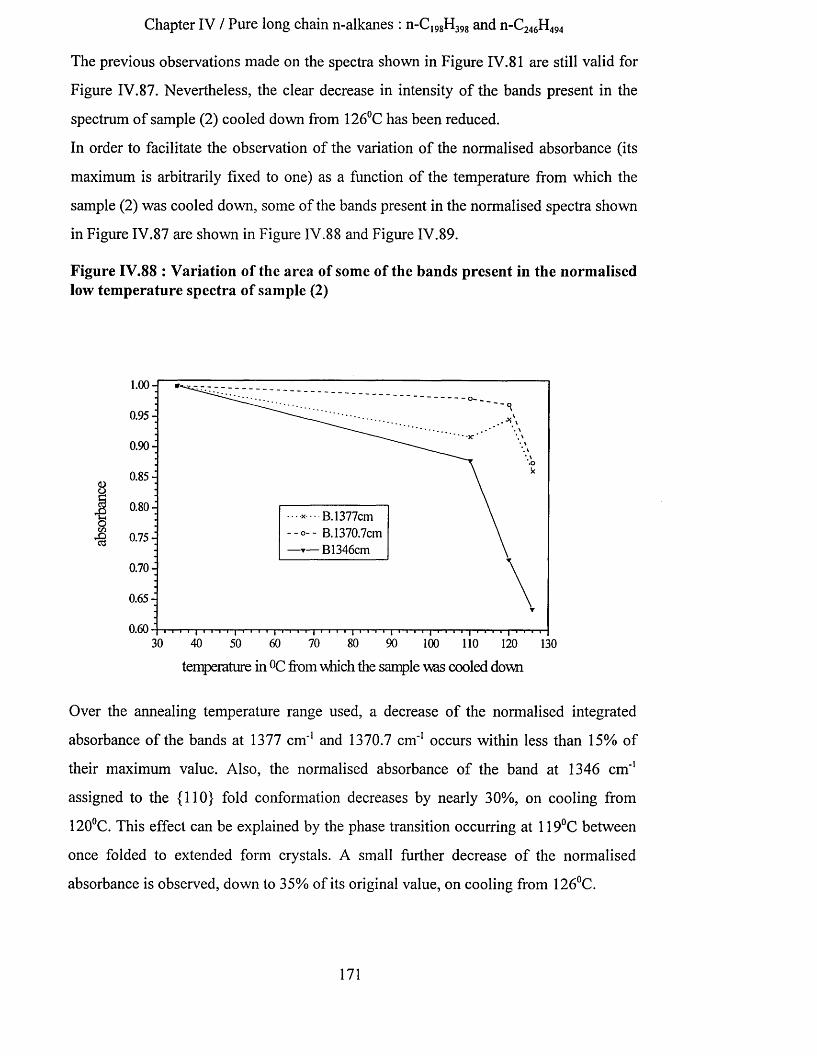
Chapter IV / Pure long chain n-alkanes : n-C198H398 and n-C246H494
The previous observations made on the spectra shown in Figure IV.81 are still valid for
Figure IV.87. Nevertheless, the clear decrease in intensity of the bands present in the
spectrum of sample (2) cooled down from 126°C has been reduced.
In order to facilitate the observation of the variation of the normalised absorbance (its
maximum is arbitrarily fixed to one) as a function of the temperature from which the
sample (2) was cooled down, some of the bands present in the normalised spectra shown
in Figure IV.87 are shown in Figure IV.88 and Figure IV.89.
Figure IV.88 : Variation of the area of some of the bands present in the normalised low temperature spectra of sample (2)
l.oo H
0.95-
0.90
0.85-
§ :1 0.80-
§ :•a °-75-
‘ ••B. 1377cm B. 1370.7cm
r— B1346cm0.70-
0.65-
0.6030 40 70 80 9050 60 100 110 120 130
temperature in °C from which the sample was cooled down
Over the annealing temperature range used, a decrease of the normalised integrated
absorbance of the bands at 1377 cm'1 and 1370.7 cm'1 occurs within less than 15% of
their maximum value. Also, the normalised absorbance of the band at 1346 cm'1
assigned to the {110} fold conformation decreases by nearly 30%, on cooling from
120°C. This effect can be explained by the phase transition occurring at 119°C between
once folded to extended form crystals. A small further decrease of the normalised
absorbance is observed, down to 35% of its original value, on cooling from 126°C.
171
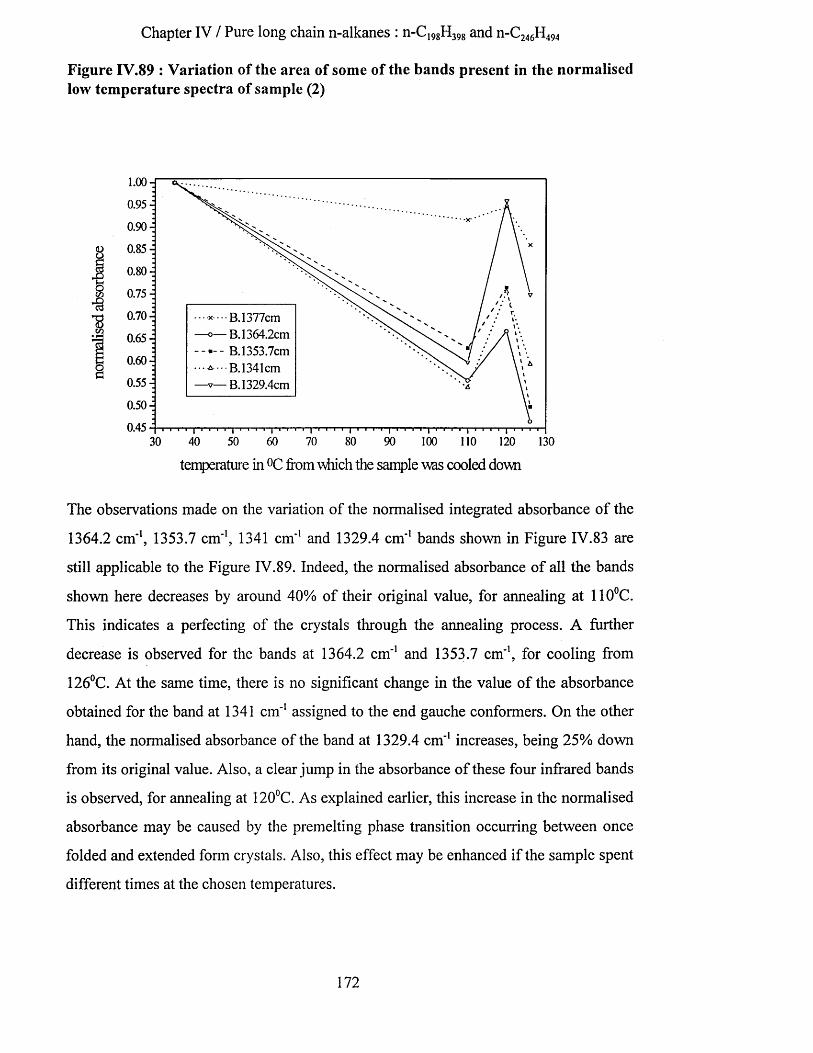
Chapter IV / Pure long chain n-alkanes : n-C198H398 and n-C246H494
Figure IV.89 : Variation of the area of some of the bands present in the normalised low temperature spectra of sample (2)
1.00 H
0.95 ■;
o.9o •:
g 0.85 -j
J 0.80 -j& :8 0.75 -
*ci :*8 0J0~'. OT
* • • B. 1377cm ■o— B. 1364.2cm
B. 1353.7cm A • • B.1341cm •v— B. 1329.4cm
0.65
0.60-i8 0.55
o.5o •:
0.4540 50 60 70 80 90 100 110 120 13030
temperature in °C from which the sample was cooled down
The observations made on the variation of the normalised integrated absorbance of the
1364.2 cm*1, 1353.7 cm'1, 1341 cm*1 and 1329.4 cm*1 bands shown in Figure IV.83 are
still applicable to the Figure IV.89. Indeed, the normalised absorbance of all the bands
shown here decreases by around 40% of their original value, for annealing at 110°C.
This indicates a perfecting of the crystals through the annealing process. A further
decrease is observed for the bands at 1364.2 cm*1 and 1353.7 cm*1, for cooling from
126°C. At the same time, there is no significant change in the value of the absorbance
obtained for the band at 1341 cm*1 assigned to the end gauche conformers. On the other
hand, the normalised absorbance of the band at 1329.4 cm*1 increases, being 25% down
from its original value. Also, a clear jump in the absorbance of these four infrared bands
is observed, for annealing at 120°C. As explained earlier, this increase in the normalised
absorbance may be caused by the premelting phase transition occurring between once
folded and extended form crystals. Also, this effect may be enhanced if the sample spent
different times at the chosen temperatures.
172

Chapter IV / Pure long chain n-alkanes : n-CI98H398 and n-C246H494
The C-C stretching mode region of the infrared spectra of sample (2) successively
annealed at 35°C, 110°C, 120°C and 126°C, and then cooled down to -173°C, is shown
in Figure IV.90.
Figure IV.90 : Low temperature infrared spectra of the C-C stretching mode region of sample (2)
(d) : cooled down from 126°C (c ): cooled down from 120°C (b ): cooled down from 110°C (a ): cooled down from 35°C
3
1140 1130 1120 1110 1100 1090 1080 1070 1060 1050 1040
wavenumbers
The band progression region is limited by two extreme bands at 1133 and 1050 cm'1.
Each one of the progression bands present in this region (crossed by a vertical dotted
line) is ascribed to non-localised mode of vibration, as noted earlier. The disappearance
of the 1056 cm'1 band noted earlier, in addition to both the higher regularity and better
resolution of the progression bands, may be seen as evidence of a perfecting of the
extended crystals inside which the concentration of remaining non all-trans conformers
present, in particular near the crystal surfaces originally formed during the
crystallisation of sample (2) from solution, decreases. Furthermore, the higher regularity
and better resolution of the progression bands may be due to a narrower distribution of
all-trans extended chain lengths with the increase of annealing temperature.
In the case of sample (2) cooled-down from 126°C, estimates for both the best series of
k values and the number of carbon atoms involved in the extended part of the n-alkane
chains were determined. A V . 1 error bar is estimated on the values of the integers k. The
173

Chapter IV / Pure long chain n-alkanes : n-C198H398 and n-C246H494
average number of carbon atoms involved in the extended part of the n-alkane chains is
estimated to be equal to 192 +/_ 12. The frequency of each of these progression bands is
plotted against the integer k, in Figure IV.91. Also, the frequency of each of these bands
was fitted by a third order polynomial curve Y, shown by a black line.
Figure IV.91 : Frequency of the progression bands ascribed to the C-C stretching mode against k, integer, for sample (2) cooled down from 126°C.
o sample(2) cooled down from 126°C
Y = 1133.6 + 0.61*X - 0 .189*X2+ 2.97*10-3*X3
0 5 10 15 20 25 30 35 40
k
The frequency differences between each of these successive bands ( vk — vk+2) is
plotted against the integer k in Figure IV.92.
174

Chapter IV / Pure long chain n-alkanes : n-C198H398 and n-C246H494
Figure IV.92 : Frequency differences between successive progression bands present in the C-C stretching mode region of the low temperature infrared spectra of sample (2)
7.0
6.5
6.0 -
5.5-
5.0-
4.5-
4.0-
3.5-
3.00 5 10 15 20 25 30 35 40
integer k
This frequency difference is found to go through a maximum which is centred on the
band at 1084.3 cm'1. The shape of this curve is similar to what can be found studying the
infrared spectra of short chain n-alkane crystals41. Therefore, this may be indicative of a
high degree of order within sample (2) crystals.
IV.3.2.3.b Elevated temperature spectra.The infrared spectra of sample (2) were also recorded at 35°C, 110°C, 120°C and 126°C.
We normalised the elevated temperature infrared spectra using the values of the area of
the broad band at 2670 cm'1 determined in the spectra of sample (2) recorded at -173°C.
These normalised infrared spectra are shown in Figure IV.93.
175
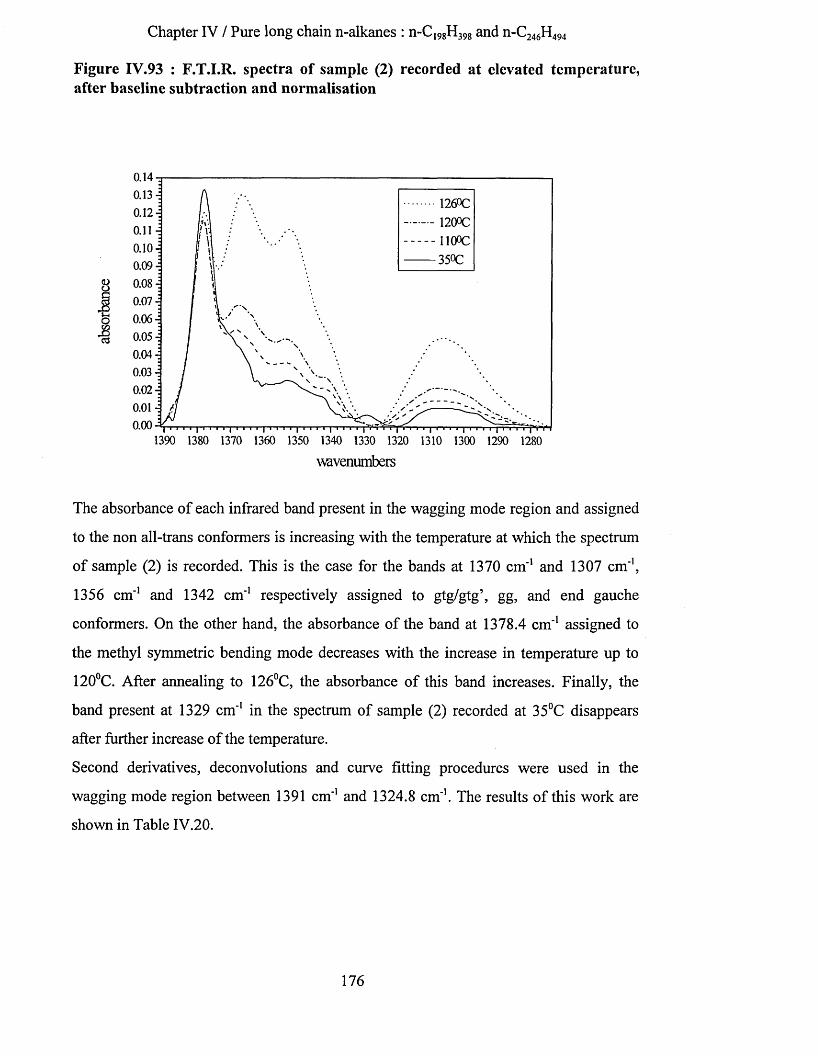
Chapter IV / Pure long chain n-alkanes : n-C198H398 and n-C246H494
Figure IV.93 : F.T.I.R. spectra of sample (2) recorded at elevated temperature, after baseline subtraction and normalisation
1390 1380 1370 1360 1350 1340 1330 1320 1310 1300 1290 1280
wavenumbers
The absorbance of each infrared band present in the wagging mode region and assigned
to the non all-trans conformers is increasing with the temperature at which the spectrum
of sample (2) is recorded. This is the case for the bands at 1370 cm'1 and 1307 cm'1,
1356 cm'1 and 1342 cm'1 respectively assigned to gtg/gtg’, gg, and end gauche
conformers. On the other hand, the absorbance of the band at 1378.4 cm'1 assigned to
the methyl symmetric bending mode decreases with the increase in temperature up to
120°C. After annealing to 126°C, the absorbance of this band increases. Finally, the
band present at 1329 cm'1 in the spectrum of sample (2) recorded at 35°C disappears
after further increase of the temperature.
Second derivatives, deconvolutions and curve fitting procedures were used in the
wagging mode region between 1391 cm'1 and 1324.8 cm'1. The results of this work are
shown in Table IV.20.
176

Chapter IV / Pure long chain n-alkanes : n-C198H398 and n-C246H494
Table IV.20 : Frequency and area of the infrared bands determined by curve fitting procedures on elevated temperature spectra of sample (2)
areawavenumbers
cm’1T=35°C T=110°C T=120°C T=126°C
1386 0.0391 0.0548 0.0664 0.05621378.4 0.9737 0.883 0.8714 0.90851370 0.394 0.3636 0.4165 0.61531364 0.2061 0.2783 0.3921 0.75461356 0.1405 0.3558 0.4729 1.02391349 0.1942 0.1192 0.2337 0.69621342 0.0633 0.1678 0.1985 0.40671336 0.0312 0.0371 0.0418 0.1035
Some of the bands present in Table IV.20 (bold type) are shown in Figure IV.94 and
Figure IV.95 where their integrated absorbance (maximum value arbitrarily fixed to
one) is plotted against the annealing temperature.
Figure IV.94 : Normalised area of the infrared bands present in the elevated temperature spectra of sample (2) as a function of the annealing temperature
1.0 H
0.9B. 1378.4cm
— B. 1370cm k- - B. 1349cm
0.8
£ 0.7-
w 0.6 - •§ :*8 °-5 7cn’3 0.4-
8 0.3 -j
0.2 -
30 40 6050 70 80 90 100 110 120 130
temperature in °C
The normalised integrated absorbance of the band at 1378.4 cm'1 varies within 10% of
its original value. As observed previously, after a decrease of its intensity up to 120°C, a
177
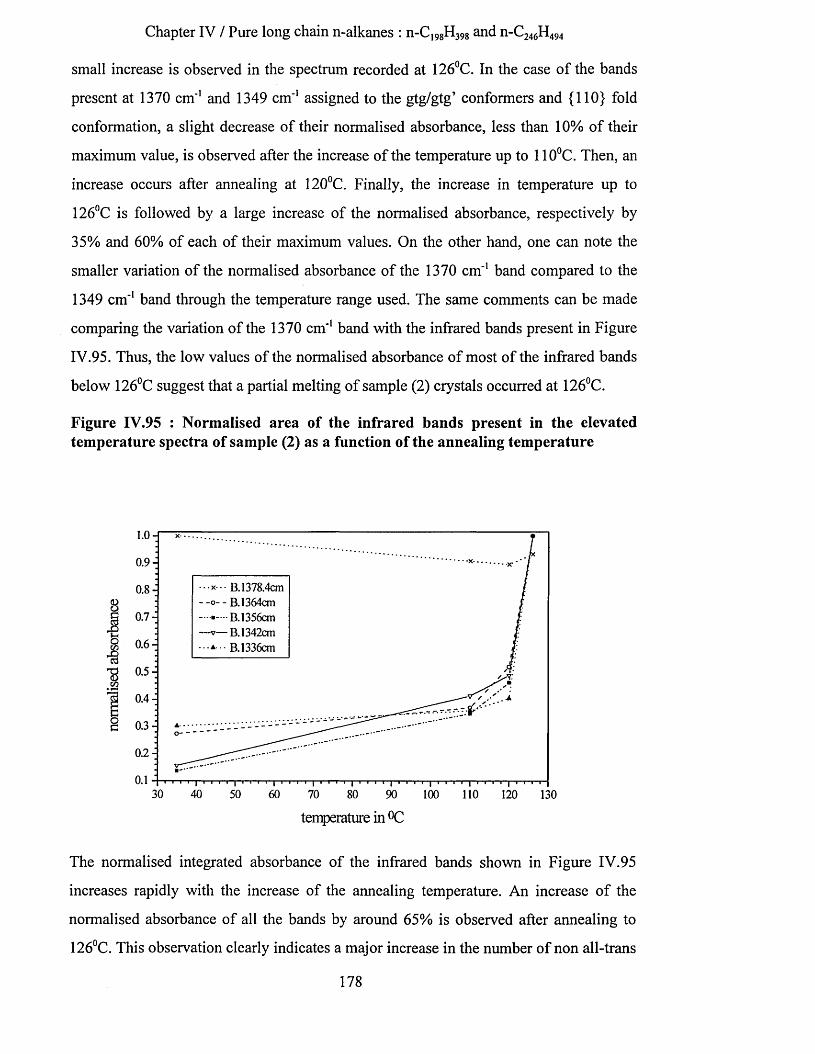
Chapter IV / Pure long chain n-alkanes : n-C198H398 and n-C246H494
small increase is observed in the spectrum recorded at 126°C. In the case of the bands
present at 1370 cm'1 and 1349 cm'1 assigned to the gtg/gtg’ conformers and {110} fold
conformation, a slight decrease of their normalised absorbance, less than 10% of their
maximum value, is observed after the increase of the temperature up to 110°C. Then, an
increase occurs after annealing at 120°C. Finally, the increase in temperature up to
126°C is followed by a large increase of the normalised absorbance, respectively by
35% and 60% of each of their maximum values. On the other hand, one can note the
smaller variation of the normalised absorbance of the 1370 cm'1 band compared to the
1349 cm'1 band through the temperature range used. The same comments can be made
comparing the variation of the 1370 cm'1 band with the infrared bands present in Figure
IV.95. Thus, the low values of the normalised absorbance of most of the infrared bands
below 126°C suggest that a partial melting of sample (2) crystals occurred at 126°C.
Figure IV.95 : Normalised area of the infrared bands present in the elevated temperature spectra of sample (2) as a function of the annealing temperature
1.0 H
0.9
• B. 1378.4cm--o - - B.1364cm — B.1356cm—?— B. 1342cm •••* ■ B.1336cm
0.8
3 0.7-
8 0.3 -i
0.2 -
30 40 50 60 70 90 100 110 120 13080
temperature in °C
The normalised integrated absorbance of the infrared bands shown in Figure IV.95
increases rapidly with the increase of the annealing temperature. An increase of the
normalised absorbance of all the bands by around 65% is observed after annealing to
126°C. This observation clearly indicates a major increase in the number of non all-trans
178
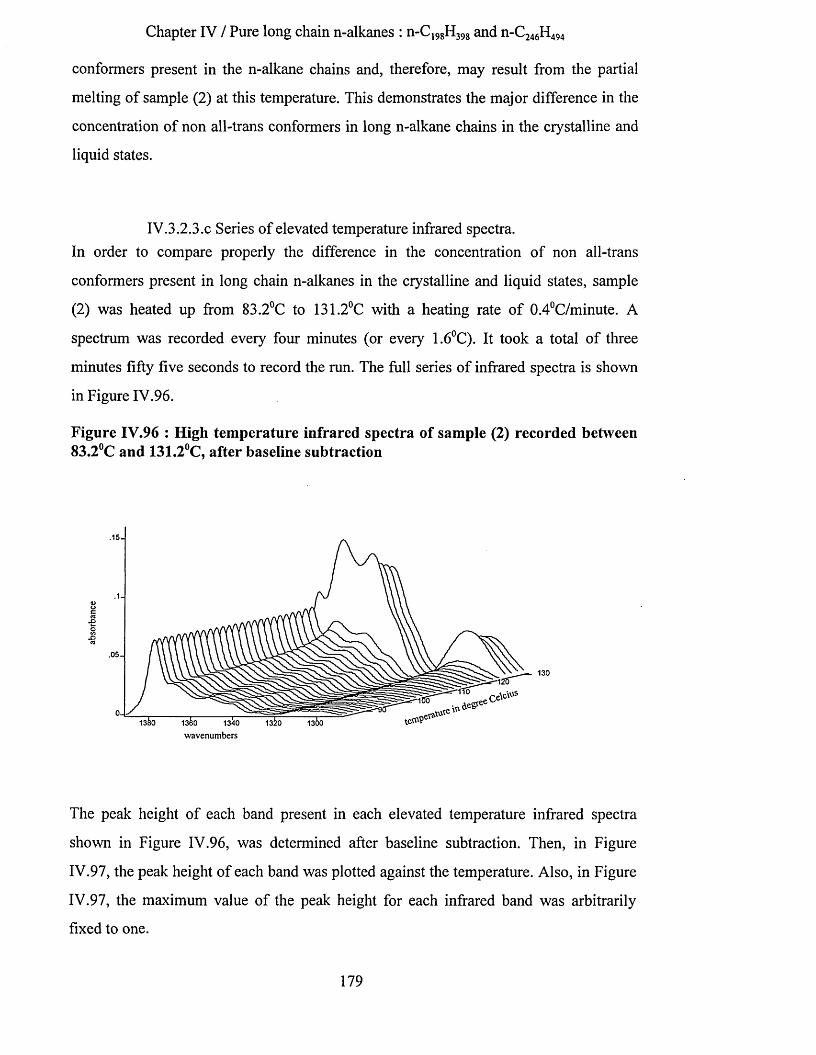
Chapter IV / Pure long chain n-alkanes : n-C198H398 and n-C246H494
conformers present in the n-alkane chains and, therefore, may result from the partial
melting of sample (2) at this temperature. This demonstrates the major difference in the
concentration of non all-trans conformers in long n-alkane chains in the crystalline and
liquid states.
IV.3.2.3.C Series of elevated temperature infrared spectra.In order to compare properly the difference in the concentration of non all-trans
conformers present in long chain n-alkanes in the crystalline and liquid states, sample
(2) was heated up from 83.2°C to 131.2°C with a heating rate of 0.4°C/minute. A
spectrum was recorded every four minutes (or every 1.6°C). It took a total of three
minutes fifty five seconds to record the run. The full series of infrared spectra is shown
in Figure IV.96.
Figure IV.96 : High temperature infrared spectra of sample (2) recorded between 83.2°C and 131.2°C, after baseline subtraction
.15 .
.1-4>occd•eo
- OC3
.05 .
13k) 13&0 wavenumbers
1301340
The peak height of each band present in each elevated temperature infrared spectra
shown in Figure IV.96, was determined after baseline subtraction. Then, in Figure
IV.97, the peak height of each band was plotted against the temperature. Also, in Figure
IV.97, the maximum value of the peak height for each infrared band was arbitrarily
fixed to one.
179

Chapter IV / Pure long chain n-alkanes : n-C198H398 and n-C246H494
Figure IV.97 : Scaled peak height of each infrared band (maximum value arbitrarily fixed to one) as a function of the temperature, after baseline subtraction
1.0 - '
0-9-1
0.8 -=
0.7-j
0.6 -=
| 0.5-=
1 0-4 "=£» 0.3-
’§ ;& 0.2 -.s :
0. 1 -
X X X X x Xx x x x
x X X x X x x X x X
X B. 1377cm• B. 1367cmA B. 1352cm□ B. 1341cmV B. 1306cm
« • • • • • • • • •O ^ ^ O o o O o o O D O O• • • • •
a □ o
A A AV V V
0 . 0 i i i i | i i • i i | i i i i | i i i i [ i i i i | i i i i | i i i i | i i i " i - | - r "i1 i - i - | i i i i | i i i i
80 85 90 95 100 105 110 115 120 125 130 135
temperature in °C
The scaled peak height of the infrared band present at 1377 cm'1 assigned to the methyl
symmetric bending mode decreases progressively with the increase in temperature up to
120°C. This effect may be due a thinning of the sample due to an increase in the
pressure applied to the sample, related to the increase of the volume of the KBr plates
and metal sample holder with the increase in temperature. From 121.6°C, the peak
height of the 1377 cm'1 band increases slightly and jumps by around 15% of its
maximum value after annealing to 126.4°C. The melting of extended form crystals is
believed to take place at this temperature. Then, above this temperature, a huge decrease
of this scaled intensity is observed. Once in the liquid state, the sample originally held
between two KBr plates slowly leaks out of the cell. Thus, the sample volume in the
infrared beam is reduced. In order to compare the concentrations of the different
conformers present in sample (2) as a function of the temperature, we need to normalise
the different infrared spectra. Thus, in Figure IV.98, we chose to use the area of the
1377 cm'1 band assigned to the methyl symmetric bending mode to normalise each
spectrum. The Figure IV.98 shows the normalised peak height of each infrared band
(maximum value arbitrarily fixed to one) plotted as a function of the temperature.
180

Chapter IV / Pure long chain n-alkanes : n-C198H398 and n-C246H494
Figure IV.98 : Normalised peak height of each infrared band (maximum value arbitrarily fixed to one) as a function of the temperature, after baseline subtraction and normalisation using the area of the 1377 cm 1 band
0.9
0.8
*<D
.a13
0.4
5 0.3-C0.2 -j
0.1 -
0.0
8 ° «
° B. 1367cma B. 1352cm B. 1341cm
v B. 1306cm
9X
o
o o oX X XA A A
o o o o o o o o ox x x x x x x x xA A A A A A A * *
o o o x x x ° ° E i U “ “ ^
V V v V v
80 85 90 95 100 105 110 115 120 125 130 135
temperature in °C
At a first approximation, we can say that the number of non all-trans conformers present
in the extended chain crystals is one order of magnitude lower than for the liquid state.
Also, differences in the normalised absorbances of the bands assigned to the specific
conformers can be observed. Thus, the normalised absorbance of the band at 1367 cm'1
assigned to the gtg/gtg’ conformers is greater below 110°C than, in decreasing order, the
normalised absorbances of the bands assigned respectively to the end gauche, gg and
gtg/gtg’ conformers. Also, the normalised absorbances of the bands assigned to the
gtg/gtg’, end gauche and gg conformers seem to show the same behaviour as a function
of the temperature, even if their initial values were different. Indeed, the normalised
absorbance of the band at 1306 cm'1 assigned to the gtg/gtg’ conformers is the lowest
one. Nevertheless, a small jump in the normalised absorbance of this last band is
observed around 105°C. Above this temperature, its value overtakes that of the band
assigned to gg conformers.
181
Chapter IV / Pure long chain n-alkanes : n-C198H398 and n-C24 6H494
IV.3.2.4 Conclusion.Low frequency Raman spectroscopic measurements on sample (2) indicate the presence
of a minority of once folded crystals in addition to extended form ones. By successively
annealing sample (2) at elevated temperatures, and then cooling it down to -173°C, a
more perfect crystal stacking takes place. Indeed, an increase of the number of orders of
diffraction present on the S.A.X.S. patterns is observed. At the same time, a perfecting
of the crystals takes place. This perfecting of the crystals can be observed in the
wagging mode region of the low temperature infrared spectra of sample (2). Indeed, the
absorbance of most of the infrared bands is found to decrease with increasing
temperature. Nevertheless, after annealing at 120°C, an increase in the absorbance of
some of the infrared bands assigned to non all-trans conformers is observed and is
believed to be due to the premelting phase transition occurring between the minority of
once folded crystals formed during the crystallisation from solution to extended form
crystals. Also, sample (2) may not have reached thermal equilibrium before cooling
down from 126°C. Therefore, the value of the absorbance of the different bands present
in the wagging mode region of the spectra and assigned to non all-trans conformers may
change as a function of the time spent at elevated temperature. On the other hand, the
higher regularity of the band progression present in the C-C stretching mode region of
the infrared spectra of sample (2) with the increase of annealing temperature also
indicates a perfecting of the extended chain crystals. These results seem to relate the
perfecting of the crystals with the more regular crystal surfaces (i.e. better crystal
stacking). From the identification of each one of these progression bands, we estimate
the number of carbon atoms involved in the extended part of the n-alkane chains in
extended forms to be 192 7.12. This number of carbon atoms can be compared with the
ones determined from both low frequency Raman spectroscopy and S.A.X.S.
measurements, which are respectively 198 7.1 and 187 7.2. After the partial melting of
sample (2) annealed at 126°C, changes in sample thickness occur. We then normalised
the infrared spectra using the area of the band present in the low temperature spectra at
around 2670 cm'1, which is believed to give the most reliable result.
Finally, by studying a series of infrared spectra of sample (2) recorded between 83°C
and 132°C, the degree of disorder present in extended form crystals a few degrees
182

Chapter IV / Pure long chain n-alkanes : n-C198H398 and n-C246H494
Celsius below their melting point was found to be one order of magnitude smaller than
in the liquid state. The different infrared spectra were normalised using the maximum
intensity of the 1377 cm*1 band in this case.
IV.3.3 Number of specific conformers in n-C198H398 crystals.
In order to estimate the number of specific conformers per molecule in sample (1)
cooled down from 51°C and sample (2) cooled down from 126°C, we used the values of
the areas of the infrared bands assigned to the non all-trans conformers present in the
infrared spectrum of liquid hexadecane, combined with the estimates of specific
conformers, using the assumption of the Rotational Isomeric State statistics. Thus, the
area of the 1377 cm'1 infrared band ascribed to the methyl symmetric bending mode was
used to normalise the spectra of sample (1) and sample (2) recorded at -173°C.
Table IV.21 : Estimates of the numbers of specific conformers in once folded and extended n-C198H398 crystal forms at -173°C
Band Position / cm'1 Assignment Number of Conformations
per Molecule.
Folded Extended Folded Extended
1376.5 1377 CH3 Deformation Normalising
1370.1 1370.7 gtg / gtg’ conformers 1.4 0.8
1363.8 1364.2 Strained gg ? 1.3 0.4
1353.4 1353.7 gg conformers 1.8 0.3
1346.4 1346 {110} Fold 0.8 0.2
1341 1341 End Gauche
conformers / {110}
Fold
0.7 0.2
Table IV.21 shows the number of each type of conformer per molecule. A larger
number of conformers was found in the case of sample (1), where the n-alkane chains
are in a perpendicular once folded form conformation. There is, in this case,
approximately one conformer of each type per chain. Nevertheless, nearly two gg
183

Chapter IV / Pure long chain n-alkanes : n-C198H398 and n-C246H494
conformers per chain are found in the once folded form crystals. On the other hand, in
sample (2) crystals, where the n-alkane chains are in the extended form, the numbers of
gg, end gauche and strained gg conformers as well as the number of {110} folds are at
least three time smaller. Furthermore, in the case of the gg conformers, this ratio is six
times smaller. As noticed previously, the remaining band at 1346 cm'1 which appears in
the infrared spectrum of sample (2) cooled down from 126°C indicates that some
crystals in the folded form may still be present in sample (2) which is essentially in
extended form conformation.
IV.3.4 Spectral subtraction.
With the aim of determining the different conformations composing the fold in the n-
Ci9 8H398 sample, we used a spectral subtraction technique. The result is shown in Figure
IV.99 where the spectrum recorded at -173°C of sample (2) cooled down from 126°C
was subtracted from the spectrum recorded at -173°C of sample (1) cooled down from
51°C. The choice of these two spectra was made to avoid observing any possible
components in the subtracted spectrum due to the tilting of the alkane chains inside the
crystal layers when sample (1) is annealed above 95°C. Linear baselines were used with
reference points of 1388.1 cm'1, 1323 cm'1 and 1260.3 cm'1. In this case, the area of the
broad band between 2690 cm"1 and 2558 cm'1 was determined by curve fitting and was
used to normalise the two infrared spectra.
184

Chapter IV / Pure long chain n-alkanes : n-C198H398 and n-C246H494
Figure IV.99 : Fold itself determined by spectral subtraction at -173°C
0.071369
1375.50.06 1353
1363 130013470.05
12960.04- 1307
<L>Q 12740.03-
o£
0.02 -
0.01- 1312
0.00 -
1329-___>1381 1321- 0.01 -
1380 1370 1360 1350 1340 1330 1320 1310 1300 1290 1280 1270
wuvenumbers
All the different bands of the wagging mode region known to be due to non all-trans
conformers involving methylene groups are present in this spectrum. Thus, the bands at
1353 cm'1 (ascribed to gg), 1340 cm*1 (ascribed to end gauche), 1300 cm'1 and 1296 cm'1
(ascribed to the off zone centre methylene wagging mode) are shown in Figure IV.99.
Also, the bands at 1363 cm'1 possibly ascribed to a strained gg conformer and 1307 cm'1
ascribed to the gtg/gtg’ conformers are present in this spectrum. The strongest band of
this region is the one at 1369 cm'1 ascribed to the gtg/gtg’ conformers. As expected, the
band at 1347 cm'1 ascribed to the {110} fold itself is there. Finally, another strong band
is at 1375.5 cm'1. This frequency is on the lower side of the commonly accepted
frequency range for a methyl group involved in a symmetric bending mode of vibration
and placed at the end of an alkane chain, the sample having an orthorhombic subcell. On
the other hand, the negative band at 1381 cm'1 is on the higher side of this commonly
accepted frequency range. The presence of these two last bands of opposite sign near the
frequency of the methyl symmetric bending mode may indicate the non equivalence of
the deformation of a methyl group placed at the end of an alkane chain in folded or
extended chain conformations. Again, the general view which considers this band as
185

Chapter IV / Pure long chain n-alkanes : n-C19gH39g and n-C246H494
conformationally insensitive may be pointed out. Finally, two clear negative bands at
1329 cm"1 and 1321 cm'1 with, perhaps another one at 1312 cm"1 are present in the
subtraction spectrum. These bands may be ascribed to a vibration involving the methyl
end groups. Indeed, the bands at 1329 cm"1 and 1312 cm'1 are observed in the spectra of
toluene and other long chain n-alkanes.
IV.3.5 Sample (3) : n-C246H494 crystallised in once folded form.
In order to observe both the possible tilting of the n-C246H494 once folded n-alkane chains
from the crystal layers and the premelting phase transition occurring between the once
folded to extended chain crystals at around 122.5 7_ 1.5 °C , we annealed sample (3)
successively at 105°C, 115°C and 122°C, cooling down to -173°C after each stage. The
melting point of n-C246H494 crystals in the extended form conformation was found20 to be
128.6°C. The melting point of n-C246H494 crystals in once folded form conformation was
found20 to be 122.5°C.
IV.3.5.1 S.A.X.S. measurements.The average layer periodicity of sample (3) determined by S.A.X.S. measurements was
found to be equal to 158.6 7. 1.7 A. This value is similar to that calculated60 for n-
C246H494 in a once folded chain conformation, 158 A.
After annealing to 105°C, 115°C and 122°C, the average layer periodicity of crystals
present in sample (3) was found to be respectively equal to 157.8 7. 2 A, 157.8 7. 2 A
and 315.5 7. 2 A. Thus, after annealing to 122°C, sample (3) originally crystallised in
once folded form, was transformed to an extended chain conformation with the alkane
chain axis perpendicular to the surface of the crystal layers. It should be noted that the
annealing of sample (3) up to 115°C did not significantly change the value of the
average layer periodicity. Therefore, contrary to sample (1), the once folded n-alkane
chains do not seem to tilt from the crystal surfaces with increasing annealing
temperature.
186

Chapter IV / Pure long chain n-alkanes : n-C198H398 and n-C246H494
IV.3.5.2 Low frequency Raman spectroscopy.The low frequency Raman spectrum of sample (3) recorded at room temperature is
shown in Figure IV. 100. Notwithstanding the low signal to noise ratio of this Raman
spectrum, we are able to determine the frequency of the first order of the longitudinal
acoustic mode at 19.2 cm'1.
Figure IV.100 : Low frequency Raman spectrum of sample (3) recorded at room temperature, after baseline subtraction
6000
L A M 1 19.2 cm-1
5000
4000
3000
2000
p 1000-
0 -
- 1000 -
- 2000 -
-3000150 140 130 120 110 100 90 80 70 60 50 40 30 20 10
Raman shift (cnr1)
The number of carbon atoms involved in the all-trans stem characteristic of the lamellar
crystals of sample (3) was determined using the value of the frequency of this Raman
band and Equation IV.49. The number of carbon atoms was found to be equal to 128.
Nearly exactly half the number of carbon atoms composing the n-C246H494 chains are
involved in this L.A. mode. Therefore, the n-alkane chains are in the once folded
conformation. This result confirms the one obtained by S.A.X.S. measurements.
187
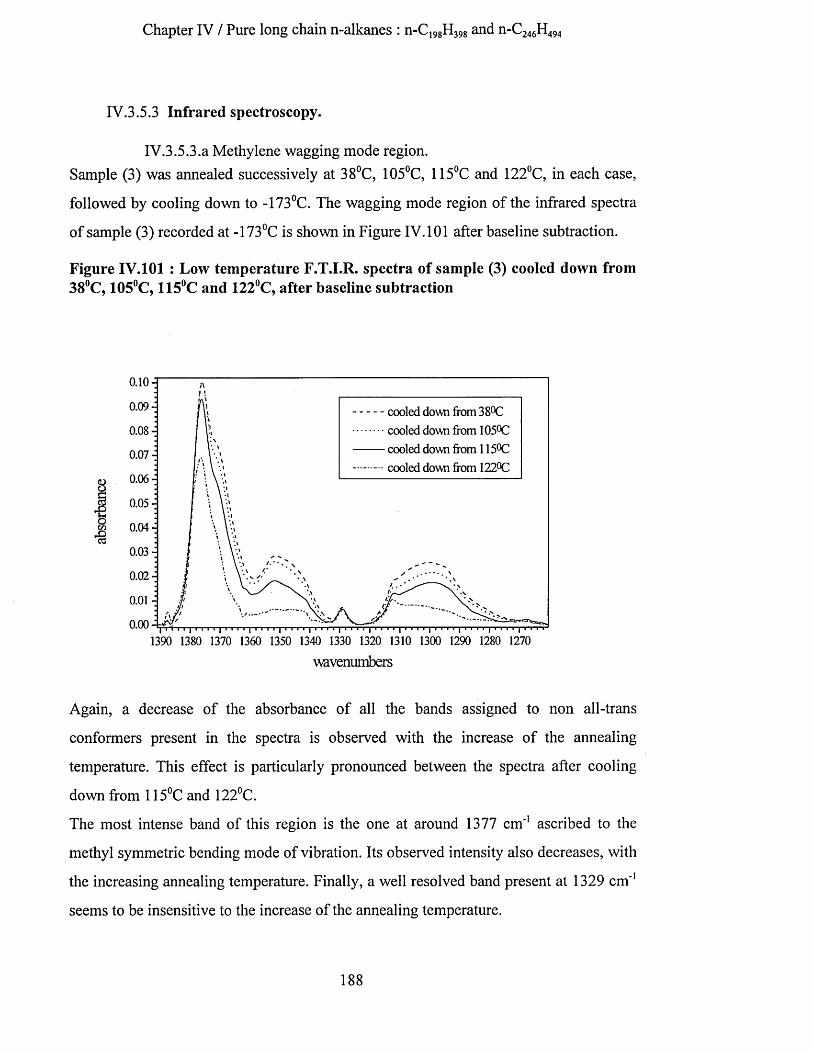
Chapter IV / Pure long chain n-alkanes : n-C198H398 and n-C246H494
IV.3.5.3 Infrared spectroscopy.
IV.3.5.3.a Methylene wagging mode region.Sample (3) was annealed successively at 38°C, 105°C, 115°C and 122°C, in each case,
followed by cooling down to -173°C. The wagging mode region of the infrared spectra
of sample (3) recorded at -173°C is shown in Figure IV. 101 after baseline subtraction.
Figure IV.101 : Low temperature F.T.I.R. spectra of sample (3) cooled down from 38°C, 105°C, 115°C and 122°C, after baseline subtraction
0.10 A
0.09- cooled down from 38°C cooled down from 105°C cooled down from 115°C cooled down from 122°C
0.08-
0.07-
g 0.06 -
J 0.05 -jR ■
_§ 0.04-i
0.03 -
0.02 -
0.0 1 -
0.001390 1380 1370 1360 1350 1340 1330 1320 1310 1300 1290 1280 1270
wavenumbers
Again, a decrease of the absorbance of all the bands assigned to non all-trans
conformers present in the spectra is observed with the increase of the annealing
temperature. This effect is particularly pronounced between the spectra after cooling
down from 115°C and 122°C.
The most intense band of this region is the one at around 1377 cm'1 ascribed to the
methyl symmetric bending mode of vibration. Its observed intensity also decreases, with
the increasing annealing temperature. Finally, a well resolved band present at 1329 cm'1
seems to be insensitive to the increase of the annealing temperature.
188

Chapter IV / Pure long chain n-alkanes : n-C198H398 and n-C246H494
Second derivatives, deconvolutions and curve fitting procedures were used in the
wagging mode region between 1391 cm*1 and 1323 cm*1 (see Table IV.22) and between
1323 cm*1 and 1260 cm*1 (see Table IV.23) to determine with accuracy the frequencies
and areas of these different bands.
Table IV.22 : Curve fitting results performed on the higher frequency part of the infrared spectra of sample (3) recorded at -173°C
areawavenumbers
in cm*1cooled down
from 38°Ccooled down from 105°C
cooled down from 115°C
cooled down from 122°C
1376.5 0.5521 0.5756 0.5494 0.51661370.5 0.4904 0.4269 0.3371 0.16841364 0.2243 0.1945 0.1505 0.04051353 0.2305 0.2175 0.1574 0.06951346 0.1836 0.1706 0.1097 0.03021341 0.0858 0.0561 0.0366 0.0271
1329.2 0.0273 0.0221 0.0275 0.0280
Table IV.23 : Curve fitting results performed on the lower frequency part of the infrared spectra of sample (3) recorded at -173°C
areawavenumbers
in cm*1cooled down
from 38°Ccooled down from 105°C
cooled down from 115°C
cooled down from 122°C
1312.5 0.1186 0.0716 0.0561 0.03981307 0.1169 0.1002 0.0788 0.05871301 0.1668 0.1578 0.1265 0.04351295 0.1103 0.0911 0.0765 0.03291289 0.1246 0.1091 0.0793 0.0254
Some of the bands present in Table IV.22 and Table IV.23 (bold type) are shown
respectively in Figure IV. 102 and Figure IV. 103 and in Figure IV. 104 and Figure
IV. 105, where their integrated absorbance (maximum value arbitrarily fixed to one) is
plotted against the temperature from which the sample was cooled down to -173°C.
189
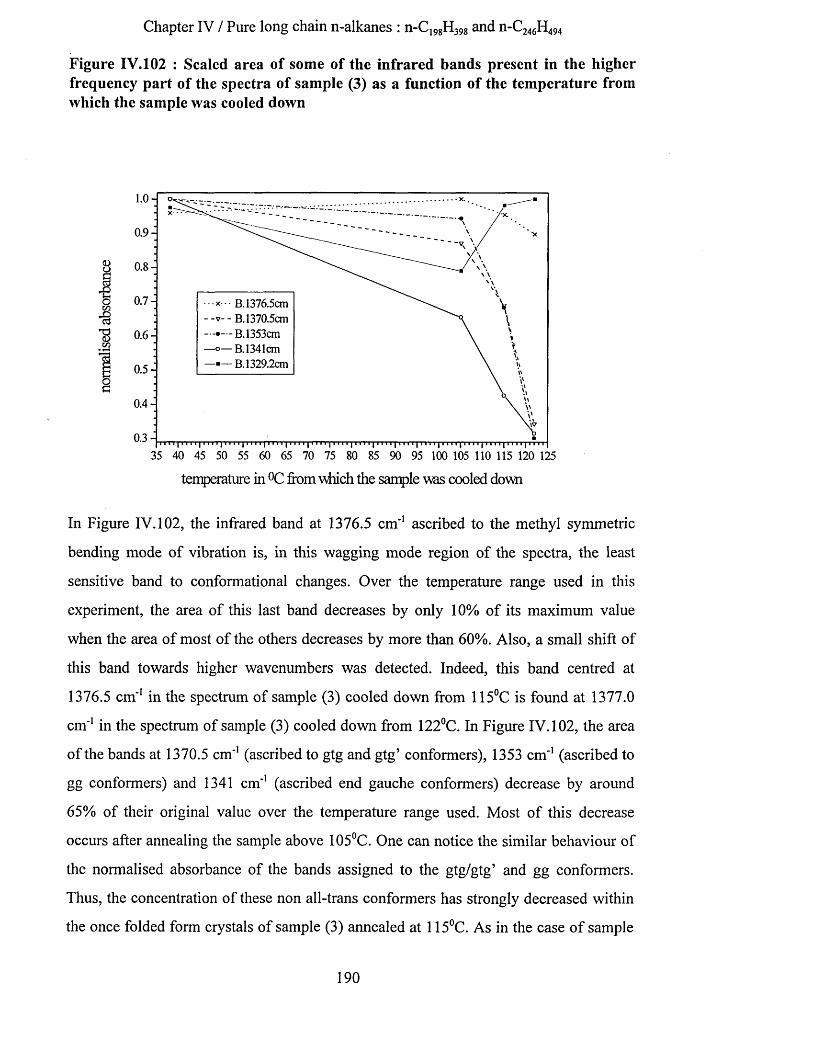
Chapter IV / Pure long chain n-alkanes : n-C198H398 and n-C246H494
Figure IV.102 : Scaled area of some of the infrared bands present in the higher frequency part of the spectra of sample (3) as a function of the temperature from which the sample was cooled down
1.0 -
0.9-
8 0.8 -
& 0.7-zn■8 :13 0.6 -m \
B. 1376.5cm r- - B. 1370.5cm >— B. 1353cm >— B. 1341cm — B. 1329.2cm0.5-
s0.4-
0.3-35 40 45 50 55 60 65 70 75 80 85 90 95 100 105 110 115 120 125
temperature in °C from which the sample was cooled down
In Figure IV.102, the infrared band at 1376.5 cm*1 ascribed to the methyl symmetric
bending mode of vibration is, in this wagging mode region of the spectra, the least
sensitive band to conformational changes. Over the temperature range used in this
experiment, the area of this last band decreases by only 10% of its maximum value
when the area of most of the others decreases by more than 60%. Also, a small shift of
this band towards higher wavenumbers was detected. Indeed, this band centred at
1376.5 cm'1 in the spectrum of sample (3) cooled down from 115°C is found at 1377.0
cm'1 in the spectrum of sample (3) cooled down from 122°C. In Figure IV.102, the area
of the bands at 1370.5 cm'1 (ascribed to gtg and gtg’ conformers), 1353 cm'1 (ascribed to
gg conformers) and 1341 cm'1 (ascribed end gauche conformers) decrease by around
65% of their original value over the temperature range used. Most of this decrease
occurs after annealing the sample above 105°C. One can notice the similar behaviour of
the normalised absorbance of the bands assigned to the gtg/gtg’ and gg conformers.
Thus, the concentration of these non all-trans conformers has strongly decreased within
the once folded form crystals of sample (3) annealed at 115°C. As in the case of sample
190
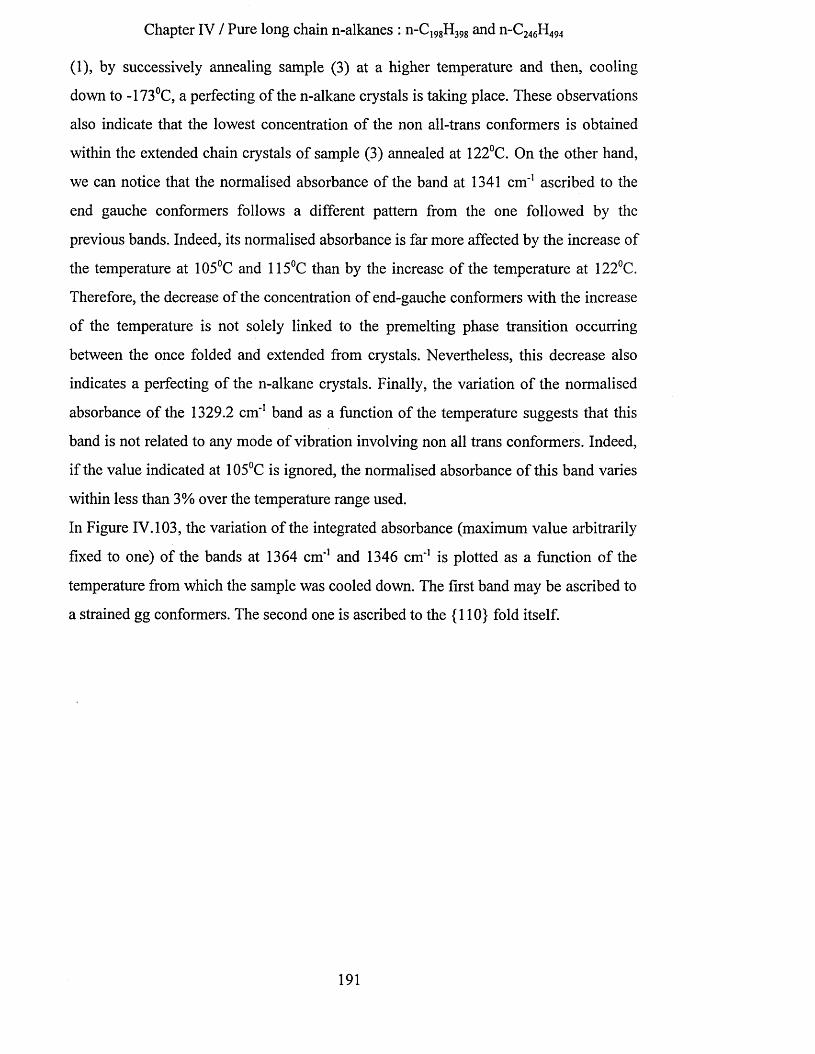
Chapter IV / Pure long chain n-alkanes : n-C198H398 and n-C246H494
(1), by successively annealing sample (3) at a higher temperature and then, cooling
down to -173°C, a perfecting of the n-alkane crystals is taking place. These observations
also indicate that the lowest concentration of the non all-trans conformers is obtained
within the extended chain crystals of sample (3) annealed at 122°C. On the other hand,
we can notice that the normalised absorbance of the band at 1341 cm'1 ascribed to the
end gauche conformers follows a different pattern from the one followed by the
previous bands. Indeed, its normalised absorbance is far more affected by the increase of
the temperature at 105°C and 115°C than by the increase of the temperature at 122°C.
Therefore, the decrease of the concentration of end-gauche conformers with the increase
of the temperature is not solely linked to the premelting phase transition occurring
between the once folded and extended from crystals. Nevertheless, this decrease also
indicates a perfecting of the n-alkane crystals. Finally, the variation of the normalised
absorbance of the 1329.2 cm'1 band as a function of the temperature suggests that this
band is not related to any mode of vibration involving non all trans conformers. Indeed,
if the value indicated at 105°C is ignored, the normalised absorbance of this band varies
within less than 3% over the temperature range used.
In Figure IV. 103, the variation of the integrated absorbance (maximum value arbitrarily
fixed to one) of the bands at 1364 cm'1 and 1346 cm'1 is plotted as a function of the
temperature from which the sample was cooled down. The first band may be ascribed to
a strained gg conformers. The second one is ascribed to the {110} fold itself.
191

Chapter IV / Pure long chain n-alkanes : n-C198H398 and n-C246H494
Figure IV.103 : Scaled area of some of the infrared bands present in the higher frequency part of the spectra of sample (3) as a function of the temperature from which the sample was cooled down
1.0-1
0.9
0.8§
0.7 -
o 0.6 -=••• B. 1376.5cm — B.1364cm >- - B.1346cm
0.3-
0.2 -
35 40 45 50 55 60 65 70 75 80 85 90 95 100 105 110 115 120 125
temperature in °C from which the sample was cooled down
The normalised integrated absorbance of these two infrared bands has a very similar
behaviour as a function of the temperature. After annealing at 115°C, the normalised
absorbance of both bands decreases by around 35%. This decrease is believed to be due
to the perfecting of once folded form crystals. Then, after annealing at 122°C, it
decreases by nearly 85%. This effect is believed to be related to the premelting phase
transition occurring between the once folded and extended form crystals at around
122°C.
The normalised absorbances of some of the bands present in the lower frequency range
of the wagging mode region are shown Figure IV. 104.
192
Chapter IV / Pure long chain n-alkanes : n-C198H398 and n-C246H494
Figure IV. 104 : Scaled area of some of the infrared bands present in the lower frequency part of the spectra of sample (3) as a function of the temperature from which the sample was cooled down
1.04
0.9-
0.8 -§
- g a 7 i 0.6 -
*8 : -M 0.5-
= - B . 1376.5cm B. 1312.5cm
i— B. 1307cm B. 1301cm
0.4-s0.3-
0.235 40 45 50 55 60 65 70 75 80 85 90 95 100 105 110 115 120 125
temperature in °C from which the sample was cooled down
Maroncelli et al.38 have shown, in the case of short chain n-alkanes, that the broad
infrared band centred at around 1306 cm'1 is a sum of several components assigned to
methylene wagging modes involved essentially in gtg’ conformers placed at different
sites along the n-alkane chains. Nevertheless, this band is also ascribed to methylene
wagging modes involved in gtg conformers. Therefore, they deliberately neglected the
presence of some gtg conformers in short chain n-alkane crystals. In particular, a band
assigned to a methylene wagging mode approximately localised within the gtg’
conformers was present at 1313 cm'1. Therefore, in Figure IV. 104, we ascribed the two
bands at 1307 cm'1 and 1301 cm'1 to gtg/gtg’ conformers. Their normalised absorbance
is strongly affected by the increase of the annealing temperature at 115°C. Nevertheless,
after annealing at 122°C, their absorbance decreases respectively by 50% and 75% of
their initial values. These different values may indicate a different sensitivity of the gtg’
conformers assigned to these two infrared bands, the ones related to the 1301 cm'1 band
being more sensitive to the premelting phase transition than the ones related to the 1307
cm'1. Finally, the band at 1312.5 cm'1 may also be assigned to the gtg’ conformers. Its
193

Chapter IV / Pure long chain n-alkanes : n-C198H398 and n-C246H494
normalised absorbance is already strongly affected after annealing sample (3) at 105°C,
with a decrease of 40% of its original value. The gtg’ conformers related to this infrared
band may be more sensitive to the perfecting of the once folded form crystals than the
ones ascribed to the 1301 cm'1 and 1307 cm'1 bands. Finally, over the temperature range
used, its absorbance decreases by nearly 70%. Thus, the slightly different variations of
the absorbance of these infrared bands with the increase of the temperature may indicate
a different behaviour of the gtg’ conformers placed at different sites along the n-alkane
chains.
In Figure IV. 105, the integrated absorbance (maximum value arbitrarily fixed to one) of
the bands at 1295 cm'1 and 1289 cm'1 is plotted as a function of the temperature from
which the sample was cooled down.
Figure IV.105 : Scaled area of some of the infrared bands present in the lower frequency part of the spectra of sample (3) as a function of the temperature from which the sample was cooled down
1.040.9-
c— B. 1376.5cm — B. 1295cm
B. 1289cm
0.3-
0.2 -
35 40 45 50 55 60 65 70 75 80 85 90 95 100 105 110 115 120 125
temperature in °C from which the sample was cooled down
The variation of the normalised integrated absorbance of these two infrared bands as a
function of the annealing temperature is very similar. After annealing sample (3) to
115°C, their normalised absorbance decreases by around 35%. This first decrease is
believed to be linked to the perfecting of the once folded crystals. The major effect is
194

Chapter IV / Pure long chain n-alkanes : n-C198H398 and n-C246H494
observed after annealing the sample to 122°C, their absorbance decreasing by around
75% of their initial values. Thus, this decrease is believed to be essentially related to the
premelting phase transition occurring between the once folded and extended form
crystals.
Figure IV. 106 shows the variation of the area of the infrared bands at 1376.5 cm'1, 888
cm'1 and 1174 cm'1 ascribed respectively to the symmetric methyl bending, methyl
rocking and methylene wagging modes of vibration. Also, the variation of the integrated
area of the broad infrared band present between 2690 cm'1 and 2558 cm'1 is shown.
Figure IV.106 : Normalised area of several infrared bands present in the low temperature spectra of sample (3) as a function of the temperature from which the sample was cooled down
1.00 - • x.
0.95
§0.90-
o
x B. 1376.5cm —□— B.2670cm - - o - - B. 1174cm —a— B.888cm
0.75-cr
0.7035 40 45 50 55 60 65 70 75 80 85 90 95 100 105 110 115 120 125
temperature in °C from which the sample was cooled down
The normalised integrated absorbance of this last broad band, centred outside the
wagging mode region of the infrared spectra, varies within 6% of its maximum value
over the temperature range used. Also, a general increase of its intensity is observed as a
function of annealing temperature. This observation contradicts the idea of a thinning of
the sample through the annealing. Also, among the bands shown, this band at 2670 cm'1
is the least sensitive to the increase of the temperature. Therefore, this band may be
preferred for normalising the infrared spectra recorded at low temperature.
195

Chapter IV / Pure long chain n-alkanes : n-C198H398 and n-C246H494
IV.3.5.3.b C-C stretching mode region.The C-C stretching mode region of the infrared spectra of sample (3) successively
annealed at 38°C, 105°C, 115°C and 122°C, and in each case cooled down to -173°C, is
shown in Figure IV. 107.
Figure IV.107 : C-C stretching mode region of the low temperature infrared spectra of sample (3) cooled down from 38°C, 105°C, 115°C and 122°C
(d ): cooled down from 122°C (c ): cooled down from 115°C (b ): cooled down from 105°C (a): cooled down from 38°C
ow•8
1140 1130 1120 1110 1100 1090 1080 1070 1060 1050 1040
wavenumbers
As seen previously, this region is limited by two extreme bands at 1133 cm'1 and 1050
cm'1. The disappearance of the 1056 cm'1 band may be seen as a perfecting of the once
folded crystals inside which the concentration of remaining non-all trans conformers,
originally formed during the crystallisation from solution, decreases. A vertical dot line
marks each progression band present in the spectrum of sample (3) cooled down from
122°C. These bands are ascribed to a non-localised mode of vibration involving the
motion of adjacent carbon atoms with the same phase difference along the n-alkane
chains. Also, some of the progression bands clearly present in the spectrum (d) can just
be detected in the spectrum (c) and with great difficulty in the spectrum (b). Therefore,
progression bands which are essentially a characteristic of the infrared spectra of sample
196
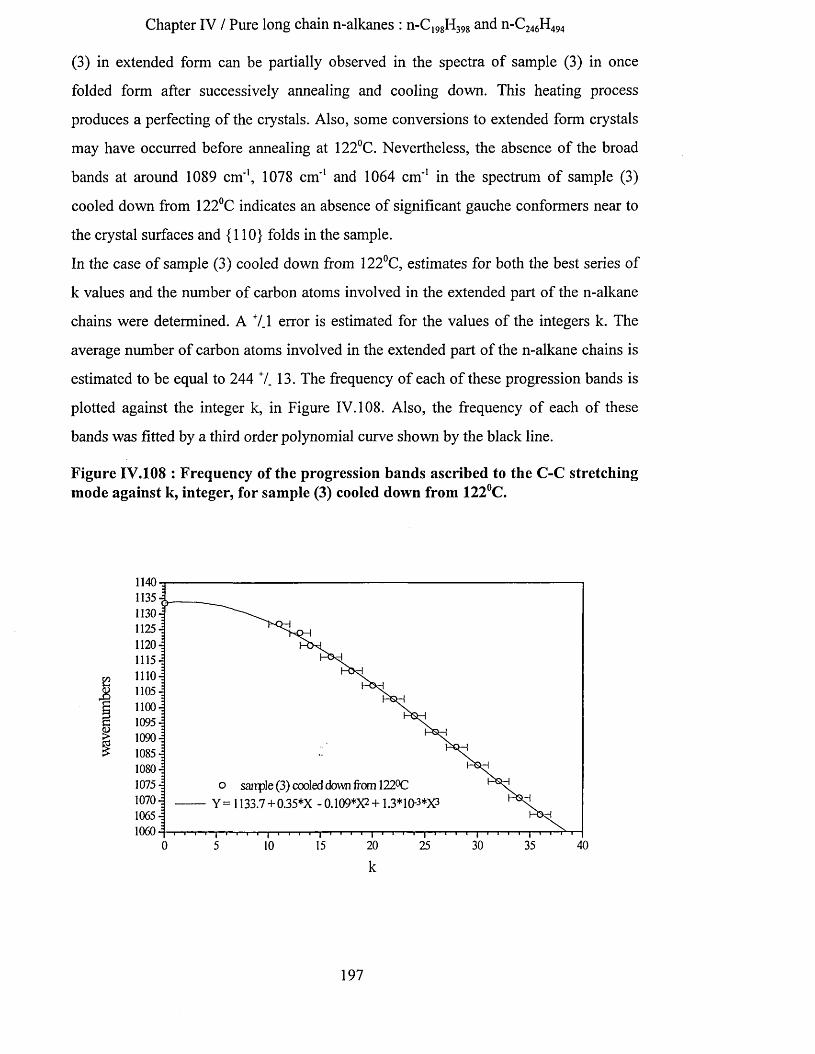
Chapter IV / Pure long chain n-alkanes : n-C198H398 and n-C246H494
(3) in extended form can be partially observed in the spectra of sample (3) in once
folded form after successively annealing and cooling down. This heating process
produces a perfecting of the crystals. Also, some conversions to extended form crystals
may have occurred before annealing at 122°C. Nevertheless, the absence of the broad
bands at around 1089 cm'1, 1078 cm’1 and 1064 cm'1 in the spectrum of sample (3)
cooled down from 122°C indicates an absence of significant gauche conformers near to
the crystal surfaces and {110} folds in the sample.
In the case of sample (3) cooled down from 122°C, estimates for both the best series of
k values and the number of carbon atoms involved in the extended part of the n-alkane
chains were determined. A 7.1 error is estimated for the values of the integers k. The
average number of carbon atoms involved in the extended part of the n-alkane chains is
estimated to be equal to 244 7. 13. The frequency of each of these progression bands is
plotted against the integer k, in Figure IV. 108. Also, the frequency of each of these
bands was fitted by a third order polynomial curve shown by the black line.
Figure IV.108 : Frequency of the progression bands ascribed to the C-C stretching mode against k, integer, for sample (3) cooled down from 122°C.
1140 -j
o sample (3) cooled down from 122°C
Y = 1133.7 + 0.35*X -0.109*5P + 1.3*10-3*X*
0 5 10 15 20 25 30 35 40
197

Chapter IV / Pure long chain n-alkanes : n-C198H39g and n-C246H494
IV.3.5.3.C Conclusion.As in the case of sample (1), we should expect the formation of tilted once folded form
crystals within sample (3) with increasing annealing temperature. The values of the
average layer periodicity determined by S.A.X.S. measurements on sample (3) have
demonstrated the absence of these tilted structures. Up to 115°C, the axes of the once
folded n-alkane chains are perpendicular to the surface of the crystal layers. Also, a
perfecting of the once folded form crystals is observed. After annealing up to 122°C,
sample (3) is no longer in a once folded crystal conformation, but in an extended one
with the chain axis perpendicular to the crystal surfaces. This transition occurring
between the two crystal forms is characterised by a strong decrease of all the bands
ascribed to the modes of vibration of methylene groups involved in non-all trans
conformers. Moreover, the band ascribed to the methyl symmetric bending mode is
affected by this premelting transition too. Its area decreases by around 10% between
105°C and 122°C with a small shift in its position, going from 1376.5 cm*1 to 1377 cm"1.
Furthermore, the clear progression bands observed in the C-C stretching mode region of
the spectrum of sample (3) cooled down from 122°C confirm the occurrence of the
transition between the two crystal forms.
Finally, the study of the methylene wagging mode region of the infrared spectra has
shown the different sensitivities of the infrared bands present around 1307 cm*1 and
assigned to gtg’ conformers placed at different sites along the n-alkane chains as a
function of the changes in the chain conformation within n-C246H494 crystals.
In pursuit of the least sensitive infrared band to chain conformational changes, the broad
band between 2690 cm'1 and 2558 cm'1 present in the spectra recorded at -173°C may be
the one of greatest interest for use in band normalisation.
198

Chapter V / Branched and mixture of long chain n-alkanes
V BRANCHED AND MIXTURES OF LONG CHAIN N-ALKANES
V .l Background.As we have already seen, monodisperse long chain n-alkanes, are recognised to be an
ideal model to study crystallisation and structure of polymers and paraffmic compounds.
In the initial stages of their crystallisation from the melt, real-time S.A.X.S.
measurements20 have shown that their crystal thickness can be equal to a non integer
fraction of the extended chain length. Then, through thickening or thinning, they
transform respectively into extended or folded crystal forms. A long chain alkane with a
methyl branch in the middle of the chain has shown similar behaviour : the
crystallisation of where the methyl group is present in the
middle of the chain, has shown an initial formation of non integer form crystals93. Then,
thinning occurs to produce once folded crystals. The once folded form seems to be a
preferred conformation for this methyl branched long alkane sample when crystallised
from both solution or melt. However, there is currently some concern as to whether the
S.A.X.S. measurements unequivocally indicate the presence of folded chain crystals,
since extended chain crystals might be expected to show a disordered layer including
the methyl groups (Dr Goran Ungar, personal communication).
The study of melt crystallised mixtures of different monodisperse long chain n-alkane
should improve the understanding of lamellar crystal structures and melting behaviour
of polymers. With this aim, an appropriate binary mixture of monodisperse long chain
n-alkanes was studied50 by real-time S.A.X.S. measurements and D.S.C. experiments. In
the case of the crystallisation from the melt of a 1:1 w/w binary mixture of the n-alkanes
n-C24 6H4 9 4 and n-C162H326, a fully reversible transition was observed between low and
high temperature phases around 90°C. The Fourier transform reconstruction of the
density profiles obtained from the X-ray experiments indicates a triple layer crystal
structure at the lowest temperatures where the n-alkane chains are in a tilted extended
form. This triple layer crystal structure is composed of two crystal layers of the same
thickness, 170 A comprising a chain of 162 carbon atoms tilted by 35°, and one thinner
crystal layer of 89 A composed of a chain of 84 carbon atoms tilted by 35°. A phase
199

Chapter V / Branched and mixture of long chain n-alkanes
transition to the non integer form of the extended chain structure is observed with
increasing temperature. In this case, there is only one crystal layer and an amorphous
layer. The crystal layer is formed by 162 carbon atoms. The crystal structures expected
at low and high temperatures are shown in Figure V.109 where the longest chains,
namely n-C24 6H494 , are represented in black and the shortest ones, namely n-C162H326, are
represented in grey for clarity.
Figure V.109 : Different crystal structures observed in binary mixture of long chain n-alkanes.
Triple Layer
heating
In this chapter, we will focus our discussion on the study of the disorder and fold
structures within two branched monodisperse long chain n-alkane samples, namely
C96H193CH(CH3)C94H189 and C96H193CH(CH2-CH2-CH2-CH3)C94H189, using S.A.X.S.
measurements, low frequency Raman spectroscopy and infrared spectroscopy
techniques. We will compare the results obtained with a linear n-alkane sample of
similar chain length, n-C198H398.
Finally we will try to observe, by means of infrared spectroscopy, the phase transition
occurring between the triple layer and non integer form of the extended chain crystal
structures within a 1:1 binary mixture of monodisperse long chain n-alkanes, n-C246H4 9 4
and n-C162H326.
200

Chapter V / Branched and mixture of long chain n-alkanes
V.2 Sample preparation.Samples were synthesised by Brooke et al.17 We crystallised the branched samples from
solution in Aristar grade toluene and prepared as follows :
(4) C96H193 -CH(CH3)-C94 H189 crystallised from 1.24% 7 V solution in toluene at 73.8 7.
0.4 °C for 90 minutes to obtain crystals in the once folded chain conformation, and then
filtered. The resulting mat was allowed to dry before pressing (pressure applied over the
sample surface lower than 0.4 ton per cm2).
(5) C96H193-CH(CH2 -CH2-CH2-CH3)-C94 H189 crystallised from 1.18% w/v solution in
toluene at 74.2 7. 0.4 °C for 90 minutes to obtain crystals in the once folded chain
conformation, and then filtered. The resulting mat was allowed to dry before pressing
(pressure applied over the sample surface lower than 0.4 ton per cm2).
A 1:1 binary mixture of n-C246H494 and n-C162H326 was prepared by X. Zeng (Sheffield
University) and then :
(6) the 1:1 binary mixture of n-C246H494 and n-C162H326 was crystallised from the melt
with a cooling rate of 2°C per minute from 130°C down to 80°C, and left at 80°C for 120
minutes before further cooling to room temperature. This process is expected to produce
a crystal with a triple layer structure as shown in the left part of Figure V.109.
Using the S.A.X.S. technique, we determined the average layer periodicity of the
samples (4) and (5), and hence the nature of the chain conformation. Using the
relationship between carbon number and chain length reported by Broadhurst60, values
of the crystal thickness for both samples in once folded form were calculated and found
to be equal to 122.5 A. The S.A.X.S. layer periodicity for sample (4) was found to be
121.6 7. 1.5 A. This value is in good agreement with the calculated one for a once
folded structure. The S.A.X.S. layer periodicity corresponding to sample (5) was found
to be 127.6 7. 2 A. This value is in good agreement with the calculated one for a once
folded structure, without taking in account the presence of the butyl branch groups
within the amorphous layers. One should remark that a different crystal structure could
also correspond to these average layer periodicities. Indeed, a structure where the alkane
chains would be in extended form with the branch groups delimiting two crystal layers
of thickness equal to half the chain length, will produce similar X-ray patterns.
201

Chapter V / Branched and mixture of long chain n-alkanes
Therefore, further X-ray scattering measurements to determine the electron density of
the different crystal interfaces should enable us to choose between the extended and
once folded models. Nevertheless, the once folded form model with the branch groups
at the crystal surfaces must be preferred, pending these further experiments.
Finally, the way sample (6) was prepared is believed to have produced a sample in the
low temperature phase characterised by a triple layer crystal structure where n-alkane
chains from both chain lengths are in a tilted extended form (shown in the left side of
Figure V.109).
V.3 Results.
V.3.1 Sample (4): C96H193 -CH(CH3)-C 9 4 H 189 crystallised in once folded form.
V.3.1.1 Low frequency Raman spectrum.The low frequency Raman spectrum of sample (4) recorded at room temperature is
shown in Figure V.l 10.
Figure V .l 10 : Low frequency Raman spectrum of sample (4) recorded at room temperature , after baseline subtraction.
7000
6500
6000
5500
5000
4500
4000
I f 3500 jg 3000
•S 2500
2000 1500
1000
500
080 75 70 65 60 55 50 45 40 35 30 25 20 15
Raman shift (cnr1)
LAM. 3 73.9 cnri
202

Chapter V / Branched and mixture of long chain n-alkanes
The first and third order of the Longitudinal Acoustic mode of vibration are present at
26 cm'1 and 73.9 cm'1. The number of carbon atoms involved in the all-trans stem
characteristic of the lamellar crystals of sample (4) was determined using the value of
the frequency of the first order of the L.A. mode and equation IV.2. The number of
carbon atoms was found to be equal to 94. Exactly half the number of carbon atoms
composing the sample (4) chains are involved in this L.A. mode. Therefore, the n-
alkane chains are in the once folded form conformation. This result confirms the one
obtained by the previous S.A.X.S. measurements, although it is subject to the same
reservation as noted earlier.
V.3.1.2 S.A.X.S. measurements.Sample (4) is believed to crystallise from both solution or melt only in the once folded
form. Previous measurements made on sample (4) crystallised from solution by means
of S.A.X.S. techniques have tented to confirm this idea. We decided to melt sample (4)
(melting point near to 117°C) by annealing it at 119°C and then cooling it down to
-173°C to record an infrared spectrum. After cooling, S.A.X.S. measurements were
carried out. The average layer periodicity was found to be equal to 100.6 7. 1.5 A. This
value is similar to 100.3 A calculated for C96H193 -CH(CH3)-C94 HI89 in a tilted once
folded chain conformation with a typical tilt angle of 35°. Thus, after annealing at 119°C
and cooling to -173°C, sample (4) is in once folded form with the chain axis tilted from
the crystal surfaces with an angle close to 35°.
V.3.1.3 Infrared spectroscopy.
V.3.1.3.a Methylene wagging mode region.In sample (4), the methyl group is positioned nearly exactly in the middle of the alkane
chain. Thus, in the case of sample (4) crystallised from solution, the alkane chains are
probably in an once folded form conformation and the methyl group is attached to one
of the carbon atoms composing the fold. Sample (4) was annealed successively at 35°C
and 119°C, in both cases followed by cooling down to -173°C (with a cooling rate of
around 10°C per minute), at which temperature the infrared spectra were recorded.
203

Chapter V / Branched and mixture of long chain n-alkanes
After annealing at 119°C, sample (4) was molten. Changes in the thickness of the
sample after its melting required a normalisation procedure. To achieve this, as was
done in the previous chapter we used as reference the integrated area of the broad band
between 2690 cm'1 and 2558 cm'1. The methylene wagging mode region of the infrared
spectra of sample (4) recorded at -173°C is compared for the two annealing temperatures
in Figure V.l 11. The signal to noise ratio of the spectrum of sample (4) cooled down
from 35°C is greater than the one cooled down from 119°C.
Figure V .l 11 : Methylene wagging mode region of the low temperature F.T.I.R. spectra of sample (4) cooled down from 35°C and 119°C, after baseline subtraction and normalisation.
0.175
0.150 cooled down from 119°C cooled down from 35°C
0.125
g 0.100
0.075 -
0.050-
0.025-
0.0001390 1380 1370 1360 1350 1340 1330 1320 1310 1300 1290 1280 1270
wavenumbers
Several bands characteristic of the methylene wagging mode region are observed in
these two infrared spectra. The major band of this region is assigned to the methyl
symmetric bending mode at 1376.5 cm'1. Then, a shoulder at around 1370 cm'1 is
detected and is assigned to the gtg and gtg’ conformers. At lower frequency, a broad
band centred at 1306 cm'1 is also ascribed to gtg and gtg’ conformers. A band at 1354
cm'1 is assigned to the gg conformers. The end-gauche conformers are observed at 1341
cm'1. The {110} fold conformation is characterised by a band at around 1347 cm'1. Two
bands near 1330 cm'1 and 1312.5 cm'1 are detected and may be linked to the methylene
204

Chapter V / Branched and mixture of long chain n-alkanes
and methyl groups placed at the end of the alkane chains. A band present at 1295 cm"1 is
ascribed to an off-zone centre methylene wagging mode.
Second derivatives, deconvolutions and curve fitting procedures were used for the
region between 1391 cm"1 and 1322 cm'1 (Table V.24) and from 1322 cm'1 to 1260.3
cm'1 (Table V.25) to determine with accuracy the frequencies and areas of these
different bands.
Table V.24 : Curve fitting results obtained for the infrared spectra of sample (4) recorded at -173°C.
area
wavenumberscm'1
cooled down from T=35°C cooled down from T=119°C
1384.9 0.0283 0.0283
1376.4 1.0591 1.2468
1370.1 0.3912 0.4666
1363.8 0.2692 0.2850
1353.6 0.2246 0.2199
1347.2 0.0554 0.0760
1341 0.0906 0.0833
1329.7 0.0141 0.0133
Table V.25 : Curve fitting results obtained for the lower frequency p art of the infrared spectra of sample (4) recorded at -173°C.
area
wavenumberscm'1
cooled down from T=35°C cooled down from T=119°C
1312.4 0.0846 0.0614
1306.3 0.0962 0.0994
1301 0.0808 0.0723
1295.6 0.0904 0.0899
1289.2 0.0702 0.0666
From these results, we can observe that the major difference between the two infrared
spectra of sample (4) recorded at -173°C is an increase of the integrated area of the band
at 1347 cm'1 assigned to the {110} fold by nearly 25% of its original value. This

Chapter V / Branched and mixture of long chain n-alkanes
observation may be directly due to the tilting of the alkane chains from the crystal
surfaces. Indeed, the tilting of the alkane chains may have changed the conformation of
the {110} folds, and hence, the integrated absorbance of the band at 1347 cm'1. At the
same time, the integrated area of the band at 1312.4 cm'1 decreases by nearly 25% of its
original value. In this case, two possibilities may be put forward. Firstly, due to the
tilting of the alkane chains, changes in the direction of the dipole moment characteristic
of this vibration may have occurred and so caused the decrease of its integrated area.
Secondly, the number of specific conformers assigned to this band may have decreased
with the tilting of the chains. Finally, as easily observed from Figure V.l 11, the
integrated areas of the bands at 1376.4 cm'1 and 1370.1 cm'1 increase by about 15% of
their original values. In both cases the tilting of the chains from the crystal surfaces may
have changed the direction of the dipole moment linked to these modes of vibration, and
thus the integrated intensity of the infrared bands assigned to them. Furthermore, in the
case of the second band at 1370.1 cm*1 assigned to gtg and gtg’ conformers, changes in
the number of specific conformers may have occurred too and caused the increase of the
integrated area of this band.
In the case of the other bands present in Table V.24 and Table V.25, their integrated
absorbance has changed by less than 10% of their maximum value and the changes are
not considered significant.
In order to compare the infrared spectra of sample (4) recorded at -173°C, we decided to
subtract the spectrum of sample (4) cooled down from 35°C from the spectrum of
sample (4) cooled down from 119°C. The result of this subtraction is shown in Figure
V.112.
206

Chapter V / Branched and mixture of long chain n-alkanes
Figure V .l 12 : Infrared spectrum of sample (4) cooled down from 35°C subtracted from the infrared spectrum of sample (4) cooled down from 119°C.
0.0301376.5 cnri
0.025
0.0201370.1 crrr1
§ 0.015-
| 0.010-kS
0.005-
0.000
1390 1380 1370 1360 1350 1340 1330 1320 1310 1300 1290 1280 1270
wavenumbers
Only the bands with the greatest absorbance are clearly visible in this subtracted
spectrum, at 1376.5 cm'1 and 1370.1 cm'1. They are respectively ascribed to the methyl
symmetric deformation and gtg and gtg’ conformers. On the other hand, the changes of
the absorbance of the bands at 1347 cm'1 and 1312.4 cm'1 are not detectable due to the
weak absorbance of these bands in the original infrared spectra.
V.3.1.3.b Conclusion.Changes in the infrared spectra of sample (4) cooled down from 35°C and 119°C were
studied by the means of curve fitting and subtraction techniques. Both the increase of
the integrated absorbance of the band at 1370.1 cm'1 and the decrease of the integrated
absorbance of the band at 1312.4 cm'1 are probably due, at least in part, to the tilting of
the alkane chains from the crystal layers. Changes in the direction of the dipole
moments and/or in the number of conformers assigned to these modes of vibrations may
both explain these observations. In the case of the bands at 1376.5 cm'1 and 1347 cm'1
assigned respectively to the methyl symmetric bending and {110} folds, the increase of
their integrated absorbance may simply be due to a change in the dipole moment
direction after the tilting of the chains. It is interesting to note that no significant
207

Chapter V / Branched and mixture of long chain n-alkanes
changes in the integrated absorbance of the 1341 cm'1 and 1353.6 cm'1 bands assigned
respectively to the end-gauche and gg conformers were detected.
V.3.1.3.C C-C stretching mode region.The C-C stretching mode region of the low temperature infrared spectra of sample (4)
cooled down from 35°C and 119°C is shown in Figure V.l 13. The signal to noise ratio
of the spectrum of sample (4) cooled down from 35°C is significantly greater than the
one cooled down from 119°C.
Figure V.113 : C-C stretching mode region of the low temperature infrared spectra of sample (4) cooled down from 35°C and 119°C, after baseline subtraction and normalisation.
(b ): cooled down from 119°C (a ): cooled down from 35°C
%
<3CO•a
1140 1130 1120 1110 1100 1090 1080 1070 1060 1050 1040
wavenumbers
The band marked by an asterisk at 1047 cm'1, present in the spectrum of sample (4)
cooled down from 119°C may be related to a methylene twisting mode characteristic of
non all-trans conformers formed during the crystallisation from the melt. Also,
progression bands present in the spectra of sample (4) recorded at -173°C and crossed by
a vertical dotted line are better resolved and slightly more regular in spectrum (a) than in
spectrum (b). All these observations may indicate a more perfect crystal structure at
208

Chapter V / Branched and mixture of long chain n-alkanes
173°C in the case of sample (4) crystallised from solution rather than the sample
crystallised from the melt.
One can observe two distinct regions within the spectra (specially spectrum (a)). Above
1100 cm'1, the progression bands are observed. Below this frequency, at least three
broad bands at around 1089 cm'1, 1078 cm'1 and 1064 cm'1 are observed. The bands at
1078 cm'1 and 1064 cm'1 were ascribed by Krimm et al.61,94 to C-C stretching modes, the
first one being characteristic of the presence of gauche conformers. Wolf et al.47 have
calculated by the Green’s function method the defect frequencies of a tight {110} fold in
polyethylene. They assigned an infrared band at 1082.5 cm'1 to the {110} folds. Thus, in
the infrared spectra of sample (4), some of these bands may be due to the presence of
the {110} folds or some disorder near the ends. Moreover, differences in this lower
frequency part of spectra (a) and (b) may indicate differences in the conformation of the
{110} folds present in sample (4) crystallised from both solution and melt.
Finally, we tried to identify each one of the progression bands present in this region. To
achieve this, we used the frequency-phase curve for C-C stretching modes of short chain
n-alkanes from n-C2oH4 2 to n-C30H62 determined by Snyder and Schachtschneider39 (for
more details, see chapter IV). Estimates for both the best series of k values characteristic
of each progression band and the number of carbon atoms involved in the extended part
of the n-alkane chains were determined. A 7.1 error is estimated on the values of the
integers k. The average number of carbon atoms involved in the extended part of the n-
alkane chains is estimated to be equal to 101 7. 2. The frequency of each of these
progression bands is plotted against the integer k, in Figure V.l 14. Also, the frequency
of each of these bands was fitted to a third order polynomial curve shown by the black
line.
209
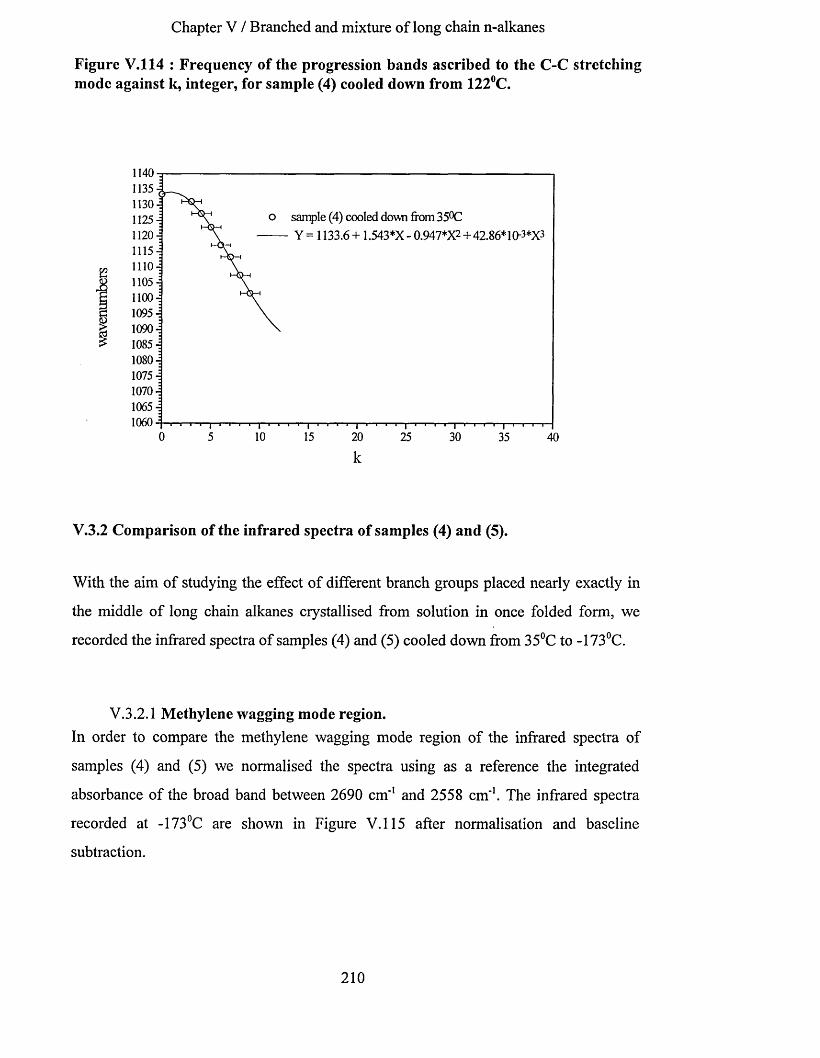
Chapter V / Branched and mixture of long chain n-alkanes
Figure V.l 14 : Frequency of the progression bands ascribed to the C-C stretching mode against k, integer, for sample (4) cooled down from 122°C.
o sample (4) cooled down from 35°C Y = 1133.6+ 1.543*X- 0.947*X2 + 42.86*10-3*X3
V.3.2 Comparison of the infrared spectra of samples (4) and (5).
With the aim of studying the effect of different branch groups placed nearly exactly in
the middle of long chain alkanes crystallised from solution in once folded form, we
recorded the infrared spectra of samples (4) and (5) cooled down from 35°C to -173°C.
V.3.2.1 Methylene wagging mode region.In order to compare the methylene wagging mode region of the infrared spectra of
samples (4) and (5) we normalised the spectra using as a reference the integrated
absorbance of the broad band between 2690 cm'1 and 2558 cm'1. The infrared spectra
recorded at -173°C are shown in Figure V.l 15 after normalisation and baseline
subtraction.
210

Chapter V / Branched and mixture of long chain n-alkanes
Figure V .l 15 : Methylene wagging mode region of the infrared spectra of samples(4) and (5) recorded at -173°C after normalisation and baseline subtraction.
1390 1380 1370 1360 1350 1340 1330 1320 1310 1300 1290 1280 1270
wavenumbers
The usual infrared bands characteristic of the methylene wagging mode region of the
infrared spectra of long chain alkanes at low temperature can be observed.
Second derivatives, deconvolutions and curve fitting procedures were used for the
region between 1391 cm'1 and 1322 cm'1 (Table V.26) and from 1322 cm'1 to 1260.3
cm"1 (Table V.27) to determine with accuracy the frequencies and areas of these
different bands.
211

Chapter V / Branched and mixture of long chain n-alkanes
Table V.26 : Curve fitting results obtained for the infrared spectra of samples (4) and (5) recorded at -173°C.
area
wavenumberscm'1
sample (4) cooled down from T=35°C
sample (5) cooled down from T=119°C
1384.9 0.0283 0.0139
1376.4 1.0591 0.8692
1370.1 0.3912 0.3110
1363.8 0.2692 0.2042
1353.6 0.2246 0.2127
1347.2 0.0554 0.0712
1341 0.0906 0.1042
1329.7 0.0141 0.0210
Table V.27 : Curve fitting results obtained for the lower frequency part of the infrared spectra of samples (4) and (5) recorded at -173°C.
area
wavenumberscm*1
sample (4) cooled down from T=35°C
sample (5) cooled down from T=35°C
1312.4 0.0846 0.0806
1306.3 0.0962 0.0912
1301 0.0808 0.0913
1295.6 0.0904 0.1031
1289.2 0.0702 0.1149
Going from the infrared spectrum of sample (4) to the spectrum of sample (5), a
decrease of the integrated absorbance of the infrared bands at 1376.4 cm'1 and 1370.1
cm'1 by nearly 20% and of the 1363.8 cm'1 band by around 25% is observed. The
number of methyl groups per chain is the same in both samples. So, changes in the
integrated absorbance of 1376.4 cm'1 band assigned to the methyl symmetric bending
mode may be explained by a difference in the orientation of the methyl groups at the
crystal surfaces. Also, the deformation of the methyl group placed at the end of the butyl
branched chain may have a slightly different fingerprint in an infrared spectrum
212

Chapter V / Branched and mixture of long chain n-alkanes
compared to the ones placed at the end of the long alkane chains. The decrease of the
integrated absorbance of the 1370.1 cm'1 band assigned to the gtg and gtg’ conformers
seems to indicate a lower concentration of gtg and gtg’ conformers within sample (5)
crystals. The further decrease of the integrated absorbance of the 1363.8 cm'1 band in the
spectrum of sample (5), which may be assigned to strained gtg and gtg’ conformers,
reinforces this idea. Moreover, the integrated absorbance of the bands at 1353.6 cm'1
assigned to gg conformers, 1306.3 cm'1 assigned to gtg and gtg’ conformers and 1312.4
cm'1 varies within only 5% of their maximum value. Therefore, no major changes in the
number of gg conformers were detected between the two branched samples. On the
other hand, going from the infrared spectrum of sample (4) to the spectrum of sample
(5), an increase of the integrated absorbance of the infrared bands at 1295.6 cm'1, 1301
cm'1 and 1341 cm'1 by around 15% is observed. In the case of the 1341 cm'1 band
assigned to end-gauche conformers, this result may indicate an increase in the number
of these conformers within sample (5). This increase may be related to a higher
concentration of end-gauche conformers in the butyl branch part of the chain than in the
long alkane chains. The increase of the absorbance of the 1301 cm'1 band which can be
ascribed to gtg and gtg’ conformers may also be related to the branched part of the
molecules. The integrated absorbance of the 1347.2 cm'1 band assigned to the {110}
fold increases by nearly 25% going from the infrared spectrum of sample (4) to the
spectrum of sample (5). Changes in the conformation of the {110} fold or a
redistribution of the energy of vibration within the fold due to the butyl branched group
may explain this observation. Finally, in the case of the bands at 1329.7 cm'1 and 1389.2
cm'1, an increase of their integrated absorbance by respectively 35% and 40% of their
maximum value is detected.
In order to compare the infrared spectra of samples (4) and (5) recorded at -173°C, we
also decided to subtract the spectrum of sample (5) cooled down from 35°C from the
spectrum of sample (4) cooled down from 35°C. The result of this subtraction is shown
in Figure V.l 16.
213

Chapter V / Branched and mixture of long chain n-alkanes
Figure V.l 16 : Infrared spectrum of sample (5) recorded at -173°C subtracted from the infrared spectrum of sample (4) recorded at -173°C, after baseline subtraction and normalisation.
0.0351375.5
0.030
0.0251369.5
0.020
§ 0.015 - 1363.5
<5I
0.010-
0.005-
0.000
-0.005 - 1345- 1291
1390 1380 1370 1360 1350 1340 1330 1320 1310 1300 1290 1280 1270
wavenumbers
This spectrum confirms the result determined by the means of curve fitting techniques.
The positive bands at 1375.5 cm'1, 1369.5 cm'1 and 1363.5 cm'1 are the bands which
have a greater integrated absorbance in the spectrum of sample (4) than in the spectrum
of sample (5). Therefore, a higher number of gtg and gtg’ conformers may be present in
the chains of sample (4). The frequency of the band at 1375.5 cm'1 is slightly lower than
the usual frequency of the methyl symmetric deformation. This may indicate a non
equivalence of some of the methyl groups present in the chains of samples (4) and (5).
Most of the other bands are negative in this spectrum, since their integrated absorbance
is greater in the spectrum of sample (5) than in the spectrum of sample (4) at -173°C. It
is especially the case for the bands at 1345 cm'1 and 1291 cm'1, the first of these being
assigned to the {110} fold.
V.3.2.2 C-C stretching mode region.The C-C stretching mode region of the low temperature infrared spectra of samples (4)
and (5) cooled down from 35°C is shown in Figure V.l 17.
214

Chapter V / Branched and mixture of long chain n-alkanes
Figure V.117 : C-C stretching mode region of the infrared spectra of samples (4) and (5) recorded at -173°C, after baseline subtraction.
(b ): butyl group, sample (5) (a ): methyl group, sample (4)
§
CD
I
1140 1130 1120 1110 1100 1090 1080 1070 1060 1050 1040
wavenumbers
Each one of the progression bands present in the spectra (a) and (b) and crossed by a
vertical dotted line has nearly the same frequency in both spectra. This observation
seems to indicate that the average length of the all-trans sequences going through the
crystal layers, which can be estimated from the frequency of each progression band, is
approximately the same in both samples. Nevertheless, progression bands are slightly
better resolved and more regular in spectrum (b) than in spectrum (a). These
observations may indicate more perfect all-trans sequences in the case of sample (5)
crystals. Perhaps a more likely explanation is that the distribution of chain lengths of the
all-trans sequences within sample (5) crystals is narrower than the one within sample (4)
crystals. In this case, the butyl branch group placed on one of the carbon atoms
composing the fold seems to fix the number of carbon atoms involved in the all-trans
sequences present in the crystal layers of sample (5).
The two distinct regions within the spectra are very clear. From 1100 cm'1 towards
higher frequencies, the progression bands are observed. From 1100 cm'1 towards lower
frequencies, at least three broad bands at around 1089 cm'1, 1078 cm'1 and 1064 cm'1 are
observed. Thus, in the infrared spectra of samples (4) and (5), some of these bands may
215
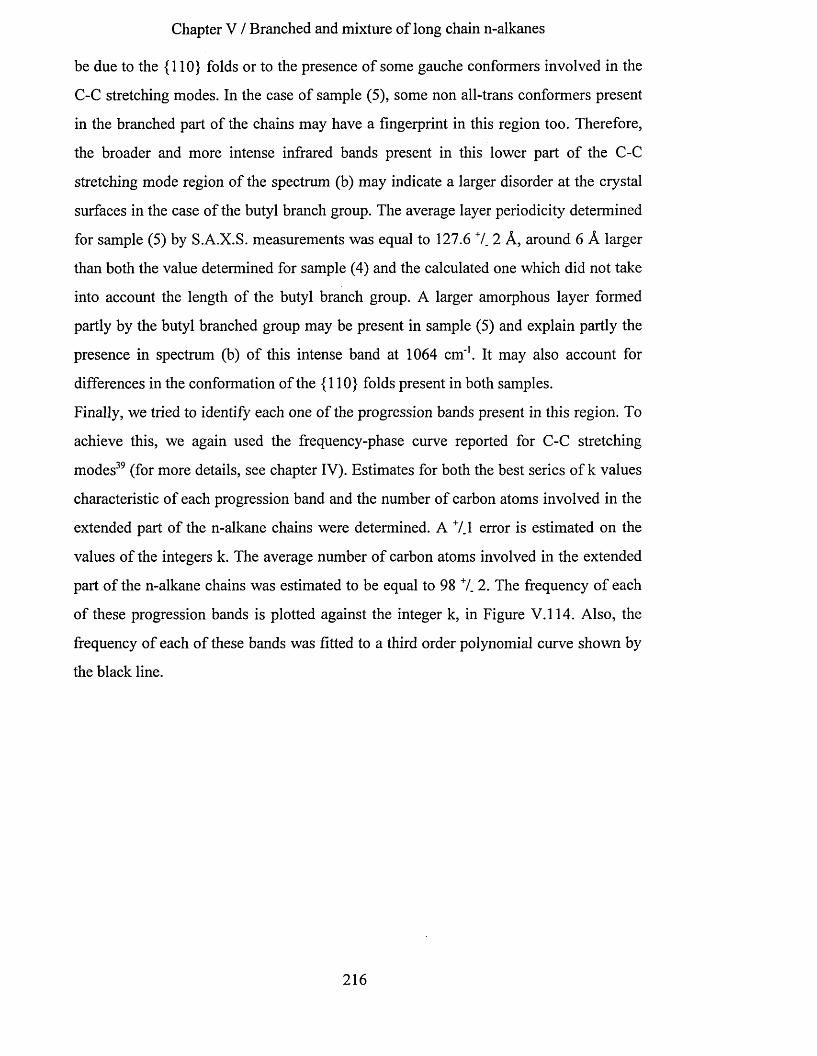
Chapter V / Branched and mixture of long chain n-alkanes
be due to the {110} folds or to the presence of some gauche conformers involved in the
C-C stretching modes. In the case of sample (5), some non all-trans conformers present
in the branched part of the chains may have a fingerprint in this region too. Therefore,
the broader and more intense infrared bands present in this lower part of the C-C
stretching mode region of the spectrum (b) may indicate a larger disorder at the crystal
surfaces in the case of the butyl branch group. The average layer periodicity determined
for sample (5) by S.A.X.S. measurements was equal to 127.6 7. 2 A, around 6 A larger
than both the value determined for sample (4) and the calculated one which did not take
into account the length of the butyl branch group. A larger amorphous layer formed
partly by the butyl branched group may be present in sample (5) and explain partly the
presence in spectrum (b) of this intense band at 1064 cm*1. It may also account for
differences in the conformation of the {110} folds present in both samples.
Finally, we tried to identify each one of the progression bands present in this region. To
achieve this, we again used the frequency-phase curve reported for C-C stretching
modes39 (for more details, see chapter IV). Estimates for both the best series of k values
characteristic of each progression band and the number of carbon atoms involved in the
extended part of the n-alkane chains were determined. A 7.1 error is estimated on the
values of the integers k. The average number of carbon atoms involved in the extended
part of the n-alkane chains was estimated to be equal to 98 7. 2. The frequency of each
of these progression bands is plotted against the integer k, in Figure V.114. Also, the
frequency of each of these bands was fitted to a third order polynomial curve shown by
the black line.
216

Chapter V / Branched and mixture of long chain n-alkanes
Figure V.118 : Frequency of the progression bands ascribed to the C-C stretching mode against k, integer, for sample (5) cooled down from 35°C.
o sample (5) cooled down from 35°C Y = 1133.5 + 1.205*X - 0.886*X2 + 38.02*10-3*x3
1080 H 1075 -j 1070 \1065-j1060 - —i—i—i—i—|—i—i—i—i—|—i—i—i i™ j—i—i—i—i—j—i—i—i—i—|—i—i—i—i—j—i—i—i—i—|—i—i—i—i—
0 5 10 15 20 25 30 35 40
k
V.3.3 Comparison of the infrared spectra of samples (4) and (1).
In order to study the effect on the crystal structure of long chain n-alkanes of a small
branch group placed in the middle of the chain, we compared the infrared spectra
recorded at -173°C of samples (1) and (4) crystallised from solution in once folded form.
V.3.3.1 Methylene wagging mode region.In order to compare the methylene wagging mode region of the infrared spectra of
samples (1) and (4), we normalised the spectra using as a reference the integrated
absorbance of the broad band between 2690 cm'1 and 2558 cm'1. The infrared spectra
recorded at -173°C are shown in Figure V.119 after normalisation and baseline
subtraction.
217
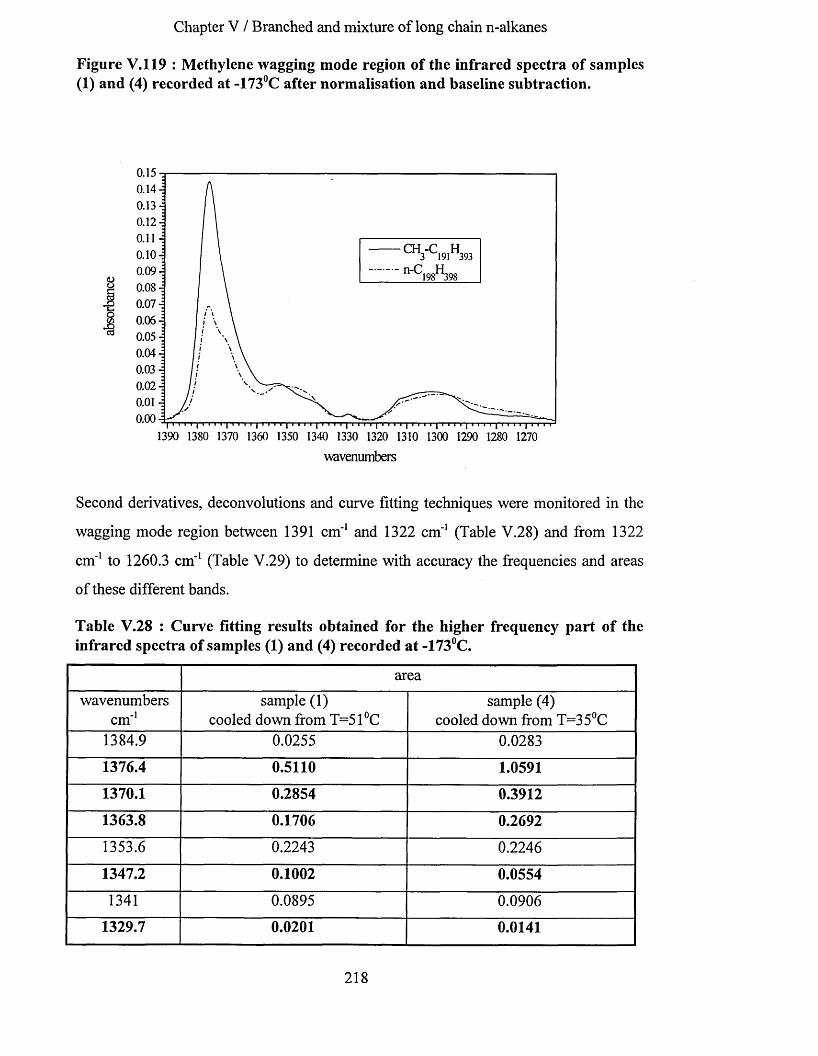
Chapter V / Branched and mixture of long chain n-alkanes
Figure V.119 : Methylene wagging mode region of the infrared spectra of samples (1) and (4) recorded at -173°C after normalisation and baseline subtraction.
1390 1380 1370 1360 1350 1340 1330 1320 1310 1300 1290 1280 1270
wavenumbers
Second derivatives, deconvolutions and curve fitting techniques were monitored in the
wagging mode region between 1391 cm'1 and 1322 cm'1 (Table V.28) and from 1322
cm'1 to 1260.3 cm'1 (Table V.29) to determine with accuracy the frequencies and areas
of these different bands.
Table V.28 : Curve fitting results obtained for the higher frequency part of the infrared spectra of samples (1) and (4) recorded at -173°C.
area
wavenumberscm'1
sample (1) cooled down from T=51°C
sample (4) cooled down from T=35°C
1384.9 0.0255 0.0283
1376.4 0.5110 1.0591
1370.1 0.2854 0.3912
1363.8 0.1706 0.2692
1353.6 0.2243 0.2246
1347.2 0.1002 0.0554
1341 0.0895 0.0906
1329.7 0.0201 0.0141
218
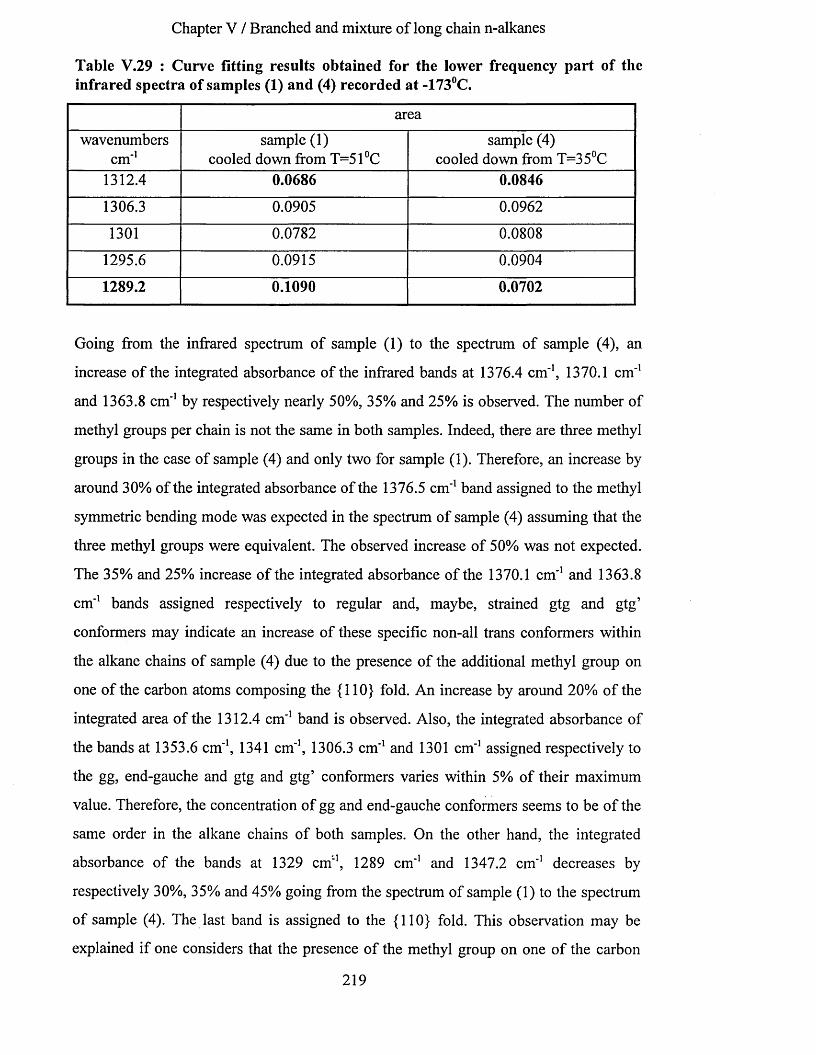
Chapter V / Branched and mixture of long chain n-alkanes
Table V.29 : Curve fitting results obtained for the lower frequency part of the infrared spectra of samples (1) and (4) recorded at -173°C.
area
wavenumberscm'1
sample (1) cooled down from T=51°C
sample (4) cooled down from T=35°C
1312.4 0.0686 0.0846
1306.3 0.0905 0.0962
1301 0.0782 0.0808
1295.6 0.0915 0.0904
1289.2 0.1090 0.0702
Going from the infrared spectrum of sample (1) to the spectrum of sample (4), an
increase of the integrated absorbance of the infrared bands at 1376.4 cm"1, 1370.1 cm"1
and 1363.8 cm'1 by respectively nearly 50%, 35% and 25% is observed. The number of
methyl groups per chain is not the same in both samples. Indeed, there are three methyl
groups in the case of sample (4) and only two for sample (1). Therefore, an increase by
around 30% of the integrated absorbance of the 1376.5 cm'1 band assigned to the methyl
symmetric bending mode was expected in the spectrum of sample (4) assuming that the
three methyl groups were equivalent. The observed increase of 50% was not expected.
The 35% and 25% increase of the integrated absorbance of the 1370.1 cm"1 and 1363.8
cm"1 bands assigned respectively to regular and, maybe, strained gtg and gtg’
conformers may indicate an increase of these specific non-all trans conformers within
the alkane chains of sample (4) due to the presence of the additional methyl group on
one of the carbon atoms composing the {110} fold. An increase by around 20% of the
integrated area of the 1312.4 cm'1 band is observed. Also, the integrated absorbance of
the bands at 1353.6 cm'1, 1341 cm"1, 1306.3 cm'1 and 1301 cm'1 assigned respectively to
the gg, end-gauche and gtg and gtg’ conformers varies within 5% of their maximum
value. Therefore, the concentration of gg and end-gauche conformers seems to be of the
same order in the alkane chains of both samples. On the other hand, the integrated
absorbance of the bands at 1329 cm'1, 1289 cm'1 and 1347.2 cm'1 decreases by
respectively 30%, 35% and 45% going from the spectrum of sample (1) to the spectrum
of sample (4). The last band is assigned to the {110} fold. This observation may be
explained if one considers that the presence of the methyl group on one of the carbon
219

Chapter V / Branched and mixture of long chain n-alkanes
atoms composing the fold has changed the conformation of the fold or caused a
redistribution of the energy of vibration within the fold.
In order to compare the infrared spectra of samples (1) and (4) recorded at -173°C, we
also subtracted the spectrum of sample (1) cooled down from 51°C from the spectrum of
sample (4) cooled down from 35°C. The two infrared spectra were normalised using the
area of the band centred at 2670 cm'1. The result of this subtraction is shown in Figure
V.120.
Figure V.120 : infrared spectrum of sample (1) recorded at -173°C subtracted from the infrared spectrum of sample (4) recorded at -173°C, after baseline subtraction and normalisation.
0.07 1376
0.06
0.05
0.04£
13700.031364
0.02 -
0.01 -
0.00
1329- 0.01 - 1289
1390 1380 1370 1360 1350 1340 1330 1320 1310 1300 1290 1280 1270
wavenumbers
The positive bands at 1376 cm'1, 1370 cm*1 and 1364 cm'1 are the bands which have a
greater integrated absorbance in the spectrum of sample (4) than in the spectrum of
sample (1). Therefore, a higher number of gtg and gtg’ conformers may be present in the
chains of sample (4). Most of the other bands are negative in this spectrum. Their
integrated absorbance is greater in the spectrum of sample (1) than in the spectrum of
sample (4) at -173°C. This is especially the case for the bands at 1346 cm'1, 1329 cm'1
and 1289 cm'1, the first one being assigned to the {110} fold.
220
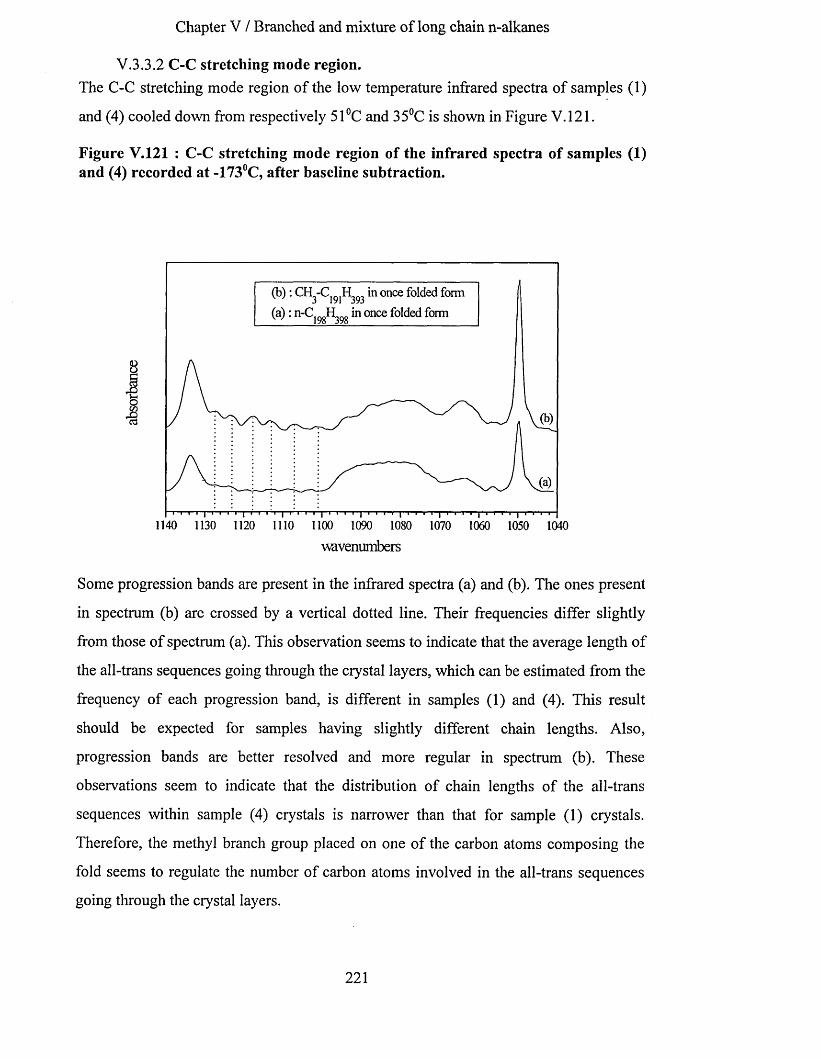
Chapter V / Branched and mixture of long chain n-alkanes
V.3.3.2 C-C stretching mode region.The C-C stretching mode region of the low temperature infrared spectra of samples (1)
and (4) cooled down from respectively 51°C and 35°C is shown in Figure V.121.
Figure V.121 : C-C stretching mode region of the infrared spectra of samples (1) and (4) recorded at -173°C, after baseline subtraction.
(b): CH "C H in once folded form
(a): n-C H in once folded form
8
01
1140 1130 1120 1110 1100 1090 1080 1070 1060 1050 1040
wavenumbers
Some progression bands are present in the infrared spectra (a) and (b). The ones present
in spectrum (b) are crossed by a vertical dotted line. Their frequencies differ slightly
from those of spectrum (a). This observation seems to indicate that the average length of
the all-trans sequences going through the crystal layers, which can be estimated from the
frequency of each progression band, is different in samples (1) and (4). This result
should be expected for samples having slightly different chain lengths. Also,
progression bands are better resolved and more regular in spectrum (b). These
observations seem to indicate that the distribution of chain lengths of the all-trans
sequences within sample (4) crystals is narrower than that for sample (1) crystals.
Therefore, the methyl branch group placed on one of the carbon atoms composing the
fold seems to regulate the number of carbon atoms involved in the all-trans sequences
going through the crystal layers.
221

Chapter V / Branched and mixture of long chain n-alkanes
Two distinct regions within the spectra are very clear. From 1100 cm'1 towards higher
frequencies, the progression bands are observed. From 1100 cm'1 towards lower
frequencies, at least three broad bands at around 1089 cm'1, 1078 cm’1 and 1064 cm’1 are
observed. In the infrared spectra of samples (1) and (4), some of these bands may be due
to the {110} folds or to the presence of some disorder at the end parts of the chains. The
broader and more intense infrared bands present in this lower part of the C-C stretching
mode region of the spectrum (b) may indicate a higher disorder at the crystal surfaces in
sample (4). It may also indicate differences in the conformation of the {110} folds
present in both samples.
V.3.4 Comparison of the infrared spectra of samples (5) and (1).
In order to study the effect on the crystal structure of long chain n-alkanes of a bigger
branched group placed in the middle of the chain, we compared the infrared spectra
recorded at -173°C of samples (1) and (5) crystallised from solution in once folded form.
V.3.4.1 Methylene wagging mode region.In order to compare the methylene wagging mode region of the infrared spectra of
samples (1) and (5), we normalised the spectra using as a reference the integrated
absorbance of the broad band between 2690 cm'1 and 2558 cm'1. The infrared spectra
recorded at -173°C are shown in Figure V.122 after normalisation and baseline
subtraction.
222
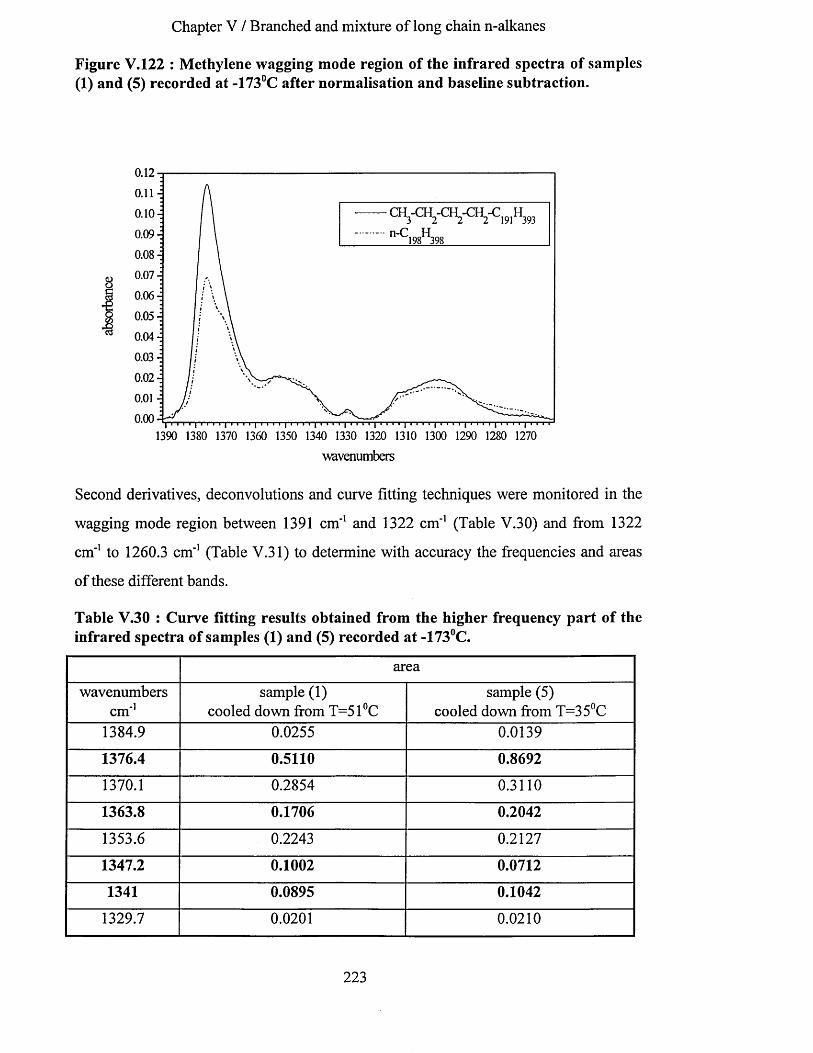
Chapter V / Branched and mixture of long chain n-alkanes
Figure V.122 : Methylene wagging mode region of the infrared spectra of samples (1) and (5) recorded at -173°C after normalisation and baseline subtraction.
0.12
0.11 -j
c h 3-c h 2-c h 2-c h 2-c .9ih 391
n-C198 398__________________
0.10-j0.09
0.08 H
o.o7£
0.06
0.05 ■;
0.04-i
0.03 ■;
0.02 •:
0.01 -j
o.oo1390 1380 1370 1360 1350 1340 1330 1320 1310 1300 1290 1280 1270
wavenumbers
Second derivatives, deconvolutions and curve fitting techniques were monitored in the
wagging mode region between 1391 cm'1 and 1322 cm'1 (Table V.30) and from 1322
cm'1 to 1260.3 cm'1 (Table V.31) to determine with accuracy the frequencies and areas
of these different bands.
Table V.30 : Curve fitting results obtained from the higher frequency part of the infrared spectra of samples (1) and (5) recorded at -173°C.
area
wavenumberscm'1
sample (1) cooled down from T=51°C
sample (5) cooled down from T=35°C
1384.9 0.0255 0.0139
1376.4 0.5110 0.8692
1370.1 0.2854 0.3110
1363.8 0.1706 0.2042
1353.6 0.2243 0.2127
1347.2 0.1002 0.0712
1341 0.0895 0.1042
1329.7 0.0201 0.0210
223

Chapter V / Branched and mixture of long chain n-alkanes
Table V.31 : Curve fitting results obtained from the lower frequency part of the infrared spectra of samples (1) and (5) recorded at -173°C.
area
wavenumberscm'1
sample (1) cooled down from T=51°C
sample (5) cooled down from T=35°C
1312.4 0.0686 0.0806
1306.3 0.0905 0.0912
1301 0.0782 0.0913
1295.6 0.0915 0.1031
1289.2 0.1090 0.1149
Going from the infrared spectrum of sample (1) to the spectrum of sample (5), an
increase of the integrated absorbance of the infrared bands at 1376.4 cm'1 by nearly 40%
is observed. Due to the presence of three methyl groups per chain in sample (5) and
assuming that they are equivalent, an increase by around 30% of the integrated
absorbance of the 1376.5 cm'1 band assigned to the methyl symmetric bending mode
was expected. The integrated absorbance of the bands at 1363.8 cm'1, 1341m'1, 1312.4
cm'1 and 1301 cm'1 increases by around 15% going from the spectrum of sample (1) to
the spectrum of sample (5). The 1341 cm'1 and 1363.8 cm'1 bands are ascribed
respectively to end-gauche and strained gtg and gtg’ conformers. Their concentration
may be higher in the sample (5) crystals. Some of these conformers may be located
within the butyl branch groups. The integrated absorbance of the bands at 1370 cm'1 and
1306 cm'1 both assigned to gtg and gtg’ conformers, 1353 cm'1 assigned to gg
conformers, 1329 cm'1 and 1289 cm'1 varies within 10% of their maximum value. A
similar concentration of gg, gtg and gtg’ conformers seems to be present in both
samples (1) and (5). Finally, the integrated absorbance of the 1347 cm'1 band assigned to
the {110} fold decreases by around 30% going from the spectrum of sample (1) to the
spectrum of sample (5). This observation may indicate a change in the conformation of
{110} folds or a redistribution of the energy of vibration within the folds due to the
presence of a butyl group on one of the carbon atoms composing the fold.
In order to compare the infrared spectra of samples (1) and (5) recorded at -173°C, we
also subtracted the spectrum of sample (1) cooled down from 51°C from the spectrum of
224

Chapter V / Branched and mixture of long chain n-alkanes
sample (5) cooled down from 35°C. The result of this subtraction is shown in Figure
V.123.
Figure V.123 : Infrared spectrum of sample (1) recorded at -173°C subtracted from the infrared spectrum of sample (5) recorded at -173°C, after baseline subtraction and normalisation.
0.0501376.5
0.045
0.040
0.035
0.030 -j
0.025&0.020
o00
1365
' 1354 1341 9o.oi5 13001312 12920.0100.005
0.000-0.005 •: 1278------^1347-- 0.010
1390 1380 1370 1360 1350 1340 1330 1320 1310 1300 1290 1280 1270
wnvenumbers
The positive band at 1376.5 cm*1 is the major band of the region. It is assigned to the
methyl symmetric deformation. Due to the presence of three methyl groups per chain in
sample (5) instead of two in sample (1), this band was expected to be observed. The
other positive bands present in the spectrum at 1365 cm'1, 1354 cm*1, 1341 cm'1, 1329
cm*1, 1312 cm'1, 1300 cm'1 and 1292 cm'1 are very much weaker and may indicate a
higher concentration of gtg, gtg’ and end-gauche conformers in the crystals of sample
(5). Finally, two negative bands at 1278 cm'1 and 1347 cm'1 are detected. The last one
assigned to the {110} folds may indicate some differences in the conformation of the
{110} folds or a redistribution of the energy of vibration within the {110} folds due to
the presence of the butyl groups on one of the carbon atoms composing the folds within
sample (5) crystals.
225

Chapter V / Branched and mixture of long chain n-alkanes
V.3.4.2 C-C stretching mode region.The C-C stretching mode region of the low temperature infrared spectra of samples (1)
and (5) cooled down from respectively 51°C and 35°C is shown in Figure V.124.
Figure V.124 : C-C stretching mode region of the infrared spectra of samples (1) and (5) recorded at -173°C, after baseline subtraction.
(b) : Futyl-C191H393 in once folded form
(a ): n-C H in once folded form
8
oVi
•8
1140 1130 1120 1110 1100 1090 1080 1070 1060 1050 1040
wavenumbers
Some progression bands are present in the infrared spectra (a) and (b). The ones present
in spectrum (b) are crossed by a vertical dotted line. Their frequencies differ slightly
from those of spectrum (a). Similar observations made when we compared the spectra of
sample (1) and (4) can be found here too. Indeed, the average length of the all-trans
sequences going through the crystal layers, which can be estimated from the frequency
of each progression band, is different in samples (1) and (5). Also, progression bands
are very much better resolved and more regular in spectrum (b) than in spectrum (a).
Therefore, the distribution of chain lengths of the all-trans sequences within sample (5)
crystals appears to be narrower than the one within sample (1) crystals. Hence, the butyl
branch group placed on one of the carbon atoms composing the fold seems to regulate
the number of carbon atoms involved in the all-trans sequences going through the
crystal layers.
226
Chapter V / Branched and mixture of long chain n-alkanes
As observed earlier, some of the bands present in the lower frequency part of this region
may be due to the {110} folds or to the presence of some disorder at the end parts of the
chains. They are much broader and more intense in the spectrum (b) which may indicate
a higher disorder at the crystal surfaces in the case of sample (5). The average layer
periodicity determined for sample (5) by S.A.X.S. measurements was equal to 127.6 7.
2 A, around 6 A larger than the calculated value which did not take in account the length
of the butyl branch group. A larger amorphous layer formed partly by the butyl
branched group may be present in sample (5) and partly explain the presence in
spectrum (b) of these broader bands. It may also indicate differences in the
conformation of the {110} folds present in the two samples.
V.3.5 Conclusion.From S.A.X.S. measurements, we determined the average layer periodicity of sample
(4) crystallised in once folded form from both solution and melt. Crystallised from the
melt, the alkane chains were found to be tilted from the crystal surfaces by an angle
close to 35°. Differences in the integrated area of the bands assigned to the {110} folds,
methyl symmetric deformation and gtg and gtg’ conformers present in the methylene
wagging mode region as well as changes in the regularity and resolution of the
progression bands present in the C-C stretching mode region of the infrared spectra
recorded at -173°C were discussed with regard to the tilting of the alkane chains.
Then, we studied the methylene wagging mode region of the infrared spectra recorded at
-173°C of methyl branched, butyl branched and unbranched long chain alkanes of
similar chain lengths. We identified different specific conformers and compared their
concentrations in each sample. Samples with a branch group in the middle of the chains
were found to contain a higher concentration of non-all trans conformers. In the case of
the butyl branched sample, some of these non all-trans conformers may be present
within the branched part of the chains. Changes detected in the integrated absorbance of
the 1347 cm'1 band assigned to the {110} fold conformation may indicate changes in the
conformation of the fold in the different samples or a redistribution of the energy of
vibration due to the different branched groups placed on one of the carbon atoms
composing the folds.
227

Chapter V / Branched and mixture of long chain n-alkanes
From the higher frequency part of the C-C stretching mode region of the low
temperature infrared spectra of the different samples, we compared the distribution and
average chain lengths of the all-trans parts of the alkane chains going through the crystal
layers. The lower frequency part of this region was taken to give an indication of the
amount of disordered material for each of the different samples. Also, some of the bands
present in this region may be related to several conformations of {110} folds. By
increasing the size of the branches in the middle of the alkane chains, the distribution of
the chain lengths for the all-trans parts of the chains going through the crystal layers
seems to become narrower. At the same time, the amount of disordered material present
in the different samples may increase.
V.3.6 Sample (6) : 1:1 binary mixture of n-C24 6H494 and n-C162H32 6.
V.3.6.1 Infrared spectrum of sample (6) recorded at -173°C.An infrared spectrum of sample (6) in the low temperature crystal structure was
recorded at -173°C. In this triple layer crystal structure, the n-alkane chains have been
found to be in an extended tilted form by the means of S.A.X.S. measurements50 (see
Figure V.109). The wagging mode region of the spectrum is shown in Figure V.125
after baseline subtraction.
228

Chapter V / Branched and mixture of long chain n-alkanes
Figure V.125 : Methylene wagging mode region of the infrared spectrum recorded at -173°C of sample (6) in a triple layer crystal form, after baseline subtraction.
0.010
0.009
0.008
0.007
g 0.006
i 0.005 -j'S :g 0.004
” 0.003 -
0.002-j0.001 -i
0.000
1390 1380 1370 1360 1350 1340 1330 1320 1310 1300 1290
wavenumbers
The maximum absorbance of the spectrum in this region is quite low (just over 0.01).
This is due to the very small quantity of sample used. The major infrared bands of this
region are assigned to the methyl symmetric deformation at 1376 cm'1 and to the gtg and
gtg’ conformers at 1370 cm'1. It is interesting to note the weak intensity of the bands
present at 1354 cm'1, 1341 cm'1 and 1329 cm'1. The first two are assigned respectively to
the gg and end-gauche conformers. The absence of a significant band at 1347 cm'1, in
addition to the weak intensity of the previous bands, may indicate an absence of {110}
fold in sample (6). In the lower frequency part of this spectrum, below 1320 cm'1, a
broad band is present. It has components at 1312 cm'1, 1306 cm'1, 1301 cm'1, 1298 cm'1
and 1295 cm'1. These bands are more intense than those at around 1350 cm'1.
The C-C stretching mode region of the low temperature infrared spectra of sample (2)
cooled down from 126°C (n-CI9gH398 in extended form), sample (3) cooled down from
122°C (n-C 246H494 in extended form) and sample (6) cooled down from room
temperature are shown in Figure V.126 after baseline subtraction.
229
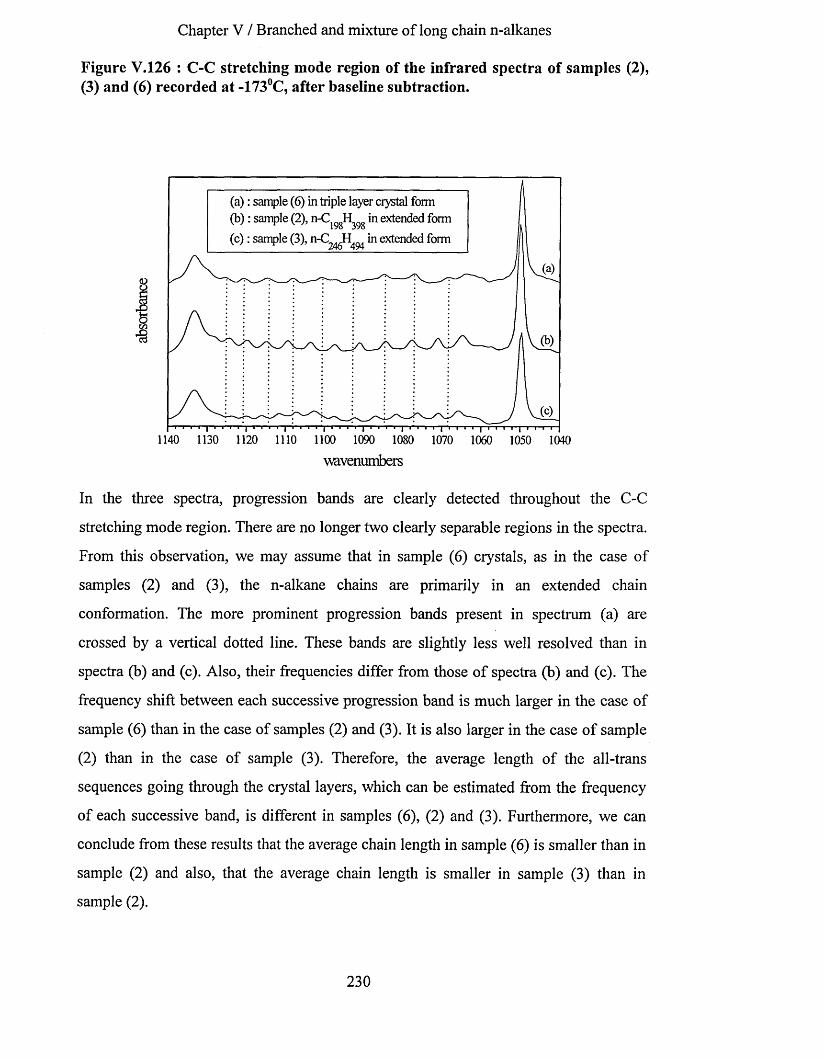
Chapter V / Branched and mixture of long chain n-alkanes
Figure V.126 : C-C stretching mode region of the infrared spectra of samples (2), (3) and (6) recorded at -173°C, after baseline subtraction.
(a) : sample (6) in triple layer crystal form(b ): sample (2), n -C ^ H ^ in extended form
( c ) : sample (3), in extended form
oCO•8
1140 1130 1120 1110 1100 1090 1080 1070 1060 1050 1040
wavenumbers
In the three spectra, progression bands are clearly detected throughout the C-C
stretching mode region. There are no longer two clearly separable regions in the spectra.
From this observation, we may assume that in sample (6) crystals, as in the case of
samples (2) and (3), the n-alkane chains are primarily in an extended chain
conformation. The more prominent progression bands present in spectrum (a) are
crossed by a vertical dotted line. These bands are slightly less well resolved than in
spectra (b) and (c). Also, their frequencies differ from those of spectra (b) and (c). The
frequency shift between each successive progression band is much larger in the case of
sample (6) than in the case of samples (2) and (3). It is also larger in the case of sample
(2) than in the case of sample (3). Therefore, the average length of the all-trans
sequences going through the crystal layers, which can be estimated from the frequency
of each successive band, is different in samples (6), (2) and (3). Furthermore, we can
conclude from these results that the average chain length in sample (6) is smaller than in
sample (2) and also, that the average chain length is smaller in sample (3) than in
sample (2).
230

Chapter V / Branched and mixture of long chain n-alkanes
The absence of any significant infrared bands at around 1089 cm'1, 1078 cm'1 or 1064
cm'1 which may be linked to the {110} folds or to the presence of some disorder near
the chain ends may indicate the absence of a significant amount of {110} fold
conformation or disorder at the crystal surfaces in sample (6). Indeed, a similar amount
of non purely all-trans conformers may be present in the three samples.
Finally, we tried to identify each one of the progression bands present in this region.
Estimates for both the best series of k values characteristic of each progression band and
the number of carbon atoms involved in the extended part of the n-alkane chains were
determined. A 7.1 error is estimated for the values of the integers k. The average
number of carbon atoms involved in the extended part of the n-alkane chains is
estimated to be equal to 158 7. 15. The frequency of each of these progression bands is
plotted against the integer k, in Figure V.l 14. Also, the frequency of each of these bands
was fitted to a third order polynomial curve shown by the black line.
Figure V.127 : Frequency of the progression bands ascribed to the C-C stretching mode against k, integer, sample (6) cooled down from room temperature.
o mixture Y = 1 133.6 +1.01*X -0.312*X2 + 6.5*10-3*X3
1065 -j1060 - —i—r—i—i—|—i—i—r—i—|—i i i i—|—i—i—r—i—|—r—i—i—i—| i i—i—i—|—i—i—i—i—|—i—i—i—i—
0 5 10 15 20 25 30 35 40
k
The study of the infrared spectrum of sample (6) recorded at -173°C indicates that no
significant amount of {110} fold material is present in sample (6) crystals. Therefore,
the n-alkane chains present in the sample are in an extended chain conformation. The
231

Chapter V / Branched and mixture of long chain n-alkanes
all-trans alkane chain length within the crystal layers is smaller in the 1:1 binary mixture
than in the case of n-C198H398 crystals in extended form. The number of carbon atoms
going through the crystal layers has been estimated to be 158 V_ 15. This value is very
similar to 162 which is the number of carbon atoms composing the shortest chains of the
mixture. Nevertheless, a similar amount of “amorphous” material is present in samples
(2), (3) and (6). This implies that the longer alkane chains present in the 1:1 binary
mixture, n-C24 6H494, are also in an extended conformation with few carbon atoms outside
the crystal layers. Therefore, this is consistent with a triple layer structure as determined
by Zeng and Ungar.
V.3.6.2 Effects of heating at a variable rate.With the aim of observing the phase transition occurring within sample (6) between a
triple layer crystal structure and a non integer form involving extended segments, we
heated sample (6) from 70.4°C to 115.2°C. An infrared spectrum was recorded every
3.2°C between 70.4°C and 97°C, then every 0.8°C between 97°C and 108°C and at 112°C
and 115.2°C. A baseline has been used with reference points at 1391 cm'1, 1328 cm'1 and
1283 cm'1. The infrared spectra recorded between 97°C and 115.2°C are shown in Figure
V.128 after baseline subtraction.
232

Chapter V / Branched and mixture of long chain n-alkanes
Figure V.128 : Methylene wagging mode region of the infrared spectra of sample (6) recorded between 97°C and 115.2°C, after baseline subtraction.
wavenumbers
The major bands are found at 1376.5 cm'1, assigned to the methyl symmetric
deformation, 1368 cm'1 assigned to the gtg and gtg’ conformers, 1353 cm'1 ascribed to
the gg conformers, 1342 cm'1 ascribed to the end-gauche conformers and 1307 cm*1
assigned to the gtg and gtg’ conformers. The first fifteen spectra were recorded every
0.8°C. At around 105°C a clear increase of the intensity of the bands assigned to the non
all-trans conformers is observed. The phase transition between the the triple crystal
layer and the N.I.F. structure may have occurred around this temperature. In order to
verify this observation the intensity of each band present in each elevated temperature
infrared spectrum recorded between 70.4°C and 115.2°C was determined after baseline
subtraction. The peak intensity of each band was normalised using the intensity of the
1376.5 cm'1 band assigned to the methyl symmetric deformation. The normalised
intensity of each band is plotted against the annealing temperature in Figure V.129.
233
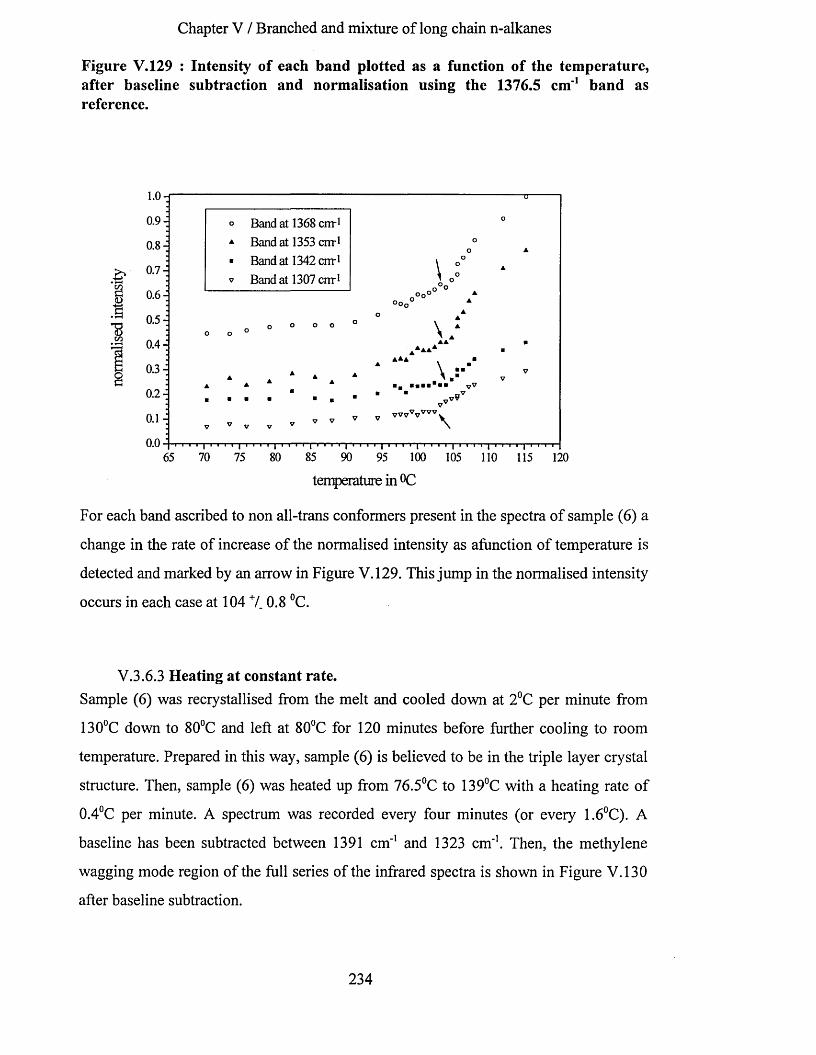
Chapter V / Branched and mixture of long chain n-alkanes
Figure V.129 : Intensity of each band plotted as a function of the temperature, after baseline subtraction and normalisation using the 1376.5 cm'1 band as reference.
£*8
l.O-i
0.9
0.8-j
0.7 -I
0.6-i
0.5 -I
0.4-j
0.3-j
0.2 ■;
0.1
0.0
° Band at 1368 crrr1* Band at 1353 cnr1■ Band at 1342 cnr1v Band at 1307 cm-1
°oco o o
■ ■ ■ ■
\\ o
>° °
A▲
▲▲
[■■■
65■I 1 1 1 1 I 1 1 1 1 I 1 ■T 1"1" 1 H ' 1 ■ i ■ | 1 1 1 1 I' 1 1 1 1 I 1 ■ 1 1 I 1 1 1 170 75 80 85 90 95 100 105 110 115 120
temperature in °C
For each band ascribed to non all-trans conformers present in the spectra of sample (6) a
change in the rate of increase of the normalised intensity as afunction of temperature is
detected and marked by an arrow in Figure V.129. This jump in the normalised intensity
occurs in each case at 104 7 0.8 °C.
V.3.6.3 Heating at constant rate.Sample (6) was recrystallised from the melt and cooled down at 2°C per minute from
130°C down to 80°C and left at 80°C for 120 minutes before further cooling to room
temperature. Prepared in this way, sample (6) is believed to be in the triple layer crystal
structure. Then, sample (6) was heated up from 76.5°C to 139°C with a heating rate of
0.4°C per minute. A spectrum was recorded every four minutes (or every 1.6°C). A
baseline has been subtracted between 1391 cm'1 and 1323 cm'1. Then, the methylene
wagging mode region of the full series of the infrared spectra is shown in Figure V.130
after baseline subtraction.
234
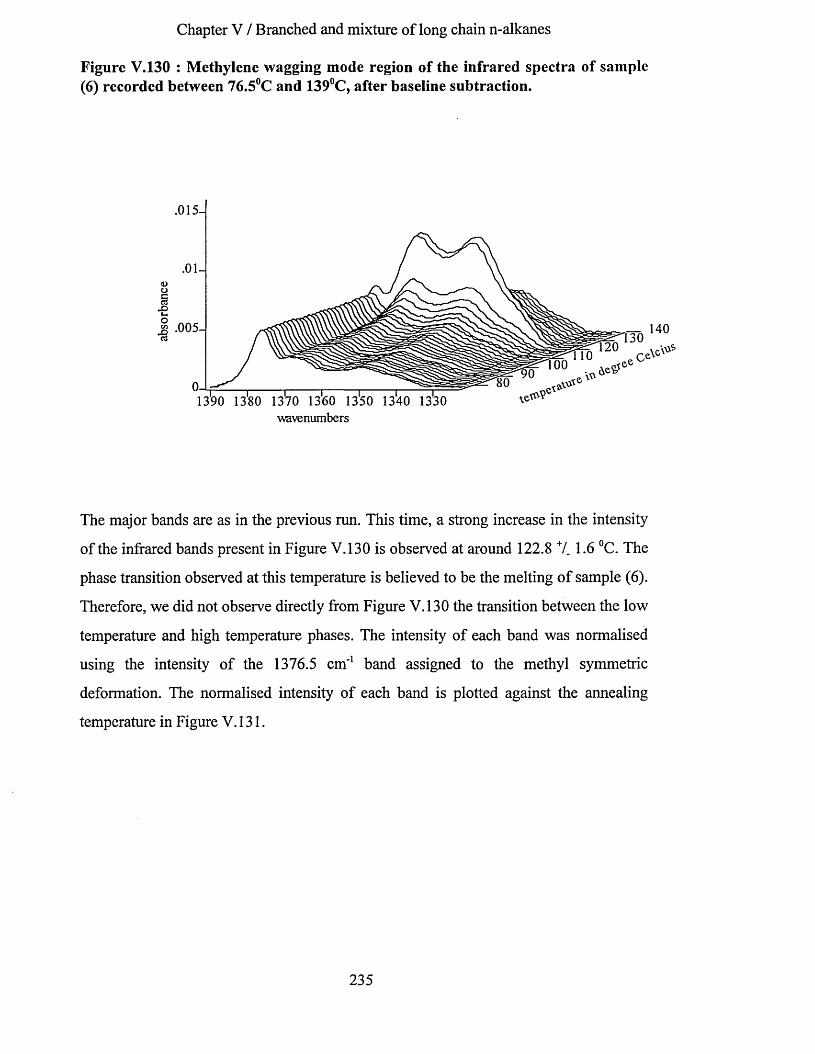
Chapter V / Branched and mixture of long chain n-alkanes
Figure V.130 : Methylene wagging mode region of the infrared spectra of sample(6) recorded between 76.5°C and 139°C, after baseline subtraction.
.015-
wave numbe r s
The major bands are as in the previous run. This time, a strong increase in the intensity
of the infrared bands present in Figure V.130 is observed at around 122.8 7. 1.6 °C. The
phase transition observed at this temperature is believed to be the melting of sample (6).
Therefore, we did not observe directly from Figure V.130 the transition between the low
temperature and high temperature phases. The intensity of each band was normalised
using the intensity of the 1376.5 cm'1 band assigned to the methyl symmetric
deformation. The normalised intensity of each band is plotted against the annealing
temperature in Figure V. 131.
235

Chapter V / Branched and mixture of long chain n-alkanes
Figure V.131 : Intensity of each band plotted as a function of the temperature, after baseline subtraction and normalisation using the 1376.5 cm'1 band as reference.
2.8
26
24
22 . 20
‘8 18 S 16■g 1.4cn% 12 I ..o G 0.8
0.6
0.4
0.275 80 85 90 95 100 105 110 115 120 125 130 135 140
temperature in °C
For each band ascribed to non all-trans conformers present in the spectra of sample (6) a
change in the rate of increase with temperature of the normalised intensity is detected at
122.8 7. 1.6 °C. Above this temperature, the sample is in the liquid state. No indication
of a transition is observed around 105°C.
In Figure V.132, the intensity of each infrared band present in the spectra has been
normalised using the 1376.5 cm'1 band as reference and then, the maximum intensity of
each band has arbitrarily been scaled to one.
Band at 1370 cm-1 Band at 1366 cm-1 Band at 1354 cm-1 Band at 1350 cm-1 Band at 1341 air1
r + J .
, ; ++t *V + ▼ ▼ ▼
o O
o o O ? 9
i i t i * ■ ■ ■ ■ ■" ' 1 I ' 1 T
±±±±±t t t ^ ti *
1 I 1 1 1 1 I 1 I 1 I I | 1 I l l | l l l l | I | I I l l | l l l l
236

Chapter V / Branched and mixture of long chain n-alkanes
Figure V.132 : Scaled intensity of each band plotted as a function of the temperature, after baseline subtraction, normalisation using the 1376.5 cm'1 band as reference and maximum intensity arbitrarily fixed to one.
1.0
0.9
0.8
0.7SJ 1 °-5
1 0-4s0.3
0.2
0.175 80 85 90 95 100 105 110 115 120 125 130 135 140
temperature in °C
Apart from the melting of the sample, no other phase transition is observed.
Nevertheless, we can remark that within sample (6) the number of the non all-trans
conformers is approximately five times lower than in the liquid state. In the case of gtg
and gtg’ conformers, their number is roughly three times lower than in the liquid state.
The absence of any indication of phase transition between the triple layer crystal form
and the N.I.F. structure may be due to the choice of heating rate we used in this last
experiment. Indeed, we may think that this transition may be detected by infrared
spectroscopy only in the case of heating the samples using very low heating rate.
V.3.7 Conclusion.The methylene wagging mode region of the low temperature infrared spectrum of
sample (6) shows low intensity of the bands assigned to gg and end-gauche conformers
and even lower intensity for the band ascribed to the {110} fold conformation. The C-C
stretching mode region of the same spectrum indicates a similar amount of disorder
within the 1:1 binary mixture in the triple layer crystal form to that observed in the n-
Bandat 1370 cm-1 Band at 1366 cm-1 Band at 1354 cm-1 Band at 1350 cm-1 Band at 1341 cnr1
O O O O O O 0 O O O 0 O
.
I I I I | I I I I I I I I I | I I I I | I I I I | I I I I | I
237

Chapter V / Branched and mixture of long chain n-alkanes
Ci9 8H398 and n-C24 6H4 9 4 extended forms. Moreover, from the frequency of the successive
progression bands present in this last region, we were able to determine that the average
number of carbon atoms involved in the all-trans chain length going through the crystal
layers of sample (6) is lower than the one going through the crystal layers of n-C198H398
in extended form. The average values are respectively 158 +/_ 15 and 192 7. 12.
By annealing the sample between 70.4°C and 115.2°C with a variable heating rate, we
observed a strong increase of the intensity of the infrared bands assigned to non all-trans
conformers for spectra recorded at around 104 7. 0.8 °C. This is believed to be the
temperature at which the phase transition between the two crystal structures occurs.
Sample (6) was crystallised once again from the melt and cooled down to obtain the
triple layer crystal form. Then, sample (6) was annealed from 76.5°C to 139°C with a
constant heating rate of 0.4°C per minute. The study of the intensity of the bands present
in the wagging mode region of the infrared spectra assigned to non all-trans conformers
as a function of temperature does not show any transition apart from the melting
occurring at 122.8 7. 1.6 °C. Therefore, the observation of the phase transition occuring
between the triple layer crystal form and the N.I.F. structure by the means of infrared
spectroscopy may be affected by the heating rate used during the experiment.
238
Chapter VI / Conclusion
VI CONCLUSION.
Purely monodisperse long chain n-alkanes are an ideal model to study crystallisation
and disorder within polymers in general and polyethylene in particular. Indeed, similarly
to polyethylene, these molecules are highly flexible, mobile, they do not involve any
specific inter-molecular interactions and do not have large side groups. Disorder is an
important parameter which can affect the mechanical and physical properties of
polymers. For example, the diffusion of a solvent within a polymer film will be highly
affected by the crystallinity and by the concentration of non all-trans conformers present
along the polymer chains. The main objective of this thesis was to study the degree of
disorder within these highly ordered materials which are purely monodisperse long
chain n-alkanes. To achieve this, the use of infrared spectroscopy was essential. Indeed,
spectroscopic techniques, sensitive to molecular details, are the only ones able to
characterise specific types of disorder in both quantitative and qualitative ways. In order
to get a complete structural picture of these monodisperse long chain alkane crystals, the
results obtained from D.S.C., X-ray scattering techniques and Raman spectroscopy were
combined with those obtained from infrared spectroscopy. The experimental part of this
thesis covered by the chapters III, IV and V follows a pattern along which the potential
degree of disorder within the different samples increases. The starting point of this
thesis is a structural study of a short member of the n-alkane family, namely n-C44H90,
which does not have the ability to crystallise by chain folding. Then, in chapter IV, we
concentrate our attention on two pure long chain n-alkanes, namely n-C198H398 and n-
C24 6H49 4. The disorder within these samples crystallised in different chain conformations
was studied using the same spectroscopic techniques and characterisation as previously.
Finally, the study of crystals prepared from branched long chain alkanes and mixtures of
long chain n-alkanes gave some indications of structural features likely in polymers
arising from branching and polydispersity.
In the first experimental chapter of this thesis, chapter III, the different crystal structures
(namely monoclinic {Oil}, monoclinic {101}, orthorhombic I and triclinic forms) of
the short chain n-alkane, n-C44H90, crystallised from solution were identified and
transitions were characterised by a combination of D.S.C. and X-ray scattering
239
Chapter VI / Conclusion
measurements. N-C44H90 samples with different crystal structures were studied using
infrared and low frequency Raman spectroscopy. Each one of the infrared bands
assigned to a methyl vibration has shown a great sensitivity, in both frequency and
intensity, to the crystal structure. In particular, the frequencies of the infrared bands
present in the spectra recorded at -173°C and ascribed to the symmetric methyl bending
mode have been found to vary as a function of the crystal structure between 1385 cm'1
and 1368 cm'1. On the other hand, a single band at 1378 cm*1 was observed in the
spectrum of n-C44H90 in the liquid state. We note that the symmetric methyl bending
mode is not the only methyl mode sensitive to the crystal structure. Indeed, as a function
of the crystal structure the frequency of the out-of-plane methyl rocking mode is found
between 885 cm'1 and 893 cm'1, the asymmetric methyl bending mode is found between
1440 cm'1 and 1468 cm'1 and finally, the in-plane and out-of-plane asymmetric methyl
C-H stretching modes are found between 2950 cm'1 and 2962 cm'1. These results
confirm the close relationship between the packing of the methyl groups at the crystal
surfaces and the crystal structure in the case of the short chain n-alkanes. Also, this
highlighted the difficulty in using the band assigned to the symmetric methyl bending
mode for normalisation purposes, certainly in the case of short chain n-alkanes, and
possibly also in the case of longer chain n-alkanes (i.e. n-alkanes able to crystallise by
chain folding). At the phase transition between different monoclinic forms, an abrupt
increase in the integrated intensity of the 1342 cm'1 infrared band assigned to end-
gauche conformers is observed. In all the infrared spectra of n-C44H90 recorded at
-173°C, none of the bands present in the methylene wagging mode region and assigned
to non all-trans conformers were strong enough to be detected. At this low temperature,
the alkane chains are essentially in an all-trans conformation. The identification of the
band progressions present in the low temperature infrared spectra and assigned to the
different methylene modes of vibration can be used to estimate the number of carbon
atoms present in the alkane chain. This estimate can be compared with the ones derived
directly from the value of the average layer periodicity determined by S.A.X.S.
measurements and from the frequency of the first order of the longitudinal acoustic
mode determined by low frequency Raman spectroscopy. We have also shown that the
frequency of the first order of the longitudinal acoustic mode present in the low
frequency Raman spectra was sensitive to the crystal structure. Indeed, the presence of

Chapter VI / Conclusion
crystals in the orthorhombic II form was identified by an infrared band at 1385 cm'1
assigned to the methyl symmetric bending mode and by the frequency of the first order
of the L.A.M. at 60.3 cm'1. Crystals in the monoclinic {011} form were assigned to a
Raman band at 58.1 cm'1.
In the last experimental chapters of this thesis, chapters IV and V, respectively
dedicated to two purely monodisperse long chain n-alkanes (namely n-C198H398 and n-
C24 6 H494 ) and to the potentially more disordered branched long chain alkanes and binary
mixtures of long chain n-alkanes, we identified different chain conformations and phase
transitions using S.A.X.S. techniques, Raman and infrared spectroscopy. We have
shown that the low frequency Raman spectra could be used to identify several chain
conformations present within the same sample. For example, in the case of sample (2),
n-C198H398 crystallised from solution in essentially extended form, a Raman band at 35.9
cm'1 was observed in addition to a strong band at 13.2 cm'1. The first Raman band is
ascribed to the first order L.A.M. of the once folded crystal form whereas the second
one is ascribed to the first order L.A.M. of the extended crystal form.
In view of the infrared results obtained from the previous experimental chapter, the use
of the broad infrared band at about 2670 cm'1 for spectral normalisation has been
preferred to the use of the band assigned to the symmetric methyl bending mode found
at 1377 cm'1 in the low temperature spectra of the long chain n-alkanes. The methylene
wagging mode region of the infrared spectra confined between 1400 cm'1 and 1260 cm'1
is rich in information related to specific non all-trans conformers which may be present
in the n-alkane chains. Indeed, the gtg and gtg’, gg and end-gauche conformers are
assigned to the infrared bands present at respectively 1370 cm'1 and 1308 cm'1, 1354
cm'1 and 1341 cm'1. These infrared bands were used to identify those of these
conformers present in the long chain alkane crystals in different forms. Also, a spectral
subtraction technique was used to determine the different conformers characteristic of
the fold itself in the case of n-C198H398 crystals studied at the lowest temperature. The
subtraction spectrum showed a strong positive band present at 1375.5 cm'1 with a
smaller negative one at 1381 cm'1. This is believed to indicate the non-equivalence of
the deformation of the methyl groups placed at the end of an n-alkane chain in folded or
extended chain conformations. We were able to estimate the numbers of each specific
conformer per n-alkane chain from the integrated area of the bands present in this region
241
Chapter VI / Conclusion
of the infrared spectra. There are at least three times more non all-trans conformers per
chain within the once folded form crystals than within the extended form crystals. Also,
we observed that the branched alkane crystals contained a higher concentration of these
conformers than the unbranched samples. One can note that in the case of the butyl
branch samples, one of these conformers could be present within the branched part of
the chains. Also, in the infrared spectra of the branched and unbranched long chain
alkanes, differences observed in the integrated absorbance of the band at 1347 cm'1 may
be due to changes in the conformation of the {110} fold or to a redistribution of the
energy of vibration due to the branch groups on one of the carbon atoms composing the
fold. Finally, for the linear n-alkanes the concentration of non all-trans conformers in
the liquid state was found to be one order of magnitude higher than in the crystalline
state near to their melting points.
We observed that the successive increases of temperature at which the different
monodisperse long chain n-alkane crystals were heated prior to cooling to -173°C
produced progressively more perfect crystals. This perfecting of the long chain n-alkane
crystals was indicated by the decrease of the integrated absorbance of most of the bands
assigned to the non all-trans conformers present in the wagging mode region of the
infrared spectra. Several progression bands are present in the C-C stretching mode
region of the lowest temperature infrared spectra of the different samples confined
between 1130 cm'1 and 1050 cm'1. From the identification of each one of these bands,
we were able to estimate the number of carbon atoms involved in the all-trans parts of
the alkane chains. For example, by identifying the progression bands present in this
region of the infrared spectra of the binary mixture of long chain n-alkanes recorded at
-173°C, we estimate that the crystal layers were composed of 158 carbon atoms. This
result seems to correspond to the thickness of the larger crystal layers present in the
triple layer crystal form proposed by Ungar and Zeng. In the case of the monodisperse
long chain n-alkanes, the perfecting of the different crystals as a function of the
annealing temperature induced a better regularity and resolution of the progression
bands. The regularity of these bands is related to both the perfection of the all-trans part
of the alkane chains (i.e. absence of gauche conformers within the internal bonds of the
chains) and the length distribution of the parts of the chains in the all-trans conformation
(i.e. the number of contiguous methylene groups involved in the all-trans bonds for each
242

Chapter VI / Conclusion
chain). Finally, the increase of the number of orders of diffraction on the S.A.X.S.
patterns of the annealed extended form crystals indicates a better stacking of the crystals
due to more regular crystal surfaces. At the phase transition between long chain n-
alkane crystals in the once folded and extended forms, the disorder was found to reach a
local maximum characterised by an increase of the integrated area of the bands present
in the wagging mode region of the infrared spectra and ascribed to the non all-trans
conformers present within the internal bonds of the chains. In the case of the binary
mixtures of long chain n-alkanes, we observed from a study of the wagging mode region
of the spectra a similar behaviour of the concentration of non all-trans conformers at the
phase transition between the triple layer structure and the non-integer form involving
extended segments.
In the case of the long chain n-alkanes, the values of the frequency differences between
the progression bands present in the C-C stretching mode region of the spectra of once
folded form crystals were expected to be equal to roughly twice the values obtained
from the spectra of the extended form crystals. Indeed, this would have been due to the
presence of the fold in the first case which splits the chains into two all-trans stems of
similar chain length. Nevertheless, in both cases we observed similar values of the
frequency differences between the progression bands. Furthermore, the frequency of
each progression band was identical in the spectra of both crystal forms. This
unexpected result may be due to the molecular symmetry, related to the high regularity
of the fold conformation in crystals of monodisperse long chain n-alkanes. It also
suggests that the disordered chain sections in once folded and extended form crystals are
of similar length. Nevertheless, in the first case, the weaker intensity of these bands may
suggest that for symmetry reasons only the more regular chains participate to the C-C
stretching mode of vibration.
At a phase transition between two crystal forms, changes are observed within this
region. Indeed, the bands present at around 1089 cm'1, 1078 cm'1 and 1064 cm'1 were
detected only in the spectra of the once folded form crystals. These bands are assigned
to non all-trans conformers. Some of those may be related to the fold itself. This region
of the infrared spectra of the butyl branched sample has shown how useful infrared
spectroscopy could be for the study of the conformation of paraffinic chains. Indeed, in
the particular case of the butyl branched alkane, the identification of the highly regular
243
Chapter VI / Conclusion
and well resolved progression bands present in the higher frequency part of this region
indicated that 98 carbon atoms were involved in the extended part of the chains. Several
broad bands were found in the lower frequency part of the region at around 1089 cm'1,
1078 cm'1 and 1064 cm'1 suggesting the presence of some non all-trans conformers and
folds. Therefore, a general picture of this sample could be drawn from these
observations : the butyl branched sample is in the once folded form with the fold nearly
exactly in the middle of the chains. The two stems passing through the crystal layers are
highly regular (mostly all-trans conformation) and are of similar chain length. Some non
all-trans conformers are present near the crystal surfaces and within the branch part of
the chains. We have also shown that by increasing the size of the branch groups (from a
methyl to a butyl group) the distribution of chain lengths in the all-trans conformation
seems to get narrower. At the same time, the amount of non all-trans conformers near
the crystal surfaces may have increased.
In the case of spectra of extended form crystals, the progression bands are found over
the full frequency region. In the spectrum recorded at -173°C of the crystals of the
binary mixture of n-alkanes, the absence of the broad bands in the lower frequency part
of this region indicates an absence of folded chains and a low concentration of non all-
trans conformers. This is confirmed by studying the wagging mode region of the same
spectrum.
In the case of the monodisperse long chain n-alkanes, tilting of the chains from the
crystal surfaces can be induced by heating. The tilt angle can be determined from
S.A.X.S. measurements after initial identification of the crystal form by low frequency
Raman spectroscopy. The tilting of the chains inside the crystals was expected to lead to
an increase in the number of non all-trans conformers present in the alkane chains, and
more especially at the chain ends. The methylene wagging mode region of the infrared
spectra of a sample successively heated up at different increasing temperatures, and then
cooled down to —173°C, was studied. We observed an unexpected decrease of the
integrated absorbance of most of the bands assigned to non all-trans conformers present
in the n-alkane chains with the increase of annealing temperature. This is explained by a
perfecting of the crystals. The perfecting of the crystals may predominate over the
formation of non all-trans conformers at the chain ends due to the chain tilting, masking
the latter effect in the infrared data. In order to separate these two effects, n-C198H398
244

Chapter VI / Conclusion
were prepared with the lowest possible concentration of non all-trans conformers. We
then studied the wagging mode region of its infrared spectra as a function of the time
spent at a fixed temperature at which the tilting was known to occur. At the shortest
time, this region indicated that the tilting of the n-alkane chains occurred through a
disordering process which does not preferentially affect the chain ends. Then, at the
longest annealing time, the tilted chains adopt a more stable conformation where the
number of non all-trans conformers is reduced. Also, due to changes in the intensity of
the 1346 cm'1 band, we believe that the conformation of the initial {110} fold may have
changed. All these results indicate that the concentration of non all-trans conformers is
not only temperature dependent but also time dependent.
The identification of all the progression bands present in the infrared spectra recorded at
-173°C of the different monodisperse long chain alkanes studied in their different chain
conformations is shown in Figure VI. 133. Sample (1) corresponds to n-C198H398
crystallised from solution in once folded form. Sample (1) ext. corresponds to n-C198H398
crystallised from solution in once folded form and transformed to the extended form by
heating. Sample (2) corresponds to n-C,98H398 crystallised from solution in the extended
form. Sample (3) corresponds to n-C24 6H4 9 4 crystallised from solution in once folded
form. Sample (3) ext. corresponds to n-C24 6H4 9 4 crystallised from solution in once folded
form and transformed to the extended form by heating. Sample (4) corresponds to
c 96h 193c h c h 3c 94H189 crystallised from solution in once folded form. Sample (5)
corresponds to C96H193CH(CH2)3CH3C94Hi89 crystallised from solution in once folded
form. Finally, sample (6) corresponds to the binary mixture of n-C162H326 and n-C246H494
in the triple layer crystal form.
245
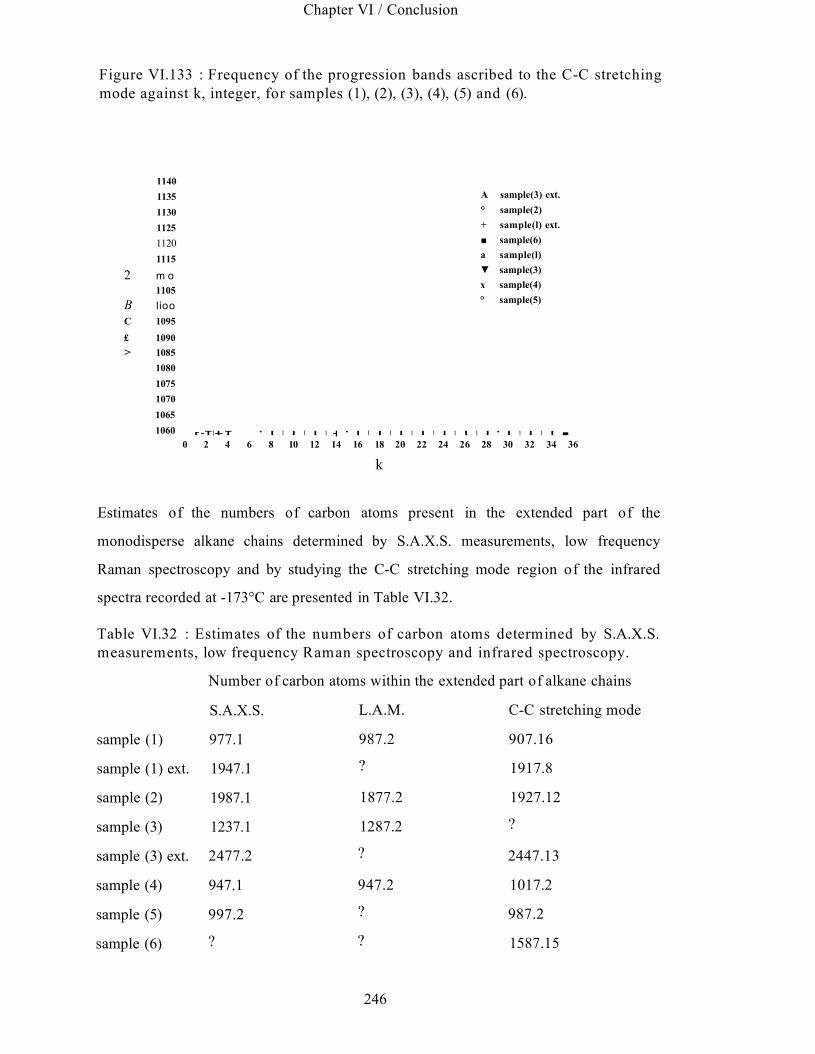
Chapter VI / Conclusion
Figure VI.133 : Frequency of the progression bands ascribed to the C-C stretching mode against k, integer, for samples (1), (2), (3), (4), (5) and (6).
1140 1135 1130 1125 1120 1115
2 m o1105
B liooC 1095
£ 1090> 1085
1080 1075 1070 1065 1060
0 2 4 6 8 10 12 14 16 18 20 22 24 26 28 30 32 34 36
k
Estimates of the numbers of carbon atoms present in the extended part of the
monodisperse alkane chains determined by S.A.X.S. measurements, low frequency
Raman spectroscopy and by studying the C-C stretching mode region of the infrared
spectra recorded at -173°C are presented in Table VI.32.
Table VI.32 : Estimates of the numbers of carbon atoms determined by S.A.X.S. measurements, low frequency Raman spectroscopy and infrared spectroscopy.
Number of carbon atoms within the extended part of alkane chains
S.A.X.S. L.A.M. C-C stretching mode
sample (1) 977.1 987.2 907.16
sample (1) ext. 1947.1 ? 1917.8
sample (2) 1987.1 1877.2 1927.12
sample (3) 1237.1 1287.2 ?
sample (3) ext. 2477.2 ? 2447.13
sample (4) 947.1 947.2 1017.2
sample (5) 997.2 ? 987.2
sample (6) ? ? 1587.15
A sample(3) ext. ° sample(2)+ sample(l) ext. ■ sample(6) a sample(l)▼ sample(3) x sample(4)° sample(5)
r -T1 -I- T ' I 1 I 1 I 1 -| ' I 1 I 1 I 1 I 1 I 1 I 1 I ' I 1 I 1 I ■
246

Chapter VI / Conclusion
It can be observed that the number of carbon atoms present in the extended part of the
alkane chains determined from the study of the C-C stretching mode region of the
infrared spectra is usually smaller than the one determined by S.A.X.S. measurements
or Raman spectroscopy. Also, the uncertainty for each value is usually larger in the case
of the use of the C-C stretching mode region. Finally, we should note that estimates of
the number of carbon atoms using the C-C stretching mode region are made for crystals
at -173°C rather than room temperature as in the case of the two other methods. Hence,
S.A.X.S. and Raman measurements are carried out on more disordered crystals. The
conditions applicable for the observation of the C-C stretching progression appear to be
more stringent than those for observing a S.A.X.S. peak or a Raman LA mode. This
suggests that the requirement of an all-trans chain is more rigorous in the first case.
Finally, a summary of the full information which can be obtained from the study of the
infrared spectra of these monodisperse long chain n-alkanes is presented in Table VI.33.
247

Chapter VI / Conclusion
Table VI.33 : Information obtained from the different spectral regions of the infrared spectra of paraffins.
Modes of Vibrations Frequency range
(cm-1)
Information
Methyl C-H stretching 2965-2950 Crystal structure, surface disorder
Methylene C-H
stretching
2920-2840 crystal disorder
Asymmetric methyl
bending
1468-1440 crystal structure
Methylene bending around 1470 crystal disorder
Methyl symmetric
bending
1385-1368 crystal structure, surface disorder
Methylene wagging 1400-1300 qualitative and quantitative study of
the surface and crystal disorders,
fold conformation, phase transition
Methylene twisting 1300-1175 crystal disorder
C-C stretching 1150-950 gauche conformers, fold structure,
estimates of the crystal layer
thickness, phase transition
Methyl rocking 893-885 Crystal structure, surface disorder
Methylene rocking 1050-720 Crystal structure, estimates of the
crystal layer thickness, gauche
conformers
Future w ork:
The different studies carried out on the monodisperse long chain n-alkanes provide
essential information for the understanding of the mechanism of crystallisation by chain
folding and, more generally, for the crystallisation of polymers. The combination of the
different techniques used in this thesis should provide the means for testing structures
having high degrees of disorder and new more complex layered phases expected to
occur in the mixtures of monodisperse long chain n-alkanes and in the branched long
248

Chapter VI / Conclusion
chain alkanes. Complex multilayered crystals also present in the subsequent
transformation of these long chain n-alkanes from primary forms present in the initial
stages of crystallisation could be studied. The use of infrared spectroscopy and
especially the C-C stretching mode region of the spectra (the importance of which has
been revealed in this thesis) should definitively provide the additional structural
information needed. The full range of monodisperse long chain n-alkanes which are
now available from n-C98H198 to n-C390H782 should be studied by the combination of
these techniques. Changes in the fold conformation as a function of the chain length
could be investigated. For polymers, it is almost certain that some folds are not adjacent.
This might occur in the long chain n-alkanes for a larger number of folds. Therefore, the
study of the fold conformation as a function of the number of folds per chain could be
carried out. Mixtures of different monodisperse long chain n-alkanes provide the
opportunity to study new lamellar structures. The controlled polydispersity within these
samples provides a well defined model for polymer crystallisation. New synthesis of
different branched long chain alkanes such as a star-shaped samples, should lead to new
forms of chain organisation within crystals. These could be studied using the same
combination of techniques : indeed, infrared spectroscopy is the best method to estimate
the degree of disorder within such crystals. Finally, newly synthesised monodisperse
long chain n-alkanes with deuterated end caps are also available. In addition to the
previous techniques used, neutron scattering should provide new structural information.
Also, the study of these deuterated long chain n-alkanes may help to assign some of the
infrared bands present in the spectra. It should give the opportunity to differentiate non
all-trans conformers present at different positions along the alkane chains.
249
References
References
1 G. R. Strobl, The Physics of Polymers, 2nd Ed., Springer-Verlag Berlin Heidelberg(1997)2 P. J. Flory, Statistical Mechanics of Chain Molecules, John Willey & sons. Inc. (1969)3 R. J. Young and P. A. Lovell, Introduction to Polymers, 2nd Ed., Chapman & Hall (1991)4 W. O. Statton and P. H. Geil, J. Appl. Polym. Sci., 3, 357 (1960)5 A. Keller, Phil. Mag., 2, 1171 (1957)6 A. Peterlin, J. Appl. Phys., 31, 1934 (1960)7 D. M. Sadler, 24, 1401 (1983)8 D. M. Sadler, 28, 1440 (1987)9 J. I. Jr Lauritzen and J. D. Hoffman, J. Res. Nat. Bur. Stds, 64A, 73 (1960)10 L. A. Wood, Scientific Progress in the Field of Rubber and Synthetic Elastomers, 2, 57, Interscience, New York (1946)11 P. J. Barham, R. A. Chivers, A. Keller, J. Martinez-Salazar and S. J. Organ, J. Mater. Sci, 20, 1625(1985)12 W. M. Leung, R. St. John Manley and A. R. Panaras, Macromolecules, 18, 746-771 (1985)13 A. J. Kovacs, C. Straupe and A. Gonthier, J. Polym. Sci, Polym. Symp. E d , 59, 31 (1977).14 J. P. Arlie, P. Spegt and A. Skoulios, Makromol. Chem, 104, 212 (1967)151. Bidd and M. C. Whiting, J. Chem. Soc, Chem. Commun, 543 (1985)16 G. Ungar, J. Stejny, A. Keller, I. Bidd and M. C. Whiting, Science, 229, 386 (1985)17 G. M. Brooke, S. Burnett, S. Mohammed, D. Proctor and M. C. Whiting, J. Chem. Soc, Perkin Trans. 1, 1635 (1996)18 G. Ungar, S. J. Organ, A. Keller, J. Polym. Sci, Polym. Lett. Ed, 26, 259 (1988)19 J. K. Hobbs, M. J. Hill, A. Keller and P. J. Barham, J. Polym. Sci. Part B, Polym. Phys, 37, 3188(1999)20 G. Ungar and A. Keller, Polymer, 2 7 ,1835 (1986)21 X. Zeng and G. Ungar, Polymer, 3 9 ,19,4523 (1998)22 X. Zeng, G. Ungar and S.J. Spells, Abstract of Papers of the American Chemical Society, 128, 2, 98 (1999)23 G. Ungar, A. Keller, Polymer, 2 8 ,1899 (1987)24 S. J. Organ, A. Keller, M. Hikosaka and G. Ungar, Polymer, 3 7 ,12, 2517 (1996)25 E. Boda, G. Ungar, G. M. Brooke, S. Burnet, S. Mohammed, D. Proctor and M. C. Whiting, Macromolecules, 3 0 ,16, 4674 (1997)26 S. J.Organ, G. Ungar and A. Keller, Macromolecules, 22, 1995 (1989)27 S. J. Organ, G. Ungar and A. Keller, J. Polym. Sci., Polym. Phys., 28B, 2365 (1990)28 P. G. Higgs and G. Ungar, J. Chem. Phys., 100,1, 640 (1994)29 J. D. Hoffman, Polymer, 32, 2828 (1992)30 J. D. Hoffman and R. L. Miller, Polymer, 3 8 ,13, 3151 (1997)31 S. J. Organ and A. Keller, J. Polym. Sci., Polym. Phys. Ed., 25, 2409 (1987)32 D. C. Bassett, R. H. Olley, S. J. Sutton and A. S. Vaughan, Macromolecules, 29, 1852(1996)
250
References
33 D. C. Bassett, R. H. Olley, S. J. Sutton and A. S. Vaughan, Polymer, 37, 22, 4993 (1996)34 S. J. Sutton, A. S. Vaughan and D. C. Bassett, Polymer, 37, 25, 5735 (1996)35 S. P. Chum, G. W. Knight, J. M. Ruiz and P. J. Phillips, Macromolecules, 27, 656 (1994)36 R. Patil and D. H. Reneker, Polymer, 35, 9, 1909 (1994)37 R. G. Snyder, J. Chem. Phys., 47, 4, 1316 (1967)38 M. Maroncelli, S. P. Qi, H. L. Strauss and R. G. Snyder, J. Am. Chem. Soc., 104, 6237 (1982)39 R. G. Snyder and J. H. Schachtschneider, Spectrochim. Acta, 19, 85 (1963)40 R. G. Snyder and J. H. Schachtschneider, Spectrochim. Acta, 19, 117 (1963)41 G. Zerbi, Pure Appli. Chem., 26, 499 (1971)42 G. Zerbi, L. Piseri, F. Cabassi, Mol. Phys, 22, 2, 241 (1971)43 P. C. Painter, J. Havens, W. W. Hart and J. L. Koenig, J. Polym. Sci, Polym. Phys. E d, 15, 1223 (1977)44 P. C. Painter, J. Havens, W. W. Hart and J. L. Koenig, J. Polym. Sci, Polym. Phys. E d, 15, 1237 (1977)45 S. J. Spells, S. J. Organ, A. Keller and G. Zerbi, Polymer, 28, 697 (1987)46 G. Ungar and S. J. Organ, Polym. Commun, 28,232 (1987)47 S. Wolf, C. Schmid, P. C. Hagele, Polymer, 31, 1222 (1990)48 S. Wolf, P. C. Hagele and C. Schimd, Colloid Polym. Sci, 269, 364 (1991)49 M. Maroncelli, H. L. Strauss and R. G. Snyder, J. Chem. Phys, 82, 6 ,2811 (1985)50 X. Zeng and G. Ungar, to be published.51 J. L. McHale, Molecular spectroscopy, First Edition, Prentice-Hall, Inc, (1999)52 S. I. Mizushima and T. Shimanouchi, J. Am. Chem. Soc, 71,1320 (1949)53 R. F. Schaufele and T. Shimanouchi, J. Chem. Phys, 47, 9 (1967)54 G. V. Fraser, Indian J. Pure Appl. Phys, 16, 344 (1978)55 H. G. Olf, A. Peterlin, W. L. Peticolas, J. Polym. Sci, Polym. Phys. E d, 12, 359 (1974)56 F. Khoury, B. Fanconi, J.D. Barnes and L.H. Bolz, J. Chem. Phys, 59,11, 5849 (1973)57 G.R. Strobl and R. Eckel, J. Polym. Sci, Polym. Phys. E d, 14, 913 (1976)58 R. G. Snyder, H. L. Strauss, R. Alamo and L. Mandelkem, J. Chem. Phys, 100, 5422 (1994)59 J. W. Cooley and J. Tukey, Math. Comp, 19, 297 (1965)60 M. G. Broadhurst, J. Res. Nat. Bur.Stand, 66A, 241 (1962)61 S Krimm, C.Y. Liang and G.B.B.M. Sutherland, J. Chem. Phys, 25, 3, 549 (1956)62 R.B. Richards, J. Appl. Chem. (London), 1, 370 (1951)63 1.1. Novak and E.S. Slouev, Optika y Spektroskopya,_2,1, 62 (1957)64 R.A. Oetjen and H.M. Randall, Reviews of Modem Physics, 16, 3/4, 260 (1944)65 J.R. Nielsen and R.F. Holland, J. Mol. Spectroscopy, 4, 488 (1960)66 R.G. Snyder, J. Mol. Spectroscopy, 4,411 (1960)67 R.G. Snyder, J. Mol. Spectroscopy, 7, 116 (1961)68 R.F. Holland and J.R. Nielsen, J. Mol. Spectroscopy, 8, 383 (1962)69 M. Kobayashi, T. Kobayashi, Y. Itoh, Y. Chatani and H. Tadokoro, J. Chem. Phys, 72,2024(1980)
251

References
70 R.A. MacPhail, R.G. Snyder and H.L. Strauss, J. Chem. Phys., 77, 1118 (1982)71 R.A. MacPhail, H.L. Strauss, R.G. Snyder and C.A. Elliger, J. Phys. Chem., 88, 334 (1984)72 R.G. Snyder, J. Chem. Phys., 71, 8, 6391 (1979)73 B.G. Ranby, F.F. Morehead and N.M. Walter, J. Polym. Sci., 44, 349 (1960)74 S.C. Nyburg and J.A. Potworowski, Acta Cryst., B29, 347 (1973)75 R. Boistelle, B. Simon and G. Pepe, Acta Cryst., B32, 1240 (1976)76 S.R. Craig, G.P. Hastie, K.J. Roberts and J.N. Sherwood, J. Mater. Chem., 4, 977 (1994)77 S. Ishikawa, H. Kurosu and I. Ando, J. Mol. Structure, 248, 361 (1991)78 I. Bidd and M. C. Whiting, J. Chem. Soc., Chem. Commun, 543 (1985)79 E. Boda, Thesis of Master of Philosophy, The University of Sheffield, (1997)80 G. L. Liang, D. W. Noid, B. G. Sumpter and B. Wunderlich, J. Phys. Chem., 98, 11739,(1994)81 F. C. Frank, Faraday Discuss. Chem. Soc., 68, 7 (1979)82 P. J. Flory, Faraday Discuss. Chem. Soc., 68, 14 (1979)83 D. C. Bassett, “Principles of Polymer Morphology”, Cambridge University Press, (1981)84 D. I. Bower, W. F. Maddams, “The vibrational spectroscopy of polymers”, Cambridge University press (1992)85 J. C. Rodriguez-Cabello, J. Martin-Monge, J. M. Lagaron and J. M. Pastor, Macromol. Chem. Phys., 199, 2767 (1998)86 R. G. Snyder, H. L. Strauss, C. A. Elliger, J. Phys. Chem., 86, 5145 (1982)87 R. G. Snyder, S. L. Hsu, S. Krimm, Spectrochim. Acta, 34A, 395 (1978)88 D. C. Basset and B Turner, Nature (London), Phys. Sci., 240, 146 (1972)89 J. Tsau and D. F. R. Gilson, J. Phys. Chem., 72, 4082 (1968)90 J. K. Wilmshurst and H. J. Bernstein, Can. J. Chem., 35, 911 (1957)91 W. Piesczek, G.R. Strobl and K. Malzahn, Acta Cryst., B30, 1278 (1974)92 Y. Kim, H. L. Strauss, R. G. Snyder, J. Phys. Chem., 93, 485, (1989)93 G. Ungar, X.B. Zeng, G.M. Brooke and S. Mohammed, Macromolecules, 31, 6, 1875(1998)94 S. Krimm, Advances in Polymer Science (1960)
\\
252