crystallization and enthalpic relaxation studies on a
TRANSCRIPT

Crystallization and Enthalpic Relaxation Studies on
A Copolymer of Lactic Acid
By
Azizan Abdul Aziz
A thesis submitted to the University of Birmingham
For the degree of
DOCTOR OF PHILOSOPHY
School of Metallurgy and Materials College of Engineering and Physical Sciences University of Birmingham December 2016

University of Birmingham Research Archive
e-theses repository This unpublished thesis/dissertation is copyright of the author and/or third parties. The intellectual property rights of the author or third parties in respect of this work are as defined by The Copyright Designs and Patents Act 1988 or as modified by any successor legislation. Any use made of information contained in this thesis/dissertation must be in accordance with that legislation and must be properly acknowledged. Further distribution or reproduction in any format is prohibited without the permission of the copyright holder.

i
Synopsis
The effect of thermal behaviour and properties such as enthalpic relaxation, degree of
crystallinity, development of crystallization, crystallization kinetics and melting behaviour of
Co-poly (lactic acid) were studied using differential scanning calorimetry (DSC), FTIR
spectroscopy and hot stage microscopy. Co-poly (lactic acid) was chosen for this study since
unlike poly (L-lactic acid) it was very slow to crystallize, the comonomer inhibiting the
crystallization, and it was well suited to test the technique of FTIR-TA to measure the
development of crystallinity over extended periods up to and beyond 1000 min. and to produce
material with very different degrees of crystallinity.
Both glass formation and enthalpic relaxation have been measured on amorphous and
partially crystalline samples produced by controlled cooling from the melt and the effect of the
degree of crystallinity measured. The reduction in the enthalpic relaxation at equilibrium was
primarily due to the change in Δcp(Tg) and increase in Tg with crystallinity attributed to the
reinforcing effect of the hard crystalline phase on the soft mobile liquid phase. Kohlrausch-
William-Watts equation was used to analyze the kinetics of the enthalpic relaxation but there
was little change of the parameters with the degree of crystallinity.
In measuring isothermal crystallization, four procedures were adopted using a
thermostated oven and DSC to follow the development of crystallinity with time over a wide
temperature range from the glass transition to the melting point (m.pt). However, the results
were dependent on the experimental conditions but gave some indication that the samples
crystallized on cooling to room temperature and on re-heating to the m.pt. Last trace of
crystallinity m.pts which were characteristic of the crystallization temperature were obtained
by rapid reheating and correcting for thermal lag. These were analysed by the Hoffman-
Weeks’s relationship to determine the equilibrium melting temperature. Furthermore by

ii
modifying a model proposed by Flory and Vrij the m.pts were used to calculate the stem lengths
of the lamellae with time at each isothermal temperature. The stem length increased in
thickness with the square root of time from the initial onset of crystallization and the rate
increased with temperature obeying an Arrhenius relationship. This was considered to be
evidence for the mechanism of secondary crystallization being diffusion controlled and
occurring concurrently with primary.
Observation of the crystallization in thin films by hot-stage microscopy confirmed that
the mechanism was that of the growth of heterogeneously nucleated disc spherulites. Both
nucleation density and radial growth rates were measured but they exhibited different
temperature dependence. The growth rate exhibited the characteristic bell shaped dependence
which has been explained by the Hoffman and Lauritzen relationship in terms of nucleation
control at temperatures close to the m.pt. and diffusion control at temperatures near the glass
transition. The derived nucleation constant K was consistent with growth nucleation occurring
in Regime 11, and enabled the surface energy terms to be determined.
FTIR spectroscopy has been used to study and characterize the change in structure of
Co-PLA with temperature and time. Many of the IR absorptions bands change position and
intensities with heating and cooling process consistent with crystallizing and melting
reversibly. Isothermal crystallization kinetics analysis of Co-PLA conducted in the temperature
range from 120 to 136 °C from these changes in the absorption of the IR bands and in particular
the intensities of the crystalline and amorphous bands of the carbonyl ester group. In this way
it was possible to analyse the kinetics of both primary and secondary crystallization directly
from the relative crystallinity over extended periods with sufficient accuracy to test the validity
of the Avrami equation.
iii
Modifications have been made to the Avrami equation to account for the simultaneous
presence of secondary crystallization and the additional crystallinity produced by the secondary
processes is sufficient to account for the observation of fractional constant n values on
analysing the data assuming that primary and secondary crystallization could be separated by
their different time dependences.
The rate constants determined were consistent with the primary process occurring by
growth of heterogeneous disc spherulites growing linearly with time and obeying an Avrami
equation with n=2.0. The secondary process occurred by the thickening of the lamellae with
the square root of time, the rate of thickening being diffusion controlled.

iv
Acknowledgement
First and foremost, I am grateful to my supervisors, Dr Michel J. Jenkins and Professor James
N. Hay for their guidance, patience, tolerance and insight over the period of this research but
for their persistence this project would not have come to fruition.
I would also like to give a very special thanks to Mr. Frank Biddlestone for his technical
support. His broad experience, logical thinking and constructive comment have been of great
value to me in carrying out the experimental part of the research.
I would like to express my sincere gratitude to Dr Samsudin S. Amril for his helpful comments
and guidance during the latter years of my studies and I must not forget to thank my many
friends who have supported me and shared their knowledge; these precious friendships have
made my life in UK most enjoyable and will last a lifetime.
I gratefully acknowledge the assistance from Dato’ Dr Zainal Abidin Mohd Yusuf (President
and Group Chief Executive of SIRIM Berhad, Malaysia) and the Director General of MARA,
Malaysia for providing the opportunity for this postgraduate study.
Finally, I would like to express my special appreciation to my wife, Siti Azurah Ahmad, my
children, Norman Adam and Mikael Alif, and also my parents, brothers and sisters for their
love, moral support and continuous encouragement during my long absences during my studies
in the U.K.

v
CONTENTS
1.0 Chapter 1. Poly (lactic acid)………………………………………………………1
1.0 Introduction………………………………………………………………..1
1.1 Polymer Morphology……………………………………………………...3
1.2 Polymer Crystallization…………………………………………………...5
1.2.1 Nucleation………………………………………………………….6
1.2.2 Growth……………………………………………………………..8
1.3 Polymer Crystallization Kinetics – the Avrami Equation……………...12
1.4 The Melting of Polymers………………………………………………….14
1.5 Previous Study on Poly (Lactic acid)…………………………………….16
1.6 The Glass Transition……………………………………………………...19
1.7 Physical Ageing and Enthalpic Relaxation in Polymers………………..21
1.8 Present Study on Copoly (lactic acid) - Aims and Objectives………….24
2.0 Chapter 2. Materials, Apparatus, Experimental Techniques………………….26
and Methods
2.1 Materials…………………………………………………………………..26
2.1.1 Poly (Lactic Acid), Co-PLA ………………………………..........26
2.2 Reagents…………………………………………………………………..27
2.2.1 Potassium bromide……………………………………………….27
2.2.2 Chloroform……………………………………………………….27
2.3 Sample Preparation and Conditioning…………………………………27
2.3.1 Compression Moulding………………………………………….27
2.3.2 Oven………………………………………………………………28
vi
2.4 Experimental Techniques………………………………………………..28
2.4.1 Differential Scanning Calorimetry (DSC)………………………28
2.4.2 Experimental Procedure………………………………………....31
2.5 Fourier Transform Infra-Red Spectroscopy (FTIR)…………………..34
2.5.1 Calibration of Temperature for Hot stage……………………...35
2.5.2 Experimental Procedure………………………………………....35
2.6 Hot Stage Microscopy…………………………………………………....39
2.6.1 Optical Microscopy……………………………………………....39
2.6.2 The Hot Stage Microscope……………………………………....39
2.6.3 Method…………………………………………………………....41
3.0 Chapter 3. Glass transition and enthalpic relaxation of……………………….42
amorphous Co-poly (lactic acid)
3.0 Introduction………………………………………………………………42
3.1 Results and Discussion…………………………………………………...42
3.1.1 Initial Studies ……………………………………………………..42
3.1.2 The effect of cooling rate on the development of crystallinity...46
3.1.3 The effect of cooling rate on Tg………………………………….48
3.1.4 Effect of cooling rates on Tg of crystalline samples….………...53
3.2 Enthalpic Relaxation of Amorphous Co-PLA……………………….....55
3.2.1 Enthalpic Relaxation of Partially Crystalline Co-PLA………...65
3.3 Conclusions…………………………………………………………….....70

vii
4.0 Chapter 4. The crystallization and Melting of Co-Poly (lactic acid)………....72
4.0 Introduction………………………………………………………………72
4.1 Crystallization of Co-PLA in DSC by Procedure A……………………72
4.2 Crystallization of Co-PLA by Procedure B……………………………..80
4.3 Crystallization of Co-PLA in the DSC by Procedure C………………..84
4.4. Crystallization of Co-PLA by Procedure D……………………………..88
4.5 The Melting and the equilibrium melting point, Tmo of Co-PLA……...93
4.6 Conclusions………………………………………………………………..98
5.0 Chapter 5. FTIR-Thermal Analysis of Co-poly (lactic acid)…………………..100
5.0 Introduction………………………………………………………….…….100
5.1 The FTIR Spectrum of Co-poly (lactic acid)………………………….…101
5.2 Changes in the IR spectrum on heating and cooling……………………103
5.2.1 Changes in the region 2800-3050 cm-1 on heating and cooling…105
5.2.2 Changes in the carbonyl region 1740 to1780 cm-1 ……………...109
on heating and cooling
5.2.3 Changes in C-H stretching band at 1300-1500 cm-1 on………….114
heating and cooling
5.2.4 Changes in the C-O-C region 1350-1150 cm-1 on………………..117
heating and cooling
5.2.5 Changes in the C-H region 1150-1000 cm-1 on…………………..120
heating and cooling
5.3 Conclusions………………………………………………………………..124

viii
6.0 Chapter 6. Hot Stage Microscopy of Co-PLA………………………………...125
6.0 Introduction……………………………………………………………...125
6.1 Dynamic runs on Co-PLA………………………………………………125
6.2 Effect of crystallization temperature on spherulite…………………...128
growth and nucleation
6.2.1 At 95 °C…………………………………………………………..128
6.2.2 At 105 °C…………………………………………………………130
6.2.3 At 118 °C…………………………………………………………131
6.2.4 At 125 °C…………………………………………………………132
6.2.5 At 135 oC…………………………………………………………133
6.2.6 At 140 °C…………………………………………………………134
6.2.7 At 145 °C…………………………………………………………135
6.3 Discussions.………………………………………………………………136
6.4 Conclusions……………………………………………………………....141
7.0 Chapter 7. The Kinetics of Crystallization of Co-poly (lactic acid)…………142
measured by FTIR-TA spectroscopy
7.0 Introduction……………………………………………………………...142
7.1 Analysis of the crystallization data……………………………………..142
7.2 Analysis of the kinetics of the primary process………………………..146
7.3 Kinetic analysis of the secondary process……………………………...153
7.4 Fit of Crystallization data to equation 7.8……………………………..156
7.5 The temperature dependence of primary crystallization……………..162
7.6 Conclusions………………………………………………………………165

ix
8.0 Chapter 8. A Summary of the Experimental Results…………………………167
8.1 Outcomes and Discussions……………………………………………...167
9.0 Chapter 9. Conclusion and Future Work ……………………………………170
9.1 Conclusion……………………………………………………………….170
9.2 Future Work. …………………………………………………………...171
References……………………………………………………………………………….173
Appendix………………………………………………………………………………...187

x
List of Figures
Figure 1.1. Poly (lactic acid), PLA repeated unit…………………………………………….1
Figure 1.2. Three different chiral stereoisomers of PLA:
L-lactide, D-Lactide and meso-lactide………………………………………………………2
Figure 1.3. Amorphous……………………………………………………………………….4
Figure 1.4. Schematic structure of a polymer spherulite,………………………...………..…4
Figure 1.5. Dependence of crystallisation rate on temperature………………………………9
Figure 1.6. The Lauritzen-Hoffman Model…………………………………………….……10
Figure 1.7. Three Nucleation Regimes……..……………………………………………......12
Figure 1.8.a) Temperature dependence of Enthalpy on cooling
b) Temperature dependence of the specific heat ……………………………………….…...23
Figure 2.1. Moore Hydraulic Press………………………………………………………….28
Figure 2.2. DSC sample and reference cells………………………………………………...30
Figure 2.3. DSC scan of a partially crystalline polymer on heating and cooling………….. 30
Figure 2.4. Schematic to determine the Tg using Savill-Richardson method………………32
Figure 2.5. Determination of ΔHm, Tmax and Tm …………………………………………………………………...33
Figure 2.6. Nicolet FTIR Spectrophotometer ………………………………………………37
Figure 2.7. Experimental set-up used in Thermal Analysis-FTIR Spectroscopy…………..37
Figure 2.8. Specac Compression Mould…………………………………………………… 38
Figure 2.9. Linkam THM 600 hot-stage…………………………………………………….38
Figure 2.10. The Optical Microscope Apparatus…………………………………………....40
Figure 2.11. Close-up of hot stage………………………………………………………….40
Figure 3.1. Dynamic DSC response of Co-PLA on first, second and third heating………..43

xi
Figure 3.2. Dynamic DSC response of Co-PLA on first, second and third cooling…………44
Figure 3.3. Enthalpy change of as-received sample on heating and on cooling…………….45
Figure 3.4. The effect of cooling rates on the melting of Co-PLA………………………….47
Figure 3.5. The effect of cooling rate on the heat of fusion and fractional
crystallinity of Co-PLA……………………………………………………………………...48
Figure 3.6. Measurement of the glass transition on heating at 10 o C min-1
after cooling through the transition at the different cooling rates ……………………….…49
Figure 3.7. The dependence of Tg on cooling rate…………...……………………………..49
Figure 3.8. The dependence of the glass transition temperature on heat of fusion………....50
Figure 3.9. Arrhenius plot of log (cooling rate) against reciprocal temperature
for amorphous and crystalline Co-PLA samples……………………………………………51
Figure 3.10. Dependence of the step change in specific heat at Tg, Δcp(Tg)
with crystallinity……………………………………………………………………………52
Figure 3.11. The Effect of cooling rate on the measure Tg on the as-received
sample at 0.33 fractional crystallinity without melting…………………………………….53
Figure 3.12. The variation of Tg of the as-received PLA sample with
cooling rate…………………………………………………………………………………54
Figure 3.13. Arrhenius plot of dependence of Tg on the Rate of Cooling.
(Crystalline sample)………………………………………………………………………..55
Figure 3.14. Change in specific heat of the amorphous glass on
cooling at 10 o C min-1 at the glass transition……………………………………………….57
Figure 3.15. Development of the ageing endotherm at Tg with time at 53.5 oC…………...57
Figure 3.16. Development of the ageing endotherms at Tg with time at 48.5 oC…………..58
Figure 3.17. Development of the ageing endotherm at Tg with time at 43.5 oC…………...59
Figure 3.18. Development of the ageing endotherm at Tg with time at 38.5 oC…………...60

xii
Figure 3.19. The development of enthalpic relaxation with time as a function
of undercooling, ΔT, from Tg……………………………………………………………….61
Figure 3.20. The dependence of enthalpic relaxation rate on degree
of supercooling from Tg…………………………………………………………………….62
Figure 3.21. Arrhenius plot of dependence of the half-life of
enthalpic relaxation on reciprocal temperature……………………………………………...63
Figure 3.22. Williams-Watt fit of the extent of enthalpic relaxation
against reduced time…………………………………………………………………..……..64
Figure 3.23. Effect of cooling rate on melting endotherm………………………………….65
Figure 3.24. Ageing of 36% crystalline sample at ΔT =15 oC………………………………66
Figure 3.25. Ageing of 11% crystalline sample at ΔT = 15 oC……………………………...67
Figure 3.26. Development of enthalpy of ageing with time………………………………...68
Figure 3.27. Development of ageing with time……………………………………………..69
Figure 3.28. Williams-Watt fit of the extent of enthalpic relaxation
against reduced time………………………………………………………………………...70
Figure 4.1a. Endotherms produced by crystallizing at 70 °C ………………………………73
Figure 4.1b. Endotherms produced by crystallizing at 85 °C ………………………………74
Figure 4.1c. Endotherms produced by crystallizing at 95 °C……………………………….75
Figure 4.1d. Endotherms produced by crystallizing at 105 °C……………………………...73
Figure 4.1e. Endotherms produced by crystallizing at 118 °C……………………………...76
Figure 4.1f. Endotherms produced by crystallizing at 125 °C…………………………..….76
Figure 4.1g. Endotherms produced by crystallizing at 135 °C……………………………..77
Figure 4.1h. Endotherms produced by crystallizing at 145 °C……………………………..78
Figure 4.1. The development of melting endotherms with time at various
isothermal crystallization temperatures…………………………………………………….78

xiii
Figure 4.2. The development of fractional crystallinity, Xc
with time over the temperature range 70–135 oC…………………………………………..79
Figure 4.3a. Endotherms produced by crystallizing at 95 °C………………………………81
Figure 4.3b. Endotherms produced by crystallizing at 105 °C……………………………..81
Figure 4.3c. Endotherms produced by crystallizing at 118 °C……………………………..82
Figure 4.3d. Endotherms produced by crystallizing at 125 °C……………………………..82
Figure 4.3e. Endotherms produced by crystallizing at 135 °C……………………………..83
Figure 4.3. PLA Sample crystallized various temperature by procedure B………………..83
Figure 4.4. The development of crystallinity with time by procedure B.
The effect of melting at 50 oC min -1……………………………………………………….84
Figure 4.5a. Endotherms produced by crystallizing at 95 °C in DSC……………………...85
Figure 4.5b. Endotherms produced by crystallizing at 105 oC…………………………….85
Figure 4.5c. Endotherms produced by Crystallizing at 118 °C…………………………….86
Figure 4.5d. Endotherms produced by crystallizing at 125 °C…………………………….86
Figure 4.5e. Endotherms produced by crystallizing at135 °C……………………………..87
Figure 4.5. Crystallizing amorphous PLA samples in DSC at various temperatures………87
Figure 4.6. The development of crystallinity with time by procedure C…………………..88
Figure 4.7a. Endotherms produced by crystallizing at 95 °C in DSC……………………...89
Figure 4.7b. Endotherms produced by crystallizing at 105 °C in DSC…………………….89
Figure 4.7c. Endotherms produced by crystallizing at 118 °C in DSC…………………….90
Figure 4.7d. Endotherms produced by crystallizing at 125 °C in DSC…………………….90
Figure 4.7e. Endotherms produced by crystallizing at135 °C in DSC……………………..91
Figure 4.7. Crystallizing amorphous Co-PLA samples in DSC at
various temperatures by procedure D………………………………………………………91

xiv
Figure 4.8. The development of crystallinity with time heating directly
from the crystallization temperature following procedure D……………………………….92
Figure 4.9. Time taken to reach 0.30 fractional crystallinity using
Methods B, C and D………………………………………………………………………...93
Figure 4.10. Dependence of melting point on crystallization time and temperature………. 94
Figure 4.11. Hoffman-Weeks plot of m.pt against crystallization temperature…………… 96
Figure 4.12. Dependence of the lamellae stem length on square root of
the crystallization time………………………………………………………………………97
Figure 5.1. Thin film FTIR Spectrum of crystalline Co-PLA at room temperature………..102
Figure 5.2a. Dynamic Run – IR Spectra on heating from 35 to 200°C
at 5 °C min-1………………………………………………………………………………...104
Figure 5.2b. Dynamic Run – IR Spectra on cooling from 200 to 35°C
at 5 °C min-1………………………………………………………………………………...105
Figure 5.3a. Dynamic Run – IR Spectra on heating from 35 to 200°C
at 5 °C min-1………………………………………………………………………………...107
Figure 5.3b. Dynamic Run – IR Spectra on cooling from 200 to 35°C
at 5 °C min-1………………………………………………………………………………...107
Figure 5.4. Change in intensity of the 2944 cm-1 band with temperature
on heating and cooling……………………………………………………………………...108
Figure 5.5. Change in intensity of the 2995 cm-1 band with temperature
on heating and cooling……………………………………………………………………...108
Figure 5.6a. Change in the carbonyl absorption, 1740-1790 cm-1,
with temperature on heating …………………………………………………………….....110
Figure 5.6b. Change in the carbonyl absorption, 1740-1790 cm-1,
with temperature on cooling………………………………………………………………..110

xv
Figure 5.7. Change in intensity at 1759 cm-1 band with temperature
on heating and cooling……………………………………………………………………...111
Figure 5.8. Change on shape of carbonyl band on Crystallization at 120 oC ……………....112
Figure 5.9. The components of the amorphous carbonyl band…………………………….112
Figure 5.10. The components of the crystalline carbonyl band……………………………. 113
Figure 5.11a. Change in intensity of the band in the region
1500 to 1300 cm-1 on heating…………………………………………………………….…115
Figure 5.11b. Change in intensity of the band in the region
1500 to 1300 cm-1 on cooling………………………………………………………………115
Figure 5.12. Change in intensity of the band at 1384 cm-1 on heating and cooling………...116
Figure 5.13. Changes in intensity of band at 1360 cm-1 on heating and cooling…………...116
Figure 5.14a. Changes in the region C-O-C stretching band at
1350 to 1150 cm-1 on heating……………………………………………………………….117
Figure 5.14b. Changes in the region C-O-C stretching band at
1350 to 1150 cm-1 on cooling………………………………………………………….……117
Figure 5.15. Changes in the intensity of 1270 cm-1 band on heating and cooling………….118
Figure 5.16. Changes in the intensity of 1212 cm-1 band on heating and cooling………….119
Figure 5.17. Changes in the intensity of 1184 cm-1 band on heating and cooling……….…119
Figure 5.18a. Changes in the region 1150 to 1000 cm-1 on heating………………………...120
Figure 5.18b. Changes in the region 1150 to 1000 cm-1 on cooling………………………...120
Figure 5.19. Changes in C-H deformation band at 1132 cm-1 on
heating and cooling…………………………………………………………………………118
Figure 5.20. Changes in C-H deformation band at 1090 cm-1 on
heating and cooling…………………………………………………………………………121

xvi
Micrographs 6.1. Birefringence changes on heating and cooling
Co-PLA at 50 oC min-1 from 30 to 180 oC……………………………………………126 - 127
Micrographs 6.2. Growth of spherulites with time at 95 oC
(Magnification 32X)………………………………………………………………………...129
Micrographs 6.3. Growth of spherulites with time at 105 oC
(Magnification 32X)………………………………………………………………………...130
Micrographs 6.4. Growth of spherulites with time at 118 oC
(Magnification 32X)……………………………………………………………………..….131
Micrographs 6.5. Growth of spherulites with time at 125 oC
(Magnification 32X)………………………………………………………………………...132
Micrographs 6.6. Growth of spherulite with time at 135 oC
(Magnification 32X)………………………………………………………………………...133
Micrographs 6.7. Growth of spherulites with time at 140 oC
(Magnification 32X)………………………………………………………………………...134
Micrographs 6.8. Growth of the spherulites with time at 145 oC
(Magnification 32X)………………………………………………………………………...135
Figure 6.9. The decrease in nucleation density with temperature…………………………..137
Figure 6.10. The increase in spherulite diameter with time at each
crystallisation temperature……………………………………………………………….…138
Figure 6.11. Temperature dependence of radial growth rate……………………………….139
Figure 6.12. The dependence of the radial growth rate on the degree
of supercooling……………………………………………………………………………..140
Figure 7.1. Relative change in absorbance at 1749 cm-1 with time on crystallization……..143
Figure 7.2a. The increase in absorbance with time on crystallization……………………...145
Figure 7.2b. The increase in relative crystallinity, X, with time…………………………...146
xvii
Figure 7.3. Double log plot of log(-ln(1-(Xp/Xp,∞))) against log (t) at 120 oC.
The effect of changing Xp,∞………………………………………………………………...148
Figure 7.4. The effect of changing Xp,∞. On the degree of fit……………………………...149
Figure 7.5. Double log plot of log(-ln(1-(Xp/Xp,∞))) against log (t) at 124 oC.
The effect of changing Xp,∞………………………………………………………………...150
Figure 7.6. Double log plot of log(-ln(1-(Xp/Xp,∞))) against log (t) at 128 oC.
The effect of changing Xp,∞………………………………………………………………………………………………….151
Figure 7.7. A summary of the Avrami analysis over temperature range studied…………..152
Figure 7.8. The dependence of the extent of secondary crystallization
on the square root of the lapsed time……………………………………………………….155
Figure 7.9. Analysis of the primary crystallization by Avrami equation…………………..157
Figure 7.10. Calculated (dots) and experimental (lines) relative
crystallinity against time…………………………………………………………………....159
Figure 7.11. The Error in fitting equation 7.8 to experimental data
at various crystallization temperatures……………………………………………………...160
Figure 7.12. The contribution of primary crystallization to the overall
relative crystallinity……………………………………………………………………..…..161
Figure 7.13. The contribution of secondary crystallization to the
overall relative crystallinity…………………………………………………………………162
Figure 7.14. Dependence of primary crystallization half-lives
on crystallization temperature………………………………………………………………163
Figure 7.15. Nucleation control of primary crystallization after
Hoffman and Lauritzen……………………………………………………………………..165

xviii
List of Tables
Table 1.1. The Avrami Rate Parameters for different Crystallization Mechanisms……….. 13
Table 2.1. Physical Properties of PLA2002D ………………………………………………26
Table 3.1. Change in Ageing endotherm with time at ΔT = 5 °C…………………………..58
Table 3.2. Change in Ageing endotherm with time at ΔT = 10 °C………………………… 59
Table 3.3. Change in Ageing endotherm with time at ΔT = 15 °C………………………… 60
Table 3.4. Change in Ageing endotherm with time at ΔT = 20 °C………………………… 61
Table 3.5. Cooling Rate used to prepare Crystalline Samples……………………………...66
Table 3.6. Ageing crystalline samples at ΔT= 15 °C…………………………………..66 - 68
Table 4.3. Secondary Crystallization Rates…………………………………………………98
Table 5.1. Molecular Group Assignment…………………………………………………..103
Table 5.2. Change of Peaks on Crystallization…………………………………………….123
Table 6.1. Growth of Spherulites (95 °C)………………………………………………….129
Table 6.2. Growth of Spherulites (105 °C)………………………………………………...130
Table 6.3. Growth of Spherulite (118 °C)………………………………………………….131
Table 6.4. Growth of spherulite (125 °C)…………………………………………………..132
Table 6.5. Growth of Spherulite (135 °C)………………………………………………….133
Table 6.6. Growth of Spherulite (140 °C)…………………………………………………..134
Table 6.7. Growth of Spherulite (145 °C)………………………………………………….135
Table 6.8. Nucleation Characteristics……………………………………………………....136
Table 6.9. The temperature dependence of the radial growth rate…………………………139
Table 7.1. Avrami Rate Parameters for primary crystallization…………………………...153
Table 7.2. Rate parameters for secondary crystallization…………………………………..155
Table 7.3. The Avrami Crystallization Rate Parameters……………………………………158
xix
Abbreviations
Co-PLA Co-poly(lactic acid)
CCD Charge-coupled devices
DSC Differential scanning calorimetry
FTIR Fourier transform infrared spectroscopy
IR Infrared
KBr Potassium bromide
m.pt. Melting point
mW Milliwatts
PET Poly(ethylene terephthalate)
PEK Polyether ketone
PEEK Polyether ether ketone
PLA Poly (lactic acid)
PS Polystyrene
ROP Ring Opening Polymerization
TGA Thermogravimetric analysis

xx
Symbols
% Percentage
σ Surface free energy
σe Fold surface free energy of the critical size nucleus
π Circumference ratio
°C Degree Celsius
μm Micron 10-6 m
A Surface area / Absorbance / a pre-exponential factor
Ao Absorbance of the amorphous band at initial time
At Absorbance of the amorphous band at time t
A∞ Absorbance at end of crystallization
Ac Absorbance of a totally crystalline sample
a Unit cell dimension along the growing plane
b Lateral side of the unit cell / monomolecular layer thickness
c Unit cell dimension along the lamella thickness / velocity of
light / concentration of the substance
cp Specific heat
d constant thickness of disc
ΔE Activation energy of viscous flow
g Steady state growth rate of a crystal / radial growth rate / Temperature
independent constant
go a pre-exponential factor
Δgv Difference in free energy between the solid and liquid per cm-3
ΔGf Free energy of nucleus per mol

xxi
ΔG* Free energy of formation of a critical size nucleus per monomer mol.
ΔHf Heat of fusion of the sample per monomer mol.
ΔHof Heat of fusion of the totally crystalline sample per monomer mol.
Δhv Enthalpy of fusion per cm3
Δsv The entropy change on crystallization per cm3
Δhm Heat of fusion per g.
Δhmo Enthalpy of fusion of totally crystalline sample per g
Δh∞ Maximum enthalpy change per g.
Δgp Change of specific heat J per g.
ΔEA Activation energy of enthalpic relaxation, per monomer mol.
Δht Enthalpy change at Tg per g
Δh∞ Difference between enthalpy of the quenched glass and liquid per g.
ho Enthalpy of the quenched glass per g
h∞ Extrapolated enthalpy of the liquid
K Kelvin / equilibrium constant / Nucleation constant
ks Secondary crystallization rate constant
k Boltzmann constant
L Nucleation density
l Film thickness / lamellae thickness / nucleation rate
N Density of heterogeneous nuclei
n Avrami exponent / number repeat monomer units / an integer constant
Rh Rate of heating
Rc Rate of the imposed factor / the crystallization rate
R Gas constant (8.314JK-1 mol-1)
R2 Sum of the square of the residuals
xxii
TA The ageing temperature
Cp Heat capacity per mol
cp,g The specific heats of the glass per g
cp l The specific heats of the liquid per g
r Constant radius of rods / radius of spherulite
T Temperature oC
Tc Crystallization temperature
Tg Glass transition temperature
Tm Melting temperature
Tmo Equilibrium melting temperature
T∞ Temperature below which the motion of crystallisable segment
t Time
t1/2 Crystallization half-life
ΔT Degree of supercooling (ΔT = Tmo – Tc)
W Wavenumber
Xa Amorphous weight fraction,
Xa,t Amorphous weight fraction at time t
Xc Crystalline weight fraction
Xp Relative primary crystallinity
X Relative crystallinity
Xc,t Fractional crystallinity at time t
Xp,t, Fractional primary crystallinity at time t
Xp∞ Fractional primary crystallinity at the end of the process
Xp,f Residual crystallinity left after partial melting
Xs∞ Fractional secondary crystallinity at the end of process

xxiii
Xt Fractional crystallinity at time t
Po Probability of a point on a surface is uncovered by expanding circles
T2 Thermodynamic glass transition temperature
v Frequency / growth rate
vo Temperature independent constant
vt Total area of the expanding circles at time t
U* Activation energy for viscous flow (6300 J per mol)
αt The degree of conversion towards equilibrium at time t
τo Average relaxation time
dT/dt Heating rate, oC s-1
dH/dt Heat flow, watts
(t) Extent of enthalpic relaxation
β Inverse measure of the breadth of the relaxation spectrum
γ Under equilibrium conditions of no annealing or re-crystallization
ξ Lamellae fold length/ thickness of the lamellae
ξ e Equilibrium lamellae fold length
Z Avrami composite rate constant
Zp Avrami composite rate constant for primary process

1
Chapter 1. Poly (lactic acid).
1.0. Introduction
Poly (lactic acid), PLA, is one of the most important commercial bio-polymers. Since
it is biodegradable and readily produced from annually renewable resources it is considered to
be a possible replacement for oil based plastics, such as polyethylene and polypropylene,
especially in packaging.[1-6]. It is biocompatible and has good mechanical properties and has
been extensively used in many medical devices and applications especially drugs delivery,
scaffolds and tissue engineering [7, 8].
PLA is produced from natural resources and being biodegradable its application in food
packaging has become appropriate because it does not require or at least very minimum usage
of the landfill for disposal [9, 10]. It has the required clarity and rigidity as a film and
comparable to materials such as poly (ethylene terephthalate) (PET) and polystyrene (PS). It
has excellent shaping and moulding properties [11]. Recently, the large scale and economic
production of PLA has been developed by Nature Work LLC but it has been reported that PLA
is relatively brittle and due to that it has limitations in the range of its applications [12].
The monomer repeat unit and chain structure of PLA is shown in Figure 1.1
Figure 1.1. Poly-lactic acid (PLA) repeated unit
2
It has an asymmetric carbon atom and as such can exist in two geometric isomers, i.e. D and L
forms, which gives rise to stereoregular polymers which differ only in stereoregularity of the
monomer sequences along the chain.
PLA is a linear aliphatic polyester of lactic acid (2-hydroxy propionic acid) and can be
produced from the condensation polymerization of lactic acid or the ring opening
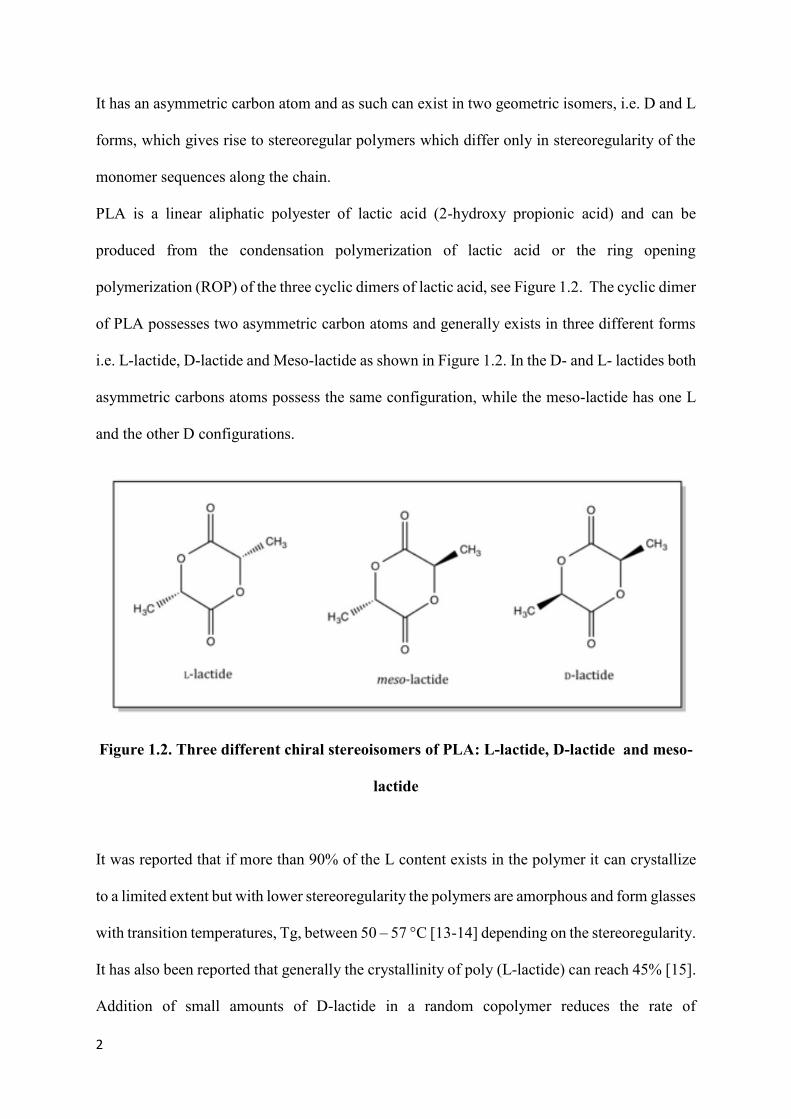
polymerization (ROP) of the three cyclic dimers of lactic acid, see Figure 1.2. The cyclic dimer
of PLA possesses two asymmetric carbon atoms and generally exists in three different forms
i.e. L-lactide, D-lactide and Meso-lactide as shown in Figure 1.2. In the D- and L- lactides both
asymmetric carbons atoms possess the same configuration, while the meso-lactide has one L
and the other D configurations.
Figure 1.2. Three different chiral stereoisomers of PLA: L-lactide, D-lactide and meso-
lactide
It was reported that if more than 90% of the L content exists in the polymer it can crystallize
to a limited extent but with lower stereoregularity the polymers are amorphous and form glasses
with transition temperatures, Tg, between 50 – 57 °C [13-14] depending on the stereoregularity.
It has also been reported that generally the crystallinity of poly (L-lactide) can reach 45% [15].
Addition of small amounts of D-lactide in a random copolymer reduces the rate of

3
crystallization and crystallinity. This reduction increases with increasing D-content of the
copolymers [16]. Studies on the influence of addition of the meso-lactide show that there is a
reduction in melting point of 3 °C for every 1% added [17]. These observations show that
significant changes can be made to the physical properties of PLA by the introduction of
imperfections in the stereoregularity. It was also reported that imperfections can be seen in the
form of twists in the configuration of the chain that hinder closed packing within the crystalline
regions and this depends on the amount of D or meso-lactide content in the copolymer [18]. It
is also been reported that in tailoring polymer properties such as crystallinity, thermal stability
and melting point as well as mechanical properties, the stereoregularity of PLA should be
controlled [19, 20].
In this study a copolymer of L- lactic acid with 4% D- lactide was studied to reduce the rate of
crystallization. It exhibited a Tg in the range 50–60 °C. Below this temperature, Co-PLA is
rigid and brittle. Developing high crystallinity in PLA tends to increase the elastic modulus and
reduce the elongation at break as well as the service temperature [21].
1.1. Polymer Morphology
Thermoplastic polymers can be divided into two groups of materials, amorphous and
partially crystalline. Polymers crystallized from the melt are not completely crystalline and the
crystallinity can vary from 10 to 80% [22]. They always contain some amorphous regions.
Polymers which cannot crystallise are completely amorphous and exist as mobile liquids above
the glass transition temperature and as immobile liquids which appear to be “solid-like” below
the glass transition.

4
In amorphous polymers the molecules are disordered with a liquid-like structure (Figure 1.3)
whereas in the crystalline regions of a partially crystalline polymer the chains pack together to
form ordered regions, frequently with a lamellar structure. These grow length-wise and by
branching splay out into a spherical array called spherulites [22]. (Figure 1.4).
Figure 1.3. Amorphous [23]
Figure 1.4. An idealised representation of the structure of a polymer spherulite
emphasising the structure of the branching lamellae and the direction of
the molecular chains perpendicular to the spherulite radius.

5
1. 2. Polymer Crystallization
The crystallization of polymers is a transition from a highly disordered array of the
chains, characteristic of the amorphous phase into three-dimensional ordering of the chains
within the lamellae in which the chains are aligned parallel to one another [24, 25]. The micro-
structure of the crystalline polymers is built up from arrays of lamellae, locally parallel with
the polymer chains perpendicular to the length of the lamellae. The lamellae are separated
from one another by amorphous regions which remote from the surface of the lamellae have
liquid structure of amorphous materials but close to the surface and emerging from the surface
retain some of the crystal structure or form irregular folds by returning to the lamella. The
lamellae by repeated branching develop into spheres, called spherulites which grow linearly
with time until they impinge with one another. Once a spherical contour is achieved the
molecular chains within the lamellae are perpendicular to the expanding radii of the spherulite.
The thickness of the lamellae and their linear growth rates are dependent on the crystallization
temperature. The size of the final spherulites depend on the number of nuclei which initiate the
growth of the spherulites and depends on the previous thermal history of the polymer and
processing conditions such as crystallisation temperature, rate of change of temperature with
respect to time, molecular weight of the polymer and any inclusions [25, 26]. Therefore only
partially crystallinity can develope due to the many entanglements preventing the entire
polymer chains arranging into the three-dimensional array required for crystallinity and a 100%
crystalline polymer is not possible on crystallizing from the melt [25].
PLA can be either amorphous or crystalline depending on its molecular order but also on the
processing conditions in the melt i.e an amorphous polymer is achieved by rapidly quenching
from the melt to below Tg if the crystallization rate is inhibited by reducing its stereoregularity.
However, by using a slow cooling rate from the melt or by retaining it at the appropriate
temperature the same polymer can be obtained crystalline [27–29].
6
1.2.1. Nucleation
Two distinct processes are involved in crystallization; these are nucleation and growth.
Three types of nucleation have been postulated to account for the behaviour of crystallization
and its temperature dependence; these are primary, secondary and tertiary nucleation.
In primary nucleation, an isolated crystalline region is produced from the melt and a small
ordered region i.e. a nucleus is produced by random alignment of chain segments or on the
surface of a foreign particle, i.e. an inorganic or dust particles; this is strictly speaking
secondary nucleation but since it involves production of a polymer crystal nucleus we will treat
it as a primary nucleation process. The first is homogeneous nucleation and occurs by the
chance alignment and clustering of chain segments until a stable entity is produced which can
grow rather than dissipate into the amorphous material. The second is heterogeneous
nucleation and is usually associated with crystalline impurities present in the polymer. Above
the melting temperature, the nuclei are unstable due to the free energy of the liquid being lower
than that of the crystalline state. Nucleation is controlled by the free energy of formation of the
nucleus, which involves the surface free energy term, σ, as well as the difference between the
bulk free energy of the liquid and the crystal Δgv, per unit volume.
For a rectangular nucleus of dimensions a, b and c, the free energy of formation of the nucleus
is
ΔGf = abcΔgv + (2ab + 2ac + 2bc) σ (1.1)
assuming the surfaces have the same free energy.
For growth of the nucleus, ΔGf has to be negative and for this to occur Δgv has to be negative.
since σ is always positive. This is the case below the equilibrium melting point and once a, b
and c have achieved critical.
For ΔGf = 0
Δgv = - {(2ab + 2ac + 2bc)/abc}σ (1.2)

7
The critical size of the nucleus a, b and c depends on the values of σ and Δgv.
Since from classical thermodynamics Δgv is defined by
Δgv = Δhv - T Δsv
where Δhv and ΔSv are the enthalpy and entropy change on crystallization per unit volume of
material at temperature T, respectively.
At the equilibrium thermodynamic melting point, Tmo, Δgv = 0. It follows that
Tmo = Δhv / Δsv (1.3)
And Δgv = Δhv (Tmo –Tc )/ Tm
o = Δhv (ΔT)/Tm
o (1.4)
where ΔT is the super-cooling from the equilibrium melting point.
It follows from the equation that Δgv gets larger as T increases and as a consequence ΔGf
smaller as well as a, b and c. It follows that the critical nucleus size decreases at lower
crystallization temperature. Also the critical nucleus size is infinite at the thermodynamic
melting point.
Hoffman and Lauritzen [30], extended this nucleation theory to polymer crystallization
recognizing that the fold surfaces, a and b had a much larger surface energy, σe than the lateral
surfaces structure, σ and equation 1.2 simplifies to
Δgv = - (2/ξ)σe (1.5)
where ξ replaces c as the thickness of the lamellae.
This is the fundamental equation of Hoffman and Lauritzen theory of nucleation of polymer
crystallization as it predicts the dependence of the thickness of lamellar crystals on
crystallization temperature, the dependence of crystal growth on the degree of supercooling
and the dependence of the melting point of polymers on crystallization temperature.

8
1.2.2. Growth
The second stage in crystallisation is growth of the crystal faces; this occurs by
secondary nuclei forming on the growth surface by clustering and alignment of the chain
segments until a stable nuclei is produced. Since the free energy of formation of the critical
nucleus size is less than the primary nucleus involving fewer surface energy terms growth will
normally occur after primary nucleation. Growth is observed to be a nucleation controlled
process with a dependence on super-cooling, decreasing as the crystallization temperature
increases towards the melting point. Spherulites are produced by growth branching of the
lamellae.
Spherulites are observed to grow linearly with time such that the radius, r,
r = v t (1.6)
where v is the growth rate and t is the time.
The growth rate has a bell shaped dependence on temperature in that the rate is zero close to
the melting point and the glass transition temperature, see Figure 1.5. This is a result of two
competing processes, nucleation at high temperature close to the melting point, when the rate
is nucleation controlled and diffusion controlled at low temperature when the motion of the
chain segments slow down as the glass transition is approached.

9
Figure 1.5. Dependence of crystallisation rate on temperature [31]
Turnbull and Fisher [32] have combined these two processes to derive the overall temperature
dependence of the growth rate from the melt. The equation has been written as in the form of
crystal growth rates as
v = vo exp (-ΔE/RT). exp (-ΔG/RT) (1.7)
where v is the growth rate of a crystal at the crystallization temperature, T, v0 is a temperature
independent constant, ΔE represents the activation energy for viscous flow, i.e. the energy
barrier for the transport of material to the crystal-liquid interface, ΔG is free energy of
formation of a critical size nucleus and R is the gas constant (8.314 JK-1 mol-1).
Hoffman and Lauritzen [33-40] modified the equation to
v= vo. exp (–U/R(Tc – T 2)) exp (- K/Tc.ΔT f) (1.8)
where U is the activation energy of viscous flow (assigned a value of 6300 Jmol-1 by Hoffman),
Tc the crystallization temperature, T2 the thermodynamic glass transition temperature, ΔT the
degree of supercooling (Tmo – Tc), R the gas constant and f is the correction for the temperature
dependence, such that f = 2Tc/ (Tc + Tmo). K is the nucleation constant the value which depends
on the type of nucleation adopted and includes molecular structure information, i.e.

10
K = jbσσeTmo/ kΔHv (1.9)
where b is the monomolecular layer thickness, σ and σe the side and fold surfaces free energies,
Tmo the equilibrium melting point, k Boltzmann constant and ΔHv the enthalpy of fusion per
unit volume.
Equation (1.9) has been used to analyse the dependence of the radial growth of spherulites on
the degree of supercooling, ΔT, provided it grew at the same rate as the radial expansion of
the spherulite, no imperfect growth of crystal face and no crystal thickening.
According to Lauritzen and Hoffman, there are three regimes which describe three different
secondary nucleation mechanisms called regime I, II and III; these are shown in Figure 1.6.
The j value of equation 1.9 depends on the nucleation regime as defined by Lauritzen and
Hoffman [30, 40, 41] where j = 4 for regimes 1 and lll, and 2 for regime ll. It is the relative
rates of the secondary nucleation on the surface and extension of the polymer chain growth
along the surface after nucleation was occurred.
Figure 1.6. The model of secondary nucleation on the growth face of crystal. [42]

11
Where:
A. Isolated secondary nucleation.
B. Nucleation followed by covering of crystal face by crystalline material. (Smooth growth
face.)
C. Further nucleation before face is completely cover. (Irregular growth face.)
D. Multiple nucleation before face is covered. (Rough growth face)
The regimes are separated by the degree of supercooling; in regime 1 it is small and surface
nucleation is low compared with the rate of covering the surface. The j value is 4 and secondary
nucleation rate dominates crystal growth. This implies that the growth surface is smooth.
In regime II the degree of supercooling is higher and the nucleation rate is comparable to rate
of the surface being covered. The value of j is 2 and the growth surface is quite rough and
irregular with prominences, see C in Figure 1.6. In regime III the degree of supercooling is
even larger and the nucleation rate is faster than the surface is covered. The j value is also 4.
Figure 1.6 illustrates the change in surface profile as the regimes change from I to III while
Figure 1.7 illustrates the change in the nucleation constant, K.

12
Figure 1.7. Three Regimes in the Nucleation [42].
1.3. Polymer Crystallization Kinetics – the Avrami Equation
The Johnson-Mehl-Avrami [43, 44] equation has been widely used to study polymer
crystallization kinetics. Its derivation is more readily understood by a procedure adopted by
Evans [45] using the pattern of expanding circles produced by raindrops on the surface of a
smooth pond as one model of spherulite crystallization in thin films. The problem which had
been solved by Poisson was to determine the probability, Po, that a particular point on the
surface was uncovered by any of the expanding circles. This was
Po = exp (-Vt) (1.10)
Where Vt is the total area of the expanding circles at time t.
Evans generalised this approach by considering all of the crystallization models adopted by
Avrami [43, 44] to evaluate the kinetics of crystallization of metals, and derived what has
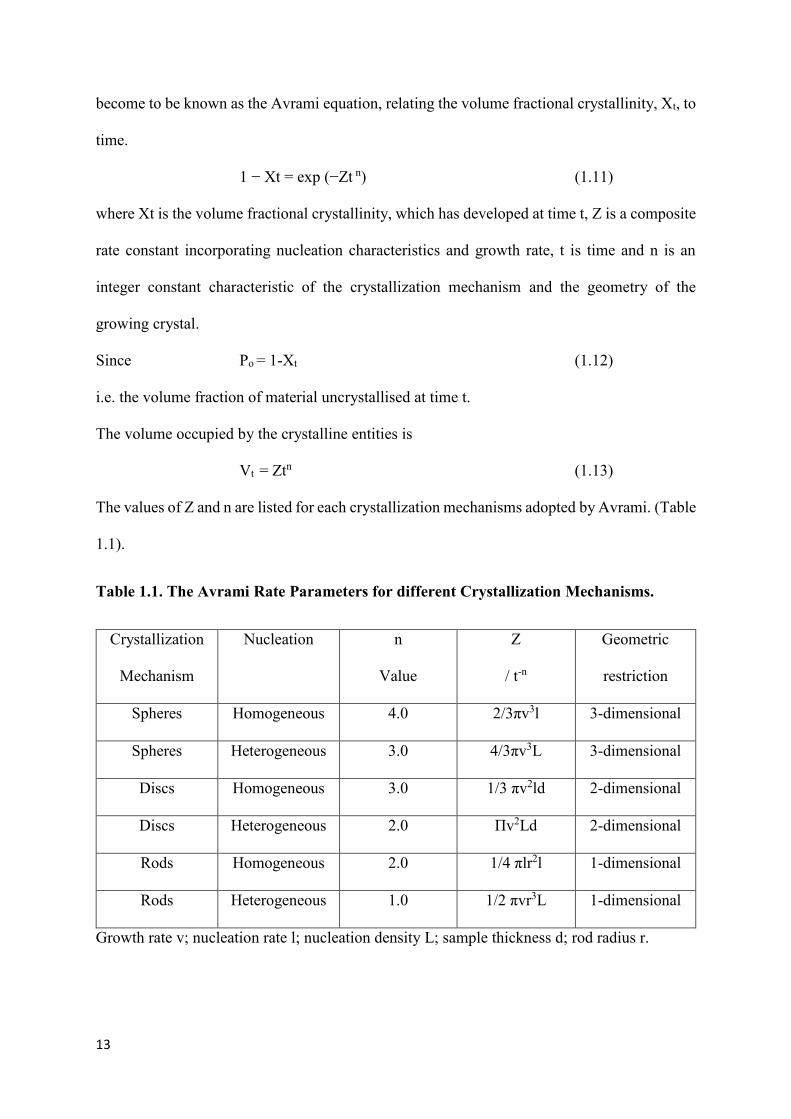
13
become to be known as the Avrami equation, relating the volume fractional crystallinity, Xt, to
time.
1 − Xt = exp (−Zt n) (1.11)
where Xt is the volume fractional crystallinity, which has developed at time t, Z is a composite
rate constant incorporating nucleation characteristics and growth rate, t is time and n is an
integer constant characteristic of the crystallization mechanism and the geometry of the
growing crystal.
Since Po = 1-Xt (1.12)
i.e. the volume fraction of material uncrystallised at time t.
The volume occupied by the crystalline entities is
Vt = Ztn (1.13)
The values of Z and n are listed for each crystallization mechanisms adopted by Avrami. (Table
1.1).
Table 1.1. The Avrami Rate Parameters for different Crystallization Mechanisms.
Crystallization
Mechanism
Nucleation n
Value
Z
/ t-n
Geometric
restriction
Spheres Homogeneous 4.0 2/3πv3l 3-dimensional
Spheres Heterogeneous 3.0 4/3πv3L 3-dimensional
Discs Homogeneous 3.0 1/3 πv2ld 2-dimensional
Discs Heterogeneous 2.0 Πv2Ld 2-dimensional
Rods Homogeneous 2.0 1/4 πlr2l 1-dimensional
Rods Heterogeneous 1.0 1/2 πvr3L 1-dimensional
Growth rate v; nucleation rate l; nucleation density L; sample thickness d; rod radius r.

14
The Avrami equation has been widely adopted to analyse the crystallization kinetics of
polymers [43, 44, 46-54] and the growth of spherulites in 3-dimensions has been observed by
microscopy. For this mechanism, n should be 4.0 for homogeneous nucleation or 3.0 for
heterogeneous nucleation but invariably fractional values between 3 and 4 are observed. The
mechanisms chosen by Avrami for crystallization do not allow for constant fractional n values
and many authors have doubted the validity of the application of the equation to polymer
crystallization kinetics. The Avrami equation has many limitations which have been cited as
the cause of fractional n values among which the variation in the crystalline density within the
spherulite boundary throughout the crystallization process has been suggested as the cause for
fractional n values. Others are that assumptions made in deriving it are not valid; the following
have been identified [33, 54, 55]:
1. Nucleation and growth rate are not constant with time
2. The equation only accounts for primarily and not secondary crystallization process
3. The volume of the system is not constant
4. The growth does not cease on impingement.
5. Only rods, discs and spheres are considered.
6. An induction time before crystallization starts is present.
Despites these limitations the Avrami equation is still universally used to analyse the
crystallization kinetics of polymers and the rate parameters are widely quoted.
1.4. The Melting of Polymers
Melt crystallized polymers generally melt over a range of 5 to 20 oC and tends to
increase with increasing crystallization temperature. The value is also dependent on thermal
history; in particular annealing at higher temperatures increases the melting point progressively
with time. The melting point is not characteristic of the polymer in the same way as it is for

15
low molecular weight material. In measuring the m.pt. of a polymer by DSC it is convenient to
define two different m.pts; one at which most of the crystalline regions are melting, i.e. Tmax
corresponding to the temperature of the maximum in the endotherm and one which defines the
last trace of crystallinity, Tm, correponding to the end temperature when the thermal response
returns to the baseline.
Polymer lamellae are very thin 10-20 nm thick and their m. p. is determined by the thickness
which varies with crystallization and annealing temperatures according to the nucleation theory
of Hoffman and Lauritzen [56]. Tmax corresponds with the melting of lamellae with average
thickness and Tm to the thickest lamellae present [56]. The range of melting corresponds with
the distribution of lamellae thicknesses present.
The melting temperature of lamellar crystals which are infinitely thick and not suppressed by
surface energy terms corresponds with the equilibrium melting temperature, Tmo [57].
However, it is not measured directly by experiment since lamellar crystal grows with a finite
thickness during the crystallization process determined by the size of the critical nucleus.
Tmo is determined by extrapolation experimentally determined m.pts of lamellae of finite
infinite thicknesses. Tmo, is determined using the Hoffman-Week’s relationship, derived from
their theory of nucleation, [56] in which the observed melting point Tm is related to
crystallization temperature, Tc by
Tm = Tmo (1 - 1/2γ) + Tc/2γ (1.14)
Where γ= (σe*ξ /σeξ*e), σe is the surface free energy of the top surface of the lamellae, ξ the
lamella thickness, and * indicates equilibrium values.
Under equilibrium conditions of no annealing or re-crystallization, γ = 1.0. Tmo is determined
from a plot of Tm against Tc which is linear with a slope of ½ if Tm has been determined under

16
equilibrium conditions of no re-crystallization on heating to melt. The extrapolated line of Tm
against Tc intersects the equilibrium line of Tm=Tc at Tmo.
1.5. Previous Study on Poly(Lactic acid)
PLA is considered to be an important industrial material with properties which have
been commercialised, such as biodegradability, biocompatibility and recyclability. It is
produced from renewable resources which will be required to replace oil based polymers in the
future. Accordingly there has been much effort in measuring its mechanical properties and
improving these by copolymerization, blending and by the addition of fillers to improve
thermal stability and crystallinity. There is a very extensive literature on PLA but a review by
Donald Garlotta [9] and a book on Poly (Lactic Acid), by R. Auras et al [11] are excellent
summary of what has been achieved, industrially and in academia.
There are a few factors that influence the thermal properties, crystallization and degree of
crystallinity of PLA material, i.e polymer molecular weight, polymerization conditions,
thermal history, stereoregularity and purity. It has been reported in the literature that the
melting enthalpy of PLLA is 93.6 Jg-1 adopted by Fisher et al. [11, 58] which is the most
commonly used.
The addition of compounds containing hydroxyl groups, (i.e., lactic acid, water, alcohols)
reduces the molecular weight of PLA by hydrolysis and the stereoregularity is easily controlled
by copolymerizing with the D- or L-lactide, and the D, L-lactide, or meso- or polymerization
conditions and amount of meso-, D-, lactide, to form random or block stereocopolymers [9,
59]. The stereo chemical architecture is also important as it helps to control the rate and extent
of crystallinity, mechanical properties and processing conditions. It has been reported, that
besides the molecular weight and the concentration of L- conformer the presence or absence of
nucleating agent alters the rate and extent of crystallization [9, 60]. It has been shown that

17
annealing the PLA copolymers with various L– and D- content, allows the crystallization to
occur between 75 °C and the melting point and often produces materials with double melting
peaks [9, 60]. Annealing at higher temperature e.g. 135 °C, close to melting temperature,
produces incomplete crystallization and produces lamellae with the highest melting points.
Annealing for longer periods enables further crystallization to occur and enables them to be
more perfect with higher melting points.
It has been reported that PLA is slow to crystallize with the fastest rates in the temperature
range of 110–130 °C [9, 17, 61-68]. Kalb and Pennings [9, 69] showed that spherulites grew
after 1 minute and the growth rate was 10.6 mm/min. at 125 °C. They also determined using
DSC that the crystallinity of PLLA did not exceed 60%. Studies on the crystallization kinetics
of copoly(L-co-meso-lactide) by Kolstad [9, 17] showed that the crystallization half-lives
increased approximately 40% for every 1 wt% increase in the meso-lactide content. They also
found that the addition of 6% talc increased the nucleation density and reduced the
crystallization half-live in line with it being a nucleating agent. Further kinetics studies by
Vasanthakumari and Pennings [9, 70] used the Hoffman–Weeks equation to determine the
equilibrium m.pt., Tmo. Urbanovici et al. [9, 71] performed isothermal rate measurements on
PLLA using DSC at six crystallization temperatures in the range of 90–130 °C and analysed
the data using the Avrami equation. Fractional n values are observed with n values between
3 and 4. With a wide range of grades and different levels of crystallinity of copolymers of LA
have different performance and a wider range of physical properties than PLA itself. Generally
with higher crystallinity better properties are observed with improved thermal stability and
increased elastic modulus [13].
Lim et al. [14] have focused on structural composition, thermal properties, crystallization
behaviour, rheological properties, and thermal degradation as well as the processing of PLA
and has shown that they are all greatly dependent on the L and D composition. They found that
18
if the L content was more than 90 % a crystalline structure would develop but if it dropped to
less than 90 % the copolymer was amorphous; increasing the D content to the decreased the
m.pt. and Tg of PLLA. They also reported that Tg was higher with L-lactide copolymer in
copolymer than the same amount of D-lactide. Similar findings have been reported by Tsuji
and Ikada [72].
It has been reported by Ahmed et al [13] that the thermal properties i.e. melting, glass transition
and crystallization as a function of molecular mass, isomer content and microstructure shows
that the Tg of PLLA material was higher than PDLLA samples. Similar observation was
reported by Ahmed in that partially crystalline sample exhibited higher Tg compare to
amorphous sample with similar molecular weights. They also found that there were no melting
or crystallization transitions with low molecular weight samples. However, high molecular
weight samples readily crystallised [13].
Study by He et al [73] at different crystallization temperature between 90 and 125 °C found
that multiple melting peaks were observed on crystallizing at the lower temperatures (105, 110
and 115 °C) while single peaks were observed at the higher temperature i.e. 120 and 125 °C.
This observation was supported by Yasuniwa et al [74] where double melting peaks were
observed at lower temperatures and low heating rates. This was attributed to melting and
recrystallization of small or less perfect lamellae on heating to melt [73].
Di Lorenzo [75] also found that at low crystallization temperatures small defect lamellae are
formed when PLA samples were crystallised. On melting these exhibited endothermic peaks,
due to recrystallization and reorganization with a second endothermic peak observed on
melting. He also found that recrystallization and reorganization were not observed at higher
crystallization temperatures where only a single melting was observed.
19
1.6. The Glass Transition
Amorphous materials have a random array of molecules which is characteristic of a
liquid while crystalline solids are characterised by long ranged three dimensional ordering of
the molecules. Crystalline materials which do not decompose or sublime melt to form liquids
above the melting point which should crystallize on cooling below the m.pt. However, not all
liquids crystallize on cooling; if their molecular structure is disordered or if the crystallization
rate is very slow. At a sufficiently low temperature these liquids harden and become glasses
which have the rigidity of a solid and the three dimensional random structure of a liquid.
The temperature at which the glass, Tg, forms depends on the rate of cooling of the liquid, the
external pressure, and any constraint on the liquid. It is accompanied by a change in mechanical
properties; an increase in elastic modulus, and yield stress and a decrease in fracture toughness
and brittleness. It is thus an important material parameter determining the ultimate use of a
commercial material. In polymers it represents a change from a hard material to a soft, rubbery
material on heating through the transition.
Unlike melting and crystallization, the glass transition is not accompanied by changes in
enthalpy, entropy or volume but is accompanied by a step change in the temperature
dependence of properties such as specific heat, and coefficient of thermal expansion. There is
no change in free energy or entropy so the transition is not accompanied by any change in
order. Thermodynamically it has been described as a second order transition involving chain
segment mobility decreasing to zero. However, the measured value of Tg depends on the
cooling rate [76] since on cooling the polymer through the transition at a constant pressure
from the equilibrium liquid is no longer able to remain in a state of equilibrium in the time
scale of cooling and a glass is produced [77, 78]. This retains the chain configuration of the
liquid at the temperature when segments stopped rearranging. The adopted chain configuration
defines the Tg as it is ‘frozen in’ at time-scale imposed by the rate of cooling [79, 80]. If a

20
higher cooling rate is used the configuration at a higher temperature is locked in and a higher
Tg is obtained; if a lower cooling rate, a lower Tg is obtained. If the material is stored close to
Tg but below Tg, the configuration will change towards the equilibrium one, if sufficient time
is allowed and a lower Tg will result with changes to volume and enthalpy [24, 81, 82]. Long
ranged segmental mobility is reduced to zero when the polymer is below its Tg compared to
that above the Tg when the mobility is relatively high.
The glass transition of PLA has been well studied; Wunderlich et al. [11, 83-85] measured the
glass transition of amorphous and semi-crystalline PLA by using adiabatic calorimetry,
differential scanning calorimetry, and temperature-modulated DSC (TMDSC). From these
experiments they found that the Tg shifted to higher temperature with increasing crystallinity
on annealing.
Studies on commercial PLLA by DSC at 10 °C min-1 showed that the initial crystalline polymer
exhibited a Tg at 73 °C but in a subsequent run it was 64 °C. This shows that on the first heating,
the Tg value was higher due to the high crystalline content (crystalline domains hinder the
mobility of amorphous chains). They suggested that the different value of Tg measured are due
to the kinetics effect that depends on the molecular weight of the polymer [9].
The effect of molecular weight and crystallinity on the mechanical properties of PLA, prepared
by polymerizing L- D- and L-lactide to produce amorphous or semi-crystalline polymers have
been studied by Perego et al, and they reported that there no significant effect of stereo-isomer
content on the value of Tg or molecular weights in the range tested [9, 86]. The value of Tg
measured by Jamshidi [9, 87] using different molecular weight shows that PLA with a
molecular weight of 22,000 g/mole has a Tg of 55 °C but the overall difference was only 4–5
°C lower than that predicted for PLA of infinite molecular weight.
21
1.7. Physical Ageing and Enthalpic Relaxation in Polymers
There are many types of ageing that polymers undergo under different conditions, e.g.
oxidative, degradative, on irradiation with ion beams etc. which result in the material properties
changing with time and invariably as a result of chemical or structural changes. Physical ageing
is unique in that the process is associated with changes below the glass transition and is totally
reversible on heating to above the Tg [88]. Physical ageing is a general phenomenon and a
basic feature of the glass state. It occurs as the glass is in a non-equilibrium state and ageing
is caused by the glass relaxing towards equilibrium as defined by the extrapolation of the liquid
properties to the ageing temperature [88]. It is called physical ageing as most physical
properties change and the change can be used to measure the extent of relaxation. If dilatometry
is used to follow the volume with time the process has been called volume relaxation and if the
change in enthalpy is measured it is called enthalpic relaxation. It is, however, generally
accepted that all three are measuring different aspects of the same phenomenon. Due to the
change in material properties on physical ageing and the importance of defining material
properties this phenomenon has been widely investigated, particularly in commercially
important polymers such as PEEK, polycarbonate, polystyrene, poly (ethylene terephthalate)
and PLA. In the case of PLA the calculated enthalpic relaxation rate at 40 °C i.e. βH = 1.77 J/g
per decade, and the apparent activation energy Δh* = 1107 kJ/mol. [11, 89].
Enthalpic relaxation is commonly studied using conventional DSC [90-92]. The glass has a
higher enthalpy at the ageing temperature than the extrapolated value for the liquid, see Figure
1.8 and ageing at a temperature close to but below Tg allows the chain segments to relax to the
equilibrium configuration [90]. During this process, the polymer chains still have some
mobility but on a time scale greater than that adopted in cooling to form the glass. On re-heating
an aged glass the excess enthalpy, (ΔH), is released as an exotherm on the step change in heat

22
capacity at the Tg, see Figure 1.8 and is a measure of the extent of relaxing of the glass towards
equilibrium.
The maximum enthalpy change, ΔH∞, is the difference between the enthalpy of the quenched
glass, Ho, and the extrapolated enthalpy of the liquid, H∞,
ΔH∞ = Ho - H∞
= {Ho (Tg) – cpg(Tg – Ta)} – {H∞(Tg) – cp.l(Tg –Ta)} (1.15)
Where Ho(Tg) and H∞(Tg) are the corresponding enthalpies at Tg and cp,g and cpl the specific
heats of the glass and liquid respectively. Since by the definition of Tg, (see Figure 1.8)
Ho(Tg) = H∞(Tg) (1.16)
Then ΔH∞ = cpl(ΔT) -cp.g(ΔT) = Δcp ΔT (1.17)
where ΔT = ((Tg – Tg), and Δcp = cpl - cpg

23
Figure 1.8. “Schematic illustration of (a) enthalpy vs temperature plot, and (b) specific heat
vs temperature curves. State A is reached by cooling at constant rate from equilibrium at To;
state B is reached after subsequently aging at Ta, for time t. The lower figure shows typical
DSC traces on heating from each of these states. The dashed line in the upper figure
represents the equilibrium enthalpy-temperature curve, and H, is the value of the enthalpy
in equilibrium at Ta.” [93], {Hutchinson J. M, 1995}.
The concept of enthalpic relaxation on ageing and its subsequent recovery as an endothermic
peak on a DSC trace is best represented schematically in Figure 1.8. In DSC, the initial
enthalpic state can be seen to deviate from the equilibrium line at Tg as the material is cooled
to A at a controlled rate. On storing at this temperature the enthalpy decreases towards the
equilibrium value but at time, t, it is reduced to Ht at B.
The loss in enthalpy between A and B is found from the enthalpy evolved on re-heating through
the glass transition, from the area under these curves between Ta and To. The DSC traces of B
which is the aged sample has more pronounced enthalpic peak on Tg [93].

24
1.8. Present Study on Copoly (lactic acid) - Aims and Objectives
While PLA as a biodegradable material has received much attention from industry and
academia as a substitute for film forming petroleum-based thermoplastics the many studies
made on the PLA are on a highly crystalline material and little has been done to investigate
amorphous and the effect of change in the degree of crystallinity on the material properties.
Conventional studies on physical ageing, on the effect of cooling rate on the glass transition
temperature as well as the effect of fractional crystallinity on glass transition temperature have
not been studied, presumably because it is difficult to produce amorphous samples with low
degrees of crystallinity. The quoted glass transition temperatures are in the region of 50-60 oC
PLA devices in vitro or at room temperature must age extensively and the material properties
become dependent on time as well as fractional crystallinity.
Co-PLA is a random copolymer of L-lactide with 4% of the D-monomer and at this degree of
copolymerization the rate of crystallization is reduced greatly. It should be possible by
controlling thermal history to produce amorphous samples as well as those with low fractional
crystallinity in order to see the effect on glass formation, physical ageing, crystallization and
melting. The copolymer is less well studied than PLA and has the potential to control the
morphology better than the homo-polymers. The kinetics of glass formation and enthalpic
relaxation will be measured by DSC on a series of samples which are amorphous and with
different degrees of crystallinity.
The effect of the degree of crystallinity and crystallization temperature on the observed m.p.
will be analysed using the Hoffman-Weekes equation model in order to determine the
equilibrium m.pt. and this in turn used to predict the temperature dependence of the rates of
crystallization.

25
DSC has been used widely to study the isothermal crystallization rate of PLA but the lack of
sensitivity of the technique may limit its application to measure the crystallization of the
copolymer, and in particular to separate primary from secondary crystallization. However,
thermal analysis Fourier transform infrared spectroscopy (TA-FTIR) has been shown to
separate the two processes in two polyesters [11, 94] and has the potential to do this in with the
copolymer. This technique will be compared with DSC to determine the most accurate method
of determine the extent of crystallization with time of the Co-PLA which has not been studied
previously.
Other techniques such as hot-stage optical microscopy will be used to investigate the variation
of radial growth of spherulites with temperature to compare the crystallization rate constants
and mechanism with those predicted by application of a modified Avrami equation.
In these ways it is hoped to have a better understanding of the parameters which determine the
glass transition temperature, the extent of enthalpic relaxation and the crystallization of PLA
copolymers and the effect of stereo-isomer content in inhibiting the crystallization.

26
Chapter 2. Materials, Apparatus, Experimental Techniques and Methods.
2.1. Materials
2.1.1. Poly Lactic Acid (Co-PLA)
The material used in this study was a co-poly (L-lactic acid) with 4% D-lactic acid. It
was supplied as PLA2002D in pellet form by NatureWorks LLC, Minnetonka, MN, USA. It is
a semi-crystalline L-lactic acid co-polymer with 4 % D-lactide to reduce its rate of
crystallization. It’s molecular weight (Mw) was194 kg mol-1.
The physical properties listed by NatureWorks for PLA2002D are shown in table 1 below:
Table 2.1. Physical Properties of PLA2002D
Physical Properties PLA 2002D
Glass transition temperature, Tg, 55 °C
Melting Point, Tm, 154 °C
Crystallization Temperature, Tc, - °C
Crystallinity, 37%
Molecular Weight, 194 kg mol-1
D-lactide Content, 4%

27
2.2. Reagents
2.2.1. Potassium bromide
Potassium bromide (KBr) powder, of FTIR grade, was supplied by Sigma Aldrich
(Dorset, UK), and pre-dried in an air-oven for at least 12 hours at 120 °C, before being pressed
into IR discs.
2.2.2. Chloroform
Chloroform, of research grade, was used as a solvent for Co-PLA. It was supplied as
99.5% pure by Sigma Aldrich (Dorset, UK) and used as received.
2.3. Sample Preparation and Conditioning 2.3.1. Compression Moulding
About 10.0 g of Co-PLA was hot pressed into sheets (100 x 100 x 1 mm) from pellets
using a Moore Hydraulic Press, see Figure 2.1. The pellets were heated to 200°C, held under
10 tonnes pressure for 3 minutes, and subsequently slow cooled to room temperature while the
pressure was maintained. The thin sheet was then cut into small pieces and used in DSC
experiments.

28
Figure 2.1. Moore Hydraulic Press
2.3.2. Oven
A Gallenkamp laboratory air oven, model (OV – 335), was used to condition polymer
samples. An external thermocouple, together with a temperature reader Digitron model 2751 –
K was used to monitor the oven temperature and maintained it as required at the conditioning
temperature.
2.4. Experimental Techniques
2.4.1. Differential Scanning Calorimetry (DSC)
A Perkin-Elmer, model DSC 7, differential scanning calorimeter, interfaced to a PC
and controlled by Perkin-Elmer Pyris Management Software, was used to characterise the
physical properties of Co-PLA. It was connected to a Grant Intracooler which controlled the

29
temperature of the DSC down to 3 oC and enabled the calorimeter to be cooled to room
temperature while maintaining cooling at 50 oC min-1.
DSC is s dynamic calorimeter and is widely used to characterise materials by measuring their
specific heat as a function of temperature and rate of heating or cooling. It does this by
comparing the instantaneous heat flow of sample and reference cells as shown in Figure 2.2.
The sample cell contains the sample of material sealed in an aluminium pan and lid, and the
reference an empty aluminium pan and lid. DSC is an important technique to study the thermal
response and the transitions of polymer by changes in heat capacity of the material. This
technique measures the difference in heat input required to keep the temperatures of the sample
and reference cells the same at a frequency of a fiftieth of a second [95]. Therefore any variation
in heat flow that occurs between the sample and reference cell is due to thermal transitions in
the sample. The heat flow between sample and reference cell is recorded in milliwatts (mW)
as a function of time and temperature.
If the sample takes in energy an endothermic transition is occurring and if the sample releases
heat an exothermic transition is occurring as shown in Figure 2.3. Much information can be
gained by using DSC to study the glass formation, crystallisation and melting of polymers, as
well as curing and other chemical processes which may occur. The glass transition is observed
as a step change in the heat flow-temperature plot while crystallization is observed as an
exothermic and melting as an endothermic process. The temperature range in which these occur
is characteristic of a polymer.

30
Figure 2.2. DSC sample and reference cell
Figure 2.3. DSC scan of a partially crystalline polymer on heating and cooling
Sample cell
Reference cell
31
2.4.2. Experimental Procedure
The temperature and thermal response of the calorimeter was calibrated from the
melting point and the enthalpy of fusion of ultra-pure indium and tin (99.999%). Calibration
of indium was set by heating from 140 to 170 °C at 5 oC min-1 and the melting point was taken
to be 156.60 °C and the enthalpy of fusion of indium 28.45 Jg-1. Tin was heated from 215 to
240 °C at 5 oC min-1 and the melting point taken to be 231.91 °C.
Between 5.0 and 7.0 mg of the ‘as received’ Co-PLA was cut from a pellet or moulded
sheet and accurately weighed into an aluminium pan and sealed with a lid. This was used as
the sample in all the DSC experiments. In order to remove its thermal history the sample was
heated from 30 to 200 °C at various heating rates from 10 to 50 °C min-1, held in the melt for
2 minutes at 200 °C before being cooled to 30 °C or the isothermal crystallization temperatures
at various cooling rates, from 0.1 to 50 oC min-1. This procedure was repeated in all the
experiments to investigate the thermal behaviour of the sample.
In determining the glass transition temperature, Tg of Co-PLA the Richardson and Savill’s
method was adopted [96]. This method was applied in all cases of polymers exhibiting an
endotherm superimposed on the step change in the heat flow response at Tg. Figure 2.4 is a
schematic of the method and involves linear extrapolation of the heat capacity, cp, from 4 to 3
and from 1 to 2 and equating the sum of the areas of A and C to B i.e. A + C = B.

32
40 50 60 70 80
21.5
22.0
22.5
23.0
23.5
24.0
24.5
He
at C
ap
acity (
Cp
)
Temperature, °C
A
C
B
1
2
3
4
Tg
Figure 2.4. Schematic diagram to determine the Tg by using Richardson method
Since melting of the copolymer occurred over a wide range of temperatures, two melting points
were measured by DSC, the peak of the endotherm, Tm (Peak), corresponding to the
temperature at which most of the polymer melted and Tm (Max) when the endotherm returned
to the baseline corresponding to the last trace of melting. Correction was made for thermal lag
by extrapolating the observed melting points to zero heating rate.
The heat of fusion, ΔHm, of the sample was determined from the area under the melting
endotherm and a linear baseline drawn from the first onset of melting to the return to the
thermal response of the melt, see Figure 2.5.
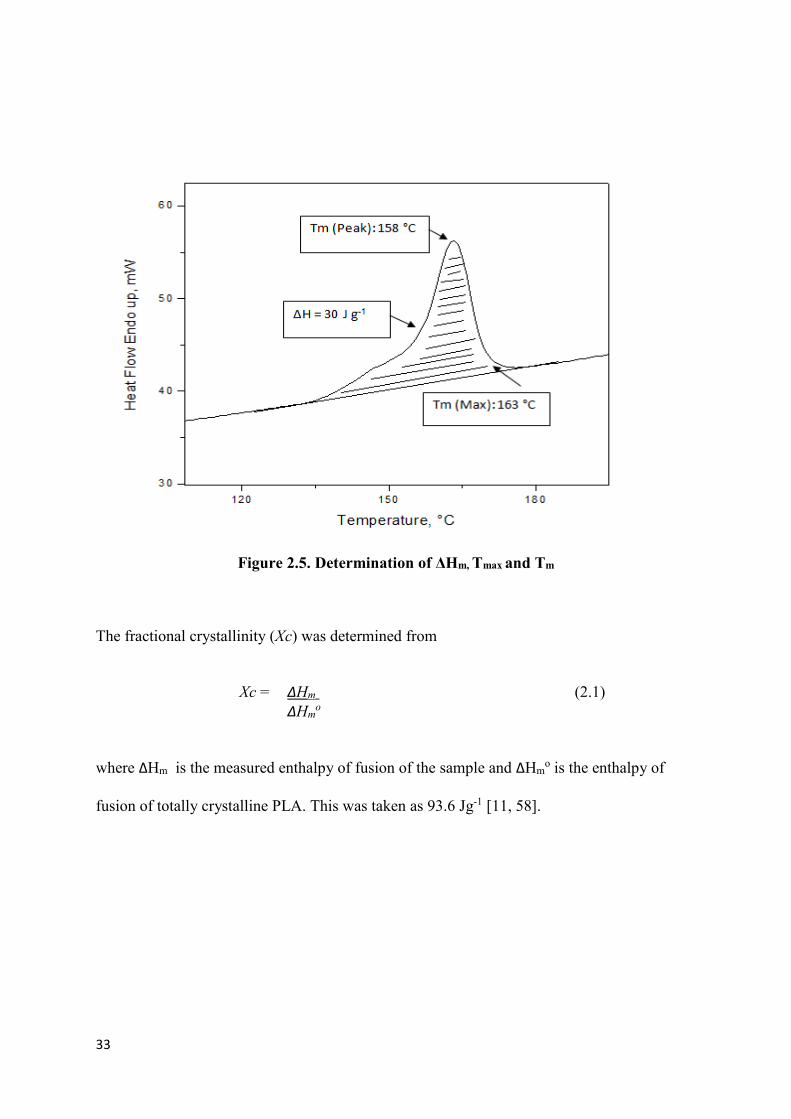
33
Figure 2.5. Determination of ΔHm, Tmax and Tm
The fractional crystallinity (Xc) was determined from
Xc = ∆Hm (2.1)
∆Hmo
where ∆Hm is the measured enthalpy of fusion of the sample and ∆Hmo is the enthalpy of
fusion of totally crystalline PLA. This was taken as 93.6 Jg-1 [11, 58].

34
2.5. Fourier Transform Infra-Red Spectroscopy (FTIR)
FTIR spectroscopy was the preferred method of analysis adopted since it has many
advantages over other dispersive techniques. Measurements were achieved quickly since all
frequencies and absorbances were measured instantaneously and sensitivity was good due to
increased accuracy of the detectors by higher optical throughput (reducing noise), and signal
averaging. The sensitivity and accuracy of the technique enables positive identification of a
wide variety of materials, as well as improving the use for quantitative analysis.
IR spectroscopy is a powerful technique for analysing organic based materials especially
polymers. It is a non-destructive characterisation technique and its basic concept is that when
IR radiation passes through the sample certain wavelengths are absorbed by exciting
vibrational and rotation modes in the molecules and the frequency of the absorbed wavelength
depends on the energy differences between the vibration and rotational energy levels. These
wavelengths are characteristic of the molecular bonds or groups and can be readily used to
assign them, analyse their concentration and determine the molecular groups that make up a
polymer.
The FTIR spectrometers used in this study relied on interferometers as beam-splitters to divide
an incoming infrared beam into two separate beams. One of these beams is reflected by a
stationary mirror, whilst the other is reflected off an oscillating mirror, causing the two beams
to travel different distances. These are recombined at the beam-splitter, and the resulting signal
is an interferogram since the two beams are in and out of phase. A frequency spectrum can be
produced from the interferogram, which is the sum of sinusoidal waves containing information
about wavenumber of a particular infrared peak and peak intensity at that wavenumber, and
has to be decoded. This occurs via the mathematical technique of Fourier transformation,
which calculates the spectra from summed sinusoidal waves in the interferogram.

35
By changing the experimental conditions, such as temperature or crystallinity, and by
monitoring changes in absorbance and peak position within the IR spectrum on heating and
cooling, it is possible to analyse conformational changes within the polymer. Polymer samples
in the form of thin films can be used to study conformational changes and the crystallisation
behaviour which provide information about the molecular arrangement within the polymer
whilst it is amorphous or crystalline [11, 94].
2.5.1. Calibration of Temperature for Hot stage
A Linkam THM 600 hot stage cell and PR600 temperature controller was calibrated by
attaching a thermocouple directly to the KBr disc to monitor the temperature which was
maintained at a fixed value by a PR600 controller. The calibration was performed by heating
from 35 to 200 °C and at each of 5 °C intervals; the KBr disc temperature was recorded. It was
then subsequently cooled from 200 to 35 °C and again at each of 5 °C intervals; the KBr disc
temperature was recorded. The temperature difference between reader and set from the PR600
controller was compared on heating and cooling.
2.5.2. Experimental Procedure
A Nicolet Spectrophotometers, model Magna IR 8700 equipped with a DTGS-KBr
detector [97] and controlled by Omnic 8.1 software, was used to collect spectra of Co-PLA
during transmission experiments, see Figure 2.6. For this technique, a Linkam THM 600
(Surrey, UK) hot-stage cell was placed within the spectrometer and the infra-red beam passed
through the sample, mounted vertically between KBr discs. A Linkam PR600 thermometric
stage was attached to the spectrometer to monitor temperature control.

36
A resolution of 1-4 cm-1 and total of a 100 scans were accumulated for each spectrum along
with a background spectrum. Figure 2.7 shows the experimental set up in thermal analysis
FTIR spectroscopy. Automatic smoothing and baseline corrections were made before
analysing the spectra. In this study, the spectra were measured in transmission.
Potassium bromide (KBr) powder was prepared by grinded to a fine powder. It was then pre-
dried in an oven for at least 12 hours to remove any moisture. Approximately 200 mg of KBr
powder was weighed and compressed into a KBr disc of 16 mm diameter using a Specac
compression mould, see Figure 2.8.
5.0 g of Co-PLA pellets were dissolved in the 100 cm3 of chloroform. A few drops of the
solution were deposited onto the KBr disc, allowed to evaporate in a fume cupboard until all
solvent had evaporated and a thin film sample produced. Sufficient number of drops were
added to produce a maximum absorbance in region of 0.5 – 1.0. A KBr disc was used as a
reference sample (blank).
For dynamic experiments, thin Co-PLA films attached between two KBr discs were heated
from 30 to 200 °C at 5 °C min-1 using the Linkam THM 600 hot-stage cell as shown in Figure
2.9. At 5 °C intervals the sample was scanned and recorded. The sample was subsequently
cooled from the melt to 40 °C and the FTIR spectrum recorded at 5 °C intervals in order to
investigate changes during heating and cooling.
In isothermal crystallization experiments, Co-PLA film samples were heated to melt (at 200
°C) at a heating rate of 50 °C min-1. This temperature was maintained for 2 minutes to ensure
the sample was completely melted and to erase the thermal history. It was then immediately
cooled to the isothermal crystallisation temperature. In this study five temperatures were used
to study the crystallisation i.e. 120, 124, 128, 132 and 136 °C. A series of spectra were collected
at a constant time interval over the whole crystallization once the sample had reached the

37
isothermal crystallization temperature. By this means IR transmission spectra were readily
measured every 2 minutes intervals for up to 1000 minutes over the temperature range studied.
Figure 2.6. FTIR Nicolet Spectrophotometer.
Figure 2.7. Experimental set-up used in Thermal Analysis FTIR Spectroscopy.
THM 600
hot-stage cell
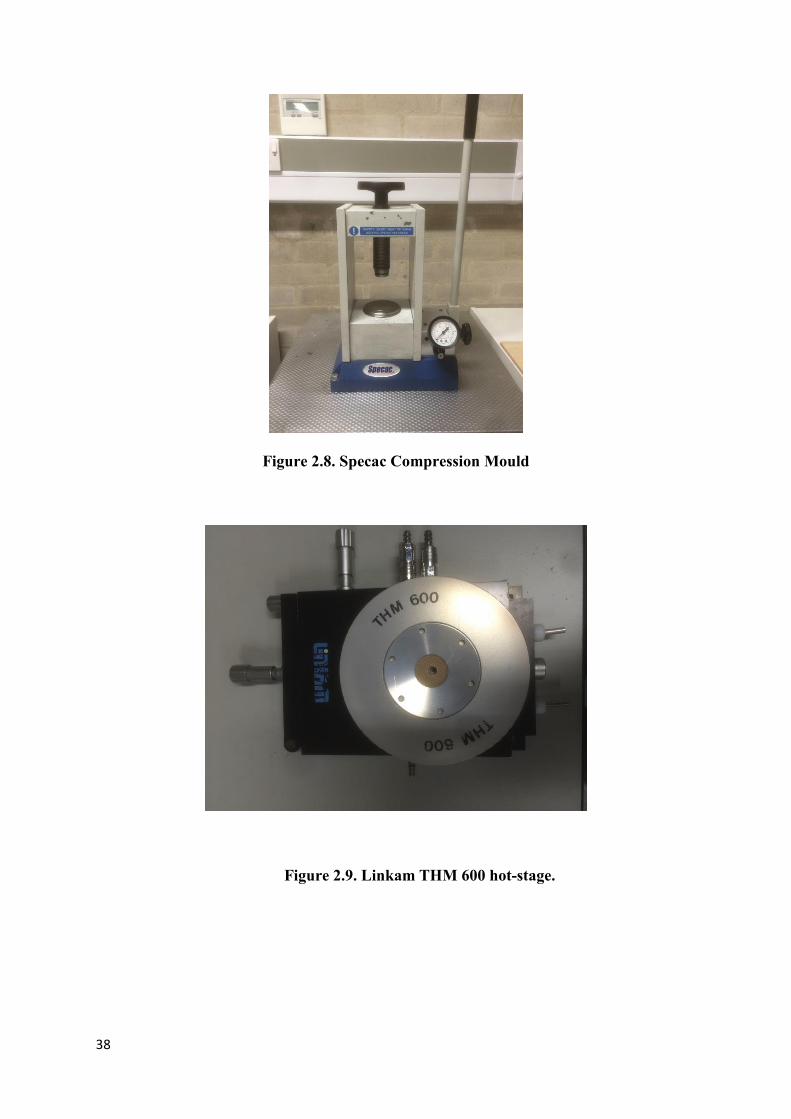
38
Figure 2.8. Specac Compression Mould
Figure 2.9. Linkam THM 600 hot-stage.

39
2.6. Hot Stage Microscopy
2.6.1. Optical Microscopy
Optical microscopy uses visible light to examine and magnify the image of small
samples up to a limit of 500 to 1000 times by lenses. It is an old technique but simple in use.
Modern developments have improved the resolution and contrast with the incorporation of
digital and video cameras, charge-coupled devices (CCD) which allows capture of digitals
images, along with software to measure the dimensions of the sample and store multiple
images. By using CCD cameras, the images can be examined directly on the computer screen.
2.6.2. The Hot Stage Microscope
A Leitz Dialux-Pol polarising light binocular microscope with long distance working
object lenses, x10, x32 and x50 magnification, and x10 eye-piece lens was used to examine a
film specimens mounted between glass cover slips. These were clamped to a hot stage, Linkam
THMS 600, securely mounted horizontally on the microscope platform, as shown in Figure
2.10. The hot stage was equipped with a thermal control unit, PR600 and the temperature
controlled by PC thermal control software [98, 99]. This apparatus, as shown in Figure 2.10
and the hot-stage as shown in close-up in Figure 2.11, was used to investigate the visual
changes in the sample on heating and cooling and during isothermal crystallization under
polarised light using a quarter plate analyser which made non-polarised material red in colour
rather than black and so enabled samples to be photographed.

40
Figure 2.10. The Optical Microscope Apparatus.
Figure 2.11. Close-up of the hot stage.

41
2.6.3. Method
Two types of experiments were conducted; dynamic and isothermal (by heating and
cooling) and isothermal crystallization measurements observing spherulite growth and
nucleation. In the dynamic runs the thin films (0.15-20 µm) were placed between glass cover
slips and mounted horizontally in the hot stage of a polarized microscope under a ¼ quartz
plate as shown in Figure 2.10. Micrographs were recorded as function of time and temperature
to study any changes in the sample on heating and cooling.
The effect of crystallization temperature on spherulite growth and nucleation study
were carried out on thin films prepared as described above in the dynamic studies but heated
to the melt at 180 oC, held for 2 minutes before being cooled at 50 oC min-1 to the crystallization
temperature for direct comparison with DSC measurements. The number of spherulites and
their diameters were measured as a function of time to measure the nucleation densities and
the radial growth rates as function of time and temperature.

42
Chapter 3. Glass transition and enthalpic relaxation of amorphous Co-poly (lactic acid).
3.0. Introduction
Differential Scanning Calorimetry (DSC) is commonly used to characterise polymers
in that it readily measures the glass transition, crystallization temperature, melting points and
crystallinity as well as enthalpic relaxation, crystallization kinetics, and thermal stability of the
morphologies produced at different temperature [9, 11, 100, 101]. It was accordingly used to
analyse the Co-PLA sample as-received and as-produced by various thermal treatments.
The focus of this chapter will be to study glass formation, and enthalpic relaxation at
various temperatures below the glass transition since both have an effect on the material
properties of polymers and determine the way material properties change on storage. These
will determine the ultimate uses of the copolymer.
3.1. Results and Discussion
3.1.1. Initial Studies
Weighed samples of the Co-PLA, about 7.0 mg, were cut from moulded pellets and
encased in aluminium pans. The samples were heated from 30 to 200 oC at a heating rate of 10
oC min-1, held for 2 minutes and subsequently cooled to 30 oC before being reheated to 200 oC
in a DSC. The DSC responses to heat, cool and reheat treatment are shown in Figure 3.1 as
changes in heat flow against temperature. On first heating, a step change in heat flow with a
slight endotherm was observed at about 60 oC characteristic of a glass transition with a small
enthalpic relaxation or ageing peak. This was followed with a linear increase in heat flow and
deviation from the linear increase in heat flow due to onset on melting occurred at 140 oC.
Melting was complete at 160 oC when the heat flow returned to a linear increase with

43
temperature corresponding to the increase in specific heat of the liquid or mobile amorphous
phase. On cooling at 10 oC min-1 the specific heat decreased with temperature with no deviation
until the step change due to the glass transition at about 60 oC, Figure 3.2. The step at the glass
transition was greater than on heating consistent with the initial sample being partially
crystalline and the cooled sample amorphous. No change corresponding to the sample
crystallizing was observed and on subsequent reheating the heat flow increased linearly with
no detectable crystallization or melting.
40 50 60 70 80 90 100 110 120 130 140 150 160 170 180 190 200
18
20
22
24
26
28
30
32
Rel
ativ
e H
eat F
low
End
o up
(m
W)
Temperature °C
1st Heating
2nd Heating
3rd Heating
Figure 3.1. Dynamic DSC response of co-PLA on first, second and third heating.
(°C)

44
60 70 80 90 100 110 120 130 140 150 160 170 180 190
18
19
20
21
22
23
24
Rel
ativ
e H
eat F
low
End
o up
(mW
)
Temperature °C
1st cool
2nd cool
3rd cool
Figure 3.2. Dynamic DSC response of Co-PLA on first, second and third cooling.
The change in enthalpy, HT – Ho, relative to a standard temperature, taken to be 30 oC was
measured by integrating the heat flow response with time, in s, after correcting for the baseline
with two aluminium pans, see Figure 3.3, since
HT –Ho = ʃ0
Tcp dT = ʃ0T(dH/dt)(dt/dT) (3.1)
where (dH/dt)(dt/dT) = Heat Flow/ Heating Rate in s.
(°C)

45
0 20 40 60 80 100 120 140 160 180 200 220 240
-10
0
10
20
30
40
50
60
70
80
90
100
110
120
En
tha
lpy,
J g
-1.°
C-1
Temperature, °C
Cooling
1st heating
2nd heating
Figure 3.3. Enthalpy change of the as-received sample on heating and on subsequent
cooling.
Melting is endothermic and the area under the melting curve above the linear response of the
heat flow is a measure of the heat of fusion of the sample, ΔHf, at the m.pt., see Figure 3.3,
i.e. ΔHf =ʃ 0∞(dH/dt).dt (3.2)
ΔHf is a measure of the fractional crystallinity, Xc, of the as–received sample, since
Xc = ΔHf /ΔHof (3.3)
where ΔHof is the heat of fusion of the totally crystalline sample. A value of 93.6 J g-1 was
adopted for this [11, 58].
The heat of fusion, ΔHf, was 26.3 J g-1 corresponding to 0.28 fractional crystallinity
while the onset and the melting peak were observed at 148 and 155°C, respectively. Similar
findings have been reported for PLA by Garlotta and De Santis [9, 102].
ΔHf
(°C)

46
It is apparent from the first run that the Co-PLA sample was partially crystalline as-received
but, however, as can be seen from Figure 3.2 it did not recrystallize on subsequent heat
treatment, either on heating or cooling. There were no exotherms present and no subsequent
melting endotherms on re-heating. This was also the case on subsequent heating and cooling;
only a glass transition was apparent. The increase in heat capacity at the glass transition
temperature, Δcp(Tg), on subsequent heating was consistent with the reheated sample being
amorphous. The amorphous glass transition temperature was determined to be 58.5 oC as
determined by Richardson’s method [96] and as outlined in the experimental section. This
method corrects for the small endothermic physical ageing peaks due to cooling and heating
the specimen through the glass transition.
To conclude no exotherms were observed on cooling at 10 oC min-1 on the first, second or third
cycles. Similar findings have been reported by Pantani and Tadakazu [103, 104] who reported
that no exothermic peaks were observed on cooling but a small endothermic peak was present
on heating for the second and third times.
Since the as-received samples were partially crystallined it is apparent that Co-PLA must
crystallise but this was dependent on the correct thermal treatment or storage conditions. It was
decided to explore the effect of different cooling rate on the degree of crystallinity which might
develop and the effect on the glass transition temperature.
3.1.2. The effect of cooling rate on the development of crystallinity
As-received samples were melted in the DSC by holding them at 200 oC for 2 minutes
before cooling at different rates from 0.1 to 50 oC min-1 and re-heating to 200 oC to determine
the melting endotherm. Figure 3.4 shows the effect of cooling rate on the extent of
crystallization of Co-PLA as measured by the melting endotherm on subsequent heating. It can
be seen that at cooling rates of 5 °C min-1 and above no endotherm was observed. Starting at

47
1°C min-1 and lower the endotherm progressively grew in size. Eventually at 0.1 oC min-1 the
area of the endotherm obtained was similar to that of the original sample.
120 130 140 150 160 170 180 190
16
20
24
28
32
Rel
ativ
e H
eat F
low
End
o U
p (m
W)
Temperature °C
0.1 °C/min
0.3 °C/min
0.5 °C/min
1 °C/min
5 °C/min
10 °C/min
20 °C/min
30 °C/min
50 °C/min
Figure 3.4. The effect of different cooling rates on the melting behaviour of Co-PLA.
This clearly shows that the higher cooling rates were too fast for crystallinity to develop within
the time scale achieved at the cooling rate. At the lowest cooling rate adopted sufficient time
had elapsed at each temperature for some crystallinity to develop, (see Figure 3.5). It also
indicated that at cooling rates, above 5 oC min-1 amorphous samples could be prepared and by
varying the rates below these value samples of different degree of crystallinity could be
produced. It was interesting to note that no deviation from linearity in the heat flow-
temperature response was observed by DSC on cooling at the slower cooling rates implying
that although crystallization had occurred, as detected on subsequent heating, the crystallization
rate was too low to be detected.
(°C)

48
0.0 0.2 0.4 0.6 0.8 1.0 1.2
0
5
10
15
20
25
30
Cooling rate, °C/minute
H
f, J g
-1
0.00
0.05
0.10
0.15
0.20
0.25
0.30
Xc
Figure 3.5. The effect of cooling rate on the heat of fusion and fractional
crystallinity of Co-PLA.
3.1.3. The effect of cooling rate on the measured glass transition temperature
The effect of various cooling rates on the measured glass transition temperature, Tg, can be
seen in Figure 3.6. The sample was cooled at different cooling rates from above the observed
melting point to 30 oC, below the transition, such that different glasses were formed defined by
the cooling rates and the value of the glass transition temperature, Tg, of each glass determined
by reheating at 10 oC min -1. The values of Tg were determined as before using Richardson’s
method [96].
Two well defined trends in the dependence of the Tg on cooling rate were observed; see Figure
3.7 in that for samples which were shown to be amorphous Tg decreased with slower cooling
rates but for slow-cooled samples, considered to be partially crystalline, the opposite trend was
observed and Tg increased with decreasing cooling rate. This later trend was attributed to the
increased crystallinity as can be seen in Figure 3.8 where the Tg increased with the heat of
fusion. The effect of the harder crystalline regions on the soft amorphous regions is to reduce

49
their segmental mobility and raise the Tg particularly in regions immediately adjacent to the
crystalline domains.
40 45 50 55 60 65 70 75 80
12
16
20
24
28
Rel
ativ
e H
eat F
low
End
o U
p (m
W)
Temperature °C
0.1 °C/min
0.3 °C/min
0.5 °C/min
1 °C/min
5 °C/min
10 °C/min
20 °C/min
30 °C/min
50 °C/min
Figure 3.6. Measurement of the glass transition on heating at 10 o C min-1
after cooling through the transition at the different cooling rates listed.
Figure 3.7. The dependence of observed Tg on cooling rate.
57
58
59
60
61
62
63
64
0 10 20 30 40 50 60
Tg,
°C
Cooling rate, °C/minute
(°C)
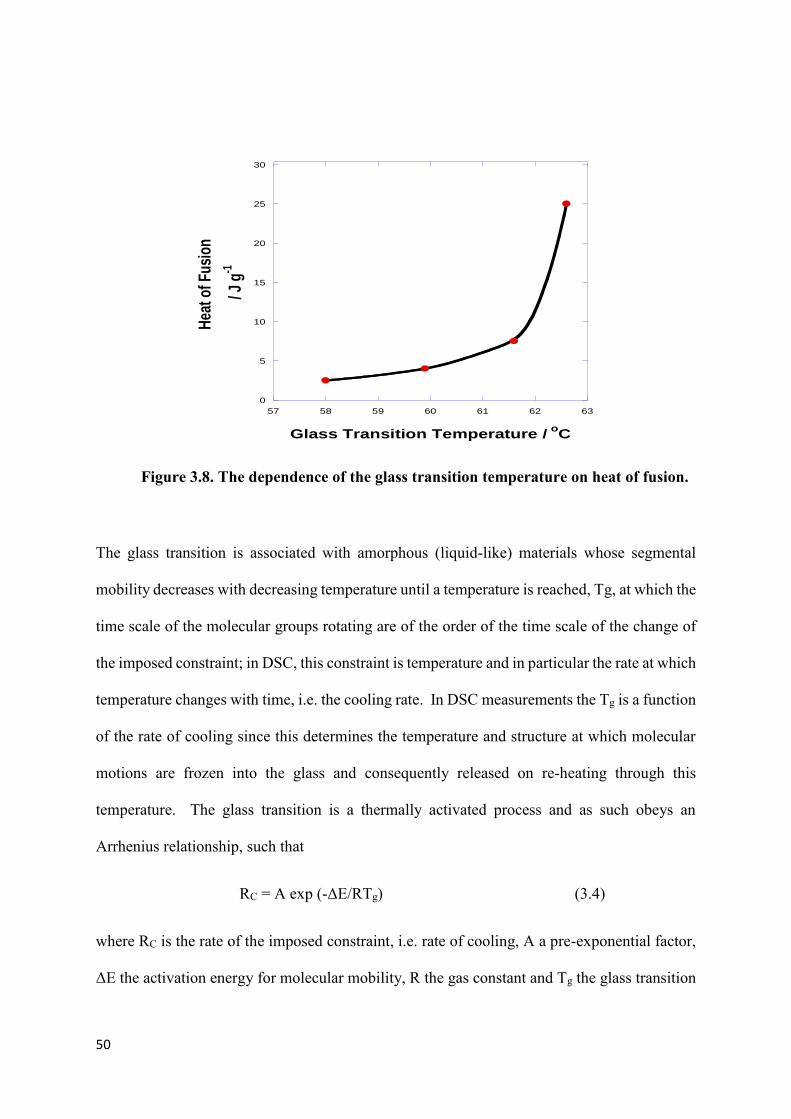
50
0
5
10
15
20
25
30
57 58 59 60 61 62 63
Hea
t of F
usio
n
/ J g
-1
Glass Transition Temperature / oC
Figure 3.8. The dependence of the glass transition temperature on heat of fusion.
The glass transition is associated with amorphous (liquid-like) materials whose segmental
mobility decreases with decreasing temperature until a temperature is reached, Tg, at which the
time scale of the molecular groups rotating are of the order of the time scale of the change of
the imposed constraint; in DSC, this constraint is temperature and in particular the rate at which
temperature changes with time, i.e. the cooling rate. In DSC measurements the Tg is a function
of the rate of cooling since this determines the temperature and structure at which molecular
motions are frozen into the glass and consequently released on re-heating through this
temperature. The glass transition is a thermally activated process and as such obeys an
Arrhenius relationship, such that
RC = A exp (-ΔE/RTg) (3.4)
where RC is the rate of the imposed constraint, i.e. rate of cooling, A a pre-exponential factor,
ΔE the activation energy for molecular mobility, R the gas constant and Tg the glass transition
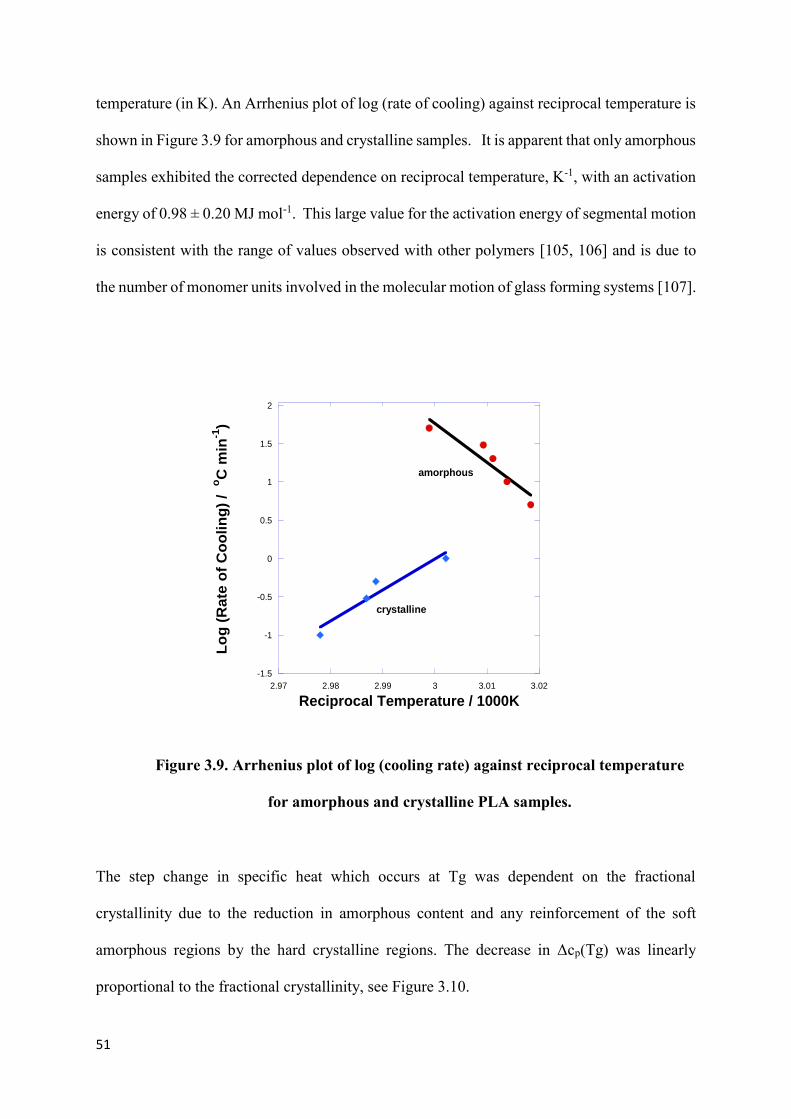
51
temperature (in K). An Arrhenius plot of log (rate of cooling) against reciprocal temperature is
shown in Figure 3.9 for amorphous and crystalline samples. It is apparent that only amorphous
samples exhibited the corrected dependence on reciprocal temperature, K-1, with an activation
energy of 0.98 ± 0.20 MJ mol-1. This large value for the activation energy of segmental motion
is consistent with the range of values observed with other polymers [105, 106] and is due to
the number of monomer units involved in the molecular motion of glass forming systems [107].
-1.5
-1
-0.5
0
0.5
1
1.5
2
2.97 2.98 2.99 3 3.01 3.02
Lo
g (
Rate
of
Co
oli
ng
) / o
C m
in-1
)
Reciprocal Temperature / 1000K
amorphous
crystalline
Figure 3.9. Arrhenius plot of log (cooling rate) against reciprocal temperature
for amorphous and crystalline PLA samples.
The step change in specific heat which occurs at Tg was dependent on the fractional
crystallinity due to the reduction in amorphous content and any reinforcement of the soft
amorphous regions by the hard crystalline regions. The decrease in Δcp(Tg) was linearly
proportional to the fractional crystallinity, see Figure 3.10.

52
This observation shows that cooling rate is the dominant factor in determining the value
of Tg of amorphous Co-PLA provided Richardson’s procedure is adopted to correct for any
ageing which may occur with different heating and cooling rates. However, with partially
crystalline samples the degree of crystallinity has a more pronounced effect and accounts for
the increased in the observed Tg with decreasing cooling rate which is the reverse of what is
observed with amorphous material. The dependence of the observed Tg of Co-PLA on cooling
rate is complex since it depends on the fractional crystallinity which develops.
0
0.1
0.2
0.3
0.4
0.5
0 0.1 0.2 0.3 0.4 0.5
Ch
an
ge
in
Sp
ecif
ic H
ea
t at
Tg
c
p(T
g)/
J g
-1oC
-1
Fractional Crystallinity, Xc
Figure 3.10. Dependence of the step change in specific heat at Tg, Δcp(Tg) with
crystallinity.

53
3.1.4. Effect of cooling rates on the Tg of crystalline sample
In order to determine the effect of crystallinity on the response of the glass transition
temperature to cooling rate on forming the glass the as-received Co-PLA was treated as
described above but without heating to the melt to maintain the amount crystallinity. The effect
of various cooling rates on the measured glass transition temperature, Tg, can be seen in Figure
3.11. The Tg on cooling through the glass transition was 7.5 oC higher than that previously
observed with the amorphous sample. The effect of cooling rate on Tg was measured as
previously but without heating to the melting temperature and the results are shown in Figure
3.12.
50 55 60 65 70 75 80
10
20
30
40
Rel
ativ
e H
eat F
low
End
o up
(m
W)
Temperature °C
0.1 C/min Heat
0.3 C/min Heat
0.5 C/min Heat
1 C/min Heat
5 C/min Heat
10 C/min Heat
20 C/min Heat
30 C/min Heat
50 C/min Heat
Figure 3.11. The effect of cooling rate on the measure Tg on the as-received sample at
0.33 fractional crystallinity without melting.
(°C)
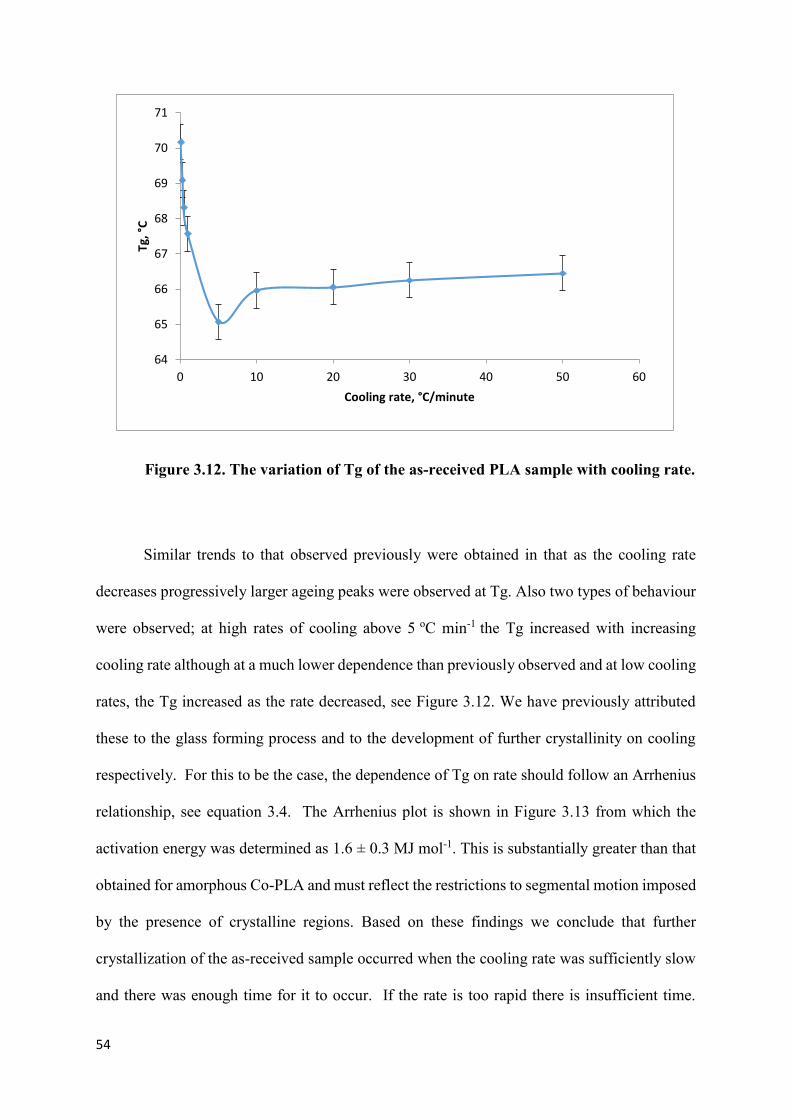
54
Figure 3.12. The variation of Tg of the as-received PLA sample with cooling rate.
Similar trends to that observed previously were obtained in that as the cooling rate
decreases progressively larger ageing peaks were observed at Tg. Also two types of behaviour
were observed; at high rates of cooling above 5 oC min-1 the Tg increased with increasing
cooling rate although at a much lower dependence than previously observed and at low cooling
rates, the Tg increased as the rate decreased, see Figure 3.12. We have previously attributed
these to the glass forming process and to the development of further crystallinity on cooling
respectively. For this to be the case, the dependence of Tg on rate should follow an Arrhenius
relationship, see equation 3.4. The Arrhenius plot is shown in Figure 3.13 from which the
activation energy was determined as 1.6 ± 0.3 MJ mol-1. This is substantially greater than that
obtained for amorphous Co-PLA and must reflect the restrictions to segmental motion imposed
by the presence of crystalline regions. Based on these findings we conclude that further
crystallization of the as-received sample occurred when the cooling rate was sufficiently slow
and there was enough time for it to occur. If the rate is too rapid there is insufficient time.
64
65
66
67
68
69
70
71
0 10 20 30 40 50 60
Tg, °
C
Cooling rate, °C/minute

55
Under fast cooling rate conditions Tg increased with increasing cooling rate and alternatively
under slow cooling rate the Tg increases with decreasing cooling rate.
0.6
0.8
1
1.2
1.4
1.6
1.8
2.942 2.944 2.946 2.948 2.95 2.952 2.954 2.956
Lo
g (
Rate
of
Co
olin
g /
o C
min
-1)
Reciprocal Temperature/ 1000/K
Figure 3.13. Arrhenius plot of dependence of Tg on the Rate of Cooling. (Crystalline
sample)
3.2. Enthalpic Relaxation of Amorphous Co-PLA
Enthalpic relaxation and its relation to physical ageing have been discussed in Section
1.7 and how it relates to the non-equilibrium nature of amorphous glass. It is associated with
the storage of glasses below but close to the glass transition and accounts for the observed
change in material properties such as fracture toughness, elastic modulus and density with time.
It is important in being able to predict the ultimate properties of commercial glasses.
Amorphous samples were prepared by cooling at 10 oC min-1 to room temperature
which was well below the glass transition temperature. This produced a standard Co-PLA glass
from which all others were compared. The glass transition was determined by immediately re-
heating at 10 oC min-1 from room temperature through the glass transition to 80 oC and the Tg
(58.5 oC) determined by the Richardson method [96]. At the same time the change in specific
1000K

56
heat at Tg, Δcp(Tg), for the amorphous sample was determined to be 0.48 ± 0.01 J oC-1 g-1, see
Figure 3.14. The sample was then cooled at 10 oC min-1 to the ageing temperature, TA, and
stored for various periods before the glass transition was re-determined on heating to 80 oC. In
this case the ageing temperature, TA, was an experimental variable and set to 5, 10, 15 and 20
°C below the measured glass transition. The development of the endothermic ageing peaks
with storage time at several ageing temperatures is shown in Figures 3.15-18 and by comparing
with the thermal response of the standard glass, the enthalpy change, ΔHt at Tg was determined
by direct subtraction of the standard glass.
The maximum enthalpy change has been shown in Section 1.7 to be
ΔH max = Δcp.ΔT (3.5)
where ΔT = (Tg-TA) the undercooling from Tg and the degree of conversion towards
equilibrium at time t, αt, is αt = ΔHt/Δcp.ΔT (3.6)
The progressive development of the physical ageing peak with time and at different degrees of
supercooling can be seen in Figures 3.15-3.18 from the increase in size of the endotherms; from
these the heat of physical ageing, the extent of conversion and the subsequent kinetics of
ageing, see Table 3.1 to 3.4 were determined.
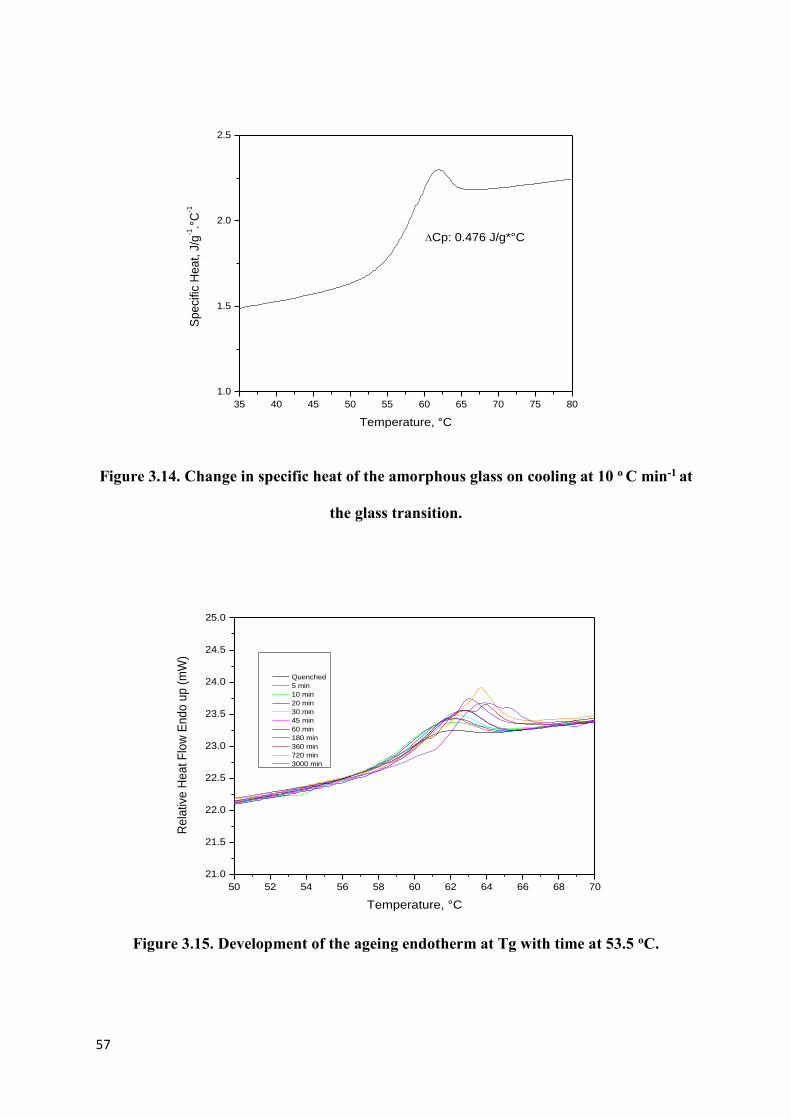
57
35 40 45 50 55 60 65 70 75 80
1.0
1.5
2.0
2.5
Spe
cific
He
at, J
/g-1.°
C-1
Temperature, °C
Cp: 0.476 J/g*°C
Figure 3.14. Change in specific heat of the amorphous glass on cooling at 10 o C min-1 at
the glass transition.
50 52 54 56 58 60 62 64 66 68 70
21.0
21.5
22.0
22.5
23.0
23.5
24.0
24.5
25.0
Re
lativ
e H
ea
t F
low
End
o u
p (
mW
)
Temperature, °C
Quenched
5 min
10 min
20 min
30 min
45 min
60 min
180 min
360 min
720 min
3000 min
Figure 3.15. Development of the ageing endotherm at Tg with time at 53.5 oC.
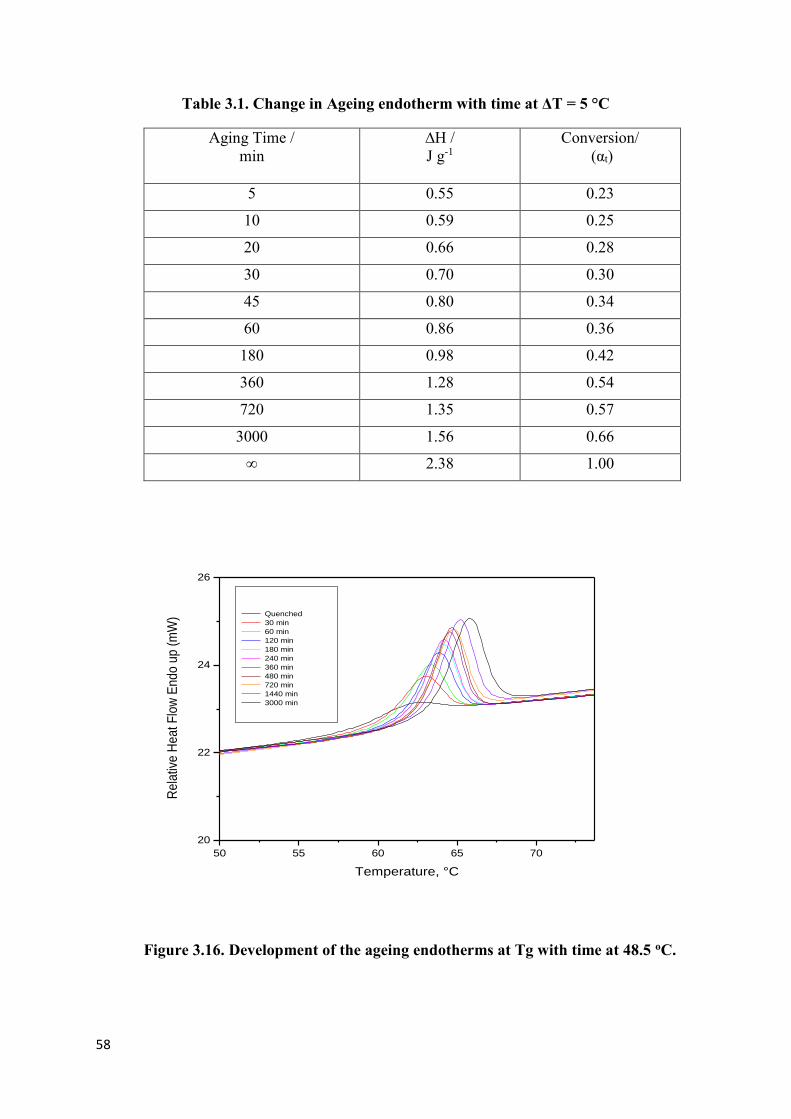
58
Table 3.1. Change in Ageing endotherm with time at ΔT = 5 °C
Aging Time /
min ∆H / J g-1
Conversion/ (αt)
5 0.55 0.23
10 0.59 0.25
20 0.66 0.28
30 0.70 0.30
45 0.80 0.34
60 0.86 0.36
180 0.98 0.42
360 1.28 0.54
720 1.35 0.57
3000 1.56 0.66
∞ 2.38 1.00
50 55 60 65 70
20
22
24
26
Re
lativ
e H
ea
t F
low
End
o u
p (
mW
)
Temperature, °C
Quenched
30 min
60 min
120 min
180 min
240 min
360 min
480 min
720 min
1440 min
3000 min
Figure 3.16. Development of the ageing endotherms at Tg with time at 48.5 oC.
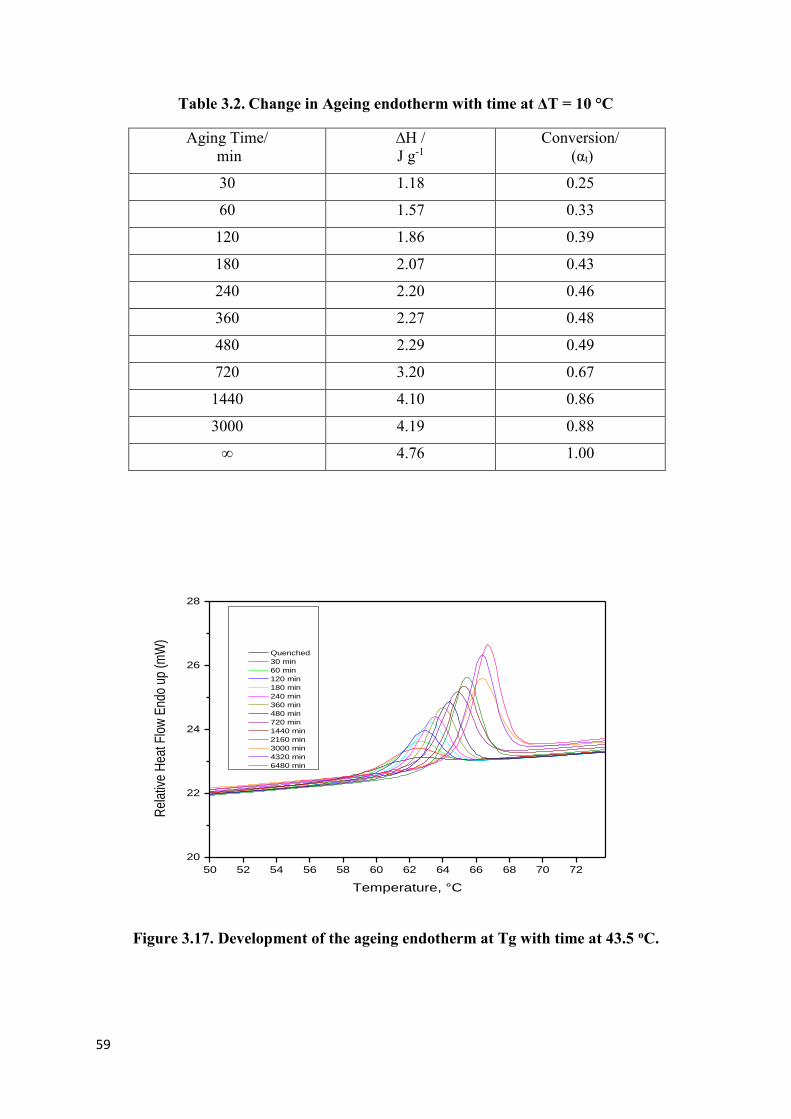
59
Table 3.2. Change in Ageing endotherm with time at ΔT = 10 °C
Aging Time/
min ∆H / J g-1
Conversion/ (αt)
30 1.18 0.25
60 1.57 0.33
120 1.86 0.39
180 2.07 0.43
240 2.20 0.46
360 2.27 0.48
480 2.29 0.49
720 3.20 0.67
1440 4.10 0.86
3000 4.19 0.88
∞ 4.76 1.00
50 52 54 56 58 60 62 64 66 68 70 72
20
22
24
26
28
Rel
ativ
e H
eat F
low
End
o up
(m
W)
Temperature, °C
Quenched
30 min
60 min
120 min
180 min
240 min
360 min
480 min
720 min
1440 min
2160 min
3000 min
4320 min
6480 min
Figure 3.17. Development of the ageing endotherm at Tg with time at 43.5 oC.

60
Table 3.3. Change in Ageing endotherm with time at ΔT = 15 °C
Aging Time / min
∆H / J g-1
Conversion (αt)
30 0.95 0.13
60 1.27 0.18
120 1.60 0.22
180 1.76 0.25
240 1.91 0.27
360 2.06 0.29
480 2.16 0.30
720 2.17 0.30
1440 2.77 0.39
2160 2.92 0.41
3000 3.30 0.46
4320 4.52 0.63
6480 5.48 0.77
∞ 7.14 1.00
50 55 60 65 70 75
21
22
23
24
25
Re
lativ
e H
ea
t F
low
End
o u
p (
mW
)
Temperature, °C
0 min
30 min
60 min
120 min
180 min
240 min
360 min
480 min
720 min
1440 min
2160 min
2880 min
Figure 3.18. Development of the ageing endotherm at Tg with time at 38.5 oC.

61
Table 3.4. Change in Ageing endotherm with time at ΔT = 20 °C
Aging Time/ min
∆H/ J g-1
Conversion/ (αt)
30 0.44 0.046
60 0.76 0.080
120 1.05 0.11
180 1.26 0.13
240 1.62 0.17
360 1.71 0.18
480 1.78 0.19
720 1.87 0.20
1440 2.39 0.25
2160 2.57 0.28
2880 2.62 0.262
∞ 9.52 1.00
The effect of changing the degree of supercooling on the development of the endothermic peak
is quite pronounced as can be seen in Figures 3.19.
Figure 3.19. The development of enthalpic relaxation with time as a function of
undercooling, ΔT, from Tg.
0
0.1
0.2
0.3
0.4
0.5
0.6
0.7
0.8
0.9
0 1000 2000 3000 4000 5000 6000 7000
Exte
nt
of
age
ing,
α
(t)
Ageing Time (minute)
∆T = 5 °C
∆T = 10 °C
∆T = 15 °C
∆T = 20 °C
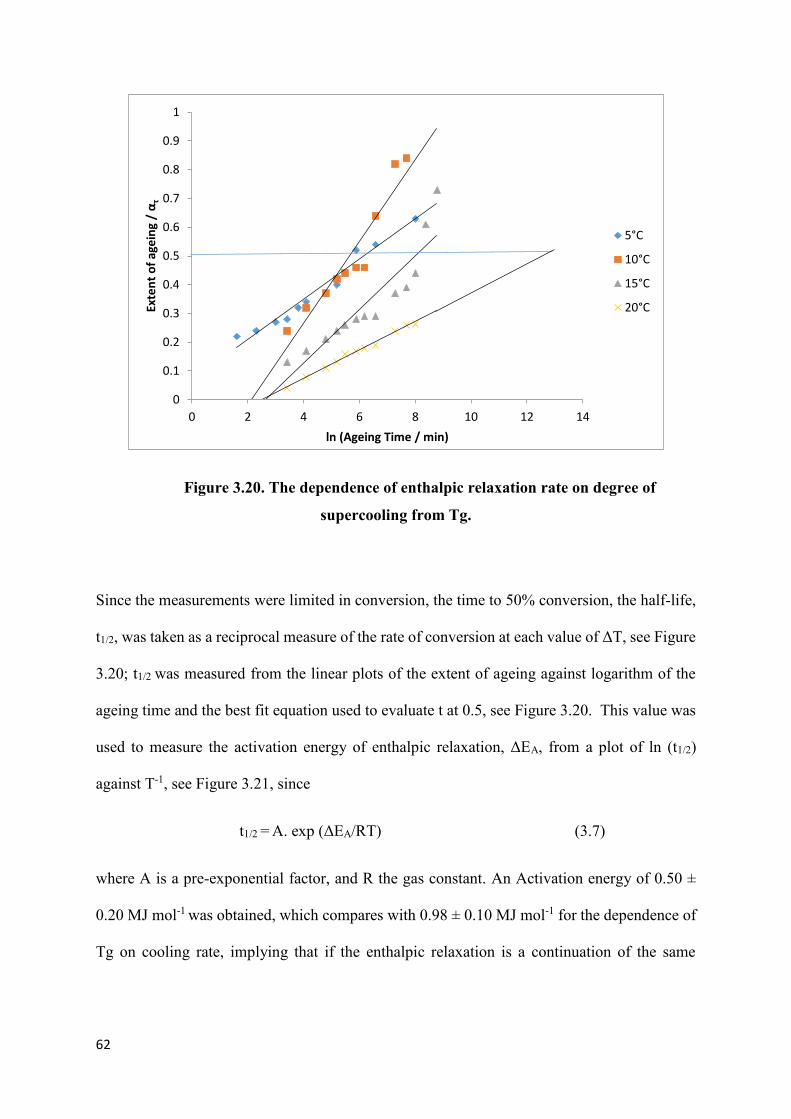
62
Figure 3.20. The dependence of enthalpic relaxation rate on degree of
supercooling from Tg.
Since the measurements were limited in conversion, the time to 50% conversion, the half-life,
t1/2, was taken as a reciprocal measure of the rate of conversion at each value of ΔT, see Figure
3.20; t1/2 was measured from the linear plots of the extent of ageing against logarithm of the
ageing time and the best fit equation used to evaluate t at 0.5, see Figure 3.20. This value was
used to measure the activation energy of enthalpic relaxation, ΔEA, from a plot of ln (t1/2)
against T-1, see Figure 3.21, since
t1/2 = A. exp (ΔEA/RT) (3.7)
where A is a pre-exponential factor, and R the gas constant. An Activation energy of 0.50 ±
0.20 MJ mol-1 was obtained, which compares with 0.98 ± 0.10 MJ mol-1 for the dependence of
Tg on cooling rate, implying that if the enthalpic relaxation is a continuation of the same
0
0.1
0.2
0.3
0.4
0.5
0.6
0.7
0.8
0.9
1
0 2 4 6 8 10 12 14
Exte
nt
of
age
ing
/ α
τ
ln (Ageing Time / min)
5°C
10°C
15°C
20°C
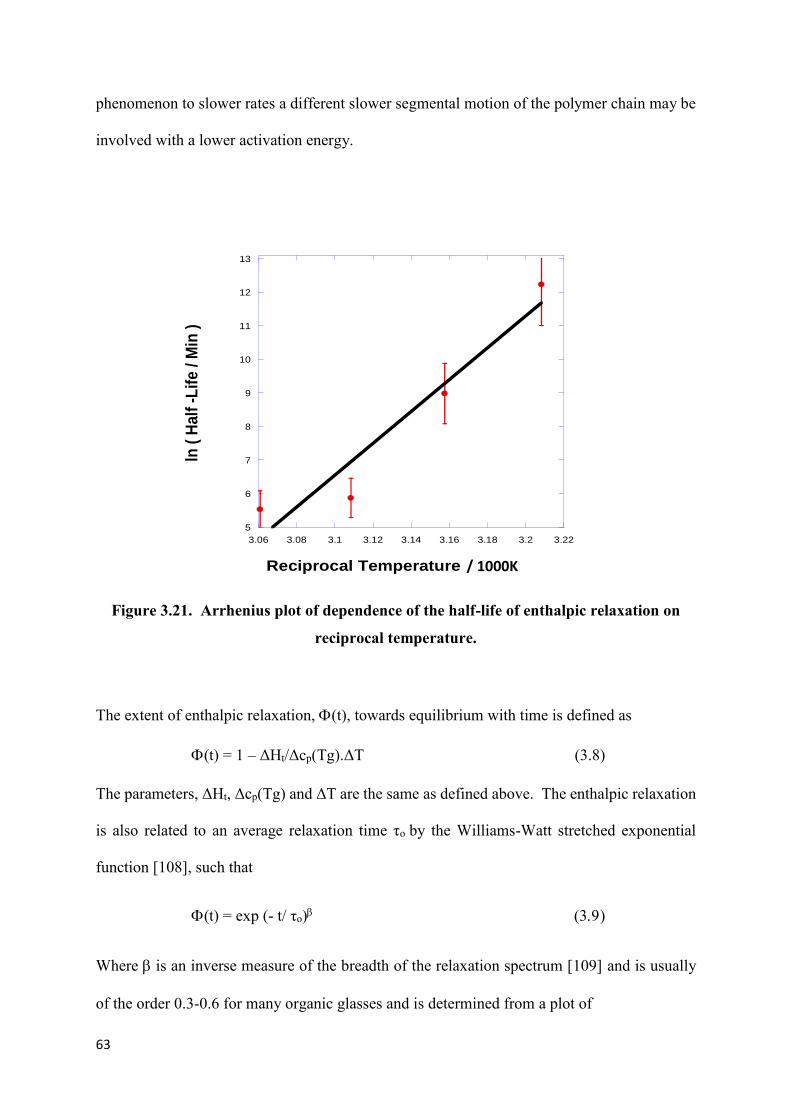
63
phenomenon to slower rates a different slower segmental motion of the polymer chain may be
involved with a lower activation energy.
5
6
7
8
9
10
11
12
13
3.06 3.08 3.1 3.12 3.14 3.16 3.18 3.2 3.22
ln (
Half
-L
ife
/ M
in )
Reciprocal Temperature x 1000/ K
Figure 3.21. Arrhenius plot of dependence of the half-life of enthalpic relaxation on
reciprocal temperature.
The extent of enthalpic relaxation, (t), towards equilibrium with time is defined as
(t) = 1 – ΔHt/Δcp(Tg).ΔT (3.8)
The parameters, ΔHt, Δcp(Tg) and ΔT are the same as defined above. The enthalpic relaxation
is also related to an average relaxation time τo by the Williams-Watt stretched exponential
function [108], such that
(t) = exp (- t/ τo)
Where is an inverse measure of the breadth of the relaxation spectrum [109] and is usually
of the order 0.3-0.6 for many organic glasses and is determined from a plot of
/ 1000K
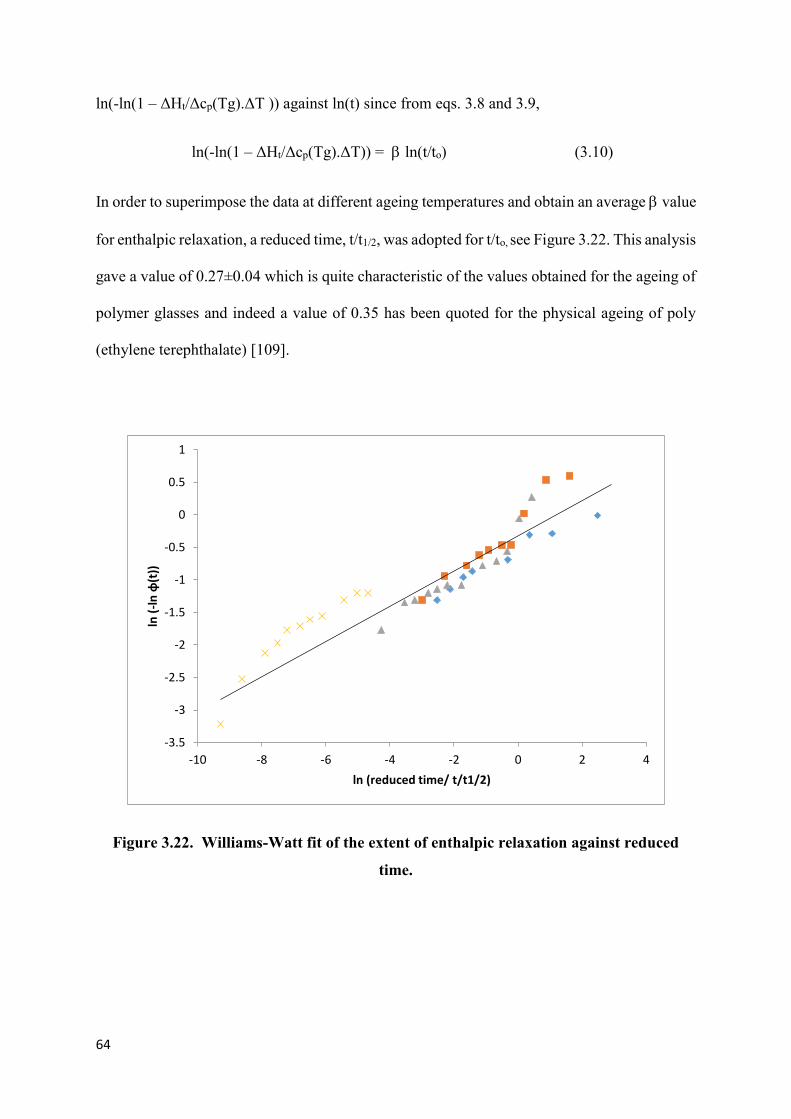
64
ln(-ln(1 – ΔHt/Δcp(Tg).ΔT )) against ln(t) since from eqs. 3.8 and 3.9,
ln(-ln(1 – ΔHt/Δcp(Tg).ΔT)) = ln(t/to) (3.10)
In order to superimpose the data at different ageing temperatures and obtain an average value
for enthalpic relaxation, a reduced time, t/t1/2, was adopted for t/to, see Figure 3.22. This analysis
gave a value of 0.27±0.04 which is quite characteristic of the values obtained for the ageing of
polymer glasses and indeed a value of 0.35 has been quoted for the physical ageing of poly
(ethylene terephthalate) [109].
Figure 3.22. Williams-Watt fit of the extent of enthalpic relaxation against reduced
time.
-3.5
-3
-2.5
-2
-1.5
-1
-0.5
0
0.5
1
-10 -8 -6 -4 -2 0 2 4
ln (
-ln
φ(t
))
ln (reduced time/ t/t1/2)
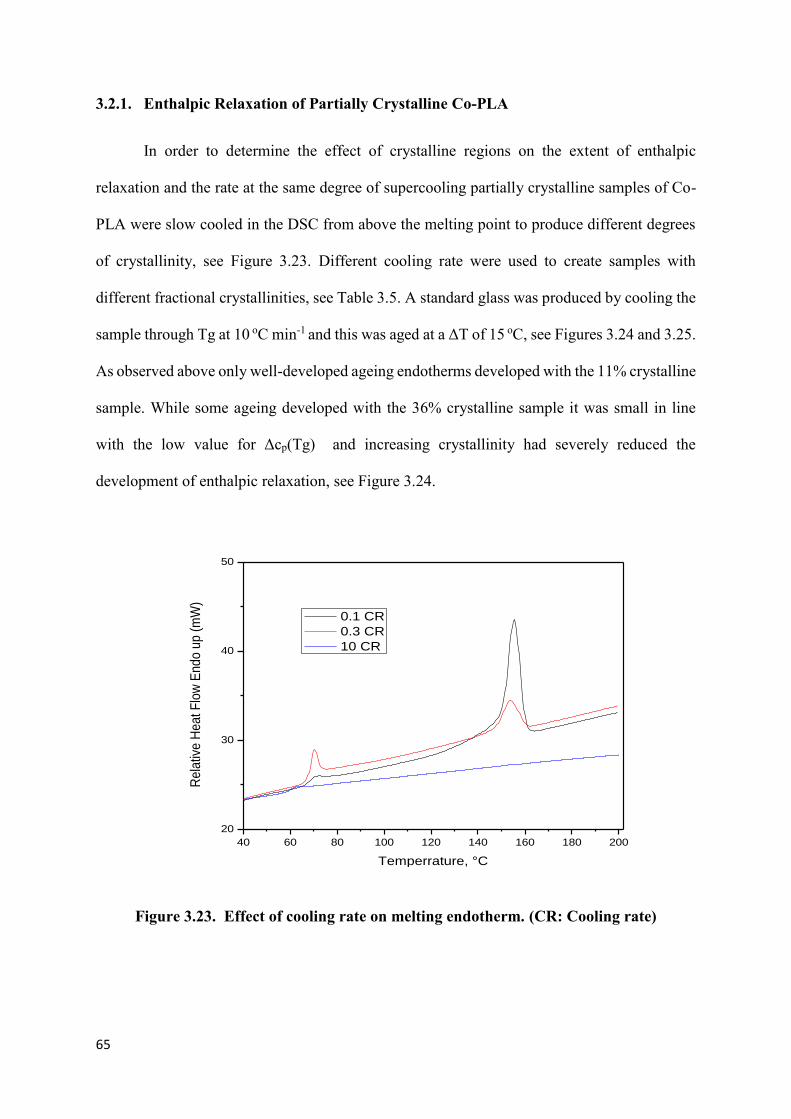
65
3.2.1. Enthalpic Relaxation of Partially Crystalline Co-PLA
In order to determine the effect of crystalline regions on the extent of enthalpic
relaxation and the rate at the same degree of supercooling partially crystalline samples of Co-
PLA were slow cooled in the DSC from above the melting point to produce different degrees
of crystallinity, see Figure 3.23. Different cooling rate were used to create samples with
different fractional crystallinities, see Table 3.5. A standard glass was produced by cooling the
sample through Tg at 10 oC min-1 and this was aged at a ΔT of 15 oC, see Figures 3.24 and 3.25.
As observed above only well-developed ageing endotherms developed with the 11% crystalline
sample. While some ageing developed with the 36% crystalline sample it was small in line
with the low value for Δcp(Tg) and increasing crystallinity had severely reduced the
development of enthalpic relaxation, see Figure 3.24.
40 60 80 100 120 140 160 180 200
20
30
40
50
Re
lativ
e H
ea
t F
low
End
o u
p (
mW
)
Temperrature, °C
0.1 CR
0.3 CR
10 CR
Figure 3.23. Effect of cooling rate on melting endotherm. (CR: Cooling rate)

66
Table 3.5. Cooling Rate used to prepare Crystalline Samples.
Cooling Rate
/ °C min1
% Crystallinity Glass Transition Temperature
/ o C
0.1
36 63.5
0.3
11 61.5
10
0 58.5
40 45 50 55 60 65 70 75 80
20
21
22
23
24
25
Re
lative
He
at F
low
En
do
up
(m
W)
Temperature, °C
Quenched
1 hour
3 hour
6 hour
12 hour
24 hour
Figure 3.24. Ageing of 36% crystalline sample at ΔT =15 oC.
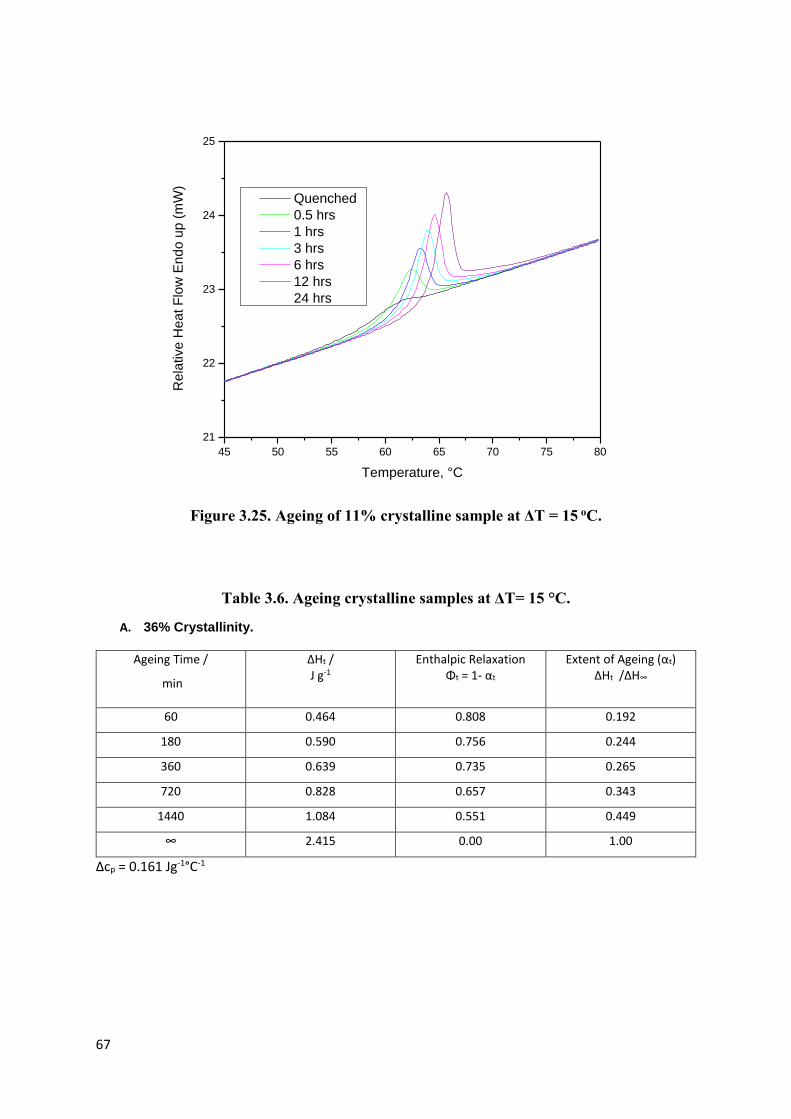
67
45 50 55 60 65 70 75 80
21
22
23
24
25
Re
lative
He
at F
low
En
do
up
(m
W)
Temperature, °C
Quenched
0.5 hrs
1 hrs
3 hrs
6 hrs
12 hrs
24 hrs
Figure 3.25. Ageing of 11% crystalline sample at ΔT = 15 oC.
Table 3.6. Ageing crystalline samples at ΔT= 15 °C.
A. 36% Crystallinity.
Ageing Time /
min
∆Ht / J g-1
Enthalpic Relaxation Φt = 1- αt
Extent of Ageing (αt) ΔHt /ΔH∞
60 0.464 0.808 0.192
180 0.590 0.756 0.244
360 0.639 0.735 0.265
720 0.828 0.657 0.343
1440 1.084 0.551 0.449
∞ 2.415 0.00 1.00
Δcp = 0.161 Jg-1°C-1

68
B. 11% Crystallinity.
Ageing Time /
min
∆Ht / J g-1
Enthalpic Relaxation Φt = 1- αt
Extent of Ageing (αt) ΔHt /ΔH∞
60 0.987 0.816 0.184
180 1.271 0.763 0.237
360 1.491 0.722 0.278
720 1.506 0.720 0.280
1440 1.797 0.666 0.334
∞ 5.370 0.000 1.00
Δcp = 0.358 Jg-1°C-1
The enthalpies of ageing with time for the crystalline samples are shown in Table 3.6
and Figure 3.26 for comparison with the amorphous material, the enthalpy developing with
time decreased with increasing crystallinity. However, this decrease was in proportion to the
drop in Δcp(Tg) since the extent of aging, ΔHt/ ΔHmax were comparative for all three materials,
see Figure 3.27.
Figure 3.26. Development of enthalpy of ageing with time.
0
1
2
3
4
5
6
0 1000 2000 3000 4000 5000 6000 7000
Enta
lph
y o
f A
gein
g, J
/g
Ageing Time (minute)
0.00 crystallinity
0.11 crystallinity
0.36 crystallinity

69
Figure 3.27. Development of ageing with time.
The extent of enthalpic relaxation towards equilibrium, (t), with time is defined by the
Williams-Watt equation, see eq. 3.9, and a plot of Ф(t) against ln(t/t0.2) was used to compare
the effect of crystallinity on the kinetics of ageing. Time to reach 20% conversion, t0.2, was
adopted in defining the reduced time since it was in the range of experimental measurements.
The 0 and 11 % crystallinity samples aged following similar kinetics, rate constant (1/t02) and
β value 0.27±0.3 while the more crystalline material had a lower rate but similar β value, as
indicated by the slope of Williams-Watt plot in Figure 3.28.
0
0.1
0.2
0.3
0.4
0.5
0.6
0.7
0.8
0 1000 2000 3000 4000 5000 6000 7000
Exte
nt
of
Age
ing,
∆H
a/∆
Hm
ax
Ageing Time (minute)
0.00 crystallinity
0.11 crystallinity
0.36 crystallinity

70
Figure 3.28. Williams-Watt fit of the extent of enthalpic relaxation against reduced
time.
3.3. Conclusions Samples of Co-PLA were slow to crystallize and this allowed them to be crystallized
by controlled cooling from the melting point. This enabled amorphous samples and samples
with controlled fractional crystallinity to be produced in order to compare enthalpic relaxation
rates. The glass transition of Co-PLA, produce with cooling rate at 10 oC min-1 was 58.5 oC but
it was raised to higher values on crystallization and a greatly reduced step in the specific heat,
Δcp(Tg), with crystallinity.
Ageing at temperatures close to but below Tg was accompanied with an endotherm at Tg on
reheating and this increased with logarithm of the storage time in agreement with the Williams-
Watt equation with a β value of 0.27. Crystallization appears to inhibit ageing in that the
reduction in Δcp(Tg) reduces the heat of enthalpic relaxation and the rate of ageing. This is
0
0.1
0.2
0.3
0.4
0.5
0.6
0.7
0.8
0.9
1
-4 -2 0 2 4 6
Enth
alp
ic R
ela
xati
on
φ(t
)
Reduced Timeln(t/t0.2)
0% crystallinity
11% crystallinity
36% crystallinity
71
attributed to the hard crystalline phase reducing the mobility of the segmental motion in the
amorphous regions, which is not in proportion to the crystallinity present.

72
Chapter 4. The Crystallization and Melting of Co-Poly (lactic acid).
4.0. Introduction
From the previous chapter on the effect of cooling rate on Co-PLA it was concluded
that the crystallization rates were too slow to be measured directly by isothermal calorimetry
and alternative procedures, A to D, were adopted to determine the development of crystallinity
with time over the range of temperatures.
4.1. Crystallization of Co-PLA in DSC by Procedure A
This procedure involved heating samples of weight 5-7 mg encased in aluminium pans,
from 30 to 200 oC at 10 oC min-1 in a DSC, holding it at 200 oC for 2 min, and cooling at 10 oC
min-1 to room temperature to produce an amorphous sample. The samples were removed from
the DSC and placed in a thermostated oven at various temperatures from 70 to 145 oC
corresponding to the region of maximum rate of crystallization (half way between Tg and the
melting point). The samples were held for various periods up to 120 min before being removed
from the oven and cooled to room temperature. The fractional crystallinity, Xt, which had
developed was determined by subsequently melting the polymer at 10 oC min-1 and measuring
the heat of fusion, ΔHf, from the area under the melting endotherm. This was divided by the
heat of fusion of totally crystallized PLLA, taken to be 93.6 Jg-1 [11, 58], to determine the
fractional crystallinity, Xt, since
Xt = ΔHf/ ΔHof (4.1)
The melting endotherms are reproduced in Figure 4.1a-h.
On crystallizing at 70oC, see Figure 4.1a, the crystallization rate was too slow to be
measured with any accuracy since only after 60-120 min was an ill-defined melting endotherm
observed, equivalent to a fractional crystallinity of about 0.01. The measured crystallinities

73
were not reproducible and the melting point, Tm, was also difficult to determine precisely but
was in the region of 155 oC.
140 150 160 170
26
28
30
32
34
36
Re
lativ
e H
ea
t F
low
En
do
Up
(m
W)
Temperature °C
0 min
15 min
30 min
45 min
60 min
75 min
90 min
105 min
120 min
PLA70 °C
Figure 4.1a. Endotherms produced by crystallizing at 70 °C.
On crystallizing at 85 oC the rate of crystallization had increased slightly and the
measured crystallinities were more reproducible. However, the fractional crystallinity which
developed within 2 h was only 0.02. The endotherms occurred at higher temperatures than at
70 oC and drifted higher with increasing time; melting occurred over 10-20 oC and was
associated with the melting of lamellae with a range of thermal stabilities. Two m.pts. were
accordingly defined corresponding to the maximum in the endotherm, Tm (Peak) and to the
melting of the maximum number of lamellae, and corresponding to the last trace of
crystallinity, Tm (Max). This was the melting point of the most stable lamellae in the
distribution.
(°C)

74
140 150 160 170
24
25
26
27
28
29
30
31
32
Re
lativ
e H
ea
t F
low
End
o U
p (
mW
)
Temperature °C
0 min
15 min
30 min
45 min
60 min
75 min
90 min
105 min
120 min
PLA85 °C
Figure 4.1b. Endotherms produced by crystallizing at 85 °C.
The crystallization was still faster at 95 oC and an endotherm was detectable after 15
min corresponding to the development of 0.015 fractional crystallinity but it was obvious that
crystallization was not complete after 2 hours (Figure 4.1c). The melting endotherm exhibited
a double distribution with two maxima, Tm (Peak 1) and Tm (Peak 2) both of which appeared to
increase with increasing time, although the last traces of crystallinity, T’m, did not appeared to
increase with time. The presence of a higher m.pt. in a double melting endotherm has in the
past [110, 111] been attributed to presence of lamellae which develop at the crystallization
temperature and thicken on heating. Nevertheless the presence of the double distribution
endotherm is consistent with two separate distributions of lamellae thickness.
(°C)

75
140 150 160 170
24
26
28
30
32
34
36
38
Re
lativ
e H
ea
t F
low
En
do
Up
(m
W)
Temperature°C
0 min
15 min
30 min
45 min
60 min
75 min
90 min
120 min
PLA95 °C
Figure 4.1c. Endotherms produced by crystallizing at 95 °C.
At 105 oC, the crystallization rate continued to increase with temperature since after 90
min the fractional crystallinity was 0.28 and the crystallization was nearing completion in that
the fractional crystallinity changed less between 90 and 120 min. than before (Figure 4.1d). A
double distribution melting endotherm was again observed with the lower one more dominant
implying that more of the lamellae crystallized at 105 oC had not thickened on heating to the
melting point (m.pt.) as they were more stable than those crystallised at 95 oC and lower.
(°C)

76
140 150 160 170
18
20
22
24
26
28
30
32
34
36
38
40
42
44
46
Re
lativ
e H
ea
t F
low
End
o U
p (
mW
)
Temperature °C
0 min
15 min
30 min
45 min
60 min
75 min
90 min
105 min
120 min
PLA105 °C
Figure 4.1d. Endotherms produced by crystallizing at 105 °C.
The crystallization rate was higher at 118 than 95 oC as the crystallinity developed to
0.38 after 2 hours compared with the previous one of 0.28 (Figure 4.1e). However, the melting
endotherms exhibited a single melt distribution with the absence of the higher melting
endotherm produced on thickening. Melting now occurred above 150 oC. The endotherms
broadened with time and shifted to higher temperatures, such that both Tm and T’m increased
progressively with time.
140 150 160 170
16
20
24
28
32
36
40
44
48
Re
lative
He
at F
low
En
do
Up
(m
W)
Temperature (°C)
15 min
30 min
45 min
60 min
75 min
90 min
105 min
120 min
PLA 118 °C
Figure 4.1e. Endotherms produced by crystallizing at 118 °C.
(°C)

77
The crystallization at 125 oC occurred at a similar rate to that at 118 oC and the
crystallinity appeared to have reached a limit after 2 hours of 0.40 (Figure 4.1f). The melting
endotherms were more regular than previous and occurred at higher temperatures with a single
distribution which moved to higher temperatures with time.
140 150 160 170
15
20
25
30
35
40
45
50
55
Re
lativ
e H
ea
t F
low
End
o U
p (
mW
)
Temperature °C
0 min
15 min
30 min
45 min
60 min
75 min
90 min
105 min
120 min
PLA125° C
Figure 4.1f. Endotherms produced by crystallizing at 125 °C.
The trends observed at 125 continued at 135 oC with higher m.pts. and a progressive increase
in Tm with time. The crystallinity appeared to be constant after 90 mins.
(°C)
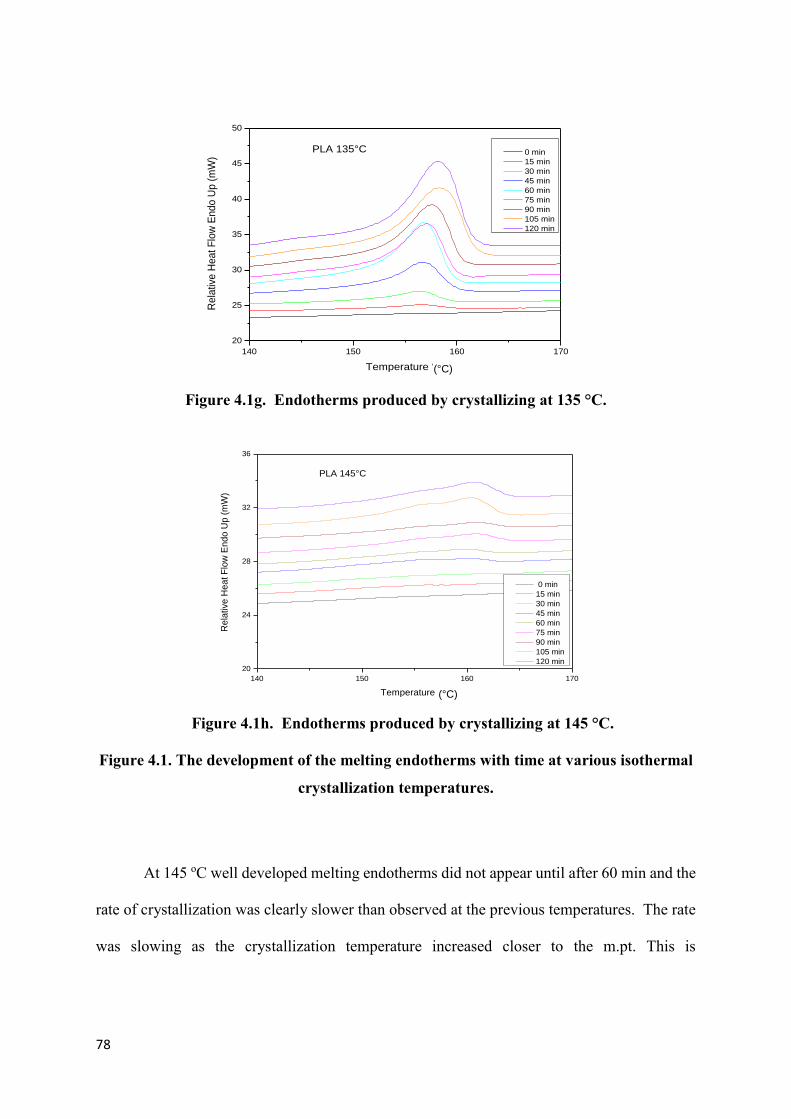
78
140 150 160 170
20
25
30
35
40
45
50
Re
lativ
e H
ea
t F
low
En
do
Up
(m
W)
Temperature °C
0 min
15 min
30 min
45 min
60 min
75 min
90 min
105 min
120 min
PLA 135°C
Figure 4.1g. Endotherms produced by crystallizing at 135 °C.
140 150 160 170
20
24
28
32
36
Re
lative
He
at F
low
End
o U
p (
mW
)
Temperature °C
0 min
15 min
30 min
45 min
60 min
75 min
90 min
105 min
120 min
PLA 145°C
Figure 4.1h. Endotherms produced by crystallizing at 145 °C. Figure 4.1. The development of the melting endotherms with time at various isothermal
crystallization temperatures.
At 145 oC well developed melting endotherms did not appear until after 60 min and the
rate of crystallization was clearly slower than observed at the previous temperatures. The rate
was slowing as the crystallization temperature increased closer to the m.pt. This is
(°C)
(°C)

79
characteristic of nucleation control as the crystallization rate, Rc, is dependent on the reciprocal
degree of super-cooling, i.e.
Rc ~ 1/(Tm –Tc) (4.2)
Despite the reduction in rate the m.pt. continued to increase, to 165 oC, with crystallization
temperature.
From Figure 4.2 it can be seen that the crystallization developed over a wide range of
temperature and although the rates were slow initially it increased to a maximum between 118
to 125 oC and then decreased again to an extremely low rate at 145 oC. This bell-shaped
dependence of rate on temperature is characteristic of polymer crystallization and in the case
of Co-PLA the rate decreased at low temperatures due to viscosity control of the crystallization
and at high temperature the rate decreased with increasing temperature due to the dependence
on supercooling characteristic of nucleation control.
Figure 4.2. The development in fractional crystallinity, Xc with time over the
temperature range 70–135 oC.
0
0.05
0.1
0.15
0.2
0.25
0.3
0.35
0.4
0.45
0 20 40 60 80 100 120 140
Frac
tio
nal
Cry
stal
linit
y, X
c
Time (minutes)
70°C
85°C
95°C
105°C
118°C
125°C
135°C
145°C

80
4.2. Crystallization of Co-PLA by Procedure B
Procedure B is a partial repeat of procedure A except that since the rate of crystallization
of Co–PLA was slow it was decided to extend the time up to 16 h, repeat some of the
crystallizations to check the reproducibility of the method and use an increased rate of heating
to eliminate melting and recrystallization on heating to the melt. This was used to explain the
presence of some of the double distribution melting endotherms. As previously 5-7 mg samples
were encapsulated in aluminium pans, melted at 200 oC, held for 2 min before cooling at 10 oC
min-1 to 30 oC in the DSC. This ensured that the samples were amorphous and would crystallize
at the temperature of the oven, within the range 95 to 135 oC. The crystallinity of the samples
were determined by measuring the heats of fusion within the DSC under the conditions adopted
previously except that the rate of heating was 50 o C min-1 to reduce the amount of melting and
recrystallization which occurred on re-heating to the melting point. Some of the crystallizations
were repeated to check the reproducibility of the method and samples were removed after 2, 4,
6 and 16 h only. These results are shown in Figure 4.3a-e.
On crystallizing at 95 oC after 2 h the crystallinity was 0.15 and Tm was 160 oC which
compares with 0.25 and 155 oC on crystallizing by procedure A. Heating at a faster rate had
considerable effect in reducing the measured fractional crystallinity as additional material had
crystallized at a lower temperature; consequently melting at a lower temperature. However,
the greatest difference between the two procedures was the absence of the bimodal melting
endotherm. A barely discernible lower endotherm was present which was very different from
that observed previously in section 4.1; the absence is attributed to heating the sample at 50
rather than 10 oC min-1 since it reduced the time for the lamellae to thicken on heating to the
melting point. The crystallinity of the sample continued to increase with time and the melting
endotherm broadened moving to higher temperatures with time.

81
140 150 160 170 180
25
30
35
40
45
50
Re
lative
He
at F
low
End
o u
p (
mW
)
Temperature °C
95°C 2hrs oven
95°C 4hrs oven
95°C 6hrs oven
95°C 16hrs oven
Figure 4.3a. Endotherms produced by crystallizing at 95 °C.
140 150 160 170 180
15
20
25
30
35
40
45
50
55
Re
lativ
e H
ea
t F
low
En
do
up
(m
W)
Temperature °C
105°C 2hrs oven
105°C 4hrs oven
105°C 6hrs oven
105°C 16hrs oven
Figure 4.3b. Endotherms produced by crystallizing at 105 °C.
Again the greatest difference between samples produced by methods A and B was the
absence of the bimodal melting endotherms and in particular the absence of the lower
temperature endotherm. This is attributed to the higher heating rate adopted, as discussed
(°C)
(°C)

82
above. The crystallization, however, continued to develop with time, from 0.3 to 0.4 fractional
crystallinity. These trends were continued at higher temperatures as can be seen in Figures
4.3c-e.
140 150 160 170 180
30
40
50
60
70
80
Re
lativ
e H
ea
t F
low
End
o u
p (
mW
)
Temperature °C
118°C 2hrs oven
118°C 4hrs oven
118°C 6hrs oven
118°C 16hrs oven
Figure 4.3c. Endotherms produced by crystallizing at 118 °C.
140 150 160 170 180
20
30
40
50
60
70
Re
lative
He
at F
low
En
do
up
(m
W)
Temperature °C
125°C 2hrs oven
125°C 4hrs oven
125°C 6hrs oven
125°C 16hrs oven
Figure 4.3d. Endotherms produced by crystallizing at 125 °C.
(°C)
(°C)

83
140 150 160 170 180 190
20
30
40
50
60
Re
lativ
e H
ea
t F
low
End
o u
p (
mW
)
Temperature °C
135°C 2hrs oven
135°C 4hrs oven
135°C 6hrs oven
135°C 16hrs oven
Figure 4.3e. Endotherms produced by crystallizing at 135 °C.
Figure 4.3. PLA sample crystallized various temperatures by procedure B.
From these observations it was apparent that by using a faster heating rate (50 °C min-1) there
is less time for the crystalline material to reorganise and develop thicker lamellae. It is
accompanied by the disappearance of the double melting endotherms in the crystallization
temperature range 95 to 105 °C and replaced by a single one centred at the lower m.pt.
previously observed on heating at a slower rate. Accordingly Tm2 is attributed to the melting
of material crystallized at the crystallization temperature and Tm1 to material structurally re-
organised on heating. Similar findings have been observed by He et al [74]; they attributed the
increased thermal stability of the lamellae to their crystallizing at higher temperature. The DSC
traces all exhibited a single melting endotherm whose Tm1 increased with increasing
crystallization temperature due to an increase in the lamellae thickness.
The development of crystallinity with time at the various crystallization temperatures
is shown in Figure 4.4. At all the temperatures, there is a rapid increase in crystallinity with
(°C)
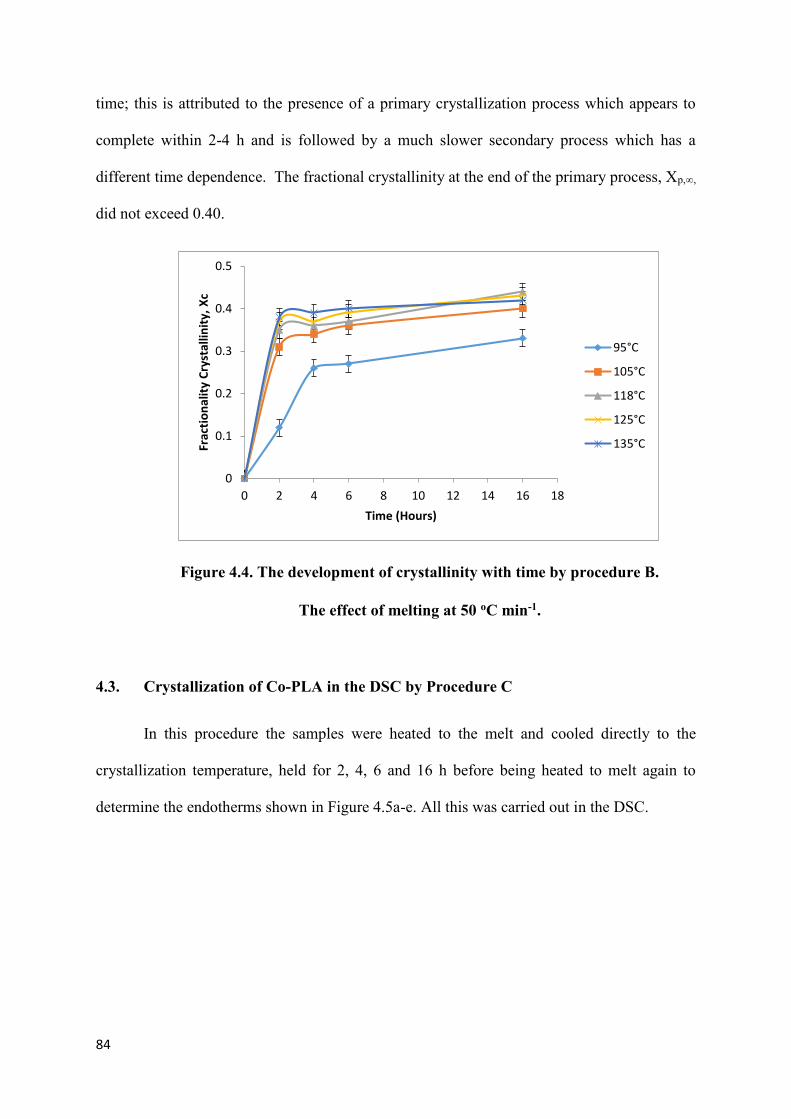
84
time; this is attributed to the presence of a primary crystallization process which appears to
complete within 2-4 h and is followed by a much slower secondary process which has a
different time dependence. The fractional crystallinity at the end of the primary process, Xp,∞,
did not exceed 0.40.
Figure 4.4. The development of crystallinity with time by procedure B.
The effect of melting at 50 oC min-1.
4.3. Crystallization of Co-PLA in the DSC by Procedure C
In this procedure the samples were heated to the melt and cooled directly to the
crystallization temperature, held for 2, 4, 6 and 16 h before being heated to melt again to
determine the endotherms shown in Figure 4.5a-e. All this was carried out in the DSC.
0
0.1
0.2
0.3
0.4
0.5
0 2 4 6 8 10 12 14 16 18
Frac
tio
nal
ity
Cry
stal
linit
y,X
c
Time (Hours)
95°C
105°C
118°C
125°C
135°C

85
145 150 155 160 165 170 175
-10
0
10
20
30
Re
lativ
e H
ea
t F
low
En
do
up
(m
W)
Temperature°C
95°C 2 hrs Tc
95°C 4 hrs Tc
95°C 6 hrs Tc
95°C 16 hrs Tc
Figure 4.5a. Endotherms produced by crystallizing at 95 °C in DSC.
140 150 160 170 180
-20
-15
-10
-5
0
5
10
15
20
25
Re
lativ
e H
ea
t F
low
End
o u
p (
mW
)
Temperature°C
105°C 2hrs Tc
105°C 4hrs Tc
105°C 6hrs Tc
105°C 16hrs Tc
Figure 4.5b. Endotherms produced by crystallizing at 105 oC.
(°C)
(°C)

86
140 150 160 170 180
-20
-15
-10
-5
0
5
10
15
20
25
30
Re
lative
He
at F
low
En
do
up
(m
W)
Temperature°C
118°C 2hrs Tc
118°C 4hrs Tc
118°C 6hrs Tc
118°C 16hrs Tc
Figure 4.5c. Endotherms produced by Crystallizing at 118 °C.
140 150 160 170 180 190
-5
0
5
10
15
20
25
30
Re
lative
He
at F
low
En
do
up
(m
W)
Temperature°C
125°C 2 hrs Tc
125°C 4 hrs Tc
125°C 6 hrs Tc
125°C 16 hrs Tc
Figure 4.5d. Endotherms produced by crystallizing at 125 °C.
Temperature (°C)
Temperature (°C)

87
150 160 170 180 190
-5
0
5
10
15
20
25
30
35
Re
lative
He
at F
low
End
o u
p (
mW
)
Temperature°C
135°C 2hrs Tc
135°C 4hrs Tc
135°C 6hrs Tc
135°C 16hrs Tc
Figure 4.5e. Endotherms produced by crystallizing at 135 °C.
Figure 4.5. Crystallizing amorphous PLA samples in DSC at various temperatures.
The development of crystallinity with time at each crystallization temperature is shown
in Figure 4.6. The behaviour is substantially the same as from that observed in Figure 4.3 in
that the development of crystallinity with time shows an initial primary followed by a
secondary process with different time dependence.
Temperature (°C)

88
Figure 4.6. The development of crystallinity with time by procedure C.
4.4. Crystallization of Co-PLA by Procedure D
In order to determine the effect of cooling the sample to room temperature and re-
heating to the melt, which is inevitable in the use of the oven to crystallize samples for a long
period, samples were heated to 200 oC in the DSC, for 2 min and cooled to the crystallization
temperature. They were held there for up to 16 h and then cooled to 30 oC before re-heating to
melt and determining the endotherms shown in Figure 4.7a-e
0
0.05
0.1
0.15
0.2
0.25
0.3
0.35
0.4
0 2 4 6 8 10 12 14 16 18
Frac
tiona
l Cry
stal
linity
, Xc
Time (Hours)
95°C
105°C
118°C
125°C
135°C

89
140 150 160 170
-15
-10
-5
0
5
10
15
20
25
Re
lative
He
at F
low
En
do
Up
(m
W)
Temperature°C
95°C 2hrs RT
95°C 4hrs RT
95°C 6hrs RT
95°C 16hrs RT
Figure 4.7a. Endotherms produced by crystallizing at 95 °C in DSC.
140 150 160 170 180
-10
-5
0
5
10
15
20
25
30
35
Re
lativ
e H
ea
t F
low
End
o U
p (
mW
)
Temperature°C
105°C 2hrs RT
105°C 4hrs RT
105°C 6hrs RT
105°C 16hrs RT
Figure 4.7b. Endotherms produced by crystallizing at 105 °C in DSC.
Temperature (°C)
Temperature (°C)

90
140 150 160 170 180
-10
0
10
20
30
Re
lative
He
at F
low
En
do
Up
(m
W)
Temperature°C
118°C 2hrs RT
118°C 4hrs RT
118°C 6hrs RT
118°C 16hrs RT
Figure 4.7c. Endotherms produced by crystallizing at 118 °C in DSC.
140 150 160 170 180 190
-15
-10
-5
0
5
10
15
20
25
Re
lative
He
at F
low
En
do
Up
(m
W)
Temperature°C
125°C 2hrs RT
125°C 4hrs RT
125°C 6hrs RT
125°C 16hrs RT
Figure 4.7d. Endotherms produced by crystallizing at 125 °C in DSC.
Temperature (°C)
Temperature (°C)

91
140 150 160 170 180 190
-5
0
5
10
15
20
25
30
Re
lative
He
at F
low
End
o u
p (
mW
)
Temperature°C
135°C 2hrs RT
135°C 4hrs RT
135°C 6hrs RT
135°C 16hrs RT
Figure 4.7e. Endotherms produced by crystallizing at135 °C in DSC.
Figure 4.7. Crystallizing amorphous Co-PLA samples in the DSC at various
temperatures by procedure D.
The development of crystallinity with time at the various isothermal temperatures are shown
in Figure 4.8; there is a considerable difference between this and Figure 4.6 in that the final
crystallinities achieved are greatly reduced from 0.30-0.45 to 0.25-0.35 and the faster rates do
not seem to exhibit any secondary crystallization component. Clearly cooling to and re-heating
from room temperature substantially increases the crystallinity measured and procedures A, B
and D cannot be used to determine the kinetics of crystallization at each isothermal
temperature.
The times taken to crystallize Co-PLA to 0.30 crystallinity at various temperatures are
shown in Figure 4.9 for all the procedures. It can be seen that procedures A, B, C and D are
all different and variable results were obtained depending on conditions. It is, however,
apparent that crystallizing within the DSC gave more consistent results and eliminated cooling
to room temperature and reheating from there which is inevitable in using the oven gave
Temperature (°C)

92
inconsistencies, greater final crystallinity and lower m.pts. Also using high heating rates and
correcting for thermal lags was better than using slower rates with less thermal lags due to the
additional crystallinity created on cooling and reheating from 30 oC in that recrystallization and
crystal perfecting was substantially reduced. These conditions must be adopted in measuring
isothermal crystallization kinetics by DSC, since it does not have the sensitivity to measure the
kinetics directly. However, the procedure is time consuming, determining the crystallinity one
point at a time and limited by the number of determinations adopted. The final accuracy in
determining the degree of crystallinity is low, frequently ± 0.05, and not sufficient for kinetic
analysis of the crystallization.
Figure 4.8. The development of crystallinity with time heating directly from the
crystallization temperature following procedure D.
0
0.05
0.1
0.15
0.2
0.25
0.3
0.35
0.4
0 2 4 6 8 10 12 14 16 18
Frac
tio
nal
Cry
stal
linit
y, X
c
Time (Hours)
95°C
105°C
118°C
125°C
135°C
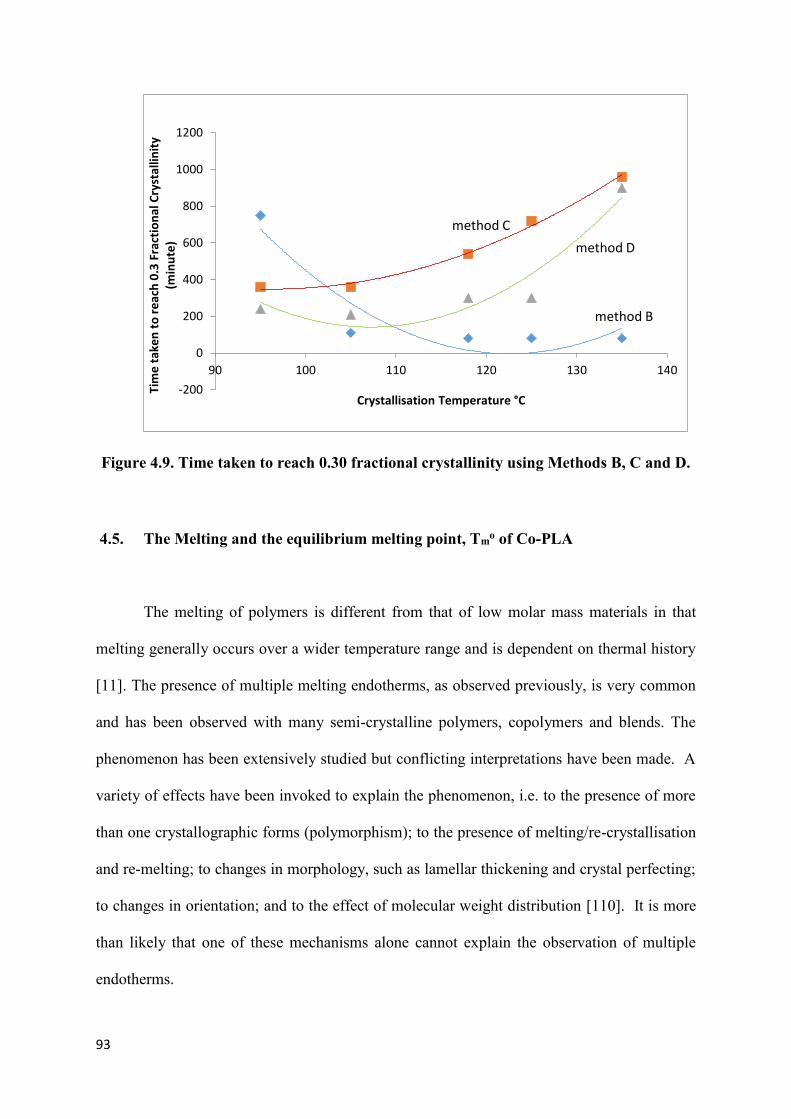
93
Figure 4.9. Time taken to reach 0.30 fractional crystallinity using Methods B, C and D.
4.5. The Melting and the equilibrium melting point, Tmo of Co-PLA
The melting of polymers is different from that of low molar mass materials in that
melting generally occurs over a wider temperature range and is dependent on thermal history
[11]. The presence of multiple melting endotherms, as observed previously, is very common
and has been observed with many semi-crystalline polymers, copolymers and blends. The
phenomenon has been extensively studied but conflicting interpretations have been made. A
variety of effects have been invoked to explain the phenomenon, i.e. to the presence of more
than one crystallographic forms (polymorphism); to the presence of melting/re-crystallisation
and re-melting; to changes in morphology, such as lamellar thickening and crystal perfecting;
to changes in orientation; and to the effect of molecular weight distribution [110]. It is more
than likely that one of these mechanisms alone cannot explain the observation of multiple
endotherms.
-200
0
200
400
600
800
1000
1200
90 100 110 120 130 140
Tim
e t
ake
n t
o r
eac
h 0
.3 F
ract
ion
al C
ryst
allin
ity
(min
ute
)
Crystallisation Temperature °C
method B
method C
method D

94
150
155
160
165
170
175
0 5 10 15 20
Melt
ing
Po
int
Tm
/ o
C
Crystallization Time / h
Tc = 95
oC
Tc = 105
oC
Tc = 118
oC
Tc = 125
oC
Tc= 135
oC
Figure 4.10. Dependence of melting point on crystallization time and temperature.
Co-PLA crystallises over a wide temperature range and samples crystallised for
different times and at different temperatures, see Figure 4.10, some with the same degree of
crystallinity, have different melting points. These clearly depend on experimental conditions.
As we have seen two endotherms are present in a limited number of samples in which the lower
one represented the melting of lamellae produced by crystallizing isothermally. Only m.pt.
determined by crystallizing under well-defined conditions, namely by method C, were analysed
in any detail. Measured values of Tm are shown in Figure 4.10 as a function of crystallization
temperature and time. In every case the higher value of Tm was adopted as a measure of the
melting point of the lamellae produced under these conditions. The value of Tm increased with
increasing crystallization temperature and with time at each temperature. Similar findings have
95
been reported by Farrow [112] where the increase in the melting temperature was attributed to
crystal perfecting and lamellae thickening as the crystallisation temperature increases.
If Tm reflects the original crystalline lamella thickness, the equilibrium melting
temperature, Tmo, can be determined using the Hoffman-Week’s relationship [56] in which the
observed melting point Tm is related to Tc by,
Tm = Tmo (1- 1/γ) + Tc/2γ (4.3)
And γ = (σe ξ /σξe )
Where σ and σe are the surface free energy of the of the fold surface of the lamellae as
crystallized and under equilibrium conditions, and ξ and ξe are the stem lengths (thickness) of
the lamellae as crystallized and under equilibrium conditions.
A linear plot of Tm vs. Tc was observed but only for the higher crystallization temperatures, as
shown in Figure 4.11 from which the value of lamella thickening coefficient, , was determined
to be 1.0 indicating that the maximum lamella thickness was close to the critical size of the
primary nucleus and the measurement of Tm was carried out under equilibrium conditions. No
re-crystallisation or crystal perfection had occurred during heating.
The extrapolated value of Tmo was 205 oC which was in good agreement with literature values
[11, 61, 69, 113]. The lower m.pt. have a γ value of ½ indicating that their thickness was half
the equilibrium value as the surface free energy terms are unlikely to change significantly.

96
80
100
120
140
160
180
200
220
80 100 120 140 160 180 200 220
Melt
inp
Po
int,
Tm
/ o
C
To
M
Crystallization Temperature / oC
Figure 4.11. Hoffman-Weeks plot of m.pt against crystallization temperature.
According to a model proposed by Flory and Vrij [114-116] and extended by Hay to
lamellar crystals [117, 118] the m.pt. of oligomers with degree of polymerization, n , is,
Tm = Tmo {1- 2RTm ln (n)/nΔh - …. } (4.4)
The higher terms involving heat capacity for the temperature dependence of Δh are minor
corrections
And ln (n)/n = 2RTm. Tmo / Δh (Tm
o - Tn) (4.5)
where Tm is the m.pt. of the oligomer, Tmo the equilibrium m.pt. , R the gas constant and Δh
the heat of fusion per monomer mole. This equation was used to determine the value of n, the
Melt
ing

97
number of monomer units in the lamellae thickness as a function of crystallization time from
the value of ln (n)/ n. A table of ln (n)/n against n enabled the number of monomer units to be
determined at each crystallization temperature and lapsed time. The stem length increased with
time throughout the crystallization and was attributed to secondary crystallization as discussed
above. The stem lengths were plotted as a function of the square root of the crystallization
time in accordance with equation 4.5 and a linear dependence observed, see Figure 4.12. The
slopes of the lines are a measure of the increase in crystallinity due to an increase in stem length
and are a measure of the secondary rate constant, ks, in monomer moles per h-1/2. These values
are listed in Table 4.3, and although there is considerable scatter in the values there is an overall
increase with temperature. This is consistent with a thermally activated process such as
diffusion control and is inconsistent with a nucleation controlled process.
30
35
40
45
50
55
60
65
1 1.5 2 2.5 3 3.5 4 4.5Nu
mb
er
of
mo
no
mer
un
its
per
ste
m len
gth
n
Square root of crystallization time /
h1/2
Tc = 95
oC
Tc = 105
oC
Tc = 118
oC
Tc = 125
oC
Tc = 135
oC
Figure 4.12 Dependence of the lamellae stem length on square root of the crystallization time.
h 1/2
98
Table 4.3. Secondary Crystallization Rates.
Crystallization
Temperature/
oC
95
105
118
125
135
Rate Constant
ks
h-1/2
2.6
2.3
3.0
4.1
3.0
4.6 Conclusions
The PLA samples were observed to crystallize slowly and even at the fastest rate the
half-life was 50 min and isothermal calorimetry was an inappropriate technique to study
isothermal crystallization directly. Accordingly modifications were made to the conventional
method used to study polymer crystallization by DSC. Crystallizing in a thermostated oven
was also inappropriate since it involved cooling the sample and reheating from room
temperature. This gave false results in increased the crystallinity and lowered the m.pt. of the
samples. Accordingly, the samples were crystallized within a DSC for different periods at
different temperatures and the crystallinities measured from the heat of fusion at the m.pt.
However, a further refinement was required in that the sample was observed to melt and
recrystallize on heating to the m.pt. and it was necessary to increase the heating rate from 10
to 50 oC min-1 to minimise the effect. The increased heating rate required a thermal lag
correction to be made to the melting temperature.
The m.pt. of the lamellae increased with crystallization temperature in line with
Hoffman and Weeks’ nucleation theory of crystal growth and was consistent with an
equilibrium melting point for PLA of 205±2.0 oC. The m.pt. at constant crystallization

99
temperature increased with time from the beginning of the crystallization; this was consistent
with lamellae thickening occurring from the time they were produced and primary and
secondary crystallization co-existing together during the primary stage of crystallization. The
increase in stem length of the lamellae with the square root of crystallisation time was evidence
for the mechanism of secondary crystallization and the increase in rate constant with
temperature that it was a thermally activated process and not nucleation controlled.

100
Chapter 5. FTIR-Thermal Analysis of Co-poly (lactic acid).
5.0. Introduction
FTIR spectroscopy – thermal analysis has been widely used to characterise polymers
since it enables the intensities of functional groups to be measured with temperature and time.
It is particularly useful in characterising the phase transitions in crystallizable polymers [94,
119, 120], in following the crystallization kinetics with temperature [121-123], and measuring
the kinetics of degradation and side group reactions in polymers from the change in intensity
of functional groups [124-126]. It can measure the relative importance of competing reactions
as well as the build-up of transient species involved in decomposition reactions. FTIR-TA has
been used widely to characterise Co-PLA as a function of temperature and time and establish
its crystallization and melting temperatures (11, 127-131].
In polymers the position and intensities of the absorption bands can be sensitive to the
stereochemistry which in PLA is determined by the monomer used in its production. D or L-
monomers give rise to isotactic polymers while the D, L-lactide produce alternating D, L
sequences or syndiotactic polymers. A random mixture of D or L-monomer would give rise to
atactic polymer with a disordered D, L sequence. These changes are attributed to the
configuration of the polymer chain and are due its chemical structure and in particular to the
asymmetric centre but do not change on heating, cooling, crystallization or melting unless the
main chain bonds are broken. They will give rise to different bands in the infra-red spectrum
of the polymer but require samples of different stereoregularity in order to assign the bands to
a stereochemical structure.
Further complications exist, in the amorphous state, in that rotation occurs about the C-C bonds
in the chain. In amorphous regions above the glass transition chain segments are mobile and
rotate freely about each chain bond. In a single rotation there are 3 minimum energy positions,

101
corresponding to positions where adjacent groups on the C atoms are close together and the
chain adopts a staggered conformation; there are two of these designated (±) gauche, i.e. ± g.
There is a further position in which adjacent groups on the C atoms are furthest apart which
corresponds to the lowest energy and is called trans i.e. t. Different gauche and trans sequences,
such as gtg, tgt etc. persists in thermal equilibrium with one another and change with
temperature which can be detected by changes to the IR spectrum. On crystallization the
polymer chain in PLA adopts a 10:3 helix at the expense of the random conformation of the
melt and there is a change in that the random conformations disappear as the helical ones
develop. This is reversed on melting; heating and cooling a polymer can be useful in assigning
crystalline and amorphous infra-red bands as well as conformation sequences.
5.1. The FTIR Spectrum of Co-poly (lactic acid)
The spectrum of partially crystalline Co-PLA is shown in Figure 5.1. It is characteristic of a
linear aliphatic ester polymer consistent with its formula, i.e.
(- CH 2 – CH (-CH3) – CO – O -)n
with degree of polymerization n.
Group frequencies, as listed in Table 5.1, were assigned using reference standard tables [11].
The absorption bands at 2800-3000 cm-1 were attributed to aliphatic bond stretching of the C-
H, –CH2–, and –CH3 groups, 1740-80 cm-1 to the ester carbonyl bond stretching and the bands
below 1500 cm-1 to the chain conformation and configuration associated with C-CH3, ester and
C-C groups.

102
Figure 5.1. Thin film FTIR Spectrum of crystalline Co-PLA at room temperature.
Wavenumbers (cm-1)
Abs
orba
nce
C H stretch
C = O stretch
Finger Print Region
C H bending
O-C=O stretch
C C
bending

103
Table 5.1. Molecular Group Assignment [132]
Wavenumber cm-1
Absorbance Group Assignment
2800-3050 weak Aliphatic -C-H stretching,
C-H, CH2, CH3
1740-1780
very strong >C=O stretching
1300-1450
strong -C-H bending
1000-1300 strong C – O ester group stretching
1130
1044
weak
weak
CH3
C-CH3 vibration
800-900 weak -C-C- bending
Many of the bands alter on crystallization due to the difference in force fields between
amorphous and crystalline regions, and the difference in chain configurations - gauche and
trans isomers in equilibrium in the mobile amorphous regions, and 103 helical structure of the
crystalline phase. In order to assign which bands were associated with each conformer samples
were heated and cooled through the glass transition, through crystallization and to the melting
temperature.
5.2. Changes in the IR spectrum on heating and cooling
Figures 5.2 a-b show that the temperature dependence of the IR spectrum of Co-PLA
in the range 4000 to 800 cm-1 is reversible on heating and cooling and changes occur on heating
and cooling associated with melting and crystallization. There are five regions of the spectrum,

104
as listed in Table 5.1, which are sensitive to structural changes taking place during
crystallization and melting; these are the C-H stretching region 2800-3050 cm-1, the >C=O
stretching at 1740-1780 cm-1, the CH3 and CH bending at 1044 to 1130 cm-1, C-O-C stretching
band at 1000 to 1500 cm-1 and -C- C- bending from 800 to 900 cm-1.
Figure 5.2a. Dynamic Run – IR Spectra on heating from 35 to 200°C at 5 °C min-1
Wavenumbers (cm-1)
Abs
orba
nce
C H stretch
C = O stretch
strecth
Finger print Region
C H bending
O-C=O stretch
C C bending
bending

105
Figure 5.2b. Dynamic Run – IR Spectra on cooling from 200 to 35°C at 5 °C min-1
Since the absorbances of the bands are, however, very variable, the carbonyl is intense and the
C-H is weak, detailed analyses of the changes on crystallization and melting were carried out
separately on individual band within these regions.
5.2.1. Changes in the region 2800-3050 cm-1 on heating and cooling
There are five bands of low intensities in this region assigned to CH3- asymmetric
stretching, CH2< asymmetric and -> C-H antisymmetric stretching, see Figure 5.3a-b. Small
changes in intensities and position of the bands occur on heating and cooling, crystallization
and melting. Most changes were observed in the intensities of the bands at 2995 and
Wavenumbers (cm-1)
Abs
orba
nce
C H stretch
C = O stretch
Finger print Region
C H bending
O-C=O stretch
C C bending

106
2944 cm-1 initially in that they were observed to move to a higher wavenumber on
crystallization at about 100 oC, and back on melting at 160 oC. The reverse is observed on
cooling below 100 oC. The trend was observed in the peak intensities which were sensitive to
temperature and crystallinity, see Figures 5.4–5. On heating the absorbance of the 2944 cm-1
band increases with temperature but there is a step down at 70 oC, due to the glass transition.
At 85 oC there is a sharp drop followed by an increase from 95 to 140 oC. Above 140 oC, there
is a rapid rise from 140 to 155 oC until it reached a value close to what it would have reached
if the initial rise had continued to increase linearly with temperature. On cooling the intensity
decreased linearly with temperature until 100 oC when it decreased sharply. At lower
temperatures it continues to decrease. These sharp step changes in intensity on heating are
attributed to crystallization at 95 oC followed by melting from 140 to 155 oC and on cooling to
onset of crystallization at 100 oC. Similar changes were observed with the 2995 cm-1 although
the noise level tended to confuse the trends. There is a decrease in intensity on heating and on
crystallization although the trend is masked by the accuracy in measuring the intensity, ±0.001,
These changes in intensities of the peaks and the shift in wavenumbers are attributed to
differences between crystalline, at 2995 and 2944 cm-1, and amorphous bands, at 2992 and
2942 cm-1.

107
Figure 5.3a. Dynamic Run – IR Spectra on heating from 35 to 200°C at 5 °C min-1.
Figure 5.3b. Dynamic Run – IR Spectra on cooling from 200 to 35°C at 5 °C min-1.
Abs
orba
nce
Wavenumbers (cm-1)
Wavenumbers (cm-1)
Abs
orba
nce
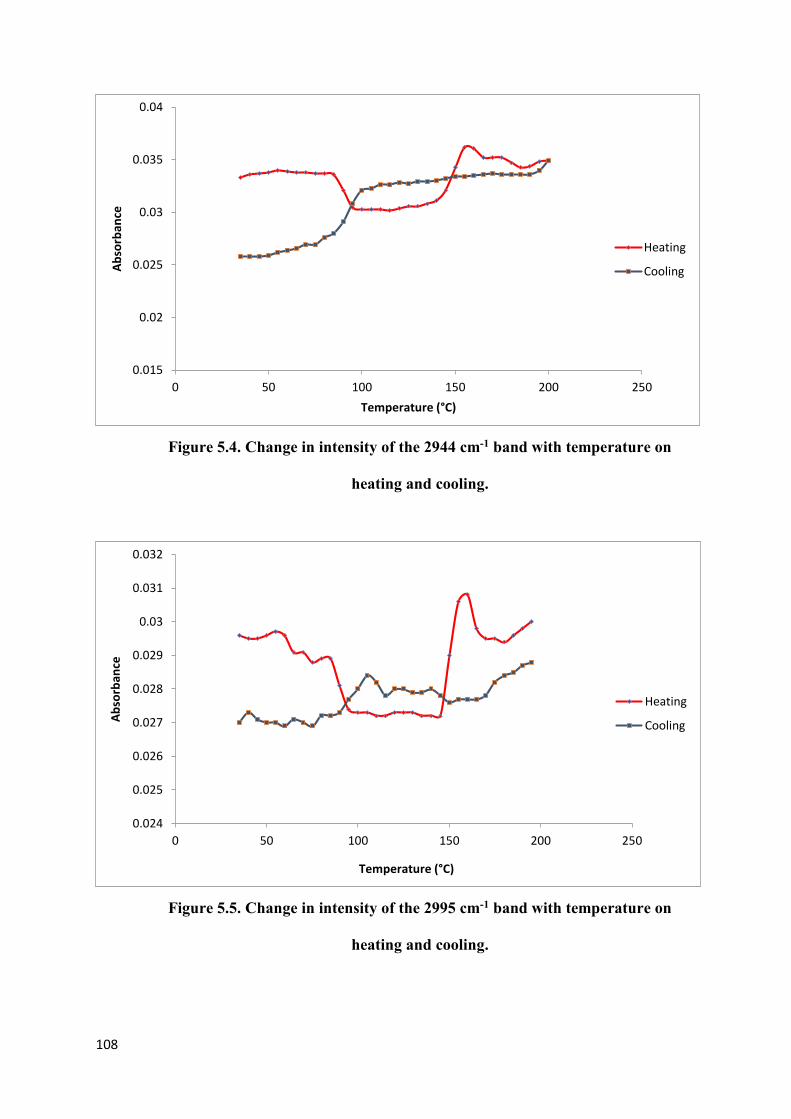
108
Figure 5.4. Change in intensity of the 2944 cm-1 band with temperature on
heating and cooling.
Figure 5.5. Change in intensity of the 2995 cm-1 band with temperature on
heating and cooling.
0.015
0.02
0.025
0.03
0.035
0.04
0 50 100 150 200 250
Ab
sorb
ance
Temperature (°C)
Heating
Cooling
0.024
0.025
0.026
0.027
0.028
0.029
0.03
0.031
0.032
0 50 100 150 200 250
Ab
sorb
ance
Temperature (°C)
Heating
Cooling
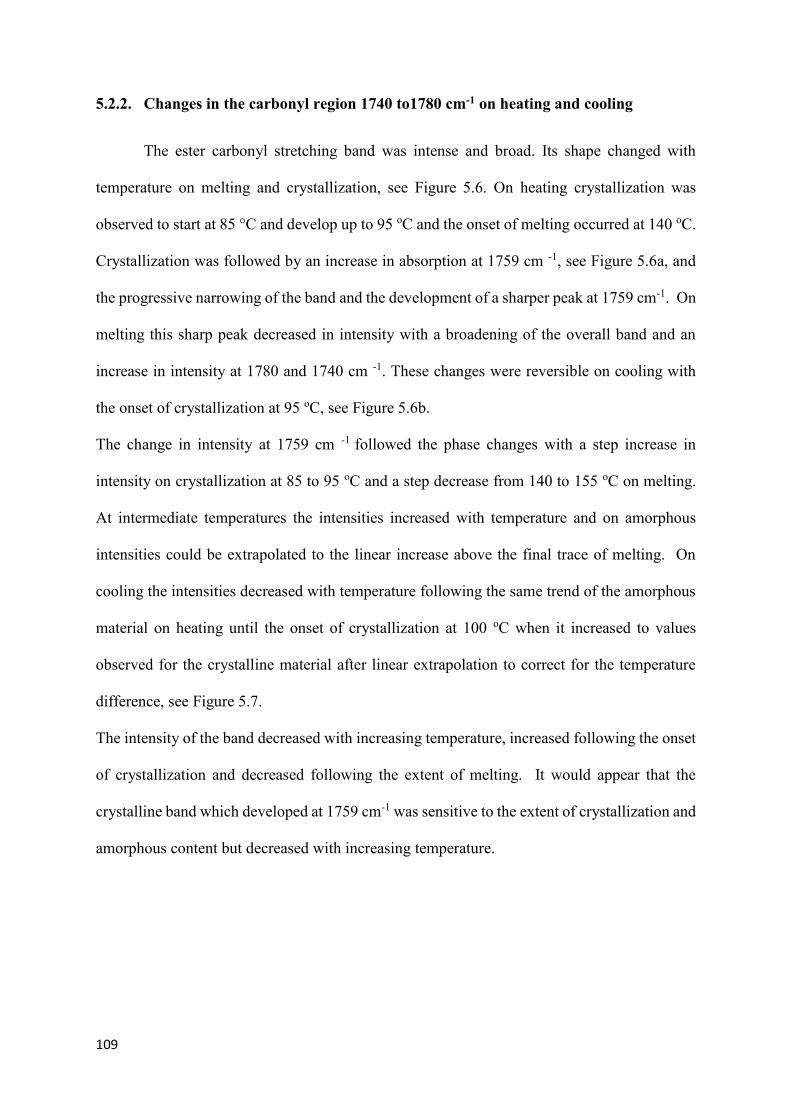
109
5.2.2. Changes in the carbonyl region 1740 to1780 cm-1 on heating and cooling
The ester carbonyl stretching band was intense and broad. Its shape changed with
temperature on melting and crystallization, see Figure 5.6. On heating crystallization was
observed to start at 85 °C and develop up to 95 oC and the onset of melting occurred at 140 oC.
Crystallization was followed by an increase in absorption at 1759 cm -1, see Figure 5.6a, and
the progressive narrowing of the band and the development of a sharper peak at 1759 cm-1. On
melting this sharp peak decreased in intensity with a broadening of the overall band and an
increase in intensity at 1780 and 1740 cm -1. These changes were reversible on cooling with
the onset of crystallization at 95 oC, see Figure 5.6b.
The change in intensity at 1759 cm -1 followed the phase changes with a step increase in
intensity on crystallization at 85 to 95 oC and a step decrease from 140 to 155 oC on melting.
At intermediate temperatures the intensities increased with temperature and on amorphous
intensities could be extrapolated to the linear increase above the final trace of melting. On
cooling the intensities decreased with temperature following the same trend of the amorphous
material on heating until the onset of crystallization at 100 oC when it increased to values
observed for the crystalline material after linear extrapolation to correct for the temperature
difference, see Figure 5.7.
The intensity of the band decreased with increasing temperature, increased following the onset
of crystallization and decreased following the extent of melting. It would appear that the
crystalline band which developed at 1759 cm-1 was sensitive to the extent of crystallization and
amorphous content but decreased with increasing temperature.

110
Figure 5.6a. Change in the carbonyl absorption, 1740-1790 cm-1, with temperature on heating
Figure 5.6b. Change in the carbonyl absorption, 1740-1790 cm-1, with
temperature on cooling.
Abs
orba
nce
Wavenumbers (cm-1)
Wavenumbers (cm-1)
Abs
orba
nce

111
Figure 5.7. Change in intensity at 1759 cm-1 band with temperature on heating and cooling.
The carbonyl stretching band, centred at 1755 cm-1 was considered to be very broad. It changed
significantly in shape on crystallization, see Figure 5.8, narrowing by increasing in intensity at
1759 cm-1 and loosing intensity between1740-1750 and 1765-1780 cm-1. These changes are
reversed on melting and this was attributed to the presence of several overlapping peaks due to
conformer isomers as well as crystalline and amorphous bands. Accordingly the bands
obtained from amorphous and partially crystalline samples were analysed in order to assign
components present. The resolved bands are shown in Figures 5.9 for amorphous sample and
5.10 for a sample crystallized at 120 oC.
0.25
0.3
0.35
0.4
0.45
0.5
0.55
0 10 20 30 40 50 60 70 80 90 100 110 120 130 140 150 160 170 180 190 200 210
Ab
sorb
ance
TEMPERATURE (°C)
HEATING
COOLING
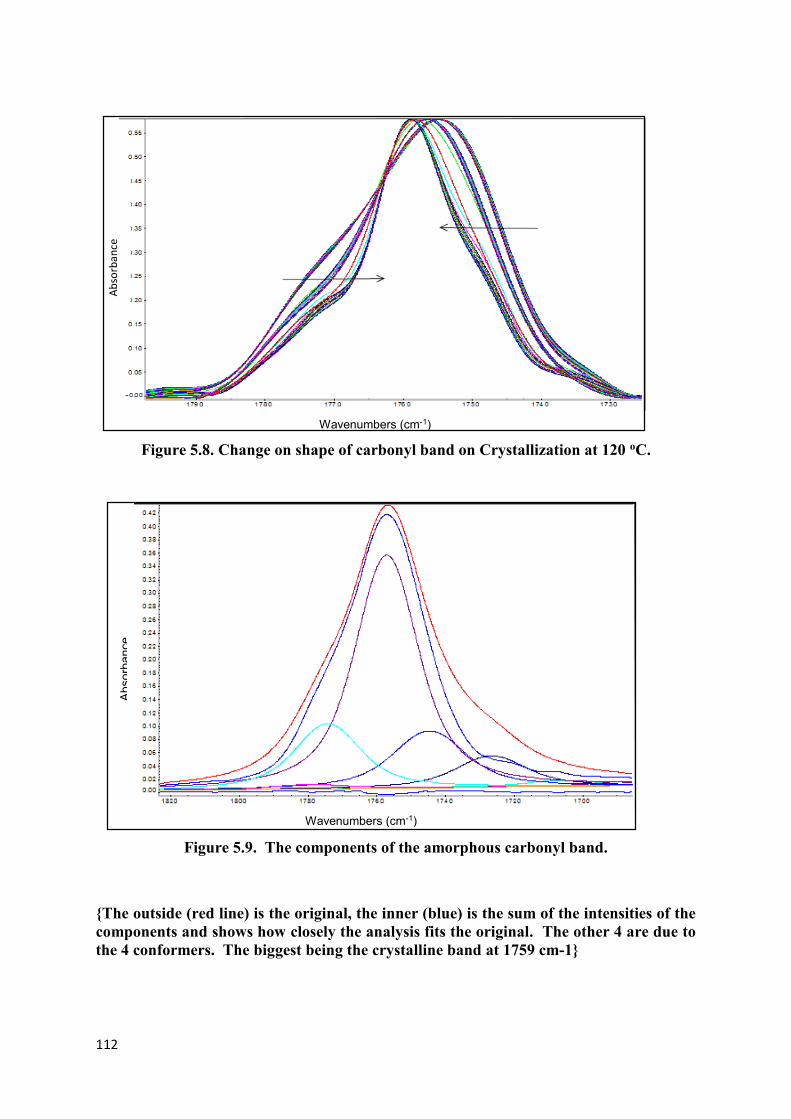
112
Figure 5.8. Change on shape of carbonyl band on Crystallization at 120 oC.
Figure 5.9. The components of the amorphous carbonyl band.
{The outside (red line) is the original, the inner (blue) is the sum of the intensities of the components and shows how closely the analysis fits the original. The other 4 are due to the 4 conformers. The biggest being the crystalline band at 1759 cm-1}
Ab
sorb
ance
Wavenumbers (cm-1)
Abs
orba
nce
Wavenumbers (cm-1)

113
The amorphous band exhibited four components at 1759, 1749, 1745 and 1725 cm-1, the two
highest of which have been attributed by Meaurio et al [129] to gt, and tt conformers. The two
lower bands were not observed although they decreased in intensity on crystallization. In
contrast, the crystalline absorption band exhibited three componnts at 1767, 1759, and 1749
cm -1 while there is an overall increased in intensity at 1759 cm-1. The 1767 cm-1 has been
attributed to gg conformer [129]. The increase in the component at 1759 and the decrease at
1749 cm -1 indicates that these components are a measure of the crystalline and amorphous
content during crystallization.
Figure 5.10. The components of the crystalline carbonyl band.

114
5.2.3. Changes in C-H stretching band at 1300-1500 cm-1 on heating and cooling
The CH3 bending and at 1384 cm-1 did not alter position or change in intensity with
crystallization or melting but it was sensitive to temperature, on heating or cooling. It appears
to be an excellent internal standard against which all other bands can be ratioed to correct for
any change in sample dimensions. By comparison the asymmetric C-H band at 1382 and
shoulder at 1390 cm-1 shifted to a single band at 1384 cm-1 on crystallization and this reversed
on melting but the intensity decreased linearly with temperature and was insensitive to changes
in crystallinity, see Figure 5.11a-b and 5.12.
The intensity of the band at 1360 cm-1 is fairly typical in that it is sensitive to crystallinity, see
Figure 5.13. It exhibits a step down at the glass transition temperature, 70 oC, and a rapid
increase as the sample crystallizes between 80 and 105 oC. The intensity decreases as the
temperature increases until it drops on melting. On cooling it continues at a low value until it
crystallizes below 105 oC.
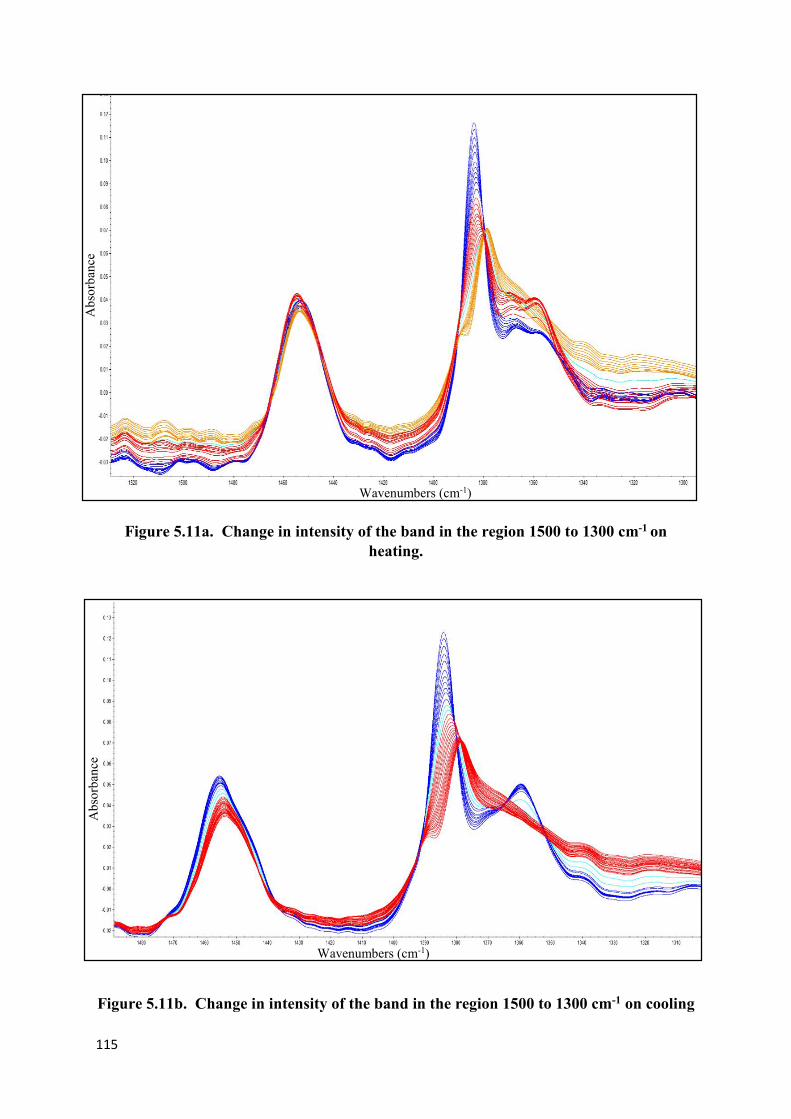
115
Figure 5.11a. Change in intensity of the band in the region 1500 to 1300 cm-1 on heating.
Figure 5.11b. Change in intensity of the band in the region 1500 to 1300 cm-1 on cooling
Abs
orba
nce
Wavenumbers (cm-1)
Wavenumbers (cm-1)
Abs
orba
nce

116
Figure 5.12. Change in intensity of the band at 1384 cm-1 on heating and cooling.
Figure 5.13. Changes in intensity of band at 1360 cm-1 on heating and cooling.
0
0.02
0.04
0.06
0.08
0.1
0.12
0.14
0.16
0 50 100 150 200 250
Ab
sorb
ance
Temperature (° C)
Heating
Cooling
0.025
0.03
0.035
0.04
0.045
0.05
0.055
0.06
0.065
0.07
0.075
0 50 100 150 200 250
Ab
sorb
ance
Temperature (° C)
Heating
Cooling
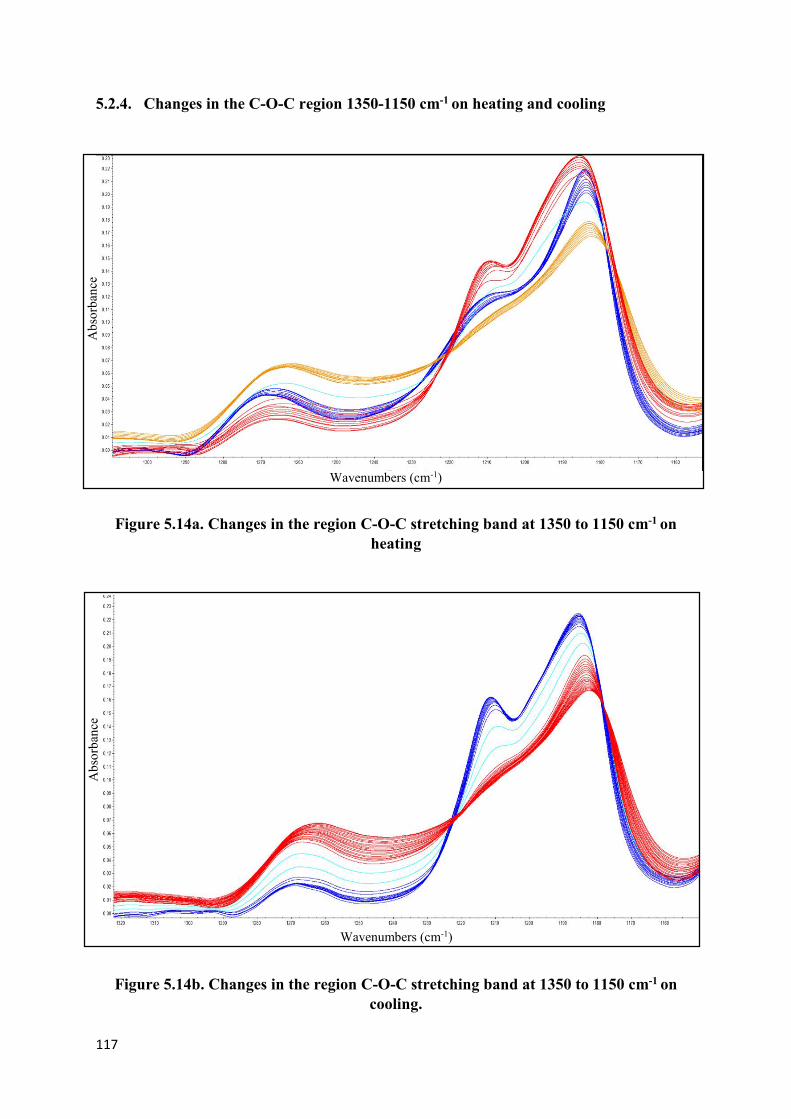
117
5.2.4. Changes in the C-O-C region 1350-1150 cm-1 on heating and cooling
Figure 5.14a. Changes in the region C-O-C stretching band at 1350 to 1150 cm-1 on heating
Figure 5.14b. Changes in the region C-O-C stretching band at 1350 to 1150 cm-1 on cooling.
Abs
orba
nce
Wavenumbers (cm-1)
Wavenumbers (cm-1)
Abs
orba
nce
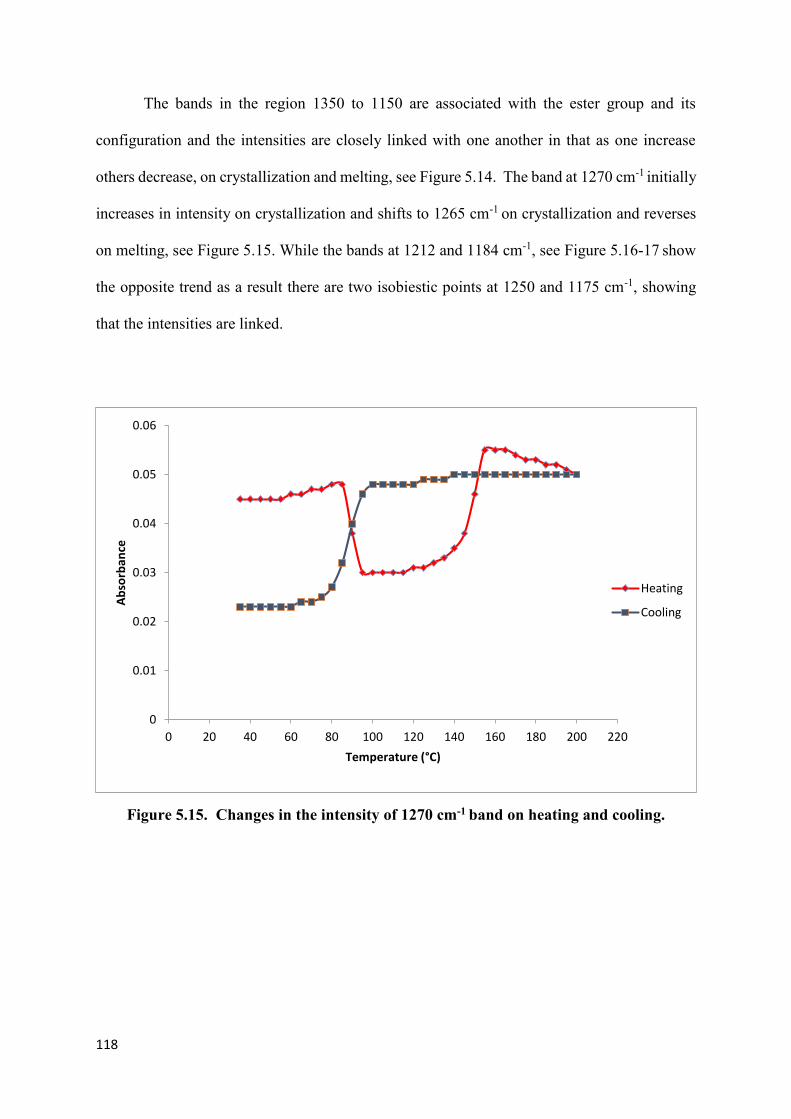
118
The bands in the region 1350 to 1150 are associated with the ester group and its
configuration and the intensities are closely linked with one another in that as one increase
others decrease, on crystallization and melting, see Figure 5.14. The band at 1270 cm-1 initially
increases in intensity on crystallization and shifts to 1265 cm-1 on crystallization and reverses
on melting, see Figure 5.15. While the bands at 1212 and 1184 cm-1, see Figure 5.16-17 show
the opposite trend as a result there are two isobiestic points at 1250 and 1175 cm-1, showing
that the intensities are linked.
Figure 5.15. Changes in the intensity of 1270 cm-1 band on heating and cooling.
0
0.01
0.02
0.03
0.04
0.05
0.06
0 20 40 60 80 100 120 140 160 180 200 220
Ab
sorb
ance
Temperature (°C)
Heating
Cooling

119
Figure 5.16. Changes in the intensity of 1212 cm-1 band on heating and cooling.
Figure 5.17. Changes in the intensity of 1184 cm-1 band on heating and cooling
0
0.02
0.04
0.06
0.08
0.1
0.12
0.14
0.16
0.18
0.2
0 50 100 150 200 250
Ab
sorb
ance
Temperature (°C)
Heating
Cooling
0.05
0.1
0.15
0.2
0.25
0.3
0 50 100 150 200 250
Ab
sorb
ance
Temperature (°C)
Heating
Cooling

120
5.2.5. Changes in the C-H region 1150-1000 cm-1 on heating and cooling.
Figure 5.18a. Changes in the region 1150 to 1000 cm-1 on heating.
Figure 5.18b. Changes in the region 1150 to 1000 cm-1 on cooling.
Wavenumbers (cm-1)
Abs
orba
nce
Abs
orba
nce
Wavenumbers (cm-1)

121
Figure 5.19. Changes in C-H deformation band at 1132 cm-1on heating and cooling.
Figure 5.20. Changes in C-H deformation band at 1090 cm-1on heating and cooling.
0.1
0.12
0.14
0.16
0.18
0.2
0.22
0 50 100 150 200 250
Ab
sorb
ance
Temperature (°C)
Heating
Cooling
0.15
0.17
0.19
0.21
0.23
0.25
0.27
0.29
0.31
0 50 100 150 200 250
Ab
sorb
ance
Temperature (°C)
Heating
Cooling

122
Similar changes were observed in the intensities of the C-H bands in this region on melting and
crystallization due to the appearance and disappearance of the bands on phase change which
enables the bands to be assigned to crystalline or amorphous regions, see Figure 5.18a-b. The
presence of an isobiestic point at 1130 cm-1 also indicates that the appearance of the band at
1135 cm-1 is associated with the disappearance of another at 1150 cm-1. All the other bands
change in intensity with temperature and on phase change. The changes in intensity for both
1132 and 1090 cm-1 were shown in Figure 5.19-20. Table 5.2 shows the change of peaks on
crystallization.

123
Table 5.2 Change of Peaks on Crystallization.
Wavenumber
cm-1
Amorphous
Wavenumber
cm -1
Crystalline
Temperature
Dependence of
the Absorbance
Change in
intensity on
Crystallization
Relative
Intensity
2999
2997
+ ve -ve m
2946
2944
+ve
-ve
m
2828
2828
+ve -ve w
1755
1759
-ve
+ ve
-ve
+ve
vs
1381
1384
-ve
-ve
sh
1360 1360 -ve +ve s
1310
1300
-ve
-ve
w
1210 1212 -ve +ve m
1266 1266 sh
1185 1188 s
1125
1132
-ve
-ve
+ve
+ve.
sh
1090 1190 -ve -ve s
1045 1045 sh
W weak; m medium; s strong ; vs very strong; sh shoulder. +ve increase; -ve decrease.

124
5.3. Conclusion
A somewhat complicated picture has emerged from the study on the change in the
spectra of Co-PLA on heating and cooling in that many of the absorption bands change their
position and intensities with temperature. This is usually linear with temperature and is
undoubtedly due to equilibrium between the gauche and trans conformers. Crystallization and
melting also results in configurational changes to the molecules and this is accompanied by a
step change in intensity. Only one band appears not to change on crystallization and to exhibit
only a linear change with temperature, such that it could be used as an internal standard. This
is the band at 1384 cm-1 but measurements must be made at a fixed temperature.
All further measurements on the FTIR spectrum of Co-PLA were made at constant temperature
in order to eliminate the change in intensity due to temperature differences.
Although the carbonyl band is complex due to the presence of 4 rotational isomer it is clear
that the one at 1759 cm-1 precisely follows the development of crystallinity and melting. It is
also the most intense band in the spectrum of Co-PLA. It was used in further isothermal
experiments to follow the development of crystallinity with time and derive the kinetic and rate
parameters.
125
Chapter 6. Hot Stage Microscopy of Co-PLA.
6.0. Introduction
Hot stage polarised light microscopy has been widely used to examine the development
of crystallization of polymers. Generally bulk polymers crystallize by the development of
spherical particles, called spherulites which have a characteristic Maltese cross birefringent
pattern in polarised light due to the spherical symmetry of the spherulites. This symmetry is
created by the growth of lamellar crystals which grow linearly with time along their length and
by regular branching into multiple lamellae produce spherical contours. The radii of the
spherulites grow linearly with time.
The variation of the radial growth rate of the spherulite and the nucleation density with
temperature, i.e. the number of spherulites per unit volume, are the two characteristic
crystallization parameters which are measure by light microscopy. These in turn can be related
to the Avrami crystallization rate parameter, Z as discussed before.
6.1. Dynamic runs on Co-PLA
The crystallization of Co-PLA was examined as thin films, 15-20 μm thick, placed
between glass cover slips and mounted horizontally in the hot stage of a polarized microscope
under a ¼ quartz plate. A partially crystalline sample was prepared by heating the sample from
30 °C to 180 °C at 30 °C min-1, cooled to 118 °C, held for 1 hour and then cooled to room
temperature. The sample then was heated to the melt and cooled to study any changes on
heating and cooling.
The micrographs are shown as a function of temperature in Micrographs 6.1. They are
typical of impinged multiple spherulites with a distinction Maltese cross birefringence but
variable nucleation density across the sample

126
A. On heating
35 °C 75 °C
155 °C 158 °C
160°C 165 °C
Scale used: 25 µm

127
B. On cooling
180 °C 110 °C
105 °C 95 °C
85 °C 75°C
Scale used: 25 µm
Micrographs 6.1. Birefringence changes on heating and cooling Co-PLA at 50 omin-1
from 30 to 180 oC.

128
No changes were observed in the birefringence on heating until above 150 oC and melting
appeared to occur between 160 and 165 oC from the disappearance of the spherulite. On
cooling at 50 oC min-1 crystallization did not occur but localised birefringent spherical particles
were observed from 110 oC down. Limited growth of these occurred and the original
birefringent pattern of multiple spherulites did not return at room temperature. Undoubtedly
the cooling rate was too high to allow crystallization to develop to any extent.
6.2. Effect of crystallization temperature on spherulite growth and nucleation
6.2.1. At 95 °C
The sample was melted at 180 oC, held for 2 minutes before being cooled at 50 oC min-1 to the
crystallization temperature. The number of spherulites and their diameters were measured with
time and the nucleation density and radial growth rate determined. The micrographs 6.2 show
the development of spherulites and their impingement with one another.

129
Scale used: 25 µm
Micrographs 6.2. Growth of the spherulite with time at 95 oC.
(objective lens X32 eyepiece lens X10
320X)
Nucleation Density = Number of spherulite / Volume
= 35 / (80µ X 120µ X 15µ) = 35 / 144000 = 2.4 x 10 -4 µm-3
= 240 x10-6 µm-3
Table 6.1. Growth of Spherulites (95 °C).
Time (s) Diameter (µm) 1600 9.0 2000 13.8 2800 20.4 3400 24.6
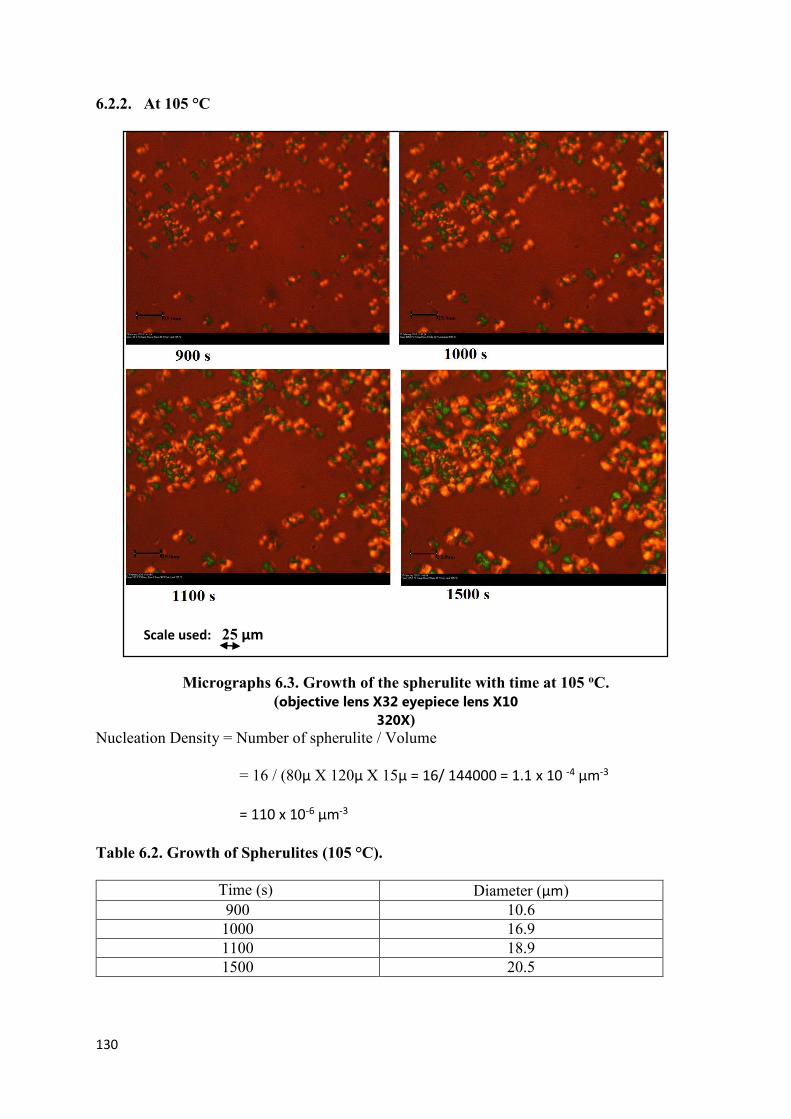
130
6.2.2. At 105 °C
Scale used: 25 µm
Micrographs 6.3. Growth of the spherulite with time at 105 oC.
(objective lens X32 eyepiece lens X10
320X) Nucleation Density = Number of spherulite / Volume
= 16 / (80µ X 120µ X 15µ = 16/ 144000 = 1.1 x 10 -4 µm-3
= 110 x 10-6 µm-3
Table 6.2. Growth of Spherulites (105 °C).
Time (s) Diameter (µm) 900 10.6 1000 16.9 1100 18.9 1500 20.5

131
6.2.3. At 118 °C
Scale used: 25 µm
Micrographs 6.4. Growth of the spherulite with time at 118 oC.
(objective lens X32 eyepiece lens X10
320X) Nucleation Density = Number of spherulite / Volume
= 6 / (80µ X 120µ X 15µ) = 6/ 144000 = 4.2 x 10 -5 µm-3
= 42 x 10-6 µm-3
Table 6.3. Growth of Spherulite (118 °C).
Time (s) Diameter (µm) 1500 23.2 2000 32.6 3000 50.9 3500 60.3

132
6.2.4. At 125 °C
Scale used: 25 µm
Micrographs 6.5. Growth of the spherulite with time at 125 oC. (objective lens X32 eyepiece lens X10
320X)
Nucleation Density = Number of spherulite / Volume
= 1 / (80µ X 120µ X 15µ) = 1/ 144000 = 6.9 x 10 -6 µm-3
= 6.9 x 10⁻⁶ µm-3
Since only one spherulite is in the field this is a minimum value and not representative of the
nucleation density.
Table 6.4. Growth of spherulite (125 °C).
Time (s) Diameter (µm) 1000 28.1 2000 76.5 3000 126.6 4000 174.6
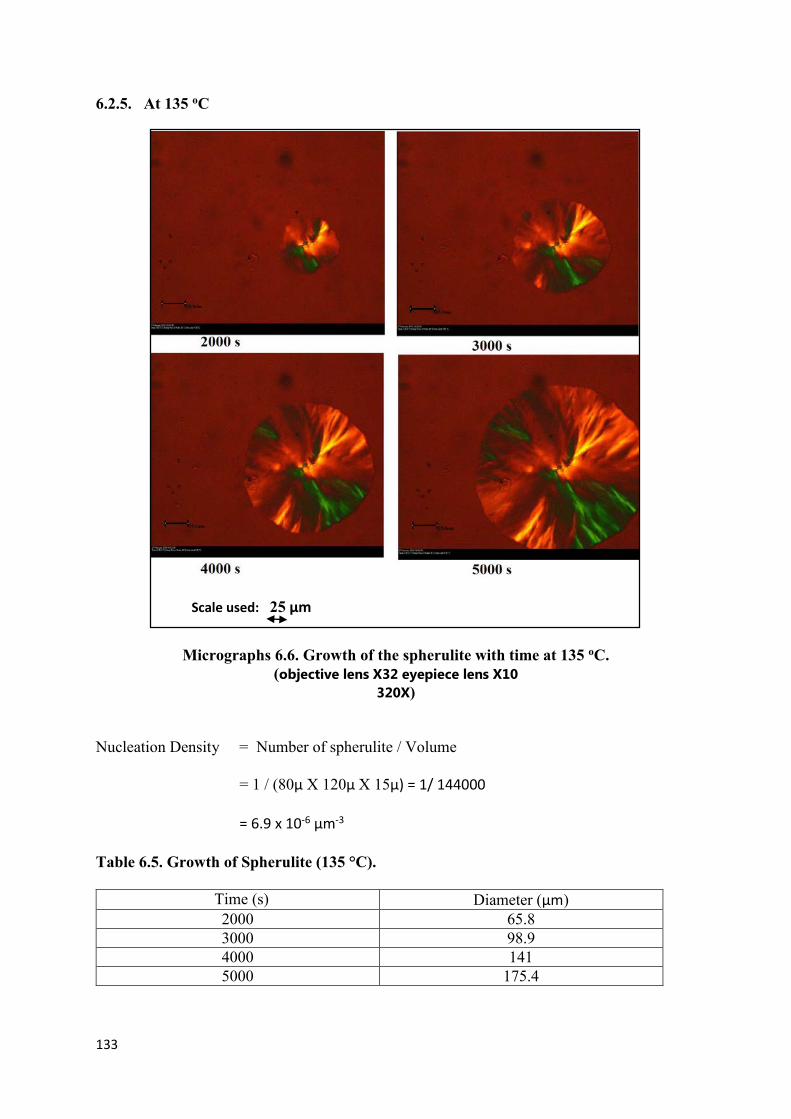
133
6.2.5. At 135 oC
Scale used: 25 µm
Micrographs 6.6. Growth of the spherulite with time at 135 oC.
(objective lens X32 eyepiece lens X10
320X)
Nucleation Density = Number of spherulite / Volume
= 1 / (80µ X 120µ X 15µ) = 1/ 144000
= 6.9 x 10⁻⁶ µm-3
Table 6.5. Growth of Spherulite (135 °C).
Time (s) Diameter (µm) 2000 65.8 3000 98.9 4000 141 5000 175.4

134
6.2.6. At 140 °C
Scale used: 25 µm
Micrographs 6.7 Growth of the spherulite with time at 140 oC. (objective lens X32 eyepiece lens X10
320X)
Nucleation Density = Number of spherulite / Volume
= 1 / (80µ X 120µ X 15µ)
= 1/ 144000
= 6.9 x 10 -6 µm-3
Table 6.6. Growth of spherulite (140 °C).
Time (s) Diameter (µm) 5000 56.6
10,000 127.4 15,000 208.8 17,500 252
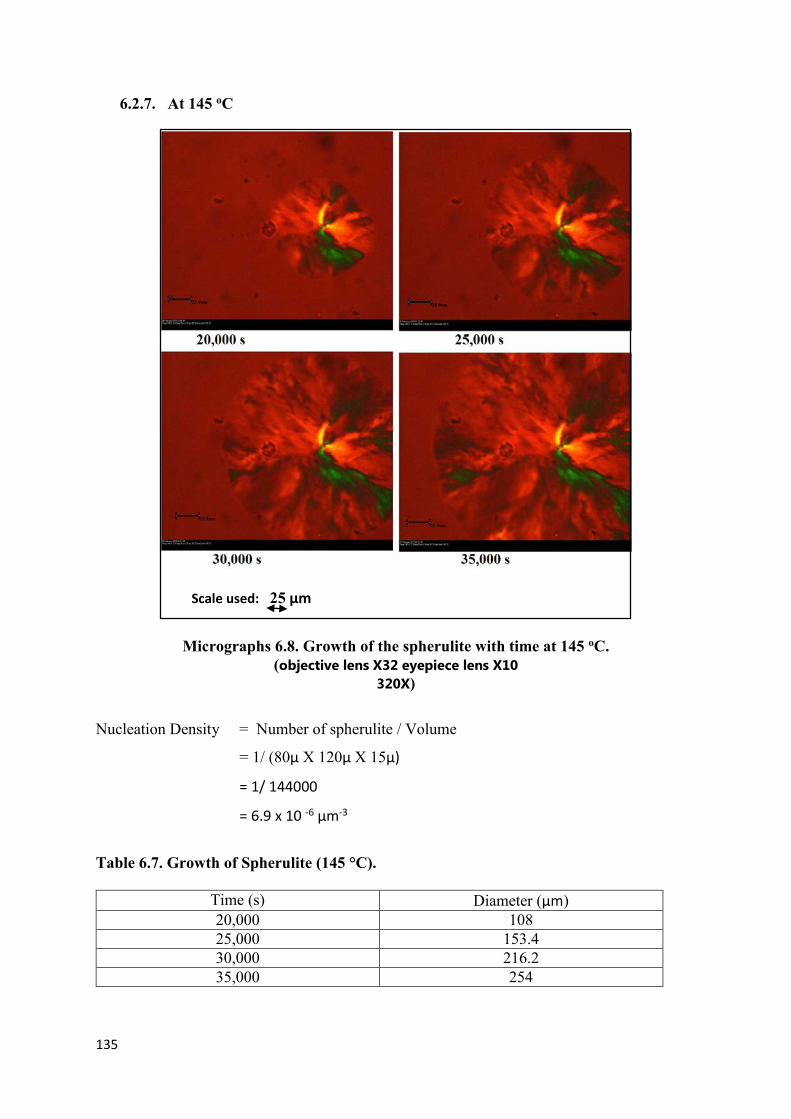
135
6.2.7. At 145 oC
Scale used: 25 µm
Micrographs 6.8. Growth of the spherulite with time at 145 oC.
(objective lens X32 eyepiece lens X10
320X)
Nucleation Density = Number of spherulite / Volume
= 1/ (80µ X 120µ X 15µ)
= 1/ 144000
= 6.9 x 10 -6 µm-3
Table 6.7. Growth of Spherulite (145 °C).
Time (s) Diameter (µm) 20,000 108 25,000 153.4 30,000 216.2 35,000 254
136
6.3. Discussion
As can be seen from Micrographs 6.2 to 6.4 the numbers of spherulites did not increase
with time at constant temperature and on average the spherulites at any crystallization
temperature and at the same time had very similar diameters, in that there are no very large or
very small ones present. This indicates that they were all nucleated at the same time and grew
to similar sizes. Nucleation was heterogeneous, perhaps on dust particles but there was an
induction time which increased with crystallization temperature, see Table 6.8. The
heterogeneous nucleation density, see Table 6.8 and Figure 6.9, also increased exponentially
with decreasing temperature – increasing with the degree of supercooling from the melting
point. This is consistent with the size of the critical size nucleus, or nucleating heterogeneous
particle, decreasing in size with decreasing temperature. This produced a larger number of
smaller spherulites at lower crystallization temperatures, compare Micrographs 6.2 to 6.5 with
6.6 to 6.8.
Table 6.8. Nucleation Characteristics.
Crystallisation Temperature
(°C) Nucleation Density (µm) -3
x 106 Induction Time
s 95 240 20 105 110 95 118 42 110 125 6.9 420 135 6.9 260 140 6.9 1500 145 6.9 8400

137
0
50
100
150
200
250
90 100 110 120 130 140 150
Nu
cle
ati
on
De
nsit
y /
Nu
mb
er
(
m)-3
x 1
06
Cystallization Temperature / oC
Figure 6.9. The decrease in nucleation density with temperature.
The nucleation density increased continuously with decreasing crystallization temperature, see
Figure 6.9 but was constant with time at each temperature, see Micrographs. There was no
decrease in nucleation density at low temperature due to increased viscosity as observed with
the growth rate, see Figure 6.9, such that no maximum nucleation density was observed but
instead it decreased continuously depending on the degree of supercooling from the
equilibrium melting point, ΔT, consistent with nucleation on heterogeneous particles which
decrease in size with decreasing crystallization temperature and increasing supercooling.
The diameters of the spherulites increased linearly with time from nucleation to impinging with
adjacent spherulites, see Figure 6.10 and the growth rates increased with temperature up to a
maximum at about 125 - 130 oC before decreasing to zero at the melting point. Table 6.9 and

138
and Figure 6.11 show the temperature dependence of the radial growth rate. This characteristic
bell shaped curve is due to two effects, viscousity control at low temperature due to the onset
of glass transition at 58.5 oC, and nucleation control at high temperature as the melting point is
approached and has been expressed by Hoffman and Lauritzen in the relationship [33-40].
v = vo exp(-U/R(Tc-T2)) exp (-K/Tc ΔT f) (6.1)
where v is the radial growth rate, vo a pre-exponential factor, U the activation energy of viscous
flow, Tc the crystallization temperature, T2 the thermodynamic glass transition temperature, ΔT
the degree of supercooling, R the gas constant and K the nucleation constant.
Figure 6.10. The increase in spherulite diameter with time at each crystallisation temperature.
0
50
100
150
200
250
300
0 5000 10000 15000 20000 25000 30000 35000 40000
Sph
eru
lite
dia
me
ter
(µm
)
Time (seconds)
95 °C
105 °C
118 °C
125 °C
135 °C
140 °C
145 °C

139
Table 6.9. The temperature dependence of the radial growth rate.
Crystallisation Temperature °C
Radial Growth rate / µm min-1
95 0.52 105 0.99 118 1.11 125 2.93 135 2.19 140 0.96 145 0.58
Figure 6.11. Temperature dependence of radial growth rate.
0
0.5
1
1.5
2
2.5
3
3.5
90 100 110 120 130 140 150
Gro
wth
rat
e (
µ m
inu
te-1
)
Crystallization Temperature, °C

140
4.5
5
5.5
6
6.5
7
7.5
8
8.5
2.8 3 3.2 3.4 3.6 3.8 4 4.2 4.4
ln (
g)
+ U
*/ R
(Tc -
T2)
1 / (Tc)(T
o
m - T
c) f x 10
5 K
-2
Figure 6.12. The dependence of the radial growth rate on the degree of supercooling.
From the plot of ln(g) +U/R(Tc-T2) against 1/Tc(Tmo-Tc), see Figure 6.12, K the nucleation
constant was determined to be 2.03 ± 0.50 x10⁵ K2. Since this covers the temperature range 95
to 145 oC which corresponds to a very high degree of supercooling, 60 to 120 oC, it must be
assumed that nucleation occurs in regime ll (see Chapter 7) and
Kll = 4bσσeTmo/ kΔHv (6.2)
Where b is the monomolecular layer thickness, σ and σe the side and fold surfaces free energies,
Tmo the equilibrium melting point, k Boltzmann constant and ΔHv the enthalpy of fusion per
unit volume. From the value of K determined from the slope of the linear relationship shown
in Figure 6.12 and the value for b and ΔHv listed by Garlotta [9] σσe was 617 erg2 cm -4 and σe
51.0 erg cm-2. This compares with 60.9 erg cm-2 adopted by using σ Garlotta for L-PLA.
141
6.4 Conclusion
Examination of the development of the spherulite diameters with time shows that only in
the initial stages of crystallization and with the lowest temperatures studied were the diameters
less than the film thickness of the film sample, 15-20 μm. Accordingly for most of the
crystallizations studied the spherulites grew as constant thickness discs and in terms of
heterogeneously nucleated discs the corresponding Avrami equation would have a n constant
value of 2.0.

142
Chapter 7. The Kinetics of Crystallization of Co-poly (lactic acid) measured by FTIR-TA spectroscopy.
7.0. Introduction
It was concluded in Chapter 4 that DSC did not have the necessary sensitivity to
measure the heat flow from isothermal calorimetry to measure the kinetics of crystallization of
Co-PLA. However, since FTIR spectroscopy measures the crystallinity directly from the
absorbance of a crystalline band and not the rate of crystallization it has the potential to measure
the kinetics directly from the change in absorbance. It only requires that sufficient time elapses
for a measurable change in the absorbance to have developed. Because absorbance is a direct
measure of the fractional crystallinity it has the potential to measure it over extended time
periods and in particular to measure the slower secondary crystallization, which has been
observed to develop with the logarithm of time.
Analysis of the IR spectrum of Co-PLA has shown that the carbonyl stretching band at 1759
cm-1 is the best vibrational band to study the kinetics of crystallization isothermally over a range
of temperature. At constant temperature any variation in absorbance is attributed to changes
due crystallinity.
This chapter is devoted to a study of the kinetics of crystallization of Co-PLA solution cast
films on to KBr discs.
7.1. Analysis of the crystallization data
Measurements of the absorbance of the 1759 cm-1 band were made on thin films of Co-PLA
cast from solution and mounted vertically in a hot-stage in the optical path of the spectrometer.
The samples were melted for 2 min at 200 o C before being cooled to the crystallization
temperature at 50 oC min-1. Measurements of absorbance were made over an extended period

143
up to 1000 minute in the temperature range 120-136 oC. The change in relative absorbance,
defined as (At -Ao)/(A∞-Ao) where Ao, At and A∞ are the absorbances initially, at time t and at
the end of the crystallization, with time at each temperature is shown in Figure 7.1.
Figure 7.1. Relative change in absorbance at 1749 cm-1 with time on crystallization.
The change in absorbance on crystallization, 0.25-0.30, was relatively constant; the difference
being due to different degrees crystallinity achieved. This is shown in Figure 7.2a. The change
in absorbance due to crystallization was analysed as follows;-
The absorbance observed initially, Ao, before crystallization had started, was constant and
attributed to an overlap of the broad amorphous band at 1750 cm-1 which decreased on
crystallization due to the reduction of the amorphous regions. Assuming a two component
124°C
128°C
120°C
132°C
136°C

144
system for the partially crystalline copolymer, the absorbance at time t, At, will have an
amorphous and crystalline component. If the fractional crystallinity is Xt then,
At = (1-Xt) Ao + XtAc (7.1)
Where Ac is the absorbance of a totally crystalline sample of the same thickness and the
fractional crystallinity is
Xt = (At –Ao) / (Ac - Ao ) (7.2)
Since Ao is unknown we adopt a relative crystallinity, X, relative to that achieved after the end
of the measurements, i.e. t∞ minute, defined as
X = Xt/ X∞ = (At – Ao) / (A∞ – Ao) (7.3)
Figure 7.2b shows the increase in relative crystallinity, X, with time.
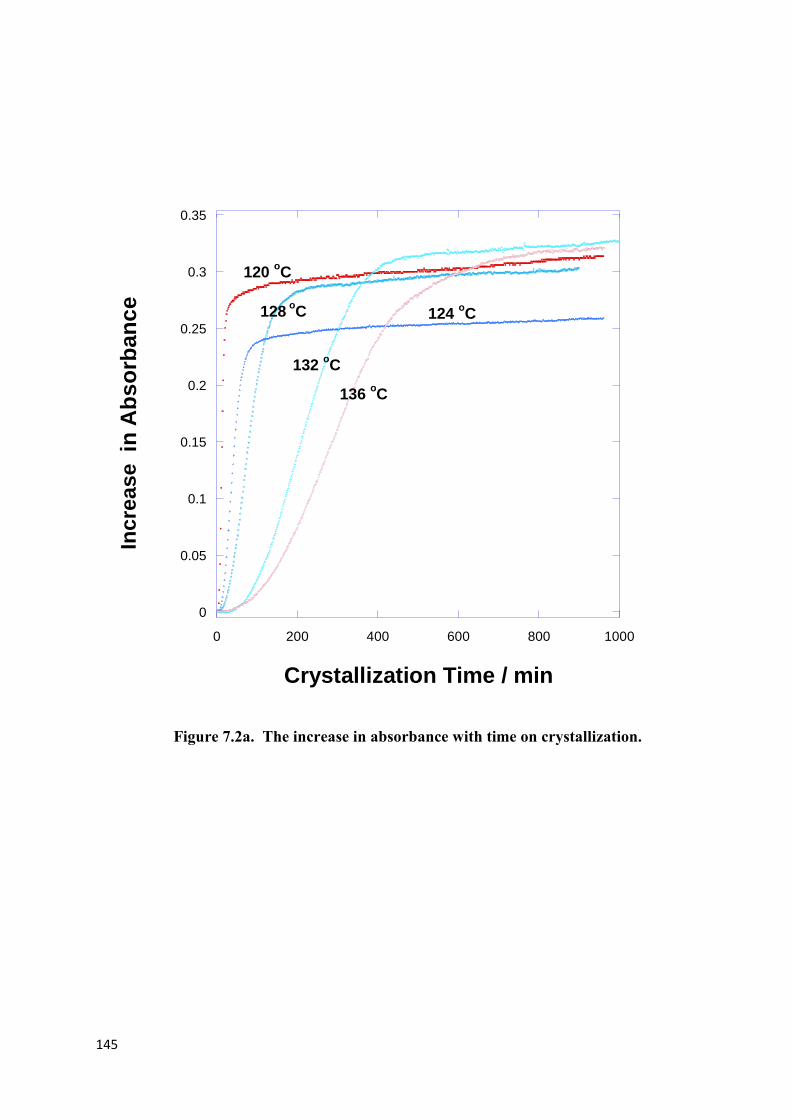
145
0
0.05
0.1
0.15
0.2
0.25
0.3
0.35
0 200 400 600 800 1000
Inc
rese i
n A
bs
orb
an
ce
Crystallization Time / min
120 oC
124 oC128
oC
132 oC
136 oC
Figure 7.2a. The increase in absorbance with time on crystallization.
Incre
ase

146
0
0.2
0.4
0.6
0.8
1
0 500 1000 1500
Re
lati
ve C
rys
tallin
ity
, X
.
Crystallization Time / min
136 oC
128 oC
132 oC
124 o
C
120 oC
Figure 7.2b. The increase in relative crystallinity, X, with time.
7.2. Analysis of the kinetics of the primary process
The relative crystallinity-time dependence over the initial part of the crystallization, the
primary process, was analysed using the Avrami equation, assuming that it ended at Xp,∞
Xp = Xp, ∞(1- exp( -Ztn)) (7.4)
where Xp is the relative crystallinity developed within the primary process, Z is a composite
rate constant incorporating nucleation characteristics and growth rate, t is time and n an integer
constant characteristic of the crystallization mechanism.

147
It follows that
log(-ln(1-(Xp/Xp,∞))) = n log (t) + log (Z) (7.5)
and plots of log(-ln(1-(Xp/Xp,∞))) against log (t) were linear with intercept of log (Z) and slope
n, see Figure 7.3. Xp, ∞ was used as an adjustable parameter and a value chosen which gave the
best linear fit to the data as determined by R2, see 7.4. Figure 7.5 and 7.6 show the plots of
log(-ln(1-(Xp/Xp,∞))) against log (t) for different temperature i.e 124 and 128 oC. The analysis
of time dependence of the primary crystallization is summarised in Figure 7.7 and the Avrami
rate parameters are listed in Table 7.1.
Using the best fit value of Xp,∞ the n values were fractional, about 2.5 ± 0.4, and as such were
inconsistent with the growth of disc for which a value of 2.0 or 3.0 was expected, depending
on nucleation being heterogeneous or homogeneous respectively. The inconsistency was
considered to lie in the assumption that secondary crystallization occurred towards the end of
the primary process and made no contribution to the relative crystallinity which developed
during the primary process.
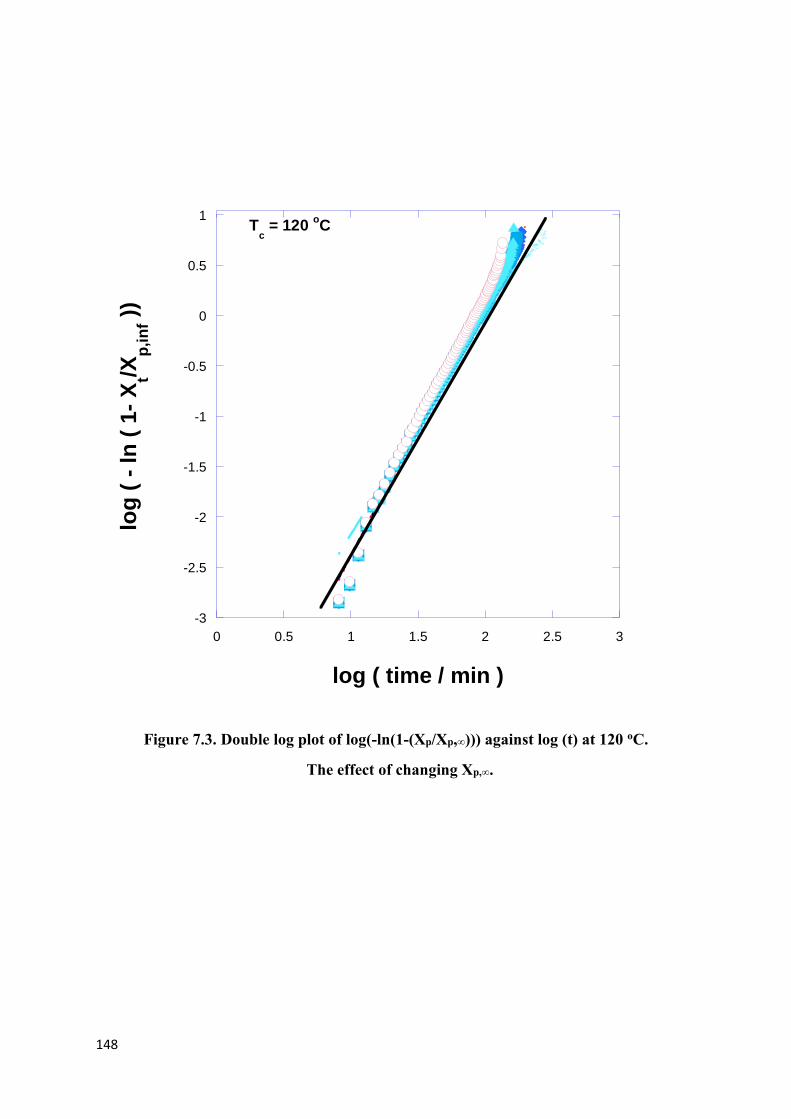
148
-3
-2.5
-2
-1.5
-1
-0.5
0
0.5
1
0 0.5 1 1.5 2 2.5 3
log
( -
ln
( 1
- X
t/Xp
,in
f ))
log ( time / min )
Tc = 120
oC
Figure 7.3. Double log plot of log(-ln(1-(Xp/Xp,∞))) against log (t) at 120 oC.
The effect of changing Xp,∞.

149
0.98
0.982
0.984
0.986
0.988
0.99
0.992
0.994
0.996
2.1 2.2 2.3 2.4 2.5 2.6 2.7 2.8
De
gre
e o
f F
it,
R2
n Value
Tc = 120
oC
Figure 7.4. The effect of changing Xp,∞. On the degree of fit.

150
-3
-2.5
-2
-1.5
-1
-0.5
0
0.5
1
0 0.5 1 1.5 2 2.5 3
log
( -
ln (
1 -
Xt/
Xp
,in
f ))
log ( time/ min )
Tc = 124
oC
Xp,inf
= 0.85X
p, inf = 0.95
Figure 7.5. Double log plot of log(-ln(1-(Xp/Xp,∞))) against log (t) at 124 oC.
The effect of changing Xp,∞.

151
-3
-2.5
-2
-1.5
-1
-0.5
0
0.5
1
0 0.5 1 1.5 2 2.5 3
log
( -
ln (
1-
Xt/X
p,in
f ))
log ( time / min )
Tc = 128
oC
Xp, inf
= 0.85
Xp,inf
= 0.0.95
Figure 7.6. Double log plot of log(-ln(1-(Xp/Xp,∞))) against log (t) at 128 oC.
The effect of changing Xp,∞..
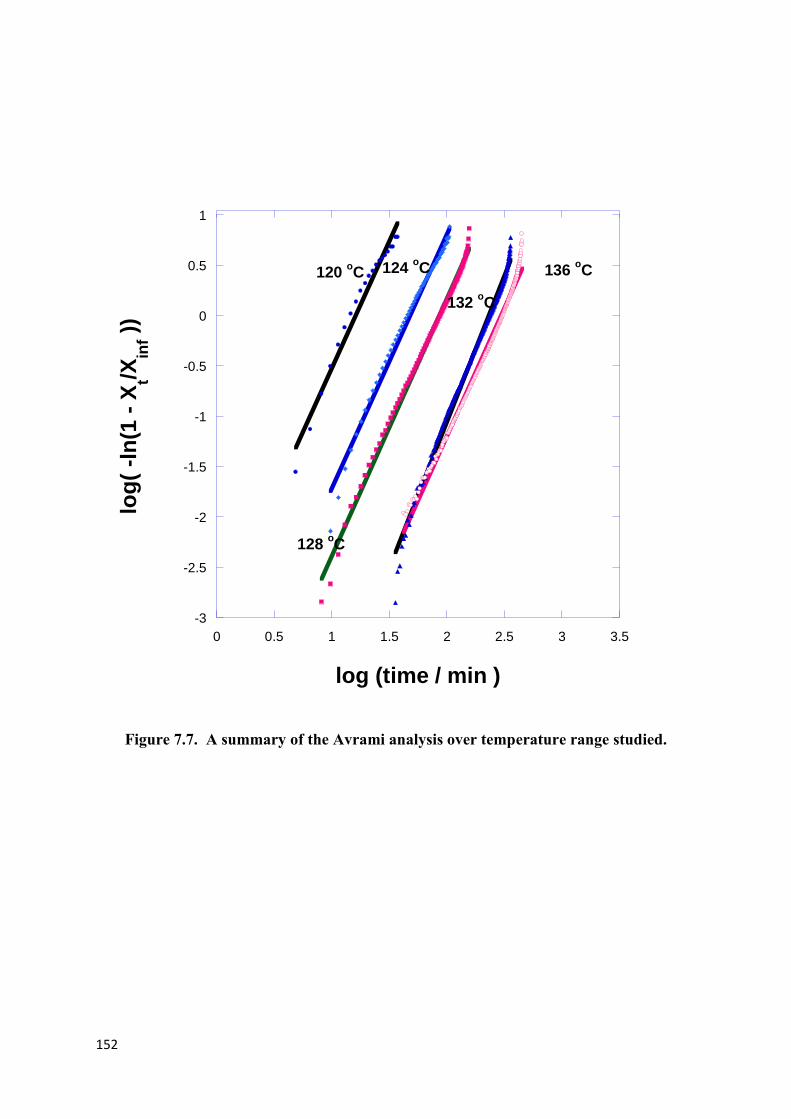
152
-3
-2.5
-2
-1.5
-1
-0.5
0
0.5
1
0 0.5 1 1.5 2 2.5 3 3.5
log
( -l
n(1
- X
t/Xin
f ))
log (time / min )
120 oC 124
oC
132 oC
128 oC
136 oC
Figure 7.7. A summary of the Avrami analysis over temperature range studied.
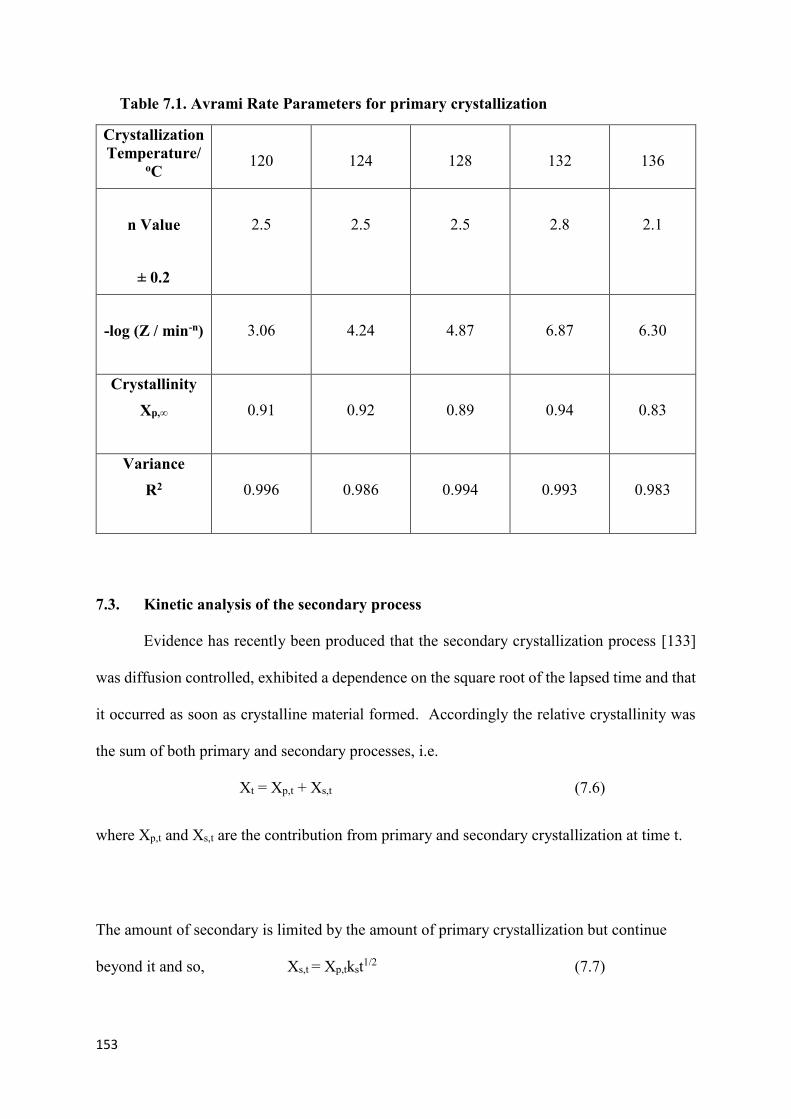
153
Table 7.1. Avrami Rate Parameters for primary crystallization
Crystallization Temperature/
oC
120
124
128
132
136
n Value
± 0.2
2.5
2.5
2.5
2.8
2.1
-log (Z / min-n)
3.06
4.24
4.87
6.87
6.30
Crystallinity Xp,∞
0.91
0.92
0.89
0.94
0.83
Variance R2
0.996
0.986
0.994
0.993
0.983
7.3. Kinetic analysis of the secondary process
Evidence has recently been produced that the secondary crystallization process [133]
was diffusion controlled, exhibited a dependence on the square root of the lapsed time and that
it occurred as soon as crystalline material formed. Accordingly the relative crystallinity was
the sum of both primary and secondary processes, i.e.
Xt = Xp,t + Xs,t (7.6)
where Xp,t and Xs,t are the contribution from primary and secondary crystallization at time t.
The amount of secondary is limited by the amount of primary crystallization but continue
beyond it and so, Xs,t = Xp,tkst1/2 (7.7)

154
This leads to Xt = Xp,∞( 1 –exp(-Ztn)(1 + kst1/2) (7.8)
for the dependence of the crystallinity with time.
Once the primary process is complete, and Xt> Xp,∞ then Xt is a linear function of t1/2 with
slope ks and intercept X,∞ since
Xt = Xp,∞(1 + kst1/2) (7.9)
This plot is shown in Figure 7.8 and rate parameters determined from it are listed in Table 7.2.
The values determined for Xp,∞ agree closely with those determined by the fit of the Avrami
equation and listed in Table 7.1 and although the rate constants do not vary much they tend to
increase with temperature which is inconsistent with a nucleation controlled process but
consistent with diffusion control.
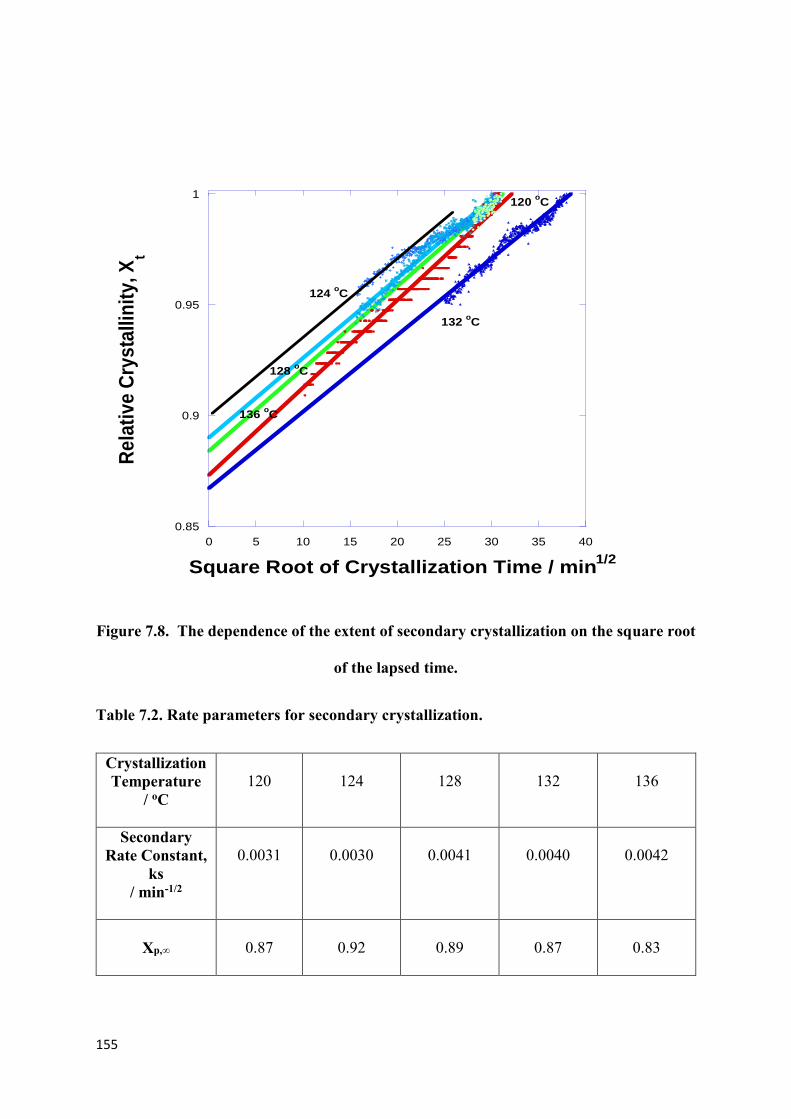
155
0.85
0.9
0.95
1
0 5 10 15 20 25 30 35 40
Re
lati
ve C
rys
tallin
ity, X
t
Square Root of Crystallization Time / min1/2
120 oC
124 oC
136 oC
132 oC
128 oC
Figure 7.8. The dependence of the extent of secondary crystallization on the square root
of the lapsed time.
Table 7.2. Rate parameters for secondary crystallization.
Crystallization Temperature
/ oC
120
124
128
132
136
Secondary Rate Constant,
ks / min-1/2
0.0031
0.0030
0.0041
0.0040
0.0042
Xp,∞
0.87
0.92
0.89
0.87
0.83

156
7.4. Fit of Crystallization data to equation 7.8
Equation 7.8 was derived assuming that primary and secondary crystallization occur
concurrently and the observed relative crystallinity at time t would not be expected to obey an
Avrami rate equation. Only the primary process follows such a dependence, since
Xt = Xp,∞( 1 –exp(-Ztn)(1 + kst1/2) (7.8)
The relative crystallinity due to the primary process which follows an Avrami equation is then,
Xp,t = Xp,∞( 1 –exp(-Ztn) = Xt /(1 + kst1/2) (7.10)
And a plot of log (-ln(Xt /(1+ kst1/2))) against log (t) will be linear with a slope of n and intercept
at t=1 of log(Z) if the primary process follows the time dependence of the Avrami equation.
Figure 7.9 shows such a plot for the crystallization at 136 oC, for which n was 1.99 ± 0.10.
The Avrami Rate parameters for the primary crystallization determined by this method are
shown in Table 7.3. In every case n was 2.0 ± 0.2 which is consistent with the growth of discs
confined to the thickness of the thin films and nucleated by heterogeneous nuclei as observed
previously by hot stage microscopy.
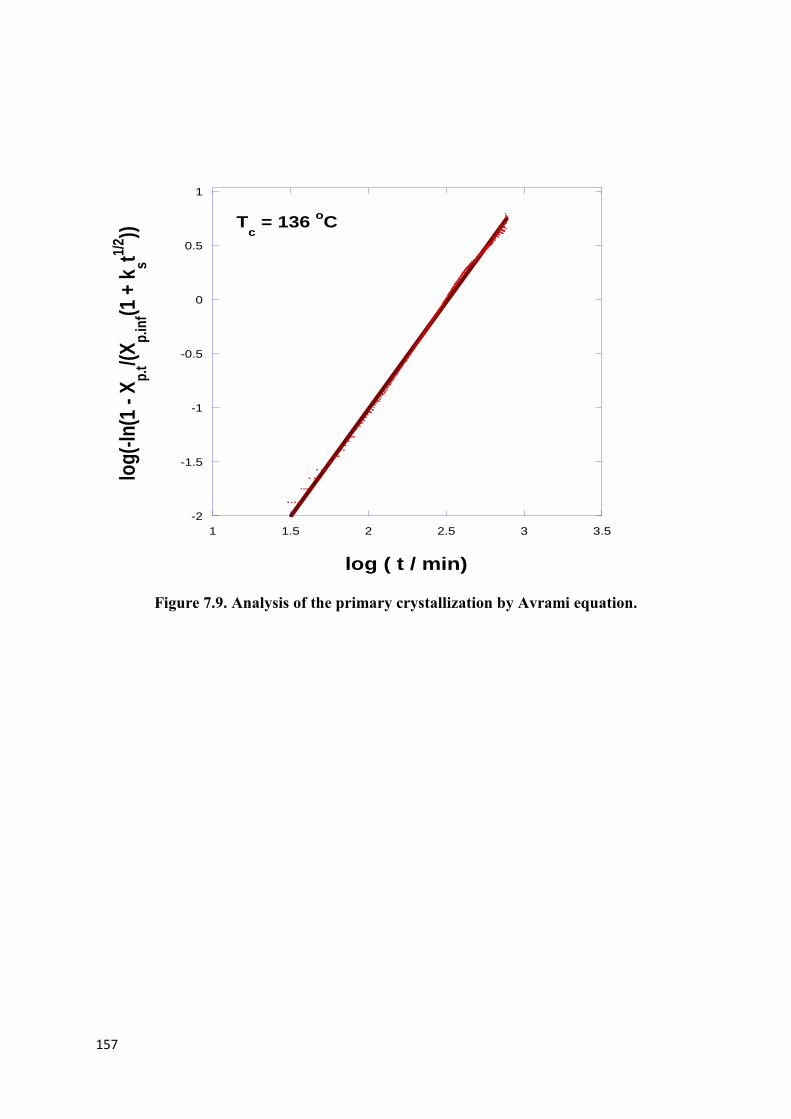
157
-2
-1.5
-1
-0.5
0
0.5
1
1 1.5 2 2.5 3 3.5
log
(-ln
(1 -
Xp
.t/(
Xp
.inf(1
+ k
st1/2))
log ( t / min)
Tc = 136
oC
Figure 7.9. Analysis of the primary crystallization by Avrami equation.

158
Table 7.3. The Avrami Crystallization Rate Parameters.
Crystallization Temperature /
oC
120
124
128
132
136
Xp,∞
0.87
0.92
0.89
0.87
0.83
Half-life
/ min
12
38
75
205
280
n Value
2.0
2.0
2.0
2.2
1.99
Z
/ min-2 x 10⁶
4440
479
123
15.7
8.84

159
0
0.2
0.4
0.6
0.8
1
0 500 1000 1500
Re
lati
ve C
rys
tallin
ity , X
t
Crystallization Time / min
136 oC
128 oC
132 oC
124 o
C
120 oC
Figure 7.10. Calculated (dots) and experimental (lines) relative crystallinity against time.
In order to confirm that eq. 7.8 was a valid description of the crystallization-time dependence
the relative crystallinity was calculated for each temperature using the rate parameters listed in
Tables 7.2 and 7.3. A comparison was made between the experimental and calculated data to
show that the equation was a reasonable fit to the overall time dependence of the
crystallizations in Figure 7.10. Good fits of the experimental data was obtained with little or
no variations observed between them. However, to highlight the differences between the two
curves, the calculated crystallinity was subtracted from the experimental and the difference was
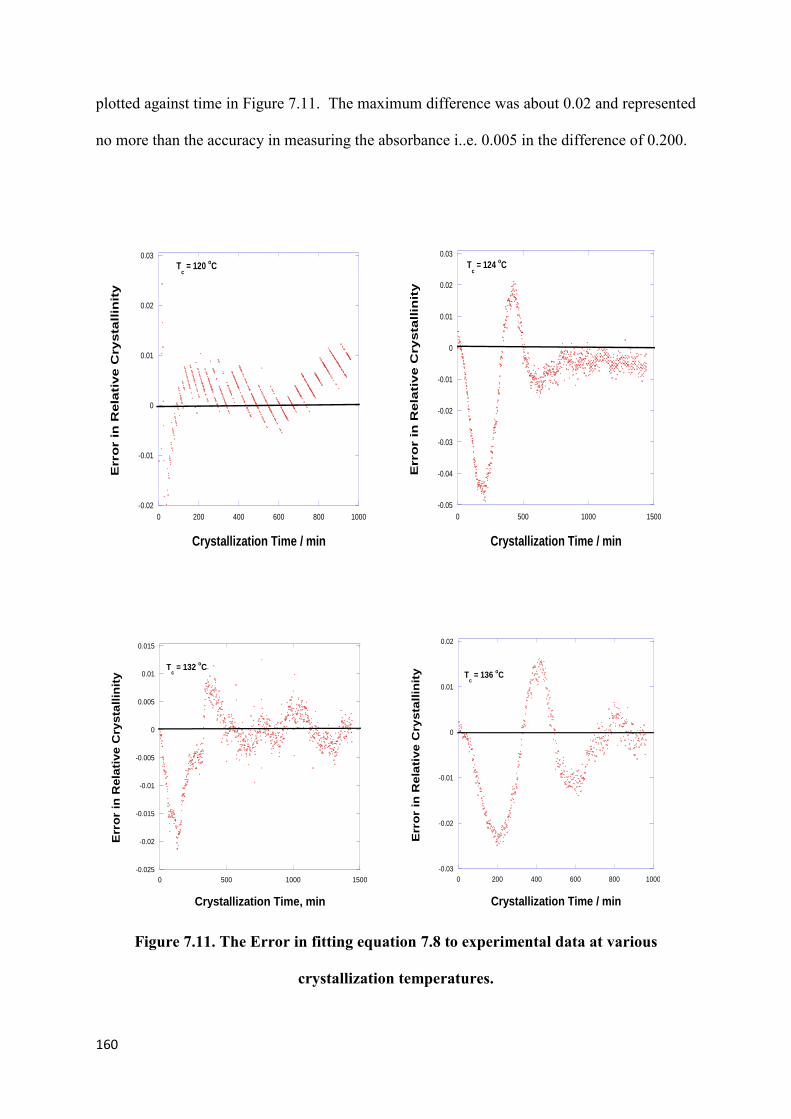
160
plotted against time in Figure 7.11. The maximum difference was about 0.02 and represented
no more than the accuracy in measuring the absorbance i..e. 0.005 in the difference of 0.200.
-0.02
-0.01
0
0.01
0.02
0.03
0 200 400 600 800 1000
Erro
r in
Rela
tive
Cry
sta
llin
ity
Crystallization Time / min
Tc = 120
oC
-0.05
-0.04
-0.03
-0.02
-0.01
0
0.01
0.02
0.03
0 500 1000 1500
Erro
r in
Rela
tive
Cry
sta
llin
ity
Crystallization Time / min
Tc = 124
oC
-0.025
-0.02
-0.015
-0.01
-0.005
0
0.005
0.01
0.015
0 500 1000 1500
Err
or
in R
ela
tive
Cry
sta
llin
ity
Crystallization Time, min
Tc = 132
oC
-0.03
-0.02
-0.01
0
0.01
0.02
0 200 400 600 800 1000
Err
or
in R
ela
tive
Cry
sta
llin
ity
Crystallization Time / min
Tc = 136
oC
Figure 7.11. The Error in fitting equation 7.8 to experimental data at various
crystallization temperatures.

161
The relative amount that the individual components of primary and secondary crystallizations
make to the overall relative crystallinity was also calculated from the rate parameters listed in
Tables 7.2 and 7.3 are shown in Figures 7.12 and 7.13. By comparison of the two figures it
can be seen that secondary crystallization makes a substantial contribution to the overall
crystallinity even in the initial stages of the crystallization, of the order of 10%, and this must
account for the increased n value observed on assuming the initial stages was due to primary
crystallization.
0
0.2
0.4
0.6
0.8
1
0 200 400 600 800 1000 1200 1400 1600
Rel
ativ
e P
rim
ary
Cry
stal
linity
, Xp,
t
Crystallization Time / min
136 oC
120 oC
132 oC
128 oC
124 oC
Figure 7.12. The contribution of primary crystallization to the overall relative
crystallinity

162
0
0.05
0.1
0.15
0 200 400 600 800 1000 1200 1400 1600
Re
lati
ve S
ec
on
da
ry C
rys
tall
init
y, X
s,t
Crystallization Time / min
136 C
132 oC
124 oC
120 oC
128 oC
Figure 7.13. The contribution of secondary crystallization to the overall relative
crystallinity.
7.5. The temperature dependence of primary crystallization
Unlike secondary crystallization primary crystallization slowed with increasing
temperature resulting in the half-lives increasing with temperature, see Figure 7.14. This is
consistent with nucleation control of the process and not diffusion as postulated for secondary
crystallization. Accordingly, Hoffman and Lauritzen’s theory of nucleation of polymer
crystallization was adopted to explain the temperature dependence,
v = vo exp(-U*/R(T-T2).exp(-K/Tc(ΔT f)) (7.11)
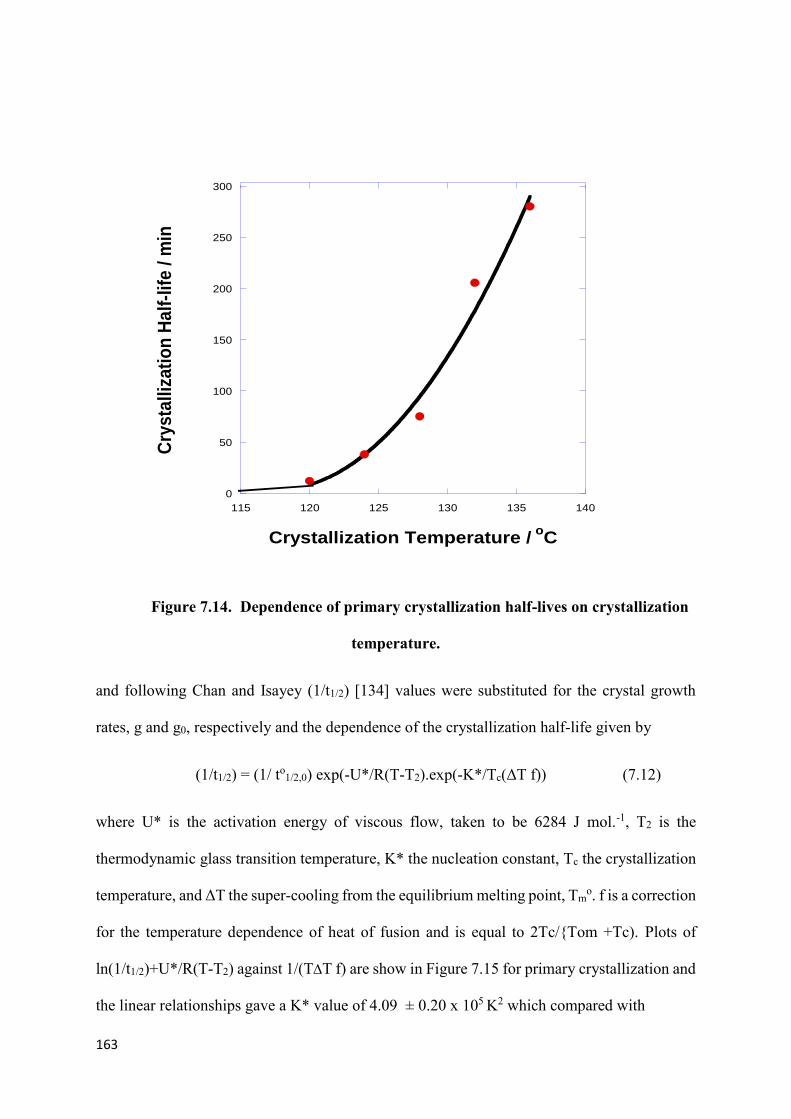
163
0
50
100
150
200
250
300
115 120 125 130 135 140
Cry
sta
lliz
ati
on
Ha
lf-l
ife
/ m
in
Crystallization Temperature / oC
Figure 7.14. Dependence of primary crystallization half-lives on crystallization
temperature.
and following Chan and Isayey (1/t1/2) [134] values were substituted for the crystal growth
rates, g and g0, respectively and the dependence of the crystallization half-life given by
(1/t1/2) = (1/ to1/2,0) exp(-U*/R(T-T2).exp(-K*/Tc(ΔT f)) (7.12)
where U* is the activation energy of viscous flow, taken to be 6284 J mol.-1, T2 is the
thermodynamic glass transition temperature, K* the nucleation constant, Tc the crystallization
temperature, and ΔT the super-cooling from the equilibrium melting point, Tmo. f is a correction
for the temperature dependence of heat of fusion and is equal to 2Tc/{Tom +Tc). Plots of
ln(1/t1/2)+U*/R(T-T2) against 1/(TT f) are show in Figure 7.15 for primary crystallization and
the linear relationships gave a K* value of 4.09 ± 0.20 x 10⁵ K2 which compared with

164
2.03 ± 0.50 x 10⁵ K2 determined previously from the temperature dependence of the spherulitic
growth rates see chapter 6. Since the nucleation constant in regime l is exactly twice that in
regime ll we deduce that the measurements differ in being measured in the two different
regimes; the high temperature measurements in Regime l and lower in Regime ll
For the crystallization to occur in Regime 1 then
Kl = 2Kll = 4bσσe Tmo /k ΔHv (7.13)
Where b is the monomolecular layer thickness determined from the crystallographic
dimensions of the unit cell, σ the surface free energy of the side of the lamellae, σe the fold
surface free energy, k the Boltzmann constant and ΔHv the enthalpy of fusion per unit volume.
Tmo is the equilibrium melting point of Co-PLA.
Using the values for these constants listed by Garlotta, [9] σ.σe was determined to be 630 ± 30
erg2 cm-4, which compares with values of 700 to 750 erg2 cm-4 for PLA, [9]. Using the accepted
value for σ of 12.0 erg cm-2 the fold surface energy was 52.5 ± 2.6 erg cm-2 and this compares
with values for similar polymers of 54.9 erg cm-2 for poly (є –caprolactone) and 76.0 erg cm-2
for PET [135].

165
Figure 7.15. Nucleation control of primary crystallization after Hoffman and
Lauritzen.
7.6. Conclusions
The absorbance of the carbonyl stretching band at 1759 cm-1 is a relative measure of
the crystallinity of Co-PLA and is sufficiently accurate to measure the kinetics of the
conversion for extended periods. However, because of the breadth of the amorphous band it
was not possible to separately determine the amorphous and crystalline bands and the fractional
crystallinity could not be determined without measuring it by some other means, e.g. from the
heat of fusion. Both primary and secondary crystallizations have been measured over 1000
min which allowed detailed analyses of their time dependence over an extended period.

166
Primary crystallization exhibited an exponential dependence on time following an Avrami
equation while secondary crystallization increased in crystallinity with the square root of the
lapsed time. The rate constant increased with increasing temperature and so the process was
considered to be diffusion controlled.
Assuming that secondary crystallization occurred towards the end of the primary gave Avrami
exponents with constant fraction n values which have no significance in terms of Avrami’s
adopted crystallization models but assuming that it occurred as soon as crystallization started
gave n values of 2.0 ± 0.2 which was consistent with growth of predetermined discs, as
observed by examination of the samples by light microscopy. Although primary crystallization
dominates the crystallization in the early stages secondary crystallization increases the overall
crystallinity sufficiently to increase the n value determined above that expected for the model.
The half-lives of the primary crystallization increased with increasing temperature consistent
with a nucleation controlled process. Analysing with Hoffman and Lauritzen’s model of
nucleation growth allowed a value of σσe to be determined, which compared favourably with
the literature values for PLA. This enabled the free energy of the fold surface, σe, to be
estimated for future consideration.
167
Chapter 8. A Summary of the Experimental Results.
8.1 Outcomes and Discussions.
In Chapters 3 to 7 different aspects of the behaviour of the copolymer of poly (L-lactic
acid) with 4% D-isomer have been studied and in this penultimate chapter an attempt has been
made to draw the various conclusion together in some sensible order.
In chapter 3 experimental procedures were developed to follow the time dependence of
crystallinity over extended periods of time using DSC but the isothermal crystallization rates
were too slow for direct measurements. Use of a laboratory oven to develop samples with a
range of crystallinity proved ineffective because of the problems in transferring samples from
the oven to the DSC to measure the degree of crystallinity. An indirect method of measuring
the development of crystallinity in the DSC by measuring the heat of fusion was less than
satisfactory as the experimental accuracy was not acceptable, ± 5%. As a result other
experimental methods to explore the kinetics of crystallization were explored.
However, melting studies showed that the m.pt. increased with time from the onset of
isothermal crystallization and also with temperature. This was in-line with Hoffman and
Week’s nucleation theory of crystal growth and consistent with the lamellar crystals increasing
in thickness with increasing temperature. Analyses of the dependence of the m.pt. on
crystallization temperature gave a value of 205 ± 2 oC for the equilibrium melting point of Co-
PLA of 207±2.0 °C in good agreement with the finding of others on PLLA. It was also been
observed that the melting point at constant temperature increased throughout the
crystallization, from the beginning to the end, in line with the secondary crystallization co-
existing together with the primary process.

168
However, by controlling the cooling rate of the sample from the melt it was possible to study
the effect of the degree of crystallinity on the glass transition temperature, and by forming
standard glasses measure their enthalpic relaxation using DSC. The subject of Chapter 4 is
accordingly the glass transition of the copolymer and its enthalpic relaxation using well
developed procedures adopted for DSC. Two types of behaviour were observed in which at
high cooling rates above 10o C min-1 the Tg increased with increasing cooling while at very low
rates of cooling 5o C min -1 and below the Tg increased with decreasing cooling rates. Cooling
rate was the dominant factor in determining the value of Tg of amorphous, but at the slower
rates crystallinity determined the Tg, and the degree of crystallinity had a pronounced effect.
With amorphous samples enthalpic relaxation on standard glasses developed following the
Williams-Watt kinetics with a β value of 0.27±0.04 in good agreement with the literature on
the copolymers in that the value decreased with the D-isomer content. Since β is a measure of
the inverse breadth of the relaxation spectrum the comonomer content is increasing the breadth
of the spectrum by producing more rotational modes in the relaxation spectrum.
Due to the failings of DSC in not having sufficient sensitivity to measure the crystallization
kinetics of Co-PLA and FTIR-TA was used. In Chapter 5 the change in the spectrum of Co-
PLA on heating and cooling to determine the phase changes occurring with temperature; in this
way it was shown that the carbonyl band was sensitive to chain configuration and a crystalline
band could be separately measured.
The isothermal crystallization kinetics of Co-PLA was measured in the temperature range from
120 to 136 °C from the change in absorbance of the carbonyl band at 1759 cm-1 and the change
in relative crystallinity determined over 1000-2000 min which enabled the secondary to be
separated from the primary process, in Chapter 7. The relative crystallinity-time data was
analysed using modified Avrami equations assuming firstly that the primary and secondary
crystallizations could be separated by their different time dependences, and secondly assuming

169
that the two co-existed together from the start of the crystallization but at the end the secondary
process continued in the absence of the primary following a dependence on the square root of
the lapsed time. Analysis of the data by the first method gave fractional n values which had no
meaning in terms of the models adopted by Avrami. The second method fitted the kinetic data
well and enabled the rate parameters of the two processes to be separately determined.
The study also shows that although the primary crystallization dominated the crystallization in
the early stage, the secondary crystallization increased the overall crystallinity and this was
sufficient to account for the increased fractional values of n. The analysis correcting for the
increased crystallinity due to the secondary process could be fitted to an Avrami equation with
n value equal to 2.00, consistent with the growth of disc spherulites in thin films as observed
by hot-stage microscopy.
Hot stage polarised light microscopy was used to measure the radial growth rates and
nucleation densities of thin films of co-PLA from 95 to 145 oC, in Chapter 6. The number of
spherulites in the field of view did not increase with time at any temperature and since the
spherulites had very similar diameters it was concluded that nucleation was heterogeneous.
The nucleation density increased with increasing degree of supercooling but the growth rates
increased with decreasing temperature, reached a maximum at about 120 oC and then decreased
to zero at the glass Transition. The growth rates observed the characteristics bell shaped curve
that has accounts for by Hoffman and Lauritzen relationship in terms of viscosity control at
low temperature due to onset of glass transition and nucleation control at temperatures close to
the melting point. Hoffman and Lauritzen’s model for secondary nucleation of growth gave a
value for the nucleation constant value of 2.03 ± 0.50 x10⁵ K2. This enabled σσe to be measured,
which compared favourably with the literature value for PLLA.

170
Chapter 9. Conclusion and Future Work
9.1 Conclusions.
● Co-PLA is slow to crystallize. The equilibrium melting point was 205 oC.
● Glass transition temperature varied with the cooling rate; faster cooling increased Tg and
produced amorphous glasses; slower cooling increased Tg and produced more crystalline
material.
● Amorphous glasses underwent enthalpic relaxation obeying the Williams-Watt relationship
with a β value of 0.27 and activation energy of 0.4 ± 0.2 MJ mol-1.
● The enthalpic relaxation of partially crystalline glasses confined to the amorphous regions
was reduced in line with the change in Δcp(Tg),
● Infra-red spectrum of Co-PLA was sensitive to chain configuration and conformation and
changed on heating or cooling and on crystallization and melting
● Intensity of the carbonyl band at 1759 cm-1 followed the degree of crystallinity and could be
used over extended periods to measure crystallization kinetics.
● Crystallization occurred by the growth of heterogeneously nucleated spherulites whose radii
grew linearly with time until they impinged with neighbouring ones. The spherical particles
became discs early in the crystallization as the diameters approached the film thickness.
● Deviations in the crystallization kinetics were attributed to presence of secondary
crystallization, such that the development of crystallinity with time followed the equation,
Xt = Xp ,∞( 1 – exp (-Ztn) ( 1+ kst1/2)
● Crystallization mechanism was interpreted as growth of heterogeneous disc spherulites
which grew obeying an Avrami equation with n=2.0 along with a secondary process by which
the lamellae thickened with a rate proportional to the square root of time.

171
9.2. Future Work
FTIR-TA has been successfully applied to a study of the crystallization kinetics of a
polyester over extended time periods with sufficient accuracy to test the validity of the Avrami
equation, and in particular eliminate the embarrassment of fractional constant n values. This
has been attributed to the presence of a secondary process which develops from the initial onset
of crystallization and increases the crystallinity over that predicted by the Avrami equation. It
would be interesting to extend this study to other polymer systems which have previously been
shown to exhibit fractional n values to determine if this is a general solution of the problem or
is it specific to this system alone.
It would be interesting to extend this approach to other polymer system, such as PEEK and
PEK which contain carbonyl groups, and other polymers which do not contain carbonyl group
to see if it is more generally applicable, e.g. polyethylene, polyethylene oxide etc. All these
systems have been observed to exhibit fractional n values when their crystallization data has
been analysed by the Avrami equation. It would confirm or otherwise that the conclusions on
the secondary crystallization process was more generally applicable to the crystallization of
polymers.
Similar rate measurements should also be carried out on D and L-PLA and their copolymers
with the D:L lactide in order to determine the effect of chain irregularities on crystallization
behaviour. This will confirm the effect of rejection of chain irregularities on these properties.
It would also be useful to measure the mechanism of secondary crystallization by direct
observation of the thickening mechanism and measurement of the time dependence of the
thickness in order to confirm the square root dependence on time. Hot stage ATM or
Environmental SEM on thin polymer films would appear to be an obvious technique for such
a study. Direct measurements of the growth rate will enable the nucleation constant to be

172
determined and directly measure the lateral surface energy term, σ, which has previously been
determined indirectly.

173
References
[1] Mirinae K, Cheol L. S and Jeong Y. G, Influences of physical aging on enthalpy
relaxation behaviour, gas permeability, and dynamic mechanical property of
Polylactide films with various D-isomer contents, Macromol. Res., 8(4), 2010, p 346-
351.
[2] Lunt. J, Large-scale production, properties and commercial applications of polylactic
polymers, Polym. Degrad. Stabil., 59(1-3), 1998, p 145-152.
[3] Drumright R. E, Gruber P. R and Henton D. E, Polylactic Acid Technology, Adv.
Mater., 12(23), 2000, p 1841-1846.
[4] Tsuji H, in Polyesters III Applications and Commercial Products, Doi Y and
Steinbuchel A, Eds., Wiley-VCH, Weinheim, 4, 2002, p.129-177.
[5] Jung H. J, Ahn K. D, Han D. K, and Ahn D. J, Surface characteristics and fibroblast
adhesion behavior of RGD-immobilized biodegradable PLLA films, Macromol. Res.,
13(5), 2005, p 446-452.
[6] Park H. M, Lee K. Y, Lee S. J, Park K. E and Park W. H, Macromol. Res., Plasma-
treated poly(lactic-co-glycolic acid) nanofibers for tissue engineering, 15(3), 2007, pp
238-243.
[7] Soppimath K. S, Aminabhavi T. M, Kulkarni A. R, and Rudzinski W. E,
"Biodegradable polymeric nanoparticles as drug delivery devices," Journal of
Controlled Release, 70(1-2), 2001, p 1-20.
[8] Guarino V, Causa F, Taddei P, Di Foggia M, Ciapetti G, Martini D, "Polylactic acid
fibre reinforced polycaprolactone scaffolds for bone tissue engineering," Biomaterials,
29(27), 2008, p 3662-3670.
174
[9] Garlotta D, "A Literature Review of Poly(Lactic Acid)," Journal of Polymers and The
Environment, 9(2), 2001, p 63-84.
[10] NatureWorksLLC. (2013). How Ingeo Is Made. Available:
http://www.natureworksllc.com/TheNIngeoNJourney/EcoNProfileNandNLCA/HowN
Ingeo is Made.
[11] Groot W, Krieken J. V, Sliekers O and De Vos S, "Production and Purification of Lactic
Acid and Lactide," in Poly(lactic acid) Synthesis, Structures, Properties, Processing,
and Applications, R. Auras, L.-T Lim, S. E. M Selke, and H. Tsuji, Eds, Ed New Jersey:
Wiley, 2010.
[12] Todo M, Park S. D, Takayama T, and Arakawa K, "Fracture micromechanisms of
bioabsorbable PLLA/PCL polymer blends," Engineering Fracture Mechanics, 74(12),
2007, p 1872-1883.
[13] Ahmed J, Zhang J. N. X, Song Z and Varshnet S. K, "Thermal Properites of
Polylactides: Effect of molecular mass and nature of lactide isomer,"Journal of Thermal
Analysis and Calorimetry, 95(3), 2009, p 957-964.
[14] Lim L. T, Auras R and Rubino M, "Processing technologies for poly(lactic acid),"
Progress in Polymer Science, 33(8), 2008, p 820-852.
[15] Mihai M, Huneault M. A and Favis B. D, "Crystallinity development in cellular
poly(lactic acid) in the presence of supercritical carbon dioxide,"Journal of Applied
Polymer Science”, 113(5), 2009, p 2920-2932.
[16] Baratian S, Hall E. S, Lin J. S, Xu R and Runt J, "Crystallization and Solid-State
Structure of Random Polylactide Copolymers, A Poly(l-lactide-co-d-lactide)s,"
Macromolecules, 34(14), 2001, p 4857-4864.
[17] Kolstad J. J "Crystallization kinetics of poly(L-lactide-co-meso-lactide),"Journal of
Applied Polymer Science, 62(7), 1996, p 1079-109.

175
[18] Averous L and Pollet E, "Biodegradable Polymers," in Environmental Silicate Nano-
Biocomposites, Averous L and Pollet E, Eds., ed, London: Springer, 2012.
[19] Martin O and Averous L, "Poly(lactic acid): plasticization and properties of
Biodegradable multiphase systems," Polymer, 42(14), 2001, p 6209-6219.
[20] MacDonald R. T, McCarthy S. P and Gross R. A, "Enzymatic Degradability of
Poly(lactide): Effects of Chain Stereochemistry and Material Crystallinity,"
Macromolecules, vol. 29(23), 1996, p 7356-7361.
[21] Wentao Z, Yoorim K, Wenli Z, Anson W and Chul B. Park, A Study of the
Crystallization, Melting, and Foaming Behaviors of Polylactic Acid in Compressed
CO2, Int. J. Mol. Sci., 10(12), 2009, p 5381-5397.
[22] Dyson R. W, Specialty Polymers (1998), 2nd ed. London: Blackie Academic &
Professional.
[23] http://plc.cwry.edu/tutorial/enhanced/files/polymers/orient/orient.htm, (polymer
Marphology).
[24] Linda C. Sawyer, David T. Grubb, Gregory F. Meyers, Polymer microscopy, 2008.
[25] Cowie J. M. G, Polymers: chemistry and physics of modern materials. 2nd ed. London,
1991: Blackie Academic & Professional.
[26] Day M, Deslandes-Y, Roovers, J and Suprunchuk, Effect of molecular weight on the
crystallization behaviour of poly(aryl ether ether ketone): a differential scanning
calorimetry study. Polymer, 32(7), 1991, p 1258-1266.
[27] Cheng S. Z. D, Cao M. Y and Wunderlich, B, Glass Transition and melting behaviour
of Poly (oxy-1,4-phenyleneoxy-1,4-phenylenecarbonyl-1,4-phenylene).
Macromolecules, 19(7), 1986, p 1868-1876.
[28] Cebe P and Hong S. -D, Crystallisation behaviour of poly(ether-ether-ketone), Polymer,
27, 1986, p 1183-1192.

176
[29] Blundell D. J and Osborn B. N, The morphology of poly(aryl-ether-ether-ketone).
Polymer, 24, 1983, p 953-958.
[30] Lauritzen J. I and Hoffman J. D, Extension of Theory of Growth of Chain-Folded
Polymer Crystals to Large Undercoolings, Journal of Applied Physics, 1973, 44(10): p
4340-4352.
[31] Di Lorenzo M. L and Silvestre C, Non-isothermal crystallisation of polymers, Progress
in Polymer Science, 24(6), 1999, p 917-950.
[32] Turnbull D and Fisher J. C, Rate of Nucleation in Condensed Systems, Journal of
Chemical Physics, 1949, 17(1), p 71-73.
[33] Wunderlich B, Macromolecular Physics, Volume 2, Crystal Nucleation, Growth. 1976,
London: Anealing Academic Press
[34] Jenkins M. J, Crystallisation in miscible blends of PEEK and PEI, Polymer, 2001.
42(5), p 1981-1986.
[35] Al Lafi A. G, James N. Hay, and Parker D. J, The effect of proton irradiation on The
melting and isothermal crystallization of poly (ether-ether-ketone), Journal of Polymer
Science Part B-Polymer Physics, 2008, 46(11), p 1094-1103.
[36] Guttman C. M, Hoffman J. D, and Dimarzio E. A, Monte-Carlo Calculation of Sans for
Various Models of Semi-Crystalline Polyethylene, Faraday Discussions, 68, 1979, p
297-309.
[37] Hoffman J. D, Guttman C. M, and Dimarzio E. A, On the Problem of Crystallization of
Polymers from the Melt with Chain Folding. Faraday Discussions, 68, 1979, p 177-
197.
[38] Hoffman J. D, Regime-Iii Crystallization in Melt-Crystallized Polymers – the Variable
Cluster Model of Chain Folding, Polymer, 24(1), 1983, p 3-26.
177
[39] Hoffman J. D, Role of Reptation in the Rate of Crystallization of Polyethylene Fractions
from the Melt, Polymer, 23(5), 1982, p 656-670.
[40] Hoffman J. D, et al., Growth-Rate of Spherulites and Axialites from Melt in
Polyethylene Fractions - Regime-1 and Regime-2 Crystallization, Journal of Research
of the National Bureau of Standards Section a-Physics and Chemistry, 79(6), 1975, p
671-699.
[41] Lauritzen, J. I and Hoffman J. D, Theory of Formation of Polymer Crystals with Folded
Chains in Dilute Solution, Journal of Research of the National Bureau of Standards
Section a-Physics and Chemistry, 64(1), 1960, p 73-102.
[42] Muthukumar M, Nucleation in Polymer Crystallization, Advances in Chemical Physics,
128, 2004, 128: p 1-63.
[43] Avrami M, Kinetics of Phase Change II Transformation-Time Relations for Random
Distribution of Nuclei, Journal of Chemical Physics, 8, 1940, p 212-224.
[44] Avrami M, Kinetics of Phase Change and Microstructure Kinetics of Phase Change III
Journal of Chemical Physics, Journal of Chemical Physics, 8: 1940, 212-224, 9, 1941,
p 177-184.
[45] Evans U. R, The Laws of Expanding Circles and Spheres in Relation to the Lateral
Growth of Surface Films and the Grain-Size of Metals, Transactions of the Faraday
Society, 1945, 41(7): p 365-374.
[46] Velisaris C. N and Seferis J. C, Crystallization Kinetics of Polyetheretherketone (Peek)
Matrices, Polymer Engineering and Science, 26(22), 1986, p 1574-1581.
[47] Banks W, Gordon M, Roe R. J and Sharples A, The Crystallization of Polyethylene,
Polymer, 4(1), 1963, p 61-74.
[48] James N. Hay and Sabir M, Crystallization Kinetics of High Polymers, Polyethylene
Oxide .2, Polymer, 10(3), 1969, p 203-&.
178
[49] James N. Hay and Mills P. J, The Use of Differential Scanning Calorimetry to Study
Polymer Crystallization Kinetics, Polymer, 23(9), 1982, p 1380-1384.
[50] Hillier I. H, Modified Avrami Equation for Bulk Crystallization Kinetics of Spherulitic
Polymers, Journal of Polymer Science Part a-General Papers, 3(9pa), 1965, p 3067-&.
[51] Price F. P, A Phenomenological Theory of Spherulitic Crystallization - Primary and
Secondary Crystallization Processes, Journal of Polymer Science Part a-General
Papers, 3(9pa), 1965, p 3079-&.
[52] Banks W, Sharples A, and James N. Hay, The effect of simultaneously occurring
processes on the course of polymer crystallization, Journal of Polymer Science Part a-
1-Polymer Chemistry, 2(9), 1964, p 4059–4067.
[53] Verhoyen O, Dupret F, and Legras R, Isothermal and non-isothermal crystallization
kinetics of polyethylene terephthalate: Mathematical modelling and experimental
measurement, Polymer Engineering and Science, 38(9), 1998, p 1594-1610.
[54] James N. Hay, Application of modified Avrami equations to polymer crystallization
kinetics, British Polymer Journal, 3, 1973, p 74-82.
[55] Qin, J. L, Guo S. Q, and Li Z. T, Melting behavior and isothermal crystallization
kinetics of PP/mLLDPE blends, Journal of Polymer Research, 15(5), 2008, p 413-420.
[56] Hoffman J. D and J. J, Weeks, Melting Process and Equilibrium Melting Temperature
of Polychlorotrifluoroethylene, Journal of Research of the National Bureau of
Standards Section a-Physics and Chemistry, 66(Jan-F), 1962, p 13-&.
[57] Lim J. S, Noda I, and Im S. S, Effects of metal ion-carbonyl interaction on miscibility
and crystallization kinetic of poly(3-hydroxybutyrate-co-3-hydroxyhexanoate)/lightly
ionized PBS, European Polymer Journal, 44(5), 2008, p 1428-1440.

179
[58] Fisher E. W, Sterzel H. J, Wegner G, Kolloid Z. Z, Polym., Investigation of the structure
of solution grown crystals of lactide copolymers by means of chemical reactions, 251,
1973, p 980–990.
[59] Hartmann M. H, in D. L Kaplan (Ed.), Biopolymers from Renewable Resources,
Springer-Verlag, Berlin, 1998, p 367–411.
[60] Bigg D. M, in Society of Plastics Engineers—Annual Technical Conference 54(2),
1996, p 2028–2039.
[61] Tsuji H and Ikada Y, Polymer, Properties and morphologies of poly(L-lactide),
Anealling conditions effects on Properties and morphologies of poly(L-lactide), 36(14),
1995, p 2709–2716.
[62] Marega C, Marigo A, DiNoto V, and Zannetti R, Die Makromolekulare Chemie,
Structure and crystallization kinetics of poly(L-lactic acid), 193, 1992, p 1599–1606.
[63] Kolstad J. J, Journal of Applied Polymer Science, Crystallization kinetics of poly(L-
lactide-co-meso-lactide), 62, 1996, p 1079–1091.
[64] Mazzullo S, Paganetto G, and Celli A, Progress in Colloid and Polymer Science,
Regime III crystallization in poly-(L-lactic) acid, 87, 1992, p 32–34.
[65] Migliaresi C, De Lollis A, Fambri L, and Cohn D, Clinical Materials, The effect of
thermal history on the crystallinity of different molecular weight PLLA biodegradable
polymers, 8, 1991, p 111–118
[66] Von Oepen R and Michaeli W, Clinical Materials, Injection moulding of biodegradable
implants, 10, 1992, p 21–28
[67] Huang J, Buehler N, Hall E, Kean R, Kolstad J. J, Wu L and Runt J, Polymer Preprints,
37(2), 1996, p 370–371.
180
[68] Kishore K, Vasanthakumari R and Pennings A. J, Journal of Polymer Science: Polymer
Physics Edition, Isothermal melting behavior of poly(L-lactic acid), 22(4), 1984, p
537–542.
[69] Kalb B and Pennings A. J, Polymer, General crystallization behaviour of poly(L-lactic
acid), 21(6), 1980, p 607–612.
[70] Vasanthakumari R and Pennings A. J, Crystallization Kinetics of Poly (l-lactic acid),
Polymer 24(2), 1983, 175–178.
[71] Urbanovici E, Schneider H. A and Cantow H. J, Some considerations concerning the
temperature dependence of the bulk crystallization rate constants of polymeric
materials, Journal of Polymer Science: Part B: Polymer Physics 35(2), 1997 359–369.
[72] Tsuji H, Crystallization from the melt of poly(lactide)s with different optical purities
and their blends, Macromolecular Chemistry and Physics. 197, 1996, p 3483-3499.
[73] He Y, Fan Z, Wei J and Li S, Morphology and Melt Crystallization of Poly(L-lactide)
Obtained by Ring Opening Polymerization of L-lactide With Zinc Catalyst., 46(2),
2006, p 1583–1589.
[74] Yasuniwa M, Subakihara S, Sugimoto Y, Nakafuku C, Thermal Analysis of the
Double-Melting Behaviour of Poly(L-lactic acid), Journal of Polymer Science Part B:
Polymer Physics, 42 (1), 2003, p 25-32.
[75] Di Lorenzo M, Crystallization behavior of poly(l-lactic acid), European Polymer, 41(3),
2005, p 569-575.
[76] Mazurin O. V, Glass Physics and Chemistry, Problems of compatibility of the values
of glass transition temperatures published in the world literature, 33(1), 2007, p 22.
[77] Gibbs J. H and Di Marzio E, Nature of the glass transition and the glassy state, The
Journal of Chemical Physics, 28 (3), 1958, p 373-383.

181
[78] Richardson M. J, “The glass transition region”, In: Mathot, V.B.F. (ed.) Calorimetry
and thermal analysis of polymers, Munich: Hanser Publishers, 1994, p 169-188.
[79] Simon F, ergeb.Exact.Naturw, 9, 1930, p 222-274.
[80] Simon F, Z.Anorg. Chem., 203, 1931, p 220-227.
[81] Cowie J. M. G and Ferguson R, Physical ageing of poly(methyl methacrylate) from
enthalpy relaxation measurements, Polymer, 34(10), 1993, p 2135-2141.
[82] Brunacci A, Cowie J. M. G, Ferguson, R & McEwenm I. J, Enthalpy relaxation in
glassy polystyrenes: 1, Polymer, 38(4), 1997, p 865-870.
[83] Pyda M, Wunderlich B, Reversing and nonreversing heat capacity of poly(lactic acid)
in the glass transition region by temperature-modulated differential scanning
calorimetry, in: Proceedings of the 31st NATAS Annual Conference on Thermal
Analysis and Applications, 2003, p 143/1–143/9.
[84] Pyda M, Nowak-Pyda E, Wunderlich B, Physical aging of amorphous poly(lactic acid)
by temperature-modulated calorimetry, in: Proceedings of the 33rd NATAS Annual
Conference on Thermal Analysis and Applications, 2005, p 135.47.662/1–
135.47.662/10.
[85] Pyda M, Wunderlich B, Reversing and Nonreversing Heat Capacity of Poly(lactic acid)
in the Glass Transition Region by TMDSC, Macromolecules, 38(25), 2005, p 10472–
10479.
[86] Perego G, Cella G. D and Bastioli C, Effect of molecular weight and crystallinity on
poly(lactic acid) mechanical properties , Journal of Applied Polymer Science, 59, 1996
p 37–43.
[87] Jamshidi K, Hyon S. H and Ikada Y, Thermal characterization of polylactides, 29(12),
1988, p 2229–2234.
182
[88] Jim R. White, Polymer ageing: physics, chemistry or engineering? Time to reflect,
Elsevier, 9(11-12), 2006, p 1396-1408.
[89] Pan P. J, Zhu B, Inoue Y, Enthalpy Relaxation and Embrittlement of Poly(L-lactide)
during Physical Aging Macromolecules, 40(26), 2007, p 9664–9671.
[90] Nicola A Bailey, James N. Hay, Duncan M Price, A study of enthalpic relaxation of
poly(ethylene terephthalate) by conventional and modulated temperature DSC,
Thermochimica Acta, 367-368, 2001, p 425-431.
[91] Aref-Azar A, Arnoux F, Biddlestone F, James N. Hay, Physical ageing in amorphous
and crystalline polymers. Part 2, Polyethyelene Terephthalate, Thermochim. Acta, 273,
1996, p 217-229.
[92] Cowie J. M. G and Ferguson R, Polym. Commun., 27, 1986, p 258.
[93] Hutchinson J. M, Physical ageing of Polymers, Progress in Polymer Science, 20, 1995,
p 703-760.
[94] Chen Z. Y, James N. Hay, and Jenkins M. J, FTIR spectroscopic analysis of
poly(ethylene terephthalate) on crystallization, European Polymer Journal, 48(9), 2012,
p 1586-1610.
[95] "Personal Communication" James N. Hay.
[96] Richardson M. J and Savill N. G, Polymer, 16, 753, (1975); Thermochimica Acta, 213,
12, (1975).
[97] http://www.thermo.com.20th Feb 2012.
[98] http://www.sintef.no/.5th May 2012.
[99] http://www.linkam.co.uk/.8th May 2012.
[100] Oneill M. J, Analysis of Temperature-Controlled Scanning Calorimeter. Analytical
Chemistry, 36(7), 1964, p 1238-&.
[101] Wunderlich B, Thermal Analysis, 1990, New York: Academic Press.

183
[102] Felice D. S, Pantani R, Titomanlio G, Nucleation and crystallization kinetics of
poly(lactic acid), Thermochimica Acta, 522, 2011, p 128– 134.
[103] Pantani R, Felice D. S, Sorrentino A, De Maio F, Polymer Degradation and Stability,
Crystallization kinetics of virgin and processed poly(lactic acid), 95, 2010, p 1148-
1159.
[104] Tadakazu M, Polymer Crystallization behaviour of poly(L-lactide), 39(22), 1998, p
5515–5521.
[105] Steven K, Chain Mobility, Thermal, and Mechanical Properties of Poly(ethylene
furanoate) Compared to Poly(ethylene terephthalate), 47 (4), 2014, p 1383–1391.
[106] Allan R MacKintosch, Liggat John J, Dynamic mechanical analysis of
poly(trimethylene terephthalate)—A comparison with poly(ethylene terephthalate) and
poly(ethylene naphthalate), Journal of Applied Polymer Science, 92(5), 2004, p 2791–
2796.
[107] Wiley M, Properties and Behavior of Polymers, 2 Volume Set, 2011, p 1259.
[108] Williams G and Watts D. C, Trans. Faraday Soc., 66, 1970, p 80-85.
[109] James N. Hay, The physical ageing of amorphous and crystalline polymers, Pure &
Appl. Chern., Vol. 67, No. 11, 1995, p 1855-1858.
[110] Liu T, Petermann J, Multiple melting behaviour in Isothermally cold-crystallized
isotatic polystyrene, Polymer 42, 2001, p 6453-6461.
[111] Bonnet M, Rogausch KD, Petermann J, The endothermic “annealing peak” of
poly(phenylene sulphide) and poly(ethylene terephthalate), Colloid Polym Sci, 277 (6),
1999, p 513–518.
[112] Farrow G, Crystallinity, “Crystal size and Melting Point of polypropylene, Polymer,
4, 1963, p 191-197.
184
[113] Ninjenhuis A. J, Grijpma D. W, Pennings A. J, Highly crystalline as-polymerized
poly(l-lactide), Polym. Bull., 1991, 26 91), p 71–77.
[114] Flory P. J and Vrij A, Melting Points of Linear-Chain Homologs – Normal Paraffin
Hydrocarbons, Journal of the American Chemical Society, 85(22), 1963, p 3548-&.
[115] Flory P. J, Orwoll R. A and Vrij A, Statistical Thermodynamics of Chain Molecule
Liquids 2. Liquid Mixtures of Normal Paraffin Hydrocarbons, Journal of the American
Chemical Society, 86(17) 1964, p 3515-&.
[116] Flory P. J, Orwoll R. A and Vrij A, Statistical Thermodynamics of Chain Molecule
Liquids I. Equation of State for Normal Paraffin Hydrocarbons, Journal of the
American Chemical Society, 86(17), 1964, p 3507-&.
[117] James N. Hay and Wiles M, Surface Free-Energy of Extended Chain Crystals of
Polyethylene, Makromolekulare Chemie-Macromolecular Chemistry and Physics,
178(2), 1977, p 623-630.
[118] Mills P. J and James N. Hay, The Lamella Size Distribution in Nonisothermally
Crystallized Low-Density Polyethylene. Polymer, 25(9), 1984, p 1277-1280.
[119] Bulkin B. J, Lewin M, DeBlase F. J, Conformational change, chain orientation, and
crystallinity in poly(ethylene terephthalate) yarns: Raman spectroscopic study,
Macromolecules, 18 (12), 1985, p 2587–2594.
[120] Zhu X. Y, Yan D. Y, Fang Y. P, In Situ FTIR Spectroscopic Study of the
Conformational Change of Isotactic Polypropylene during the Crystallization Process,
J. Phys. Chem. B, 105 (50), 2001, p 12461-12463.
[121] Chalmers J. M, Hannah R. W, Mayo D. W, Spectra-structure correlations: Polymer
spectra. In Handbook of Vibrational Spectroscopy; Chalmers, J. M, Griffiths, P. R,
Eds.; John Wiley & Sons: Chichester,UK,; 4, 2002, p 1893-1918.

185
[122] Koenig J. L, Spectroscopy of Polymers; American Chemical Society: Washington, DC,
1992.
[123] Mallapragada S. K, Narasimhan B, Infrared Spectroscopy in Analysis of Polymer
Crystallinity, In Encyclopedia of Analytical Chemistry, Meyers, R. A, Ed.; John Wiley
& Sons: Chichester, UK, 2000, p 7644-7658.
[124] Holland B. J, James N. Hay, Thermal degradation of nylon polymers, Polym. Int.,
49(9), 2000, p 943–948.
[125] Holland B. J, James N. Hay, The kinetics and mechanisms of the thermal degradation
of poly(methyl methacrylate) studied by thermal analysis – Fourier transform infrared
spectroscopy, Polymer, 42 (11), 2001, p 4825–4835.
[126] Holland B. J, James N. Hay, The thermal degradation of poly (ethylene terephthalate)
and analogous polyesters measured by thermal analysis – Fourier transform infrared
spectroscopy, Polymer, 43, 2002, p 1835–1847.
[127] Jianming Z, Hideto T, Isao N and Yukihiro O, Weak Intermolecular Interactions during
the Melt Crystallization of Poly(L-lactide) Investigated by Two-Dimensional Infrared
Correlation Spectroscopy, J. Phys. Chem. B, 108(31), 2004, p 11514-11520.
[128] Jianming Z, Differences in the CH3/OaC interactions among poly(L-lactide), poly(L-
lactide)/poly(D-lactide) stereocomplex, and poly(3-hydroxybutyrate) studied by
infrared spectroscopy, Journal of Molecular Structure, 735–736, (2005), p 249–257.
[129] Meaurio E, Infrared Spectrum of Poly(L-lactide): Application to Crystallinity Studies,
Macromolecules, 39(26), 2006, p 9291-9301.
[130] Meaurio E, Conformational Behavior of Poly(L-lactide) Studied by Infrared
Spectroscopy, J. Phys. Chem. B, 110(11), 2006, p 5790-5800.
[131] Kister G, Effects of morphology, conformation and configuration on the IR and Raman
spectra of various poly( lactic acid)s, Polymer, 39(2), 1998, p 267-273.

186
[132] Bellamy L. J, Infra-red Spectra of Complex Molecules. Volume 2. Advances in Infra-red
Group Frequencies, Chapter 11. Published by Chapman and Hall, London 1980
[133] Chen Z. Y, James N. Hay, and Jenkins M. J, The Effect of Secondary Crystallization
on Crystallization Kinetics – Polyethylene Terephthalate Revisited, European Polymer
Journal, 81, 2016, p 216-223.
[134] Chan T. W and Isayev A. I, Quiescent polymer crystallization: Modelling and
measurements, Polymer Engineering & Science, 34(6), 1994, p 461-471.
[135] Chen Z. Y, James N. Hay, and Jenkins M. J, The kinetics of crystallization of
poly(ethylene terephthalate), measured by FTIR spectroscopy, European Polymer
Journal, 49(6), 2013, p 1722–1730.

187
Appendix 1
Supported Publications:
1. Azizan A. Aziz, Sani A. Samsudin, James N. Hay* and Michael J. Jenkins, “The Effect
of a secondary Process on Polymer Crystallization Kinetics – 3. Co-poly (lactic acid)”.
As submitted to European Polymer Journal for consideration to publish.