crystallization behavior of bisphenol-a ......ii crystallization behavior of bisphenol-a...
TRANSCRIPT

CRYSTALLIZATION BEHAVIOR OF BISPHENOL-A
POLYCARBONATE: EFFECTS OF CRYSTALLIZATION TIME,
TEMPERATURE, AND MOLAR MASS
by
Seungman Sohn
Dissertation Submitted to the Faculty of the
Virginia Polytechnic Institute and State University
in partial fulfillment of the requirements for the degree of
DOCTOR OF PHILOSOPHY
in
Materials Science and Engineering
Dr. Hervé Marand, Chairman
Dr. Garth L. Wilkes
Dr. Ronald G. Kander
Dr. Richey M. Davis
Dr. William T. Reynolds
April, 2000
Blacksburg, Virginia
Key words: Crystallization, Bisphenol-A polycarbonate, Multiple melting behavior,
Secondary crystallization kinetics
Copyright 2000, Seungman Sohn

ii
CRYSTALLIZATION BEHAVIOR OF BISPHENOL-A
POLYCARBONATE: EFFECTS OF CRYSTALLIZATION TIME,
TEMPERATURE, AND MOLAR MASS
by
Seungman Sohn
Hervé Marand, Chairman
Materials Science and Engineering
(Abstract)
Crystallization and multiple melting behavior of bisphenol-A polycarbonate (PC)
was investigated using differential scanning calorimetry (DSC) for the monitoring of
thermal behavior and atomic force microscopy (AFM) for the morphology study. The
exceedingly slow crystallization kinetics of PC and the feasibility of obtaining near
monodisperse fractions provide distinct advantages for the elucidation of the effects of
crystallization time, temperature, and molar mass on crystallization kinetics.
The effects of molar mass on the glass transition temperature (Tg) and heat
capacity change at Tg, and the amorphous density of PC were investigated.
Similar to many semicrystalline polymers, PC exhibits a multiple melting
behavior upon heating. While for each PC sample, the coexistence of low and high
temperature endothermic regions in the DSC heating traces is explained by the melting of
populations of crystals with different stabilities, melting-recrystallization-remelting
effects are observed only for the lowest molar mass samples.
The effects of crystallization temperature and molar mass distribution on overall
crystallization kinetics were studied for some of the fractions, including the commercial
PC-28K (Mw = 28,000 g.mol-1) sample. Regarding the kinetics of secondary

iii
crystallization, particular attention was placed on understanding the effects of molar
mass, initial degree of crystallinity prior to the secondary crystallization, and secondary
crystallization time and temperature. The secondary crystallization of PC follows the
same laws discovered in previous studies of PEEK, PET, it-PS and ethylene copolymers,
and the results are discussed in the context of a bundle-like secondary crystallization
model.
During isothermal annealing of semicrystalline PC-28K around the high melting
endotherm, a significant increase of melting temperature along with peak broadening
with time was observed. Independently, morphological studies using AFM showed that
mean lamellar thickness increases with time during isothermal annealing. These results
are discussed in light of isothermal thickening of lamellar crystals.
Lastly, almost 200 DSC melting traces of varying molar mass PC samples thermally
treated under various conditions were analyzed to calculate crystallinity (Xc), rigid
fraction (RF), and rigid amorphous fraction (RAF). The correlation between RAF vs Xc,
Tg, and Tg broadening are discussed.

iv
To
my lovely family
Yeunjung Doe, Hyuckjoon Sohn, and
my parents
Nanchan Sohn, Guinam Jung, Junhoei Doe, Myungsuk Yang
Without whose sacrifices none of this would have been possible

v
Acknowledgements
My first appreciation must go to my great advisor Prof. Hervé Marand, who
showed me an incessant love and enthusiasm about polymer science, and who also
showed me a clear and satisfactory way of being a good scientist. He is my friend,
teacher, and further, the learning from him will be a corner stone in my future career.
Without his guidance, I never would have seen the beauty of polymer science.
I wish to acknowledge the guidance, helpful discussions for my work as provided
during the last five years by:
- Prof. Garth L. Wilkes, who is a great teacher with broad knowledge and enthusiasm,
and who knows how to help students.
- Prof. William T. Reynolds, who is extremely generous and thoughtful.
- Prof. Ronald G. Kander, Prof. Richey M. Davis, who gave me helpful suggestions for
my research.
- Dr. Azar Alizadeh, with whom I spent numerous nights in the lab. Her critical
discussions were essential ingredient in the completion of this work.
- Prof. Darrell H. Iler and Mr. L. C. Shank for their help in preparation of
polycarbonate fractions.
- Dr. Qing Ji for more than 100 runs of GPC analysis and helpful discussions.
- The fellow students in Prof. Marand’s group, old and new, especially Mr. Sean M.
Christian for his good friendship.
- The fellow students in Prof. Ward’s and Prof. McGrath’s labs, who helped me in
several ways for my experiments.
Special thanks are due to my senior alumnus Dr. Ojin Kwon, who encouraged me
when I was in difficulty. His scientific knowledge and enthusiasm towards science were
good justifications why I wanted to be a scientist. Dr. Taigyu Park also deserves my
appreciation for his critical discussions and timely help.
Lastly, the never-ending sacrifice of my wife, Yeunjung, will be the heart of my
appreciation for the last five years of my research.

vi
Table of Contents
Chapter 1 Introduction …………………………………………………………1
Chapter 2 Review …………………………………………………………………7
2.1 The Two-phase and Three-phase Model …………………………8
2.1.1 The Two-phase Model …………………………………………8
2.1.2 The Three-phase Model …………………………………10
2.1.2.1 Rigid Amorphous Phase …………………………13
2.1.2.2 Pseudo-crystalline Phase …………………………19
2.2 Secondary Crystallization …………………………………………20
2.2.1 Overall Crystallization Kinetics …………………………20
2.2.2 Secondary Crystallization Model …………………………24
2.3 Multiple Melting Behavior …………………………………………32
2.4 Crystallization and Melting Behavior of PC …………………………38
2.4.1 Crystallization …………………………………………………38
2.4.2 Multiple Melting Behavior of PC …………………………40
References
Chapter 3 Materials and Experimental …………………………………………50
3.1 Sample Preparation …………………………………………………50
3.1.1 PC fractionation …………………………………………………51
3.1.2 Purification …………………………………………………58
3.2 Experimental …………………………………………………………59
3.2.1 Sample Moulding …………………………………………59
3.2.2 Calorimetric Study …………………………………………60
3.2.3 Density Measurement …………………………………………62
3.2.4 Atomic Force Microscopy …………………………………64
3.2.5 Optical Microscopy …………………………………………64
3.3 Amorphous Characterization …………………………………………65
3.3.1 General Features in Glass Transition Behavior …………………65
3.3.2 Glass Transition Temperature in Amorphous PC …………68
3.3.3 Heat Capacity Change at Tg …………………………………72

vii
3.3.4 Amorphous Density …………………………………………73
References
Chapter 4 On the Origin of Multiple Melting Behavior of Semicrystalline PC..79
4.1 Introduction …………………………………………………………79
4.2 Reorganization Process …………………………………………………80
4.3 Experimental …………………………………………………………82
4.3.1 Materials …………………………………………………82
4.3.2 Differential Scanning Calorimetry …………………………84
4.3.3 Thermal Lag Corrections …………………………………84
4.4 Results …………………………………………………………………85
4.4.1 The nature of the Multiple Melting Behavior in PC …………87
4.4.2 Heating Rate Dependence of the Low Endotherm …………97
4.5 Discussion …………………………………………………………100
4.6 Conclusions …………………………………………………………109
References
Chapter 5 Primary and Secondary Crystallization Kinetics of PC …………112
5.1 Introduction …………………………………………………………112
5.2 Experimental …………………………………………………………113
5.2.1 Quantitative Analysis of DSC Melting Traces …………………113
5.2.2 Atomic Force Microscopy …………………………………116
5.2.3 Optical Microscopy …………………………………………116
5.3 Results …………………………………………………………………117
5.3.1 Overall Kinetics of Crystallization …………………………117
5.3.1.1 The Effect of Molar Mass …………………………117
5.3.1.2 The Effect of Crystallization Temperature …………123
5.3.2 Morphology …………………………………………………126
5.3.3 Secondary Crystallization Kinetics …………………………126
5.3.3.1 The Effect of the Initial Degree of Crystallinity …131
5.3.3.2 The Effect of Secondary Crystallization Temperature …140
5.3.3.3 The Effect of Partial Melting Temperature …………146
5.3.3.4 The Effect of Primary Crystallization Temperature …153

viii
5.3.3.5 Reproducibility of the Temporal Evolution of Low
Endotherm …………………………………………153
5.4 Discussion …………………………………………………………155
5.4.1 Overall Crystallization Kinetics …………………………157
5.4.1.1 The Effect of Molar Mass Distribution …………157
5.4.1.2 The Effect of Crystallization Temperature …………160
5.4.1.3 Morphology of Semicrystalline PC …………………160
5.4.1.4 Secondary Crystallization Kinetics …………………161
5.5 Conclusions …………………………………………………………169
References
Chapter 6 Isothermal Lamellar Thickening of Semicrystalline PC …………174
6.1 Introduction …………………………………………………………174
6.1.1 Isothermal Lamellar Thickening …………………………174
6.1.2 Polymer Epitaxy …………………………………………177
6.2 Experimental …………………………………………………………178
6.2.1 Calorimetry Study …………………………………………179
6.2.2 Atomic Force Microscopy …………………………………179
6.2.3 Epitaxial Growth …………………………………………182
6.3 Results …………………………………………………………………184
6.3.1 Isothermal Lamellar Thickening from DSC …………………184
6.3.2 Lamellar Thickness Measurement by AFM …………………190
6.3.3 Construction of Gibbs-Thomson Plot …………………………197
6.4 Discussion …………………………………………………………205
6.4.1 Isothermal Lamellar Thickening from DSC …………………205
6.4.2 Epitaxial Growth and Lamellar Thickness Measurement …208
6.4.3 Various Issues in the Construction of Gibbs-Thomson Plot …211
6.5 Conclusions …………………………………………………………214
References
Chapter 7 The Evolution of Rigid Amorphous Fraction and Its Correlation with
the Glass Transition Behavior of Semicrystalline PC …………217
7.1 Introduction …………………………………………………………217

ix
7.2 Experimental …………………………………………………………219
7.2.1 Temperature Correction for the Experimental
Heat of Fusion ………………………………………………220
7.2.2 Surface Enthalpic Contribution for the Equilibrium
Heat of Fusion ………………………………………………222
7.3 Results …………………………………………………………………224
7.4 Discussion …………………………………………………………225
7.5 Conclusions …………………………………………………………230
References
Chapter 8 Summary …………………………………………………………233
Future Work …………………………………………………………………………236
Appendix A.1 Stockmayer-Fixman Plot of Bisphenol-A Polycarbonate Fractions …239
Appendix A.2 A Brief Review of Gray’s Method for Thermal Lag Correction in DSC
Melting Traces ……………………………………………………242

x
List of Figures
Figure 2.1 The fringed-micelle model for the morphology of semicrystalline polymers
(from reference 1 in Chapter 2) …………………………………………………9
Figure 2.2 Two typical models considering the nature of chain folding: (a) regular folds
(adjacent reentry), (b) irregular folds (non-adjacent reentry) (from reference 3 in Chapter
2) …………………………………………………………………………12
Figure 2.3 A typical example of primary and secondary crystallization in polyethylene.
Sample has been crystallized at 127.5oC from DSC and dilatometry (data from reference
40 in Chapter 2) ………………………………………………………………………23
Figure 2.4 Various secondary crystallization models. Lamellar insertion model (a);
Stack insertion model (b); Bundle-like secondary crystallization model (c) …………27
Figure 2.5 A multiple melting behavior of semicrystalline bisphenol-A
polycarbonate (Mw = 18,800 g/mol, Mw/Mn =2.0). Sample has been crystallized at
170oC for 192 hours. Melting traces were recorded at10oC/min heating rate.
Temperature scale was properly calibrated using In-sandwich sample …………33
Figure 3.1 GPC traces of two commercial PC samples …………………………52
Figure 3.2 GPC traces of PC fractions …………………………………………54
Figure 3.3 A schematic diagram of fractionation apparatus …………………57
Figure 3.4 Typical examples of DSC temperature scale calibrations upon heating (a)
and cooling (b). Note about 30% higher slope in In-sandwich sample shows the thermal
lag effect …………………………………………………………………………61
Figure 3.5 A typical example of calibration curve for density gradient column …63
Figure 3.6 A schematic DSC traces in the glass transition region …………………67
Figure 3.7 Glass transition temperatures of PC fractions as a function of the logarithm
of cooling rate for different molar mass samples. Tgo is the linear extrapolation value to
zero cooling rate. Temperature scale has been properly calibrated using In-sandwich
sample …………………………………………………………………………69
Figure 3.8 A variation of amorphous PC glass transition temperature as a function of
<Mn>-1(a) and as a function of <Mw> (b). The polydispersity of fractions used in the
present study was in the range of 1.02 to 1.49 and polydispersity for literature data

xi
including the commercials in this work is in the range of 2.0 to 3.5 …………………70
Figure 3.9 Heat capacity change at Tg as a function of number average molar mass of
amorphous PC …………………………………………………………………74
Figure 3.10 Amorphous densities of PC fractions as a function of weight
average molar mass …………………………………………………………………75
Figure 4.1 A schematic diagram of reorganization (melting-recrystallization-remelting)
process as a function of heating rate …………………………………………………81
Figure 4.2 A typical example of thermal lag corrections considering both temperature
shift and peak broadening. In this example, PC-28K sample was initially crystallized at
185oC for 202 hours, partially melted at 220oC and exposed to secondary crystallization
at 185oC for 2 hours. Temperature scale has been properly corrected using In-
sandwiched sample. Heating rate was 10oC/min …………………………………86
Figure 4.3 Effect of heating rate on the melting behavior of PC-28K crystallized at
185oC from the glassy state for 202 hours and quenched to 100oC …………………88
Figure 4.4 Effect of heating rate on the melting behavior of PC-4K crystallized from
the glassy state at 165oC for 38 hours, and quenched to 60oC …………………90
Figure 4.5 Effect of heating rate on the melting behavior of PC-28K crystallized at
185oC from the glassy state for 202 hours, and partially melted at 220oC and
subsequently quenched to 100oC …………………………………………………93
Figure 4.6 Effect of cooling rate on the melting behavior of PC-28K crystallized at
185°C from the glassy state for 202 hours, and partially melted at 220oC and
subsequently quenched to 100oC …………………………………………………95
Figure 4.7 Analysis of cooling rate effect on the melting behavior of PC-28K, in terms
of, a) Peak melting temperature; b) Heat of fusion; c) rigid amorphous fraction, all as a
function of cooling rate …………………………………………………………96
Figure 4.8 Effect of heating rate on the melting behavior of PC-28K crystallized at
185oC from the glassy state for 202 hours, partially melted at 220oC and further
isothermally crystallized under various conditions: a) 175oC for 120 minutes; b) 185oC
for 40 minutes; c) 185oC for 120 minutes …………………………………………98
Figure 4.9 Effect of heating rate on the low endotherm location of PC-28K crystallized
under various conditions (BC stands for bulk crystallization and SC, for secondary

xii
crystallization) …………………………………………………………………101
Figure 5.1 A typical example of curve fitting in DSC melting traces. Gray area
designates the low endotherm developed during the secondary crystallization. PC-28K
sample was initially crystallized at 185oC for 202 hours, partially melted at 220oC and
exposed to secondary crystallization at 185oC for 40 minutes …………………115
Figure 5.2 Heating traces (HR = 10oC/min) of PC-28K crystallized at 185oC for
various times. Inset shows the corresponding temporal evolution of the total heat of
fusion ……………………………………………………………………………118
Figure 5.3 GPC traces of PC-28K during crystallization at 185oC for various times. For
comparison reason GPC traces of previous thermal treatments are included …120
Figure 5.4 Temporal evolution of the total heat of fusion of fractions (filled symbols)
and commercial (crossed symbol) PC of varying molar mass …………………121
Figure 5.5 Variation of the half-time of crystallization (t1/2) of fractions and
commercial PC as a function of weight average molar mass. Closed diamond symbol
shows the time elapsed to develop ca. 1% crystallinity in case of PC-30K fraction
crystallized at 190oC …………………………………………………………………122
Figure 5.6 Temporal evolution of the total heat of fusion of PC-4K crystallized at
various crystallization temperatures …………………………………………………124
Figure 5.7 The variation of the half-time of crystallization of varying molar mass PC
samples as a function of crystallization temperature. Open symbol, a commercial PC
sample (Mw = 46,000 g.mol-1) from the reference 8. The dotted lines are only for the
visual guide lines …………………………………………………………………125
Figure 5.8 Heating traces (HR = 10oC/min) of PC-28K, crystallized at 185oC for 202
hours, partially melted at 220oC and further isothermally crystallized at 185oC for various
times ranging from 5 minutes to 900 minutes …………………………………133
Figure 5.9 Heating traces (HR = 10oC/min) of PC-28K, crystallized at 185oC for 105
hours, partially melted at 220oC and further isothermally crystallized at 185oC for various
times ranging from 20 min to 480 min …………………………………………135
Figure 5.10 Heating traces (HR = 10oC/min) of PC-28K, crystallized at 185oC for 153
hours, partially melted at 220oC and further isothermally crystallized at 185oC for various
times ranging from 20 min to 480 min …………………………………………136

xiii
Figure 5.11 Effect of the initial level of crystallinity on the temporal evolution of the
total heat of fusion of PC-28K, following partial melting at 220oC and further
crystallization at 185oC. Open symbols show intermediate total heats of fusion during
secondary crystallization, and closed symbols represent initial (after partial melting) and
final total heat of fusion …………………………………………………………137
Figure 5.12 Evolution of the melting endotherm peak temperature with time during the
secondary crystallization at 185oC performed for samples with different level of initial
crystallinity ……………………………………………………………………………139
Figure 5.13 Evolution of the low endotherm enthalpy of fusion with secondary
crystallization time at 185oC performed for samples with different level of initial level of
crystallinity ……………………………………………………………………………141
Figure 5.14 Temporal evolution of the low endotherm melting peak (a) and heat of
fusion (b) for PC-19K after partial melting at 217oC and secondary crystallization at
170oC for various times …………………………………………………………142
Figure 5.15 Temporal evolution of the low endotherm melting peak (a) and heat of
fusion (b) for PC-28K after partial melting at 220oC and secondary crystallization under
various temperatures and time …………………………………………………144
Figure 5.16 Variation of the rate of the shift of the low endotherm as a function of
secondary crystallization temperature, Tx, for various molar mass PCs (in this plot B(Tx)
has been evaluated at HR =10oC/min). Note that closed and crossed symbols represent
fractions and commercials, respectively …………………………………………147
Figure 5.17 Heating traces (HR = 10oC/min) of PC-19K after partial melting at two
different temperatures (210oC and 217oC). For comparison reason, the melting traces of
original sample crystallized at 170oC for 16 days are plotted together. PM stands for
partial melting …………………………………………………………………150
Figure 5.18 Temporal evolution of melting endotherm for PC-19K exposed to secondary
crystallization at 170oC after partial melting at 210oC for 2 minutes (a), and 217oC for 2
minutes (b). Original sample was crystallized at 170oC for 16 days…………………151
Figure 5.19 Temporal evolution of the low endotherm melting peak (a) and heat of
fusion (b) for PC-19K after partial melting (PM) at two different temperatures. In both
cases secondary crystallization (SC) was performed at 170oC. For comparison reason

xiv
original melting peak temperatures were plotted together (closed symbols) …………152
Figure 5.20 The temporal evolution of low endotherm peak position change in case of
PC-6K samples initially crystallized for two different temperatures. Only Tx has been
varied and partial melting (PM) and secondary crystallization (SC) experiments have
been performed at the same temperatures. Temperature scale has been corrected using
In-sandwich sample (HR = 10oC/min) …………………………………………154
Figure 5.21 Reproducibility test of the temporal evolution of the low endotherm. PC-
12K sample, crystallized at 178oC for 160 hours and partially melted at 220oC, was
further isothermally crystallized at 178oC for one hour …………………………156
Figure 5.22 Variation of normalized total heat of fusion (or crystallinity) among
different polymers after long time crystallization. The X-axis has been normalized with
critical molar mass corresponding to each polymer …………………………………159
Figure 5.23 Temporal evolution of the low endotherm melting temperature in PC-4K
secondary crystallized at 165oC at different heating rates. Inset shows the rate of shift of
the low endotherm, B(Tx), as a function of square root of heating rate. Samples were
originally crystallized at 165oC for 38 hours and partially melted at 216oC …………167
Figure 5.24 Variation of the rate of the shift of the low endotherm at zero heating rate as
a function of �T (= Tx-Tg) for two extreme molar mass samples of PC used in this study.
The arrow points the temperature at which B(Tx) becomes zero (crossover temperature,
Tco). In Chapter 6, this figure is re-plotted with the data from isothermal annealing
experiments (see Figure 6.14) …………………………………………………168
Micrograph 5.1 AFM phase image of the early stage of spherulite formation of PC-
28K bulk crystallized at 185oC for 95 hours …………………………………………127
Micrograph 5.2 AFM image of the structure of well-developed PC spherulites. PC-
28K was bulk crystallized at 185oC for 95 hours …………………………………128
Micrograph 5.3 Spherulitic structure in semicrystalline PC-28K crystallized at 185oC
for 250 hours. The scale bar shows approximately 50 microns …………………129
Micrograph 5.4 AFM height image of the early stage of PC-4K spherulites. PC-4K
was bulk crystallized at 165oC for 6 hours …………………………………………130
Figure 6.1 A schematic representation of AFM phase mode signal used to determine
lamellar thickness. �l and �a stand for lamellar and amorphous layer thickness,
xv
respectively …………………………………………………………………………180
Figure 6.2 A schematic structure of (014) cleavage plane of calcite (CaCO3) …183
Figure 6.3 The effect of annealing above the primary crystallization temperature on the
melting behavior of PC-28K. Samples were initially crystallized at 185oC for 202 hours.
Annealing temperature, Ta = 208oC …………………………………………………185
Figure 6.4 The effect of annealing above the primary crystallization temperature on the
melting behavior of PC-28K. Samples were initially crystallized at 185oC for 202 hours.
Annealing temperature, Ta = 217oC …………………………………………………186
Figure 6.5 The effect of annealing above the primary crystallization temperature on the
melting behavior of PC-28K. Samples were initially crystallized at 185oC for 202 hours.
Annealing temperature, Ta = 223oC …………………………………………………187
Figure 6.6 Variation of melting peak temperature as a function of annealing time for
various annealing temperatures. For inset lines, see the discussion section …………188
Figure 6.7 Variation of total heat of fusion as a function of annealing time for various
annealing temperatures. For inset lines, see the discussion section …………………189
Figure 6.8 GPC traces of PC-28K samples before (as-crystallized) and after annealing
at 224oC for different times. Samples were initially crystallized at 185oC for 202 hours
…………………………………………191
Figure 6.9 Lamellar thickness distribution upon isothermal annealing at 220oC for
different times. PC-28K samples were crystallized on calcite at 185oC for 95
hours. As is; (b) 5 hours; (c) 10 hours; (d) 18 hours …………………………………199
Figure 6.10 Lamellar thickness distribution upon isothermal annealing of PC-28K as a
function of annealing time …………………………………………………………201
Figure 6.11 Variation of lamellar thickness (circle) and the breadth of distribution
measured by standard deviation (square) with isothermal annealing time. …………202
Figure 6.12 Variation of the normalized light intensity during heating scan at heating
rate of 10oC/min (a), and the first derivative of normalized intensity with respect to
temperature, dInor/dT, to determine the peak melting temperature (b). Temperature scale
was calibrated from the onset melting temperature of In standard …………………204
Figure 6.13 A plot of Tm vs inverse lamellar thickness (a Gibbs-Thomson plot).
LIM stands for light intensity measurement from optical microscope …………206

xvi
Figure 6.14 Variation of the rate of the shift of the low endotherm at zero heating rate as
a function of �T (= Tx-Tg) for two extreme molar mass samples of PC used in this study.
The arrow points the possible location of �c-relaxation temperature in PC (T�c). For
comparison reason, B(Tx) for high endotherm is included from the isothermal annealing
experiments. (for detail, see the text and also see Figure 5.24 in Chapter 5)…………209
Micrograph 6.1 AFM phase image of PC lamellae on calcite. PC-28K sample was
initially crystallized at 185oC for 95 hours (as-crystallized) …………………………193
Micrograph 6.2 AFM phase image of PC lamellae on calcite. PC-28K sample was
initially crystallized at 185oC for 95 hours, and further annealed at 220oC for 5 hours
…………………………………………194
Micrograph 6.3 AFM phase image of PC lamellae on calcite. PC-28K sample was
initially crystallized at 185oC for 95 hours, and further annealed at 220oC for 10 hours
…………………………………………195
Micrograph 6.4 AFM phase image of PC lamellae on calcite. PC-28K sample was
initially crystallized at 185oC for 95 hours, and further annealed at 220oC for 18 hours
…………………………………………196
Micrograph 6.5 AFM surface image viewed from different angle of as crystallized
PC lamellae on calcite (i.e., tilted surface image of micrograph 6.1). PC-28K sample
was initially crystallized at 185oC for 95 hours …………………………………198
Figure 7.1 A temperature correction curve for the experimental heat of fusion of PC
samples used in this study. Note that temperature corrected heat of fusion is about 20%
higher than experimental heat of fusion …………………………………………221
Figure 7.2 Correction for the equilibrium heat of fusion considering the surface
enthalpic contribution …………………………………………………………………223
Figure 7.3 The evolution of rigid fraction (RF) as a function of crystallinity for PC
samples thermally treated under various conditions. Note that crystallinity has been both
temperature and surface enthalpic contribution corrected …………………………226
Figure 7.4 Tg broadening as a function of RAF of PC samples under various thermal
Treatments ……………………………………………………………………………227
Figure 7.5 Normalized Tg increase as a function of RAF for PC samples under various
thermal treatments …………………………………………………………………228

xvii
List of Tables
Table 1.1 Chemical structure and some physical properties of
bisphenol- A polycarbonate (PC) …………………………………………………5
Table 3.1 Results from the molar mass characterization by GPC for two commercial
PCs before and after purification …………………………………………………53
Table 3.2 Results from the molar mass characterization by GPC for PC fractions…55
Table 4.1 Molecular characteristics and crystallization conditions of some of
bisphenol-A polycarbonate samples …………………………………………………83
Table 4.2 Melting temperatures of PC-28K before and after partial melting …89
Table 4.3 Heating rate parameters for secondary crystallization under different
Conditions ……………………………………………………………………………99
Table5.1 Molecular characteristics and crystallization conditions for bisphenol-A
polycarbonate samples …………………………………………………………132
Table 5.2 Parameters describing the temporal evolution of the low endotherm for
various PC samples at different secondary crystallization temperatures. Effects of
crystallization temperature and molar mass…………………………………………145
Table 5.3 Parameters describing the temporal evolution of the low endotherm for
various PC samples at different secondary crystallization temperatures. Effect of heating
rate ……………………………………………………………………………148
Table 6.1 GPC analysis before and after isothermal annealing at 224oC …………192
Table 6.2 Variations of lamellar thickness and breadth of distribution with isothermal
annealing time at 220oC. PC-28K samples have been initially crystallized at 185oC for
95 hours …………………………………………………………………………201

1
Chapter 1
Introduction
Polymers are widely used in many important everyday applications such as
clothing, household appliances, automotive products, and even aerospace. Recently,
some specialty polymers expanded their realms into the electronics industry for
packaging, dielectric, and display purposes. Various kinds of thermoplastic polymers,
such as poly(aryl ether ether ketone) (PEEK) and poly(phenylene sulfide) (PPS), have
been introduced in the last two decades. These thermoplastic materials have been the
subjects of extensive studies due to their potential use as high performance engineering
plastics in many applications, such as a matrix for advanced composite material.
One of the most important features of these various polymers is that they are
always used as semicrystalline materials. Therefore, crystallinity, along with polymer
morphology, plays an important role in determining their critical material properties such
as modulus, toughness, permeability, and chemical resistance. Broadly speaking, above
Tg, with a crystallinity increase, modulus tends to increase at the expense of toughness.
Similarly, crystallinity would enhance chemical resistance and decrease permeability.
A crystallization process is largely divided into two regimes: primary and
secondary1. Primary crystallization can be defined as the succession of primary
nucleation of a crystal phase and growth of three-dimensional semicrystalline structures
(such as spherulites and hedrites, etc.) from an unconstrained metastable melt. The end
of primary crystallization can be associated with the impingement of the three-
dimensional structures. Secondary crystallization is identified with phenomenon leading
to an increase of crystallinity after the completion of the primary crystallization stage.

2
Although the extent of secondary crystallization may, in certain instances, be
relatively small, its impacts on fundamental material properties, such as glass transition
temperature and shear or tensile modulus, are thought to be profound. As secondary
crystallization proceeds, it often increases the glass transition temperature of a given
polymer, and it enhances shear or tensile modulus at the expense of toughness. A
possible reason is that secondary crystallization imposes conformational constraints on
the amorphous fraction between lamellar structures2. These constraints will increase as
secondary crystallization proceeds. In other words, material properties will change as a
function of time. Therefore, an understanding of the kinetics of secondary crystallization
is necessary to predict the evolution of material’s properties. This information will be
invaluable in designing polymeric materials, especially for long time use.
While the kinetics of primary crystallization is relatively well documented for
many polymers, secondary crystallization kinetics is not. This is because the increase of
crystallinity in this stage is significantly smaller than in the primary crystallization stage,
this secondary crystallization phenomenon was thought to be relatively unimportant and
thus has not been seriously investigated. Again, the author argue that the study of
secondary crystallization kinetics is important because time-dependent material property
changes are not governed by the primary crystallization, but by secondary crystallization
processes.
The main goal of this study is to further the understanding of secondary
crystallization. For this specific purpose, bisphenol-A polycarbonate (PC) was chosen as
a model system. The distinctive advantage of PC lies in its extremely slow crystallization
kinetics. This material, therefore, was a good candidate to follow the various steps of the

3
crystallization process whether primary or secondary, and further, it allowed to examine
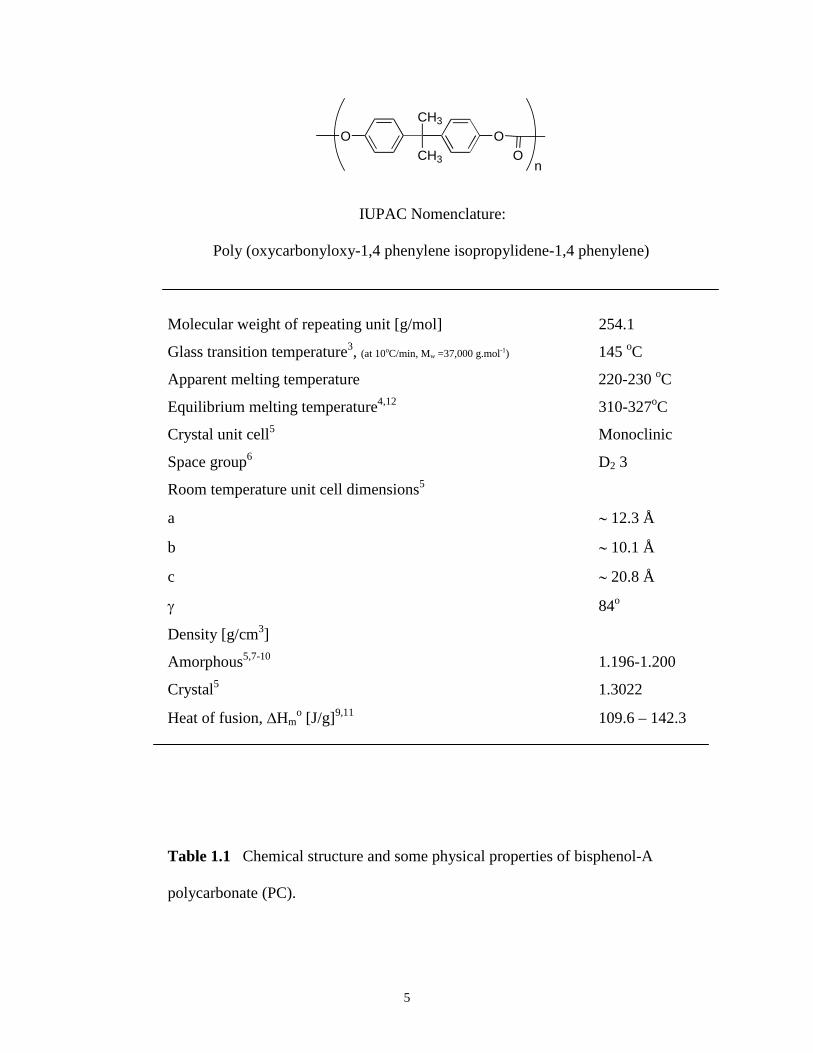
each stage, independently. In Table 1.1, the chemical structure and some important
physical parameters of PC are summarized.
Overview of this study:
Chapter 2 is devoted to a review of a few subjects that are relevant to this study:
1) The two-phase and three-phase models
2) Secondary crystallization
3) Multiple melting behavior
4) Previous studies of crystallization of PC
Chapter 3 describes materials, including sample preparation and characterization,
and experiments. In the section on materials, sample preparation and characterization
will be offered. Sample preparation includes fractionation (carried out by Dr. Iler and
Mr. Shank at Eastern Mennonite University, Harrisonburg, VA) and purification
processes followed by GPC analysis (carried out by Dr. Ji, Virginia Tech, Blacksburg,
VA). Amorphous samples have also been characterized in terms of glass transition
temperature (Tg), (isobaric) heat capacity change at Tg (�CP at Tg) and room temperature
amorphous density (�a). The experimental section describes all the experimental
techniques utilized in this study.
Chapter 4 focuses on the elucidation of the origin of multiple melting behavior
observed from the DSC heating traces of semicrystalline PC. The feasibility of
reorganization by melting-recrystallization-remelting will be thoroughly examined by
heating rate studies performed on PC crystallized under various conditions.

4
In Chapter 5, primary and secondary crystallization kinetics of PC are presented.
The effects of crystallization temperature, time, and molar mass on the kinetics of
primary and secondary crystallization are offered. Some of the results from the kinetics
of secondary crystallization are explained in the light of a newly proposed secondary
crystallization model. The study of the crystallization time and temperature dependencies
of the melting behavior suggests the existence of a crossover temperature, Tco, separating
two different secondary crystallization regimes.
Chapter 6 provides some evidences, from calorimetry, suggesting the existence of
isothermal lamellar thickening, above the cross over temperature discussed in Chapter 5.
To further support the existence of isothermal lamellar thickening in PC, AFM is
employed to determine the mean lamellar thickness and its distribution as a function of
annealing time. These results are analyzed using the Gibbs-Thomson equation, allowing
to propose values for the magnitude of the equilibrium melting point (Tmo) and the
interfacial surface free energy (�e).
In Chapter 7, the existence of a rigid amorphous fraction (RAF) in semicrystalline
PC is presented. To evaluate crystallinity more precisely, the temperature dependence of
the theoretical heat of fusion and surface enthalpic contributions were accounted for. It is
shown that the calculated RAF is associated with both the Tg broadening and Tg increase
during secondary crystallization.
5
O
CH3
CH3
O
On
IUPAC Nomenclature:
Poly (oxycarbonyloxy-1,4 phenylene isopropylidene-1,4 phenylene)
Molecular weight of repeating unit [g/mol] 254.1
Glass transition temperature3, (at 10oC/min, Mw =37,000 g.mol-1) 145 oC
Apparent melting temperature 220-230 oC
Equilibrium melting temperature4,12 310-327oC
Crystal unit cell5 Monoclinic
Space group6 D2 3
Room temperature unit cell dimensions5
a � 12.3 Å
b � 10.1 Å
c � 20.8 Å
� 84o
Density [g/cm3]
Amorphous5,7-10 1.196-1.200
Crystal5 1.3022
Heat of fusion, �Hmo [J/g]9,11 109.6 – 142.3
Table 1.1 Chemical structure and some physical properties of bisphenol-A
polycarbonate (PC).

6
References
1. J. M. Schultz, Polymer Materials Science, 1974, Prentice-Hall, Inc., New Jersey.
2. H. Marand, A. Alizadeh, R. Farmer, R. Desai, V. Velikov, Macromolecules in press;
Bull. Am. Phys. Soc., 1999, 44(1), 608.
3. Polymer Handbook 3rd edition, VI-258.
4. R. Legras, J. P. Mercier, J. Polym Sci., Polym.Phys., 1977, 15, 1283.
5. R. Bonart, Makromolekular Chem., 1966, 92, 149.
6. Hermann Schnell, “Chemistry and Physics of Polycarbonates”, 1964, John Wiley &
Sons, Inc.
7. B. Falkai, W. Rellensmann, Makromolekular Chem., 1964, 75, 112.
8. K.-H. Hellwege, J. Hennig, W. Knappe, Kolloid-Zeitschrift und Zeitschrift für
Polymere, 1962, 186, 29.
9. J.P. Mercier, R. Legras, J. Polym Sci., Polym.Lett., 1970, 8, 645.
10. G. E. Wissler, B. Crist. Jr, J. Polym Sci., Polym.Phys., 1980, 18, 1257.
11. L. D. Jones, F. E. Karasz, J. Polym Sci., Polym.Lett., 1966, 4, 803.
12. J. M. Jonza, R. S. Porter, J. Polym. Sci. Polym. Phys., 1986, 24, 2459.

7
Chapter 2
Review
The long chain nature of macromolecules distinguishes them from small
molecular substances. It is because of their long chain nature that polymers can not
crystallize completely. Crystallizable polymers can then exist in two states: a liquid
amorphous state above the melting point and a semicrystalline state at lower
temperatures. In the amorphous state, polymer chains are randomly arranged and the
overall conformational state of the individual chain is in random coil state, although
locally there could be some degree of order. In the crystalline state, all chains have the
same conformation, which favors packing into an ordered structure. As indicated above,
unlike small molecular solids such as metals, polymers do not crystallize completely.
That is to say, their morphology is controlled by kinetics not by thermodynamics.
Therefore, the morphological structure of any semicrystalline polymer must be
represented by both an amorphous and crystalline phases. In the first section of this
chapter, a description of semicrystalline polymer morphology will be offered in the
context of conventional two-phase and the three-phase models.
Another important consequence of the semicrystalline nature of polymers is that
under proper conditions, virtually all semicrystalline polymers may undergo a secondary
crystallization process. This can be readily understood from the viewpoint that
thermodynamically semicrystalline polymers are in a metastable state; therefore, under
proper conditions such as in the presence of enough thermal energy, further
crystallization can occur. This phenomenon, along with several proposed models, will be
discussed in the second section of this chapter.

8
Secondary crystallization process is often related to a multiple melting behavior
observable by calorimetry. Despite the numerous studies of this subject, controversies
still exist regarding the origin of the multiple melting behavior. In the third section of
this chapter, general aspects and competing mechanisms for multiple melting behavior
will be considered.
The last section will be devoted to an overview of crystallization and melting
behavior of bisphenol-A polycarbonate (PC). This will further explain some unique
features of PC crystallization such as its extremely slow crystallization kinetics. The
multiple melting behavior of semicrystalline PC will be also discussed.
2.1 The Two-phase and Three-phase Models
In this section, a brief review of the two-phase and the three-phase models will be
presented. In the context of the two-phase model, well-defined amorphous and
crystalline phases will be assumed; for the three-phase model, besides these two phases,
an interphase will be introduced. This interphase can be described as an intermediate
phase similar to either the amorphous (rigid amorphous phase) or crystalline (para-
crystalline phase) phases.
2.1.1 The Two-phase Model
Historically, semicrystalline polymer morphology has been described by a simple
two-phase model consisting of amorphous and crystalline phases. In early times, the
“fringed-micelle” model1 fully adopted these two clear phases. The essential features of
this model are schematically presented in Figure 2.1. The main characteristics of this
“ideal” model lie in two folds. First, this model does not intrinsically consider the
existence of interphase or transition zones, because immediately outside of the ordered

9
Figure 2.1 The fringed-micelle model for the morphology of semicrystalline polymers (from reference 1).

10
crystalline phase is a randomly oriented amorphous phase and vice versa. Without
sacrificing any main features of this model, one can describe the transition zones as
infinitesimally thin; therefore, as originally proposed, only two sharp phases: disordered
amorphous and ordered crystalline phases. Second, theses two distinguished phases
allow the assumption that any partial properties associated with each phase can be
represented by the fraction of the equilibrium properties of each phase. This statement is
significant in material property determination. One good example is that, in the
calculation of crystallinity from calorimetry study, if the above premise is truly
acceptable, the answer will be given as the ratio of measured heat of fusion to equilibrium
heat of fusion (i.e., Xc = �Hmexp/�Hm
o). This relationship is widely used, and in most
circumstances and within a certain degree of uncertainty, this equation is fairly
acceptable*. This fringed micelle model has been successfully applied to describe the
morphology and structure-property relationship of rubber, cellulose, and polymers with
low crystallinity2. For example, in the explanation of the observed increase of strength of
elastomer with crystallinity, this model may suggest that the pinning effect of embedded
crystalline phase will increase the strength; if so, as crystallinity increases so does the
modulus.
2.1.2 The Three-phase Model
* Despite the simplicity of this equation, an accurate determination of �Hmo is not an easy task. This is mainly because
an extrapolation is mandatory regardless of the type of methods to set the proper value of �Hmo. This extrapolation
could be subject to large uncertainty, especially when crystallinity is low. It also needs to be noted that for more
accurate crystallinity determination, the surface enthalpy term (�Hms) and temperature corrections for heat of fusion
must be included. This will be especially important when the crystals are not all lamellar-type crystals and when the
apparent melting temperature is far below the equilibrium melting temperature. This issue will be further discussed in
Chapter 7.

11
Since the discovery of the chain folding nature of semicrystalline polymers, the
validity of the two-phase model has often been challenged by more complicated, yet
more realistic, models3. Figure 2.2 illustrates, some of the models assuming specific
description of the crystal/liquid interphase. These various models have important
features. First, chain folding is required to form three-dimensional crystals; therefore, the
surface property, such as surface energy in the basal plane (�e) where chain folding takes
place will be different from that in lateral plane (�s). Largely speaking, �e is in the range
of 40 to 100 mJ/m2, and �s is in the vicinity of 5 to 20 mJ/m2. Second, the existence of
various types of chain folds such as tight folds (adjacent reentry, (a)), loose loops (non-
adjacent reentry, (b)), tie molecules and free ends (chain cilia, (b)) will give rise to a
transition zone, or an interphase between lamellar crystals and disordered free melt. The
formation of an interphase is a clear deviation from the simple two-phase model, in
which the physical nature of the interphase is not questioned because it is assumed to be
infinitesimally thin.
Numerous experimental observations suggested the existence of interphase:
In calorimetry study, the lower intensity of relaxation strength at Tg (�Cp at Tg) even after
considering the effect of crystallinity, e.g., poly(oxymethylene) (POM)4, polyethylene
(PE)5, isotactic polypropylene (it-PP)6, poly(caprolactone)7, isotactic polystyrene (it-PS)8,
poly(butylene terephthalate) (PBT)9, poly(ethylene terephthalate) (PET)7,10,
poly(phenylene sulfide) (PPS)11,12, poly(ether ether ketone) (PEEK)13, and thermoplastic
polyimide (TPI)14;
In dielectric measurement, the unexpected decrease of �-relaxation intensity in the
presence of crystals, e.g., TPI14, PEEK17;

12
�
�
�
Crystalline
Amorphous
Interfacial Zone
Figure 2.2 Two typical models considering the nature of chain folding: (a) regular folds (adjacent reentry); (b) irregular folds (non-adjacent reentry)(from reference 3).
(a)
(b)

13
In dynamic mechanical analysis, the broadening and shifting of Tg in
semicrystalline polymers, e.g., TPI15, Bisphenol-A polycarbonate (PC)18;
In SAXS study, direct measurement of the interphase thickness, e.g., PPS11, TPI14.
Again, all of these diverse and independent techniques unanimously agree on the
existence of the interphase. However, despite these numerous observations suggesting
the presence of interphase, fundamental questions regarding its physical nature remain
open. In the following review of this section, two types of interphase will be discussed:
1) a rigid amorphous phase that assumes this interphase is more akin to the amorphous
phase, and 2) para-crystalline phase that treats the interphase as pseudo-crystalline phase.
Based on some experimental observations, the nature of interphase will be discussed.
2.1.2.1Rigid Amorphous Phase
All amorphous polymers are in a single equilibrium phase above Tg, as are the
semicrystalline polymers above Tm. These completely mobile chains will be gradually
hindered in their motions by a decrease in temperature; upon reaching Tg, all the chains
become virtually frozen, exhibiting very restricted local motions such as bond rotation.
By several experimental methods, such as calorimetry and volume dilatometry, this glass
transition behavior can be accurately monitored. From calorimetry, for instance, Tg is
often defined as the inflection point of the heat capacity step. Another important
parameter characterizing the amorphous state is heat capacity change at Tg per se. In
principle, the change in heat capacity at Tg (�Cp at Tg) must reveal the relaxation
strength of all the amorphous chains undergoing glass transition. Therefore, the
intensity of �Cp step, or the relaxation strength at Tg for semicrystalline polymers, will be
diminished because the fraction of amorphous chains participating in glass transition has

14
been reduced. Under the strict application of the two-phase model, the heat capacity
change at Tg can be used to determine the crystallinity of a given semicrystalline system
through a simple relationship, if the �Cp associated with the fully amorphous state can be
measured:
Xc = 1- fmaf = 1- �Cpsc/�Cp
am [2.1]
Where Xc is crystallinity, fmaf is a fraction of mobile amorphous phase, and �Cpsc and
�Cpam are the heat capacity changes at Tg in the semicrystalline and completely
amorphous polymers, respectively. Equation (2.1) assumes that all the amorphous
polymer chains relax at Tg and that polymer chains in the crystalline phase do not.
In reality, many authors, including Wunderlich et al.4,6,7,9,10,12,13 and Cebe et
al.11,14, often observed that the right side of equation (2.1) is greater than the measured
crystallinity either from calorimetry study or from other independent methods such as
WAXS. These results strongly suggest that in the case of semicrystalline polymers, not
all the amorphous chains relax at the normal glass transition temperature. Based on this
observation, Wunderlich et al.6,19,20 introduced the concept of rigid amorphous fraction
(RAF), which is the fraction of amorphous chains that does not relax at the normal glass
transition temperature. Accordingly, equation (2.1) should be reformulated as follows.
fr = 1- �Cpsc/�Cp
am [2.2]
fr = Xc + fraf [2.3]

15
Where fr is the total rigid fraction, the summation of crystallinity (Xc) and rigid
amorphous fraction (fraf).
Equations (2.2) and (2.3) clearly demonstrate that the existence of a RAF will
lead to the inequality of equation (2.1). More importantly, the inapplicability of equation
(2.1) is a clear deviation of a simple two-phase model, since the conventional two-phase
model strictly assumes two distinctive phases, not the third phase that does not follow the
characteristic behavior of either the amorphous or the crystalline phase. The existence of
RAF was originally proposed based on calorimetric measurement, yet other methods,
such as dielectric measurement, DMA, and SAXS, pointed out similar results (for proper
references, see above).
The introduction of a RAF helped significantly, at least conceptually, in the
development of the three-phase model composed of mobile amorphous (liquid-like), rigid
amorphous (non-liquid like), and crystalline phases. Although the existence of RAF (also
called non-liquid like amorphous phase) has been suggested by various techniques, some
questions regarding its fundamental nature are still open: the location of RAF, difference
between RAF and mobile amorphous, and the description of the relaxation behavior of
RAF.
Regarding the first question, at least three “geographical” locations could be
assigned. They are 1) the interspherulitic amorphous region, where non-crystallized
chains may be accumulated after spherulites impingement; 2) interlamellar stacks (liquid
pocket zone); and 3) interlamellar amorphous layer. Among these possibilities, the last
two locations have recently been proposed to be the most probable. Sauer and Hsiao27
calculated the total rigid fraction (RF) from SAXS measurements, assuming that the RAF

16
formed in the interlamellar amorphous layer does not contribute to the glass transition,
and that the rigid amorphous between the lamellar stacks will increase and broaden
normal Tg. They showed that, based on these two hypotheses, the measured RAF value
from SAXS is close to the value from DSC. Recently, Srinivas and Wilkes15, based upon
the observed decrease of lamellar thickness with time, used the “lamellar insertion
model” for the mechanism of secondary crystallization, in which thinner lamellae form in
the region of lamellar stacks. These authors also adopted the assumption that the
amorphous fraction in the interlamellar layer may not contribute to Tg due to the thinness
of amorphous layer. This “dual lamellar thickness” model, originally proposed by
Keller21 and later by Bassett et al.22 as a plausible mechanism of multiple melting
behavior often observed for semicrystalline materials, intrinsically assumes the
development of rigid fraction in the region of interlamellar stacks and interlamellar
amorphous layer. Various secondary crystallization models will be further considered in
the next section. Cebe et al. provided evidence suggesting that RAF develops in the
amorphous layer, which could be either the interlamellar region or the interlamellar
stacks, from various techniques such as DSC11,14,23, MDSC23,24, dielectric16,17, DMA16
and SAXS11,14,23. These studies of RAF suggest that interlamellar stacks and/or
interlamellar amorphous layer could be the possible locations of rigid amorphous
fraction; however, their results do not rule out the possibility that the interspherulitic
amorphous zone may contribute to the formation of RAF.
The next question is how the properties of RAF differ from those of the pure
amorphous phase. The presence of crystals will constrain the neighboring amorphous
phase and may prevent it from relaxing at the normal Tg. This constrained amorphous

17
interphase would be composed of chain cilia, tight or loose loops, which may or may not
have the same average chain conformation as mobile amorphous since they have a
constrained conformation70. Intuitively speaking, this interphase will have an
intermediate chain conformation somewhere between well-ordered crystals and that of a
completely disordered amorphous. These intermediate chain conformation would be
reflected in the density of the RAF (�raf); accordingly, if measured properly, the expected
RAF density would be somewhere between the crystal density (�c) and amorphous
density (�a). Cebe et al.11 calculated �raf of PPS crystallized from the glassy and melt by
the combination of DSC and WAXS techniques. In addition, from SAXS, under the
assumption of a well-defined one dimensional step-wise electron density distribution
along a direction normal to the lamellar stacks, they estimated the thickness of lamellae,
amorphous and rigid amorphous phases. From this study, they concluded that �raf being
equal to 1.325 g/cc is very close to the pure amorphous density (�a = 1.3195 g/cc) but
considerably far from the density of the crystal (�c = 1.430 g/cc). The thickness of the
RAF layer is reported to be approximately 40Å, and the mobile amorphous layer is ca. 30
-50Å. It also needs to be noted that in case of PPS, Cebe et al.11,23 consistently reported a
very high value for RAF bigger than 0.4 in case of cold crystallization, and this is,
compared with PEEK17 (0.24-0.32) or TPI17 (0.10-0.15), the largest value ever reported.
The measured density of RAF qualitatively agrees with the prediction that it
would be between �a and �c, and more importantly, that the value is quite close to the
amorphous density. This result may indicate that within a limited uncertainty,
conventional two-phase model may suffice at least from the standpoint of density
variation, although for an accurate description of semicrystalline polymer morphology

18
the three-phase model will be necessary. Based upon these observations, the RAF can be
envisaged as a constrained amorphous phase existing between the crystals exhibiting
slightly higher macroscopic density compared with mobile amorphous phase.
Lastly, the relaxation behavior of the RAF will be considered. One of the
important consequences of the existence of the RAF is the upward shift and broadening
of Tg. This is mainly because, as described earlier, the constrained amorphous will not
completely relax at the normal Tg. Several experimental observations have been made
showing the Tg increase and broadening upon crystallization in various polymers9,11-17,23-
26. Equations (2.2) and (2.3) allow the quantitative determination of the amount of rigid
fraction, yet it does not consider the relaxation behavior itself. For this, it is necessary to
know the characteristic relaxation time and its distribution in RAF, which is, however,
substantially complicated since a rigid amorphous phase may relax in the whole
temperature range between Tg and Tm28-30. To simplify this problem of broad overlap,
Sauer et al.27 and Srinivas et al.15 formed the hypothesis that RAF in the interlamellar
region does not contribute to Tg shift, but the RAF residing in the interlamellar stacks
does (see above). The premise of this critical hypothesis lies in the relative thinness (�
50Å) of the observed interlamellar amorphous layer thickness from SAXS measurement
in many semiflexible polymers14,27,30-33, compared with the gap between the interlamellar
stacks27 (300 –800Å). However, Cebe et al.11 reported that in the case of PPS exhibiting
the largest RAF ever reported, the interphase thickness is about 40Å. Based on this
result, one can postulate that other semicrystalline polymers such as PET, PEEK and TPI
will have a thinner interphase than PPS since these polymers are known to have lower
levels of RAF than PPS. Actually, Cebe et al.14 reported 20�5Å of interphase thickness

19
for TPI. These studies indicate that the above hypothesis– RAF in the interlamellar
region does not contribute to Tg– may not reflect the true nature of RAF since the
interphase thickness seems thinner than the entire interlamellar amorphous layer
thickness. Mobile amorphous chains remaining in the interlamellar amorphous layer may
relax at normal Tg. To elucidate the precise nature of the RAF, especially the “retarded”
relaxation behavior, fundamental research is needed.
2.1.2.2Pseudo-Crystalline Phase
Until now, the interphase between crystals was understood in light of the rigid
amorphous phase, which can be depicted as a less mobile amorphous phase due to the
constraints imposed by surrounding crystals. This type of approach is based on the
hypothesis that the nature of the interphase is akin to an amorphous phase rather than a
crystalline phase. Supporting this premise is the observation that RAF density is
noticeably close to that of amorphous11 (see above).
However, recently it has been claimed that the nature of interphase is closer to the
crystalline phase based on TMDSC, DMA, and TMA measurements34. For example,
Petermann et al.34 used this “pseudo-crystalline” or “para-crystalline” concept to interpret
the low endotherm in multiple melting behavior in PET. Again, this concept is basically
the same as the RAF in the sense of introducing the existence of an interphase, yet it
treats the interphase closer to crystalline phase. As with RAF, various questions
regarding the para-crystalline phase remain unanswered.
In summary, despite the simplicity and usefulness of the conventional two-phase
model, the more precise nature of semicrystalline polymer morphology may be better
understood in the context of the three-phase model consisting of crystalline, free melt,

20
and interphase. From various techniques, including but not limited to DSC, SAXS,
dielectric and thermo-mechanical measurements, this interphase has been interpreted as a
rigid amorphous phase that does not relax at the normal glass transition but at higher
temperatures due to the constraints imposed by surrounding crystals. While the quantity
of RAF can be readily determined from the known crystallinity and heat capacity change
at Tg, its physical nature, such as its exact relaxation behavior, is far from being
completely understood. As an alternative for the explanation of interphase, the concept
of pseudo-crystalline phase has recently been introduced.
2.2 Secondary Crystallization
2.2.1 Overall Crystallization Kinetics
Largely speaking, crystallization is a type of phase transformation, in which a
thermodynamic driving force results from the decrease of Gibbs free energy by formation
of the more stable crystalline phase. In the case of polymer crystallization, complete
transformation, thus the achievement of 100% crystallinity, is seldom possible for kinetic
reasons. The overall isothermal transformation kinetics, initially formulated by Göler et
al.35, can be effectively described by the Avrami theory38, which was originally
formulated for metals. Later this was modified by Evans36 and Morgan37 for different
growth geometry. The Avrami equation relates the fraction or amount of uncrystallized
material (�) that persists in the system after some time t at the crystallization temperature
to its growth rate parameter k and the nucleation parameter n.
� = exp(-k�tn) [2.4]

21
The overall transformation rate k embodies both nucleation and growth rates, assumed by
Avrami to take place under isovolume conditions, where a change from amorphous to a
fully crystallized state occurs. The equation was further modified by Mandelkern39 to
include some aspects of incomplete crystallization encountered in polymer
crystallization. It is important to remember that the idea of a distinct phase
transformation from amorphous to crystalline is implicit in this model wherein the value
of the n exponent is an integer generally varying from 2 to 4 depending on the geometry,
dimensionality of the growth process, and mode of nucleation. For example, if n is 4,
growth is three-dimensional spherulitic and occurs from nucleated centers created
sporadically in location and time (i.e., homogeneous or thermal nucleation). For n= 3
nucleation is predetermined in time (heterogeneous or athermal nucleation) and the form
of growth of spherulites.
In polymer crystallization, however, a non-integral value of n is often encountered
because of the complexity of the phase transformation. These complexities are, to name
a few, volume shrinkage upon crystallization, variable crystallinity within the spherulite,
and possible mixing of thermal and athermal nucleation.
Equation (2.4) can be rewritten in terms of crystallinity (Xc), which is often
determined from calorimetry or volume dilatometry.
� = 1 Xc(t)/Xc� = exp(-k�tn)
or Xc(t)/Xc� = 1 exp(-k�tn) [2.5]

22
Where Xc(t) is a crystallinity at a given time and temperature, and Xc� represents the
maximum crystallinity for a given crystallization temperature.
After taking a double logarithm on both sides and proper manipulation, equation (2.5)
can be linearized to give the exponent n and the growth parameter k from the slope and
calculated intercept, respectively.
ln[-ln(1-Xc(t))] = lnk + nlnt [2.6]
Experimentally, it has long been known that in polymer crystallization, equation
(2.6) is a good approximation up to a certain period of time, yet at longer times negative
deviations from Avrami behavior is observed. A typical behavior is illustrated in Figure
2.3, which presents the double logarithmic plot of crystallinity as a function of
crystallization time measured from dilatometry and calorimetry for polyethylene fraction
(Mw = 85,000 g/mol), crystallized from the melt at 127.5oC40. While the initial part of the
plots is indeed linear, being the slope (n) equal to 2.5, after a certain period of time (40 to
50 minutes) the slope of the line starts to decrease to approximately 0.5.
This type of observation for PE and other polymers has led to the formal breakup
of the crystallization process into two processes: primary and secondary. As noted
earlier, the primary crystallization kinetics can be dealt with using the Avrami equation,
while the secondary crystallization cannot. Although often, primary and secondary
crystallization overlap, the secondary crystallization process is generally characterized as
a slow process to complete the crystallization. Once again, it needs to be underscored
that the time scale in Figure 2.3 is in logarithm; therefore, the increase of crystallinity

23
Crystallization Time (min)
10 100 1000
-ln[1
-Xc(
t)]
0.1
1
10
Calorimetry - MeltingCalorimetry - Crystallization
Dialtometry
Figure 2.3 A typical example of primary and secondary crystallizationin polyethylene. Sample has been crystallized at 127.5oC from DSC and dilatometry (data from reference 40). Y-axis has been expressed in terms of negative logarithm of residual amorphous fraction upon crystallization so that the slope in this figure represents the Avrami exponent, n, (see equation 2.6 in the text). In this particular case, n for the primary and the secondary crystallization is close to 2.5 and 0.5, respectively.
Primary Secondary
n 2.5
n 0.5

24
during the secondary crystallization stage is substantially smaller and slower than during
the primary crystallization.
2.2.2 Secondary Crystallization Models
In the literature, the long-time evolution of crystallinity through the secondary
crystallization stage has often been associated with the lamellar thickening mechanism41-
43. This conclusion has been reached by studying the effect of annealing on relatively
high crystallinity linear PE. Fischer and Schmidt have reported, from SAXS
experiments, that upon annealing, the long period of single crystals of linear PE linearly
increases with the logarithm of annealing time44,45. Some other studies also showed
similar log-time kinetics46-49. It is important to note that all of the studies quoted above
have been more or less limited in scope, devoted to the annealing effects and lamellar
thickening above �c relaxation temperature of PE under relatively low undercooling, or
even upon direct crystallization from the melt.
In polymers with medium to low levels of crystallinity, the effects of long-time
annealing on crystallinity, morphology, and properties are far less understood, which
could be due in part to the high number of polymers and a wider range of methodologies
that can be applied. While these factors should be beneficial, the interpretation of results
from different techniques or a combination of techniques can lead to conflicting
conclusions. For instance, in contrast to PE41-49 or it-PP50-52, poly(ethylene terephthalate)
(PET), whose Tg is above room temperature, has been studied over the entire range from
Tg to Tm. Various mechanisms for the long-time annealing effect on the crystal structure
and morphology have been suggested: lamellar thickening53, evolution of a new
population of lamellae54, combination of thickening and recrystallization53, and crystal

25
perfection55,57,58. The thermal transitions and morphological changes observed upon
heating from the isothermal crystallization or annealing temperature have been attributed
to melting and recrystallization56 or the melting of separate populations of lamellae53,54.
It is highly unlikely, however, that lamellar thickening is at the origin of
secondary crystallization of semi-flexible polymers such as PET, PBT, PEEK, PPS and
PC at lower temperatures. For these polymers, the chain rigidity is unfavorable to the
reorganization at the lamellar fold surface, which is required if isothermal lamellar
thickening is to occur. Although some of these polymers such as PET59-62, PEEK63 and
PC64, were proposed to exhibit an �c relaxation, such a transition should only be
observed, if at all, at temperatures much closer to the apparent melting temperature (this
will be further detailed for PC in Chapter 6). Thus, isothermal lamellar thickening, if it
exists, cannot be the dominant mechanism for the secondary crystallization of
semiflexible polymers annealed at temperature close to Tg.
The above proposed secondary crystallization mechanisms in either flexible or
semi-flexible polymers can be classified into two major processes: reorganization,
including lamellar thickening and crystal perfection of pre-existing lamellae crystals; and
formation of new crystals upon secondary crystallization. In the first hypothesis,
lamellae initially formed during primary crystallization can be more stable through either
lamellar thickening or crystal perfectioning by the diffusion of imperfections existing
inside the crystals. Polyolefins such as PE44-49,65,66 and it-PP6,65,67,68,76 are good examples.
Above the �c-relaxation temperature, for example, PE can thicken during the secondary
crystallization stage. This thickening mechanism, however, may not be the most feasible
mechanism of secondary crystallization in other semi-flexible polymers such as PEEK,

26
PET, PPS and PC since, as noted previously, no �c relaxation has been experimentally
observed for these polymers. Therefore, commonly observed log-time dependent
crystallinity increase during the secondary crystallization stage cannot be attributed to the
lamellar thickening mechanism in the case of semi-flexible polymers. In this case, the
second hypothesis, the formation of new crystals appears to be more appropriate.
Although this formation of new crystals is likely to be at the origin of secondary
crystallization, there are considerable debates regarding the location and the nature of
secondary crystals: 1) lamellar insertion model93,96, in which secondary crystals are
thinner lamellae formed in the interlamellar amorphous layer; 2) stack insertion
model15,32,33,106-108, in which stacks of thinner secondary lamellae form in the interlamellar
stacks (or in the liquid pocket zone); and 3) bundle-like secondary crystallization
model64,70,75,110-111, in which bundle-like or fringed-micelle type crystals form in the
amorphous layer between the preexisting crystals either in interlamellar or in stacks. The
differences in these models are schematically presented in Figure 2.4. Although they
contain the essential characteristics of each model, these graphical presentations should
be taken with caution since the sizes of lamellae, either primary or secondary, and
bundle-like crystals are not to scale.
The lamellar insertion model is primarily based upon SAXS data, from which the
long spacing (Lp) can be assigned as either twice the first minimum or the first maximum.
Further under the assumptions of two-phase and one dimensional stack plate models,
lamellar thickness (�c) and amorphous layer thickness (�a) can be determined from the
known crystallinity. Hsiao et al., from the morphology study of PEEK93, observed the
decrease of long spacing and lamellar thickness with crystallization time, but relatively

27
(a)
(c)
(b)
Spherulite
Figure 2.4 Various secondary crystallization models: (a) Lamellar insertion model; (b) Stack insertion model; (c) Bundle-like secondary crystallization model (for detailed description of each model, see the text).

28
constant �a; and they attributed theses results to the formation of new lamellae inserted
between the interlamellar amorphous layer upon secondary crystallization (lamellar
insertion model). Later, this model was seriously challenged by Verma et al. due to the
inconsistent observation that the amorphous layer thickness does not decrease even after
the new lamellae insertion31. Instead, Verma et al. claimed that thinner secondary
lamellae form between the separate lamellar stacks, and further that these thinner
lamellae grow simultaneously and independently with primary lamellae, not by the
insertion mechanism.
Very recently, Hsiao et al., from the morphology study of PET32 and PBT33,
discarded the previous lamellar insertion model, and claimed instead the stack insertion
model, in which new lamellae form in the liquid pocket or interlamellar stacks. This
model is similar to the mechanism proposed by Verma et al.31, but with a difference in
whether the formation is simultaneous or serial. Srinivas et al. observed the decrease of
lamellar thickness with crystallization time from the study of TPI and claimed that this
decrease is consistent with the stack insertion model15. Although this dual lamellar
morphology model has been widely recognized in several independent studies, no
unanimous agreement has been achieved regarding the sequence of formation, whether
the two different lamellar populations grow simultaneously31,112 or in series15,22,32,33. To
avoid these complexities, some authors did not specify the sequence, although they did
interpret the polymer morphology in terms of the dual lamellar population model109.
This dual lamellar population model, regardless of the sequence of lamellar
formation, is predominantly based on the interpretation of SAXS data. Morphological
information from the SAXS is most often based on two-phase model and one-

29
dimensional correlation function analysis113. From these two simplified assumptions, the
morphology of semicrystalline polymers is envisaged as alternating between two well-
defined layers: lamellae and amorphous. Under this assumed morphology, the
correlation function of SAXS intensity data yields two thicknesses, L1 and L2 (with
L1>L2) the sum of which is equal to the long period (Lp). The assignment of the crystal
thickness (�c) to either L1 or L2 has to be made on the basis of other information. In other
words, SAXS data alone can not identify which length corresponds to either the lamellar
or amorphous layer thickness. This intrinsic difficulty of SAXS data analysis has led to a
controversy, as lamellar thickness was in some cases attributed to the shorter
thickness14,15,23,58,107-109, and in others, to the larger thickness31-34,93,106,114. Despite several
studies devoted to this topic, the question has not been settled definitely.
It needs to be emphasized that the assumptions of the two-phase model and the
linear correlation function in SAXS data analysis will lead to the detection of only well-
defined layer thickness. The serious question is, what if the secondary crystals are not of
the lamellar-type, making their electron density distribution unable to be interpreted by
an idealized stacked plate model? This potential problem of SAXS was recently pointed
out by Alizadeh et al. in the study of ethylene/1-octene copolymer75. They claimed that a
lamellar morphology coexisting with fringed-micellar structure cannot be interpreted by
an idealized stacked plate model used in classical analysis of SAXS data, since the
fluctuation in electron density along the normal to the lamellar surface is far from
matching the density expected for this idealized stack model.
Despite numerous investigations of secondary crystallization, no quantitative
information regarding the size or orientation of secondary crystals has been gained, and

30
no quantitative analysis of calorimetric data has been reported to support the notion that
the secondary crystals are indeed lamellar type crystals. For instance, in the literature,
multiple melting behavior is often attributed to the existence of two different populations
of lamellae, thinner lamellae for low endotherm and thicker lamellar for high endotherm
based on combined calorimetric and SAXS data31,32,107-109. It needs to be underscored,
however, that this conclusion was achieved through a more or less qualitative
understanding of the evolution of the endothermic behavior, not by a systematic and
quantitative analysis of each endotherm as a function of temperature, time, and molar
mass. Marand and his coworkers extensively investigated the multiple melting behavior
in several types of polymers, such as ethylene/�-olefin75, PEEK70, PET115, PBT115, nylon-
6115, and PC64,110,111, and unambiguously showed that the characteristic of the low
endotherm cannot be associated with chain-folded lamellar type structures except,
possibly at the highest secondary crystallization temperatures. This conclusion was based
on two major findings. First, at the initial stage of secondary crystallization, the Avrami
exponent from the plot of heat of fusion associated with the low endotherm (�Hmlow) vs
log[time] is 0.5, showing the kinetics of secondary crystals to be very different from that
of lamellar type crystals. Second, the peak position of the low endotherm (Tmlow)
increases linearly with logarithm of time over several decades, and more importantly, at a
shorter time of secondary crystallization, the melting temperature of secondary crystals
becomes very close to the crystallization temperature (i.e., Tm Tx), suggesting that the
formation of secondary crystals is reversible. It is necessary to remember that lamellar
formation is not a reversible process, and even at a shorter time of crystallization, the
melting temperature of lamellar crystals is always significantly higher than the

31
crystallization temperature. It also needs to be noted that the peak melting temperatures
of the high endotherms of the above mentioned semiflexible polymers do not change
during secondary crystallization unless they are annealed at very high temperature close
to the apparent melting temperature. The kinetics of secondary crystallization will be
further detailed in Chapter 5.
Based on these observations, a new model of secondary crystallization has been
proposed, and is schematically presented in Figure 2.4 (c). The major characteristic that
distinguishes this new model from the previous two models is that the secondary crystals
are visualized as bundle-like or fringed-micellar type crystals at low temperatures and
mosaic blocks at high temperatures, and lamellar crystals at the highest temperatures.
Again this model is qualitative so that more quantitative information such as the size and
the orientation of small secondary crystals can not be theoretically predicted. The
thicknesses of lamellar and the interlamellar amorphous layer, in case of semicrystalline
PC, are known101 to be approximately 40 to 50Å, and 70 to 150Å, respectively. These
numerical values must be taken with a caution that, depending on the crystallization and/
or annealing conditions and molar mass, there exist considerable variations.
In summary, the non-equilibrium nature of semicrystalline polymers leads to a
secondary crystallization phenomenon, which occurs, more than likely, through a
combination of multiple processes, such as reorganization and two or more populations
of crystals with different thermal stabilities. In the case of rigid backbone polymers, such
as PEEK, PET, and PC, however, reorganization such as isothermal lamellar thickening
seems unlikely to be the main mechanism of secondary crystallization considering chain
rigidity. As a secondary crystallization model for these systems, three models have been

32
proposed, namely, lamellar insertion, stack insertion, and bundle-like secondary
crystallization models. The first two models propose, mainly based on the SAXS
experiments, that secondary crystallization occurs through the formation of thinner
lamellae inserted during crystallization, either in an interlamellar amorphous layer or in
lamellar stacks. On the other hand, from the quantitative analysis of calorimetric data
and morphology studies, the last model claims that secondary crystals do not have a
lamellar nature but form through a non-chain folding process; it is thus more likely that
they are bundle-like crystals grown between the preexisting main lamellae.
2.3 Multiple Melting Behavior
This review will be restricted to the investigation of multiple endothermic
transitions resulting from isothermal crystallization and/or annealing of semicrystalline
polymers from the glassy or from the melt states.
High molar mass linear PE, rigid backbone polymers such as PEEK, PET, PPS,
PC, and polymers with regio-defects, and copolymers such as ethylene/�-olefin
copolymers exhibit multiple melting endotherms upon heating in the DSC. Typical
multiple melting traces in the case of PC is illustrated in Figure 2.5. Although the
crystallization kinetics of PC is extremely slow, under proper temperature and time
conditions it is crystallizable, and upon heating, it exhibits multiple melting endotherms,
in which the high endotherm is around 230oC and the low endotherm appears ca. 10 to
20oC above the initial crystallization temperature. The exact position of the low
endotherm is dependent on crystallization temperature and time. Although in this
particular case we observe two endotherms, it has been reported that by step-wise
crystallization methods, one can control the number of endotherms; for instance, Cebe et

33
Temperature (oC)
180 200 220 240
dq/d
T (
J.g-1
.K-1
)
0
1
2
Figure 2.5 A multiple melting behavior of semicrystalline bisphenol-A polycarbonate (Mw = 18,800 g/mol, Mw/Mn =2.0). Sample has been
crystallized at 170oC for 192 hours. Melting traces were recorded at10oC/min heating rate. Temperature scale was properly calibrated using In-sandwich sample (for detail, see Chapters 3 and 4).

34
al. reported as many as 7 endotherms for PPS69. Similar results have been obtained for
PEEK70, PET71,72.
More importantly, this multiple melting behavior is virtually a universal
phenomenon, observed for many flexible or semi-flexible semicrystalline chain
polymers. Among polymers known to exhibit this multiple melting behavior are:
- (high molar mass) polyethylene (PE)74 and its copolymers with �-olefin75
- isotactic polypropylene (i-PP)6,76
- isotactic polystyrene (i-PS)77-79
- poly(vinyl chloride) (PVC)80-82
- polyamides (several even numbered nylons)83-85
- poly(ethylene terephthalate) (PET)53,56,86,87
- poly(butylene terephthalate) (PBT)9
- poly(phenylene sulfide) (PPS)12,23,24,69,88
- poly(arylene ether ether ketone) (PEEK)13,91-94,97-99
- thermoplastic polyimide (TPI)14,15
- bisphenol-A polycarbonate (PC)18,101,102
Of these polymers, PE and its copolymers, TPI, and semi-flexible polymers such as PET,
PEEK, and PPS have been the subject of extensive study in attempts to understand this
multiple melting behavior.
In case of PET, Holdsworth and Tuner-Jones56 suggested that the multiple
endotherms are the result of the melting of the lamellae originally formed at the
crystallization temperature and their further recrystallization during heating followed by
the final melting of the recrystallized lamellae. Groeninckx et al.53 later challenged this

35
model. They investigated the effects of various thermal treatments on the crystallinity,
melting behavior, and morphological features with the conclusion of the possibility of
crystal perfection without thickening as well as the partial melting and recrystallization.
Zhou and Clough86 and Lin and Koenig87 attributed the low endotherm to the melting of
small imperfect lamellae formed during the secondary crystallization process.
Lemstra et al.77, in a study of the triple endothermic melting behavior of
isothermally crystallized it-PS, identified the upper two endotherms in the DSC scan as
the process of melting-recrystallization-remelting, but fail to provide a well-supported
model for the low endotherm. They suggested that one possible reason for the small
annealing endotherm could be a process of “densification”, possibly a secondary
crystallization, without specifying the mechanism for the process.
In a study on multiple melting of Nylon 6,6, Bell et al.84 suggested the
coexistence of two different morphological forms of the polymer that melt
correspondingly at different temperatures: one kinetically favored, the other
thermodynamically favored.
In case of PEEK, like other polymers, despite a considerable amount of studies,
controversies still exist regarding the interpretation of multiple melting endotherms in the
DSC heating scan. Blundell and Osborn89, two of the first authors to identify the multiple
melting endotherms of PEEK, attributed these multiple endotherms to the melting-
recrystallization-remelting process following the model proposed by Holdsworth and
Turner-Jones for PET56. Later, Lee and Porter defined the high endotherm as the
maximum of the combined endothermic melting and exothermic recrystallization peaks
of the continuously reorganizing crystalline regions90. In contrast to these interpretations,

36
which are largely based on a reorganization model, the dual lamellae population model
was discussed by Cebe and Hong91 and Bassett et al.22, and was further expanded with
morphological evidences by other authors92-94. Cebe and Hong studied the melting
behavior of PEEK by applying a cyclic thermal treatment in the DSC on a previously
crystallized sample91. They demonstrated that the upper melting endotherm remained
unchanged as a result of successive heating above the temperature of the previous
treatment, followed by immediate cooling down of the sample. The only feature of the
DSC heating scans that changed during this particular treatment was the position and the
heat of fusion of the low endotherm, which appeared just above the highest previous
thermal treatment temperature. Based on this observation, it was suggested that the low
endotherm represents the melting of a secondary population of less perfect, thus less
stable, lamellae that melt just above the isothermal crystallization temperature.
Additional evidence against the melting-recrystallization-remelting model has
been provided in a work on the thermal properties of PEEK by Cheng et al.13, and by the
morphology study of Bassett et al.22. A sequence of DSC heating scans of samples that
were isothermally melt-crystallized for various times showed unequivocally that the high
endotherm develops first and should, therefore, be associated with the melting of primary
PEEK lamellae. However, Cheng et al.13 did not completely exclude the possibility of
partial reorganization during the heating scan.
Bassett et al.22 suggested that the two peaks in the typical double melting scan of
PEEK represent the melting of different components within the spherulitic morphology;
these components are formed at different stages of the crystallization process and situated
at physically different locations within the spherulitic structure. At the earlier stage of

37
primary crystallization, primary lamellae develop to occupy but not fill the spherulitic
structure. Upon heating in the DSC, the melting of these primary lamellae occurs at the
high endotherm. At the later stage, secondary crystallization, a population of secondary
lamellae develops from the melt between the primary ones. These secondary lamellae are
smaller and stable only up to a temperature slightly above the crystallization temperature.
The constraining effect of the primary lamellae is named as the reason for the slowing
down of the secondary stage of crystallization. The authors are cautious in assigning a
specific molecular mechanism for the secondary crystallization. Rather, they assign its
name according to the time factor: it represents the development of new lamellae after the
formation of the dominant primary ones. Finally they point out that such a model of
sequential crystallization would be applicable to the crystallization mechanism of other
chain folding polymers of intermediate crystallinity, namely it-PS and PET.
Very recently Marand et al.70 studied the crystallization and melting behavior of
PEEK crystallized from both the glassy and from the melt. From the quantitative
analysis of calorimetric data, they concluded that indeed the low endotherm is
dominantly a melting of separate populations of crystals, yet 1) at a relatively low
temperature of crystallization temperature (Tx < 320oC), secondary crystals are not of the
lamellar type but appear to be bundle-like crystals grown between the primary lamellae;
2) at higher temperature (Tx > 320oC), the crystallization kinetics of secondary crystals
approaches that of lamellar type crystals.
In summary, despite the numerous investigations for various semiflexible
polymers mentioned above, the true nature of multiple melting behavior has yet to be
completely understood. The two most competing explanations are 1) the reorganization

38
process during heating scan, and 2) the existence of two or more crystal populations with
different thermal stabilities. As noted earlier, in a particular temperature range of
crystallization and/or isothermal annealing, either one of these processes could be
dominant, nonetheless, a single mechanism seems unlikely to be fully responsible for the
multiple melting behavior occurring in the whole temperature between Tg and Tm.
Therefore, in general, multiple endotherms occurring between Tg and Tm of given
semicrystalline polymers upon heating should be understood as a consequence of the
combination of the above two mechanisms.
2.4 Crystallization and Melting Behavior of PC
2.4.1 Crystallization
Since the commercialization of bisphenol-A polycarbonate (PC), in the mid
1950s, there has been diverse research into this material. Among them, crystallization
studies are relatively few, since its crystallization kinetics are extremely slow, especially
for the commercially applicable molar mass range (> 15,000 g/mol); also in most
applications, amorphous PC is generally used. High molar mass PC (> 60,000 g/mol)
used for coatings, films, and filaments processed from the solution due to its high melt
viscosity, can be readily crystallized up to the extent of 25 to 30 %116. In other
processing conditions such as high pressure during injection molding, PC can develop a
small extent of crystallinity (�8%)127.
Falkai and Rellensmann117,118 measured the spherulite growth rate from the bulk
at different temperatures and concluded that PC (Mv = 33,000 g/mol) shows a maximum
growth rate at 190oC. In addition, from volumetric dilatometry, they reported that the
primary crystallization kinetics follow the classical nucleation and growth mechanism

39
with the Avrami exponent of 3, regardless of the crystallization temperature between
175oC and 205oC118.
Bonart124, based on X-ray data, reported that PC has a monoclinic crystal structure
of density equal to 1.3022 g/cm3. Kämpf concluded from a morphology study of bulk
crystallized PC (Mv =33,000 g/mol) that PC crystallizes slowly (190oC for 8 days) and
forms spherulitic structures119.
Due to PC’s extremely slow bulk crystallization kinetics, the majority of later PC
crystallization studies adopted other methods of crystallization. These are:
- solvent induced crystallization (SINC)128,129,131,132,134
- vapor induced crystallization (VINC)18,101,102,126
- plasticizer and/or nucleating agent (organic or inorganic)104,105,130,133
Some of these methods enhance the crystallization kinetics by the factor of 200 times
over that of conventional bulk crystallization130. According to Mercier et al.104,105,133, the
final crystallinity could be increased up to 76 %, and the apparent melting temperature of
nucleated PC could be as high as 295oC, which approaches one of reported equilibrium
melting temperature (~ 327oC)98. Considering that bulk crystallized PC seldom exceeds
25 to 30% crystallinity with 230oC apparent melting temperature18,101,102,117,131,132, these
remarkable results demonstrate the critical effect of nucleating agents. Legras and
Mercier suggested that this exceptionally high apparent melting temperature of nucleated
PC might be due to the extended chain morphology104,133.
Although the above methods can enhance the crystallization kinetics of PC, there
are some crucial drawbacks. When PC is crystallized in the presence of plasticizer and/or
organic or inorganic nucleating agents a considerable degradation may occur. Mercier et

40
al. reported that in some cases, molar mass has been decreased by as much as 50% of its
initial value in the presence of nucleating agents130. The decrease of molar mass in the
presence of nucleating agents is rare because in general nucleating agents serve as a
physical nucleating sites leading to the increase of number density for potential nuclei.
To explain this somewhat peculiar behavior, Mercier et al. proposed the “chemical
nucleation model”, in which they claimed that nucleating agents chemically react with
PC through chain scission104,105. These chemically modified ionic chain-ends may
enhance the crystallization kinetics. Based on this observation, they concluded that at
least some portion of the increased crystallinity should be ascribed to the decrease of
molar mass.
In cases of SINC or VINC, the difficulty lies in the complete removal of the
residual solvent. Even after a prolonged drying, approximately 0.5% of solvent still
exists and may act as plasticizer, which may decrease the glass transition temperature of
the sample considered132, although some authors claimed that these residual solvents
should not affect the crystallization kinetics18,102,103.
To avoid these undesirable molar mass decreases or plasticizer effects upon
crystallization, bulk crystallization is preferred. Another reason for bulk crystallization is
that the potential effects of plasticizers, nucleating agents, and residual solvents on
secondary crystallization and multiple melting behavior are not known. However, even
in the case of bulk crystallization, there is still a possibility of molar mass decrease
through thermal degradation, since bulk crystallization requires a relatively high
temperature (180-190oC) and prolonged crystallization time (on the order of days)117-119.
To minimize thermal degradation, PC samples must be thoroughly dried under vacuum

41
above the glass transition temperature of the given sample; they also must be crystallized
under an inert atmosphere. Prolonged crystallization (at 190oC for 504 hours) without
degradation has been reported even under these careful experimental conditions131.
2.4.2 Multiple Melting Behavior of PC
The bulk of earlier investigations on semicrystalline PC relied primarily on
methodologies such as optical microscopy117,119,126, dilatometry118, WAXS124,125 and
mechanical testing120,123. Although these various techniques revealed some valuable
aspects of semicrystalline PC, such as spherulitic morphology, crystal structure, and
modulus, other information obtainable only by calorimetry was not provided.
Calorimetry studies on semicrystalline PC started to appear rather recently. Gallez et al.
studied the effect of plasticizer (in this particular case, trimellitic acid) on the kinetics of
PC crystallization; they provided a DSC thermogram exhibiting a small but
distinguishable shoulder as well as a main melting peak at 245oC130. Later, Wissler and
Crist studied the relationship of heat capacity increase at Tg (i.e., �Cp at Tg) with the
degree of primary crystallization131. In this work they crystallized PC (Mw =30,000
g/mol) both from the solution and from the bulk, yet they only reported DSC thermogram
from the solution, in which a single peak was observed although the peak became
broadened with crystallinity. Jonza and Porter also reported a similar broad single peak
with high endotherm shoulder101. They crystallized PC (Mw =37,000 g/mol) initially in
the presence of acetone vapor and further annealed at two different temperatures, 197oC
and 230oC, for various times between 4 and 125 hours. Di Filippo et al.132 studied the
relaxation behavior of semicrystalline PC (Mv =32,000 g/mol) crystallized by VINC, and
their thermograms are similar to those of Jonza and Porter.

42
Recently Laredo et al. studied the influence of aging and crystallinity on the
molecular motion of PC (Mw =33,000 g/mol), and in this work they reported that two
well-separated peaks appear around 180oC and 220oC, respectively upon acetone vapor
induced crystallization18. Mendez et al. studied the effects of annealing temperature and
time on the melting behavior of PC (Mw =33,000 g/mol), and in this work they clearly
showed the multiple melting behavior of semicrystalline PC upon heating102. They
crystallized the samples in the presence of acetone vapor and then further annealed them
at different temperatures and times.
These several independent investigations on the melting behavior of
semicrystalline PC fail to show consistent results in DSC melting traces. Considering the
fact that in all above studies, the authors used similar molar mass commercial samples
(Mw =30,000 to 37,000 g/mol) crystallized by the same vapor-induced crystallization
technique, these inconsistencies in the DSC thermograms are difficult to understand. The
reason might be due to the possibility that upon VINC, the sample may not be
homogeneously crystallized; this heterogeneity may result in sometimes broad and
otherwise clear multiple melting behavior upon heating. It is highly unlikely that molar
mass distribution is at the origin of these different behaviors since all studies mentioned
used commercial PC samples not fractions. This observation may suggest a potential
problem in the VINC technique of polymer crystallization. To prevent this erratic
behavior, sample thickness should be precisely determined based upon the time- and
crystallinity- dependent diffusion behavior of the solvent or vapor used. Ware et al.
reported a non-Fickian diffusion behavior from the study of acetone-induce
crystallization of PC128. In the present work, as will be shown later, multiple melting

43
behavior was consistently observed regardless of molar mass, molar mass distribution,
crystallization temperature, and time. This consistency indirectly shows sample
homogeneity upon bulk crystallization.
Laredo et al. attributed the multiple melting behavior of PC to reorganization,
without providing any evidence for it18. Mendez et al. drew the same conclusion based
on the temperature dependent shift of low endotherm102. Again, they did not pay
attention to the quantitative analysis of the low endotherm, but rather interpreted the data
from the viewpoint of reorganization process based on qualitative observations of
thermograms. If the multiple melting behavior is truly arising from reorganization, then
low and high endotherm should both be dependent on heating rates. A detailed
discussion of the reorganization process will be offered in Chapter 4. Neither of the
above two investigations provided this heating rate dependent behavior of semicrystalline
PC; therefore, the conclusions from previous studies must be verified in the light of more
systematic and quantitative calorimetric studies.
In summary, compared with other widely investigated multiple melting behavior
of semi-flexible polymers such as PEEK, PET, PPS, and TPI, a relatively small number
of studies have been reported for PC. To further complicate the situation, the results
from these limited studies are not consistent in terms of the multiple melting behavior and
did not provide a precise mechanism for the multiple melting behavior. In this regard,
systematic and quantitative calorimetry study will be necessary to clearly resolve the
issue of multiple melting behavior in PC.

44
References
1. J. Schultz, “Polymer Materials Science”, 1974, Prentice-Hall, Inc, Englewood Cliffs,
New Jersey.
2. J. H. Magill, “Morphogenesis of Solid Polymer Microstructure”, in “Treaties on
Materials Science and Technology, Volume 10, Properties of Solid Polymeric
Materials, Part A,” ed. J. M. Schultz, 1977 Academic Press, New York.
3. L. Mandelkern, “The Crystalline State”, in “Physical Properties of Polymers”, 1984,
ed. J. E. Mark, ACS Washington D.C.
4. H. Suzuki, J. Grebowicz, B. Wunderlich, Brittish Polym. J., 1985, 17, 11.
5. C. L. Beatty, F. E. Karasz, J. Macromol. Sci.-Rev. Macromol. Chem., 1979, C17, 37.
6. J. Grebowicz, S. F. Lau, B. Wunderlich, J. Polym. Sci.:Polym. Symp., 1984, 71, 19.
7. J. Menczel, B. Wunderlich, J. Polym Sci. Polym. Lett. Ed., 1981, 19, 265.
8. F. E. Karasz, H. E. Bair, J. M. O’Reilly, J. Phys. Chem., 1965, 69(8), 2657.
9. S. Z. D. Cheng, R. Pan, B. Wunderlich, Macromol. Chem., 1988, 189, 2443.
10. B. Wunderlich, “Thermal Analysis”, 1990, Academic Press: Sandiego, CA.
11. P. Huo, P. Cebe, Colloid Polym. Sci., 1992, 270, 840.
12. S. Z. D. Cheng, Z. Q. Wu, B. Wunderlich, Macromolecules, 1987, 20, 2802.
13. S. Z. D. Cheng, M. Y. Cao, B. Wunderlich, Macromolecules, 1986, 19, 1868.
14. P. P. Huo, J. B. Friler, P. Cebe, Polymer, 1993, 34, 4387.
15. S. Srinivas, G. L. Wilkes, Polymer, 1998, 39, 5839.
16. P. P. Huo, P. Cebe, Polymer, 1993, 34, 696.
17. P. Cebe, P. P. Huo, Thermochimica Acta, 1994, 238, 229.
18. E. Laredo, M. Grimau, A. Muller, A. Bello, N. Suarez, J. Polym. Sci. Polym. Phys.,
1996, 34, 2863.
19. S. F. Lau, B. Wunderlich, J. Polym Sci. Polym. Phys., 1984, 22, 379.
20. H. Suzuki, J. Grebowicz, B. Wunderlich, Macromol. Chem., 1985, 186, 1109.
21. A. Keller, IUPAC Int. Symp., Macromol. Proc., Florence, 1980, p 135.
22. D. C. Bassett, R. H. O’Relley, I. A. M. Al Raheil, Polymer, 1988, 29, 1945.
23. S. X. Lu, P. Cebe, M. Capel, Macromolecules, 1997, 30, 6243.
24. S. X. Lu, P. Cebe, Polymer, 1996, 37, 4857.
25. J. C. Coburn, R. H. Boyd, Macromolecules, 1986, 19, 2238.

45
26. D. S. Kalika, R. K. Krishnaswamy, Macromolecules, 1993, 26, 4252.
27. B. B. Sauer, B. S. Hsiao, Polymer, 1995, 36, 2553.
28. P. Huo, P. Cebe, Mat. Res. Soc. Symp. Proc., 1991, 215, 93.
29. P. Huo, P. Cebe, J. Polym. Sci. Polym. Phys., 1992, 30, 239.
30. P. Huo, P. Cebe, Macromolecule, 1992, 25, 902.
31. R. K. Verma, V. Velikov, R. G. Kander, H. Marand, B. Chu, B. S. Hsiao, Polymer,
1996, 37, 5357.
32. Z. G. Wang, B. S. Hsiao, B. B. Sauer, W. G. Kampert, Polymer, 1999, 40, 4615.
33. B. S. Hsiao, Z. G. Wang, F. Yeh, Y. Gao, K. C. Sheth, Polymer, 1999, 40, 3515.
34. M. Bonnet, K. D. Rogausch, J. Petermann, Colloid Polym. Sci., 1999, 277, 513; C. D.
Breach, X. Hu, J. Mater. Sci. Lett., 1996, 15, 1416; J. J. Scobbo, C. R. Hwang,
Polym. Engr. Sci., 1994, 34, 1744.
35. V. Göler, F. Sacks, G. Sacks, Z. Phys., 1932, 77, 281.
36. U. R. Evans, Trans. Faraday Soc., 1945, 41, 365.
37. L. B. Morgan, Phil. Trans. Phys. Soc., 1954, A247, 13.
38. M. Avrami, J. Chem. Phys., 1939, 7, 1103; 1940, 8, 212; 1941, 9, 177.
39. L. Mandelkern, “ Crystallization of Polymers”, 1964, Ch. 8, McGraw Hill, New
York.
40. A. Booth, J. H. Hay, Polymer, 1969, 10, 95.
41. J. M. Schultz, R. D. Scott, J. Polym. Sci., 1969, A-2, 7, 659.
42. J. D. Hoffman, J. J. Weeks, J. Chem. Phys., 1965, 42, 4301.
43. B Wunderlich, J. Mellilo, Macromol. Chem., 1968, 118, 250.
44. E. W. Fischer, G. F. Schmidt, Angew. Chem. 1962, 1, 488.
45. E. W. Fischer, Pure Appl. Chem., 1972, 31(1), 113.
46. W. Banks, M. Gordon, R. J. Roe, A. Sharples, Polymer, 1963, 4, 61.
47. S. Buckser, L. H. Tung, J. Phys. Chem., 1959, 63, 763.
48. F. Rybnikar, J. Polym Sci., 1960, 44, 517.
49. D. T. Grubb, J. H. Liu, M. Caffrey, D. H. Blderback, J. Polym. Sci. Polym. Phys.,
1984, 22, 367.
50. L. C. E. Struik, Polymer, 1987, 28, 1521.
51. R. H. Boyd, Polymer, 1985, 26, 323.

46
52. D. Schaeter, H. W. Spiess, U. W. Suter, W. W. Fleming, Macromolecules, 1990, 23,
3431.
53. G. Groeninckx, H. Reynaers, H. Berghmans, G. Smets, J. Polym. Sci. Polym Phys.,
1980, 18, 1311; G. Groeninckx, H. Reynaers, J. Polym. Sci. Polym Phys., 1980, 18,
1325.
54. J. P. Bell, T. Murayama, J. Polym. Sci., part A-2, 1969, 7, 1059.
55. R. C. Roberts, Polymer, 1969, 10, 117.
56. P. J. Holdsworth, A. Tuner-Jones, Polymer, 1971, 12, 195.
57. S. Fakirov, E. W. Fischer, R. Hoffmann, G. F. Schmidt, Polymer, 1977, 18, 1121.
58. E. W. Fischer, S. Fakirov, J. Mat. Sci., 1976, 11, 1041.
59. A. Lovinger, D. Davis, F. Padden, Polymer, 1985, 26, 1594.
60. K. O’Leary, P. H. Geil, J. Macromol. Sci., 1967, B1, 147.
61. P. Zoller, P. Bolli, J. Macromol. Sci. Phys., 1980, B18, 55.
62. K. Iler, H. Bruer, J. Colloid Sci., 1963, 18, 1.
63. J. Rault, J. Macromol Sci. Rev. Macromol. Chem. Phys., 1997, C37(2), 335.
64. A. Alizadeh, S. Sohn, L. C. Shank, H. D. Iler, H. Marand, submitted to
Macromolecules.
65. J. Enns, R. Simha, J. Macromol. Sci., 1977, B13, 25.
66. J. Enns, R. Simha, J. Macromol. Sci., 1977, B13, 11.
67. J. Blais, R. S. Manley, J. Macromol. Sci., 1967, B1, 525.
68. P. Törmala, J. Macromol Sci. Rev. Macromol. Chem. Phys., 1970, C17, 297.
69. J. S. Chung, P. Cebe, Polymer, 1992, 33, 2325.
70. H. Marand, A. Alizadeh, R. Farmer, R. Desai, V. Velikov, Macromolecules, in print.
71. F. J. M. Rodriguez, P. J. Phillips, J. S. Lin., Macromolecules, 1996, 29, 7491.
72. E. M. Woo, T. Y. Ko, Colloid Polym Sci., 1996, 274, 309.
73. R. G. H. Lammertink, M. A. Hempenius, I. Manners, G. J. Vancso, Macromolecules,
1998, 31, 795.
74. F. Sakaguchi, L. Mandelkern, J. Maxfield, J. Polym. Sci., Polym Phys, 1976, 14,
2137.
75. A. Alizadeh,L. Richardson, J. Xu, S. McCartney, H. Marand, Y. W. Cheung, S.
Chum, Macromolecules, 1999, 32, 6221; Bull.Am. Phys. Soc.,1999, 44(1), 1562.

47
76. W. K. Busfield, C. S. Blake, Polymer, 1980, 21,35.
77. P. J. Lemstra, T. Kooistra, G. Challa, J. Polym. Sci. Part A-2, 1972, 10, 823.
78. Z. Pelzbauer, R. St. J. Manley, J. Macromol. Sci- Phys, 1973, B7, 345.
79. J. Vivirito, H. D. Iler, H. Marand, unpublished results.
80. K. H. Illers, Makromol. Chem., 1969, 127, 1.
81. H. E. Bair, P. C. Warren, Macromol. Sci.-Phys., 1981, B20, 381.
82. A. Gray, M. Gilbert, Polymer, 1976, 17, 44.
83. P. Weigel, R. Hirte, C. Ruscher, Faserforsch. Textiletech., 1974, 25, 283.
84. J. P. Bell, P. E. Slade,J. H. Dumbleton, J. Polym. Sci. Part A-2, 1968, 6, 1773.
85. F. Shuren, Z. Guanguha, T Qun, Y. Yuqin, J. Thermal Anal., 1993, 39, 875.
86. C. Zhou, S. B. Clough, Polym. Eng. Sci., 1988, 28, 65.
87. S. B. Lin, J. L. Koenig, , J. Polym Sci. Polym. Symp., 1984, 71, 121.
88. J. S. Chung, P. Cebe, Polymer, 1992, 33, 2312.
89. D. J. Blundell, B. A. Osborn, Polymer, 1983, 24, 953.
90. Y. Lee, R. S. Porter, Macromolecules, 1987, 20, 1336.
91. P. Cebe, S.-D. Hong, Polymer, 1986, 27, 1183.
92. M. P. Lattimer, J. K. Hobs, M. J. Hill, P. J. Barham, Polymer, 1992, 33, 3971.
93. B. S. Hsiao, K. H. Gardner, D. Q. Wu, B. Chu, Polymer, 1993, 34, 3986; B. S. Hsiao,
K. H. Gardner, D. Q. Wu, B. Chu, Polymer, 1993, 34, 3996.
94. J. Wang, M. Alvarez, W. Zhang, Z. Wu, Y. Li, B. Chu, Macromolecules, 1992, 25,
6943.
95. A. Jonas, R. Legras, J.-P. Issi, Polymer, 1991, 32, 3364.
96. A. M. Jonas, T. P. Russel, D. Y. Yoon, Macromolecules, 1995, 28, 8491.
97. S.-S. Chang, Polymer, 1988, 29, 138.
98. A. J. Lovinger, S. D. Hudson, D. D. Davis, Macromolecules, 1992, 25, 1752.
99. H. Marand, A. Prasad, Macromolecules, 1992, 25, 1731.
100. K.-N. Kruger, H. G. Zachmann, Macromolecules, 1993, 26, 5202.
101. J. M. Jonza, R. S. Porter, J. Polym. Sci. Polym. Phys., 1986, 24, 2459.
102. G. Mendez, A. J. Müller, J. Thermal Analysis, 1997, 50, 593.
103. R. P. Kambour, F. E. Karasz, J. H. Daane, J. Polym. Sci. part A-2, 1966, 4, 327.

48
104. C. Bailly, M. Daumerie, R. Legras, J. P. Mercier, J. Polym. Sci. Polym. Phys.,
1985, 23, 343; C. Bailly, R. Legras, J. P. Mercier, J. Polym. Sci. Polym. Phys.,
1985, 23, 355; C. Bailly, M. Daumerie, R. Legras, J. P. Mercier, J. Polym. Sci.
Polym. Phys., 1985, 23, 493.
105. R. Legras, C. Bailly, M. Daumerie, J. M. Dekoninck, J. P. Mercier, V. Zichy, E.
Nield, Polymer, 1984, 25, 835.
106. B. S. Hsiao, B. B. Sauer, J. Polym Sci. Polym Phys., 1993, 31, 901.
107. A. M. Jonas, T.P. Russel, D. Y. Yoon, Macromolecules, 1995, 28, 8491.
108. A. M. Jonas, T.P. Russel, D. Y. Yoon, Colloid Polym. Sci., 1994, 272, 1344.
109. C. Fougnies, P. Damman, D. Villers, M. Dosiere, M. H. J. Koch, Macromolecules,
1997, 30, 1385; C. Fougnies, P. Damman, M. Dosiere, M. H. J. Koch,
Macromolecules, 1997, 30, 1392; C. Fougnies, M. Dosiere, M. H. J. Koch, J.
Roovers, Macromolecules, 1998, 31, 6266.
110. S. Sohn, A. Alizadeh, H. Marand, L. C. Shank, H. D. Iler, American Chemical Soc.
Polym. Preprint, 1999, 81, 250.
111. S. Sohn, A. Alizadeh, H. Marand, Polymer in print.
112. M. P. Lattimer, J. K. Hobbs, M. J. Hill, P. J. Barham, Polymer, 1992, 33, 3971.
113. G. R. Stroble, M. J. Schneider, J. Polym. Sci. Polym. Phys., 1980, 18, 1343; G. R.
Stroble, M. J. Schneider, I. G. Voigt-Martin, J. Polym. Sci. Polym. Phys., 1980, 18,
1361.
114. G. Konard, H. G. Zachmann, Kolloid Z. Z. Polym., 1971, 247, 851.
115. A. Alizadeh, S. Sohn, H. Marand to be published.
116. Hermann Schnell, “Chemistry and Physics of Polycarbonates”, 1964, John Wiley &
Sons, Inc.
117. B. Falkai, W. Rellensmann, Makromolekular Chem., 1964, 75, 112.
118. B. Falkai, W. Rellensmann, Makromolekular Chem., 1965, 88, 38.
119. G. Kämpf, Kolloid-Zeitschrift, 1960, 172, 50.
120. J. P. Mercier, J. J. Aklonis, M. Litt, A. V. Tobolsky, J. Appl. Polym. Sci., 1965, 9,
447.
121. F. Gallez, R. Legras, J. P. Mercier, Polym Engr. Sci., 1976, 16, 276.

49
122. K.-H. Hellwege, J. Hennig, W. Knappe, Kolloid-Zeitschrift und Zeitschrift für
Polymere, 1962, 186, 29.
123. K.-H. Hellwege, J. Hennig, W. Knappe, Kolloid-Zeitschrift und Zeitschrift für
Polymere, 1964, 188, 121.
124. R. Bonart, Makromol. Chem., 1966, 92, 149.
125. A. Prietzschk, Kolloid Z., 1958, 156(1), 8.
126. R. E. J. Fryer, J. Appl. Polym. Sci., 1974, 18, 2261.
127. K. Djurner, J-A. Manson, M. Rigdahl, J. Polym Sci., Polym. Lett., 1978, 16, 419.
128. R. A. Ware, S. Tirtowidjojo, C. Cohen, J. Appl. Polym. Sci., 1981, 26, 2975.
129. E. Turska, W. Benecki, J. Appl. Polym. Sci., 1979, 23, 3489.
130. F. Gallez, R. Legras, J. P. Mercier, Polym Engr. Sci.,1976, 16, 276.
131. G. E. Wissler, B. Crist. Jr, J. Polym Sci., Polym.Phys., 1980, 18, 1257.
132. Giuseppe V. Di Filippo, Maria E. Gonzalez, Maria T. Gasiba, A.V. Müller, J. Appl.
Polym. Sci., 1987, 34, 1959.
133. F. Gallez, R. Legras, J. P. Mercier, J. Polym Sci. Polym. Phys., 1976, 14, 1367; R.
Legras, J. P. Mercier, J. Polym Sci. Polym. Phys., 1977, 15, 1283; R. Legras, J. P.
Mercier, J. Polym Sci. Polym. Phys., 1979, 17, 1171.
134. J. Parlapiano, G. L. Wilkes, Polymer preprint, 1976; J. Parlapiano, M.S Thesis,
1976, Virginia Tech., Blacksburg, Virginia.

50
Chapter 3
Materials and Experimental
This chapter is composed of three main parts: first, a description of the
fractionation and purification procedures, and few words about sample preparation;
second, the description of experimental techniques used in the present study; and lastly,
amorphous sample characterization. The result of amorphous sample characterization
will be included in this Chapter, as a precursor to the study of semicrystalline
polycarbonate, which will be offered in Chapters 4 to 7.
Commercial materials and fractions have been characterized in terms of molar
mass distribution, glass transition temperature (Tg), heat capacity change at Tg (�Cp at
Tg), and room temperature amorphous density (�a).
Most widely used polycarbonates are bisphenol-A based polycarbonate (i.e.,
aromatic polycarbonates), yet aliphatic polycarbonates do exist1. In the present study,
however, only bisphenol-A polycarbonates have been utilized, so without any further
complication, sample nomenclature can be abbreviated as PC for bisphenol-A
polycarbonate.
3.1 Sample Preparation
Two types of materials were used for this study: commercial samples and
fractions from one of the higher molar mass commercial PC. Two different molar mass
commercial PC’s were supplied from GE under the trade name of “Lexan” in the form of
pellets. NMR analysis revealed these two commercial PCs to be chemically identical,
and from the results of GPC (solvent CHCl3, at 30oC), their molar masses and molar mass
distributions were characterized. To obtain the absolute molar mass of PC samples, a

51
universal calibration methods was used in GPC analysis. To remove the unknown effects
of additives in these commercial PCs on crystallization, both were purified. Actual GPC
traces of “as is” samples are shown in Figure 3.1, and molecular characteristics before
and after purification are listed in Table 3.1.
3.1.1 PC Fractionation
For this study, Dr. H. D. Iler (Eastern Mennonite Univ., VA 22802) kindly
fractionated one commercial PC (PC-28K, Mw = 28,000 g/mol) into 11 different molar
mass fractions ranging from approximately 4,300 to 55,000 g/mol. GPC traces of these
fractions and molar masses and distributions are presented in Figure 3.2 and in Table 3.2,
respectively. Detailed procedures of the fractionation are given below.
A solvent/non-solvent fractionation method similar to that described by Schnell2
and Sitaramaiah3 was used. The procedure involved stepwise addition of methanol (non-
solvent) to a 0.5% w/v solution of the polymer (PC-28K) in methylene chloride at
25.0�0.1oC. The fractionation flask was a 5L round bottom flask modified through the
addition of a 3cm diameter x 5cm extension designed to amass the denser polymer rich
phases resulting from each stage of the fractionation. For a given fraction, methanol was
added drop-wise* with vigorous stirring until the solution developed a slight haze
indicating a liquid/liquid phase separation** . After complete settling of the polymer rich
phase into the flask extension, the solvent rich phase was siphoned off into a catch flask
submerged in a 30oC water bath. The polymer fraction was then collected by shocking
with methanol and drying in a vacuum oven under a reduced pressure of 29.9 inches of
* Flow rate of non-solvent was about 12.5 ml/min.** For the first fraction, about 1000 ml of methanol was necessary, for the second or later fractions, however, only 40 to
50 ml of methanol was sufficient.

52
Retention Volume (mL)
18 21 24 27
Rel
ativ
e R
espo
nse
(mV
)
0
10
20PC-19K
PC-28K
Commercial
Figure 3.1 GPC traces of two commercial PC samples

53
Sample Purification Mw (g.mol-1) Mw/Mn
Before 18,800 1.99
PC-19K
After 19,300 2.01
Before 28,400 1.95
PC-28K
After 28,600 2.05
Table 3.1 Results from the molar mass characterization by GPC for two
commercial PC samples before and after purification.

54
Retention Volume (mL)
18 21 24 27
Rel
ativ
e R
espo
nse
(mV
)
0
10
20
30
40
50PC- 4K
PC- 6K
PC- 9K
PC-12K
PC-17K
PC-21K
PC-25K
PC-32K
PC-43K
PC-55K
Figure 3.2 GPC traces of PC fractions (see also Table 3.2).

55
Sample Mw (g.mol-1) Mn (g.mol-1) Mw/Mn
PC-4K 4,270 4,170 1.02
PC-6K 6,390 6,110 1.05
PC-8K 8,710 8,180 1.07
PC-12K 12,400 11,300 1.10
PC-17K 17,100 15,600 1.10
PC-21K 21,400 18,800 1.14
PC-25K 25,200 21,900 1.15
PC-30K 29,800 24,900 1.20
PC-32K 32,400 25,900 1.25
PC-43K 43,200 31,600 1.37
PC-55K 55,000 37,000 1.49
Table 3.2 Results from the molar mass characterization by GPC for PC fractions.

56
Hg at ambient temperature. Eleven fractions were obtained from 3L of initial polymer
solution by repeating these procedures. The fractionation apparatus is schematically
illustrated in Figure 3.3.
It should be noted that although the initial phase separation for a fraction appeared
to be liquid-liquid in nature, the polymer would crystallize from the polymer rich phase
during the time allotted for settling. This actually made polymer collection easier and did
not appear to adversely affect the fraction polydispersity. Also, the reported potential for
degradation of polycarbonate with this particular solvent/non-solvent system4,5 was
minimized by using HPLC grade solvents stored under dry nitrogen blankets and drying
the polymer fractions under vacuum at temperatures below 25oC.
GPC was used for the characterization of fractions, and molecular characteristics
are presented in Table 3.2 along with weight average molar masses and molar mass
distributions (polydispersity = <Mw>/<Mn>). Actual GPC traces are also plotted in
Figure 3.2. From Tables 3.1 and 3.2, it is clear that the polydispersity of fractions has
been reduced considerably upon fractionation almost up to the theoretical limit of 1.0,
especially in the case of low molar mass fractions. These more narrow samples will
provide an excellent opportunity for the study of molar mass distribution effect on the
crystallization kinetics, which is one of the main goals of this study. With molar mass
increase, polydispersity tends to increase although the value is still lower than that of
commercial samples. Also of interest, as seen in Figure 3.2, small shoulder starts to
appear around 32,000 g/mol fraction. Although the exact nature of this GPC peak
broadening at higher molar mass fractions is not completely understood, it might be due
to the presence of ring-type oligomers connecting polymer chains and thus hampering

57
Figure 3.3 A schematic diagram of fractionation apparatus.(a) heater; (b) stirrer; (c) non-solvent injection hole; (d) Siphoning hole; (e) polymer-rich phase; (f) solvent-rich phase; (g) 5L fractionation flask; (h) isothermal bath
(a)(b) (b)
(c) (d)
(e)
(f)
(g)
(h)

58
narrower fractionation. The present study, however, does not pursue the molecular
nature of these shoulders due to the extremely sluggish crystallizability of these high
molar mass fractions even under optimum conditions (see Chapter 5).
Once the molar masses of fractions are known, one can use the Stockmayer-
Fixman analysis6 to obtain the (normalized) unperturbed dimensions (<Ro2>/<M>) and
the chain stiffness factor (C�). The reliability of the molar masses determined by GPC
can be ensured by comparing these values with reported ones. Indeed, this analysis
confirmed that the molar masses of fractions from this study are quite acceptable. Detail
of the procedures and results of the Stockmayer-Fixman analysis are given in Appendix
A.1. Briefly, the reported values of unperturbed dimensions19 and C�
19 of PC are,
respectively, 0.93 and 2.0. From the analysis of the Stockmayer-Fixman plot using the
molar masses from the GPC, they have been found as equal to 0.84 and 1.83.
3.1.2 Purification
To remove the potential effects of impurities and of some additives on the
crystallization behavior of PC, commercial samples have been purified. The procedure
involved dissolving approximately 10 grams of PC in 100 ml of HPLC grade chloroform
and precipitating that solution very slowly in the excess amount of HPLC grade methanol
under vigorous stirring. Upon completion, precipitated PC was filtered and subsequently
washed with methanol (HPLC grade) several times. This was further dried under vacuum
for 24 hours at 150oC, which is above the glass transitions of two commercial PCs, to
ensure the complete removal of residual solvent and non-solvent. After drying, GPC
analysis was employed to check the molar mass change during the purification step.

59
Molar mass and molar mass distribution did not appear to change during the purification
step. GPC results are given in Figure 3.1 and Table 3.1.
3.2 Experimental
In the present study, various techniques have been used to characterize amorphous
and semicrystalline PC. These are differential scanning calorimetry (DSC) for the
monitoring of thermal behavior, density gradient column (DGC) for macroscopic density
measurement, and atomic force microscopy (AFM) and optical microscopy (OM) for
morphological studies. This section will describe general experimental methods involved
in these techniques. Before introducing these techniques, sample moulding method after
fractionation or purification will be offered. While this chapter deals only with
amorphous characterization, the methodologies used for the study of semicrystalline PC
are similar unless otherwise specified.
3.2.1 Sample Moulding
The fractions and purified commercial samples became porous and white (i.e.,
partially crystallized) solids after drying. To remove all thermal histories and to prepare
appropriate samples for various measurements, samples were reshaped into films using a
platen-heated Carver Laboratory press. For this procedure, an appropriate amount of
material was hot pressed at 250oC and 150 psi under a nitrogen atmosphere for 5 minutes,
and subsequently cooled down to room temperature. These fresh moulded samples were
shown to be amorphous by DSC and density measurements. These amorphous samples
were further characterized using various techniques described in the following section.
For bulk crystallization from the glassy state, amorphous films were wrapped in
aluminum foil and placed in an oven at the desired crystallization temperature

60
under an inert atmosphere. Specific crystallization conditions are detailed in the
following chapters.
3.2.2 Calorimetric Study
Differential scanning calorimetry (DSC) was used for the monitoring of thermal
behavior in amorphous or semicrystalline PC. A DSC-2 Perkin-Elmer calorimeter
operated with an ice and water bath was used. In order to reduce differences among
samples, discoid samples of 120�20 �m thickness and 11.0�1.0 mg weight were
employed. A linear horizontal baseline of the DSC signal was obtained before and after a
few series of DSC scans. This baseline corrects for the difference between the heat flow
output of a blank DSC pan and the reference pan to zero or a constant. The heat flow
output for the sample was obtained after subtraction of the baseline heat flow from the
recorded output for that sample. In the �CP measurement, sapphire calibration was done
for each sample and scan rate. Both heating and cooling experiments were performed at
different scan rates ranging from 0.3 to 40°C/min, although the majority of DSC melting
traces were recorded at 10oC/min heating rate. Temperature calibration during cooling
scans was achieved by recording the isotropic-to-nematic phase transition of p-
azoxyanisole. The theoretical value for the reversible isotropic to nematic phase
transition of this liquid crystal is equal to 136.0°C (see below).
Temperature calibration during heating scans was accomplished by recording the
melting transition of an indium standard sandwiched between two amorphous PC films.
This step was necessary for the correct temperature calibration in the experiments with
different heating rates, since polymers have lower thermal conductivity than metal
standards. Figures 3.4 (a) and (b) show typical examples of temperature calibrations

61
Scan Rate (oC/min)
-30 -20 -10 0 10 20 30
Tm o
f Azo
xyan
isol
e (o C
)
131
132
133
134
135
136
137
138
Heating Rate (oC/min)
0 10 20 30 40 50
Tm o
f In
(o C)
155
156
157
158
159
160
161
In Standard: Slope = 0.099
PC/In/PC Standard: Slope = 0.133
R2 = 0.999
Figure 3.4 Typical examples of DSC temperature scale calibrations upon heating (a) and cooling (b). Note about 30% higher slope in In-sandwich sample showing the thermal lag effect (for detail, see the text).
(a)
(b)

62
using In-sandwiched sample and normal metal standard upon heating (a) and p-
azoxyanisole upon cooling (b). In general, p-azoxyanisole is used only for the
temperature correction upon cooling, but even upon heating, it can serve as a good
standard material without thermal lag correction. The approximately 30% steeper slope
from the In-sandwiched sample suggests the existence of a considerable degree of
thermal lag due to the instrument as well as the low thermal conductivity of polymers.
An increase in heating rate and thus an increased thermal lag leads not only to a
shift in the peak melting temperature but also to a broadening of the melting endotherm.
The peak melting temperature can be effectively corrected using this In-sandwiched
sample, yet the broadening of the melting endotherm requires other calibration methods.
Gray’s procedure7,8 was used as a first approximation in the calibration of melting
endotherm peak broadening. Figure 4.2 (Chapter 4) shows a typical example of these
corrections. Some important features of Gray’s model have been briefly discussed in
Appendix A.2. Finally, instrument temperatures (resolution � 0.2oC) during isothermal
experiments were calibrated by extrapolating the melting temperatures of standards (tin,
lead and indium) to zero heating rate.
3.2.3 Density Measurement
Amorphous and semicrystalline PC densities were measured from the density
gradient column. The column was constructed from NaBr aqueous solution with a
resolution of 0.0003 g/cc. The calibration curve is shown in Fig 3.5. To remove the
surface effects such as impurities and bubbles, samples have been carefully moulded
between clean Kapton film. This PC film was cut to approximately 5mm � 5mm and
dropped into the column. The actual column reading was done after 8 hours of

63
Column Height (mm)
0 100 200 300 400 500 600
Den
sity
(g/
cm3 )
1.170
1.180
1.190
1.200
1.210
1.220
1.230
1.240
R2 =0.999
Figure 3.5 A typical example of calibration curve for density gradient column

64
equilibration, and 5 or more samples were used and averaged. The positions of standard
bead were checked every 48 hours, and whenever the bead heights varied more than the
resolution of column, 10-4 g/cc, the column was discarded. The lifetime of the density
gradient column was approximately 4 weeks.
3.2.4 Atomic Force Microscopy
Lamellar structures in spherulites from the cold-crystallized samples and
structures resulting from possible epitaxy of PC on calcite substrate were examined using
AFM. Details of sample preparation will be offered in the appropriate sections; however,
this section will present a general description of AFM used in this study. An atomic
force microscopy (Digital Instrument, Dimension 3000) was operated in tapping mode at
room temperature using nanosensor TESP (tapping etched silicon probe) type single
beam cantilevers. The resolution in Z-axis (i.e., vertical direction) was better than 0.1nm,
and in the plane of sample (i.e., x- and y- axis), the resolution was ca. 0.5nm. To
minimize the potential artifacts from tip broadening, the tip has been replaced whenever
the image was not reproducible. To enhance the image resolution, 1 Hz or slower scan
rate was used. Images were collected in both height and phase modes.
3.2.5 Optical Microscopy
The spherulitic structure of semicrystalline PC morphology has been examined
using polarized light optical microscopy (Zeiss, Axioplan) equipped with a Linkam
heating stage with temperature controller and camera. Temperature control in this
heating stage was better than �1oC, and the temperature scale was calibrated using the
onset melting temperatures of Indium and Tin standards.

65
Optical microscopy is usually used for morphology study; however in the present
investigation, it has also been applied to the determination of thin film melting
temperature. For this purpose, a photo diode detector and a light intensity analyzer were
connected to an OM equipped with heating stage. With this set of equipment, the change
in the polarized light intensity of the sample during heating could be monitored as a
function of temperature for a given heating rate. The distinct advantage of this technique
lies in being able to measure the melting temperature of very thin film crystallized on
transparent but inseparable substrate such as glass. This will be further described in
Chapter 6 along with the results.
3.3 Amorphous characterization
After fractionation and purification, amorphous samples were characterized in
terms of their glass transition temperature (Tg), heat capacity change at Tg (�Cp at Tg) and
amorphous density (�a). The first two properties were measured from calorimetry, and
the last, from density measurements. This characterization step is an important precursor
to crystallization study since the amorphous state can serve as “zero” crystallinity state.
In general, one of the most important phenomena representing the amorphous state is the
glass transition behavior. Before presenting the results, therefore, some general features
of glass transition behavior will be offered along with the introduction of several
important parameters characterizing glass transition region.
3.3.1 General Features of Glass transition Behavior
Glass transition can be defined as the change in relaxation behavior of polymer
chains from the long-range cooperative chain motions to short-range restricted chain
motions such as bond rotation. Below the glass transition temperature (Tg), polymer

66
chains are virtually frozen and act like a stiff spring (glassy state); however, above Tg,
polymer chains achieve enough thermal energy to move more freely (rubbery state) like a
weak spring. From the definition of Ehrenfest classification9 of phase transitions, glass
transition exhibits the characteristics of the second-order phase transition: continuity in
the first derivative of Gibbs free energy, such as enthalpy, entropy, and volume, but
discontinuity in the second order derivative of Gibbs free energy, such as thermal
expansion coefficient and heat capacity.
Phenomenologically, the glass transition temperature is defined as the inflection
point of heat capacity increase (decrease) upon heating (cooling) in a calorimetry study.
Figure 3.6 shows a schematic diagram of DSC traces around the glass transition region.
Five temperatures characterize the glass transition region10. The first perceptible
beginning of the glass transition, Tb, is judged by the first increase in heat capacity from
that of the solid glassy state. The extrapolated beginning and end of the glass transition,
T1 and T2, are indicative of the breadth of the major portion of the glass transition. The
major portion of Tg broadening will be reflected in �Tg (= T2-T1), which will be one of
the main subjects of Chapter 7. When judged by heat capacity increase, the glass
transition temperature, Tg, is chosen at half-devitrification. Finally, Te, the end of glass
transition, is reached when the heat capacity meets the liquid heat capacity.
Before applying this general description of glass transition from DSC, one
important caution needs to be mentioned. The precise shape of Figure 3.6 and Tg
depends on the scan rate. Therefore, whenever the glass transition temperature is
specified, the scan rate must be specified. Largely speaking, the more time is allowed in
the vicinity of the glass transition region (i.e., lower scan rates), the more time the

67
Temperature (arb. unit)
Hea
t Flo
w (
arb.
uni
t)
Tg
Tb
Te
T1
T2
�Cp
Figure 3.6 A schematic DSC traces in the glass transition region (For detailed description, see the text).

68
polymer chains will have to adjust themselves to an energetically favorable chain
conformation. Thus, upon decreasing the cooling rate, the departure from equilibrium
occurs at a lower temperature leading to the decrease of Tg.
Another important parameter in Figure 3.6 is the heat capacity difference between
the glassy and liquid states, i.e., �Cp at Tg. At the glass transition temperature, because of
chain mobility change, the heat capacity will undergo a jump, and this magnitude directly
reveals the intensity of relaxation of the amorphous phase for a given polymer. This was
discussed briefly in Chapter 2 and will be further discussed in Chapter 7.
3.3.2 Glass Transition Temperature in Amorphous PC
In this study, three different scan rates were used (-20, -10, -5oC/min) to observe
the effect of cooling rate on the glass transition temperature of PC fractions. The
necessary temperature scale corrections were done for each scan rate following the
procedures described in the previous section. After proper temperature correction, the
variation of Tg with the logarithm of cooling rate became almost linear, and by the
extrapolation to zero cooling rate for each fraction, Tgo could be determined. This value
was designated as the Tg for each fraction. The results are plotted in Figures 3.7 and 3.8
where, respectively, Tg is presented as a function of cooling rate and as a function of
<Mn>-1 and <Mw>. Figure 3.8 includes the data from the literature to compare with the
results from this study. Since the glass transition temperature is sensitive to the method
employed for its measurement, literature data11-14 obtained calorimetrically under similar
conditions are only included.
Figure 3.7 clearly shows the increase of Tg with molar mass. The variation of Tg
is over 25oC for the number average molar mass ranging between ca. 4,200 to 37,000
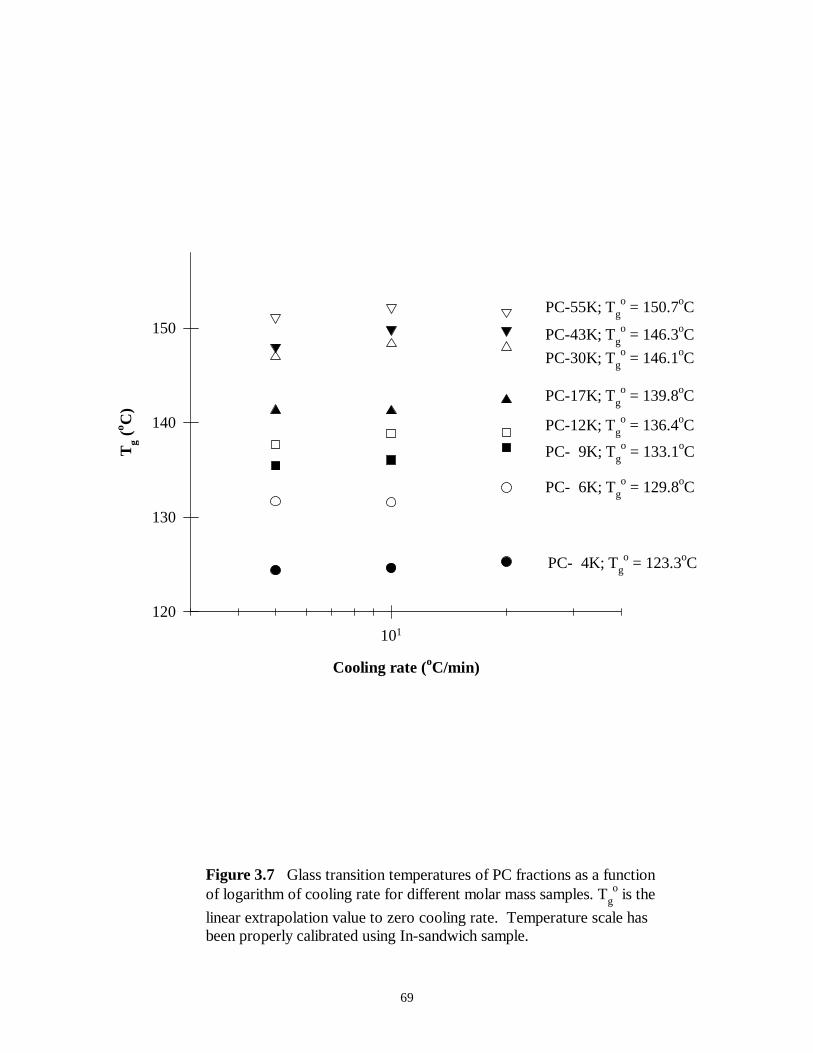
69
Cooling rate (oC/min)
101
Tg
(o C)
120
130
140
150
PC- 4K; Tgo = 123.3oC
PC- 6K; Tgo = 129.8oC
PC- 9K; Tgo = 133.1oC
PC-12K; Tgo = 136.4oC
PC-17K; Tgo = 139.8oC
PC-30K; Tgo = 146.1oC
PC-43K; Tgo = 146.3oC
PC-55K; Tgo = 150.7oC
Figure 3.7 Glass transition temperatures of PC fractions as a functionof logarithm of cooling rate for different molar mass samples. Tg
o is the
linear extrapolation value to zero cooling rate. Temperature scale has been properly calibrated using In-sandwich sample.

70
1/<Mn> x 104 (mol.g-1)
0 1 2 3 4 5
Tg (
o C)
100
110
120
130
140
150
160Adam et al.11
Wissler et al.12
This work (commercial)Dobkowski14
This work (fraction)
Figure 3.8 A variation of amorphous PC glass transition temperature as a function of <Mn>
-1(a) and as a function of <Mw> (b).
The polydispersity of fractions used in the present study was in the range of 1.02 to 1.49 and the polydispersity for the literature data including the commercials in this work is in the range of 2.0 to 3.5
<Mw> (g.mol-1)
104 105
Tg
(o C)
100
110
120
130
140
150
160
(a)
(b)

71
g.mol-1.
The particular way of presenting Tg with molar mass shown in Figure 3.8 (a),
follows the Fox-Flory equation15, in which the variation of Tg has been empirically
approximated as a linear function of <Mn>-1.
Tg = Tg� – K�<Mn>
-1 [3.1]
Where Tg� is the glass transition temperature of infinite molar mass, K is a material
constant related to the free volume of the given polymer, and <Mn> is a number average
molar mass. Overall, the agreement between the data from this study and from the
literature is acceptable, with the exception of somewhat lower Tgs of high molar mass
fractions in this study. Similar results have been reported from the study of polystyrene.
Monodisperse and polydisperse samples of polystyrene are indistinguishable when their
glass transition temperature is expressed as a function of Mn16.
However, when Tg is plotted as a function of Mw, the effect of molar mass
distribution becomes apparent. Results shown in Figure 3.8 (b) corroborate the strong
effect of polydispersity on the glass transition temperature. The samples from the
literature have a much broader molar mass distribution (Mw/Mn �2.0-3.5) than the
fractions investigated here. Note the systematic and significant deviation between the
narrower and broader molar mass distribution samples for Mw < 20,000 g.mol-1, when the
glass transition temperature is plotted as a function of weight average molar mass.
From the glass transition study of near monodisperse polystyrene, Lin claimed
that the plot of Tg vs <Mn> will show three characteristic regimes in which above MT (�

72
10�2Me, Me is an entanglement molar mass), glass transition temperature reaches a
plateau value17. In the case of PC, Me has been known to be around 1,300 to 1,600
g/mol18,19, and thus the molar mass for the upper bound is ca. 20,000 g.mol-1. As shown
in Figure 3.8 (a), Lin’s claim appears to not apply to PC fractions, since the glass
transition of Tg continuously increases with molar mass. This discrepancy is not
completely understood at present; however, the reason might be found in the relatively
broad molar mass distribution in higher molar mass PC fractions, although the
polydispersity indices of these samples are still smaller than those of commercial
materials.
These comparisons strongly suggest that for accurate studies of glass transition
and crystallization behaviors, near mono-disperse samples will be necessary to eliminate
the potential effect of the polydispersity. From this point of view, the fractions utilized in
the present investigation, especially for lower molar mass PC fractions, are expected to
reveal more precise effects of molar mass on the crystallization behaviors.
3.3.3 Heat Capacity Change at Tg
The difference of heat capacity change at Tg (�Cp = Cpl-Cp
g) is an important
parameter in describing chain relaxation behavior around the glass transition. For
example, semicrystalline polymers often exhibit a smaller magnitude of �Cp as compared
to the complete amorphous state because the chain molecules in the crystalline phase do
not exhibit segmental relaxation at nominal Tg. This well-known phenomenon has been
further developed and expanded to introduce the concept of rigid amorphous phase by
many authors (see Chapter 2 for proper references).

73
The variation of �Cp (HR = 10oC/min) of amorphous PC as a function of molar
mass is shown in Figure 3.9. The main feature is that with a decrease of molar mass, �Cp
at Tg increases. Similar results have been reported for other polymers20. Of more
interest, above a certain molar mass* (�15,000 g/mol), �Cp seems to be constant being
equal to 0.25 J�g-1�K-1. In the similar range of molar mass, �Cp of amorphous PC has
been reported20 as 0.3 J�g-1�K-1. Cheng and Wunderlich21 and Wunderlich and Jones22
reported �Cp of amorphous PC as 0.22 and 0.25 J�g-1�K-1, respectively. Adam and Hay11
reported it as 0.17 J�g-1�K-1. DiMarzio and Dowell23, Kim and Burns24, and Wissler and
Crist12 reported it as 0.24, 0.22 and 0.29 J�g-1�K-1, respectively. In these various studies,
molar masses were in the range of 25,000 to 45,000 g/mol. The average value (see
Figure 3.9) of 0.25 J�g-1�K-1 from this study agrees with previous reports.
3.3.4 Amorphous Density
As a last step in amorphous PC characterization, the densities of PC fractions
have been measured. The results are presented in Figure 3.10. Except for two relatively
low molar mass fractions (PC-9K and PC-12K), all the other fractions showed an
essentially constant value, an average being equal to 1.1977 � 0.0002 (g/cm3). This value
is in agreement with the reported values, being from 1.196 to 1.200 (g/cm3) of amorphous
PC12,13,26-28.
In the case of relatively low molar mass fractions** , there could be some
crystallinity developed during air cooling due to the relatively fast crystallization kinetics.
* Interestingly, the mechanical property of amorphous PC has been shown to change rather abruptly around this molar
mass, and Wilkes has attributed this to the formation of the effective entanglements at or above this critical molar
mass25.

74
<Mn> (g/mol)
0 10000 20000 30000 40000
�C
p (J
.g-1
.K-1
)
0.24
0.26
0.28
0.30
0.32Fractions
Commercial materials
<Mcr> = ca. 15,000 g/mol
Figure 3.9 Heat capacity change at Tg as a function of number average
molar mass of amorphous PC.

75
M w (g/mol)
104 105
Den
sity
(g/
cm3 )
1.197
1.198
1.199
1.200
1.201
<�a> = 1.1977± 0.0002 (g/cm3)
Figure 3.10 Room temperature amorphous densities of PC fractions as a function of weight average molar mass.

76
For example, in case of PC-12K, based on the density measurement, it could be said that
the amorphous sample has been crystallized to the extent of ca. 1% upon cooling. It
should be noted that even this small amount of crystallinity may give rise to the variation
of density in its third decimal point. This is a good justification for the sensitive
measurement of crystallinity from the density measurement. On the other hand, however,
extreme caution must be used when defining the absolute values of amorphous and 100%
crystalline phase densities for the accurate determination of crystallinity. In this regard,
the reported amorphous PC density range is too broad to be used for the exact calculation
of crystallinity from the density measurement. From now on, 1.1977 g/cc is assigned as
pure amorphous density and 1.294 g/cc for 100% crystalline phase density from the study
of WAXS for semicrystalline PC29. The latter value is in agreement with previous
studies by Bonart26 and Prietzschk30.
** (see Page 73) Several attempts to measure the densities of two lowest molar mass fractions (PC-4K and PC-6K)
have been discouraged because the films with reasonable size and stability for density measurement could not be
achieved due to the brittleness of the films.

77
References
1. Hermann Schnell, “Chemistry and Physics of Polycarbonates”, 1964, John
Wiley & Sons, Inc.
2. H. Schnell, Angew. Chem., 1956, 68, 633.
3. G. Sitaramaiah, J. Polym. Sci. Part-A, 1965, 3, 2743.
4. G. V. Schulz, A. Horbach, Makromol. Chem., 1959, 29, 93.
5. G. C. Berry, H. Nomura, K. G. Mayhan, J. Polym. Sci. Part-A, 1967, 5, 1.
6. L. Trosasarelli, D. Campi, G. Saini, J. Polym. Sci., 1959, 34, 205.
7. A. Gray, in “Analytical Chemistry”, Plenum Press, New York, 1963, V1, p 322.
8. V. Berstein, V. M. Ergov, in “Differential Scanning Calorimetry of Polymers:
Physics, Chemistry, Analysis, Technology”, 1994, Ellis Horwood, U. K.
9. P. W. Atkins, “Physical Chemistry”, Fifth ed. 1994, W. H. Freeman & Co., New
York. P 200.
10. S. Z. D. Cheng, M. Y. Cao, B. Wunderlich, Macromolecules, 1986, 19, 1868.
11. G. A. Adam, J. N. Hay, I. W. Parsons, R. N. Haward, Polymer, 1976, 17, 51.
12. G. E. Wissler, B. Crist, J. Polym. Sci. Polym Phys., 1980, 18, 1257.
13. B. Falkai, W. Rellensmann, Makromol. Chem., 1964, 75, 112.
14. Z. Dobkowski, Eur. Polymer J., 1982, 18, 563.
15. P. J. Flory, J. Appl. Phys., 1950, 21, 581; J. Polym. Sci., Part C, 1968, 16, 3373.
16. P. L. Kumler, S. E. Keinath, R. F. Boyer, J. Macromol. Sci. Phys., 1977, B13,
631.
17. Y. H. Lin, Macromolecules, 1990, 23, 5292.
18. L. J. Fetters, D. J. Lohse, S. C. Milner, W. W. Graessley, Macromolecules,
1999, 32, 6847.
19. L. J. Fetters, D. J. Lohse, D. Richter, T. A. Witten, A. Zirkel, Macromolecules,
1994, 27, 4639.
20. R. F. Boyer, J. Macromol. Sci. Phys., 1973, B7, 487.
21. S. Z. D. Cheng, B. Wunderlich, J. Polym. Sci. Polym. Phys., 1986, 24, 1755.
22. B. Wunderlich, L. D. Jones, J. Macromol. Sci. Phys., 1969, B3, 67.
23. E. A. DiMarzo, F. Dowell, J. Appl. Phys., 1979, 50, 6061.
24. W. Kim, C. M. Burns, J. Appl. Polym. Sci., 1987, 34, 945.

78
25. G. L. Wilkes, in “Encyclopedia of Physical Science and Technology”, 1988, 11,
p 61.
26. R. Bonart, Makromol. Chem., 1966, 92, 149.
27. K. H. Hellwege, J. Hennig, W. Knappe, Kolloid. Z. Z. Polym., 1962, 186, 29.
28. J. P. Mercier, R. Legras, J. Polym. Sci. Polym. Lett., 1970, 8, 645.
29. A. Alizadeh, R. Farmer, S. Sohn, H. Marand, in preparation.
30. A. Prietzschk, Kolloid Z., 1958, 156(1), 8.
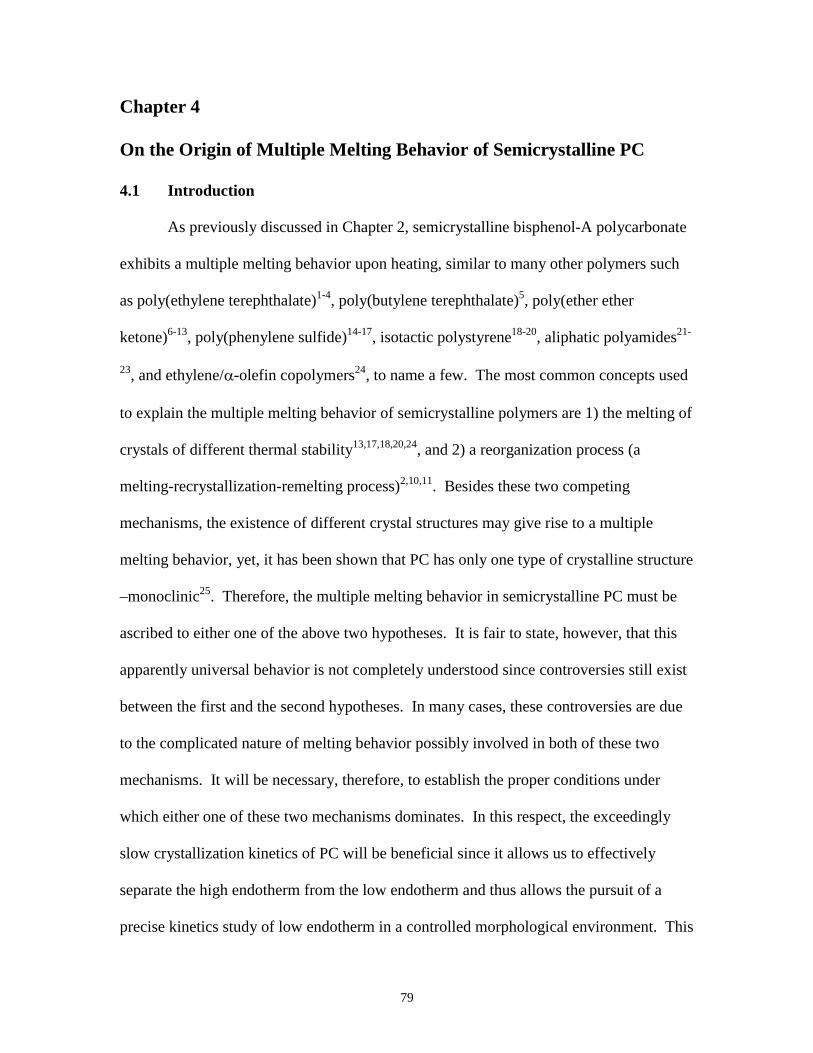
79
Chapter 4
On the Origin of Multiple Melting Behavior of Semicrystalline PC
4.1 Introduction
As previously discussed in Chapter 2, semicrystalline bisphenol-A polycarbonate
exhibits a multiple melting behavior upon heating, similar to many other polymers such
as poly(ethylene terephthalate)1-4, poly(butylene terephthalate)5, poly(ether ether
ketone)6-13, poly(phenylene sulfide)14-17, isotactic polystyrene18-20, aliphatic polyamides21-
23, and ethylene/�-olefin copolymers24, to name a few. The most common concepts used
to explain the multiple melting behavior of semicrystalline polymers are 1) the melting of
crystals of different thermal stability13,17,18,20,24, and 2) a reorganization process (a
melting-recrystallization-remelting process)2,10,11. Besides these two competing
mechanisms, the existence of different crystal structures may give rise to a multiple
melting behavior, yet, it has been shown that PC has only one type of crystalline structure
–monoclinic25. Therefore, the multiple melting behavior in semicrystalline PC must be
ascribed to either one of the above two hypotheses. It is fair to state, however, that this
apparently universal behavior is not completely understood since controversies still exist
between the first and the second hypotheses. In many cases, these controversies are due
to the complicated nature of melting behavior possibly involved in both of these two
mechanisms. It will be necessary, therefore, to establish the proper conditions under
which either one of these two mechanisms dominates. In this respect, the exceedingly
slow crystallization kinetics of PC will be beneficial since it allows us to effectively
separate the high endotherm from the low endotherm and thus allows the pursuit of a
precise kinetics study of low endotherm in a controlled morphological environment. This

80
low endotherm kinetic study will be essential in understanding the exact nature of low
endotherm. The low and high endotherm kinetics will be further detailed in the
following chapter.
Multiple melting behavior explained by the hypothesis of reorganization is often
visualized through a heating rate dependent melting behavior26,27. The quantitative
understanding of the reorganization process (melting-recrystallization-remelting) is still
incomplete, yet qualitative experimental observations can be explained rather easily. As
the heating rate increases, the peak temperature and heat of fusion associated with high
endotherm should decrease, and eventually melting endotherms will show a single,
possibly broad, peak at sufficiently high heating rate. A more detailed description of
reorganization during heating will be offered in the following section. Because the effect
of heating rate on the observed multiple melting behavior is generally used as a
justification for the existence of reorganization effects, it is worthwhile to address this
issue more thoroughly. Specifically, it is imperative to examine whether such heating
rate dependence is consistent with the explanation of the multiple melting behavior in
terms of a bimodal population of crystals of different morphological characteristics. In
the context of the present work, we use loosely the term reorganization during heating as
implying melting-recrystallization-remelting process, although we realize that
reorganization can also occur through lamellar thickening or increase in crystal
perfection.
4.2 Reorganization Process
Some essential features of the reorganization process during heating are presented
schematically in Figure 4.1. At the lower heating rate (a), there is ample time for the

81
Heating Rate
Slow
Enough time for recrystallization
Intermediate
Fast
No timefor recrystallization
End
oth
erm
ic
Figure 4.1 A schematic diagram of reorganization (melting-recrystallization-remelting) process as a function of heating rate.
Melting
Recrystallization
Remelting

82
melting of initially present crystals and subsequent recrystallization during the heating
scan. In this case, the lower endotherm is the net result of the superposition of the
melting endotherm of initial crystals (i.e., crystals present before the heating scan) and
the recrystallization exotherm of the just-molten material. The higher endotherm is then
observed at temperatures where recrystallization effects are no longer significant and the
melting of crystals formed during the heating scan becomes dominant. At the fastest
heating rate (c), initially present crystals melt during the heating scan but recrystallization
cannot take place since the residence time at temperatures where recrystallization could
take place is too short. Consequently, in this case, a single, possibly broad, melting
endotherm is observed. At a moderate heating rate (b), the crystals will have less time to
reorganize, thus the recrystallization exotherm and consequently the remelting endotherm
will decrease in magnitude and peak temperature. Considering all these qualitative
features of reorganization, an increase in heating rate should lead to a shift of the high
endotherm to lower temperatures and a decrease in the relative magnitude of the high
endotherm via that of the low endotherm.
4.3 Experimental
4.3.1 Materials
Two of the commercial bisphenol-A polycarbonate, PC-19K and PC-28K and the
lowest molar mass fraction, PC-4K, were used for this study. Commercial sample
purification and fractionation procedures are described in Chapter 3. These samples were
originally crystallized according to the conditions depicted in Tables 4.1. These samples
achieved their maximum degree of heat of fusion under each crystallization condition.
The effect of heating rates on the melting behavior was examined on 1) completely

83
Sample Mw
( g. mol-1 )
Mw /Mn Crystallization
Conditions
�Hmtotal
(J/g)
PC-4K 4,300 1.02 165°C, 38 hours 34.4
PC-19K 18,800 1.99 170°C, 384 hours 27.2
PC-28K 28,400 2.05 185°C, 202 hours 25.9
Table 4.1 Molecular characteristics and crystallization conditions of bisphenol-A
polycarbonate samples.

84
crystallized, 2) partially melted, and 3) partially melted and subsequently further
crystallized samples.
4.3.2 Differential Scanning Calorimetry
The thermal behavior of the samples was monitored using differential scanning
calorimetry (DSC). Indium and tin standards were used to calibrate the temperature
scale. Heating and cooling scans were performed at different rates, �, from 0.3 to
40oC/min. The temperature calibration during cooling was achieved, as described in
Chapter 3, using the isotropic-to-nematic phase transition of p-azoxyanisole (TI-N =
136oC). In all cases, DSC traces were presented after subtraction of a baseline that
approximates the heat capacity of the semicrystalline sample over the temperature range
considered. Use of a linear baseline in the melting region was mandated by the lack of
availability of heat capacity data for the crystal phase of bisphenol-A polycarbonate.
Therefore, the heating traces presented in this chapter provide information only on
enthalpic contributions associated with the melting process. As a result, apparent heat
capacities (dq/dT) will vanish above and below the melting transition. Details of sample
preparation and DSC experimental procedures are given in Chapter 3.
4.3.3 Thermal Lag Corrections
When a polymer has been crystallized before the heating scan, it may experience
the additional transformation of less stable crystals into more stable crystals
(reorganization process) upon heating. To avoid this reorganization effect during
heating, a higher heating rate will be necessary to minimize the residence time at
temperatures where the molten material transforms into more stable crystals (see the
previous section of reorganization process, in detail). Unfortunately, under these

85
conditions, thermal lag effect becomes prominent, leading not only to a shifting of
melting peak temperatures but also to a broadening of the melting endotherms27.
Commonly, metal standards are used to calibrate the temperature scale at a given
heating rate. However, it is not accurate to calibrate the actual temperature inside the
sample, because the thermal conductivity of organic materials is much lower than that of
metals. The use of metal standards for sample temperature calibration, therefore, invokes
an inadequate temperature calibration and more importantly, does not allow for
corrections of the shape of the melting endotherm due to the effect of temperature
gradients within the sample. We, therefore, carried out the temperature calibration using
an indium standard sandwiched between two amorphous PC films. For the correction of
peak broadening, Gray’s method has been applied28,29, as a first approximation. A typical
example of these corrections is shown in Figure 4.2 in which the melting traces (�
=10oC/min.) of PC-28K crystallized at 185oC for 202 hours were corrected by these
calibrations: 1) temperature correction by In-sandwiched sample, 2) peak broadening
correction by Gray’s model. Temperature scale calibration using In-sandwiched sample
were previously described in Chapter 3 (see Figure 3.4 (a)). Gray’s model correction is
only applicable for the heating rates less than ca. 40oC/min28,29. A brief review of Gray’s
method is presented in Appendix A.2.
4.4 Results
In this section, the nature of multiple melting behavior of PC and heating rate
dependence of the low endotherm will be presented. First, the results of heating rate
experiments performed on the as-crystallized and partially melted samples of various
molar masses will be offered. Next, the results of secondary crystallization experiments

86
Temperature (oC)
180 200 220 240
dq/d
T (
J. g
-1.K
-1)
-0.2
0.0
0.2
0.4
0.6
Temperature corrected
Temperature corrected +Gray's model applied
Figure 4.2 A typical example of thermal lag correction consideringboth temperature shift and peak broadening. PC-28K sample wasinitially crystallized at 185oC for 202 hours, partially melted at 220oC and exposed to secondary crystallization at 185oC for 2 hours. Temperature scale has been properly corrected using In-sandwiched sample (for detail, see the text). Heating rate was 10oC/min.

87
performed on partially melted sample at different temperature and time will be presented.
4.4.1 The Nature of the Multiple Melting Behavior in PC
As-crystallized samples
In Figure 4.3, the corrected heating traces of PC-28K crystallized from the glassy
state at 185°C for 202 hours are displayed at heating rates ranging from 2.5 to 20°C/min.
The heating of PC subsequent to the above crystallization process gives rise to a low, an
intermediate, and a high melting endotherm. The intermediate endotherm spreads over a
wide temperature range, and under this particular crystallization condition, overlaps with
both low and high melting endotherms. In the case of PC-19K, however, this
intermediate endotherm is relatively less overlapped mainly due to the well-separated
peak positions of low and high endotherms (see Figure 2.5, for instance). Table 4.2
presents the melting temperatures of PC-28K original and partially melted samples. As
can be observed in Figure 4.3 and Table 4.2, the location of the high endotherm is found
to be almost independent of heating rate (� > 2°C/min). On the other hand, the position
of the low endotherm depicts strong heating rate dependence and shifts systematically
towards higher values with increasing heating rate. The total heat of fusion of the sample
(25.9 J/g) is heating rate independent. Qualitatively, PC-19K showed similar heating rate
dependent behavior to PC-28K.
Figure 4.4 shows the results of similar experiments performed on PC-4K, the
lowest molar mass fraction, which has been crystallized at 165oC for 38 hours. Three
different scan rates, 5, 10, and 20oC/min, were used. In each case, three endotherms are
observed. The lower endotherm is observed slightly above the crystallization
temperature and, similarly to PC-19K and PC-28K, shifts to higher temperatures with

88
Temperature (oC)
180 200 220 240
dq/d
T (
J. g
-1. K
-1)
0.0
0.5
1.0
1.5
2.0
HR= 5.0oC/min
HR= 10.0oC/minHR= 20.0oC/min
HR= 2.5oC/min
Figure 4.3 Effect of heating rate on the melting behavior of PC-28K crystallized at 185oC from the glassy state for 202 hours and quenched to 100oC

89
Heating Rate
(°C/min)
PC-28K (original)
Crystallized at 185°C
for 202 hours
PM;PC-28K
Partially Melted
at 220°C
Tmlow (°C) Tm
high (°C) Tmhigh (°C)
2.5 204.0 229.1 228.9
5.0 205.6 228.5 228.2
10.0 207.2 227.8 228.6
20.0 208.9 228.4 228.7
Table 4.2 Melting temperatures of PC-28K before and after partial melting.

90
Figure 4.4 Effect of heating rate on the melting behavior of PC-4K
crystallized from the glassy state at 165°C for 38 hours, and quenched to 80oC.
Temperature ( °C )
150 175 200 225 250
dq/d
T (
J. g
-1. K
-1 )
0.0
0.5
1.0
1.5
2.0
2.5
3.0
HR = 5.0 °C / min
HR = 10.0 °C / min
HR = 20.0 °C / min

91
increasing heating rates. The upper endothermic region shows the trend expected for a
melting-recrystallization-remelting phenomenon. The enthalpy of fusion of the
intermediate endotherm increases and that of the highest endotherm decreases with
heating rate. Furthermore, the intermediate endotherm shifts to higher temperatures
while the highest endotherm shifts to lower temperatures with heating rate. A similar
observation of an increase in the rate of reorganization upon heating with decreasing
molar mass has been reported for poly(vinylidene fluoride), nylon-12 and poly(phenylene
sulfide) by Judovits et al.30.
Partially Melted Sample
This section will present a series of experiments that were performed to
investigate, independently, the high endotherm for PC-28K. In addition, the effect of
cooling rate after partial melting will be considered.
Partial melting was carried out by heating (� � 20oC/min) PC-28K samples
crystallized at 185oC for 202 hours up to 220oC, which is approximately in the middle of
low and high endotherm peak melting temperatures. Upon reaching 220oC, these
samples were rapidly cooled to 100oC (� = � 40oC/min) and subsequently reheated at
various heating rates to record their melting behavior. The corrected heating traces of
partially melted PC-28K samples (PM; PC-28K) for heating rates ranging from 2.5 to
20oC/min are shown in Figure 4.5. Partially melted samples solely exhibit a high
endotherm whose corresponding peak melting temperature and heat of fusion are found
to be heating rate independent (see Table 4.2). The average heat of fusion of the partially
melted sample is equal to 8.4 J/g. The high endotherm melting temperature, Tmhigh, of the
partially melted sample (fourth column in Table 4.2) is found to be identical, within an

92
experimental uncertainty, to that of the original sample for all heating rates (third column
in Table 4.2).
Cooling Rate Effect
Many crystallizable polymers often exhibit non-isothermal crystallization upon
either heating or cooling. PC, as shown in Figure 4.3 and in the literature31-33, does not
crystallize either upon heating or upon cooling, even at a very slow scan rate, due to its
extremely slow crystallization kinetics (recall that PC-28K requires 40 to 50 hours of
induction time at maximum growth rate temperature before the detectable heat of fusion:
see Chapter 5). These observations, nonetheless, does not rule out the possibility that PC
may crystallize upon cooling in the presence of pre-existing crystals. This is a very
important question that needs to be properly addressed because in order to investigate the
melting characteristics of secondary crystals, it is important to ensure that there is no
morphological evolution during cooling between the upper temperature used for partial
melting and the temperature at which secondary crystallization is performed (see below).
In the previous set of experiments, the characteristics of the high and low
endotherms were investigated separately by direct comparison of heating traces of as-
crystallized and partially melted PC samples. This comparison is based on the
assumption that partial melting and subsequent cooling of the samples do not affect the
population and the size of the most stable primary crystals. The observation of identical
peak melting temperatures for as-crystallized and partially melted samples indicates that
the heating rate and the upper temperature used for partial melting were properly chosen
to avoid reorganization of the primary crystals. We therefore need to discuss the

93
Temperature (oC )
175 200 225 250
dq/d
T (
J. g
-1. K
-1 )
0.0
0.5
1.0
1.5
2.0
HR = 2.5°C / min
HR = 5.0°C / min
HR = 10.0°C / min
HR = 20.0°C / min
Figure 4.5 Effect of heating rate on the melting behavior of PC-28K
crystallized at 185°C from the glassy state for 202 hours, partially melted
at 220oC, and subsequently cooled to 100oC.

94
influence of the rate of cooling from 220 °C to 100 °C on the subsequent melting
behavior.
To provide the proper answer to this question, a series of cooling rate experiments
was conducted on partially melted samples at 220oC at the scan rates ranging from – 0.3
to – 40oC/min, and each melting endotherm was subsequently recorded from 100oC to
260oC at 10oC/min heating rate. Figure 4.6 shows the melting traces of a series of
samples (PM; PC-28K) with different cooling rates. Figure 4.7 depicts the analysis of the
above melting endotherms in various aspects, in which the melting peak position
variation (a), change of heat of fusion (b), and amount of rigid amorphous fraction (RAF)
change (c) are plotted as a function of cooling rate. RAF, the fraction of amorphous that
does not relax at normal Tg, was discussed briefly in Chapter 2, and will be discussed
again in Chapter 7. Briefly speaking an increase of RAF shows the increase of
constraints; for example, small crystals developed upon cooling will exert constraints on
the amorphous phase thus decrease the relaxation intensity at Tg. This can be effectively
visualized from the development of RAF upon cooling.
The melting traces of partially melted sample are independent of the cooling rate
unless the rate is equal to or smaller than -2.5oC/min. However, for cooling rates below -
2.5oC/min., the enthalpy of fusion and the peak melting temperature increase with
decreasing cooling rate. The analysis of RAF in Figure 4.7 (c) also supports this
conclusion. It has been demonstrated, therefore, that the heat of fusion after partial
melting (8.4 J/g) comes solely from the heat of fusion of crystals survived after partial
melting, not from the crystals formed upon cooling, unless the cooling rate is sufficiently
slow (�� -2.5oC/min). This conclusion also ensures that as long as the cooling rate

95
Temperature (oC)
175 200 225 250
dq/d
T (
J. g
-1 K
-1 )
0.0
0.5
1.0
1.5
2.0
2.5
222 225 228 231 234 237
0.0
0.5
1.0
1.5
2.0
10.0oC/min
1.2oC/min
20.0oC/min
40.0oC/min
2.5oC/min
5.0oC/min
0.6oC/min0.3oC/min
Figure 4.6 Effect of cooling rate on the melting behavior of PC-28K
crystallized at 185°C from the glassy state for 202 hours, partially melted
at 220oC, and subsequently cooled to 100oC at different rates.

96
� �H
CR/ � �
H(C
R=
40o C
/min
)
1
2
Tm (
o C)
228
229
230
231
232
Cooling Rate (oC/min)
10-1 100 101 102
Rig
id A
mor
phou
s F
ract
ion
0.0
0.1
0.2
(a)
(c)
(b)
Figure 4.7 Analysis of cooling rate effect on the melting behavior
of PC-28K, in terms of, a) peak melting temperature; b) heat of
fusion; c) rigid amorphous fraction, all as a function of cooling rate
(for detailed description of each analysis, see the text).

97
exceeds 2.5oC/min, the population of most stable lamellae does not change by partial
melting at 220oC.
4.4.2 Heating Rate Dependence of the Low Endotherm
Secondary crystallization experiments were conducted on a series of partially
melted PCs at different temperatures and times. After partial melting at 220oC, the
samples were immediately fast cooled to a temperature Tx, where further secondary
crystallization was allowed for a given time, tx. The various experimental conditions for
this secondary crystallization stage are detailed in Table 4.3. Note that in all cases, the
temperature, Tx, associated with this second crystallization stage is below or equal to the
original crystallization temperature. After partial melting at 220oC and subsequent
quenching to secondary crystallization temperature (Tx) at or below the original
crystallization temperature, the high endotherm does not change within the experimental
time frame (see section 4.4.1 and Chapter 5). At Tx = 185oC, for example, up to 200
minutes, the high endotherm does not change appreciably (see Chapter 5). It can be,
therefore, safely stated that the morphological characteristics exhibited by primary
crystals are not to be affected by the secondary crystallization process. Upon reaching
the desired time of secondary crystallization, the sample has been rapidly cooled to 100oC
and subsequently reheated at different heating rates ranging from 5 to 20oC/min.
Figure 4.8 illustrates the melting traces of samples exposed to secondary
crystallization at 175oC for 120 minutes (a), at 185oC for 40 minutes (b), and at 185oC for
120 minutes (c). As a base line before secondary crystallization, the melting endotherm
of partially melted sample is plotted together (�= 10oC/min) for each sample. A
comparison between samples with and without secondary crystallization (i.e., the melting

98
0
1
2
0
1
2
Temperature ( °C )175 200 225 250
0
1
2
175°C, 120 minutes
185°C, 40 minutes
185°C, 120 minutes
HR = 5.0 °C / min
HR = 10.0 °C / min
HR = 20.0 °C / min
dq/d
T (
J.
g-1.
K-1 )
Figure 4.8 Effect of heating rate on the melting behavior of PC-28K crystallized at 185oC from the glassy state for 202 hours, partially melted at 220oC and further isothermally crystallized under various conditions:a) 175oC for 120 minutes; b) 185oC for 40 minutes; c) 185oC for 120 minutes.
(a)
(b)
(c)
dq/d
T (
J.
g-1.
K-1 )
dq/d
T (
J.
g-1.
K-1 )
HR = 5.0 °C / min
HR = 10.0 °C / min
HR = 20.0 °C / min
HR = 5.0 °C / min
HR = 10.0 °C / min
HR = 20.0 °C / min

99
Crystallization T mlow = (Tm
low)° + K
��������
Samples Conditions (Tmlow)° K (�0.03)
PC-28K 185°C, 202 hours 202.2 1.52
SC:175°C, 120 minutes 189.7 1.50
PM; PC-28K SC:185°C, 40 minutes 196.7 1.49
SC:185°C, 120 minutes 199.2 1.56
PC-19K 170°C, 384 hours 189.9 1.50
PM; PC-19K SC:170°C, 120 minutes 181.5 1.49
PC-4K 165°C, 38 hours 176.5 2.18
Table 4.3 Heating rate parameters for secondary crystallization under different
conditions (PM: partial melting at 220°C for PC-28K and at 217oC for PC-19K; SC:
secondary crystallization at the indicated temperature; �: heating rate in °C/min).

100
traces of partially melted sample) confirmed that both the location and the heat of fusion
of the high endotherm are not affected by the second thermal treatment at or below
original crystallization temperature, 185oC, for a given time frame. However, secondary
crystallization leads to the development of a low endotherm observed just above Tx.
Furthermore, the low endotherm melting temperature increases continuously with heating
rate.
In Figure 4.9, the low endotherm melting temperature, Tmlow, is plotted as a
function of the square root of heating rate, �½, for different secondary crystallization
conditions. The use of this particular graphic representation is justified in the discussion
section. In Figure 4.9, the data corresponding to the original sample crystallized at 185oC
for 202 hours are also included. In all cases Tmlow is found to increase linearly with �
½.
Of more interest is that the slopes of the various Tmlow vs �½ line are identical within
experimental uncertainty (see Table 4.3, PC-28K exhibits an average slope of 1.52�0.03).
4.5 Discussion
Figures 4.3 and 4.4 contrast the effect of molar mass on the viability of the
reorganization process. Low molar mass sample, most likely due to the increased chain
mobility, exhibits a melting-recrystallization-remelting phenomenon, while higher molar
mass sample does not. Of more importance, however, is that despite this possibility of
reorganization in the neighborhood of high endotherm (i. e., melting of lamellar type
crystals), low endotherm (i. e., melting of bundle-like crystals) exists independently. For
example, in Figure 4.4, even when two higher endotherms are merged into a single peak
due to a strong reorganization process, the low endotherm independently exists. This
strongly suggests that the multiple melting behavior can not be entirely explained by the

101
[Heating rate (oC/min )]1/2
1 2 3 4 5
Tm
low (
o C )
185
190
195
200
205
210
BC- 185°C, 202 hoursSC- 185°C, 120 min
SC- 185°C, 40 min
SC- 175°C, 120 min
Figure 4.9 Effect of heating rate on the low endotherm location of PC-28K crystallized under various conditions (for detail, see Table 4.3).(BC stands for bulk crystallization and SC, for secondary crystallization).Temperature accuracy was better than 0.2oC

102
reorganization process, but the presence of a second type of crystals before the heating
scan must be included for the proper interpretation.
The concept of the reorganization process is based on the thermal stability of
preexisting crystals. After partial melting, only high endotherm is present and does not
exhibit the characteristics of reorganization, mainly because these crystals have already
achieved their maximum thermal stability* under a given crystallization condition.
Comparing Figure 4.3 and 4.5, one can tell that the shoulder, located in between the high-
and low endotherm, more than likely suffers reorganization, which can be understood
from the viewpoint that these crystals will have a lower degree of perfection and thus be
more vulnerable to reorganization upon heating.
However, the observations for higher molar mass PC materials– that partially
melted samples exclusively exhibit the higher endothermic transition, and that identical
peak temperatures are obtained for the high endotherm in the original and partially
melted samples– lead to the conclusion that the multiple melting behavior is associated
with the fusion of crystals exhibiting different morphologies and thermal stabilities. For
high molar mass PC samples, the high endotherm does not arise from reorganization
processes taking place during heating but is associated with the melting of primary
(lamellar) crystals. For both high and low molar mass samples, the low endotherm is
associated with the melting of crystals formed during secondary crystallization.
From Figure 4.6 and the analyses (Figure 4.7) of peak position (a), heat of fusion
(b), and rigid amorphous fraction (c), it is clearly shown that cooling rate (�) is a crucial
* This maximum thermal stability does not mean they are the most stable crystals. In Chapter 6 an isothermal
lamellar thickening will be presented and it will be shown that these crystals can also thicken if annealed at higher
temperatures (> 208oC) for relatively longer times (> 10 minutes).

103
variable in non-isothermal crystallization upon cooling: when � is equal to or greater than
2.5oC/min, crystallization during cooling can be virtually prevented, yet when � is
smaller than that, non-isothermal crystallization occurs.
A close inspection of Figure 4.6 reveals that there exist at least two different types
of recrystallization processes upon cooling. The first type is inferred from the long tail of
the slowly cooled sample. The melting process of rapidly cooled samples after partial
melting (� 10oC/min) occurs in a relatively narrow temperature range. In contrast, the
onset of melting in samples cooled more slowly between 220oC and 100oC is observed at
much lower temperatures. These observations indicate that during slow cooling (��
2.5oC/min) some of the PC chain segments are able to recrystallize and thus possibly
form small relatively unstable crystals. Note that upon cooling an initially amorphous PC
from the melt, even at cooling rates much lower than those used here, no perceptible
crystallization occurs. This is due to the large induction period associated with the
crystallization of PC from the free melt. However, in the presence of preexisting crystals
(i.e., those left after partial melting), and possibly as a consequence of conformational
constraints present in the residual amorphous fraction, the crystallization rate is
noticeably enhanced. For these reasons, upon cooling small crystals may form at lower
temperatures, a phenomenon that has been reported in the literature35. As noted earlier,
these small crystals will impose constraints on the neighboring amorphous, which may be
manifested by the increase of RAF with the decrease of cooling rates.
The second type of recrystallization upon cooling can be revealed in the shift of
melting endotherm to higher temperatures with decreasing cooling rate. This may
suggest either that isothermal lamellar thickening may be operative at temperatures in the

104
vicinity of 220oC or that some crystals form during cooling between 220oC and 185oC*.
These crystals would be expected to be more stable than those formed during the initial
crystallization at 185oC. However, in this case, the melting endotherm might be expected
to exhibit multiple peaks or at least a high temperature shoulder. The observation of a
single, relatively narrow endotherm may suggest that both processes (lamellar thickening
and new crystal formation) may be at play. The occurrence of
isothermal lamellar thickening will be further discussed in Chapter 6. Largely speaking,
longer residence at temperature in the range 220oC-185oC during cooling leads to an
increase in crystallinity and melting temperature. It needs to be emphasized, however,
that such effects are only observed for very low cooling rates (�� 2.5oC/min).
The viability of reorganization processes in the high endotherm region is therefore a
function of 1) molar mass, 2) heating rate, and 3) cooling rate in the presence of pre
existing crystals. It has been mentioned earlier that the induction period for the
crystallization of PC chain segments is much shorter when crystals are already present
than when crystallization occurs from the pure melt. Studies of the effect of cooling rate
after partial melting indicate that recrystallization can occur if sufficient time is allotted
for this process (�� 2.5oC/min). This suggests that the rate of formation of new crystals
is enhanced either first, when other crystals are already present or second, when previous
melting has not led to a totally relaxed amorphous fraction. The reason for the second
explanation is that during partial melting, chain segments in secondary crystals lose
* In Chapter 5, for the first detectable evolution of low endotherm upon secondary crystallization, which is in a sense
melting of new crystals, it takes 5 and 1 minutes at 185oC and 195oC, respectively. The residence times between 220oC
and 185oC and between 220oC and 195oC, at cooling rate of 2.5oC/min, are 14 and 10 minutes, respectively. These
simple calculations may indicate that upon cooling there is indeed an ample time for the evolution of new crystals that
are more stable than those formed by crystallization at 185oC between these temperature ranges.

105
crystallographic registration but cannot return to the random conformational state
characteristic of the unconstrained melt. This is a direct consequence of both the rigid
backbone structures of PC and the constraints exerted by the surrounding primary
crystals. This lower conformational entropy, either from the preexisting crystals or from
the constrained melt, is at the origin of both non-isothermal crystallization upon cooling
and the much shorter induction time for secondary crystallization. Under both
circumstances the energy barrier for crystal nucleation appears to be reduced. In the
following chapter, where the kinetics of low endotherm is discussed, it is shown that the
induction periods for the primary and secondary crystallization of PC-28K at 185oC differ
by more than two orders of magnitude (40 hours and 5 minutes, respectively).
On closer examination of Figure 4.8, it can be seen that at the lowest heating rate
(5 °C/min), a small shoulder develops between the low and high endotherms. The overall
enthalpy of fusion associated with the low endotherm and shoulder appears to remain
independent of heating rate. This observation suggests that secondary crystals may
undergo a small extent of reorganization by melting-recrystallization-remelting during
slow heating. However, we emphasize that the extent of reorganization, as indicated by
the enthalpy of fusion associated with the shoulder, is small and will not significantly
affect the location of the low endotherm peak melting temperature. It needs to be also
underlined that reorganization processes in the low endothermic region are not present for
heating rates exceeding 10 °C/min. These latter observations provide additional and
strong support for the claim that the low and high endotherms are associated with the
melting of two different morphological entities. These results also suggest that
temperature modulated DSC may not be the most appropriate tool to investigate the

106
melting behavior of as-formed secondary crystals since this technique relies on the use of
very low heating rates, at which reorganization processes can become significant.
In Figure 4.9, it needs to be acknowledged that the upward shift of the low
endotherm with increasing heating rate is consistent with the occurrence of the
reorganization process during heating. It is important, however, to recognize that a
constant value for the slopes of Tmlow vs �½ lines is incompatible with the account of the
multiple melting behavior by a melting-recrystallization-remelting process. This, the
same dependence of melting temperature on heating rate, is displayed for crystals
exhibiting intrinsically different thermal stabilities. For instance, the same slope of Tmlow
vs �½ is observed for crystals formed at 185oC over the period of 202 hours (more stable),
and for crystals formed at 175oC for 2 hours (less stable). Such behavior is, once again,
inconsistent with expectations for the melting-recrystallization-remelting phenomenon.
A clue for the origin of the heating rate dependence of the low endotherm melting
temperature is obtained from the linearity of Tmlow vs �½ plots after thermal lag
correction. This observed behavior has been shown to be a characteristic of superheated
crystals27. Superheating is a term used to describe the melting of a crystal at temperatures
above that expected from equilibrium considerations. To obtain the linear dependence
between Tmlow and �½, the rate of melting is assumed to be a linear function of the degree
of superheating. Using temperature modulated differential scanning calorimetry, Toda et
al.40 recently showed that the hypothesis of a linear dependence of the rate of melting on
superheating maybe oversimplified. According to Toda et al.40, a rate of melting
proportional to �Ty leads to a linear variation of the degree of superheating with �1/(1+y).

107
At this point, it is not possible for us to accurately determine the value of y. However, a
value of y in the vicinity of 0.5 yields an acceptable fit to our experimental data.
In polymeric materials, two types of crystal morphologies lend themselves to
superheating27. First, large crystals, such as polyethylene or polytetrafluoroethylene
extended chain crystals, exhibit superheating due to the slow kinetics of melting from the
surface to core. Second, metastable crystals with conformationally constrained interfacial
chains, such as tie chains or loose loops, will also reduce the entropy of fusion upon
melting (i.e., superheating). The increase in the melting temperature of secondary
crystals with heating rate, in this study, is most likely associated with the latter case- the
reduction of entropy of fusion upon melting*. Such reduction in entropy of fusion has
already been discussed by Wunderlich27 and Zachmann34 in the context of fringed
micellar structures.
As will be further discussed in the following chapter and as has been discussed in the
previous publications38,39, the low endotherm in many semicrystalline polymers,
including PC, is associated with the melting of bundle-like or fringed micellar secondary
crystals. The profound effect of these bundle-like small crystals is to increase the level of
conformational constraints, thus leading to a reduction in the conformational entropy of
the remaining amorphous phase. In support of this point of view, both the glass
* Thermodynamically equilibrium melting temperature, Tmo, is defined as Tm
o = �Hmo/�Sm
o, where �Hmo and �Sm
o
are the equilibrium heat of fusion and entropy change upon melting, respectively. This simple equation tells us that for
the increase of melting temperature, any material system can take two different routes: first the increase of heat of
fusion by either large crystal formation or crystal perfectioning, and second, the decrease of conformational entropy. In
the particular case of bundle-like crystal formation, for the explanation of the increase of low endotherm melting
temperature with heating rate (Chapter 4), time (Chapter 5) or possibly with frequency, the second mechanism seems
more feasible, at least partly, considering the constrained environments. Nonetheless, the first possibility can not be
completely ruled out. This will be further discussed in Chapter 7.

108
transition and the low endotherm melting temperatures are found to shift to higher
temperatures with increasing secondary crystallization time. This will be further
discussed in Chapter 7. Theoretical support for this idea has recently been obtained from
thermodynamic correlation between the temporal evolution of the melting temperature of
secondary crystals and that of the glass transition temperature of the residual amorphous
fraction41. This thermodynamic model was successfully applied to experimental data on
it-PS, PEEK and PET. The above arguments suggest that the shift of the low endotherm
to a higher temperature with increasing heating rate is compatible with superheating of
metastable fringed-micellar crystals.
As a last discussion supporting the applicability of superheating concepts in the
case of secondary crystals, one can compare the degree of superheating, defined as the
difference between the melting temperature at that heating rate, Tmlow, and the
equilibrium or zero entropy production melting temperature of that crystal, (Tmlow)o, thus
Tmlow-(Tm
low)o. Examination of Table 4.3 indicates that the slope K, which is directly
related to the degree of superheating, is considerably larger for PC-4K than for the other
two samples. In a parallel study, it has been found that the rate of shift of the low
endotherm with secondary crystallization time is significantly larger for PC-4K than for
PC-19K and PC-28K39. Studies of narrow molar mass fractions indicate that this
difference is not associated with the broader molar mass distribution. These results will
be further discussed in the next chapter. The increase in both the superheating effects and
the rate of shift of low endotherm melting temperature with secondary crystallization
time for low molar mass materials is likely explained by the increase in crystallinity and
the increase of conformational constraints in the residual amorphous fraction with

109
decreasing molar mass. In support of this interpretation, in this study, the rigid
amorphous fraction (RAF) has been calculated for different molar mass semicrystalline
PC samples (see Chapter 7). The interesting result is that low molar mass fraction clearly
has a higher degree of RAF compared with higher molar mass samples. A similar
conclusion has been drawn by Cebe et al., in the study of poly(phenylene sulfide)42.
4.6 Conclusions
Studies of the heating rate dependence of the melting behavior of semicrystalline
bisphenol-A polycarbonate of various molar mass indicate that the high and low
endothermic regions are associated with the melting of primary (chain folded lamellae)
and secondary crystals (bundle-like or fringed micellar type), respectively. No
reorganization effects during heating are observed for PC-19K and PC-28K in the usual
range of heating rate (� 2.5oC/min). In contrast, the lower molar mass material, PC-4K,
exhibits a melting-recrystallization-remelting process during heating. This reorganization
process, which is mediated by the higher mobility, and thus higher recrystallization rate
of the shorter chain length polymer, however, only affects the shape of the high
endothermic region. The observed upward shift of the low endotherm with increasing
heating rate is explained by superheating effects and is fully consistent with the notion
that amorphous chains in the vicinity of secondary crystals are conformationally
constrained and these constraints cannot fully relax upon melting of the secondary
crystals.

110
References
1. G. Groeninckx, H. Reynaers, H. Berghmans, G. Smets, J. Polym. Sci. Polym Phys.,
1980, 18, 1311; G. Groeninckx, H. Reynaers, J. Polym. Sci. Polym Phys., 1980, 18,
1325.
2. P. J. Holdsworth, A. Tuner-Jones, Polymer, 1971, 12, 195.
3. C. Zhou, S. B. Clough, Polym. Eng. Sci., 1988, 28, 65.
4. S. B. Lin, J. L. Koenig, , J. Polym Sci. Polym. Symp., 1984, 71, 121.
5. S. Z. D. Cheng, R. Pan, B. Wunderlich, Macromol. Chem., 1988, 189, 2443.
6. S. Z. D. Cheng, M. Y. Cao, B. Wunderlich, Macromolecules, 1986, 19, 1868.
7. P. Cebe, S.-D. Hong, Polymer, 1986, 27, 1183.
8. M. P. Lattimer, J. K. Hobs, M. J. Hill, P. J. Barham, Polymer, 1992, 33, 3971.
9. B. S. Hsiao, K. H. Gardner, D. Q. Wu, B. Chu, Polymer, 1993, 34, 3986; B. S. Hsiao,
K. H. Gardner, D. Q. Wu, B. Chu, Polymer, 1993, 34, 3996.
10. D. J. Blundell, B. N. Osborn, Polymer, 1983, 24, 953.
11. Y. Lee, R. S. Porter, Macromolecules, 1992, 25, 1731.
12. A. J. Lovinger, S. D. Hudson, D. D. Davis, Macromolecules, 1992, 25, 1752.
13. H. Marand, A. Prasad, Macromolecules, 1992, 25, 1731; H. Marand, A. Alizadeh, R.
Farmer, R. Desai, V. Velikov, Macromolecules, in press
14. S. Z. D. Cheng, Z. Q. Wu, B. Wunderlich, Macromolecules, 1987, 20, 2802.
15. S. X. Lu, P. Cebe, M. Capel, Macromolecules, 1997, 30, 6243.
16. S. X. Lu, P. Cebe, Polymer, 1996, 37, 4857.
17. J. S. Chung, P. Cebe, Polymer, 1992, 33, 2325.
18. P. J. Lemstra, T. Kooistra, G. Challa, J. Polym. Sci. Part A-2, 1972, 10, 823; P. J.
Lemstra, A. J. Schouten, G. Challa, J. Polym. Sci. Polym Phys., 1974, 12, 1565.
19. Z. Pelzbauer, R. St. J. Manley, J. Macromol. Sci- Phys, 1973, B7, 345.
20. J. Vivirito, H. D. Iler, H. Marand, unpublished results.
21. P. Weigel, R. Hirte, C. Ruscher, Faserforsch. Textiletech., 1974, 25, 283.
22. J. P. Bell, P. E. Slade,J. H. Dumbleton, J. Polym. Sci. Part A-2, 1968, 6, 1773.
23. F. Shuren, Z. Guanguha, T Qun, Y. Yuqin, J. Thermal Anal., 1993, 39, 875.
24. A. Alizadeh,L. Richardson, S. McCartney, H. Marand, Macromolecules, 1999, 32,
6221; Bull.Am. Phys. Soc., 1999, 44(1), 1562.

111
25. R. Bonart, Makromol. Chem., 1966, 92, 149.
26. P. B. Rim, J. P. Runt, Macromolecules, 1984, 17, 1520.
27. B. Wunderlich, “ Macromolecular Physics”, 1976, Academic Press, New York, Vol3.
28. A. Gray, “Analytical Chemistry”, 1963, Plenum Press, New York, Vol. 1, p 322,.
29. V. Berstein, V. M. Ergov, in “Differential Scanning Calorimetry of Polymers:
Physics, Chemistry, Analysis, Technology”, 1994, Ellis Horwood, U. K.
30. L. Judovits, J. D. Menczel, A. G. Leray, J. Thermal Anal., 1998, 54, 605.
31. B. Falkai, W. Rellensmann, Makromolekular Chem., 1964, 75, 112.
32. G. Kämpf, Kolloid-Zeitschrift, 1960, 172, 50.
33. Hermann Schnell, “Chemistry and Physics of Polycarbonates”, 1964, John Wiley &
Sons, Inc.
34. H. G. Zachmann, A. Peterlin, J. Macromol. Sci. Phys., 1969, B3(3), 495.
35. G. Mendez, A. J. Müller, J. Thermal Anal., 1997, 50, 593.
36. S. Sohn, A. Alizadeh, H. Marand, Polymer in print.
37. J. E. K. Schawe, G. R. Strobl, Polymer, 1998, 39, 3745.
38. S. Sohn, A. Alizadeh, H. Marand, L. C. Shank, H. D. Iler, American Chemical Soc.
Polym. Preprint, 1999, 81, 250.
39. A. Alizadeh, S. Sohn, L. C. Shank, H. D. Iler, H. Marand, submitted to
Macromolecules.
40. A. Toda, T. Oda, C. Tomita, M. Hikosaka, T. Arita, Y. Saruyama, Proc. Am. Chem.
Soc. Polym. Div., 1999, 81, 236.
41. H. Marand, A. Alizadeh, in preparation
42. S. X. Lu, P. Cebe, M. Capel, Macromolecules, 1997, 30, 6243.

112
Chapter 5
Primary and Secondary Crystallization Kinetics of PC
5.1 Introduction
The origin of multiple melting behavior in PC was discussed in the previous
chapter. In summary, the high endotherm could not be explained solely by the
reorganization process (melting-recrystallization-remelting) of pre-existing crystals, but
required the existence of two different crystal populations with different thermal
stabilities. More specifically, at moderate heating rate (�> 2.5oC/min), the multiple
melting endotherm could be explained by the melting of primary chain-folded lamellar
crystals and secondary bundle-like crystals, which correspond to the high and low
melting endotherms, respectively.
The distinct advantage offered by PC is the absence of crystallization during
sufficiently fast cooling after partial melting (see Figures 4.6 and 4.7). Therefore,
partially melted samples exhibiting solely high endotherm can be used to study the
secondary crystallization behavior, independently. This unique feature of semicrystalline
PC provides an excellent opportunity to pursue the precise secondary crystallization
kinetics without further complications arising from the non-isothermal crystallization
upon cooling. This potential problem has been noted in the previous study of PEEK1.
An understanding of overall crystallization kinetics of PC crystallized from the
glassy state is necessary for the study of secondary crystallization kinetics. However, to
our knowledge, only very few publications have addressed the kinetics of crystallization
of PC from the bulk 2-5; furthermore, studies of the effect of molar mass on the kinetics of
bulk crystallization of PC are even more scarce5. To address these issues properly, the

113
overall crystallization kinetics of PC crystallized from the glassy state as a function of
temperature and molar mass will be presented before the secondary crystallization
kinetics study. In addition, a morphology study in the stage of primary crystallization
will also be offered.
The results and the discussion sections are presented in two main parts that cover
the effects of molar mass, molar mass distribution, and temperature on 1) the overall
kinetics of crystallization, and 2) the secondary crystallization kinetics. In the discussion
section, the results are examined in the context of the conceptual secondary
crystallization model that has been proposed from the studies of PEEK1 and
ethylene/octene copolymer6.
5.2 Experimental
The purified commercial bisphenol-A polycarbonate samples and some fractions
were used for this study. Details of experimental procedures for purification and
fractionation processes and molecular characterizations are given in Chapter 3. Sample
preparation and a general description of DSC experiments are described in Chapter 3 and
4. However, when necessary, specific experimental procedures are given before
presenting the results. This section offers, first, the description of quantitative analysis of
DSC melting traces upon secondary crystallization, and second, the detailed experimental
methods for the morphology study using atomic force microscopy (AFM) and polarizing
optical microscopy (OM). For general descriptions of AFM and OM, refer to Chapter 3.
5.2.1 Quantitative Analysis of DSC Melting Traces
For the study of secondary crystallization kinetics, the peak melting temperature
and the heat of fusion associated with the low endotherm must be quantitatively

114
determined. For this purpose, peak-fitting method (peak fit software, Jandel Scientific
Co.) was used to analyze the low endotherm in the DSC melting traces. In Figure 5.1, a
typical example is illustrated. In this particular case, PC-28K sample was cold-
crystallized at 185oC for 202 hours, partially melted at 220oC, and subsequently exposed
to secondary crystallization at 185oC for 40 minutes.
To achieve reliable and consistent results, the following criteria have been
applied. The overall multiple melting endotherms are divided into three parts: high,
intermediate (shoulder), and low endotherms. To fit each of these endotherms, a total of
five curves was necessary; among those, three were for the high endotherm, and one for
the intermediate endotherm. For the fitting of low endotherm, which is the main interest
of this analysis, a single curve was used. Symmetric Gaussian function was used to
generate these curves, and, more importantly, the mathematical shape of each curve was
not changed throughout the analysis. In the analysis of the evolution of low endotherm
with different secondary crystallization time and temperature, the position, height, and
width of low- and intermediate endotherm fitting curves were changed but not those for
high endotherms. This was possible because 1) upon cooling after partial melting, no
further crystallization occurs, and thus the shape and the magnitude of high endotherm
do not change; and 2) upon secondary crystallization performed at or below the primary
crystallization temperature, the growth of the high endotherm was significantly slow, and
thus further modification of fitting curves for the high endotherm was not necessary.
These distinct advantages of PC provided us with reliable and reproducible low
endotherm analysis, especially when the development of shoulder is insignificant. At
either longer crystallization times or high temperature due to the broad overlap of low

115
Temperature (oC)
180 200 220 240
dq/d
T (
J. g
-1.K
-1)
0
1
2
Figure 5.1 A typical example of curve fitting in DSC melting traces.The dark area designates the low endotherm developed during the secondary crystallization. PC-28K sample was initially crystallized at 185oC for 202 hours, partially melted at 220oC and exposed to secondary crystallization at 185oC for 40 minutes.
Original DSC heating traces
Fitted curves

116
endotherm with shoulder, the analysis was inevitably subjected to relatively large
uncertainty. Nonetheless, in the determination of the early stage low endotherm heat of
fusion, this uncertainty was insignificant because the low endotherms could be clearly
resolved. Lastly, the melting peak position of low endotherm was determined from the
fitted curve.
5.2.2 Atomic Force Microscopy
An atomic force microscope (AFM: Digital Instrument, Dimension 3000) was
operated in tapping mode at room temperature using nanosensor TESP (tapping etched
silicon probe) type single beam cantilevers. Compression moulded PC samples were
crystallized from the bulk inside the oven (temperature fluctuation < �0.3oC) for different
conditions: PC-28K at 185oC for 96 hours, and PC-4K at 165oC for 6 hours. Before
crystallization, all samples were preheated at 310oC for 5 minutes to remove potential
nuclei. The free surfaces of crystallized samples were examined under AFM. Images
were collected in both height and phase modes.
5.2.3 Optical Microscopy
As will be discussed in the results section, AFM images clearly show the
spherulitic structure of PC upon crystallization. However, the macroscopic size of those
spherulites are in the range of 5 to 10 microns, which is too small to resolve clearly under
a conventional optical microscope. To enhance the visibility of spherulites, thin film (�1
�m) was solvent cast on a glass substrate and crystallized. Although solvent (HPLC
grade CHCl3) must be used to cast thin film, the method of crystallization used in this
study is different from the widely used solvent induced crystallization (SINC) technique
because of the following procedures. After solvent casting on clean glass, the film was

117
subsequently dried at 150oC, slightly above the glass transition of PC and well above the
boiling point of chloroform (61-62oC) for a period of 24 hours to remove the residual
solvent. It needs to be noted that at this drying stage, no crystallization was induced.
This completely “dry” thin film was first preheated at 310oC for 5 minutes to remove
potential nuclei, and then further crystallized at 185oC for 250 hours inside an oven in a
dry nitrogen atmosphere. Subsequently, the morphology of this sample was examined
using the polarizing optical microscope.
5.3 Results
5.3.1 Overall Kinetics of Crystallization
5.3.1.1The Effect of Molar mass
In Figure 5.2, the melting traces of PC-28K crystallized at 185°C for different
periods of time are displayed. PC-28K exhibits a multiple melting behavior upon heating
subsequent to isothermal crystallization at 185°C. While the location of the higher
melting endotherm is independent of crystallization time, the melting temperature
associated with the lower endotherm continuously shifts to higher values with increasing
crystallization time. The total enthalpy of fusion (including both the low and the high
endotherms), �Hmtotal, was determined for each crystallization time from the area under
the DSC curve between the fixed limits of 160°C and 250°C. The insert in Figure 5.2
shows the variation of �Hmtotal with time for PC-28K crystallized at 185°C. Note that a
significant induction period (� 40-50 hours) is required for the detection of the first sign
of crystallinity at this temperature (see the footnote in page 119).
To see the effect of molar mass on the overall crystallization kinetics, the above
crystallization procedures were repeated for several PC fractions, and the result is

118
Temperature (oC )
180 200 220 240
dq/d
T (
J. g
-1. K
-1)
0.0
0.5
1.0
1.5
2.0
54 hours
77 hours
105 hours
153 hours
202 hours
680 hours
Time (min)103 104 105
� �H
m to
tal (
J .
g-1 )
0
10
20
30
Figure 5.2 Heating traces (HR = 10oC/min) of PC-28K crystallizedat 185oC for various times. Inset shows the corresponding temporal evolution of total heat of fusion.
PC-28K

119
depicted in Figure 5.4. For brevity reason, DSC melting traces are omitted for these
fractions; however, the general features are strikingly similar: time independent peak
position of high endotherms and strong time dependent shift of low endotherms (for
instance, in case of PC-4K, see Figure 4.4, HR = 10oC/min). Note that all samples were
crystallized at the same undercooling (�T = Tmo-Tx), assuming the variation of
equilibrium melting temperature,Tmo, is not significant with molar mass distribution. It is
clearly shown that the induction period dramatically increases and the maximum apparent
heat of fusion decreases, with molar mass.
From Figure 5.4, we can define the half-time of crystallization (t½), the time
elapsed to reach 50% of the maximum apparent heat of fusion for a given temperature.
The result is presented in Figure 5.5, in which available literature data are also
included2,5,7,8. The literature data were carefully selected only for PCs crystallized from
the bulk at the same temperature as used in the present study. t½ exhibits a strong molar
mass dependence showing more than two orders of magnitude change for a range of
molar masses between ca. 4,300 and 67,000 g.mol-1. It is also noteworthy that molar
mass distribution strongly affects the t½. Fractions crystallize slower than commercial
materials for a similar molar mass. For instance PC-30K fraction, even after
crystallization for 450 hours at 190oC, only showed ca. 1% crystallinity, whereas similar
molar mass commercial sample already reached their apparent maximum heat of fusion at
Due to the necessity of long time annealing at relatively high temperature, thermal degradation might occur during
crystallization, although throughout the experiments samples were crystallized in an inert atmosphere. The variation of
molar mass distribution in PC-28K samples was regularly checked during crystallization at 185oC, and the results are
summarized in Figure 5.3. In Figure 5.3, GPC traces of previous thermal treatments are included for a comparison
reason. As clearly seen, within experimental uncertainty, the variation of molar mass distribution was insignificant
during crystallization at 185oC up to 300 hours.

120
Retention Volume (mL)
18 21 24 27
Res
pons
e (m
V)
0
10
20
As is
Purified (a)
(a)+310oC for 10 min (b)
(b)+185oC for 100 hours
(b)+185oC for 300 hours
(b)+185oC for 200 hours
Figure 5.3 GPC traces of PC-28K samples after crystallization at 185oC for various times. For comparison reason GPC traces of previous thermal treatments are included. (see the footnote in previous page)

121
Time (min)
101 102 103 104 105
�H
mto
tal (
J.g-1
)
0
10
20
30
Figure 5.4 Temporal evolution of the total heat of fusion of fractions(filled symbols) and commercial (crossed symbol) PC samples of varying molar mass.
PC-6K (190oC)
PC-28K (185oC)
PC-4K (195oC)
PC-17K (190oC)
PC-12K (190oC)

122
M w (g . mol-1)
103 104 105
t 1/2
(m
in)
102
103
104
Fractions (this work)
Commercial (this work)
Commercial (literature)2,7,8
Figure 5.5 Variation of the half-time of crystallization of fractions and commercial PC samples as a function of weight average molar mass. Closed diamond symbol shows the time elapsed to develop ca. 1% crystallinity in case of PC-30K fraction crystallized at 190oC.
Commercial (literature)5
Fraction PC-30K (this work)

123
this temperature and time.
5.3.1.2The Effect of Crystallization Temperature
We first address the effect of temperature on the crystallization kinetics of PC-4K.
This fraction was crystallized at five different temperatures between 155°C and 210°C
for different times. Figure 5.6 shows the temporal evolution of �Hmtotal for PC-4K at
these crystallization temperatures. As expected, �Hmtotal increases steeply after some
induction period and finally reaches an apparent plateau at the longest crystallization
times. In the range of temperatures investigated, this plateau is virtually independent of
crystallization temperature.
The above procedures were repeated for other fractions, and the results were
analyzed in terms of the variation of t½ as functions of both crystallization temperature
and molar mass (see Figure 5.7). PC of Mw = 46,000 g.mol-1 (PC-46K) using volumetric
data reported in the literature8 was included in Figure 5.7. We note that t1/2’s differ by
more than two orders of magnitude between PC-4K and PC-46K, as similarly seen Figure
5.5. Of more interest, we also note that t½ exhibits a minimum around Tx = 186°C for the
low molar mass fraction (PC-4K), and in the vicinity of 190°C for PC-46K commercial
sample. This observation may lead to the conclusion that in the case of bulk-crystallized
PC, regardless of molar mass the maximum crystallization rate occurs approximately at
190oC. Similar conclusions have been drawn from the studies of PPS9 and PEEK10,11
fractions. Due to the limited amount of material for each fraction, except for PC-4K, the
exact shape of the variation of t½ for other fractions can not be rigorously determined,
although it is apparent that crystallization around 190oC occurs faster than crystallization

124
Time (min)
102 103 104
�H
m to
tal (
J . g
-1)
0
10
20
30
40
Tx = 155°C
Tx = 165°C
Tx = 181°C
Tx = 210°C
Tx = 195°C
Figure 5.6 Temporal evolution of the total heat of fusion of PC-4K for different crystallization temperatures.

125
Temperature (oC)
140 160 180 200 220
t 1/2
(min
)
102
103
104
105
Figure 5.7 The variation of the half-time of crystallization of varying molar mass PC samples as a function of crystallization temperature. Open symbol shows a commercial PC sample (Mw = 46,000 g.mol-1)
from the literature8. The dotted lines are only for the visual guide.
PC-4K
PC-6K
PC-12K
PC-17K
PC-46K(Commercial)

126
at lower temperatures. In this plot, therefore, the dotted lines must be used only as visual
guide.
5.3.2 Morphology
Micrographs 5.1 and 5.2 show, respectively, the early and later stages of
spherulite formation in PC-28K cold-crystallized at 185oC for 96 hours. Although the
size of spherulite is small, due to the high resolution of the AFM, the phase images
clearly show that PC forms spherulitic structure. Micrograph 5.1 seems to be close to a
sheaf like structure observed by MacNulty under the optical microscope12. Micrograph
5.2 depicts the formation of branches and the spherulitic impingement upon growth. The
morphology of PC-28K thin film crystallized at 185oC for 250 hours is shown in
Micrograph 5.3. Relatively big spherulite (50 to 75�m size) could be clearly resolved.
To study the effect of molar mass on the morphology, the lowest molar mass
fraction, PC-4K, was cold-crystallized at 165oC for 6 hours. In Micrograph 5.4, the
height image indicates the spherulitic structure for this low molar mass PC. Similarly,
Fryer13 observed spherulites in PC-9K crystallized from solution. These studies show
that in the whole range of molar masses of PC, the principal morphology of
semicrystalline PC is a spherulitic structure.
5.3.3 Secondary Crystallization Kinetics
This section will present the results of secondary crystallization studies performed
in the DSC cell for PC samples of different molar masses. In these experiments, we
varied the 1) initial degree of crystallinity prior to secondary crystallization, 2) both the
secondary crystallization temperature and time, 3) the partial melting temperature, and 4)
primary crystallization temperature. The reproducibility of the temporal evolution of the

127
Micrograph 5.1 AFM phase image of the early stage of spherulite formation. PC-28K was bulk crystallized at 185oC for 95 hours. (for detail, see the text)
0 50
5�m
�m

128
Micrograph 5.2 AFM phase image of the structure of well-developedPC spherulites. PC-28K was bulk crystallized at 185oC for 95 hours.(for detail, see the text)
0 5
05
�m
�m

129
Micrograph 5.3 Spherulitic structure in semicrystalline PC-28Kcrystallized at 185oC for 250 hours. The scale bar shows approximately50 microns. (for detailed crystallization conditions, see the text)

130
Micrograph 5.4 AFM height image of the early stage of PC-4Kspherulites. PC-4K was bulk crystallized at 165oC for 6 hours.(for detail, see the text)
0 2
02
�m
�m

131
low endotherm will also be discussed. The results will be presented in this order.
Detailed crystallization conditions of PC samples used for the study of secondary
crystallization kinetics are listed in Table 5.1.
5.3.3.1The Effect of the Initial Degree of Crystallinity
Secondary crystallization experiments were performed under isothermal condition
after partial melting for samples that were cold-crystallized for different periods of time.
The choice of the crystallization temperature and times was based on the study of the
overall kinetics of crystallization presented in the preceding section. Since similar
experiments were carried out for PC-19K and PC-28K, the details of the thermal
treatments are given only for PC-28K.
PC-28K was crystallized by annealing from the glass at a temperature of 185°C
for a period of 202 hours (PC-28K; 202h). This sample was then partially melted (PM)
by heating it at a rate of 40°C/min to a temperature above the low endotherm (TPM =
220°C) and keeping it at that temperature for 1 minute. Note that the choice of the partial
melting temperature (TPM) depends slightly on the sample molar mass (see Table 5.1).
The heats of fusion of the original and partially melted samples are 25.4 and 8.3 J/g,
respectively. Subsequent to partial melting, the sample was quenched at the maximum
cooling rate available to the secondary crystallization temperature, Tx = 185°C, and
maintained at that temperature for a given period of time, tx. The sample was then
quenched to room temperature, and its heating trace was subsequently recorded at a rate
of 10°C/min. This procedure was repeated for different secondary crystallization times.
Figure 5.8 shows typical heating curves for this set of samples for times ranging from 5
to 900 minutes. Also plotted in this figure is the melting trace of a partially melted

132
Sample
Designation Mw ( g. mol-1 ) Mw / Mn
Crystallization
Conditions in the Oven
Partial
Melting (PM), oC
*PC-4K 4,270 1.02 At 165°C, for 38 hours 216
*PC-6K 6,110 1.05 At 173°C, for 49 hours 215
*PC-12K 12,400 1.10 At 178°C, for 160 hours 220
*PC-17K 17,100 1.10 At 181°C, for 382 hours -
PC-19K 18,800 1.99 At 170°C, for 384 hours 217
PC-28K 28,400 2.07 At 185°C, for 202 hours 220
Table 5.1 Molecular characteristics and crystallization conditions for bisphenol-A
polycarbonate samples (Asterisk shows the fractions).

133
Temperature (°C )
180 200 220 240
dq/d
T (
J. g
-1. K
-1)
0.0
0.5
1.0
1.5
2.0
5 min 10 min 20 min 30 min
40 min
86 min120 min240 min
480 min900 min
After partial melting
Figure 5.8 Heating traces (HR = 10oC/min) of PC-28K, crystallizedat 185oC for 202 hours, partially melted at 220oC, and further isothermallycrystallized at 185oC for various times ranging from 5 min to 900 min.

134
sample that was not subjected to further crystallization at 185°C. As a result of the
second isothermal crystallization at 185°C, a low endothermic peak develops just above
the crystallization temperature during subsequent heating.
The above procedure was repeated for two other PC-28K samples that were cold
crystallized at 185°C for shorter times (105 and 153 hours, respectively). These samples,
designated (PC-28K; 105h) and (PC-28K; 153h) exhibited overall heats of fusion of 9.5
and 20.4 J.g-1, respectively. After partial melting at TPM = 220°C, their heats of fusion
decreased to 2.7 J.g-1 and to 5.9 J.g-1, respectively. DSC melting traces of these two
samples upon secondary crystallization are shown in Figures 5.9 and 5.10. In all cases,
the presence of the low endotherm was detected.
In Figure 5.11, �Hmtotal is plotted as a function of log (tx) for the three PC-28K
samples. In this figure, the filled symbols represent the heats of fusion of the original and
the partially melted samples, while the open symbols are associated with samples
subjected to the second crystallization stage at 185°C. Note that as a result of secondary
crystallization, �Hmtotal increases continuously with time and, at later stages, reaches the
value characteristic for the original sample (i.e. before partial melting). A deviation from
this behavior is observed at the latest stages of secondary crystallization for (PC-28K;
105h). This is mainly because sample (PC-28K; 105h) is far from completing its primary
crystallization.
We now focus on the time dependence of the melting temperature, Tmlow, and the
heat of fusion, �Hmlow, associated with the low endotherm for samples (PC-28K; 105h),
(PC-28K; 153h), and (PC-28K; 202h), resulting from secondary crystallization at 185°C.
On Figure 5.12, Tmlow is found to increase linearly with log (tx - t0) over more than three

135
Figure 5.9 Heating traces (HR = 10oC/min) of PC-28K, crystallizedat 185oC for 105 hours, partially melted at 220oC, and further isothermallycrystallized at 185oC for various times ranging from 20 min to 300 min.
Temperature (oC)
180 200 220 240
dq/d
T (
J. g
-1. K
-1)
0.00
0.25
0.50
0.75
After partial melting
180 min
120 min 60 min 45 min 30 min 20 min
300 min

136
Temperature (oC)
180 200 220 240
dq/d
T (
J. g
-1 K
-1 )
0.0
0.5
1.0
1.5 20 min 30 min 45 min 60 min
120 min
180 min240 min480 min
After partial melting
Figure 5.10 Heating traces (HR = 10oC/min) of PC-28K, crystallizedat 185oC for 153 hours, partially melted at 220oC, and further isothermally crystallized at 185oC for various times ranging from 20 min to 480 min.

137
Time (min)
10-1 100 101 102 103 104
�H
mto
tal (
J.g-1
)
0
5
10
15
20
25
30
PC-28K; 105h
PC-28K; 202hPC-28K; 153h
Figure 5.11 Effect of the initial level of crystallinity on the temporal evolutionof the total heat of fusion of PC-28K, following partial melting at 220oC, andfurther crystallization at 185oC. Open symbols show intermediate total heats offusion during the secondary crystallization, and closed symbols represent initial(after partial melting) and the final total heat of fusion. The accuracy of the determination of the experimental heat of fusion was better than 0.2 J.g-1.

138
decades, where to is the induction period, which is defined as the time required to detect a
measurable heat of fusion (� 0.4 J.g-1 ) for the low endotherm. Under these conditions,
the induction periods for (PC-28K; 105h), (PC-28K; 153h) and (PC-28K; 202h) are
reproducibly found to be 7, 3, and 2 minutes, respectively. The filled symbols in Figure
5.12 correspond to the low endotherm peak temperature for the original samples at
different stages of crystallization. Note that the data scatter is larger in this case than for
samples undergoing secondary crystallization after partial melting. Such scatter is a
result of the overlap between the low and the high endotherms at very long crystallization
times (see the heating traces of original samples in Figure 4.3 at HR = 10oC/min). As
mentioned earlier, an induction period of about 45 hours is required to detect any trace of
crystallinity during the cold-crystallization of PC-28K. Once this induction time is
accounted for, it is found that the same Tmlow vs log (tx) dependence is exhibited by all
samples (see Figure 5.12). Following the formalism used in the previous studies,1,6 the
variation of Tmlow with log (tx) is expressed empirically by:
Tmlow = Tx
+ A(Tx) + B(Tx) log (tx) [5.1]
Where A(Tx) and B(Tx) are the fitting parameters , and in case of PC-28K (Tx = 185oC),
these values are noted in Figure 5.12.
Adopting the free-growth approximation14,
�Hmlow = K·tx
n [5.2]

139
t - to (min)
100 101 102 103 104 105
Tm
low -
Tx
( °C
)
0
5
10
15
20
25
30
35
PC-28K; 202h
PC-28K; 153h
PC-28K; 105h
PC-28K; original
A(Tx ) = 12.5
B(Tx ) = 3.4
Figure 5.12 Evolution of the low endotherm melting peak temperature with time during the secondary crystallization at Tx = 185oC performed
for samples with different levels of initial crystallinity.

140
log (�Hmlow ) is plotted as a function of log (tx) for (PC-28K; 105h), (PC-28K; 153h) and
(PC-28K; 202h) in Figure 5.13. Since log (�Hmlow ) increases linearly with log (tx) at the
early stage of secondary crystallization, the Avrami exponent, n, is identified as the slope
at short crystallization times. The Avrami exponent, n, characterizes the geometry and
the mechanism of growth, while K describes the rate of secondary crystallization at the
early stage. Data in Figure 5.13 indicate that the initial stage of secondary crystallization
is characterized by an Avrami exponent of 1/2. At later stages of secondary
crystallization, ca. 100 -200 minutes, a deviation from linearity is observed, indicating
that �Hmlow continues to increase with time but at a much slower rate. Note also that the
absolute magnitude of �Hmlow depends on the initial degree of crystallinity of the sample.
Note that due to the strong overlap of the low and the high endotherms in the case of the
original samples, the calculation of �Hmlow is subjected to a large uncertainty; therefore,
these samples are not included in Figure 5.13.
Similar experiments were conducted for the PC-19K sample. In this case, the
cold crystallization was performed at 170°C for 192 and 384 hours. Partial melting was
carried out at TPM = 215°C, and further isothermal crystallization was also performed at
170°C for times ranging from 1 to 1000 minutes. The temporal evolutions of Tmlow and
�Hmlow are displayed in Figures 5.14 (a) and (b) for this series of samples. These plots
once more demonstrate the linear variation of Tmlow vs log (tx) and an Avrami exponent of
1/2 for the initial stage of secondary crystallization.
5.3.3.2The Effect of Secondary Crystallization Temperature
In this series of experiments, amorphous samples were again cold-crystallized
under the conditions given in Table 5.1 to ensure spherulitic impingement. These

141
100 101 102 103
�H
mlo
w (
J . g
-1)
0.1
1
10
PC-28K; 202h
PC-28K; 153h
PC-28K; 105h
t - to (min)
<n> = 0.52
Figure 5.13 Evolution of the low endotherm enthalpy of fusion with secondary crystallization time at 185oC performed for samples with different levels of initial crystallinity. The solid lines is a fitted line for the data of 202 hours and the other two cases are omitted for the simplicity of data presentation. Experimental error < 0.2 J.g-1.

142
t - to ( min )
100 101 102 103 104 105
�H
mlo
w (
J .
g-1 )
0.1
1
10
Tm
low -
Tx
(°C
)
0
5
10
15
20
25
30
35
A(Tx) = 9.2
B(Tx) = 4.0
n = 0.49
n = 0.44
PC-19K; original
PC-19K; 96h
PC-19K; 384h
Figure 5.14 Temporal evolution of the low endotherm melting peak temperature (a), and heat of fusion (b) for PC-19K after partial meltingat 217oC and secondary crystallization at Tx = 170oC for various times.
The accuracies for the temperature and the heat of fusion were better than 0.2oC and 0.2 J.g-1, respectively.
(a)
(b)

143
samples were partially melted at TPM and subsequently quenched at the maximum
cooling rate available to the crystallization temperature, Tx, at which they were kept for a
given time, tx. These samples were then quenched to room temperature and immediately
reheated to record their melting behavior. The nomenclature (PC-XX; PM-TPM ; SC-Tx)
describes a given secondary crystallization experiment, where PC-XX provides
identification of the sample molar mass and the initial crystallization conditions (Table
5.1), PM-TPM specifies the temperature at which partial melting was carried out, and SC-
Tx designates the temperature of the second crystallization stage. For instance, (PC-28K;
PM-220; SC-175) implies that the sample PC-28K, initially crystallized at 185°C for 202
hours, was partially melted at 220°C and further crystallized at 175°C.
Analysis of heating traces after secondary crystallization provides an access to the
crystallization time dependence of the melting point and heat of fusion associated with
the low endotherm. These quantities were in turn analyzed using equations (5.1) and
(5.2) to yield the parameters A(Tx), B(Tx), K and n. The results in case of PC-28K are
presented in Figure 5.15 and Table 5.2, and all other results from the fractions are also
included in Table 5.2. The values of the K and n parameters are not included for PC-4K
and PC-6K, because a rigorous analysis of the enthalpy associated with the low
endotherm could not be performed for short crystallization times. Indeed, low molar
mass samples, which are only allowed to crystallize for short times under isothermal
conditions, can develop further crystallinity during subsequent heating. The exotherm
associated with crystallization during heating unfortunately overlaps the low endotherm
associated with the melting of secondary crystals formed at Tx. This issue is no longer
present for longer secondary crystallization times, since the rate of secondary

144
Tm
low -
Tx
(°C
)
5
10
15
20
25
30
Tx = 165 °C
Tx = 175 °C
Tx = 185 °C
Tx = 195 °C
Figure 5.15 Temporal evolution of the low endotherm melting temperature (a), and heat of fusion (b) for PC-28K after partial melting at 220oC and secondary crystallization for various temperatures and times.
Time (min)
100 101 102 103 104
�H
mlo
w (
J .
g-1 )
10-1
100
101
Tx = 165 °C
Tx = 175 °C
Tx = 185 °C
Tx = 195 °C
(a)
(b)
n � 0.5

145
BAPC-28K A(Tx) B(Tx) K n
Tx = 165°C 13.35 4.32 0.064 0.59
Tx = 175°C 12.49 4.18 0.189 0.53
Tx = 185°C 12.28 3.62 0.273 0.52
Tx = 195°C 11.47 3.34 0.297 0.66
BAPC-12K A(Tx) B(Tx) K n
Tx = 168°C 9.00 4.53 – –
Tx = 178°C 9.73 3.80 0.317 0.54
Tx = 183°C 8.41 3.90 – –
BAPC-6K A(T x) B(Tx)
Tx = 163°C 6.65 4.61
Tx = 173°C 8.64 3.04
Tx = 178°C 8.54 2.65
BAPC-4K A(T x) B(Tx)
Tx = 155°C 4.94 5.70
Tx = 165°C 8.70 3.64
Tx = 170°C 8.06 3.53
Table 5.2 Parameters describing the temporal evolution of the low endotherm for
various PC samples at different secondary crystallization temperatures. Effects of
crystallization temperature and molar mass. The experimental uncertainties for the
A (Tx) and B(Tx) were better than 0.5oC and 0.3oC, respectively.

146
crystallization decreases with time beyond the initial stage and the crystallinity developed
during heating becomes negligible. The parameters A(Tx) and B(Tx) reported for
samples PC-4K and PC-6K in Table 5.2 are thus derived from measurements on samples
crystallized for long times. The above experimental limitations are not an issue for
higher molar mass PC samples, as the rate of secondary crystallization decreases with
increasing chain length. B(Tx) as a function of secondary crystallization temperature is
plotted in Figure 5.16. For each PC samples, an increase in crystallization temperature
results in a decrease in the slope B(Tx). For molar masses equal to or higher than 12,000
g.mol-1, B(Tx) decreases almost linearly with Tx. Note that commercial and fractionated
samples fall on the same line. For the lowest molar mass samples, B(Tx) still exhibits a
quasi-linear variation with Tx, but the slope (ca. -0.13) is much higher than for the higher
molar mass samples (-0.04).
Finally, the effect of heating rate on the magnitude of the slope B(Tx ) for the two
extreme molar masses, i.e. samples PC-4K and PC-28K was investigated. For PC-4K,
three, and for PC-28K, four, different temperatures of secondary crystallization
experiments were used, and the subsequent melting behaviors were examined at heating
rates ranging from 5 to 20°C/min. The results of such analyses (Table 5.3) indicate that
the magnitude of B(Tx) increases with heating rate. A more detailed analysis of these
results will be offered in the discussion section.
5.3.3.3The Effect of Partial Melting Temperature
In the previous two sections, to monitor the temporal evolution of the low
endotherm, second isothermal crystallization experiments were performed on samples
that had been partially melted at TPM. TPM is slightly different depending on the molar

147
Tx (oC)
150 160 170 180 190 200
[B(T
x ),
� =
10o C
/min
]
0
2
4
6
8
PC-28K
PC-19K
PC-12K
PC-6K
PC-4K
Figure 5.16 Variation of the rate of shift of the low endotherm, B(Tx), as
a function of secondary crystallization temperature, Tx, for various molar
mass PC samples (in this plot B(Tx) has been evaluated at HR =10oC/min).
Note that closed and crossed symbols represent fractions and commercial materials, respectively.

148
PC-4K Tx = 155°C Tx = 165°C Tx = 170°C
A(Tx) B(Tx) A(Tx) B(Tx) A(Tx) B(Tx)
�= 5°C/min 5.90 4.15 6.62 3.04 7.26 2.47
�= 10°C/min 5.80 5.38 7.05 3.64 8.06 3.53
�= 20°C/min 5.84 5.72 7.31 4.25 8.66 3.76
PC-28K Tx = 165°C Tx = 175°C Tx = 185°C Tx = 195°C
A(Tx) B(Tx) A(Tx) B(Tx) A(Tx) B(Tx) A(Tx) B(Tx)
�= 5°C/min 8.00 4.30 8.55 3.63 9.30 3.01 9.8 2.80
�= 10°C/min 10.22 5.17 10.88 4.18 11.67 3.87 11.25 3.34
�= 20°C/min 10.71 5.26 11.05 4.60 10.17 3.93 11.55 4.30
Table 5.3 Parameters describing the temporal evolution of the low endotherm for
various PC samples at different secondary crystallization temperatures. Effect of
heating rate. The experimental uncertainties for the A (Tx) and B(Tx) were better
than 0.5oC and 0.3oC, respectively.

149
mass of samples (see Table 5.1) since the choice of TPM is to ensure the complete melting
of crystals melting at the low endotherm. This partial melting temperature may affect the
secondary crystallization kinetics: due to the overlapping nature of high and low
endotherms, during partial melting, most of the intermediate endotherm (shoulder) and a
small fraction of high endotherm have been removed.
PC-19K samples originally crystallized at 170oC for 16 days were partially melted
at two different temperatures (210oC and 217oC) for two minutes to ensure the complete
removal of the low endotherm. Secondary crystallization experiments have been
performed at 170oC for various times. The details of the experimental procedures are
similar to those described in the previous section, and will thus be omitted here. On
Figure 5.17, the melting traces of the original sample, partially melted at 210oC and
217oC, are plotted. Obviously, a higher partial melting temperature leads to a more
narrow and well-defined peak. The peak position of the sample partially melted at 217oC
has been shifted about 4oC higher than the original sample, which could be due to the
annealing effect (see Chapter 6). Figure 5.18 (a) and (b) present the heating traces for
samples after secondary crystallization. The temporal behavior of the low endotherm
follows the characteristics that have been observed previously. The analysis of the low
endotherm in terms of peak position and heat of fusion is shown in Figure 5.19 (a) and
(b), respectively. From this, it is demonstrated that regardless of the partial melting
temperature, the low endotherm kinetics follows the same characteristic behavior: the
peak position increases linearly with time and the initial Avrami exponent is close to 0.5.
Of more interest, the peak position of the low endotherm falls on the same line,
regardless of the partial melting conditions.

150
Temperature (°C)
160 180 200 220 240
dq/d
T (
J. g
-1.K
-1 )
0
1
2
3
Figure 5.17 Heating traces (HR = 10oC/min) of PC-19K after partial melting (PM) at two different temperatures (210oC and 217oC). For comparison reason, the melting traces of original sample crystallized at 170oC for 16 days are plotted together.
Original sample
PM at 210oC for 2 min
PM at 217oC for 2 min

151
Temperature (°C)
180 200 220 240
dq/d
T (
J. g
-1.K
-1)
0
1
2
3
After PM 10 min
20 min
62 min
165 min
860 min
Figure 5.18 Temporal evolution of the melting endotherm for PC-19Ksubsequent to secondary crystallization at 170oC after partial melting at 210oC for 2 minutes (a), and 217oC for 2 minutes (b). Original sample was crystallized at 170oC for 16 days.
dq/d
T (
J. g
-1.K
-1)
0
1
2
3
(a)
(b)
After PM 5 min
10 min
20 min
60 min
300 min1100 min

152
t - to ( min )
100 101 102 103 104 105
�H
mlo
w (
J .
g-1 )
0.1
1
10
Tm
low -
Tx
(°C
)
0
5
10
15
20
25
30
35
A(Tx) = 9.2
B(Tx) = 4.0
n = 0.49
n = 0.44
PC-19K; original
PC-19K; 96hPC-19K; 384h
Figure 5.14 Temporal evolution of the low endotherm melting peak temperature (a), and heat of fusion (b) for PC-19K after partial meltingat 217oC and secondary crystallization at Tx = 170oC for various times.
The accuracies for the temperature and the heat of fusion were better than 0.2oC and 0.2 J.g-1, respectively.
(a)
(b)

153
5.3.3.4The Effect of Primary Crystallization Temperature
In this section, the effect of primary crystallization temperature on the secondary
crystallization kinetics is presented. PC-6K samples crystallized at two different
temperatures (173oC and 190oC) were partially melted at 216oC and further crystallized at
173oC for various times. Other experimental conditions were similar to previous
calorimetry studies. The analysis was done only for the temporal evolution of the low
endotherm peak position. This is because, as noted earlier, for this particular sample
(PC-6K), the Avrami exponent, n, can not be determined due to the overlap of the
crystallization exotherm and the melting endotherm at early times of secondary
crystallization. Tmlow vs log [time] for these two sets of samples are plotted in Figure
5.20. As clearly seen, Tmlow exhibits a linear variation with log(tx), and within the
experimental uncertainty, the low endotherm peak position does not depend on the
primary crystallization temperature.
5.3.3.5Reproducibility of the Temporal Evolution of Low Endotherm
Until now, the evolution of the low endotherm has been analyzed in two ways-
peak melting temperature (Tmlow) and heat of fusion (�Hm
low). In the preceding sections it
has been clearly shown that the evolution of low endotherm exhibits a strong time and
temperature dependent behavior. Time dependent behavior of the low endotherm can
readily be described using equations (5.1) and (5.2). At this moment, it would be
beneficial to ensure that for a given time of secondary crystallization, the melting peak
position and the heat of fusion associated with the low endotherm are reproducible. To
this end, PC-12K samples have been used in the following experimental procedures. PC-

154
Time (min)
102 103
Tm
low (
o C)
12
14
16Tx= 173oC; TPM = 215oC; Tsc = 173oC
Tx= 190oC; TPM = 215oC; Tsc = 173oC
A(Tx) = 7.07; B(Tx) = 3.10
Figure 5.20 Temporal evolution of low endotherm peak positionchange in case of PC-6K samples initially crystallized for two different temperatures (Tx = 173 and 190oC). Only Tx has been varied and
partial melting (PM) and secondary crystallization (SC) experiments have been performed at the same temperatures. Temperature scale has been corrected using In-sandwich sample. (HR = 10oC/min)
PC-6K

155
12K samples, initially crystallized at 178oC for 160 hours and partially melted at 220oC,
were exposed to the secondary crystallization at 178oC for one hour. Upon reaching the
desired time, the sample was fast cooled to 100oC at the maximum rate available and
subsequently reheated at 10oC/min up to 220oC. The sample was then immediately
quenched back to 178oC and remained at this temperature for another hour for the second
experiment. These steps were repeated four times. Note that in each run, the preexisting
high endotherm was not altered, since the heating scan stopped at 220oC, where the
partial melting was performed. In doing so, the reproducibility of the low endotherm in
terms of peak position and heat of fusion can be effectively checked. DSC melting traces
of these four scans around the low endotherm region are shown in Figure 5.21. As
clearly seen, the low endotherm resulting from secondary crystallization was highly
reproducible in terms of both peak position (� 0.2oC) and heat of fusion (� 0.05 J.g-1).
5.4 Discussion
In this chapter, the bulk kinetics of crystallization is described through the
temporal evolution of the enthalpy of fusion �Hmtotal . The principal reason for not
converting enthalpies of fusion to degrees of crystallinity stems from the rather large
uncertainty associated with the theoretical enthalpy of fusion for bisphenol-A
polycarbonate (110 to 140 J.g-1)15,16. Furthermore, the melting of PC crystals is generally
observed over a large temperature range centered ca. 100 K below the reported
equilibrium melting temperature (Tm = 590-600 K)17. It is therefore imperative to
account for the temperature dependence of the molar heat capacity for both the crystal
and the liquid fractions in calculations of the degree of crystallinity. More importantly,
SAXS and other morphological studies indicate that PC lamellae are generally very

156
Temperature (oC)
180 200 220
dq/d
T (
J. g
-1. K
-1 )
0.0
0.1
0.21st scan2nd scan
3rd scan
4th scan
Figure 5.21 Reproducibility test of the temporal evolution of the low endotherm. PC-12K sample, crystallized at 178oC for 160 hours, partially melted at 220oC, was further isothermally crystallized at 178oC for one hour. Detail experimental conditions see the text. Note the scale of heat flow rates.

157
thin18, suggesting that surface enthalpic contributions cannot be neglected19. This latter
issue becomes even more critical when one considers PC samples that contain a
significant fraction of small secondary crystals. These issues will be further discussed in
Chapter 7.
5.4.1 Overall Crystallization Kinetics
5.4.1.1The Effect of Molar Mass Distribution
The rates of crystallization of PC of varying molar masses are depicted in Figure
5.15, where the half-time of crystallization is plotted as a function of molar mass. Notice
that t1/2 of the fractions increases steeply with molar mass. The extremely low
crystallization rates of PC, especially for higher Mw, may be related to its stiff backbone
and high melt viscosity20. The substantially low value of the growth rate of PC mainly
results from a very high free energy of fold formation (27.3 kcal per mole of fold for PC
versus the corresponding value of 5.7 kcal per mole of fold for PE)17.
In Figure 5.15, it is also noteworthy that the crystallization kinetics of commercial
samples is faster than that of fractions of similar molar mass. The broader molar mass
distribution of the commercial samples, when caused by the existence of the low molar
mass components, might explain their faster kinetics of crystallization. In this case, the
short chain molecules reduce the average relaxation time of the longer chain molecules
and therefore increase the crystallizability of the material. Therefore, in commercial
samples, the shorter chain molecules start the process of crystallization, and serve as
nucleating sites for the longer chains. However, this sequence of crystallization is
opposite to what occurs in polydisperse PE21, where the high molar mass components
initiate the crystallization. The experiments of Ergoz et al.21 in fractions of low to

158
moderate molar mass PE clearly demonstrate this point (i.e. at a given temperature Tx, the
crystallization rate of fractions of PE increases considerably with Mw). This difference is
likely to be explained by the fact that diffusion effects control the rate of crystallization
of PC at the temperature investigated, while nucleation effects control that of PE.
It is informative to compare the above result with other previous reports. The
molar mass dependence of the total heat of fusion among different polymers after long
time crystallization is illustrated in Figure 5.22*. In this figure, the total heats of fusion of
fractions of linear PE22,23 (triangles), PEEK24 (squares), and PC (circles) are compared.
The molar masses on the X-axis have been divided by the corresponding critical
entanglement molar mass, Mc25. Accordingly, the values on the Y-axis have been
normalized to the heat of fusion of the perfect crystal (i.e., crystallinity). It is interesting
to note that for these three polymers, which have very different backbone structures, the
crystallinity decreases linearly with the logarithm of Mw /Mc. The slope of each line
reflects the diminishment of the crystallizability of the polymeric material with an
increase in the density of the entanglements22. For PC fractions, over the range of molar
mass investigated, the slope of crystallinity vs log{M w/Mc} is smaller than in linear PE
and PEEK. Additionally, the normalized heat of fusion of PC extrapolated to Mw = Mc
leads to a noticeably smaller value compared to that of linear PE or PEEK. Again this
could be related to the high free energy of fold formation of PC14 and exceedingly slow
crystallization rate2-4,26. To elucidate the influence of the entanglements density on the
final degree of crystallinity of PC, more investigations are required; for instance, it would
be desirable to study fractions of higher molar masses.
* Dr. Alizadeh originally proposed this plot, and some of the arguments accompanying Figure 5.22 was constructed
with her helpful discussion.

159
M w / Mc
1 10 100 1000
{ �H
mto
tal }
norm
or
Xc
0.0
0.2
0.4
0.6
0.8
1.0
LPE Fractions23
PEEK Fractions24
PC fractions (this study)
LPE Fractions22
Figure 5.22 Variation of normalized total heat of fusion (or crystallinity)among different polymers after long time crystallization. The X-axis has been normalized with critical molar mass corresponding to each polymer25.

160
5.4.1.2The Effect of Crystallization Temperature
For a rigorous comparison of the kinetics of crystallization, the undercooling–
defined as the difference between the equilibrium melting point and the crystallization
temperature– of the samples should be equal. However, to our knowledge the variation
of the equilibrium melting temperature of PC as a function of molar mass is not known.
One should notice that the most accurate determination of the equilibrium melting
temperature through the non-linear Hoffman-Weeks approach would require measuring
the apparent melting temperature of the polymer at many different crystallization
temperatures27. However, the temperature range for crystallization of PC is extremely
narrow2-4.26, thus in practice this method will be subjected to a large uncertainty.
Because of this intrinsic difficulty in PC, the conclusions from Figure 5.7 must be
considered under the assumption that the equilibrium melting temperature of fractions are
similar. The two important observations from Figure 5.7 are that 1) the maximum growth
rate of PC appears to occur at the same temperature (around 190oC) regardless of molar
mass distribution; and 2) there exists a significant difference (on the order of 100 times)
in the absolute time scale of t1/2 between samples of varying molar mass. In a parallel
line with the first observation, several reports claim that the maximum rate of
crystallization of PC should occur around 190oC8,15,20,28,29.
5.4.1.3Morphology of Semicrystalline PC
Since the first report of spherulitic structure of cold crystallized PC (Mv= 33,000
g/mol, 190oC for 8 days under dry N2) by Kämpf4,30, many authors have studied the
morphology of semicrystalline PC. Falkai and Rellensmann reported the crystallization
kinetics and morphology of cold-crystallized PC (Mv= 33,000 g/mol) from the melt2,3,

161
and they also showed spherulitic morphology of PC. MacNulty crystallized PC (Mw not
specified) by solvent casting for periods between one and sixty hours at 180oC12. The
author described the sequential formation of spherulite using optical microscope starting
from a roughly elliptical entity followed by a perfectly symmetrical dumb-bell shape
entity. This description is very similar to a general structure of spherulite suggested by
Keller31,32. Siegmann and Geil intensively studied the crystallization of solvent cast PC
thin film either from “as is” wet film or after melting and quenching to its glassy state33.
The authors proposed that the glassy state may have small but ordered structures, called
nodules, which further grow into bigger nodules and eventually form spherulites
depending on the annealing temperature and time. However, such views are highly
controversial42.
Several morphology studies of semicrystalline PC, including the above relatively
earlier works, can be classified into three different types based on the methodology
adopted: first, bulk crystallization either from the glassy state or from the melt2-4; second,
solvent or vapor induced crystallization12,30,33; and lastly, nucleating agents and/or
plasticizer assisted crystallization17. These very different types of crystallization studies
confirm that PC forms spherulitic structure upon crystallization, regardless of sample
crystallization conditions. Morphology study in the present work also supports this
conclusion.
5.4.1.4Secondary Crystallization Kinetics
The most striking result is that while the kinetics of crystallization of PC from a
completely amorphous state is extremely slow (in the order of 10 to 100 hours), the
secondary crystallization process, especially in partially melted samples, occurs at a

162
much faster rate (in the order of minutes). In the previous sections the remarkable
influence of the molar mass on the rate of "primary" crystallization of PC was noted. In
contrast, the kinetics of the low endotherm depicts two universal behaviors, regardless of
the molar mass distribution, the initial stage of crystallization prior to the secondary
crystallization, secondary crystallization temperature, and partial melting temperature:
Tmlow increases linearly with the logarithm of crystallization time, and at the early stage,
the Avrami exponent in log[�Hmlow] vs log[time] is 0.5.
Secondary crystallization in these cases occurs in the presence of preexisting
crystals and through a completely different mechanism. While the primary crystals that
remain after partial melting are lamellar type, the secondary crystals most likely exhibit
bundle-like or fringe-micellar type structures or possibly mosaic block crystals depending
on temperature. More importantly, the formation of this specific type of secondary
crystals is believed to be limited to amorphous regions within the spherulites. These
amorphous regions between pre-existing lamellae are more constrained than the free
melt. Thus, the formation of bundle-like crystals in these confined regions will be more
favorable than chain-folded lamellae. In addition, PC chain segments could be less
entangled in the interlamellar amorphous regions than in the liquid-like amorphous zones.
This maybe possible because during partial melting, chain segments lose crystallographic
registration but cannot return to the random conformational state characteristic of the
unconstrained melt. (Again, this is a direct consequence of both the rigid backbone
structure of PC and the constraints imposed by surrounding lamellae.) Therefore, during
secondary crystallization subsequent to partial melting, the chain segments already have a
more favorable conformational state for crystal formation. This would lead to a faster

163
rate of secondary crystallization, at least for the bundle-like crystals. Another viewpoint
would be to consider that chains in the interlamellar amorphous region have reduced
molar conformational entropy than the free melt. Thus they should exhibit a larger
driving force towards crystallization.
As mentioned earlier, the kinetics of formation secondary crystals also differ from
that of folded-chain lamellae. At the early stages of secondary crystallization, the
logarithm of the heat of fusion of the low endotherm, log[�Hmlow], increases linearly with
log[time], the slope (i.e. Avrami exponent, n) being equal to 0.5. Note that the Avrami
exponent of ca. 0.5 is observed all PC samples, either fractions or commercials,
regardless of the variety of thermal treatments. An Avrami exponent of 0.5 has also been
observed in our laboratory for many other semicrystalline polymers, such as PEEK1,
ethylene/octene copolymers6, PET34, it-PS34, etc. We note that an Avrami exponent of
0.5 was already reported by Schultz et al. for the secondary crystallization of linear
polyethylene at a temperature below that of the primary crystallization35. Such a value of
the Avrami exponent was argued by these authors to be consistent with predictions for
instantaneous nucleation and diffusion-controlled one dimensional growth and possibly
linked to the observation by Keith et al.36 of intercrystalline links between the edges of
chain-folded lamellar crystals. One could, however, interpret this Avrami exponent in
the context of the fractal growth process discussed by Mathot et al37. An Avrami
exponent of a value below 0.5 was reported recently by Fu et al. for the secondary
crystallization of ethylene/1-butene copolymers38. The frequently reported Avrami
exponent of 0.5 for the secondary crystallization directly indicates that secondary
crystallization is very different from primary crystallization in terms of kinetics, for in the

164
latter case, the Avrami exponent is in the range of 2 to 4 depending on the geometry and
the mode of nucleation.
The remaining part of this section will be devoted to the melting behavior of
secondary bundle-like crystals. In the results section, it was observed that: 1) the melting
traces of PC samples after secondary crystallization reveal the presence of a low
endotherm above the crystallization temperature, Tx; and 2) over more than five decades
of time, the peak position of this low endotherm increases linearly with the logarithm of
time. The linear variation of the low endotherm melting position with log[tx] was
depicted through equation (5.1), and the intercepts and slopes, A(Tx) and B(Tx)
respectively, were reported in Table 5.2.
Based on previous investigations of PEEK1 and ethylene/-olefin copolymers6, a
series of conclusions about the physical meaning of the parameters A(Tx) and B(Tx) was
extracted. For these polymers, it has been demonstrated that at low to intermediate
secondary crystallization temperature, the extrapolation of the equation (5.1) to very short
times yields the crystallization temperature, i.e. Tmlow �Tx. For these polymers at low to
intermediate temperatures, secondary crystals were proposed to form through a non-
folding process. The equality between Tmlow and Tx is a signature of the bundle-like
crystals through a non-folding process, since the melting temperature of conventional
lamellae, even at very short times, always exceeds their crystallization temperatures.
In case of PC, however, it was observed that even at short times, Tmlow is always 5
to 10oC higher than Tx. At present this is not completely understood; however, it might
be related to the rigid backbone structure of PC. Once a bundle-like crystal is formed, the
environment becomes extremely constrained; thus, upon melting these small crystals

165
exhibit significant superheating effects, which may lead to the higher Tmlow than Tx even
at short times. One support for this reasoning is that in Table 5.3, as the heating rate
decreases, the intercept A(Tx) appears to decrease (less superheating at lower heating
rates).
For PEEK1, ethylene/octene copolymer6, PC39, and PET40, the rate of shift of the
low endotherm to higher temperatures with time, B(Tx), was proposed to be due, at least
partly, to a parallel decrease in the conformational entropy of the remaining amorphous
phase as a consequence of bundle-like secondary crystallization. PC exhibits only a
small variation of Tg with time in the course of secondary crystallization. However, a
clear broadening of the glass transition has been observed as secondary crystallization
proceeds. These observations are in accordance with the explanation that, as a result of
the formation of bundle-like crystals, the conformational entropy decreases, and therefore
the constraints increase. These issues will be addressed in Chapter 7.
The shift of the low endotherm melting point (Tmlow) to higher temperatures with
time could also be explained by lateral growth but not thickening of secondary crystals.
If thickening was at the origin of the shift of the low endotherm, then the rate of this shift
should increase with increasing crystallization temperature, because thickening is
generally a thermally activated process. This is contradictory to the experimental
observations, where the slope B(Tx) in equation (5.1) decreases with increasing Tx (see
Table 5.2). On the other hand, thickening cannot be exclusive to bundle-like crystals, and
if such a mechanism is feasible, one would expect the lamellar type crystals also to
thicken. Based on the time independence of the peak position of the high endotherm, this

166
lamellar thickening process cannot be operative at these secondary crystallization
temperatures.
Finally, it should be noted that both A(Tx) and B(Tx) are heating rate dependent
(see Table 5.3). The values reported in Table 5.2 are evaluated at a heating rate of
10°C/min. The heating rate dependence in the case of PC is very strong since the bundle-
like crystals formed during secondary crystallization exhibit a significant amount of
superheating39,41. In Figure 5.23, the temporal evolution of Tmlow in the case of PC-4K
exposed to the secondary crystallization at Tx = 165°C is illustrated for different heating
rates. Tmlow varies linearly with log(tx) at all heating rates, and the slope of such lines,
B(Tx), becomes steeper with heating rate, �. The inset of Figure 5.23 depicts the
variation of B(Tx) as a function of the square root of heating rate �0.5. The exponent of
0.5 for the heating-rate dependence is based on the assumption that the rate of melting is
a linear function of degree of superheating (for details, see Chapter 4). Thus when
polymer melting shows superheating, typically the melting point will linearly increase
with the square root of heating rate. The linear extrapolation of B(Tx) vs �0.5 to zero
heating rate corrects for the superheating effects, providing us with the intrinsic rate of
the shift of the low endotherm , [B(Tx), �0], at a given crystallization temperature.
For a given polymer, the degree of superheating is a function of its molar mass,
crystallization, and also melting conditions. Therefore, the determination of the intrinsic
rate of the shift of the low endotherm at different crystallization temperatures and for
different molar masses will be necessary. For this, samples are chosen to represent the
lowest and the highest molar masses among the crystallizable specimens available, and
the temperature range has been selected to be as wide as possible. In Figure 5.24, the

167
Time (min)
100 101 102 103 104
Tm
low (
o C)
170
175
180
185
190
{��(°C/min)}0.5
0 2 4 6 8
B(T
x)
0
2
4
6
8
�= 5°C/min
�=10°C/min
�=20°C/min
slope = B(Tx)
Figure 5.23 Temporal evolution of the low endotherm melting temperaturein PC-4K subsequent to secondary crystallization at 165oC at different heatingrates. Inset shows the rate of shift of the low endotherm, B(Tx), as a function of
the square root of heating rate. Samples were originally crystallized at 165oC for 38 hours and partially melted at 216oC. The accuracies for the temperature and B(Tx) were better than 0.2oC and 0.3oC, respectively.

168
�T = Tx - Tg
0 20 40 60 80
[B (
Tx
), �
= 0
°C/m
in]
0
2
4
6
PC-4K (Low Endotherm)
PC-28K (Low Endotherm)
Figure 5.24 Variation of the rate of the shift of the low endotherm at zeroheating rate as a function of �T (= Tx-Tg) for two extreme molar mass samples
of PC used in this study . The arrow points the temperature at which B(Tx)
becomes zero (crossover temperature, Tco). In Chapter 6, this figure is re-plotted
with the data from isothermal annealing experiments (see Figure 6.14).
Tco

169
variation of [B(Tx), �0] with �T (= Tx – Tg) for these two samples has been plotted.
[B(Tx), �0] decreases with increasing Tx, and more interestingly, [B(Tx), �0] for
both samples falls on the same line and vanishes at specific crossover temperatures, Tco.
For instance, around Tx = 190oC and 210oC the intrinsic rate of the shift of the low
endotherm for PC-4K and PC-28K, respectively, becomes zero. Therefore, possibly, low
endotherm does not exist above this crossover temperature.
5.5 Conclusions
The primary crystallization kinetics shows a strong dependence on molar mass
distribution. In the molar mass ranging between 4,300 and 55,000 g.mol-1, low molar
mass fraction crystallizes faster, and the overall crystallization rates differ by more than a
factor of 100. It was also observed a significance influence of molar mass distribution on
the overall crystallization kinetics.
In contrast, the kinetics of secondary crystallization of PC is essentially molar
mass independent. Regardless of molar mass distribution, initial stage of crystallization
prior to the secondary crystallization, secondary crystallization temperature, and partial
melting temperature, the kinetics of the low endotherm exhibits two universal behaviors:
low endotherm melting temperature, Tmlow, increases linearly with the logarithm of
crystallization time, and at the early stage, the Avrami exponent in the logarithm of the
heat of fusion associated with the low endotherm, log[�Hmlow], as a function of the
logarithm of crystallization time is 0.5. The rate of the shift of low endotherm with time,
B(Tx), was found to decrease with temperature.
From the heating rate correction of B(Tx), it has been found that there exists a
crossover temperature at which B(Tco) = 0, and below which both the low and the high

170
endotherm are present, and above which only the high endotherm is expected to be stable.
This latter issue will be further discussed in Chapter 6.

171
References
1. H. Marand, A. Alizadeh, R. Farmer, R. Desai, V. Velikov, Macromolecules in press;
Bull. Am. Phys. Soc., 1999, 44(1), 608.
2. B. Falkai, W. Rellensmann, Makromolekular Chem., 1964, 75, 112.
3. B. Falkai, W. Rellensmann, Makromolekular Chem., 1965, 88, 38.
4. G. Kämpf, Kolloid-Zeitschrift, 1960, 172, 50.
5. E. Turska, W. Przygocki, M. Maslowski, J. Polym Sci. Part C, 1968, 16, 3373.
6. A. Alizadeh, L. Richardson, J. Xu, S, McCartney, H. Marand, W. Cheng, S. Chum,
Macromolecules, 1999, 32, 6221.
7. G. E. Wissler, B. Crist. Jr, J. Polym Sci., Polym.Phys., 1980, 18, 1257.
8. F. Gallez, R. Legras, J. P. Mercier, J. Polym Eng. Sci., 1976, 16, 276.
9. L. C. Lopez, G. L. Wilkes, Polymer, 1988, 29, 106.
10. M. Day, Y. Deslandes, J Roovers, T. Suprumchuk, Polymer, 1991, 32, 1258.
11. Y. Deslandes, F. N. Sabir, J. Roovers, Polymer, 1991, 32, 1267.
12. B. J. MacNulty, Polymer, 1968, 9, 41.
13. R. E. J. Fryer, J. Appl. Polym. Sci., 1974, 18, 2261.
14. V. F. Goler, G. Sachs, Phys., 1932, 77, 281.
15. R. Legras, J. P. Mercier, J. Polym. Sci. Polym Lett., 1970, 8, 645.
16. L. D. Jones, F. E. Karasz, J. Polym. Sci. Polym. Phys., 1966, 4, 803.
17. F. Gallez, R. Legras, J. P. Mercier, J. Polym Sci. Polym. Phys., 1976, 14, 1367; R.
Legras, J. P. Mercier, J. Polym Sci. Polym. Phys., 1977, 15, 1283; R. Legras, J. P.
Mercier, J. Polym Sci. Polym. Phys., 1979, 17, 1171; G. Mendez, A. J. Müller, J.
Thermal Analysis, 1997, 50, 593. C. Bailly, M. Daumerie, R. Legras, J. P. Mercier, J.
Polym. Sci. Polym. Phys., 1985, 23, 343; C. Bailly, R. Legras, J. P. Mercier, J. Polym.
Sci. Polym. Phys., 1985, 23, 355; C. Bailly, M. Daumerie, R. Legras, J. P. Mercier, J.
Polym. Sci. Polym. Phys., 1985, 23, 493.
18. J. M. Jonza, R. S. Porter, J. Polym. Sci. Polym. Phys., 1986, 24, 2459.
19. L. Mandelkern, A. L. Allou, M. Golapan, J. Phys. Chem., 1968, 72, 309.
20. G. Mendez, A. J. Müller, J. Thermal Analysis, 1997, 50, 593.
21. E. Ergoz, J. M. Fatou, L. Mandelkern, Macromolecules, 1972, 5, 147.

172
22. A. Alizadeh, A. Munoz-Escalona, P. Lafuente, J. V. Garcia-Ramos, J. Martinez-
Salazar, Polymer, 1999, 40, 4345.
23. M. Eskelinen, J. V. Seppala, Eur. Polym. J., 1996, 32, 331.
24. V. Velikov, Ph. D. Dissertation, 1996, Virginia Polytechnic Institute and State
University.
25. L. J. Fetters, D. J. Lohse, S. Milner, W. W. Graessley, Macromolecules, 1999, 32,
6847.
26. Hermann Schnell, “Chemistry and Physics of Polycarbonates”, 1964, John Wiley &
Sons, Inc.
27. H. Marand, J. Xu, S. Srinivas, Macromolecules, 1998, 31, 8219.
28. Giuseppe V. Di Filippo, Maria E. Gonzalez, Maria T. Gasiba, A.V. Müller, J. Appl.
Polym. Sci., 1987, 34, 1959.
29. E. Laredo, M. Grimau, A. Muller, A. Bello, N. Suarez, J. Polym. Sci. Polym. Phys.,
1996, 34, 2863.
30. G. Kämpf, Kolloid-Zeitschrift, 1962, 185, 6.
31. A. Keller, J. Polym. Sci., 1955, 17, 291,; ibid, 1955, 17, 351.
32. A. Keller, J. R. S. Waring, J. Polym. Sci., 1955, 17, 447.
33. A. Siegmann, P. H. Geil, J. Macromol. Sci. Phys., 1970, B4(2), 239; A. Siegmann, P.
H. Geil, J. Macromol. Sci. Phys., 1970, B4(2), 273.
34. A. Alizadeh, S. Sohn, J. Xu, R. Farmer, S. Elkoun, H. Marand, Manuscript in
preparation.
35. J. M. Schultz, R. D. Scott, J. Polym Sci. A-2, 1969, 7, 659.
36. H. D. Keith, F. J. Padden, R. G. Vadimsky, J. Appl. Phys., 1971, 42, 4585.
37. V. B. F. Mathot, R. L. Scherrenberg, T. F. J. Pijpers, Polymer, 1998, 39, 4542; V. B.
F. Mathot, R. L. Scherrenberg, T. F. J. Pijpers, Y. M. T. Engelen, New Trends
Polyolefin Sci. Tech., 1996, 71.
38. Q. Fu, F. C. Chiu, K. McCreight, M. Guo, W. W. Tseng, S. Z. D. Cheng, M. Y.
Keating, E. T. Hsieh, P. J. Deslauriers, J. Macromol. Sci. Phys., 1997, B36(1), 41.
39. S. Sohn, A. Alizadeh, H. Marand, Polymer in print.
40. H. Marand, P. Sholtz, R. Verma, V. Prabhu, V. Vivirito, Bull. Am. Phys. Soc., 1996,
41(1), 450.

173
41. B. Wunderlich, in “Macromolecular Physics”, 1980, Academic Press, N. Y. Vol 3.
42. M. Dettenmaier, H. H. Kausch, Colloid and Polymer Sci., 1981, 259, 209.

174
Chapter 6
Isothermal Lamellar Thickening of Semicrystalline PC
6.1 Introduction
In Chapter 5, from the heating rate effect on the shift of the low endotherm with
time (see Figure 5.24), it has been proposed that around 210oC, a change in secondary
crystallization behavior may occur for PC-28K. In this chapter, to provide proper
evidence for this hypothesis, a series of experiments was performed. First, isothermal
annealing was done to follow the thermal behavior of these annealed samples. Second,
the variation of lamellar thickness upon isothermal annealing was measured directly
using AFM. Based on the melting temperature and lamellar thickness, a Gibbs-Thomson
plot could be constructed, from which the equilibrium melting temperature (Tmo) and the
basal plane interfacial free energy (�e) were extracted.
6.1.1 Isothermal Lamellar Thickening
Polymers often crystallize in the form of spherulite composed of lamellae (see, for
example, Micrographs 1 to 4 in Chapter 5). The chain folding nature of lamellae leads to
anisotropic surface free energies, being higher on the chain-folded surface than on the
lateral side. When lamellar thickening occurs, the ratio of surface area to total volume
decreases (i.e., less surface effect), and thus overall free energy of crystals decreases.
Several polymers are known to exhibit isothermal lamellar thickening:
poly(ethylene oxide) (PEO)1-3, poly(4-methylpentene-1)4-6, poly(�-caprolactone)7, and
polyethylene3,8-10. It needs to be noted that isothermal lamellar thickening only occurs
when polymer crystals exhibit an �c relaxation; however, chain mobility inside the
crystals (i.e., �c relaxation) is necessary not a sufficient condition. All the above

175
polymers have been reported to possess both �c relaxation and isothermal lamellar
thickening5. It also needs to be emphasized that isothermal lamellar thickening is a
kinetic process. Even though a certain temperature for �c relaxation (T�c) exists, if
sufficient time is allowed, thickening could occur at a lower temperature than known T�c.
Therefore, T�c should be understood as a range of temperatures rather than as a well-
defined single temperature. Some theoretical studies explaining the mechanism of
isothermal lamellar thickening have appeared. For instance, Sanchez et al. derived
equations for the rate of thickening by treating the process using irreversible
thermodynamics11,12.
As noted earlier, �c relaxation occurs above a certain temperature, T�c, and this
temperature is more or less a material property, although it possesses some kinetic nature.
For instance in case of PE, T�c is known to be around 60oC8-10. For PC, T�c is not
known, yet two reports claim that PC exhibits lamellar thickening. Jonza and Porter
observed lamellar thickening by double annealing at 470K and 503K from SAXS
experiments13. Very recently, from the DSC experiments, Mendez and Müller reported
peak position shifting (3-5oC) of PC by isothermal annealing at 462K14. They
crystallized samples in the presence of acetone vapor at room temperature for 9 hours.
Based on this shifting of peak position, they concluded that semicrystalline PC exhibits
isothermal lamellar thickening14.
In the previous chapter, it was proposed that a� crossover phenomenon may occur
around 210oC in PC. Therefore, if PC crystals were annealed isothermally around this
temperature, an isothermal lamellar thickening may be observed. These experiments will
be of interest in that the existence of isothermal lamellar thickening in PC indeed

176
supports the main conclusion in Figure 5.24, that above Tco, low endotherm may not be
stable, and thus, only the high endotherm exists. From the studies described in Chapters
4 and 5, it is known that low endotherm exists below this temperature. Isothermal
annealing experiments have been conducted inside the DSC on PC-28K initially
crystallized at 185oC for 202 hours at five different temperatures above 208oC.
It needs to be mentioned that the most direct evidence for the existence of �c
relaxation will be the measurement of chain mobility inside crystals around the proposed
T�c using solid state NMR or dynamic mechanical analysis (DMA). For instance,
Schmidt-Rohr et al. recently detected the occurrence of chain flips in PE (at Tm-60K)15,16,
i-PP (at Tm-80K)17, PEO (at Tm-100K)17, and POM (at Tm-90K)16. Also using DMA, the
T�cs of various flexible polymers such as PE3, it-PP18, PEO3, and POM3 have been
reported. The debate regarding the existence of �c relaxation in semi-flexible polymers
such as PET and PEEK is not completely settled5,15,16; however, it is generally accepted
that for these polymers, T�c, if it exists, should be in the proximity of the apparent
melting temperature. Therefore, the most direct evidence of �c relaxation in semi-
flexible polymers using the two above mentioned techniques may not be easily
achievable. This is because in solid state NMR, as noted in the parenthesis, the chain
mobility is generally measured well below the apparent melting temperature, and for
DMA, the relaxation peak around T�c will be more than likely overlapped with the
melting peak5. In the present work, as an alternative to provide an evidence for the
existence of��c relaxation in PC, isothermal lamellar thickening experiments were
performed (recall the fact that isothermal lamellar thickening is only possible in the

177
presence of �c relaxation, and in general the starting temperature of isothermal lamellar
thickening is close to T�c)5.
6.1.2 Polymer Epitaxy
Calorimetry study is effective in following the thermal behavior of samples that
underwent isothermal annealing, and as reported recently14, the resultant thermograms
may suggest the existence of isothermal lamellar thickening based upon the change of
melting peak position with time. However, the most direct evidence will be the
measurement of lamellar thickness upon isothermal annealing. This, yet, is not an easy
task because in general, spherulites formed upon crystallization are the mixture of
lamellae grown in all orientations, so the observed morphology cannot be used for the
measurement of lamellar thickness.
To resolve this issue, a special substrate will be required upon which lamellae can
grow epitaxially, and preferentially in an edge-on orientation. The rigorous definition of
epitaxy is the growth of one phase (guest crystal) on the surface of another phase (host
crystal) in one or more strictly defined crystallographic orientations20. To achieve this
goal, guest and host crystals must have related crystallographic structures. Although the
structural analogy implies interactions at the molecular scale, such a level of
understanding is seldom achieved, especially in the polymer crystallization field.
Therefore, epitaxy is often defined in terms of purely geometric lattice matching; 10-15%
lattice mismatch between the host and guest crystals is considered as an upper limit for an
epitaxy.
Since the first observation of polymer epitaxy on alkali halide substrates21,22 in the
1950s, several other substrates have been investigated. Among them, polymer epitaxy on

178
organic substrate and polymer-polymer epitaxy have been of interest. Theoretically if
one can use single crystals for the substrate of the epitaxy of the same polymer, then the
lattice parameter matching will be perfect, therefore, this substrate will produce perfect
epitaxy. In reality, it is very challenging to grow macroscopic size single crystals. To
overcome this problem, oriented polymers have been used for substrates. Various
orientation techniques have been adopted, such as spinning or coextrusion23 and uniaxial
drawing24. References 25 and 26 are the reviews of epitaxy on low molar mass (mainly
inorganic) materials, and epitaxy of polymer-organic (including polymer-polymer)
systems, respectively. The use of inorganic substrate has revealed the major structural
and morphological features of polymer epitaxy. As a general rule, the guest polymer
chains lie with their chain axis parallel to the substrate surface: the lamellae that grow
edge-on, i.e., are normal to that substrate.
In this study, calcite was chosen for the substrate based on the close lattice
parameter matching. The morphological feature of this PC epitaxy on calcite substrate
was monitored by AFM, and lamellar thickness and distribution were calculated from
100 or more measurements of lamellar thicknesses. Finally, various techniques were
employed to measure the melting temperature of isothermally annealed samples. Based
on the lamellar thickness and the melting temperature data, a Gibbs-Thomson plot could
be constructed, from which the equilibrium melting temperature (Tmo) and the interfacial
free energy (�e) were determined.
6.2 Experimental
Purified bisphenol-A polycarbonate PC-28K commercial samples have been used
for isothermal annealing and secondary crystallization experiments in DSC and also for

179
direct lamellar thickness measurements using AFM. For detailed sample molecular
characteristics, see Chapter 3.
6.2.1 Calorimetry Study
PC-28K samples were crystallized at 185oC for 202 hours, and these as-
crystallized samples were exposed to isothermal annealing experiments performed inside
DSC at 5 different temperatures (208, 214, 217, 220, 223oC) in the time frame of 1
minute to 35 hours. Upon reaching the desired annealing time, tx, samples were cooled at
the maximum cooling rate available to 100oC, and heating traces were then recorded at
10oC/min. The details of procedures for DSC sample preparation and temperature
calibrations were described in Chapter 3.
6.2.2 Atomic Force Microscopy
An atomic force microscope (Digital Instrument, Dimension 3000) was operated
in tapping mode at room temperature using nanosensor TESP (tapping etched silicon
probe) type single beam cantilevers. Images were collected in both height and phase
modes. For the lamellar thickness measurement, at least 100 lamellae were chosen from
three samples, and each individual lamellar thickness was determined from the section
analysis software (see below). Lamellar thickness distribution was then constructed,
from which the most probable population of lamellar thickness was designated as the
mean lamellar thickness.
Figure 6.1 shows a schematic presentation of the section analysis method. After
capturing the phase image of a given sample, one can draw a vertical line to the normal
direction of lamellae on the image, and the software converts the phase image across the
line to a near sinusoidal shape curve as shown in Figure 6.1. The upper portion of the

180
Thickness
Sig
nal
(+)
0
(-)�l �a
Figure 6.1 A schematic illustration of AFM phase mode signal used to determine lamellar thickness. �l and �a stand for lamellar and amorphous
layer thickness, respectively (for detailed description, see the text).

181
sinusoidal curve depicts an individual lamella, and the lower part represents the
amorphous layer between the neighboring lamellae. The lengths �l and �a shown in
Figure 6.1 are the lamella and the amorphous layer thickness, respectively.
Although the above procedure provides a reliable way to measure thickness, the
measured values could be overestimated. This could be because first, tip geometry and
tip edge broadening may induce an overestimation of actual lamellar thickness, and
second, the potential interactions between the tip and the lamellae being scanned may
hinder an accurate measurement. Currently, there are no means to quantitatively correct
the latter source of error. However, in tapping mode, it is more than likely that the
interactions between the tip and the substrate will be much less significant than in contact
mode, so in this study this effect was considered negligible. For the correction from the
tip broadening and tip geometry, a standard sample (MXS 301CE, from Moxtek Co.,
serial number: D112805010) with a known thickness was scanned under the same
conditions, and the measured lamellar thickness was calibrated according to this
correction factor*. The dimensional accuracy for this particular standard sample
guaranteed by the provider was better than 0.5 nm. The calculated overestimation was
10�2%, and this correction is quantitatively in good accordance with the previous
report27. Zhou and Wilkes compared the accuracy of three different techniques– SAXS,
* The MOXTEK MXS 301 CE calibration and reference standard is fabricated using a silicon wafer substrate which is
overcoated with a polymer material. To render the durability, 60nm thickness of tungsten is double coated on top of
this polymer. The company certified calibration period was 288nm. In this study, the lamellar thickness was in the
range of 4 to 16nm, a range that is significantly smaller than the size of calibration period. Due to the unavailability of
proper standards for the comparable size with lamellar thickness, we were forced to use the above standard, and
consequently a large uncertainty was inevitable. Therefore, in this study, we are more interested in the change of
lamellar thickness upon isothermal lamellar thickening.

182
TEM, and AFM– in terms of quantitative determination of lamellar thickness27. They
concluded that the accordance between SAXS and TEM is excellent, while the lamellar
thickness from AFM was slightly overestimated in the order of 10%.
6.2.3 Epitaxial Growth
As noted earlier, calcite (Iceland Spar, origin Chihuahua, Mexico) was used as a
substrate for the epitaxial growth of PC lamellae. This choice was based upon the close
matching of unit cell parameters28. The unit cell structure of PC is monoclinic, in which
unit cell parameters are: a =10.1Å, b =12.3Å, c =20.8Å and � =84o at room temperature29.
The schematic structure of (014) plane (cleavage plane)28 of calcite substrate is illustrated
in Figure 6.2. From the known lattice parameters of substrate and crystalline PC, the
degree of lattice mismatching in the a- and c-axis can be calculated: �a = +1.2%; �c =
+2.7%, under the assumption of b-axis growth direction. These mismatches are well
below the upper limit of 10-15% for the epitaxial growth (see above).
It is important to note that the above criterion of lattice matching for an epitaxy is
only a necessary condition. To achieve a rigorous epitaxy it is necessary to know the
exact surface topology of contact crystals. In other words, PC chain conformation on top
of calcite is also an important criterion in epitaxial growth. Unfortunately, as far as we
concerned, the epitaxy of PC has not been previously reported let alone for this particular
substrate. Therefore, at present, it can not be ensured whether calcite substrate meets the
latter requirement. As will be seen later, PC does not form a rigorous epitaxy for several
reasons; nonetheless, at least locally, PC lamellae appear to grow edge-on under
conditions of pseudo-epitaxy, which makes it possible to measure the lamellar thickness.
In this context, therefore, we loosely use the term epitaxy to include this type of pseudo-

183
4.05
Å
4.99 Å
CO3
Ca
Figure 6.2 A schematic structure of (014) cleavage plane of calcite (CaCO3)

184
epitaxy.
Each PC sample was prepared as follows. First, 0.2 wt% polymer solution was
prepared by dissolving PC-28K sample in HPLC grade chloroform. A proper size of
freshly cleaved calcite was placed in the solution and removed after one minute. Then
the prepared sample was first dried at 150oC in vacuuo for a period of 24 hours and
subsequently crystallized at 185oC in an oven for 95 hours. Upon reaching the desired
crystallization time, three samples were examined by AFM to measure lamellar
thickness. After these examinations, those samples were further annealed at 220oC for
three different time stages (5, 10, and 18 hours) to see the effect of isothermal annealing.
At each stage, lamellar thickness was measured by AFM following the same procedures.
6.3 Results
6.3.1 Isothermal Lamellar Thickening from DSC
Figures 6.3 to 6.5 show the melting traces of isothermally annealed PC-28K for
different temperatures. Figure 6.6 and 6.7 summarize the analyses in terms of melting
temperature and heat of fusion change upon isothermal annealing, respectively. From the
DSC melting traces, one can unambiguously tell that the melting temperature increases
and the endothermic peak broadens with time for a given annealing temperature. At short
times of up to 10 minutes, in this particular temperature range, melting temperature
(Tmhigh) and heat of fusion (�Hm
high) increase slowly, while at longer times, both start to
increase dramatically. To explain these observations, two possible reasons are proposed.
First, upon high temperature annealing, molar mass might be decreased due to the
thermal degradation, and second, these annealing temperatures are above the �c
relaxation temperature (T�c), thus, lamellae underwent lamellar thickening possibly with

185
Temperature (°C)
200 220 240 260
dq/d
T (
J . g
-1 .
K-1
)
0
1
2
1 min
5 min 20 min 60 min 120 min 480 min 1200 min
Ta = 208°C
Figure 6.3 The effect of annealing above the primary crystallization temperature on the melting behavior of PC-28K. Samples were initially crystallized at 185oC for 202 hours. Annealing temperature, Ta = 208oC.

186
Temperature ( °C )
220 240 260
dq/d
T (
J . g
-1 .
K-1
)
0
1
2
3
4
1 min 5 min 20 min 60 min 120 min 480 min 1200 min
Ta = 217 °C
Figure 6.4 The effect of annealing above the primary crystallizationtemperature on the melting behavior of PC-28K. Samples were initially crystallized at 185oC for 202 hours. Annealing temperature, Ta = 217oC.

187
Temperature ( °C )
220 240 260
dq/d
T (
J . g
-1 .
K-1
)
0
1
2
3
4 1 min 5 min 20 min 120 min 480 min 1200 min 2100 min
Ta = 223 °C
Figure 6.5 The effect of annealing above the primary crystallization temperature on the melting behavior of PC-28K. Samples were initiallycrystallized at 185oC for 202 hours. Annealing temperature, Ta = 223oC.

188
Time (min)
100 101 102 103
Tm
high
(o C
)
230
240
250
260
Ta = 208 °C
Ta = 217 °C
Ta = 220 °C
Ta = 223 °C
Ta = 214 °C
Figure 6.6 Variation of melting peak temperature as a function of annealing time for various annealing temperatures. For inset lines, see the discussion section. The accuracy of the temperature determination was better than 0.2oC.
Ta

189
Time ( min )
100 101 102 103
�H
mto
tal (
J. g
-1)
0
10
20
30
Ta = 208 °C
Ta = 217 °C
Ta = 220 °C
Ta = 223 °C
Ta = 214 °C
Figure 6.7 Variation of the total heat of fusion as a function of annealing time for various annealing temperatures. For inset lines, see the discussion section. The accuracy of the determination of the experimental heat of fusion was better than 0.5 J.g-1.
Ta

190
crystal perfection.
To check the possibility of thermal degradation, molar masses of some of the
samples, including the one annealed for the longest times at the highest temperature (i.e.,
40 hours at 224oC), were checked by GPC. The results are presented in Figure 6.8 and
Table 6.1. Certainly, it can be stated that within experimental uncertainty, the molar
mass and molar mass distribution were not adversely affected by isothermal annealing at
this temperature and for the range of times. Therefore, the first hypothesis must be ruled
out, leaving the second possibility that isothermal lamellar thickening, possibly with
crystal perfection, is most likely at the origin of the increase of Tmhigh and �Hm
high upon
isothermal annealing.
6.3.2 Lamellar Thickness Measurement by AFM
From the calorimetry study, melting peak broadening and shifting to a higher
temperature may indicate the consequences of isothermal lamellar thickening, yet these
cannot be the direct evidences. The most direct evidence is the measurement of lamellar
thickness upon isothermal annealing. To this end, AFM was utilized to measure the
lamellar thickness of PC epitaxially grown on calcite substrate. In Micrographs 6.1 to
6.4, phase images of isothermally annealed specimens are presented. Micrograph 6.1
shows a PC sample before annealing (i.e., as-crystallized at 185oC for 95 hours), and
Micrographs 6.2, 6.3, and 6.4 show for 5, 10, and 18 hours of annealing at 220oC,
respectively. In each micrograph, one can observe an area of pseudo-epitaxy. Lamellae
in this area were carefully analyzed to determine lamellar thickness and distribution. As
mentioned earlier, at least 100 lamellae from three different samples were analyzed for
each annealing time, including as-crystallized samples. One of the unique features of the
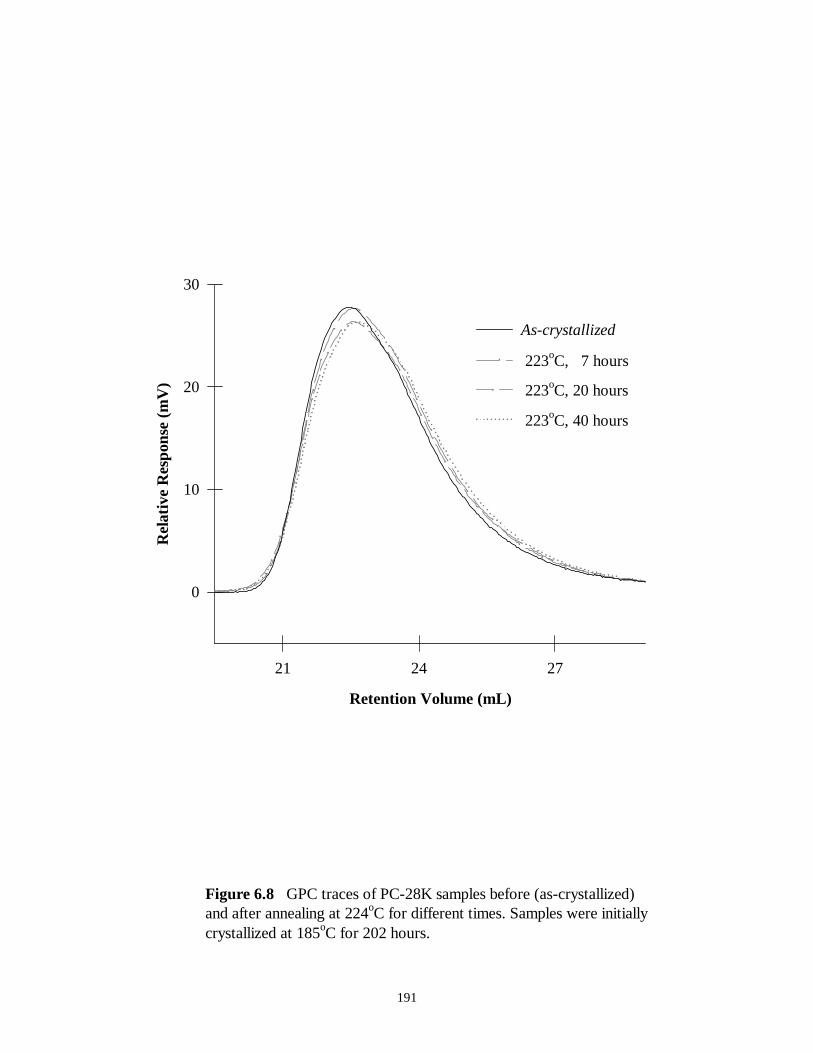
191
Retention Volume (mL)
21 24 27
Rel
ativ
e R
espo
nse
(mV
)
0
10
20
30
As-crystallized
223oC, 20 hours
223oC, 40 hours
223oC, 7 hours
Figure 6.8 GPC traces of PC-28K samples before (as-crystallized) and after annealing at 224oC for different times. Samples were initially crystallized at 185oC for 202 hours.

192
SampleAnnealing
ConditionsMw (g/mol) Mw/Mn
As-crystallized 29,400 2.03
PC-28K 224oC, 7 h 31,000 2.10
224oC, 20h 31,500 2.08
224oC, 40h 29,100 2.13
Table 6.1 GPC analysis before and after isothermal annealing at 224oC.

193
Micrograph 6.1 AFM phase image of PC lamellae on calcite.PC-28K sample was initially crystallized at 185oC for 95 hours (as-crystallized).
0 1
01
m
m

194
Micrograph 6.2 AFM phase image of PC lamellae on calcite. PC-28K sample was initially crystallized at 185oC for 95 hours, and further annealed at 220oC for 5 hours.
m
m
0 1
01

195
Micrograph 6.3 AFM phase image of PC lamellae on calcite. PC-28K sample was initially crystallized at 185oC for 95 hours, and further annealed at 220oC for 10 hours.
0 1
01
m
m

196
Micrograph 6.4 AFM phase image of PC lamellae on calcite. PC-28K sample was initially crystallized at 185oC for 95 hours, and further annealed at 220oC for 18 hours.
0 1
01
m
m

197
AFM technique is that the surface image can be visualized under various view and light
angles. This “image tilting” can be used to check the qualitative degree of epitaxy.
Micrograph 6.5 shows the tilted image of Micrograph 6.1 under different angle to three-
dimensionally visualize the surface structure. In the left lower diagonal, one can observe
vertically oriented lamellae on top of calcite.
The analyses of lamellar thickness distribution are shown in Figures 6.9 and 6.10.
In Figure 6.9, lamellar thickness distributions for each annealing temperature, including
as-crystallized sample, are shown. In Figure 6.10 all these lamellar thickness
distributions are plotted together to show the effect of isothermal annealing on the
variation of lamellar thickness. The mean lamellar thickness and the standard deviation
are also summarized in Table 6.2. Clearly, an increase in isothermal annealing time leads
to an increase in the mean lamellar thickness (i.e., indicating isothermal lamellar
thickening). The breadth of the lamellar thickness distribution as measured by the
standard deviation also increases with annealing time. Of further interest, as seen in
Figure 6.11, lamellar thickness and the standard deviation increase linearly with the
logarithm of annealing time. A similar linear relationship between lamellar thickness and
logarithm of isothermal annealing time has been previously reported for poly(4-
methylpentene-1)30 and poly(�-caprolactone)31.
6.3.3 Construction of Gibbs-Thomson Plot
For the construction of Gibbs-Thomson plot, melting temperature and
corresponding lamellar thickness must be known. In the present study, peak melting
temperatures of crystals were determined from the calorimetry study, and lamellar
thickness from AFM. With regard to sample preparation, bulk-crystallized thick samples

198
Micrograph 6.5 AFM surface image viewed from different angle of as-crystallized PC lamellae on calcite (i.e., tilted surface image of micrograph 6.1). PC-28K sample was initially crystallized at 185oC for 95 hours.

199
40 50 60 70 80 90 100
Num
ber
Fra
ctio
n
0.0
0.1
0.2
0.3<l> = 72 Å
Lamellar Thickness (Å)
50 60 70 80 90 100 110 120
Num
ber
Fra
ctio
n
0.0
0.1
0.2<l> = 86 Å
(a)
(b)
Figure 6.9 Lamellar thickness distribution upon isothermal annealing at 220oC for different times. PC-28K samples were crystallized on calcite at 185oC for 95 hours. a) As is; (b) 5 hours; (c) 10 hours; (d) 18 hours.

200
50 60 70 80 90 100 110 120 130
Num
ber
Fra
ctio
n
0.0
0.1
0.2<l> = 96 Å
Lamellar Thickness (Å)
60 70 80 90 100 110 120 130 140 150 160
Num
ber
Fra
ctio
n
0.0
0.1
0.2
<l> = 105 Å
(c)
(d)
Figure 6.9 Continued

201
Lamellar Thickness (Å)
40 60 80 100 120 140 160
Num
ber
Fra
ctio
n
0.0
0.1
0.2
0.3As is5 hours
10 hours
18 hours
Figure 6.10 Lamellar thickness distribution upon isothermal annealing of PC-28K at 220oC for various times.
Time (hrs) <lc> (Å) <�c> (Å)
0
5
10
18
72
86
96
105
14
15
18
21
Table 6.2 Variations of lamellar thickness and breadth of distribution with isothermal annealing time at 220oC. PC-28K samples have been initially crystallized at 185oC for 95 hours.

202
Annealing time (min)
102 103
<lc>
(Å
)
< �>
(Å
)
10
15
120
140
20
100
80
Figure 6.11 Variation of lamellar thickness (circle) and the breadth of distribution measured by standard deviation (square) as a function of the logarithm of isothermal annealing time.

203
(120�20 m) were used for calorimetry experiments, while thin solvent cast films (1
m) were employed for AFM. Although it is widely accepted that the lamellar thickness
depends only on the degree of undercooling32,33 (i.e., � 1��T, where �T = Tmo-Tx) for a
given molar mass sample, there could be some effects from sample thickness. To
compare a bulk and thin film crystallization, the effects of film thickness on
crystallization behavior must be resolved. These issues will be further addressed in the
discussion section.
To investigate this question properly, an attempt was made to measure the melting
temperature of solvent cast thin film on glass substrate using an optical microscope
equipped with a heating stage and a photodiode detector. The films were prepared
following the same procedures used in the AFM sample preparation. After crystallization
at 185oC for 95 hours (as-crystallized) and subsequent annealing at 220oC for 5 and 18
hours, samples were melted at 10oC/min in the heating stage. The temperature scale of
the heating stage was properly calibrated by the onset melting temperature of indium
standard. The polarized light intensity was monitored during the heating scan by a photo
diode detector connected to a light intensity analyzer. Further details on the set up of this
equipment were described in the experimental section of Chapter 3.
Figure 6.12 (a) and (b) show, respectively, the raw data and the first derivative of
raw data to define the melting peak positions of as-crystallized and annealed samples.
Unambiguously, in Figure 6.12, melting point systematically increases upon isothermal
annealing. More importantly, the measured melting temperature of as-crystallized thin
film (266oC) is considerably higher than that of thick bulk sample (228.5�0.4oC)
crystallized under the same condition. This will be further discussed later.

204
Nor
mal
ized
Inte
nsity
, Ino
r
1
2
3
Temperature (oC)
260 270 280 290
dIno
r/dT
0.0
0.2
0.4
0.6
(a)
(b)
Figure 6.12 Variation of normalized light intensity during heating scan at heating rate of 10oC/min (a), and the first derivative of normalized intensity with respect to temperature, dInor/dT, to determine the peak
melting temperature (b). Temperature scale has been calibrated form the onset melting temperature of In standard.
As is
18 hours
5 hours
266oC
273oC
282oC

205
Based on the data from these two different techniques– melting temperature from
the optical microscope with photo intensity detector and lamellar thickness from AFM–,
a Gibbs-Thomson plot was constructed. The result is shown in Figure 6.13, in which
available literature data were also included13. From the intercept and the slope of this
plot, Tmo and �e have been calculated as 597K and 52 mJ/m2, respectively. These values
are comparable to the previously reported data13,34.
6.4 Discussion
6.4.1 Isothermal Lamellar Thickening from DSC
From the kinetic study of the low endotherm in the previous chapter, one of the
key characteristics is that B(Tx), the rate of the shift of the low endotherm melting point
with time, decreases with increasing temperature (see Figure 5.11). In contrast, one can
clearly deduce from Figures 6.6 and 6.7 that the high endotherm shows the opposite
behavior, i.e., the slope– defined from either the shift of the melting temperature with
time (Figure 6.6) or the shift of the heat of fusion with time (Figure 6.7)– increases with
temperature. The inset lines in Figures 6.6 and 6.7 schematically represent the change of
the slope with annealing temperature. This comparison supports the conclusion drawn in
Chapters 4 and 5 that the evolution of the high and the low endotherm are quite different,
possibly because these endotherms are associated with different morphological entities.
An isothermal annealing at or above 208oC leads to the melting of a significant
portion of preexisting crystals. Obviously, more materials is partially melted by a higher
temperature annealing, and this can be readily seen in Figure 6.7, in which at 208oC the
heat of fusion of initial stage (1 min) is ca. 17.5 J.g-1, while the heat of fusion decreases
to 5 J.g-1 by 223oC, after 1 min annealing. These two conditions– annealing above the

206
1/lc (x 102) (Å-1)
0.0 0.5 1.0 1.5 2.0 2.5 3.0 3.5
Tm (
K)
450
480
510
540
570
600
Tmo = 597 K
�e = 52 mJ/m2
Jonza et al.13 (from SAXS)This work (from LIM)
Figure 6.13 A plot of Tm vs inverse lamellar thickness (A Gibbs-
Thomson plot). LIM stands for light intensity measurement using optical microscope. For detailed experimental conditions, see the text.

207
primary crystallization temperature and the presence of enough crystallizable materials
created by partial melting– will drive lamellar thickening as well as recrystallization
during isothermal annealing. These recrystallized lamellae will have higher melting
temperatures than as-crystallized lamellae because of the higher recrystallization
temperature. Overall, these two processes may both be at play for the melting endotherm
broadening and shifting as seen in Figures 6.3 to 6.5.
At this moment, we can not distinguish these two processes. This is not an easy
issue to address since it requires the knowledge of the kinetics of recrystallization in the
presence of preexisting crystals. Nonetheless, qualitatively speaking, recrystallization
alone cannot explain the results shown in Figures 6.3 to 6.5. If only recrystallization had
occurred, then the endotherm would have two peaks, or at least a shoulder at higher
temperature. A close examination of Figures 6.3 to 6.5 reveals that although the
endotherm becomes broader, in all cases, the endotherms are single peaked. Other
support comes from the observation that in Figure 6.5, the initial small and lower melting
temperature endotherm per se has grown into a large endotherm whose melting
temperature range virtually does not overlap with that of initial endotherm. Once again,
if only recrystallization occurred during isothermal annealing, then the melting
endotherm should not shift with annealing time. These observations strongly suggest that
under high temperature isothermal annealing, lamellar thickening must occur possibly
with recrystallization.
Peak broadening and peak temperature shifting as observed in Figures 6.3 to 6.5
are most likely related to �c relaxation, the increase of chain mobility inside the crystal.
However, the suggested �c relaxation temperature around 210oC (i.e., Tm – 10 ~ 20oC) is

208
in good contrast to that in LPE, in which �c relaxation occurs around 60oC (i.e., Tm – 60
~ 80oC)8-10. As briefly explained in the introduction section, because T�c is too close to
the apparent melting temperature, the observation of the relaxation phenomenon using
solid state NMR or dynamic mechanical analysis would not be easy, especially in the
case of semi-flexible polymers. This narrow temperature window for �c relaxation must
be a direct consequence of rigid chain backbone of PC, which hinders chain mobility
inside the crystal until the temperature approaches the near apparent melting temperature.
A similar observation has been made for PEEK (Tm � 340oC, T�c � 325oC ) by Marand et
al35.
From Figure 6.6, we can define the rate of the shift of the high endotherm at each
temperature for short times (< 20min). This data can be combined with the data shown in
Figure 5.24, and they are plotted together in Figure 6.14. Under the assumption that
lamellar crystals do not show significant superheating, the rate of the shift of high
endotherm also approaches to zero at very similar temperature, in the vicinity of 210oC in
case of PC-28K.
Since negative B(Tx), either for low or high endotherm, does not have any
physical meaning, this temperature may be a crossover temperature for the existence of
secondary crystals. One possible explanation for this phenomenon is that, as noted
earlier, at this crossover temperature, �c relaxation and isothermal lamellar thickening of
PC may occur.
6.4.2 Epitaxial Growth and Lamellar Thickness Measurement
The selection of calcite as a substrate for epitaxial growth was entirely based on
the matching of unit cell parameters on the cleavage plane (014) of host (calcite) and the

209
�T = Tx - Tg
0 20 40 60 80
[B (
Tx
),
= 0
°C/m
in]
0
2
4
6
PC-4K (Low Endotherm)
PC-28K (Low Endotherm)
Figure 6.14 Variation of the rate of the shift of the low endotherm at zeroheating rate as a function of �T (= Tx-Tg) for two extreme molar mass samples
of PC used in this study . The arrow points the possible location of �c-relaxation
temperature in PC (T�c). For comparison reason, B(Tx) for high endotherm is
included from the isothermal annealing experiments.(for detail, see the text and also see Figure 5.24 in Chapter 5).
Tco = T��c
PC-28K (High Endotherm)

210
guest (PC). One caution, however, must be taken into account. The plane (014) is not
the only cleavage plane. Three planes, considering the hexagonal crystal system of
calcite, have been suggested as cleavage planes, i.e., (001), (011) and (014), although
some authors claimed that (014) plane is the most feasible plane28. Because of this
multiple choice of cleavage planes, even after a clean cleavage, macroscopically, the
surface will be polycrystalline, containing the mixtures of all these possible cleavage
planes. This will produce different orientations of pseudo-epitaxy as well as non-epitaxy,
although “locally” PC may epitaxially crystallize on a proper cleavage plane, (014). For
instance in Micrographs 6.1 and 6.5, the left lower diagonal shows pseudo-epitaxy, yet
lower diagonal shows a change of orientation plane and also a weak tendency for the
epitaxy.
Another reason for forming a pseudo-epitaxy of PC on calcite could be that, in
this study, the epitaxy appears to be of a multi-layer nature rather than monolayer. The
film thickness is ca. 1m, and the lateral dimension of lamellae in PC crystallized at
185oC seldom exceeds 200nm, so each epitaxial region in micrographs shows at least 5 or
more layers of vertical stacks of lamellae, i.e., multi-layer epitaxy. Logically, the very
first layer upon the substrate will have a perfect epitaxy and the next layer may be close
but with some degree of misfit. Very likely, the third or higher layers will be subjected to
more misfits, such as lamellar tilting in vertical and/or parallel direction.
Fortunately, this pseudo-epitaxy nature of PC on calcite, however, may not
seriously affect the reliability of lamellar thickness measurement for two reasons. First,
lamellar thickness is not affected by the presence of lamellar tilting in a parallel direction
since it is widely accepted that lamellar thickness depends only on the inverse of the

211
degree of undercooling (i.e., � 1��T, where �T = Tmo-Tx) for a given molar mass
sample32,33. Second, the correction factor for the tilting in the vertical direction of
lamellae is proportional to cos�, where � is the tilted angle. Based on simple calculation,
even under the severe assumption of a 20o tilting angle, the error is about 6%, so the
vertical tilting, if any, will not seriously affect the results.
6.4.3 Various Issues in the Construction of the Gibbs-Thomson Plot
To combine the calorimetric and AFM results for the construction of Gibbs-
Thomson plots, it is assumed that the melting point of AFM samples at the given
annealing time is the same as that of the sample prepared for DSC experiments under the
same condition. In the present study, this has been found not to be the case (see Figure
6.12). The main reason could be the difference in sample preparation methods: for
calorimetry, the samples were bulk-crystallized with thickness of 120 �20m, yet for
AFM, very thin solvent cast films (1 m) were used. From the measurement of thin
film melting temperature, it has been shown that the melting temperature difference in
these two sets of samples is not trivial: over 35oC difference (Tm of thin film (266oC) vs
Tm of bulk crystallized sample (228�0.4oC).
Although this phenomenon is not completely understood, it appears that it must
be associated with the sample thickness. The effect of film thickness on melting
temperature, however, is not an easy question to address, because as film thickness
approaches the size of a micron, the number of methods to measure the melting
temperature of this thin film on top of a substrate is very limited. This could be the main
reason why several morphology studies of PC using solvent cast film did not report the
melting temperature36-39. Despite the experimental difficulty, logically speaking, the

212
glass transition temperature of a thin film could be lower than that of bulk. Siegmann
and Geil claimed from the crystallization study of PC solvent cast film that the thinness
of the film (up to 1m) lowers the Tg thereby increasing chain mobility39. They
explained this in terms of the free volume concept that surface will act as a source of
excess free volume, therefore as surface to volume ratio increases, the overall free
volume increases, thus Tg decreases39.
At this moment, one may argue that there could also be a solvent effect since thin
film must be prepared from the solvent. To address this question properly, the following
experiment was conducted. First, a thin film was cast on the known mass of glass
substrate following the same procedures used for the previous study, and subsequently
the mass of sample (i.e., the total mass comes from the three contributions: glass,
polymer and solvent) was measured. After complete drying of this sample at 150oC in
vacuuo for 24 hours, the sample mass was measured again. The difference in mass must
be ascribed to the solvent mass removed upon drying. From the known volume and
concentration of polymer on the glass substrate, the trapped solvent amount was
calculated as being equal to ca. 0.23%. Assuming the trapped solvent depresses the glass
transition temperature following a Gordon-Taylor type equation, the calculated Tg
depression was less than 2oC. Note that at the drying stage no crystallization was
detected. This experiment clearly shows that the effect of solvent, if any, is insignificant
and cannot be the main reason explaining the observed significant melting temperature
difference between the bulk crystallized sample and thin film.
In Figure 6.13, for the construction of Gibb-Thomson plot, lamellar thickness and
peak melting temperature were determined respectively, from AFM and optical

213
microscope equipped with a heating stage and a photo detector. Note that for AFM
samples, a calcite substrate was utilized, while clean glass was used for the samples for
optical microscopy. The reason is that the films on calcite substrate were so thin and
completely transparent, even after long time crystallization, that the light intensity change
upon the melting could not be detected. On the other hand, the film crystallized on a
glass substrate, although thin, it formed spherulitic structures. Therefore, the light
intensity can be accurately monitored during melting (see Figure 6.12). The justification
of these experiments is also based on the well-known observation that the lamellar
thickness depends only on the inverse of the degree of undercooling32,33. This seems to
be a logical assumption since the measured lamellar thickness and the peak melting point
are in good accordance with the reported Gibbs-Thomson plot. This, however, does not
completely rule out the possibility that there could be some substrate effects on the
melting temperature. To address this question properly, a fundamental study of the effect
of various substrates producing different morphologies will be necessary.
The combination of the results of Tmhigh from optical microscopy with actual
lamellar thickness from AFM has led to the construction of a Gibbs-Thomson plot
(Figure 6.13), in which available literature data were also included13. As far as the author
knows, very few reports of Gibbs-Thomson plots exist in the case of PC13,34. Jonza and
Porter13 constructed a Gibbs-Thomson plot with three data points measured from
calorimetry and small angle X-ray methods, and they concluded that Tmo is 608K and �e,
70mJ/m2. On the other hand, Legras and Mercier34 reported that Tmo is equal to 591K
and �e, 94mJ/m2 from the spherulite growth rate study of plasticized PC. The results
from this study (Tmo = 597K and �e = 52 mJ/m2) seem to be comparable.

214
In general Tmo can be determined either by Gibbs-Thomson equation or by a non-
linear Hoffman-Weeks extrapolation32,33, in the latter case if the polymer can be
crystallized in a broad temperature range. Good examples are it-PP33 and PEO40.
Unfortunately, one cannot apply non-linear Hoffman-Weeks extrapolation method to PC
for this purpose, since the temperature window for crystallization of PC is extremely
narrow29,41,42, thus in practice, extrapolation will be subjected to a large uncertainty.
From this point of view, the Gibbs-Thomson plot will be the most appropriate method to
determine Tmo of PC.
6.5 Conclusions
In this chapter to test the hypothesis of two different mechanisms of secondary
crystallization above and below Tco, two independent isothermal annealing experiments
were performed. First, from the calorimetry study, it was observed that an increase in
isothermal annealing time for a given temperature above 208oC leads to an increase in
peak melting temperature along with peak broadening, suggesting the presence of
isothermal lamellar thickening. Second, from the direct lamellar thickness measurement
using AFM, it was found a clear trend of lamellar thickness increase upon isothermal
annealing performed under the same conditions as in the calorimetry study.
A Gibbs-Thomson plot was constructed from lamellar thickness and
corresponding melting temperature measured by various techniques, and in this plot, Tmo
and �e were calculated as 597K and 52 mJ/m2, respectively.

215
References
1. A. J. Kovacs, A. Gonthier, Kolloid Z., 1972, 250, 530.
2. S. Z. D. Cheng, A. Zhang, J. Chen, D. P. Heberer, J. Polym Sci., Part B, 1991, 29,
287.
3. J. Enns, R. Simha, J. Macromol. Sci. Phys., 1977, B13, 11
4. D. C. Bassett, D. Patel, Polymer, 1994, 35, 1512
5. J. Rault, J. Macromol. Sci, Rev. Macromol. Chem. Phys., 1997, C37, 335.
6. B. Wunderlich, Macromolecular Physics, 1976, Ch. 7, Academic Press, New York.
7. P. J. Phillips, G. J. Rensch, J. Polym Sci., Part B, 1989, 27, 155.
8. C. L. Gruner, B. Wunderlich, R. C. Bopp, J. Polym. Sci., A-2, 1969, 7, 2099.
9. C.D. V. Rees, D. C. Bassett, Nature, 1968, 219, 368.
10. D. V. Rees, D. C. Bassett, J. Polym Sci., Part B, 1969, 7, 273.
11. I. C. Sanchez, J. P. Colson, R. K. Eby, J. Appl. Phys., 1973, 44, 4332
12. I. C. Sanchez, A. Peterlin, R. K. Eby, F. L. McCrackin, J. Appl. Phys., 1974, 45,
4216.
13. J. M. Jonza, R. S. Porter, J. Polym. Sci. Polym. Phys., 1986, 24, 2459.
14. G. Mendez, A. J. Müller, J. Thermal Analysis, 1997, 50, 593
15. W. G. Hu, C. Boeffel, K. Schmidt-Rohr, Macromolecules, 1999, 32, 1611.
16. W. G. Hu, K. Schmidt-Rohr, Acta Polym., 1999, 50, 271.
17. K. Schmidt-Rohr, H. W. Spiess, Multidimensional Solid State NMR and Polymers,
1994, Academic Press.
18. P. Tormala, J. Macromol. Sci. Rev. Macromol. Chem., 1970, C17, 297
19. R. Boyer, J. Macromol. Sci. Phys., 1973, B8, 503
20. I. Bonev, Acta Crystallogr., Section A , 1972, 28, 508.
21. J. Williems, Naturwissenschaften, 1955, 42, 176
22. E. W. Fischer, Kolloid-Z., 1958, 159, 108
23. K. K. Seth, C. J. E. Kempster, J. Polym. Sci., Polym. Symp. 1977, 58, 297.
24. T. Takahashi, M. Inamura, I. Tsujimoto, J. Polymer Sci., Polym. Lett. Ed., 1970, 8,
651; T. Takahashi, F. Teraoka, I. Tsujimoto, J. Macromolec. Sci. Phys., 1977, B12(3),
303.
25. D. W. Pashley, Adv. Phys., 1965, 14, 327.

216
26. J. C. Wittmann, B. Lotz, Prog. Polym. Sci., 1990, 15, 909.
27. H. Zhou, G. L. Wilkes, Polymer, 1997, 38, 5735.
28. L. Addadi, S. Weiner, Proc. Natl. Acad. Sci. U.S.A. 1985, 82, 4110; L. Addadi, J.
Moradian, E. Shay, N. G. Maroudas, S. Weiner, Proc. Natl. Acad. Sci. U.S.A. 1987,
84, 2732.
29. G. Kämpf, Kolloid. Z., 1961, 172, 51
30. D. C. Bassett, D. Patel, Polymer, 1994, 35, 635.
31. P. J. Phillips, G. J. Rensch, J. Polym. Sci. Polym. Phys., 1989, 27, 155.
32. H. Marand, J. Xu, S. Srinivas, Macromolecules, 1998, 31, 8219.
33. J. Xu, S. Srinivas, H. Marand, P. Agarwal, Macromolecules, 1998, 31, 8230.
34. R. Legras, J. P. Mercier, J. Polym. Sci. Polym. Phys., 1979, 17, 1171.
35. H. Marand, A. Alizadeh, Manuscript in preparation.
36. R. E. J. Fryer, J. Appl. Polym. Sci., 1974, 18, 2261. A. Prietzschk, Kolloid. Z., 1959,
156, 8.
37. B. J. MacNulty, Polymer, 1968, 9, 41. R. Bonart, Makromol. Chemie, 1966, 92, 149.
38. H. R. Harron, R. G. Pritchard, B. C. Cope, D. T. Goddard, J. Polym. Sci. Polym.
Phys., 1996, 34, 173.
39. A. Siegmann, P. H. Geil, J. Macromol. Sci. Phys., 1970, B4(2), 239; A. Siegmann, P.
H. Geil, J. Macromol. Sci. Phys., 1970, B4(2), 273.
40. H. Marand, J. Xu, Manuscript in preparation.
41. F. Galez, R. Legras, J. P. Mercier, Polym. Engr. Sci., 1976, 16, 276.
42. H. Schnell, in “Chemistry and Physics of Polycarbonates”, 1964, Interscience, N. Y.

217
Chapter 7
The Evolution of Rigid Amorphous Fraction and Its Correlation with
the Glass Transition Behavior of Semicrystalline PC
7.1 Introduction
One of the important conclusions from the kinetics study of secondary
crystallization in Chapter 5 is that the rate of the shift of the low endotherm with time,
B(Tx) is due, at least partly, to the reduction of the conformational entropy of the
remaining amorphous phase. The observation that B(Tx) decreases with the increase in
secondary crystallization temperature may support this conclusion (see Chapter 5). If the
above hypothesis is true, then the increase of Tg or Tg broadening during the secondary
crystallization may be explained in the context of the increase of constraints imposed by
bundle-like crystals. Indeed, Marand et al. observed almost linear relationship between
the temporal evolution of Tg and B(Tx) in case of PEEK, it-PS, PET; furthermore, they
provided thermodynamical considerations explaining this observation1.
In correlating the evolution of Tg with B(Tx), the implicit assumption is that B(Tx)
is, at least qualitatively, related to the level of constraints imposed by bundle-like
crystals. In this chapter the rigid amorphous fraction (RAF) is used as an alternative way
of evaluating the level of constraints, and the correlation between RAF and glass
transition behavior will be presented. The key assumption behind the use of the RAF as
an index for the level of constraints is that the RAF developed during crystallization is
proportional to the level of constraints. Detailed descriptions of the rigid amorphous
phase (RAP) and calculations of the RAF are offered in Chapter 2.

218
Originally, Wunderlich et al.2-4 introduced the concept of rigid amorphous
fraction (RAF), which is defined as the fraction of amorphous phase that does not
contribute to Tg at the normal glass transition temperature, to explain the experimental
inconsistency between the measured crystallinity (Xc) and rigid fraction (fr) (see below).
fr = 1 – �Cpsc/�Cp
am = fraf + Xc [7.1]
Where fr is rigid fraction representing the fraction of chain molecules that does not
contribute to the heat capacity increase at normal Tg. �CpSC and �Cp
amor stand for the
heat capacity increase at Tg in the semicrystalline and completely amorphous polymer,
respectively. Equation (7.1) can be used for the quantitative determination of the RAF
from the calorimetry study. Further, if Xc is known, then the difference between fr and Xc
would be the fraction of rigid amorphous phase (fraf).
At this moment a caution must be taken to ensure that the level of crystallinity is
determined as accurately as possible for the proper evaluation of fraf. In many cases, the
crystallinity is expressed as the ratio of measured value to that of 100% crystalline phase.
For instance, crystallinity from the calorimetry study is often expressed as follows.
Xc = �Hmexp/�Hm
o [7.2]
Where �Hmexp and �Hm
o are the experimental and 100% crystalline phase heat of fusion,
respectively. At least two corrections need to be considered for a proper use of equation
(7.2). First, �Hmo represents the enthalpy of fusion of a perfect crystal at the equilibrium

219
melting temperature, Tmo. However, semicrystalline polymers usually melt at a lower
temperature than Tmo; therefore, �Hm
exp needs to be corrected for temperature effect.
Second, �Hmo assumes the infinitely large perfect crystal, yet in reality, polymer crystals
are limited in size, thus the surface enthalpic contribution should be taken into account.
The latter issue becomes even more critical when one considers samples that contain a
significant fraction of small secondary crystals.
In this chapter, the crystallinity of all the data presented was properly corrected
considering the above two effects, and based on this more accurate crystallinity, rigid
amorphous fraction was evaluated. In the following experimental section, the detail
procedures for these two corrections will be offered.
7.2 Experimental
In chapters 4 to 6, calorimetry studies were conducted on PC samples crystallized
under various conditions, such as different 1) molar mass, 2) secondary crystallization
temperature and time, and 3) isothermal annealing temperature and time. In this Chapter,
approximately 200 DSC melting traces of previous experiments were analyzed, and in
each DSC curve, the rigid fraction (fr) and the experimental heat of fusion (�Hmexp) were
determined. The rigid fraction (fr) was calculated using equation (7.1). The heat capacity
changes at Tg in the amorphous state (i.e., �Cpam in equation 7.1) for fractions and
commercial PC-28K samples are presented in Figure 3.9. �Hmexp was properly corrected
to evaluate more accurate crystallinity (see below). Glass transition temperature, the heat
capacity changes at Tg, and the breadth of Tg were measured following the method
described by Cheng et al5. Tg was determined at the inflection point of the �Cp increase.
Tg broadening (�Tg) was measured by the temperature difference in the intercepts of the

220
tangential line at Tg with the heat capacity lines of liquid (T2) and glass (T1) (i.e., �Tg =
T2 - T1). Detailed descriptions of these parameters are offered in Chapter 3, along with
an illustration. Other experimental conditions, such as sample preparation, DSC
measurements, and temperature scale calibration, were described in Chapter 2.
7.2.1 Temperature Correction for the Experimental Heat of Fusion
Temperature correction for the experimental heat of fusion was done using the
following thermodynamic considerations. The enthalpy of fusion, �Hm* at a temperature
Tm will be given by:
dT (T)'C + )(T H )T(H
0m
m
T
T
p0
m0mmm ��� [7.3]
�Cp´(T) = CpL (T) - Cp
S (T) [7.4]
Where �Cp´(T) is the difference between the heat capacities of the solid and liquid
polymers at temperature T. The temperature dependencies of heat capacities of
bisphenol-A polycarbonate in both liquid and glassy states are available experimentally.
In addition, Wunderlich et al. in the ATHAS databank6 provided the temperature
dependence of the heat capacity of PC in the crystalline state based on theoretical
considerations. In this study, a value of 608K has been used for the equilibrium melting
temperature of PC7. Figure 7.1 shows a universal calibration curve used for the
temperature correction of the experimental heat of fusion in PC. Note that PC-6K
(fraction) and PC-28K (commercial), which represent two extreme molar masses used for
the analysis, fall on the same line. The experimental heat of fusion in each DSC curve
has been temperature corrected using the calibration factor given in Figure 7.1. After a

221
�Hmexp (J.g-1)
0 10 20 30 40
�H
mco
r (J.
g-1)
0
10
20
30
40
50
�Hmcor = 1.22 x �Hm
exp
R2 =0.999
PC-6K (fraction)
PC-28K (commercial)
Figure 7.1 A temperature correction curve for the experimental heat of fusion of PC samples used in this study. Note that temperature corrected heat of fusion (�Hm
cor ) is about 20% higher than the experimental heat
of fusion (�Hmexp ).

222
proper temperature correction, �Hmexp increased about 20%.
7.2.2 Surface Enthalpic Contribution for the Equilibrium Heat of Fusion
As noted earlier, the existence of small secondary crystals may decrease the
equilibrium heat of fusion of as-crystallized samples due to a significant surface enthalpic
contribution. To properly evaluate this correction, wide angle x-ray scattering (WAXS)
experiments were performed on as-crystallized and partially melted PC-19K samples.
From each DSC melting trace, an the experimental heats of fusion is obtained. In Figure
7.2, �Hmtotal of PC-19K samples (before and after partial melting) is plotted as a function
of XWAXS* (crystallinity from WAXS experiments) for different crystallization times. In
this plot, crystallinity from the density measurement
was also included. Note that in Figure 7.2, the heat of fusion in each line has been
temperature corrected, and as-crystallized PC-19K and PC-28K fall on the same line
within experimental uncertainty. One important observation in this figure is that as-
* The degree of crystallinity of a semicrystalline sample can be estimated from the experimental scattering profile by
using the following equation:
Xwaxs = Ic/(Ic +Ia)
where XWAXS is the degree of crystallinity from WAXS, and Ic and Ia represent the integrated intensities of the
crystalline and the amorphous phases, respectively. In this method, it is assumed that the total scattering within a
certain region of the reciprocal space is independent of the state of segregation of polymer. The integrated intensities Ia
and Ic are usually obtained by curve fitting the experimental scattering curve. For this, the scattering profiles of a 100%
crystalline and a 100% amorphous specimen are prerequisites. An obvious assumption of this method is that the
scattering profile of a 100% amorphous (glassy or liquid-like) specimen and that of the amorphous phase in the
semicrystalline sample are proportional. This same argument is applicable to the crystalline phase, but we are
deliberately discussing the amorphous phase, since in many semicrystalline polymers, such as PE, the scattering profile
of the 100% amorphous specimen is not available at the same temperature as that of the semicrystalline sample. In
other polymers, the scattering profile of the 100% amorphous sample, although available, is significantly different from
the corresponding profile of the amorphous phase in the semicrystalline sample. Fortunately, in PC, it is easy to obtain
completely amorphous films at room temperature and also due to the low levels of crystallinity (<0.30) in this material,
it has been found that the amorphous-scattering profiles in the semicrystalline and 100% amorphous samples are very
similar.

223
Crystallinity from WAXS or density measurement
0.00 0.05 0.10 0.15 0.20 0.25 0.30
�H
mco
r (J.
g-1
)
0
5
10
15
20
25
30
�Hmo (original) = 117 ( J.g-1)
�Hmo (partial melting) = 136 ( J.g-1)
PC-19K (partial melting) from WAXS
PC-28K (original) from density
PC-19K (original) from WAXS
Figure 7.2 Correction for the equilibrium heat of fusion considering the surface enthalpic contribution.

224
crystallized and partially melted samples appear to fall onto two distinguishable lines.
As-crystallized samples (i.e., containing both small secondary crystals and lamellar type
crystals) follow the lower line, whereas partially melted samples (i.e., containing only
lamellar type crystals) fall on the upper line. These results are consistent with the notion
that the existence of small crystals will give rise to the decrease of the equilibrium heat of
fusion due to a significant surface enthalpic contribution. Therefore, these two different
values of the equilibrium heat of fusion was used for the calculation of crystallinity from
the calorimetry study (see equation (7.2)). For instance, the upper value (136 J/g) was
used for isothermally annealed samples, which exhibit the high endotherm only, and for
samples possessing both the low and high endotherms, the lower value (117 J/g) was
applied.
7.3 Results
Before presenting the results, we need to specify the sample nomenclature used in
the following figures. All the samples were designated as (PC-XX, tx, YY, Tx). PC-XX
stands for the molar mass of PC samples; tx, for the time of primary crystallization; YY,
for the method of thermal treatment; and Tx, for the temperature of given thermal
treatment. YY could be SC (secondary crystallization), IA (isothermal annealing), BC
(bulk crystallization), and CL (cooling). For example (PC-28K, tx = 202h, SC, 165oC)
means PC-28K sample initially crystallized at 185oC for 202 hours, partially melted at
220oC, and subsequently exposed to the secondary crystallization at 165oC for various
times. Note that primary crystallization and partial melting temperatures are slightly
varied for different molar mass samples (see Table 5.1).
In Figure 7.3 the evolution of rigid fraction (fr) as a function of corrected

225
crystallinity is presented. One immediate observation is that regardless of molar mass
and various thermal treatment conditions, all the data fall on the same line within the
limit of uncertainty. More importantly, fr is always greater than Xc, being approximately,
fr � 2Xc. According to equation (7.1), this result indicates that rigid amorphous fraction
(RAF) increases almost linearly with crystallinity; furthermore, as can be expected, the
RAF becomes negligible when crystallinity approaches zero value. Another interesting
observation is that clearly low molar mass sample exhibits higher level of RAF, with
higher level of crystallinity.
In Figures 7.4 and 7.5, respectively, normalized Tg broadening and Tg variation as
a function of RAF are shown. [�Tg]normalized was defined as [T2-T1]sc/[T2-T1]am, in which
sc and am stand for semicrystalline and amorphous phase, respectively. Tg variation was
also normalized in a similar way as [Tg]normalized = [Tgsc-Tg
am]/Tgam �100. Largely
speaking, these two plots show a similar trend: an increase of RAF leads to the increase
of Tg and Tg broadening.
7.4 Discussion
As seen in Figure 7.3, the inequality between fr and Xc is a clear deviation from
the two-phase model. In the context of the two-phase model, fr should be the same as Xc,
because this model strictly assumes two phases: amorphous (mobile) and crystalline
(rigid).
Within experimental uncertainty, the observation of fr � 2Xc may suggest the
upper limit of apparent maximum crystallinity achievable from the bulk crystallization of
PC. Because, hypothetically, when fr reaches 1, the corresponding crystallinity would be
0.5, and obviously, fr can not be bigger than 1; therefore, Xc = 0.5 would be the upper

226
Xc
0.0 0.1 0.2 0.3 0.4 0.5
RF
= 1
-[ � �C
psc/ � �
Cpam
]
0.0
0.2
0.4
0.6
0.8
1.0
PC-28K, tx= 202h, SC, 165
oC
PC-28K, tx= 202h, SC, 175
oC
PC-28K, tx= 202h, SC, 185
oC
PC-28K, tx= 202h, SC, 195
oC
PC-28K, tx= 105h, SC, 185
oC
PC-28K, tx= 153h, SC, 185
oC
PC-28K, CL after PM 220oC
PC-28K, BC, 185oC
PC-28K, IA, 208oC
PC-28K, IA, 214oC
PC-28K, IA, 217oC
PC-28K, IA, 220oC
PC-28K, IA, 223oC
PC-6K, SC, 163oC
PC-6K, SC, 173oC
PC-6K, SC, 178oC
PC-12K, SC, 168oC
PC-12K, SC, 178oC
PC-12K, SC, 183oC
PC-12K, BC, 178oC
RF = Xc ( two-phase model )
RF � 2Xc ( three-phase model )
Figure 7.3 The evolution of rigid fraction (RF) as a function of crystallinity for PC samples thermally treated under various conditions. Note that crystallinity has been both temperature and surface enthalpic contribution corrected (see the text). The accuracy of the determination of RF was better than 0.03

227
RAF
0.0 0.1 0.2 0.3 0.4
[ �T
g]no
rmal
ized
= [T
2-T
1]sc/[T
2-T
1]am
0.9
1.2
1.5
1.8
2.1
2.4
PC-12K, SC, 168oC
PC-12K, SC, 178oC
PC-28K, tx = 202h, SC, 195oC
PC-28K, tx = 202h, SC, 185oC
PC-28K, tx = 202h, SC, 175oC
PC-28K, tx = 202h, SC, 165oC
PC-28K, tx = 105h, SC, 185oC
PC-28K, tx = 153h, SC, 185oC
PC-28K, CL after PM at 220oC
PC-28K, BC, 185oC
PC-28K, IA, 208oC
PC-28K, IA, 214oC
PC-28K, IA, 220oC
PC-28K, IA, 223oC
PC-12K, BC, 178oC
PC-12K, SC, 183oC
Figure 7.4 Tg broadening as a function of RAF of PC samples under various
thermal treatments. The accuracy of [�Tg]normalized determination was better
than ±5%.
PC-6K, BC, 165oC

228
RAF
0.0 0.1 0.2 0.3 0.4
[Tg]
norm
aliz
ed =
[Tgsc
- T
gam]/T
gam x
100
0.0
0.5
1.0
1.5
2.0
PC-28K, tx = 202h, SC, 195oC
PC-28K, tx = 202h, SC, 185oC
PC-28K, tx = 202h, SC, 175oC
PC-28K, tx = 202h, SC, 165oC
PC-28K, tx = 105h, SC, 185oC
PC-28K, tx = 153h, SC, 185oC
PC-28K, IA, 208oC
PC-28K, IA, 214oC
PC-28K, IA, 220oC
PC-28K, IA, 223oC
Figure 7.5 Normalized Tg increase as a function of RAF for PC samples under
various thermal treatments. The accuracy of the Tg determination was better than 0.3oC
PC-12K, SC, 168oC
PC-12K, SC, 178oC
PC-12K, BC, 178oC
PC-12K, SC, 183oC
PC-6K, BC, 165oC

229
boundary. It is well known that when PC (Mw = ca. 30,000 to 67,000 g/mol) crystallizes
from the bulk, the kinetics of crystallization are extremely slow and the maximum degree
of crystallinity seldom exceeds 0.37-13. In the present study, even from the isothermal
annealing experiments (see the data labeled as IA in Figure 7.3), the maximum
crystallinity does not exceed 0.28, being the highest value among all the PC-28K samples
crystallized under various conditions. Furthermore, as depicted in Chapter 5, in the case
of low molar mass fractions, the rate of primary crystallization kinetics was increased
more than 100 times compared with that of PC-28K, yet surprisingly, the final level of
crystallinity was always less than 0.37. According to the literature, higher crystallinity
PC is only available when other methods of crystallization are employed, such as
crystallization in the presence of nucleating agent and/or plasticizer14,15. In general, the
slow crystallization kinetics and limited crystallizability of PC have been explained in
terms of chain rigidity10,16,17. The above observation in Figure 7.3 may suggest a more
specific result of chain rigidity: rigid chain may generate the higher level of RAF (i.e.,
more constraints) and this will further hinder the growth of crystals.
In this figure, it is also observed that the lower molar mass sample exhibits a
higher degree of RAF. Cebe et al. reported a similar result from the study of cold-
crystallized PPS18. They explained the observation in such a way that the lower molar
mass sample has a greater number of taut tie molecules between the crystals resulting in a
large fraction of constrained amorphous phase18. For PC, this could be because of the
increased crystallinity of low molar mass fractions due to the increased mobility. To
strictly compare RAF in different samples, the crystallinity in the samples should be the

230
same; however, due to the relatively fast crystallization kinetics and higher degree of
crystallinity in lower molar mass PC, this condition could not be achieved.
The increase of Tg and Tg breadth with the increase of RAF in Figures 7.4 and 7.5
can be expected. The level of constraints may increase during crystallization, which
leads to the increase of both the level of RAF and the degree of Tg broadening, including
Tg per se. Of more interest, however, is that Tg increase or broadening significantly
occurs only above a certain level of RAF, seemingly close to the value of 0.2. Because
the data are much less scattered below this value, this upturn point can be relatively well
defined. Based on the assumption that the location of the RAF could be between the
lamellar crystals, possibly near the crystal/amorphous interphase, we propose a possible
explanation to this observation. Before the RAF reaches this critical value, the thickness
of amorphous layer is large enough not to be affected by the presence of RAF
(insignificant change in Tg and Tg broadening). However, as the RAF further increases,
more constrained mobile amorphous will show a retarded relaxation leading to the
significant increase of Tg and Tg broadening. At this later stage, due to the large
scattering, no other specific information such as the effects of molar mass and
crystallization temperature could be obtained; however, qualitatively speaking, Tg and Tg
broadening increase dramatically at this stage, indicating the existence of considerable
constraints.
7.5 Conclusions
From the quantitative analysis of RAF in varying molar mass PC samples
crystallized under various conditions, the following conclusions are drawn. Regardless
of molar mass and thermal treatment conditions, semicrystalline PC exhibits a rigid

231
fraction (fr) that is always greater than the corrected crystallinity (Xc). This observation
strongly suggests the evolution of the rigid amorphous phase upon bulk crystallization of
PC. Quantitatively, the degree of the RAF increases almost linearly with crystallinity in
the range of 0 to 0.4, and the lower molar mass samples show a higher degree of RAF
compared with higher molar mass samples. Tg and Tg broadening increase with the
evolution of RAF, and, of more interest, it seems that there exists a critical level of RAF
that initiates the significant changes in Tg and Tg broadening.

232
References
1. H. Marand, A. Alizadeh, in preparation.
2. J. Grebowicz, S. F. Lau, B. Wunderlich, J. Polym. Sci.:Polym. Symp., 1984, 71, 19.
3. S. F. Lau, B. Wunderlich, J. Polym Sci. Polym. Phys., 1984, 22, 379.
4. H. Suzuki, J. Grebowicz, B. Wunderlich, Macromol. Chem., 1985, 186, 1109.
5. S. Z. D. Cheng, M. Y. Cao, B. Wunderlich, Macromolecules, 1986, 19, 1868.
6. ATHAS data Bank: http://funnelweb.utcc.utk.edu/~athas/databank/intro.html (The
heat capacity data of semicrystalline PC has been listed since 02/01/00).
7. J. M. Jonza, R. S. Porter, J. Polym. Sci. Polym. Phys., 1986, 24, 2459.
8. E. Turska, W. Przygocki, M. Maslowski, J. Polym Sci. Part C, 1968, 16, 3373.
9. E. Laredo, M. Grimau, A. Muller, A. Bello, N. Suarez, J. Polym. Sci. Polym. Phys.,
1996, 34, 2863.
10. G. Mendez, A. J. Müller, J. Thermal Analysis, 1997, 50, 593.
11. B. Falkai, W. Rellensmann, Makromolekular Chem., 1964, 75, 112.
12. G. E. Wissler, B. Crist. Jr, J. Polym Sci., Polym.Phys., 1980, 18, 1257.
13. Giuseppe V. Di Filippo, Maria E. Gonzalez, Maria T. Gasiba, A.V. Müller, J. Appl.
Polym. Sci., 1987, 34, 1959.
14. C. Bailly, M. Daumerie, R. Legras, J. P. Mercier, J. Polym. Sci. Polym. Phys., 1985,
23, 343; C. Bailly, R. Legras, J. P. Mercier, J. Polym. Sci. Polym. Phys., 1985, 23,
355; C. Bailly, M. Daumerie, R. Legras, J. P. Mercier, J. Polym. Sci. Polym. Phys.,
1985, 23, 493.
15. R. Legras, C. Bailly, M. Daumerie, J. M. Dekoninck, J. P. Mercier, V. Zichy, E.
Nield, Polymer, 1984, 25, 835.
16. Hermann Schnell, Chemistry and Physics of Polycarbonates, 1964, John Wiley &
Sons, Inc.
17. G. Kämpf, Kolloid-Zeitschrift, 1960, 172, 50.
18. S. X. Lu, P. Cebe, M. Capel, Macromolecules, 1997, 30, 6243.

233
Chapter 8
Summary
Crystallization and melting behavior of varying molar mass bisphenol-A
polycarbonate (PC) samples were investigated using differential scanning calorimeter
(DSC) for the monitoring of thermal behavior, and atomic force microscope (AFM) for
the morphology study. The following is a summary of conclusions from the results of the
investigations.
The glass transition temperature (Tg) of PC is strongly affected by molar mass and
molar mass distribution. In the molar mass range between ca. 4,300 and 55,000 g.mol-1,
the variation of Tg is more than 25oC, and near monodisperse samples show slightly
lower Tgs than commercial samples. In addition, amorphous density of PC is determined
as being equal to 1.1977�0.0002 g/cc.
Studies of the heating rate dependence of the melting behavior of PC indicate that
the high and low endothermic regions are associated with the melting of primary (chain
folded lamellae) and secondary crystals (bundle-like or fringed micellar type crystals),
respectively. No reorganization effects during heating are observed for PC-19K and PC-
28K in the usual range of heating rate (�� 2.5oC/min). In contrast, the lower molar mass
material, PC-4K, exhibits a melting-recrystallization-remelting process during heating.
This reorganization process, however, affects only the shape of the high endothermic
region. The observed upward shift of the low endotherm with increasing heating rate is
explained by superheating effects and is fully consistent with the notion that amorphous
chains in the vicinity of secondary crystals are conformationally constrained.

234
The primary crystallization kinetics of PC shows a strong dependence on molar
mass. In the molar mass ranging between 4,300 and 28,000 g.mol-1, low molar mass
fraction crystallizes faster, and overall crystallization rates differ by more than a factor of
100. We also observed a significant influence of molar mass distribution on the overall
crystallization kinetics.
In contrast, the kinetics of secondary crystallization of PC is essentially molar
mass independent. Regardless of molar mass distribution, initial stages of crystallization,
primary or secondary crystallization temperature, and partial melting temperature, the
kinetics of the low endotherm depicts two universal behaviors: Low endotherm melting
temperature, Tmlow, increases linearly with the logarithm of crystallization time, and at the
early stage, the Avrami exponent in the logarithm of the heat of fusion associated with
the low endotherm, log[�Hmlow], as a function of the logarithm of crystallization time is
0.5. The rate of shift of the low endotherm with time, B(Tx), was found to decrease with
temperature, and this could be ascribed, at least partly, to a decrease of the
conformational entropy upon secondary crystallization. From the heating rate correction
of B(Tx), we showed that there exists a crossover temperature below which both the low-
and the high endotherm are present, and above which only the high endotherm is
expected to be stable. It is suggested that this crossover temperature could be related to
the �c relaxation temperature in PC.
The existence of isothermal lamellar thickening in PC has been examined by two
independent methods. First, from the calorimetry study, it was observed that an increase
in isothermal annealing time for a given temperature above 208oC leads to peak melting
temperature increase along with peak broadening, suggesting the presence of isothermal

235
lamellar thickening. Second, from direct lamellar thickness measurement using AFM, a
clear trend of lamellar thickness increase upon isothermal annealing performed at 220oC
in the time range of 5 to 18 hours was shown.
A Gibbs-Thomson plot could be constructed from lamellar thickness and
corresponding melting temperature measured by various techniques. From this plot, the
equilibrium melting temperature (Tmo) and interfacial surface free energy (�e) of PC were
determined as 597K and 52 mJ/m2, respectively.
From the analysis of rigid fraction using corrected crystallinity, it was found that,
regardless of molar mass and thermal treatment conditions, semicrystalline PC always
exhibits rigid fraction larger than the corrected crystallinity. This observation strongly
suggests the evolution of rigid amorphous phase upon bulk crystallization of PC.
Quantitatively, the degree of rigid amorphous fraction (RAF) increases almost linearly
with crystallinity in the range of 0 to 0.4. The lower molar mass samples show a higher
degree of RAF compared with higher molar mass samples. Tg and Tg broadening
increase with the evolution of RAF, and of more interest, it seems that there exists a
critical level of RAF needed to initiate the significant changes in Tg and Tg broadening.

236
Future Work
Based on the results, the discussion, and the conclusions drawn from this study,
the following suggestions for future work can be made:
On the effect of film thickness on crystallization
From the bulk-crystallization of some PC fractions (PC-4K, 6K, 8K, 12K, 17K)
and two commercials (PC-19K and PC-28K), it was consistently shown that, regardless
of the primary crystallization temperatures between 155oC to 210oC, the peak melting
temperatures of the high endotherms of these samples are in the range of 220oC to 230oC.
In contrast, the peak melting temperature of thin film of PC crystallized under similar
conditions was significantly higher than that of the bulk-crystallized samples. We
proposed that this might be due to the film thickness effect; however, at present, the exact
reason could not be found. To resolve this issue, we need to crystallize several samples
with different but precisely controlled thickness under the same conditions and measure
the melting temperatures of those samples. These experiments may provide the
information of film thickness effect on crystallization.
On the two regimes of isothermal crystallization
At the end of Chapter 5, from the heating rate studies of the rate of the shift of the
low endotherm, it was found that there exists a crossover temperature, below which both
the low and the high endotherm are present, and above which only the high endotherm is
expected to be stable. In conjunction with this, in Chapter 6, the presence of isothermal
lamellar thickening above this critical temperature was investigated using DSC and AFM,
and it was suggested that this temperature is related to isothermal lamellar thickening. To
provide further evidence for this hypothesis, small angle x-ray scattering (SAXS)

237
experiment will be of help. For instance, the measurement of the variations of long
spacing below and above this critical temperature with crystallization time will provide
important information.
On the epitaxy of PC
The present study used calcite as a substrate for the epitaxial growth of PC, a
choice that was purely based on the lattice parameter matching. To achieve strict
conditions of epitaxy, it is necessary to know the exact chain conformation of PC
molecules on calcite cleavage plane. Furthermore, this information will be crucial to find
better substrates of PC epitaxy. For this, computer simulation may be required.
On the evaluation of rigid amorphous fraction (RAF)
In Chapter 7, almost 200 DSC melting traces were analyzed to calculate RAF.
Although qualitatively, the data show reasonable trends with other variables such as
crystallinity, Tg and Tg broadening, the scattering of data is rather large, especially at later
stages of crystallization. The principal reason is that each sample was thermally treated
separately under different conditions, therefore, the sample to sample variations could not
be eliminated. For example, in the study of the effect of time on the secondary
crystallization kinetics, the following procedures were used: sample A was thermally
treated by 1) crystallization at 185oC for 202 hours, 2) partial melting at 220oC for 1 min,
and 3) secondary crystallization at 185oC for tx. The thermal treatments for the next
samples were exactly the same but with a different tx in step 3. The scattering of data
shown from Figures 7.3 to 7.6 is because of these multiple steps of thermal treatments for
many different samples. To resolve this issue, it may be necessary to use temperature
modulated DSC (TMDSC) with a small number of samples and perform all the thermal

238
treatments inside the DSC. Although in the case of PC, this will be a time-consuming
experiment, the results will be far less scattered, and thus we may be able to extract
quantitative information.
On the bundle-like secondary crystallization model
The experimental observations that have been made in Chapters 4, 5, and 6 are
qualitatively in good accordance with a newly proposed bundle-like secondary
crystallization model. This model, as already pointed in Chapter 2, however, more
qualitative than quantitative. To develop a quantitative model that enables us to
theoretically predict the size, the spatial orientation, and the exact location(s) of the
secondary crystals, the following information will be necessary:
1) The exact time-dependent variation of the concentration and the distribution of the
amorphous chains, such as chain cilia and loose loops, consisting the interlamellar
amorphous layers
2) The correlation between the amount of rigid amorphous fraction (RAF) and
secondary crystals in addition to the exact location of RAF
3) The possible relationship between the chain rigidity and the size or the amount of
secondary crystals
4) A reliable methodology of morphology study that enables us to physically see the
secondary crystals.

239
Appendix A.1
Stockmayer-Fixman Plot of Bisphenol-A Polycarbonate Fractions
One can utilize different methods such as light scattering and small angle X-ray
scattering to determine the unperturbed dimension (<Ro2>1/2) of polymer in the melt or in
� solution. If we have fractions, as an alternative, we can adopt Stockmayer-Fixman plot
method to calculate <Ro2>1/2. The essential concept of this method is based on the known
fact that as molecular weight decreases the intrinsic viscosity also decreases, and at the
limiting case when <Mw> approaches zero, from the intercept, one can calculate the
normalized unperturbed dimension.
[�] = Ko�<M>1/2 + 0.51���B�<M> [A.1.1]
Where [�] is an intrinsic viscosity, <M> is molecular weight, B is a constant and � is a
Flory universal constant of 2.5 x10²¹ dL cm-3 mol-1 or 2.5 x 10²³ mole-1. When both sides
are divided with M1/2, equation (A.1.1) can be reformulated as follows.
[�]�<M>-1/2 = Ko + 0.51���B�<M>1/2 [A.1.2]
Equation (A.1.2) tells us that when [�][<M> -1/2] is plotted as a function of <M>1/2, it will
give rise to a linear relationship, and from the intercept, Ko, we can calculate the
unperturbed dimension (more precisely normalized unperturbed dimension with
molecular weight, thus [<Ro2>/<M>]1/2) from the following relationship.

240
Ko = ��[<Ro2>/<M>]3/2 [A.1.3]
In Figure A.1.1, the results from the analysis of PC fractions are presented. The intercept
is 0.00147 dL g-3/2 mol1/2, which leads to the normalized unperturbed dimension,
[<Ro2>/M]1/2 as being equal to 0.84. This value is in good agreement with the reported
value, 0.931,2.
When the normalized unperturbed dimension is known, as a next step, the chain
stiffness factor, C�, can be calculated.
C� = <Ro
2>/n�2 [4]
Where n is the number of chain backbone of length �. The calculated C� is 1.83, and this
is close to the known value of 2.02.
Based on these results it can be corroborated that the measured molar masses
from the GPC analysis are acceptable.
<Mw>1/2
0 50 100 150 200 250
[ � �]<
Mw>-1
/2
0.001
0.002
0.003
0.004
0.005
Figure A.1.1 Stockmayer-Fixman plot for the PC fractionsused in this study (Mw ranges from 5,000 to 55,000 g/mol)
R2 = 0.99
K o = 0.00147 dLg-3/2mol1/2

241
At this moment it would be informative to know the magnitude of the radius of
the gyrations of PC fractions in chloroform solution at room temperature and the
magnitude of the length of worm-like or Kuhn segment length of PC. The first one is in
the range of 30 to 70 Å for the molar mass (Mw) between ca. 4,300 and 55,000 g.mol-1.
Kuhn segment for PC3 was reported as being close to 160 Å.
References
1. A. Zang, C. Carrea, J. Appl. Polym. Sci., 1991, 42, 1965.
2. L. J. Fetters, D. J. Lohse, D. Richter, T. A. Witten, A. Zirkel, Macromolecules, 1994,
27, 4639.
3. N. Maeda, T. Norisuye, Polymer, 1993, 34, 3475.

242
Appendix A.2
A Brief Review of Gray’s Method for Thermal Lag Correction in DSC Melting
Traces
The advent of differential scanning calorimetry (DSC) has greatly facilitated an
accurate and relatively convenient method of monitoring the thermal behavior of
polymeric materials. One of the advantages of DSC analysis comes from the use of two
separate electronic heaters for sample and reference, which is the primary difference
between DSC and conventional differential thermal analysis (DTA). For an accurate
measurement of temperature change during any phase change, DTA intrinsically requires
higher resistance, incompatible with quick response and high resolving power; DSC does
not. This advantage allows DSC to measure most accurately the heat flow with either
time or temperature.
Both DSC and DTA actually measure the temperature difference between the
sample and the reference, �T = Ts –Tr, as a function of the duration of heating or
temperature change. The value of �T is proportional to the change in enthalpy H, heat
capacity C, and the total thermal resistance R to the heat flux. In both DTA and DSC, the
quantity R consists of two components
R = Ro +Rs
Where Ro is the thermal resistance of the instrument appearing because of the separate
arrangement of the heater and sample, and Rs is the thermal resistance determined by that
of the sample itself. Largely speaking, Rs is governed by two separate factors: first, the
resistance arising due to a non-ideal contact (Rs1) between the sample and capsule, and
second, the intrinsic thermal resistance of the sample per se (Rs2). Rs1 is strongly affected
by several factors such as the shape of sample, the method of sample manipulation, and

243
sample mass. For example, a pre-melted metal standard, having a good electrical contact
with capsule, may show an almost zero value of Rs1. In the case of polymeric materials,
this type of “ideal” contact may not be obtainable because sometimes the aim of the study
is to rereal the nature of thermal history of samples, thus pre-melting would not be
allowed. Another alternative to reduce Rs is obtained by reducing the sample mass, yet
sometimes this may not be desirable either, since, for instance, an accurate measurement
of heat capacity change at Tg intrinsically requires higher mass of sample. Due to these
reasons, the existence of Rs would be inevitable, and thus thermal lag (lagging of the
sample temperature behind that of the heater) from this sample resistance needs to be
corrected for the precise evaluation of temperature and peak shape. In general, this
temperature correction due to thermal lag could be accomplished by using a metal
standard sample sandwiched between the polymer under study. For a detailed description
of this method, see Chapters 3 and 4.
Besides the necessity of temperature correction, the shape of curve also needs to
be adjusted, since thermal lag not only causes temperature shifting but also invokes peak
broadening. This peak broadening can be effectively corrected by Gray’s method1,2.
According to Gray1,2, the evolution or absorption of heat by a sample per unit time,
dH/dt, can be represented by the sum of the three components H1, H2, H3 as schematically
depicted in Figure A.2.1.
dH/dt = – dq/dt + (Cs-Cr)dT/dt – RCsd2q/dt2 [A.2.1]
H1 H2 H3

244
Figure A.2.1. Graphical illustration of each component in Gray’s method in DSC melting traces.
Where
� H1 is dq/dt, the recorded heat flux, i.e., the experimental DSC melting traces;
� H2 is (Cs-Cr)dT/dt, the displacement of the base line from the zero level. Here Cs and
Cr are the heat capacities of the sample and the reference, respectively, and dT/dt is the
rate of change of temperature, such as heating rate;
� H3 is RCsd2q/dt2, the slope of the experimental curve at any point.
By finding a proper reference with a heat capacity equal or very close to that of
the sample being studied, one can practically eliminate the contribution from H2. As
noted earlier, the presence of the component H3 changes the shape of the experimental
DSC melting traces. The contribution of this component is proportional to the time
constant RCs determining the resolving power of the instrument. It is impossible to
eliminate component H3; therefore, DSC melting traces require correction. This H3
correction will be especially mandatory when a higher heating rate is used. The actual
procedure is simply adding the component H3 to the experimental melting traces using
Temperature
dq/dt
H2 = (Cs - Cr)dT/dtt
0
Tmax
H3
H1
RCs

245
the known value of RCs. For instance, in the case of In standard3, RCs is approximately
2.6s, and for polymers4, it is in the range of 5 to 10. In case of bisphenol-A
polycarbonate, from the heating rate study of In-sandwiched sample, RCs has been found
to be close to 7. Figure 4.2 shows a typical example of peak broadening correction by
this method. As seen, after correction, the peak width has been narrowed.
Although Gray’s method is effective, it has a serious limitation. This method
strictly relies on the assumption that R is a constant and does not change during heating.
This is approximately valid for relatively low heating rate normally below 40oC/min, yet
above this, the onset slope of melting traces is not linear, revealing the change of R
during melting. At this stage, this correction method would no longer be valid.
References
1. A. Gray, Thermal Analysis (4, ICTA), 1975, Budapest: Akad, Kiado.
2. A. Gray, Analytical Calorimetry, 1976, v1, New York, Plenum Press.
3. Manual of Perkin-Elmer, DSC-7 Instruction.
4. V. A. Bershtein, V. M. Egorov, Differential Scanning Calorimetry of Polymers, 1994,Ellis.

246
Vita
Seungman Sohn was born in March 1, 1970 in Pusan, Korea. He graduated from Seoul
National University with a bachelor degree in Metallurgical Engineering in 1992. He
further received his Master of Science in 1994 from the same university under the
guidance of Prof. Tak Kang. After spending about a year in Korea, he joined Virginia
Tech in July 1995, in Materials Engineering Science program.