crystallization, melting behavior, physical properties ... · the time dependence of the physical...
TRANSCRIPT

Crystallization, Melting Behavior, Physical Properties, and
Physical Aging of Ethylene/1-Octene Copolymers
Sha Yang
Thesis submitted to the faculty of the Virginia Polytechnic Institute and State
University in partial fulfillment of the requirements for the degree of
Master of Science
in
Chemistry
Hervé Marand, Committee Chair
Alan R. Esker
Garth L. Wilkes
May 3, 2011
Blacksburg, VA
Keywords: ethylene/1-octene copolymers, melting, crystallization, physical aging

ii
Crystallization, Melting Behavior, Physical Properties, and
Physical Aging of Ethylene/1-Octene Copolymers
Sha Yang
Abstract
The time dependence of the physical properties of ethylene/1-octene (EO)-copolymers after
primary crystallization is investigated by calorimetry, density, and creep measurements.
The temporal evolution of the multiple melting of EO-copolymers is monitored by
differential scanning calorimetry. The low temperature endotherm displays an evolution similar
to that observed for the enthalpy recovery in glasses after physical aging. Using this analogy, a
calorimetry-aging rate is defined, which quantifies the change in the low endotherm temperature
with time. Similarly a density-aging rate is defined from the evolution of density with time.
A non-classical creep behavior is observed for short aging times, consistent with
crystallization-induced shrinkage. The change in crystallinity during aging leads to a change in
the shape of the relaxation spectrum. Hence, analysis of creep data cannot be carried out using
Struik’s superposition method. For both short and long aging times, the creep rate exhibits a
dependence on copolymer composition similar to those associated with the calorimetry- and the
density-aging rates, suggesting a common origin for the evolution of the low endotherm, the
creep behavior and the bulk density.
The calorimetry, density, and creep data are reexamined based on the following assumptions:

iii
First, a single population of small crystals is formed during crystallization at low temperature;
Second, these small crystals increase in stability under isothermal conditions, easily melt and
recrystallize during heating and serve as efficient thermo-reversible cross-links to increase the
conformational constraints in the residual amorphous fraction. These assumptions appear to be
consistent with all observations made to date.

iv
Acknowledgements
I would like to express my sincere appreciation to my advisor, Dr. Hervé Marand, for his
help and invaluable guidance.
I would like to thank Dr. Alan R. Esker, Dr. Garth L. Wilkes and Dr. Paul Deck for serving
on my committee and for their useful remarks on my thesis.
I would like to thank Peter Caulfield for RHC DSC training.
Thanks to Dow Chemical and TA Instruments for providing the materials and equipments
for this research project.
Finally, I wish to express my deepest appreciation to my family and friends who provided
encouragement throughout my study.

v
Table of Contents
Chapter 1. Introduction ................................................................................................................... 1
Chapter 2. Background ................................................................................................................... 2
2.1 Crystallization .................................................................................................................... 2
2.1.1 Primary Crystallization ............................................................................................ 2
2.1.2 Secondary Crystallization ...................................................................................... 12
2.1.3 Copolymer Crystallization and Melting................................................................. 19
2.1.4 Crystallization, Melting and Morphology of Ethylene/1-Octene Copolymers ...... 21
2.2 Physical Aging ................................................................................................................ 24
Chapter 3. Experimental ............................................................................................................... 35
3.1 Materials .......................................................................................................................... 35
3.2 Methodology .................................................................................................................... 35
3.2.1 Differential Scanning Calorimetry ......................................................................... 36
3.2.2 Density ................................................................................................................... 36
3.2.3 Creep Behavior ...................................................................................................... 37
Chapter 4. Results and Discussion ................................................................................................ 39
4.1 Results .............................................................................................................................. 39
4.1.1 Differential Scanning Calorimetry ......................................................................... 39
4.1.2 Density ................................................................................................................... 50
4.1.3 Creep ...................................................................................................................... 54
4.1.4 Rapid Heating Cooling Differential Scanning Calorimetry ................................... 58
4.2 Discussion ........................................................................................................................ 60
4.2.1 Development of the Low Temperature Melting Endotherm after Crystallization . 60
4.2.2 Evolution of B(Tx) with Tx .................................................................................... 61
4.2.3 Universality of the B vs. θ Trends for EO-copolymers and Other Semicrystalline
Polymers ......................................................................................................................... 62
4.2.4 Same Trend for the Slopes of DSC and Density Measurements ........................... 63

vi
4.2.5 Increase of Crystallinity with Crystallization Time for DSC and Density
Experiments .................................................................................................................... 64
4.2.6 Summary of the Small Strain Creep Results .......................................................... 65
Chapter 5. Conclusions and Suggested Future Work .................................................................... 68

vii
List of Figures
Figure 2.1. Growth stages of a polymer spherulite with chain-folded lamellae ............................ 3
Figure 2.2. Spherulitic growth rate vs. crystallization temperature for isotactic polystyrene ....... 4
Figure 2.3. Lamellar thickness as a function of crystallization temperature for polyethylene ...... 5
Figure 2.4. Lamellar thickness as a function of crystallization time for polyethylene .................. 5
Figure 2.5. Linear Hoffman-Week extrapolation and nonlinear fit. .............................................. 7
Figure 2.6. Schematic of a chain-folded lamellar single crystal .................................................... 9
Figure 2.7. Schematic describing the secondary nucleation and the substrate completion processes
.............................................................................................................................................. 10
Figure 2.8. Sketch of the different stages in the formation of polymer crystallites according to
Strobl et al ............................................................................................................................. 11
Figure 2.9. DSC melting traces of PEO crystallized at 56.2 °C for different times .................... 13
Figure 2.10. DSC melting traces (heating rate of 10 K/min) of PEEK crystallized at 300 °C for
different times ...................................................................................................................... 14
Figure 2.11. Evolution of the low endotherm temperature with crystallization time at different
temperatures for PEEK (heating rate of 10 K/min). ............................................................ 15
Figure 2.12. Evolution of the low endotherm enthalpy of fusion with crystallization time at
different crystallization temperatures for PEEK (heating rate of 10 K/min). ...................... 15
Figure 2.13. Secondary crystal formation model by Marand et al............................................... 16
Figure 2.14. Melting of 400 ng to 4 mg it-PS samples at different heating rates ........................ 19
Figure 2.15. Inclusion model and exclusion model ..................................................................... 20
Figure 2.16. Molecular structure comparisons for three different ethylene copolymers ............. 22
Figure 2.17. Four types of CGCT copolymers ............................................................................ 23
Figure 2.18. Volume-temperature plot around the glass transition temperature .......................... 24
Figure 2.19. Aging rate obtained from tensile creep data ............................................................ 25
Figure 2.20. Semi-log plot of tan δ (1 Hz) for it-PP after different aging times at 23 °C ........... 26

viii
Figure 2.21. Creep behavior of isotactic poly(propylene) aging at 70 °C ................................... 26
Figure 2.22. Idealized aging rate, µ, vs. temperature for semicrystalline polymers .................... 27
Figure 2.23. Struik’s model of physical aging ............................................................................. 28
Figure 2.24. Evolution of creep compliance with time (Struik’s model) ..................................... 28
Figure 2.25. Evolution of creep compliance with time (McCrum and Reads’ model) ................ 29
Figure 2.26. Evolution of the low temperature endotherm position with time between 0 °C and
60 °C for ethylene/1-octene copolymer with 12.3 mol% octene ......................................... 30
Figure 2.27. Definition of the cross-over temperature (TCO) from the crystallization temperature
Tx dependence of B(Tx) for BAPC ...................................................................................... 31
Figure 2.28. Marand’s model of physical aging: segmental mobility below TCO ........................ 32
Figure 2.29. Evolution of B as a function of the dimensionless temperature, θ. ......................... 33
Figure 2.30. Evolution of the low endotherm heat of fusion for EO-12.3 after crystallization at
20oC for different times ....................................................................................................... 34
Figure 3.1. Creep test schedule for aging studies ........................................................................ 38
Figure 4.1. Evolution of the melting behavior of EO-12.3 after quenching from 160 to 23 °C,
residence at 23 °C for various times and subsequent quenching to -17 °C ......................... 40
Figure 4.2. Evolution of the low temperature endotherm of EO-12.3 after quenching from 160 to
23 °C, residence at 23 °C for various times and subsequent quenching to -17 °C .............. 41
Figure 4.3. DSC heating scans of EO-12.3, crystallized for 10 hours at various temperatures ... 42
Figure 4.4. Evolution of Tmlow
with crystallization temperature Tx (crystallized for 10 hours) .. 43
Figure 4.5. Variation of Tmlow
for various temperatures as a function of time for EO-12.3 ........ 44
Figure 4.6. Evolution of B(Tx) with Tx for EO-12.3 (cooling at 20 K/min and heating at 10 K/min).
.............................................................................................................................................. 45
Figure 4.7. Evolution of B(Tx) with Tx for EO-8.2 (cooling at 20 K/min and heating at 10 K/min).
.............................................................................................................................................. 45
Figure 4.8. Evolution of B(Tx) with Tx for EO-3.4 (cooling at 20 K/min and heating at 10 K/min).
.............................................................................................................................................. 46

ix
Figure 4.9. B(Tx) vs. octene mol% at 23oC.................................................................................. 47
Figure 4.10. Change of segmental mobility with B(Tx) for three EO-copolymers ...................... 48
Figure 4.11. Evolution of the DSC fractional degree of crystallinity with residence time at 23oC
for EO-12.3 .......................................................................................................................... 49
Figure 4.12. Evolution of the density as a function of time at 23 oC for EO-3.4. ........................ 50
Figure 4.13. Evolution of the density as a function of time at 23 oC for EO-8.2. ........................ 51
Figure 4.14. Evolution of the density as a function of time at 23 oC for EO-12.3. ...................... 51
Figure 4.15. Slopes D(T) of density vs log t vs. octene mol% at 23oC ....................................... 52
Figure 4.16. Evolution of the fractional degree of crystallinity with residence time at 23oC for
EO-12.3 from density measurements ................................................................................... 53
Figure 4.17. Creep study at 30oC for EO-3.4 ............................................................................... 54
Figure 4.18. Creep study at 30oC for EO-8.2 ............................................................................... 55
Figure 4.19. Creep study at 30oC for EO-12.3 ............................................................................. 55
Figure 4.20. Creep study after 1 hour aging ................................................................................ 56
Figure 4.21. Creep study after 3 hours aging. .............................................................................. 57
Figure 4.22. Creep study after 9 hours aging. .............................................................................. 57
Figure 4.23. Creep rate as a function of copolymer composition for different aging times (1 hour,
3 hours and 9 hours) ............................................................................................................. 58
Figure 4.24. Multiple melting behavior of EO-12.3 (crystallizes at 233.15 K for 20 minutes) .. 59
Figure 4.25. Multiple melting behavior of PEEK (crystallizes at 573.15 K for 15 minutes, then
quenches to 513.15 K and crystallizes for 15 min) .............................................................. 60
Figure 4.26. Change of B(Tx) with T for PEEK (heating at 10 K/min) ....................................... 62
Figure 4.27. Evolution of D(T) and B(T) with octene content by density and DSC measurements.
.............................................................................................................................................. 64
Figure 4.28. Creep study of EO-copolymers after 6.7 minutes aging ......................................... 66

x
List of Tables
Table 3.1.1 Characteristics of EO-copolymers ............................................................................ 35
Table 4.1.1 Tg and TCO of EO-copolymers .................................................................................. 48
Table 4.1.2 Summary of the slopes of density vs. log t for EO-copolymers at 23oC .................. 52

1
Chapter 1. Introduction
The goal of this research project is to understand the origin of the time dependence of the
structure and physical properties of ethylene/1-octene (EO)-copolymers, and the possible
correlations between physical aging, secondary crystallization, and
melting-recrystallization-remelting. Three different types of experimental techniques are used,
namely, differential scanning calorimetry (DSC), density, and creep.
Chapter 2 introduces the background of bulk crystallization (primary and secondary
crystallization); melting of semicrystalline polymers and copolymers, morphology of
EO-copolymers; and physical aging. Chapter 3 provides the experimental details associated with
these investigations, including the material characteristics (octene content, weight average
molecular weight (Mw), polydispersity index (PDI) and density) and the conditions under which
experimental techniques (DSC, density, and creep) were utilized. Chapter 4 gives the results of
these measurements and the discussion of the time dependent physical properties. Chapter 5
provides conclusions and suggests future studies.

2
Chapter 2. Background
2.1 Crystallization
Bulk crystallization occurs in two stages: primary crystallization and secondary
crystallization. This review first focuses on flexible chain homopolymers without structural or
compositional defects and only considers quiescent crystallization (no orientation) from the melt,
because such materials rarely exhibit multiple-melting behavior. The special case of copolymers
is dealt with subsequently.
2.1.1 Primary Crystallization
Primary crystallization is the process associated with the formation of semicrystalline
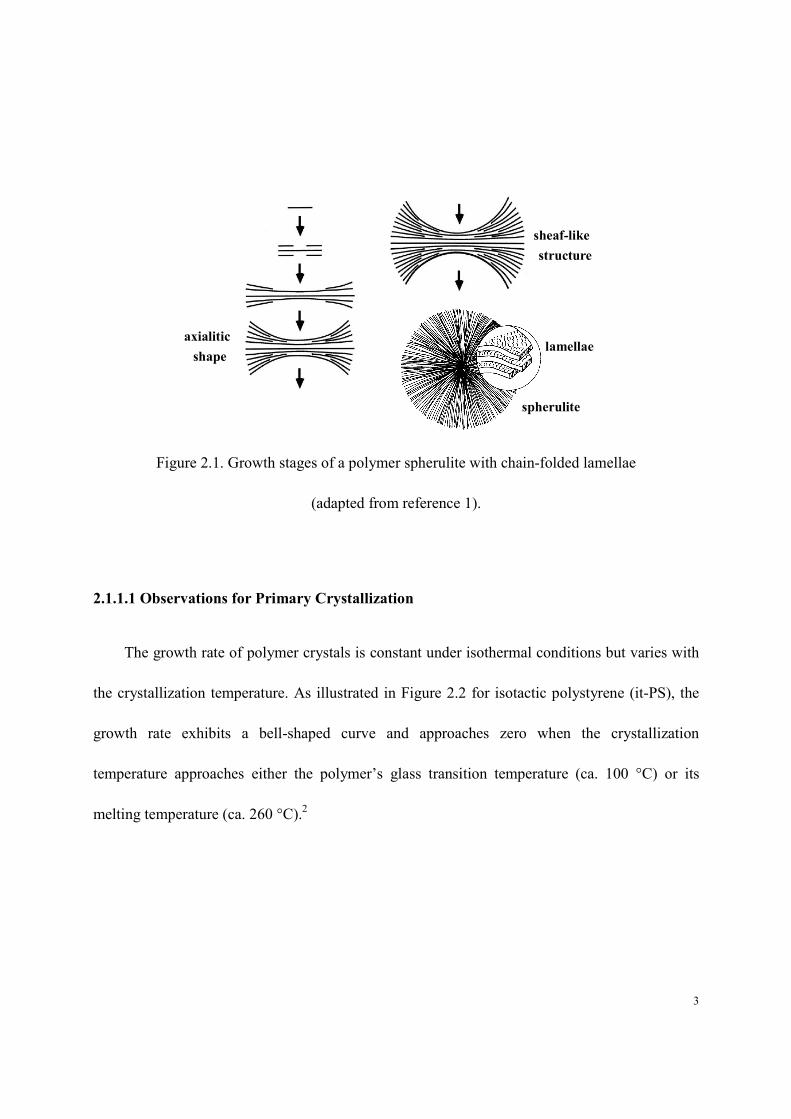
superstructures (hedrites, axialites, and, most frequently, spherulites). The growth stages
associated with primary crystallization are illustrated in Figure 2.1, for a polymer spherulite
consisting of chain-folded lamellar crystals: 1) a primary nucleus leads to the formation of a
single crystal; 2) a multiple layer crystal results from screw dislocations; 3) repeated branching
and splaying of lamellae leads to an axialite, then, to a sheaf-like structure, and finally to a
spherulite.1 The end of the primary crystallization stage is marked by the impingement of
neighboring spherulites initiated by different nuclei.
3
Figure 2.1. Growth stages of a polymer spherulite with chain-folded lamellae
(adapted from reference 1).
2.1.1.1 Observations for Primary Crystallization
The growth rate of polymer crystals is constant under isothermal conditions but varies with
the crystallization temperature. As illustrated in Figure 2.2 for isotactic polystyrene (it-PS), the
growth rate exhibits a bell-shaped curve and approaches zero when the crystallization
temperature approaches either the polymer’s glass transition temperature (ca. 100 °C) or its
melting temperature (ca. 260 °C).2
axialitic
shape
sheaf-like
structure
spherulite
lamellae

4
Figure 2.2. Spherulitic growth rate vs. crystallization temperature for isotactic polystyrene
(adapted from reference 2).
Another general observation is that lamellar crystals are thin chain-folded plate-like
structures, where the thin dimension is along the chain axis and the basal crystal planes contain
the chain folds. The average thickness of lamellae increases with crystallization temperature,
more significantly so, when crystallization occurs at lower undercooling (Figure 2.3).3 Lamellar
crystals are sometimes observed to thicken with increasing crystallization time (Figure 2.4).4
This thickening process is driven by the increase in crystal stability associated with the decrease
in the crystal surface area to volume ratio.

5
Figure 2.3. Lamellar thickness as a function of crystallization temperature for polyethylene
(adapted from reference 3).
Figure 2.4. Lamellar thickness as a function of crystallization time for polyethylene
(adapted from reference 4).
6
2.1.1.2 Melting Behavior of Polymer Crystals
The melting temperature is one of the most important thermodynamic properties of a
crystallizable polymer. The melting temperature observed experimentally depends on the
conditions under which the polymer is crystallized. Several models have been proposed to
evaluate the equilibrium or thermodynamic melting point, Tm. The Hoffman-Weeks analysis,5
which is based on predictions from the Lauritzen-Hoffman kinetic theory6 of crystallization,
proposes a linear relationship between observed melting temperature, Tm´, and crystallization
temperature, Tx, at relatively small undercooling:
xmm TTTγγ11
1' +
−= (2.1)
where γ is the coefficient of thickening of the lamellae. The equilibrium melting temperature is
determined in a Tm´ vs. Tx plot from the intercept of the extrapolated linear relationship between
Tm´ and Tx with the line Tm´ = Tx (Figure 2.5).
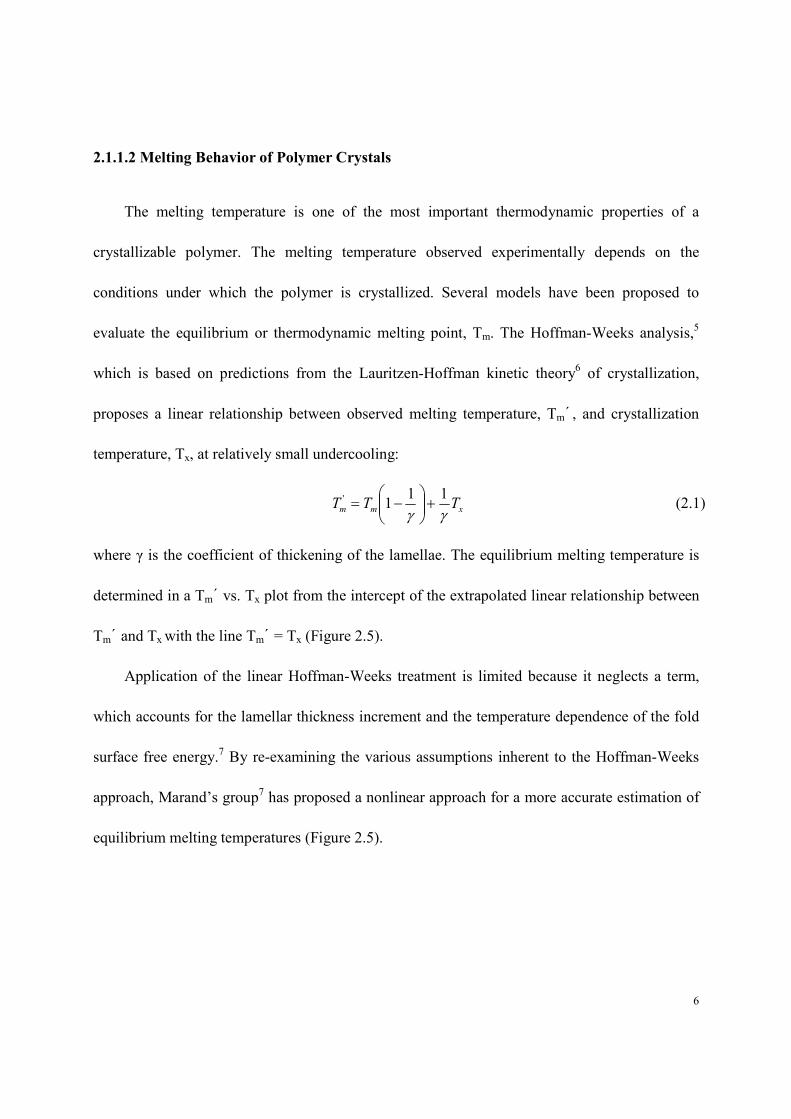
Application of the linear Hoffman-Weeks treatment is limited because it neglects a term,
which accounts for the lamellar thickness increment and the temperature dependence of the fold
surface free energy.7 By re-examining the various assumptions inherent to the Hoffman-Weeks
approach, Marand’s group7 has proposed a nonlinear approach for a more accurate estimation of
equilibrium melting temperatures (Figure 2.5).
7
Figure 2.5. Linear Hoffman-Week extrapolation and nonlinear fit.7
Recently, in a significant departure from conventional wisdom, Strobl and coworkers8-14
proposed that crystallization occurs from a mesomorphic phase rather than from the isotropic
phase and defined different thermodynamic temperatures for crystallization (mesomorphic to
crystal) and melting (crystal to isotropic melt). On the basis of time- and temperature-dependent
small angle X-ray scattering (SAXS) measurements, they suggest that the equilibrium
crystallization temperature is always higher than the equilibrium melting temperature.12
They
also suggest that the equilibrium melting and crystallization temperatures are both higher than
the zero growth temperature, which is the temperature controlling the growth rate of polymer
crystals. The zero growth temperature is the temperature associated with the equilibrium between
the isotropic and the mesomorphic phases.

8
2.1.1.3 Abbreviated Kinetic Theory of Polymer Crystallization
Observation of linear growth (crystal growth rate is independent of time) and of a strong
temperature dependence of crystallization rates have led to suggestions that polymer crystal
growth is controlled by secondary nucleation.6 In this context, the rate of crystal growth is a
function of the driving force for crystallization and the barrier to secondary nucleation.
The Lauritzen-Hoffman (LH) theory is one of the main kinetic theories of polymer
crystallization.6, 15-18
According to the LH theory, the free energy change for the formation of a
lamellar crystal at Tx, ∆Gc(Tx), can be used to describe the driving force quantitatively.
If we denote X and Y as the lateral crystal dimensions, l as the crystal thickness, σ as the
lateral surface free energy, and σ e as the fold surface free energy, we can express∆Gc(Tx) as
follows for the crystal shown in Figure 2.6 after neglecting the small σ -containing term:
∆Gc(T) = 2σ eXY(1 - l/lmin) (2.2)
where lmin = 2 σ e / ∆ Gf0(Tx), which is the minimum possible crystal thickness at the
crystallization temperature, Tx. In equation 2.2, ∆Gf0(Tx) is the bulk free energy of fusion per
unit volume of crystal at the crystallization temperature. This quantity is well approximated by
∆Gf0(Tx) ~ ∆Hf
0(Tx) (Tm - Tx)/Tm, where ∆Hf
0 is the bulk heat of fusion of the polymer crystal
per unit volume.

9
Figure 2.6. Schematic of a chain-folded lamellar single crystal (adapted from reference 15).
The larger the lamellar thickness, the larger the free energy change during crystallization, the
larger the driving force. On the other hand, the free energy barrier for nucleation increases with
lamellar thickness. The rate of crystallization is the result of the interplay between the free
energy barrier for nucleation and the driving force. The LH nucleation theory assumes that
crystal growth occurs by a chain folding mechanism. The two-step kinetically controlled
mechanism (Figure 2.7) consists in the deposition of an initial stem on a clean surface
(nucleation), and the subsequent and repeated folding of the rest of the chain to complete the
layer (substrate completion). As both the driving force for crystallization and the barrier to
nucleation increase with the lamellar thickness, l, an optimum lamellar thickness is required to
maximize the growth rate at each crystallization temperature.

10
Figure 2.7. Schematic describing the secondary nucleation and the substrate completion
processes (adapted from reference 6).
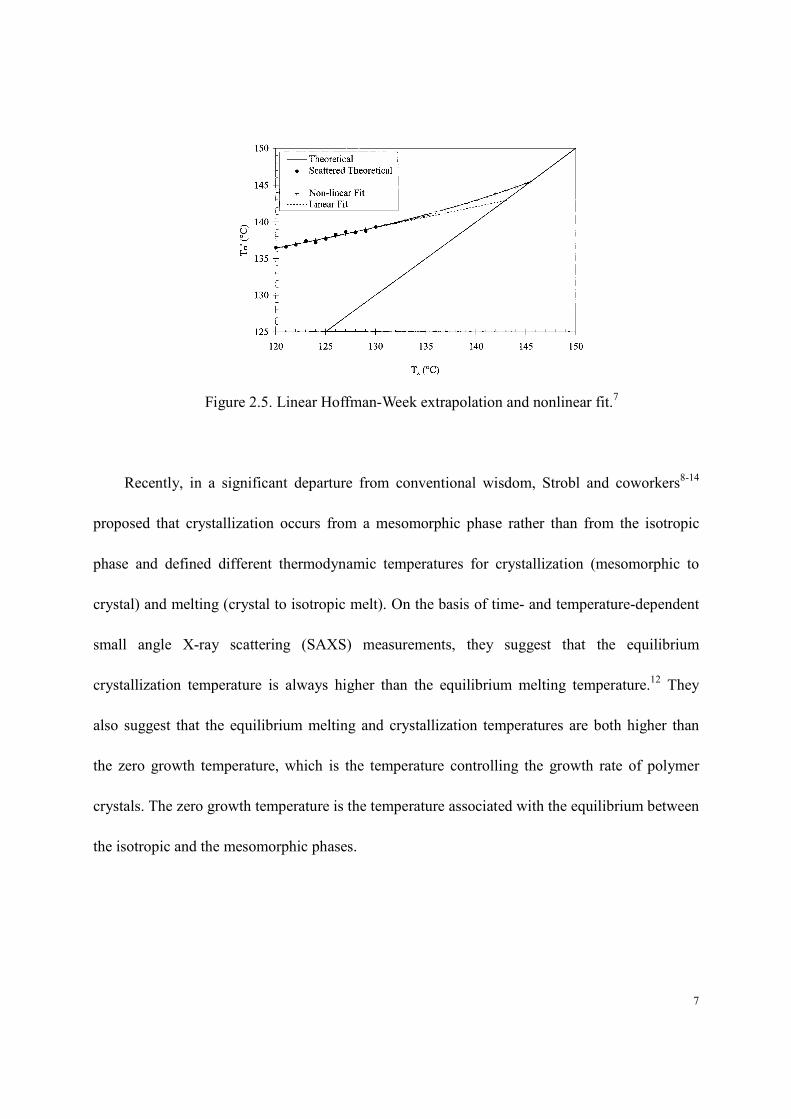
Strobl11, 14
proposed another model for polymer crystallization, which suggests that the
formation and growth of the crystallites is a multi-step process involving the formation of a
mesomorphic layer by attachment of chains onto the growth front. The mesomorphic layer
thickens with time as the mobility of chains within this phase is high. Solidification occurs by a
structural transition when the mesomorphic layer reaches a critical thickness. A “granular crystal
or block” is used to describe the resulting structure. The last step is the increase in internal
perfection by merging the blocks together. This model is proposed based on the experiments
carried out by Strobl et al.11, 14 (SAXS and DSC experiments), Kanig et al.19 (observation of
mesomorphic layers prior to the formation of the PE lamellar crystallites by transmission
electron microscopy), Rastogi et al.20
(observation by optical microscopy of a two step process
during the formation of PE crystallites under high pressure), and Okada et al.21
(observation by
11
light scattering of density fluctuations in the melt prior to the appearance of the first crystallites
in the case of it-PP). Figure 2.8 provides a snapshot of the transformation of the melt into the
final lamellar crystallite.
Figure 2.8. Sketch of the different stages in the formation of polymer crystallites according to
Strobl et al. 11
The differences between the LH and the Strobl models are: 1) the LH model considers only
two phases (liquid phase and crystalline phase) while the Strobl model also considers an
intermediate mesomorphic phase; 2) the LH model assumes a chain folding process, where the
chains attach to the growth front in a crystallographic fashion, whereas the Strobl model assumes
neither chain folding nor crystallographic registration during the first stage. Hence, the
undercooling below the melt to mesomorphic transition controls the crystal growth rate.

12
2.1.1.4 Crystallinity
Crystallization is a function of thermodynamics and kinetics. Sections of polymer chains
that are rejected or trapped between crystal lamellae during crystallization will generate an
amorphous phase. As crystallization is never complete, a degree of crystallinity is introduced and
denoted by Xc (also referred to as "crystallinity index", or "percent crystallinity"). When
crystallinity is expressed as the fraction of the total mass exhibiting crystalline order, we can
write:
ca
cc
mm
mX
+= (2.3)
where mc is the mass of the crystalline phase and ma is the mass of the amorphous phase. Using
this definition, any intensive property P of a semicrystalline polymer can be represented by a
weighted average of the "partial properties" of the crystalline and the amorphous components-Pc
and Pa22
P = Xc Pc + Xa Pa (2.4)
where Xa = 1 - Xc. Equation 2.4 corresponds to the 2-phase model of semicrystalline polymers.
2.1.2 Secondary Crystallization
It has been widely reported23-26
that many physical properties of semicrystalline polymers,
such as the density or the modulus, still increase after primary crystallization, as a result of a
further increase in crystallinity. The term “secondary crystallization” is used to describe the

13
increase in the degree of crystallinity with time after the growth and impingement of spherulites.
On the basis of calorimetric studies of the melting behavior of semicrystalline polymers,
one can distinguish two classes of secondary crystallization processes. In the case of high
crystallinity flexible polymers, such as poly(ethylene oxide) (PEO) and linear polyethylene (PE),
the melting behavior is characterized by a single melting endotherm (Figure 2.9).5, 27-29
Secondary crystallization is only observed at high temperature close to the melting point
(undercooling of 20 K for PEO). The crystallinity increases slowly over decades of time.
Figure 2.9. DSC melting traces of PEO crystallized at 56.2 °C for different times (adapted
from reference 30).
In the case of polymers with relatively low crystallinity, such as semiflexible polymers with
large repeat units or polymers with short branches, noncrystallizable comonomers, or stereo- or
regio-defects, the melting behavior often exhibits multiple endotherms (Figure 2.10).7, 30, 31
Time increases

14
Figure 2.10. DSC melting traces (heating rate of 10 K/min) of PEEK crystallized at 300 °C for
different times.31
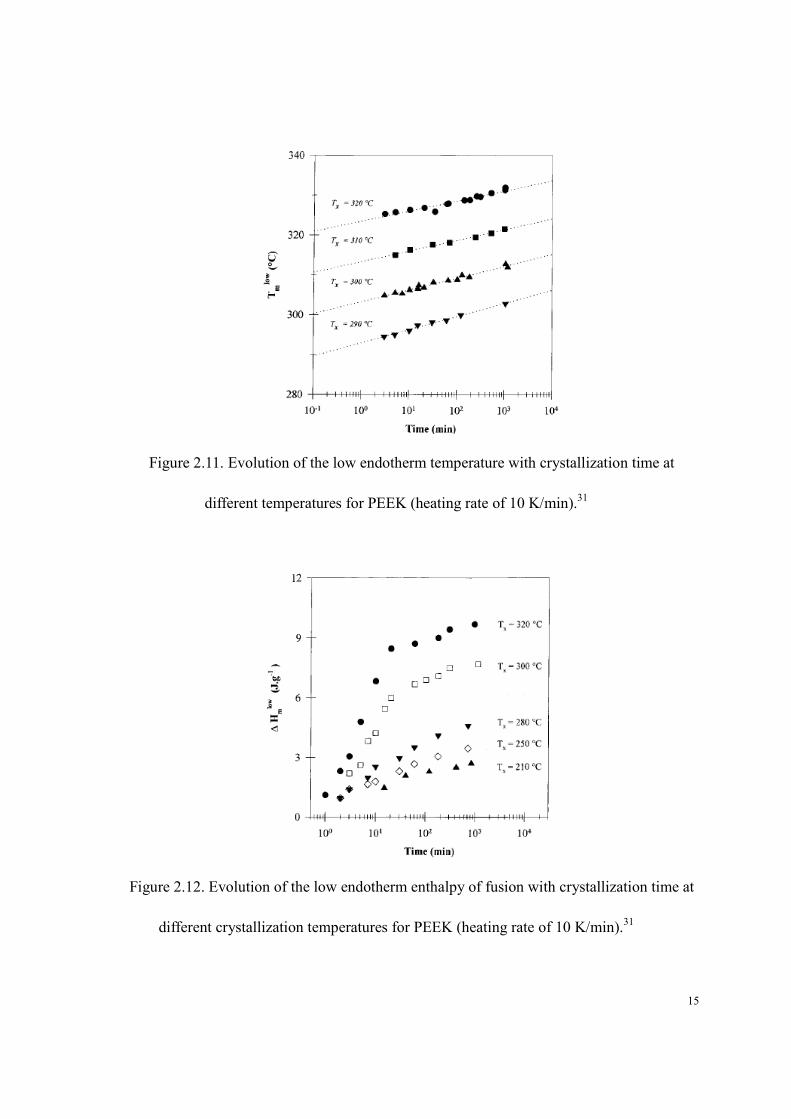
The melting temperature (Figure 2.11) and the heat of fusion (Figure 2.12) associated with
the low temperature endotherm increase with crystallization time while these associated with the
high temperature endotherm remain constant.
15
Figure 2.11. Evolution of the low endotherm temperature with crystallization time at
different temperatures for PEEK (heating rate of 10 K/min).31
Figure 2.12. Evolution of the low endotherm enthalpy of fusion with crystallization time at
different crystallization temperatures for PEEK (heating rate of 10 K/min).31

16
Several models have been proposed for the origin of the double endothermic behavior.
Strobl11, 14
suggested that the low temperature endotherm is associated with the melting of
isolated (hence, of lower stability) crystal blocks, while the high temperature endotherm
corresponds to the melting of crystal blocks that have merged (more stable). The increase in low
endotherm temperature with time arises as a result of crystal perfection. The formation of
isolated and merged crystal blocks is described in Figure 2.8.
Another model, proposed a decade ago by Marand and coworkers7, 30-32
argues that the low
temperature endotherm is associated with the melting of secondary crystals, which form
predominantly after the growth of primary crystals, and the high temperature endotherm
corresponds to the melting of primary crystals (Figure 2.13).
Figure 2.13. Secondary crystal formation model by Marand et al.
(adapted from reference 32).
This model was proposed based on broad and detailed evidence from a large number of

17
DSC, small angle X-ray scattering, and atomic force microscopy investigations on several
semicrystalline polymer systems: EO-copolymers;7 PEEK;
31, 33-37 bisphenol-A polycarbonate
(BAPC) ;30, 38
poly(ethylene terephthalate) and ethylene-styrene interpolymer;32
isotactic
polypropylene, it-PS, and nylon-6 (unpublished work by Marand’s group). Evolution of the
heat of fusion with crystallization time led to Avrami exponents in the range of 2 to 4 for the
high temperature endotherm, and around 0.5 for the low temperature endotherm. Different
crystallization mechanisms were thus proposed to explain the different behaviors of the high
temperature endotherm (melting of primary crystals) and the low temperature endotherm
(melting of secondary crystals). A melting study of low molecular weight BAPC using heating
rate in the range of 5 to 20 K/min showed unambiguously that the multiple melting behavior was
associated with a melting-recrystallization-remelting process (see below).38
However, a similar
study with high molecular weight BAPC in a somewhat larger range of heating rates (2.5 to 20
K/min) indicated that the shape and position of the high temperature endotherm were not
significantly affected by the change in heating rate, suggesting that
melting-recrystallization-remelting process did not occur on the time scale associated with
heating in the DSC. The other possibility, that melting-recrystallization-remelting occurred too
fast to be observed even at 20 K/min heating, was dismissed at the time, based on the assumption
that the rate of melting-recrystallization-remelting should decrease with increasing molecular
weight. Furthermore, comparative DSC31
and real time small angle X-ray scattering (SAXS)33
studies of PEEK crystallized from the glass or from the melt did not provide support for the
melting-recrystallization-remelting mechanism.

18
To explain the frequently observed multiple melting behavior, a number of investigators
have often quoted the melting-recrystallization-remelting mechanism.39-41
This mechanism
proposes that the low temperature endotherm is associated with the melting of crystals present in
the as-crystallized sample (Figure 2.1), while the high temperature endotherm is due to the
melting of the material, which has recrystallized during the heating scan above the low
temperature endotherm. Until recently there has been very little evidence to support this
mechanism, because, as stated in the above paragraph, heating experiments using conventional
rates in the range of 1 to 40 K/min in a calorimeter or even in a small angle X-ray scattering or
wide angle X-ray diffraction set-up had generally failed to show significant heating rate effects.
The recent development of nano-calorimeters by Allen et al.42, 43 and their improvement by
Schick et al., 44-47
now allows melting traces to be recorded at heating rates up to 106 K/s. A
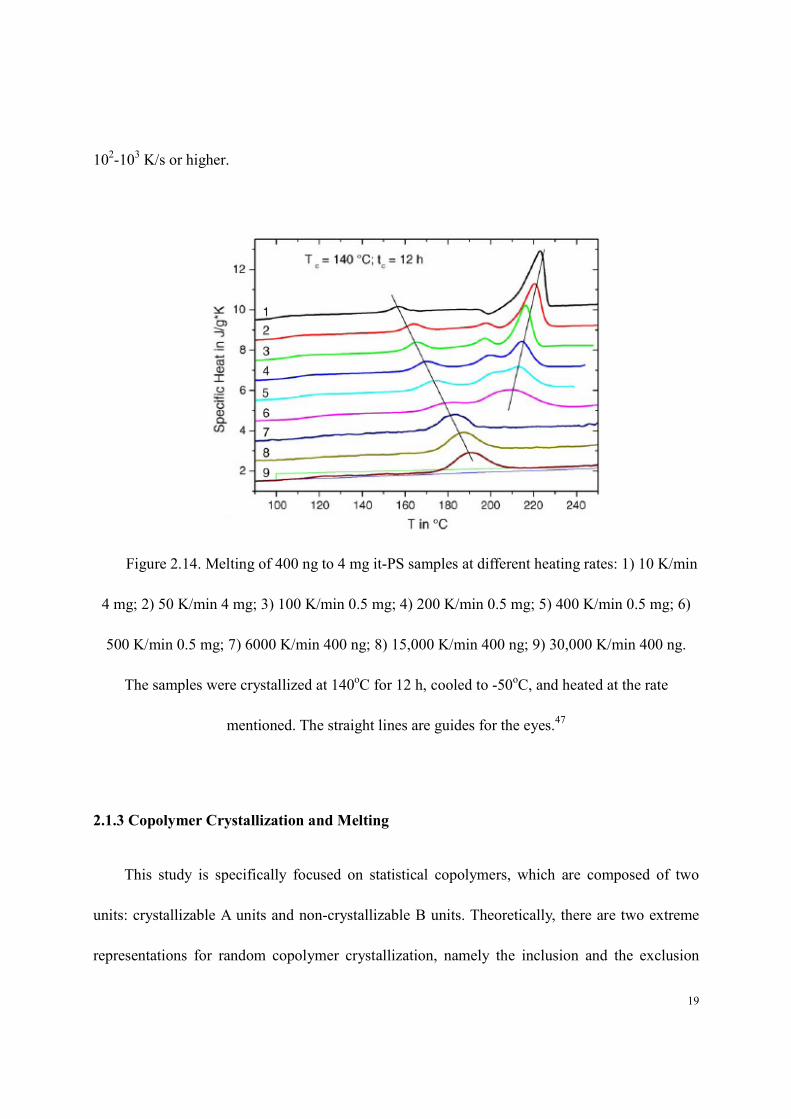
melting study47
of it-PS showed that the lower and upper endotherms merge into a single
endotherm, when the heating rate reaches ca. 100 K/s (Figure 2.14). A similar conclusion was
reported for PET for a heating rate of ca. 1000 K/s.39
One of the major assumptions made in the elaboration of the secondary crystal formation
model was that with a proper choice of the heating rate, it is possible to identify whether or not
melting-recrystallization-remelting occurs. Limited by the techniques that were available a
decade ago, changing the heating rate by an order of magnitude (such as 5-40 K/min for PEEK
and 2.5-20 K/min for BAPC) was thought to be sufficient to identify the reorganization of
crystals during heating. Recent chip calorimetry studies suggest that recrystallization occurs
extremely rapidly during heating and can only be suppressed with heating rates on the order of
19
102-10
3 K/s or higher.
Figure 2.14. Melting of 400 ng to 4 mg it-PS samples at different heating rates: 1) 10 K/min
4 mg; 2) 50 K/min 4 mg; 3) 100 K/min 0.5 mg; 4) 200 K/min 0.5 mg; 5) 400 K/min 0.5 mg; 6)
500 K/min 0.5 mg; 7) 6000 K/min 400 ng; 8) 15,000 K/min 400 ng; 9) 30,000 K/min 400 ng.
The samples were crystallized at 140oC for 12 h, cooled to -50
oC, and heated at the rate
mentioned. The straight lines are guides for the eyes.47
2.1.3 Copolymer Crystallization and Melting
This study is specifically focused on statistical copolymers, which are composed of two
units: crystallizable A units and non-crystallizable B units. Theoretically, there are two extreme
representations for random copolymer crystallization, namely the inclusion and the exclusion

20
models, which are illustrated in Figure 2.15. In the inclusion model, the copolymer may form a
two-phase system with the crystalline phase as a solid solution of A and B units where the co-
monomer B units act as defects in the crystalline A lattice. If the defect energy is sufficiently
small, both phases have the same composition. In the exclusion model, the copolymer forms a
two phase system with the crystalline phase composed entirely of A units and the amorphous
phase composed of a mixture of A units and noncrystallizable B units.
Figure 2.15. Inclusion model (left) and exclusion model (right) (adapted from reference 49).
Flory’s thermodynamic equilibrium theory of random copolymer crystallization48-51
considers the case where B units are defects that are completely excluded from the crystalline A
lattice. Based on Flory’s theory, the equilibrium melting temperature of a copolymer, Tm, is
related to T0m, the equilibrium melting temperature of the parent (A) homopolymer:
1/ Tm – 1/ T0
m = – (R/ ∆Hu) ln p (2.5)
where, R = gas constant, ∆Hu = the heat of fusion per mole of unit of A, and p = the probability
that an A unit is succeeded by another A unit without being influenced by the nature of the

21
preceding unit.
From Equation 2.5, it is obvious that the equilibrium melting temperature in Flory’s theory
does not depend on the chemical nature of the B units. The decrease in melting temperature and
crystallinity due to copolymerization is only related to the amount of B units and is not
influenced by the chemical nature of the noncrystallizable comonomer.
2.1.4 Crystallization, Melting and Morphology of Ethylene/1-Octene Copolymers
Mandelkern’s group52 investigated the crystallization and melting behavior of different
kinds of ethylene copolymers. For ethylene/α-olefin copolymers, except for the copolymers
containing propylene as a comonomer, the melting temperature is independent of the chemical
nature of the comonomer, as long as a sequence distribution is well approximated by the
binomial distribution (random copolymerization). Several properties such as the density, the
enthalpy of fusion, and the crystallite thickness are found to decrease steadily with increasing
comonomer content. These properties are highly dependent on co-unit concentration but
independent of co-unit type. Peeters et al.53
reported that increasing the octene content decreases
the crystallization and melting temperatures, crystallinity, spherulite radius, long period, and
crystalline lamellar thickness. On the basis of these studies, one can conclude that
ethylene/1-octene copolymers follow Flory’s exclusion model.
The EO-copolymers studied in the present work were prepared at the Dow Chemical
Company using the constrained geometry catalyst (metallocene) technology (CGCT). The

22
microstructures of EO-copolymers made by CGCT differ significantly from these of copolymers
made by conventional Ziegler-Natta catalysts. Conventional Ziegler-Natta catalysts are
heterogeneous in nature. Hence, they have multiple active sites with different reactivity ratios for
ethylene and various α-olefins. The copolymers produced by Ziegler-Natta catalysts have
broader molecular-weight distributions (MWD) and short-chain branching distribution (SCBD).
On the other hand, constrained geometry catalysts, and metallocene catalysts in general, exhibit a
single active site that controls the composition distribution. In addition, CGCT allows the
addition of vinyl-ended polymer chains to produce long-chain branching (LCB). Benefits of
LCB are improved processability, shear sensitivity for high-rate extrusion, and melt strength for
film stability and drawdown in film-blowing applications. Figure 2.16 illustrates the molecular
structure of three ethylene/α-olefin copolymers: conventional linear low density polyethylene
(LLDPE) made by Ziegler-Natta catalyst, homogeneous copolymers made by other metallocene
technology catalysts (MTC’s), and substantially linear homogeneous copolymers made by
CGCT.54
Figure 2.16. Molecular structure comparisons for three different ethylene copolymers
(adapted from reference 54).

23
A study by Moet et al.55
showed that CGCT ethylene/1-octene copolymers can be classified
into one of four groups (Figure 2.17). Type IV materials exhibit a lamellar morphology with
well-developed spherulites. Type III copolymers form smaller spherulites with thinner lamellae
than the homopolymer. For type II copolymers, spherulites, which contain both bundled crystals
and lamellar crystals, are poorly developed and unbanded. Type I copolymers are those with low
degree of crystallinity, low melting temperature, absence of cooling rate effects, absence of
spherulites and the granular, and nonlamellar morphology.
Figure 2.17. Four types of CGCT copolymers (adapted from reference 55).

24
2.2 Physical Aging
When an amorphous polymer is rapidly cooled to a temperature, T, below the glass
transition temperature, Tg, its physical properties are observed to depend on the residence time at
T. The change in the physical properties with time are the result of a change in the physical state
of the material and indicates that a material below its glass transition temperature is generally in
a non-equilibrium state.56, 57 The change in properties with time is called “physical aging” to
distinguish it from the chemical aging generally associated with thermal degradation,
photo-oxidation, etc. During physical aging, a material is gradually evolving toward the
equilibrium liquid state.58, 59
Several attempts to describe the origin of physical aging have been
offered. Kovacs suggested that the origin of physical aging is related to the evolution of the
polymer’s free volume, as shown in Figure 2.18.60
At temperatures below the glass transition
temperature (Tg), the specific volume and mobility of the amorphous phase decrease with time.
In other words, the non-equilibrium state gradually approaches the equilibrium state.
Figure 2.18. Volume-temperature plot around the glass transition temperature (adapted from
reference 60).

25
Creep is a widely used method for studying physical aging. Struik performed a substantial
amount of pioneering work on physical aging.61-66
Struik has shown that at low deformations (in
the linear viscoelastic regime) and below Tg, the creep compliance curves (measured here in
tension) for different aging times can be superimposed on one reference aging time by shifts
along the time axis to make a master curve. When plotting the shift factor ata versus the aging
time, ta, on a double logarithmic graph, a straight line is obtained. The slope of this line is known
as the shift rate or the aging rate, µ, as shown in Figure 2.19.
Figure 2.19. Aging rate obtained from tensile creep data.70
Semicrystalline polymers have a non-negligible amorphous component and exhibit strong
aging effects below their glass transition temperature. Rather unexpectedly, however, they also
show strong aging behavior above their glass transition temperature, as shown for isotactic
polypropylene (it-PP) at room temperature (Figure 2.20).63
During aging, changes in compliance

26
as large as 40-60% can be observed (Figure 2.21).71
Figure 2.20. Semi-log plot of tan δ (1 Hz) for it-PP after different aging times at 23 °C.63
Figure 2.21. Creep behavior of isotactic poly(propylene) aging at 70 °C (adapted from
reference 71).

27
Figure 2.22. Idealized aging rate, µ, vs. temperature for semicrystalline polymers.70
It is important to know the relationship between the aging rate and the temperature. An
idealized plot of aging rate µ versus temperature is shown in Figure 2.22. To explain the
observation of different regimes of aging at different temperatures, Struik proposed the model of
an extended glass transition.62-65
According to Struik, the constraints exerted on the amorphous
chains by the crystalline fraction causes a distribution of Tg values, between a lower Tg (TgL),
identifiable with the nominal Tg of the amorphous polymer, and an upper Tg (TgU), which is the
Tg of the amorphous fraction most constrained by the proximity of the crystalline lamellae. The
aging rates are different in the three regions defined by TgL and Tg
U. There is no aging above Tg
U
since above TgU the entire amorphous fraction is mobile. Between Tg
L and Tg
U both the
constrained and relaxed amorphous fractions exhibit aging, while only the mobile amorphous
fraction ages below TgL. Figure 2.23 illustrates Struik’s model.

28
Figure 2.23. Struik’s model of physical aging.70
Struik’s work is pioneering but may be inadequate for semicrystalline polymers. He
assumes that during aging there is no change in the shape of the relaxation spectrum (Figure
2.24). McCrum67 and Read68 suggest that creep curves for different aging times cannot be
superimposed on one reference aging time by only shifts along the time axis because the shape of
the relaxation spectrum does change (Figure 2.25). The relaxation strength (∆D = DR - DU)
decreases due to the fact that the relaxed compliance (DR) decreases more than the unrelaxed
compliance (DU) during aging. Since aging affects DU, DR and ∆D, it will also affect the
calculated shift factor, ata.
Figure 2.24. Evolution of creep compliance with time (Struik’s model) (adapted from
reference 67).

29
Figure 2.25. Evolution of creep compliance with time (McCrum and Reads’ model)
(adapted from reference 67).
DSC may be another method to study physical aging. DSC has been used in the past to
study the physical aging of amorphous glasses. Hodge et al. discussed the enthalpy relaxation
phenomenon in amorphous materials, and the observed shift in the enthalpy recovery peak with
aging temperature and time.72-78
Crystallization studies of semicrystalline polymers also lead to
the formation of an endothermic transition some 10 to 30 K above the crystallization temperature.
Several studies7, 30, 31
suggest that for a given crystallization temperature (Tx), the peak
temperature of the low temperature endotherm, Tmlow
, increases linearly with the logarithm of
crystallization time (Figure 2.26). We can define parameters A(Tx) and B(Tx) for each
crystallization temperature by:
Tmlow
(Tx) = Tx + A(Tx) + B(Tx) log(tx) (6)

30
Figure 2.26. Evolution of the low temperature endotherm position with time between 0 °C
and 60 °C for ethylene/1-octene copolymer with 12.3 mol% octene.7
Theoretically, there are three ways to explain the change in any property P of a
semicrystalline polymer with time: 1) a change in the crystalline phase only; 2) a change in the
amorphous phase only; 3) a change in both phases. In this work, we suggest that physical aging
above the glass transition temperature involves both the crystalline and amorphous fractions.
That is
P(t) = Xc(t) Pc(t) + Xa(t) Pa(t) (2.7)
In contrast to Struik, who considered that aging above Tg is only associated with a
densification of the constrained amorphous phase, Marand et al.7, 30-32
suggested that physical
aging is a consequence of secondary crystal formation, a process, which affects both the
crystalline and amorphous phases. In this model, secondary crystals would act as cross-linking

31
sites for the remaining amorphous segments, hence, cause the observed evolution of the
mechanical properties. The change in the mechanical properties is due to both the change in Xc(t)
and the change in Pa(t) (due to the increase in constraints for isotropic materials). Secondary
crystallization is associated with the formation of new crystals only below a cross over
temperature, TCO, defined in Figure 2.27.30
Figure 2.27. Definition of the cross-over temperature (TCO) from the crystallization temperature
Tx dependence of B(Tx) for BAPC.30
In Figure 2.27, they plot B(Tx), the slope of Tmlow
(t) vs. log t, determined for different
crystallization temperatures. When the crystallization temperature increases toward TCO, B(Tx) is
observed to decrease. Above TCO, no secondary crystals form, and the melting behavior is
characterized by a single melting endotherm. The mechanism of secondary crystallization above
TCO was speculated to be the thickening of existing lamellae. A possible correlation was offered
between TCO and the αc relaxation temperature, Tαc, above which the rapid cooperative segmental
motion in the crystal phase allows the lamellar thickening process to occur at a measurable rate.

32
This led Marand et al.7, 30
to suggest that physical aging may originate from the lack of mobility
in both the crystal and the amorphous phases. The entropic constraints caused by secondary
crystals can only be released if segmental motion takes place sufficiently rapidly and over large
enough length scales in both the amorphous and the crystal phases (Figure 2.28).
Figure 2.28. Marand’s model of physical aging: segmental mobility below TCO.70
Since the onset of segmental mobility for the crystal and amorphous phases is associated
with the temperatures, TCO and Tg, respectively, it was proposed that the segmental mobility at
the crystal/liquid interphase is controlled by a reduced temperature, denoted Θ, defined by
Equation 2.8.
Θ = gCO
xCO
TT
TT
−
− (2.8)
The lower Tx , the larger Θ, and the lower the mobility. Thus, the influence of secondary
crystallization on the remaining amorphous fraction is larger at lower temperature. Consequently,
at lower temperatures, the rate at which the conformational constraints can be released is slower.

33
Thus, the rate at which the physical properties of the remaining amorphous fraction are expected
to change with time is larger. One of the unpublished results from Marand’s group (Figure 2.29)
shows that the variation of B with θ seems to follow the same trend for BAPC with different
molar masses, PET, it-PS, and PEEK. This data suggests some universality in the behavior of
semicrystalline polymers with regard to aging between TCO and Tg.
Figure 2.29. Evolution of B as a function of the dimensionless temperature, θ.79
However, the mechanism proposed by Marand et al.7, 30
suggest that physical aging should
stop as soon as the production of secondary crystals ceases. This requirement is not supported by
the data on Figure 2.30, which shows that the low endotherm heat of fusion increases quickly at
short crystallization times, but increases very slowly at very long crystallization times (t > 103
minutes). This observation is not consistent with the assumption that the number of constraints

34
(caused by the secondary crystals) increases steadily with the logarithm of time, even at long
crystallization time.
Figure 2.30. Evolution of the low endotherm heat of fusion for EO-12.3 after crystallization
at 20oC for different times.
7

35
Chapter 3. Experimental
3.1 Materials
The ethylene/1-octene (EO)-copolymers investigated in this study were synthesized at the
Dow Chemical Company using the CGCT INSITETM
technology.54
The materials, along with
their octene content, weight average molecular weight (Mw), polydispersity index (PDI), and
density, are listed in Table 3.1.1. All values in the table were provided by the Dow Chemical
Company. The comonomer composition in EO-copolymers were determined by temperature
rising elution fractionation (TREF).80-82
Table 3.1.1 Characteristics of EO-copolymers.
Sample Name Octene Content,
(mol%)
Octene Content,
(wt%)
Mw
(g/mol) PDI
Density
(g/cm3)
EO-3.4 3.37 8.30 116000 2.34 0.9103
EO-8.2 8.22 17.63 100800 2.15 0.8873
EO-12.3 12.3 22.99 119700 2.04 0.8726
3.2 Methodology
The main goal of this thesis is to investigate the effect of long isothermal treatment above
Tg on the physical properties of semicrystalline EO-copolymers. The principal experimental
technique for these investigations is the differential scanning calorimetry (DSC). Additional
studies focused on properties such as the density and the small strain creep compliance.

36
3.2.1 Differential Scanning Calorimetry
3.2.1.1 Conventional Differential Scanning Calorimetry
A TA Instruments Q2000 DSC was used under dry nitrogen purge. Since metals have a
much higher thermal conductivity than organic materials, using a pure indium sample as a
standard to calibrate the temperature scale is not suitable. Indium and tin “sandwiches”, made by
inserting a piece of indium or tin between two pieces of polymer films, were used to serve as
calibration standards. Thin films were prepared by melt pressing at 160 °C in a Carver laboratory
hot press in a dry nitrogen atmosphere and were subsequently quenched in cold water. Small
samples with similar masses (1.2 ± 0.2 mg) were used to minimize and simplify thermal lag
corrections.
3.2.1.2 Rapid Heating Cooling Differential Scanning Calorimetry
The DSC thermograms at fast heating rates were recorded using a RHC DSC from TA
Instruments under dry nitrogen purge. The heating rates are 50, 250, 500, 1000 and 1500 K/min.
Samples size are in the range of 100~200 µg.
3.2.2 Density
Densities of EO-copolymers were measured at 23.00 ± 0.05 °C in a Techne DC-1 density
gradient column prepared using isopropanol and water. Since the density range of

37
EO-copolymers is 0.87-0.92 g/cm3, 1080 mL isopropanol/water solution (with a density of 0.82
g/cm3) and 920 mL pure water were used to prepare the density gradient column. Calibration of
the column was carried out with 8 standard floats whose densities are known within ± 0.0001
g/cm3. The resolution of the column was about 0.0002 g/cm
3. Measurements were carried out at
least twice with fresh samples cut from compression-molded films to ensure reproducibility.
3.2.3 Creep Behavior
Creep measurements are widely used to study physical aging. 61-66 The small strain creep
study was carried out in bending mode on a TA Instruments model 2980 Dynamic Mechanical
Analyzer. The aging behavior was studied at 30 °C, which is well above the glass transition
temperature of each EO-copolymer (-55 °C, -46 °C and -33 °C for EO-12.3, EO-8.2 and EO-3.4,
respectively) and below the ΤCO (94 °C, 103 °C, and 110 °C, for EO-12.3, EO-8.2 and EO-3.4,
respectively, as will be shown in Section 4.1.1.3). The creep studies were performed using a
methodology well described in the literature. 56, 61-66 The aging times were 0.11 hour, 0.33 hour,
1 hour, 3 hours, and 9 hours. After an initial aging time t1
aging, a small constant stress was
applied during the creep time tcreep. The resulting bending creep compliance J(t) was recorded.
The ratio of tcreep to aging time taging was smaller than 0.17 to minimize the effect of aging during
the creep measurement period and get a “snapshot” of the properties at taging. Then the load was
released and the sample was allowed to recover. The recovery time was about 15 times tcreep to
obtain a complete recovery of the strain. At the time t(i+1)
aging = 3t(i)
aging, the constant stress was

38
applied again to start the next creep cycle. Figure 3.1 illustrates the process. To make sure the
creep test was done in the linear viscoelastic response region, the applied stress was sufficiently
small that the strain was typically less than 0.1%.
Figure 3.1. Creep test schedule for aging studies (adapted from reference 56).
Time

39
Chapter 4. Results and Discussion
4.1 Results
4.1.1 Differential Scanning Calorimetry
Section 4.1.1.1 examines the effect of crystallization time and temperature on the
development of the low temperature endotherm. Section 4.1.1.2 examines the effect of octene
content on the development of the low temperature endotherm. Section 4.1.1.3 investigates the
relationship between rate of shift of the low endotherm and the reduced temperature, while
Section 4.1.1.4 discusses the evolution of DSC crystallinity as a function of time.
4.1.1.1 Effects of Crystallization Time and Temperature
We record the melting behavior of ethylene/1-octene copolymers crystallized isothermally
at varying temperatures for different crystallization times. A sample is initially rapidly heated to
160 °C, where it is kept for 2 minutes to erase any previous thermal history. The sample is then
cooled at 20 K/min to a temperature, Tx, where it is allowed to crystallize isothermally for a
certain amount of time. Next, the sample is subsequently quenched to a temperature 40 K below
the crystallization temperature. The sample is subsequently melted at a rate of 10 K/min.
Figure 4.1 shows a typical set of DSC heating scans for EO-12.3 crystallized at 23 °C for
different times. At about 62 °C, each heating scan shows a high temperature endotherm (T’m).
These endotherms exhibit almost the same position and shape. In the temperature region below

40
T’m, a low temperature endotherm is observed above the temperature of isothermal treatment, Tx.
The magnitude and position of the low temperature endothermic peak increase with
crystallization time, tx. The shift of the low temperature endothermic peak to higher temperatures
is proposed to be associated with the melting-recrystallization-remelting and crystal perfection.
Figure 4.1. Evolution of the melting behavior of EO-12.3 after quenching from 160 to 23 °C,
residence at 23 °C for various times and subsequent quenching to -17 °C.
To determine the peak position of the low temperature endothermic transition, the heat flow
curve obtained for the 0 hour residence time at 23 °C is used as “baseline”. The heating traces
are obtained after subtraction of the baseline and display a negative deviation from zero with a
minimum around Tx, 23 °C (Figure 4.2.A). Then, a positive deviation with a maximum is
displayed at about 8 K above the minimum. The maximum of the low temperature endothermic
transition for the subtracted heat flow curve is defined as Tmlow
(tx). Figure 4.2.B shows that a

41
more negative deviation is observed in the subtracted DSC traces below 23 °C when
crystallization time increases. As the crystallization time increases, fewer amorphous sequences
are available for crystallization during the subsequent quench from 23 °C to -17 °C.
Figure 4.2. Evolution of the low temperature endotherm of EO-12.3 after quenching from 160 to
23 °C, residence at 23 °C for various times and subsequent quenching to -17 °C. (A) Example of
baseline subtraction for 10 hours crystallization; (B) DSC traces after subtraction for various
crystallization times.
A
B

42
We now focus on the effect of the crystallization temperature. Figure 4.3 shows DSC
heating scans (at a heating rate of 10 K/min) of EO-12.3, which was allowed to crystallize at
different temperatures (random order) for 10 hours. Similar to Figure 4.2, at about 62 °C, each
heating scan shows a high temperature endothermic peak (T’m). The upper endotherm exhibits
almost the same position and shape. A low temperature endothermic peak is observed above Tx.
Magnitude of the low temperature endothermic peak increases with an increase of Tx. Tmlow
is on
a line, which is almost parallel to the T’m = Tx line on the Hoffman-Weeks plot (Figure 4.4).
5
Figure 4.3. DSC heating scans of EO-12.3, crystallized for 10 hours at various temperatures.

43
Figure 4.4. Evolution of Tmlow
with crystallization temperature Tx (crystallized for 10 hours).
Earlier studies of the isothermal crystallization of the EO-copolymers (Figure 11 in
Reference 7) suggested that the logarithmic time scale must be chosen to effectively investigate
the time dependence of the low temperature endotherm. Tmlow
is plotted in Figure 4.5 for various
crystallization temperatures and times for EO-12.3. In all cases, Tmlow
increases linearly with
log(tx), as represented by Equation 4.1:
Tmlow
= Tx + A (Tx) + B (Tx) * log(tx) (4.1)
where the parameters A and B are functions of Tx.

44
Figure 4.5. Variation of Tmlow
for various temperatures as a function of time for EO-12.3.
B(Tx) is the slope of the linear plot of Tmlow
(t) vs. log(t) at a given crystallization
temperature, Tx. The evolution of B(Tx) with Tx is investigated over a wide temperature range for
EO-12.3 (Figure 4.6). As Figure 4.1 shows, a significant decrease of B(Tx) is observed for Tx ≧
40 °C. On the other hand, when the sample is crystallized at successively lower temperatures,
B(Tx) decreases to reach a minimum at Tx ~ Tg. Further lowering the temperature below -60 °C
leads B(Tx) to a constant value. The evolution of B(Tx) with Tx is shown in Figures 4.7 and 4.8
for EO-8.2 and EO-3.4, respectively. The low temperature crystallization study by DSC was
carried out only for EO-12.3, since the low temperature endothermic peak is too small to yield a
reliable value of Tmlow, hence, of B(Tx) for EO-3.4 and EO-8.2.

45
Figure 4.6. Evolution of B(Tx) with Tx for EO-12.3 (cooling at 20 K/min and heating at 10 K/min).
Figure 4.7. Evolution of B(Tx) with Tx for EO-8.2 (cooling at 20 K/min and heating at 10 K/min).

46
Figure 4.8. Evolution of B(Tx) with Tx for EO-3.4 (cooling at 20 K/min and heating at 10 K/min).
4.1.1.2 Effects of Octene Content on the Development of Low Temperature Endotherm
Changing the octene content changes the physical properties of the EO-copolymers.
Decreasing the octene content increases Tg, increase the crystallinity, and increases melting
temperatures of the high temperature endothermic peak. This study only focuses on the effect of
octene content on the development of the low temperature endothermic peak. As observed in a
previous study in our laboratory (Figure 1 in reference 7), the relative magnitude of the lower
temperature exotherm increases with octene content over the range of copolymer compositions
considered here. The DSC crystallization study was carried out at the same temperature as the
density experiment, specifically at 23oC, (see Section 4.1.2 for details). As shown in Figure 4.9,
B(Tx) of EO-8.2 is the largest among the three EO-copolymers. These results will be compared
with the results obtained from density measurements in the following discussion section.

47
Figure 4.9. B(Tx) vs. octene mol% at 23oC.
4.1.1.3 B as a Function of the Reduced Temperature θ
As discussed at the end of Section 2.2, the reduced temperature, θ, is calculated using
Equation 2.8. B(Tx) is measured at different heating rates and then is extrapolated to zero rate to
yield B(Tx, HR=0). Then, extrapolation of the B(Tx, HR=0) vs. Tx plot to the condition B(Tx) = 0
allows to define the cross-over temperature, TCO. The Tg and TCO values for EO-copolymers are
given in Table 4.1.1. TCO decreases when the octene content increases. This is explained by a
reduced local concentration of crystallizable -CH2-CH2- sequences. One of the unpublished
results from Marand’s group (Figure 2.29) shows that the change of B(Tx) with reduced
temperature, θ, appears to exhibit universal behavior, where BAPC of different molar masses,
PET, it-PS, and PEEK data at different temperatures fall on the same curve. Similarly the
reduced temperatures of three EO-copolymers are calculated using Equation 2.8 and are shown

48
in Figure 4.10. The black line in Figure 4.10 is the best fit of data from PEEK, it-PS, BAPC, and
PET (Figure 2.29). It is independent of the nature of the polymer as long as the reduced
temperature is used.
Figure 4.10. Change of segmental mobility with B(Tx) for three EO-copolymers.
Table 4.1.1 Tg and TCO of EO-copolymers
Sample Octene Content (mol%) Tg (°C) *TCO (°C)
EO-3.4 3.37 -33 111
EO-8.2 8.22 -46 103
EO-12.3 12.3 -52 94
* Obtained by extrapolation of B(Tx) to zero heating rate and zero DSC aging rate.

49
4.1.1.4 Crystallinity
A fractional degree of crystallinity based upon DSC data, XcDSC
, is calculated from the
following equation:
XcDSC
= 0
m
m
H
H
∆
∆ (4.2)
where the experimental data ∆Hm is the observed melting enthalpy of a sample, and ∆Hm0 is the
heat of fusion for completely crystalline linear polyethylene (290 J/g).83
For EO-12.3, ∆Hm is
calculated by an integration of the DSC heating trace over the temperature interval from 5oC to
85oC. The crystallinity is 0.0965 at zero crystallization time and increases slowly with an
increase of crystallization time (Figure 4.11).
Figure 4.11. Evolution of the DSC fractional degree of crystallinity with residence time at
23oC for EO-12.3.

50
4.1.2 Density
4.1.2.1 Effect of Octene Content
The evolution of the sample density with the crystallization time at 23oC is investigated and
plotted in Figures 4.12, 4.13, and 4.14 for EO-3.4, EO-8.2, and EO-12.3, respectively. Slopes of
density with the crystallization time, D(T), are summarized in Table 4.1.2 and plotted in Figure
4.15.
Figure 4.12. Evolution of the density as a function of time at 23 oC for EO-3.4.

51
Figure 4.13. Evolution of the density as a function of time at 23 oC for EO-8.2.
Figure 4.14. Evolution of the density as a function of time at 23 oC for EO-12.3.

52
Table 4.1.2 Summary of the slopes of density vs. log t for EO-copolymers at 23oC
Samples D(T) g/mL
EO-3.4 2.4 ± 0.1
EO-8.2 3.6 ± 0.2
EO-12.3 3.0 ± 0.1
Figure 4.15. Slopes D(T) of density vs log t vs. octene mol% at 23oC.
4.1.2.2 Crystallinity
A fractional degree of crystallinity based upon density, XcDens
, can be obtained from
Equation 4.3:

53
XcDens
= ))((ac
ac
ρρρρ
ρρ
−−
(4.3)
where ρ is the experimental density, ρ c, and ρ a are the crystalline and amorphous densities,
respectively. At 23oC, the values of 1.00 g/cm
3 for the crystalline density and 0.852 g/cm
3 for the
amorphous density are often quoted and have been adopted by most investigators.84-86
Thus,
these values are used in this study. XcDens
of EO-12.3 is calculated and shown in Figure 4.16.
While small differences in the absolute value of XcDens
are observed in multiple density
measurements of different samples, all measurements show similar time dependences.
Figure 4.16. Evolution of the fractional degree of crystallinity with residence time at 23oC for
EO-12.3 from density measurements.
54
4.1.3 Creep
4.1.3.1 Effect of Aging Time
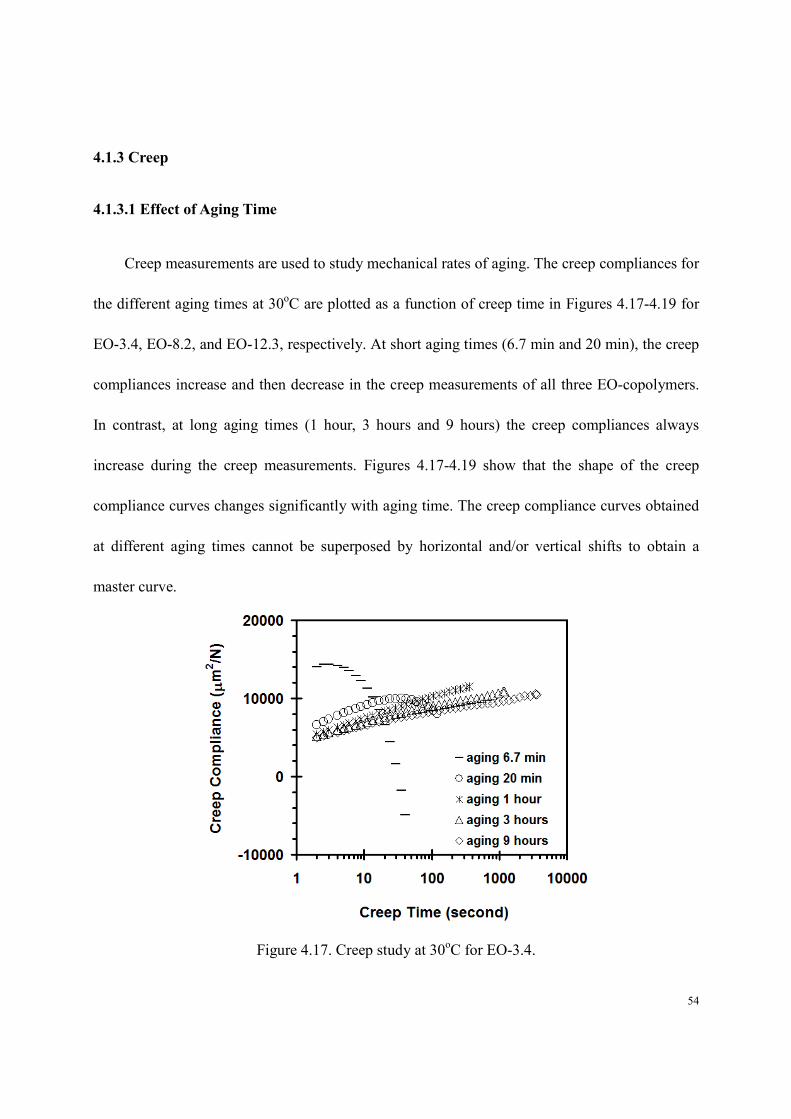
Creep measurements are used to study mechanical rates of aging. The creep compliances for
the different aging times at 30oC are plotted as a function of creep time in Figures 4.17-4.19 for
EO-3.4, EO-8.2, and EO-12.3, respectively. At short aging times (6.7 min and 20 min), the creep
compliances increase and then decrease in the creep measurements of all three EO-copolymers.
In contrast, at long aging times (1 hour, 3 hours and 9 hours) the creep compliances always
increase during the creep measurements. Figures 4.17-4.19 show that the shape of the creep
compliance curves changes significantly with aging time. The creep compliance curves obtained
at different aging times cannot be superposed by horizontal and/or vertical shifts to obtain a
master curve.
Figure 4.17. Creep study at 30oC for EO-3.4.

55
Figure 4.18. Creep study at 30oC for EO-8.2.
Figure 4.19. Creep study at 30oC for EO-12.3.

56
4.1.3.2 Effect of Octene Content
Creep compliance vs. creep time curves are plotted in a logarithmic time scale for the three
EO-copolymers after a long aging times on Figure 4.20 (1 hour), Figure 4.21 (3 hours) and
Figure 4.22 (9 hours). The creep rate, m, is defined as creep compliance divided by logarithmic
creep time and is considered to be associated with molecular mobility.62, 63
Creep rates after long
aging times (1 hour, 3 hours, and 9 hours) are plotted as a function of copolymer composition in
Figure 4.23.
Figure 4.20. Creep study after 1 hour aging.

57
Figure 4.21. Creep study after 3 hours aging.
Figure 4.22. Creep study after 9 hours aging.

58
Figure 4.23. Creep rate as a function of copolymer composition for different aging times
(1 hour, 3 hours and 9 hours).
4.1.4 Rapid Heating Cooling Differential Scanning Calorimetry
To distinguish between the melting-recrystallization-remelting and the secondary
crystallization mechanisms, melting studies of EO-12.3 are carried out at fast heating rates (100,
500, 1000, 1500 and 2000 K/min) after isothermal crystallization (Figure 4.24).
For these experiments, EO-12.3 was first melted at 433.15 K to erase any previously
established thermal history. It was than cooled to 233.15 K and held isothermally for 20 minutes
followed by quenching to 123.15 K. Finally, the sample was heated to 433.15 K at various
heating rates.
For comparisons with results obtained from previous studies, the multiple melting behavior

59
of PEEK was also studied using the TA Instrument RHC DSC at the following heating rates: 50,
200, 400, 800 and 1200 K/min (Figure 4.25). PEEK samples were first melted at 653.15 K to
erase any previously established thermal history. Samples were then cooled to 573.15 K and held
isothermally for 15 minutes. Next, the samples were further cooled to 513.15 K and held
isothermally for 15 minutes followed by quenching to 173.15 K. Finally, the samples were
heated to 653.15 K with different heating rates.
Examination of Figures 4.24 and 4.25 makes it clear that the two melting peaks of EO-12.3
and PEEK start to merge together when the heating rate increases.
Figure 4.24. Multiple melting behavior of EO-12.3 (crystallizes at 233.15 K for 20 minutes).

60
Figure 4.25. Multiple melting behavior of PEEK (crystallizes at 573.15 K for 15 minutes, then
quenches to 513.15 K and crystallizes for 15 min).
4.2 Discussion
4.2.1 Development of the Low Temperature Melting Endotherm after Crystallization
A low temperature endothermic peak is observed in the melting scan of semicrystalline
EO-copolymers subsequent to crystallization. Both the magnitude and the position of this peak
increase with the crystallization temperature and time. The multiple melting behavior is
associated with the melting of small and unstable crystals, the recrystallization of the melt
produced by their melting, and the melting of the recrystallized material. This conclusion is
drawn from the reorganization effects observed in Figures 4.24 and 4.25 and consistent with
Schick’s findings for PET and it-PS. The low temperature endotherm corresponds to the melting

61
of these small crystals. The high endotherm is associated with the melting of crystals, which
form during the heating scan. With a longer crystallization time, Tmlow
shifts to a higher
temperature, a reflection of the ability of these crystals to stabilize with time. Following the work
of Alfonso et al.87
and Strobl et al.11, 13, 14
, it is likely that the stabilization under isothermal
conditions is associated with an increase in lateral crystal dimensions or an increase in crystal
perfection rather than with an increase in crystal thickness, since no changes are observed in the
angular dependence of the SAXS of these materials during aging.
4.2.2 Evolution of B(Tx) with Tx
B(Tx) is used to define the calorimetric rate of aging by DSC measurements. The change of
B with Tx for PEEK, an unpublished result from Marand’s group, is shown in Figure 4.26. Note
that Figures 4.6 and 4.26 are qualitatively similar to Figure 2.17 for the mechanical rate of aging
from Struik’s model. B(Tx) is associated with the rate of increase in crystal stability. Small and
unstable crystals are formed at a low crystallization temperature. These crystals can rapidly
stabilize with time. As Tx increases (and approaches TCO), it is known that crystals are larger and
more stable. Thus, their driving force toward stabilization decreases and the rate of increase in
stability, B(Tx), decreases. At some temperature, Tx = TCO, the crystals formed are sufficiently
large, hence, stable, that they melt at a high enough temperature and can no longer undergo
melting-recrystallization-remelting. In other words these crystals simply melt. It is indeed
expected that the rate of recrystallization should decrease with increasing temperature as high

62
enough temperatures. Thus, TCO, is the temperature where the melting-recrystallization-remelting
processes vanishes. At these high temperatures, segmental mobility increases dramatically in the
crystal, and the crystals can still improve their stability with increasing crystallization time at a
rate that increases with temperature (Tx ≧ TCO). Hence, we speculate that the increase in B(Tx)
with Tx for Tx > TCO (Figures 2.27 and 4.26) is associated with the thermally activated increase
in segmental motion, while the decrease in B(Tx) with Tx for Tx < TCO is associated with a
decrease in driving force toward stabilization under conditions where the rate of segmental
motion is too low to play a significant role (Figures 4.6-4.8, and Figure 4.26).
Figure 4.26. Change of B(Tx) with T for PEEK (heating at 10 K/min).79
4.2.3 Universality of the B vs. θ Trends for EO-copolymers and Other Semicrystalline
Polymers
We note in Figure 4.10 that the rate of stabilization B(T) measured for the three

63
EO-copolymers studied here follow the same trend as PEEK, it-PS, BAPC, and PET. This
observation suggests that similar processes occur at the cross-over temperature, TCO.
4.2.4 Same Trend for the Slopes of DSC and Density Measurements
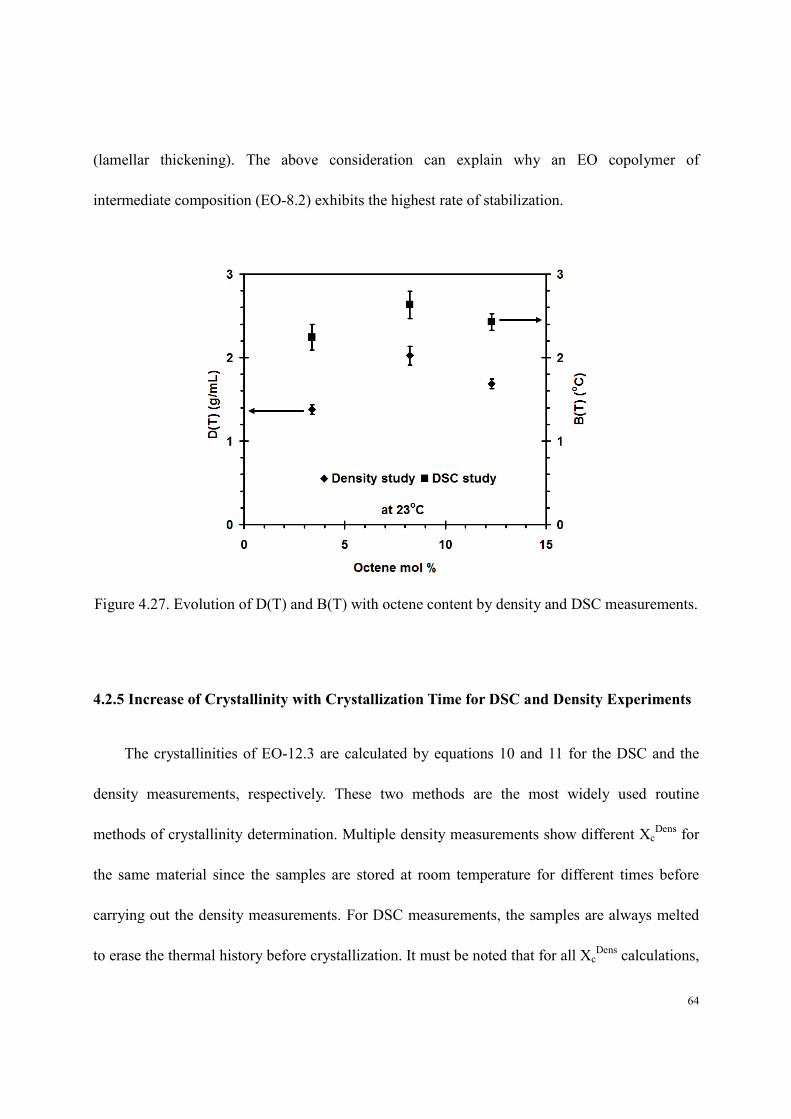
We also note that at 23oC the DSC (Figure 4.9) and density (Figure 4.15) aging rates exhibit
the same copolymer composition dependence (Figure 4.27). Both of these rates can be associated
with a stabilization process if an increase in density and melting temperature can be related to an
increase in stability. While such correlation is obvious for the melting temperature, it is less so
for density, unless the observed increase in density is associated with an increase in lateral crystal
dimensions or an increase in crystal perfection. We also note that the rate of stabilization for
EO-8.2 is the highest among the three EO-copolymers. The observation that the rate of stability
increase is a maximum at intermediate copolymer composition makes sense from the standpoint
that copolymers with a very high level of short-chain branching (high octene content), crystallize
only to a very limited extent (if at all), hence, their crystals have very limited ability to increase
their stability. On the other hand, crystallization of linear chains, or of copolymers with very few
short-chain branches, leads to crystals that are almost perfect and have very little driving force
toward stabilization. Also, in such materials, crystallization by a chain-folding mechanism leads
to very high crystallinity. Hence, in this case, there are very few amorphous segments available
for further crystallization. In this case, the rate of stabilization at low temperature approaches
zero. Obviously, at higher temperature, a different mechanism may be at play to increase stability
64
(lamellar thickening). The above consideration can explain why an EO copolymer of
intermediate composition (EO-8.2) exhibits the highest rate of stabilization.
Figure 4.27. Evolution of D(T) and B(T) with octene content by density and DSC measurements.
4.2.5 Increase of Crystallinity with Crystallization Time for DSC and Density Experiments
The crystallinities of EO-12.3 are calculated by equations 10 and 11 for the DSC and the
density measurements, respectively. These two methods are the most widely used routine
methods of crystallinity determination. Multiple density measurements show different XcDens
for
the same material since the samples are stored at room temperature for different times before
carrying out the density measurements. For DSC measurements, the samples are always melted
to erase the thermal history before crystallization. It must be noted that for all XcDens
calculations,

65
it was assumed that the density of the amorphous phase in the semicrystalline polymer is
constant and identical to that of purely amorphous polyethylene – 0.852 g/cm3. It is not
surprising to note that the values of XcDens
and XcDSC
are somewhat different since samples for
density and DSC were kept at room temperature for different times. The key point is that both
measurements suggest that the crystallinity increases steadily with crystallization time. This is
consistent with a solid-state NMR study of isotactic polypropylene by VanderHart et al.,88
which
suggests that the degree crystallinity of it-PP increases slightly but steadily during aging above
Tg, and does not remain strictly constant as hypothesized by Struik.62-65
4.2.6 Summary of the Small Strain Creep Results
In order to obtain a “snapshot” of the properties at an aging time taging, the time scales for
the creep tests are set to follow Struik’s suggestion for short-time tests (Figure 2.25). Since the
ratio of tcreep to taging is smaller than 0.14, the effect of aging during the creep measurement period
can be neglected as indicated by Struik.62,63
However, our creep measurements of
EO-copolymers show very different behavior (Figures 4.17-4.19) at various aging times. With an
increase in aging time, the constraints associated with the crystallinity increase (crystals act as
crosslink points). Thus, the molecular mobility decreases. This explains why the creep rates of
EO-3.4 and EO-8.2 decrease with increasing aging time as shown in Figure 4.23 (long aging
times). The uncertainty is too large to draw any conclusion from Figure 4.23 for the softer
material EO-12.3.

66
As Figure 2.30 indicates, the crystallinity increases fast in the early stage of crystallization
and slows down at later times.7 Thus, after a shorter aging time (6.7 min or 20 min), the increase
of crystallinity can occur rapidly by a variety of mechanisms (new crystal formation in the
remaining amorphous phase, an increase in the size of small crystals, and an increase in crystal
perfection)87
and the sample shrinks during the creep test, which explains why a smaller and
even a negative creep compliance is obtained at the end of the creep measurement (Figures
4.17-4.19). The change in the creep compliance of EO-8.2 with time is the largest among the
three EO-copolymers (Figure 4.28).
This observation is consistent with the DSC and density results which allowed us to
conclude that EO-8.2 has the highest rate of stabilization (the largest magnitude for B(T) and
D(T)).
Figure 4.28. Creep study of EO-copolymers after 6.7 minutes aging.

67
On the other hand, for long aging times (1 hour, 3 hours, or 9 hours), the rate of increase in
crystallinity (increase in the number or size of small crystals and increase in crystal perfection) is
lower than at short times. This observation is consistent with the result that the creep compliance
changes slowly during the creep test for long aging times. The slight increase in creep
compliance with creep time at long aging time is still the largest for EO-8.2 (Figure 4.23),
suggesting that the availability of amorphous chains to participate in some crystallization or
crystal perfection process is still responsible for the change in creep behavior.
All of this means that aging of EO-copolymers above Tg is not as simple as Struik suggested.
Similar to Struik’s long-term tests, where aging during creep cannot be neglected, the actual
creep compliances (Figures 4.17-4.19) have a different curvature than predicted. The negative
curvature results from continuous crystallization and stiffening of the material during creep. The
shape of the retardation spectrum changes during aging, which leads to a failure of the creep
time-aging time-superposition. Thus, a master curve cannot be obtained by simply shifting the
creep curve horizontally and/or vertically as Struik suggested. Our creep studies of
EO-copolymers lead to the same conclusions as reached by McCrum and Read.67, 68
We suggest
that physical aging can be explained by the increase in crystallinity, which affects both the
crystalline content and the intrinsic properties of the amorphous phase (increase in constraints).

68
Chapter 5. Conclusions and Suggested Future Work
The goal of this work was to study the origin of the time dependence of the structure and
physical properties of EO-copolymers. The DSC, density, and creep results are explained based
on an assumption that small and unstable crystals are formed at a low temperature (T<TCO)
during crystallization. These unstable small crystals can: 1) rapidly stabilize with time, which
explains why Tmlow(tx) increases with crystallization time; 2) easily melt and recrystallize, which
explains the multiple melting behavior; 3) serve as efficient thermo-reversible cross-links to
increase the conformational constraints in the residual amorphous fraction. The
crystallization-induced shrinkage explains the decrease in creep compliance at short aging times.
The further crystal stabilization at long aging times explains the origin of the negative curvature
observed in plot of creep compliance vs. time. Physical aging can be explained by the increase in
crystallinity, which affects both the crystalline content and the intrinsic properties of the
amorphous phase (increase in constraints). The increase in crystallinity may occur through
different mechanisms at short and long crystallization times (new crystal formation, increase in
crystal lateral dimensions and crystal perfection), which may explain the complicated evolution
of the creep compliance as a function of creep time and aging time.
To confirm the assumption that the multiple melting behavior of EO-copolymers is the
result of a melting-recrystallization-remelting process, DSC experiments carried out at much
higher heating rates are suggested as future work. To carry out such experiments, I would suggest

69
using the newest rapid-scanning calorimeter: the Flash DSC produced by Mettler-Toledo.89
The
scan rates of Flash DSC are in the range of 30 K/min - 2.4 MK/min for heating with the sample
size in the 10 ng - 1 µg range.

70
Bibliography
1. Khoury, F.; Passaglia, E., Treatise on Solid State Chemistry. Hannay N. ed.; Plenum Press: New York, 1976;
Vol. 6.
2. H. Darrell Iler’s Ph. D. thesis, 1995 Virginia Tech.
3. Barham, P. J.; Chivers, R. A.; Keller, A.; Martinezsalazar, J.; Organ, S. J., The Supercooling Dependence of the
Initial Fold Length of Polyethylene Crystallized from the Melt - Unification of Melt and Solution Crystallization.
Journal of Materials Science 1985, 20, (5), 1625-1630.
4. Stack, G. M.; Mandelkern, L.; Voigtmartin, I. G., Changes in Crystallite Size Distribution during the Isothermal
Crystallization of Linear Polyethylene. Polymer Bulletin 1982, 8, (9-10), 421-428.
5. Hoffman, J. D.; Weeks, J. J., X-ray study of isothermal thickening of lamellae in bulk polyethylene at the
crystallization temperature. J. Chem. Phys., 1965, 42, (12), 4301.
6. Hoffman, J.; Davis, G.; Lauritzen, J., Treatise on Solid State Chemistry. Hannay N. ed.; Plenum Press: New
York, 1976; Vol. 3, p 497-614.
7. Alizadeh, A.; Richardson, L.; Xu, J.; McCartney, S.; Marand, H.; Cheung, Y. W.; Chum, S., Influence of
structural and topological constraints on the crystallization and melting behavior of polymers. 1. Ethylene/1-octene
copolymers. Macromolecules 1999, 32, (19), 6221-6235.
8. Heck, B.; Hugel, T.; Iijima, M.; Strobl, G., Steps in the formation of the partially crystalline state. Polymer
2000, 41, (25), 8839-8848.
9. Iijima, M.; Strobl, G., Isothermal crystallization and melting of isotactic polypropylene analyzed by time- and
temperature-dependent small-angle X-ray scattering experiments. Macromolecules 2000, 33, (14), 5204-5214.
10. Schmidtke, J.; Strobl, G.; ThurnAlbrecht, T., A four-state scheme for treating polymer crystallization and
melting suggested by calorimetric and small angle X-ray scattering experiments on syndiotactic polypropylene.
Macromolecules 1997, 30, (19), 5804-5821.
11. Strobl, G., From the melt via mesomorphic and granular crystalline layers to lamellar crystallites: A major route
followed in polymer crystallization? European Physical Journal E 2000, 3, (2), 165-183.
12. Al-Hussein, M.; Strobl, G., The melting line, the crystallization line, and the equilibrium melting temperature
of isotactic polystyrene. Macromolecules 2002, 35, (5), 1672-1676.
13. Strobl, G., A thermodynamic multiphase scheme treating polymer crystallization and melting. European
Physical Journal E 2005, 18, (3), 295-309.
14. Strobl, G., Crystallization and melting of bulk polymers: New observations,conclusions and a thermodynamic
scheme. Prog Polym Sci 2006, 31, 398-442.
15. Lauritzen, J.; Hoffman, J., J. Appl. Phys. 1973, 44, 4340-4352.
16. Clark, E. J.; Hoffman, J. D., Regime-III Crystallization in Polypropylene. Macromolecules 1984, 17, (4),
878-885.
17. Hoffman, J. D.; Miller, R. L., Kinetics of crystallization from the melt and chain folding in polyethylene
fractions revisited: Theory and experiment. Polymer 1997, 38, (13), 3151-3212.
18. Armistead, J. P.; Hoffman, J. D., Direct evidence of regimes I, II, and III in linear polyethylene fractions as
revealed by spherulite growth rates. Macromolecules 2002, 35, (10), 3895-3913.
19. Kanig, G., Application of the Short-Time Staining for the Electron-Microscopic Investigation of the
Crystallization of Polyethylene. Colloid and Polymer Science 1983, 261, (4), 373-374.

71
20. Rastogi, S.; Hikosaka, M.; Kawabata, H.; Keller, A., Role of Mobile Phases in the Crystallization of
Polyethylene .1. Metastability and Lateral Growth. Macromolecules 1991, 24, (24), 6384-6391.
21. Okada, T.; Saito, H.; Inoue, T., Time-Resolved Light-Scattering-Studies on the Early Stage of Crystallization in
Isotactic Polypropylene. Macromolecules 1992, 25, (7), 1908-1911.
22. Schultz J., "Polymer Materials Science",. Prentice-Hall: Englewood Cliffs,NJ, 1974.
23. Groeninckx, G.; Reynaers, H.; Berghmans, H.; Smets, G., Morphology and Melting Behavior of
Semi-crystalline Poly(ethylene-terephthalate).1.Isothermally Crystallized PET. J. Polym. Sci. Polym. Phys. Ed. 1980,
18, 1311.
24. Fischer, E. W.; Fakirov, S., Structure and Properties of Polyethyleneterephthalate Crystallized by Annealing in
Highly Oriented State. 1. Morphological Structure as Revealed by Small-Angle X-Ray-Scattering. J. Mat. Sci. 1976,
11, 1041.
25. Fakirov, S.; Fischer, E. W.; Hoffmann, R.; Schmidt, G. F., Structure and Properties of
Poly(ethylene-terephthalate) Crystallized by Annealing in Highly Oriented state. 2. Melting Behavior and Mosaic
Block Structure of Crystalline Layers. Polymer 1977, 18, 1121.
26. Bell, J. P.; Murayama, T., Relations between dynamic mechanical properties and melting behavior of nylon 66
and poly(ethylene terephthalate). J. Polym. Sci. Part A-2 1969, 7, (6), 1059.
27. Schultz, J. M.; Scott, R. D., Temperature Dependence of Sceondary Crystallization in Linear Polyethylene.
J.Polym. Sci. A-2, 1969, 7, 659.
28. Wunderlich, B.; Mellilo, J., Morphology and growth of extended chain crystals of polyethylene. Macromol.
Chem. 1968, 118, 250.
29. Xu, J., Equilibrium Melting Temperature Determination of Semicrystalline Polymers through Nonlinear
Hoffman-Weeks Extrapolation and Secondary Crystallization of Ethylene/Styrene Copolymers. 1999, PhD thesis at
Virginia Tech.
30. Alizadeh, A.; Sohn, S.; Quinn, J.; Marand, H.; Shank, L. C.; Iler, H. D., Influence of structural and topological
constraints on the crystallization and melting behavior of polymers: 3. Bisphenol A polycarbonate. Macromolecules
2001, 34, (12), 4066-4078.
31. Marand, H.; Alizadeh, A.; Farmer, R.; Desai, R.; Velikov, V., Influence of structural and topological constraints
on the crystallization and melting behavior of polymers. 2. Poly(arylene ether ether ketone). Macromolecules 2000,
33, (9), 3392-3403.
32. Marand, H.; Alizadeh, A., Polymer secondary crystallization: A universal model. Abstracts of Papers of the
American Chemical Society 1999, 218.
33. Verma, R. K.; Velikov, V.; Kander, R. G.; Marand, H.; Chu, B.; Hsiao, B. S., SAXS studies of lamellar level
morphological changes during crystallization and melting in PEEK. Polymer 1996, 37, (24), 5357-5365.
34. Marand, H.; Prasad, A., On the Observation of a New Morphology in Poly(Arylene Ether Ether Ketone) - a
Further Examination of the Double Endothermic Behavior of Poly(Arylene Ether Ether Ketone). Macromolecules
1992, 25, (6), 1731-1736.
35. Lovinger, A. J.; Davis, D. D., Solution Crystallization of Poly(Ether Ether Ketone). Macromolecules 1986, 19,
(7), 1861-1867.
36. Lovinger, A. J.; Hudson, S. D.; Davis, D. D., High-Temperature Crystallization and Morphology of Poly(Aryl
Ether Ether Ketone). Macromolecules 1992, 25, (6), 1752-1758.
37. Kruger, K. N.; Zachmann, H. G., Investigation of the Melting Behavior of Poly(Aryl Ether Ketones) by

72
Simultaneous Measurements of Saxs and Waxs Employing Synchrotron-Radiation. Macromolecules 1993, 26, (19),
5202-5208.
38. Sohn, S.; Alizadeh, A.; Marand, H., On the multiple melting behavior of bisphenol-A polycarbonate. Polymer
2000, 41, (25), 8879-8886.
39. Minakov, A. A.; Mordvintsev, D. A.; Schick, C., Melting and reorganization of poly(ethylene terephthalate) on
fast heating (1000 K/s). Polymer 2004, 45, (11), 3755-3763.
40. Minakov, A. M., J.; Hashimoto, T.; Huth, H.; Schick, C., , Temperature distribution in a thin-film chip utilized
for advanced nanocalorimetry. Measurement Science & Technology 2006, 17, (1), 199-207.
41. Papageorgiou, G. Z.; Achilias, D. S.; Bikiaris, D. N., Crystallization kinetics of biodegradable poly(butylene
succinate) under isothermal and non-isothermal conditions. Macromolecular Chemistry and Physics 2007, 208, (12),
1250-1264.
42. Efremov, M. Y.; Olson, E. A.; Zhang, M.; Lai, S. L.; Schiettekatte, F.; Zhang, Z. S.; Allen, L. H., Thin-film
differential scanning nanocalorimetry: heat capacity analysis. Thermochimica Acta 2004, 412, (1-2), 13-23.
43. Efremov, M. Y.; Olson, E. A.; Zhang, M.; Schiettekatte, F.; Zhang, A.; Allen, L. H., Ultrasensitive,fast,thin-film
differential scanning calorimeter. Review of Scientific Instruments 2004, 75, 179-191.
44. Zhuravlev, E.; Schick, C., Fast scanning power compensated differential scanning nano-calorimeter: 1. The
device. Thermochimica Acta 2010, 505, (1-2), 1-13.
45. Zhuravlev, E.; Schick, C., Fast scanning power compensated differential scanning nano-calorimeter: 2. Heat
capacity analysis. Thermochimica Acta 2010, 505, (1-2), 14-21.
46. Minakov, A. A.; Schick, C., Ultrafast thermal processing and nanocalorimetry at heating and cooling rates up to
1 MK/s. Review of Scientific Instruments 2007, 78, (7), -.
47. Minakov, A. A.; Mordvintsev, D. A.; Tol, R.; Schick, C., Melting and reorganization of the crystalline fraction
and relaxation of the rigid amorphous fraction of isotactic polystyrene on fast heating (30,000 K/min).
Thermochimica Acta 2006, 442, (1-2), 25-30.
48. Flory, P. J., Thermodynamics of crystallization in high polymers. IV. A theory of crystalline states and fusion in
polymers, copolymers, and their mixtures with diluents. J. Chem. Phys. 1949, 17, (3), 223.
49. Flory, P.; Mandelkern, L.; Hall, H., Crystallization in high polymers. VII. Heat of fusion of
poly-(N,N'-sebacoylpiperazine) and its interaction with diluents. J. Am. Chem. Soc. 1951, 73, 2532-2538.
50. Flory, P. J., Theory of crystallization in copolymers. Transactions of the Faraday Society 1955, 51, 848-57.
51. Flory, P.; Evans, R.; Mighton, H., J. Am. Chem. Soc. 1950, 72, 2018-2528.
52. Alamo, R.; Domszy, R.; Mandelkern, L., Thermodynamic and Structural-Properties of Copolymers of Ethylene.
Journal of Physical Chemistry 1984, 88, (26), 6587-6595.
53. Peeters, M.; Goderis, B.; Vonk, C.; Reynaers, H.; Mathot, V., Morphology of homogeneous copolymers of
ethene and 1-octene .1. Influence of thermal history on morphology. Journal of Polymer Science Part B-Polymer
Physics 1997, 35, (16), 2689-2713.
54. Chum, P. S.; Kruper, W. J.; Guest, M. J., Materials properties derived from INSITE metallocene catalysts.
Advanced Materials 2000, 12, (23), 1759-1767.
55. Bensason, S.; Minick, J.; Moet, A.; Chum, S.; Hiltner, A.; Baer, E., Classification of homogeneous
ethylene-octene copolymers based on comonomer content. Journal of Polymer Science Part B-Polymer Physics
1996, 34, (7), 1301-1315.
56. Struik, L., Physical ageing in amorphous polymers and other materials. Elsevier: Amsterdam, 1978.

73
57. Hutchinson, J., Physical Aging of Polymers. Prog Polym Sci 1995, 20, (4), 703.
58. Greiner, R.; Schwarzl, F. R., Volume Relaxation and Physical Aging of Amorphous Polymers .1. Theory of
Volume Relaxation after Single Temperature Jumps. Colloid and Polymer Science 1989, 267, (1), 39-47.
59. Slobodian, P.; Riha, P.; Rychwalski, R. W.; Emri, I.; Saha, P.; Kubat, J., The relation between relaxed enthalpy
and volume during physical aging of amorphous polymers and selenium. European Polymer Journal 2006, 42, (10),
2824-2837.
60. Kovacs, A. J., Fortsch. Hochpolymer Forschung 1963, 3, 394.
61. Struik, L. C. E., The long-term physical ageing of polypropylene at room temperature. Plastics and Rubber
Processing and Applications 1982, 2, (1), 41.
62. Struik, L. C. E., Mechanical behaviour and physical ageing of semi-crystalline polymers:1. Polymer 1987, 28,
1521.
63. Struik, L. C. E., Mechanical behaviour and physical ageing of semi-crystalline polymers:2. Polymer 1987, 28,
1534.
64. Struik, L. C. E., Mechanical behaviour and physical ageing of semi-crystalline polymers:3. Prediction of long
term creep from short time tests. Polymer 1989, 30, 799.
65. Struik, L. C. E., Mechanical behaviour and physical ageing of semi-crystalline polymers:4. Polymer 1989, 30,
815.
66. Struik L. C. E., "Physical Aging", in "Encyclopedia of Polymer Science and Engineering". Wiley: New York,
2nd ed., vol. 1, 1984-1990; p 595.
67. Chai, C. K.; Mccrum, N. G., Mechanism of Physical Aging in Crystalline Polymers. Polymer 1980, 21, (6),
706-712.
68. Read, B. E., Effects of physical ageing on creep in polypropylene. Polymer 1988, 29, 2159.
69. Hellinckx, S., A Quantitative Model Describing Physical Aging in Isotactic Polypropylenes. Colloid and
Polymer Science 1995, 273, (2), 130-137.
70. Marand, H., private communication.
71. Prabhu, V.; Marand, H., unpublished results.
72. Hodge, I. M., Effects of Annealing and Prior History on Enthalpy Relaxation in Glassy-Polymers .6.
Adam-Gibbs Formulation of Nonlinearity. Macromolecules 1987, 20, (11), 2897-2908.
73. Hodge, I. M.; Berens, A. R., Effects of Annealing and Prior History on Enthalpy Relaxation in
Glassy-Polymers .5. Mathematical-Modeling of Nonthermal Preaging Perturbations. Macromolecules 1985, 18, (10),
1980-1984.
74. Hodge, I. M., Effects of Annealing and Prior History on Enthalpy Relaxation in Glassy-Polymers .4.
Comparison of 5 Polymers. Macromolecules 1983, 16, (6), 898-902.
75. Hodge, I. M.; Huvard, G. S., Effects of Annealing and Prior History on Enthalpy Relaxation in
Glassy-Polymers .3. Experimental and Modeling Studies of Polystyrene. Macromolecules 1983, 16, (3), 371-375.
76. Berens, A. R.; Hodge, I. M., Effects of Annealing and Prior History on Enthalpy Relaxation in
Glassy-Polymers .1. Experimental-Study on Polyvinyl-Chloride). Macromolecules 1982, 15, (3), 756-761.
77. Hodge, I. M.; Berens, A. R., Effects of Annealing and Prior History on Enthalpy Relaxation in
Glassy-Polymers .2. Mathematical-Modeling. Macromolecules 1982, 15, (3), 762-770.
78. Hodge, I. M., Enthalpy Relaxation and Recovery in Amorphous Materials. Journal of Non-Crystalline Solids
1994, 169, (3), 211-266.

74
79. Unpublished result from Marand’s group.
80. Tso, C. C.; DesLauriers, P. J., Comparison of methods for characterizing comonomer composition in ethylene
1-olefin copolymers: 3D-TREF vs. SEC-FTIR. Polymer 2004, 45, (8), 2657-2663.
81. Gabriel, C.; Lilge, D., Comparison of different methods for the investigation of the short-chain branching
distribution of LLDPE. Polymer 2001, 42, (1), 297-303.
82. Zhang, M. Q.; Lynch, D. T.; Wanke, S. E., Characterization of commercial linear low-density polyethylene by
TREF-DSC and TREF-SEC cross-fractionation. Journal of Applied Polymer Science 2000, 75, (7), 960-967.
83. Wunderlich, B., Macromolecular physics in: crystal melting. 1980, Vol. 3, New York, Academic Press.
84. Doak, K. W., Encycl. Polym. Sci. Eng. , 2nd edn., Wiley Interscience, 2nd edn. 1986, vol 6, 383.
85. Kissin, Y. V., Kirk-Othmer Encycl. Chem. Technol. , Vol. 17, 4th edn., Wiley Interscience. 1996, 702.
86. Alger, M., Polymer Science Dictionary, 2nd edn. Chapman and Hall, 2nd edn. 1997.
87. Alfonso, G. C.; Pedemonte, E.; Ponzetti, L., Mechanism of Densification and Crystal Perfection of
Poly(Ethylene-Terephthalate). Polymer 1979, 20, (1), 104-112.
88. VanderHart, D. L.; Snyder, C. R., Proton NMR characterization of room-temperature aging after modest
thermal cycling in isotactic polypropylenes. Macromolecules 2003, 36, (13), 4813-4826.
89. See the website of Mettler-toledo: www.mt.com.