crystallographic structure of the foliated calcite of bivalvesgrupo179/pdf/checa 07a.pdf ·...
TRANSCRIPT
Journal of
www.elsevier.com/locate/yjsbi
Journal of Structural Biology 157 (2007) 393–402
StructuralBiology
Crystallographic structure of the foliated calcite of bivalves
Antonio G. Checa a,*, Francisco J. Esteban-Delgado a, Alejandro B. Rodrıguez-Navarro b
a Departamento de Estratigrafıa y Paleontologıa, Facultad de Ciencias, Universidad de Granada, Avenida Fuentenueva s/n, 18071 Granada, Spainb Departamento de Mineralogıa y Petrologıa, Facultad de Ciencias, Universidad de Granada, Avenida Fuentenueva s/n, 18071 Granada, Spain
Received 9 May 2006; received in revised form 22 September 2006; accepted 24 September 2006Available online 11 October 2006
Abstract
The foliated layer of bivalves is constituted by platy calcite crystals, or laths, surrounded by an organic layer, and which are arrangedinto sheets (folia). Therefore, the foliated microstructure can be considered the calcitic analogue to nacre. In this paper, the foliatedmicrostructure has been studied in detail using electron and X-ray diffraction techniques, together with SEM observations on naturallydecalcified shells, to investigate the crystallographic organization on different length scales and to resolve among previous contradictoryresults. This layer is highly organized and displays a coherent crystallographic orientation. The surface of the laths of the foliated layer isconstituted by calcite crystals oriented with their c-axis tilted opposite to the growth direction of the laths and one of its f10�14g rhom-bohedral faces looking in the growth direction. These faces are only expressed as the terminal faces of the laths, whereas the main sur-faces of laths coincide with f10�18g rhombohedral faces. This arrangement was consistently found in all specimens studied, which leadsus to the provisional conclusion that, unlike previous studies, there is only one possible crystallographic arrangement for the foliatedlayer. Future studies on other species will help to ascertain this assertion.� 2006 Elsevier Inc. All rights reserved.
Keywords: Biomineralisation; Microstructure; Shell; Calcite; Foliated layer; Bivalves; Oysters; Scallops; Electron back scattering diffraction; X-raydiffraction
1. Introduction
Foliated microstructure is defined as being composed ofblade-like elongate parallel crystals (laths) of calcite witharrow-point endings which coalesce laterally forming lam-inae (folia) (Fig. 1). The folia dip uniformly over largeareas and usually reach the surface of secretion of the shellat a reduced angle. Clear descriptions of the morphologyand mode of growth of the foliated layer can be found inTaylor et al. (1969) and Carter (1980).
The foliated layer is particularly frequent in bivalves,where it forms the bulk of the shells of several epibenthicgroups (Table 1). It is present in the Middle Cambrianbivalve Tuarangia (MacKinnon, 1982; Runnegar, 1985;Berg-Madsen, 1987), but it does not reappear until the
1047-8477/$ - see front matter � 2006 Elsevier Inc. All rights reserved.
doi:10.1016/j.jsb.2006.09.005
* Corresponding author. Fax: +34 958 248528.E-mail address: [email protected] (A.G. Checa).
Upper Devonian (in the pectinoid genus Saharopteria,e.g., Carter, 1990), from whence it has been increasinglyfrequent in bivalves.
The typical foliated fabric is also found in some limpets(e.g., Carter and Hall, 1990). Outside the Mollusca, it hasbeen described in cyclostome bryozoans (Taylor and Wee-don, 2000) and a similar microstructure (the calcitic cross-bladed lamination; see, e.g., Williams, 1997) also occurs insome articulate brachiopods.
The foliated microstructure has been studied by manyauthors (see introduction in Runnegar, 1984), but only afew have described the crystallographic orientation of crys-tals in this microstructure. Fig. 2 summarizes the basicinformation regarding crystal orientation and the tech-niques used in previous studies. It can be observed thatcrystallographic orientations reported by different authorsvary substantially and are clearly in conflict with eachother. Among these studies, the most comprehensive is thatof Runnegar (1984), which comprises several families. This

Table 1Bivalve families with foliated layers
Order OstreoidaSuperfamily Ostreoidea: families Ostreidae*, GryphaeidaeSuperfamily Pectinoidea: families Pectinidae*, Propeamussiidae*,SpondylidaeSuperfamily Anomioidea: families Anomiidae*, Placunidae*
Order LimoidaSuperfamily Limoidea: family Limidae
Asterisks indicate the groups studied.
Fig. 1. Surface views of the foliated layers of A. ephippium (A and B) and O. edulis (C and D) showing the different degrees of coplanarity of laths anddevelopment of folia. Arrows indicate growth direction of the shell.
Fig. 2. Interpretations of the crystallography of the foliated layers inprevious studies (see above-mentioned references for further information).
394 A.G. Checa et al. / Journal of Structural Biology 157 (2007) 393–402
author proposes more than one solution within single fam-ilies (Ostreidae and Pectinidae) and even species (Crassos-
trea virginica). This uncertainty could be due either to:(1) a high variability of the crystallographic properties ofsuch microstructures or (2) ambiguity in the determinationof the crystallographic orientation resulting from the tech-niques used. The first possibility is not likely since organ-isms displaying this microstructure type (i.e., bivalves) areknown to control the orientation and disposition of crys-tals. This control is exerted by different, genetically definedfactors and results in highly reproducible microstructuralcharacteristics displayed by organisms belonging to thesame group (Addadi and Weiner, 1992). Regarding the sec-ond possibility, previous authors have determined crystalorientation using XRD, TEM, and other types of micros-copy (OM, AFM). Crystal orientation cannot be preciselyand unambiguously determined based on morphologyalone obtained by optical, scanning electron or atomicforce microscopy. TEM provides much more precise infor-mation about crystal orientation of a thin sectioned sample
by means of selected area electron diffraction (SAED).Nevertheless, SAED patterns obtained are sections of thereciprocal space and in order to define the disposition ofthe main crystallographic axes, the sample needs to becut and oriented adequately (Beeston et al., 1986). Further-
A.G. Checa et al. / Journal of Structural Biology 157 (2007) 393–402 395
more, SAED patterns are from a very small sample area(�0.5 lm in diameter) and only provide information aboutthe orientation of individual crystals and not about thelong range order of crystals in the shell. Conventional h–2h scans determined by XRD give only limited informationabout the preferential orientation of crystals (Rodrıguez-Navarro et al., 2002). To determine the three-dimensionalcrystallographic orientation, other techniques are avail-able, including XRD texture analysis and electron backscatter diffraction (EBSD). These techniques provide muchmore detailed and unambiguous information of the 3-Ddisposition of crystals than do the previously mentionedtechniques. They provide the distribution of pole densitiesof crystallographic directions needed to define the orienta-tion of crystals. Additionally, these two techniques arecomplementary and give high resolution information aboutthe organization of crystals on different scales from milli-meters (XRD texture analysis) to micrometers (EBSD).While the first technique gives statistical information ofthe disposition of crystals in the shell, the second yieldsdetailed local information about the orientation of individ-ual crystals. XRD texture analysis has been applied tostudy different shell microstructure types (see Chateigneret al., 2000, and references therein) but not the foliatedmicrostructure. Our study has been based mainly on theabove mentioned two techniques.
The crystallographic structure is a basic ultrastructuralaspect and is a prerequisite for further studies dealing withmorphogenetic, evolutionary-systematic and, even, biomi-metic aspects. Our study aims to determine the main crys-tallographic directions of crystals of the foliated layer andwhether there is more than one crystallographicarrangement.
2. Materials and methods
2.1. Materials
The following species have been investigated: the oystersOstrea edulis Linnaeus, 1758, Ostrea puelchana D’Orbigny,1842 and Crassostrea gigas (Thunberg, 1873) (Ostreidae),the scallops Pecten maximus Linnaeus, 1758, Aequipecten
opercularis (Linnaeus, 1758), Mimachlamys varia (Linnae-us, 1758) (Pectinidae), Adamussium colbecki (Smith,1902), Propeamussium jeffreysi (Smith, 1885) and Prope-
amussium sibogai (Dautzenberg and Bavay, 1904) (Propea-mussiidae), the window-pane shell Placuna placenta
(Linnaeus, 1758) (Placunidae), and the saddle shell Anomia
ephippium (Linnaeus, 1758) (Anomiidae). Except for O.
puelchana, A. colbecki, Pr. sibogai, Pr. jeffreysi, and P. pla-
centa, we always observed shells of freshly killed animals(caught in the Mediterranean coast of Andalucıa, Spain).Specimens of M. varia, P. maximus and A. ephippium werekept alive for some two weeks in aquaria. Probably due tothe shortage of food, the interior of the valves showed adelicate dissolution of the constituent crystallites and theirorganic envelopes, which revealed its ultrastructure.
2.2. Scanning electron microscopy
SEM observation of nacre crystals was carried out bothin fractured specimens and in the shell interiors. Sampleswere usually observed intact, although in some we removedeither the organic [with 5% NaOH for one to two hours orproteinase K (1 mg ml�1) from 1 to 20 min] or mineralmatter (2–4% EDTA) at room temperature. Samples werecoated either with carbon (UHS evaporator, Hitachi,Japan) for FESEM observation (Gemini 1530, Leo, Ger-many) and Ultra-high resolution FESEM (S-5200, Hitachi,Japan).
2.3. X-ray diffraction
The three-dimensional orientation of the shell crystalswas determined using an X-ray single diffractometerequipped with an area detector (D8 SMART APEX, Bru-ker, Germany). For diffraction experiments, the workingconditions were: Mo Ka, 50 KV and 30 mA, a pin-hole col-limator of 0.5 mm in diameter, and an exposure time of20 s per frame. Shell samples were measured by reflection(diffractometer x and 2h angles were set at 10 and 20�,respectively) without polishing the surface. A set of frames(2-D diffraction patterns) was registered while rotating thesample around / angle (a frame every degree; a total of 180frames). Pole densities for the strongest calcite reflections(102, 104, 006, 110, 113, 202, 018, and 116) were calculatedusing XRD2DScan software (www.ugr.es/~anava/xrd2dscan.htm) and displayed in stereographic projectionusing specially designed visualization software. Each polefigure displays the intensity variation of a given hkl reflec-tion as a function of the sample orientation (Fig. 3). Fromthese plots, the 3-D orientation of associated {hkl} crystalfaces can be observed. Pole figures calculated in this waywere compared to those measured using a conventionalX-ray texture diffractometer (D-5000, Siemens, Germany).
Pole figures were registered for O. edulis, O. puelchana,P. maximus, M. varia, A. colbecki, Pr. sibogai, P. placenta,and A. ephippium shells.
2.4. Electron diffraction
The electron back scatter diffraction (EBSD) techniqueanalyzes the diffraction pattern produced when backscat-tered electrons are diffracted by a crystalline material. Thispattern provides information about the orientation of thecrystal lattice and the space group of the crystal structure(Randle, 2000). Using the scanning capabilities of a SEM(XL-30, Philips, The Netherlands), data from differentpositions can be either integrated into an orientation mapor processed to obtain pole figures, pole plots or rockingcurves resembling those obtained by X-ray diffraction.We have used the same system of representation (stereo-graphic projection) as for XRD data. This technique pro-vides resolution on a lm scale and is therefore a goodcomplement to the broader scale, X-ray-based techniques
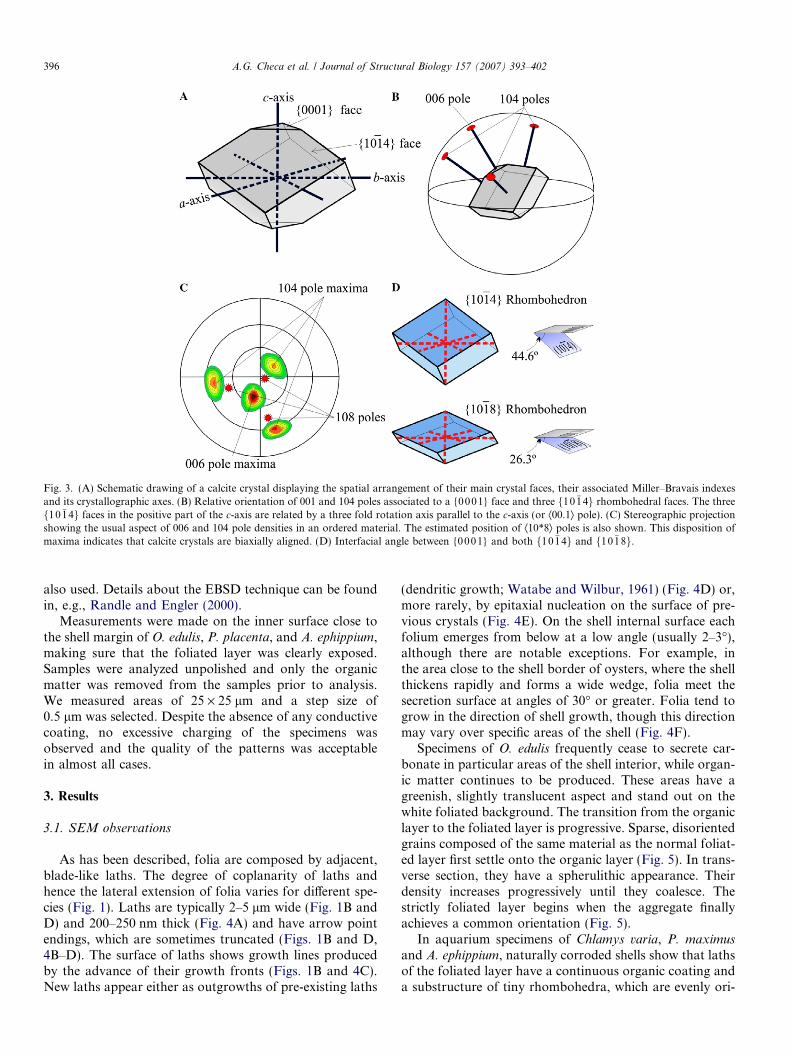
Fig. 3. (A) Schematic drawing of a calcite crystal displaying the spatial arrangement of their main crystal faces, their associated Miller–Bravais indexesand its crystallographic axes. (B) Relative orientation of 001 and 104 poles associated to a {0001} face and three f10�14g rhombohedral faces. The threef10�14g faces in the positive part of the c-axis are related by a three fold rotation axis parallel to the c-axis (or Æ00.1æ pole). (C) Stereographic projectionshowing the usual aspect of 006 and 104 pole densities in an ordered material. The estimated position of Æ10*8æ poles is also shown. This disposition ofmaxima indicates that calcite crystals are biaxially aligned. (D) Interfacial angle between {0001} and both f10�14g and f10�18g.
396 A.G. Checa et al. / Journal of Structural Biology 157 (2007) 393–402
also used. Details about the EBSD technique can be foundin, e.g., Randle and Engler (2000).
Measurements were made on the inner surface close tothe shell margin of O. edulis, P. placenta, and A. ephippium,making sure that the foliated layer was clearly exposed.Samples were analyzed unpolished and only the organicmatter was removed from the samples prior to analysis.We measured areas of 25 · 25 lm and a step size of0.5 lm was selected. Despite the absence of any conductivecoating, no excessive charging of the specimens wasobserved and the quality of the patterns was acceptablein almost all cases.
3. Results
3.1. SEM observations
As has been described, folia are composed by adjacent,blade-like laths. The degree of coplanarity of laths andhence the lateral extension of folia varies for different spe-cies (Fig. 1). Laths are typically 2–5 lm wide (Fig. 1B andD) and 200–250 nm thick (Fig. 4A) and have arrow pointendings, which are sometimes truncated (Figs. 1B and D,4B–D). The surface of laths shows growth lines producedby the advance of their growth fronts (Figs. 1B and 4C).New laths appear either as outgrowths of pre-existing laths
(dendritic growth; Watabe and Wilbur, 1961) (Fig. 4D) or,more rarely, by epitaxial nucleation on the surface of pre-vious crystals (Fig. 4E). On the shell internal surface eachfolium emerges from below at a low angle (usually 2–3�),although there are notable exceptions. For example, inthe area close to the shell border of oysters, where the shellthickens rapidly and forms a wide wedge, folia meet thesecretion surface at angles of 30� or greater. Folia tend togrow in the direction of shell growth, though this directionmay vary over specific areas of the shell (Fig. 4F).
Specimens of O. edulis frequently cease to secrete car-bonate in particular areas of the shell interior, while organ-ic matter continues to be produced. These areas have agreenish, slightly translucent aspect and stand out on thewhite foliated background. The transition from the organiclayer to the foliated layer is progressive. Sparse, disorientedgrains composed of the same material as the normal foliat-ed layer first settle onto the organic layer (Fig. 5). In trans-verse section, they have a spherulithic appearance. Theirdensity increases progressively until they coalesce. Thestrictly foliated layer begins when the aggregate finallyachieves a common orientation (Fig. 5).
In aquarium specimens of Chlamys varia, P. maximus
and A. ephippium, naturally corroded shells show that lathsof the foliated layer have a continuous organic coating anda substructure of tiny rhombohedra, which are evenly ori-

Fig. 4. (A) Cross sectional view of the foliated layer of O. edulis. (B) Terminal faces of laths in C. varia, some of which can be interpreted as f10�14grhombohedral faces. (C) Terminal f10�14g faces in the foliated layer of Propeamussium dalli. (D) Dendritic growth of laths in the foliated layer of C. varia.(E) Epitaxial nucleation of new laths in the foliated layer of O. edulis. (F) Differently oriented sets of folia in O. edulis. Arrows indicate the growth directionof the folia.
Fig. 5. Transition between an organic layer (dark area in the center micrograph) and the normal foliated layer (white area) on the internal shell surface ofO. edulis. The process of calcification progresses towards the right bottom side. It initiates with the deposition of isolated and disoriented foliated grains(upper left micrograph); background bulges are calcite rhombohedra formed within the organic layer. When the density and size of grains increases theybegin to interact with each other although the whole is highly disoriented (upper right micrograph). The material becomes highly organized shortly aftercarpeting of the organic surface is completed (lower right micrograph).
A.G. Checa et al. / Journal of Structural Biology 157 (2007) 393–402 397
ented and also co-oriented with those of neighbouring lathsand folia (Fig. 6A and B). The orientation of corrosionrhombohedra is consistent in the three species examinedand there is always a rhombohedral face (the one whichis the best exposed in plan view) looking in the directionof growth while the other two are looking backwards. Inlateral view, the face looking forwards is less inclined withrespect to the lath surface than the edge of the faces look-ing backward. Their outlines form an angle greater than90� (Fig. 6C).
3.2. X-ray and electron diffraction
Pole figures determined either by XRD or EBSD in thedifferent shells analysed are always consistent, so we willrefer to them without distinction. A selection of samplesis shown in Figs. 7 and 8. We should stress that 006 and001 pole figures determined by XRD and EBSD, respec-tively, represent the orientation of {0001} crystal planesof calcite and are equivalent. In all specimens studied, the006/001 pole figures display one single maxima at a vari-
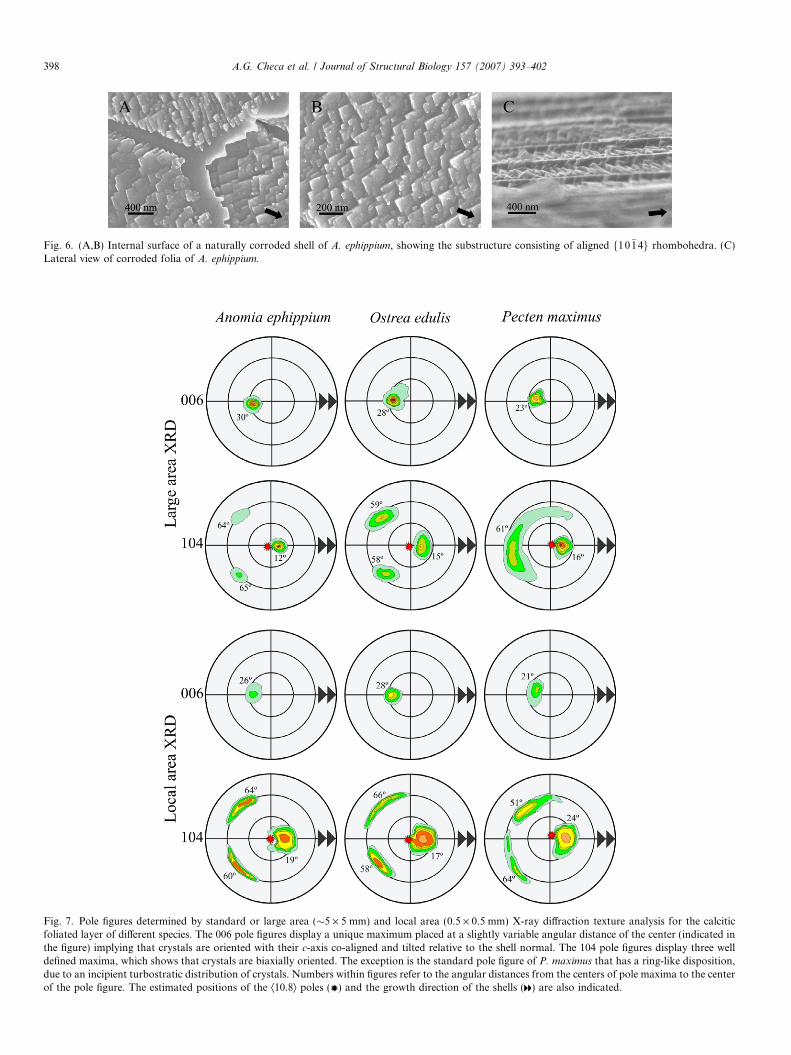
Fig. 6. (A,B) Internal surface of a naturally corroded shell of A. ephippium, showing the substructure consisting of aligned f10�14g rhombohedra. (C)Lateral view of corroded folia of A. ephippium.
Fig. 7. Pole figures determined by standard or large area (�5 · 5 mm) and local area (0.5 · 0.5 mm) X-ray diffraction texture analysis for the calciticfoliated layer of different species. The 006 pole figures display a unique maximum placed at a slightly variable angular distance of the center (indicated inthe figure) implying that crystals are oriented with their c-axis co-aligned and tilted relative to the shell normal. The 104 pole figures display three welldefined maxima, which shows that crystals are biaxially oriented. The exception is the standard pole figure of P. maximus that has a ring-like disposition,due to an incipient turbostratic distribution of crystals. Numbers within figures refer to the angular distances from the centers of pole maxima to the centerof the pole figure. The estimated positions of the Æ10.8æ poles ( ) and the growth direction of the shells ( ) are also indicated.
398 A.G. Checa et al. / Journal of Structural Biology 157 (2007) 393–402
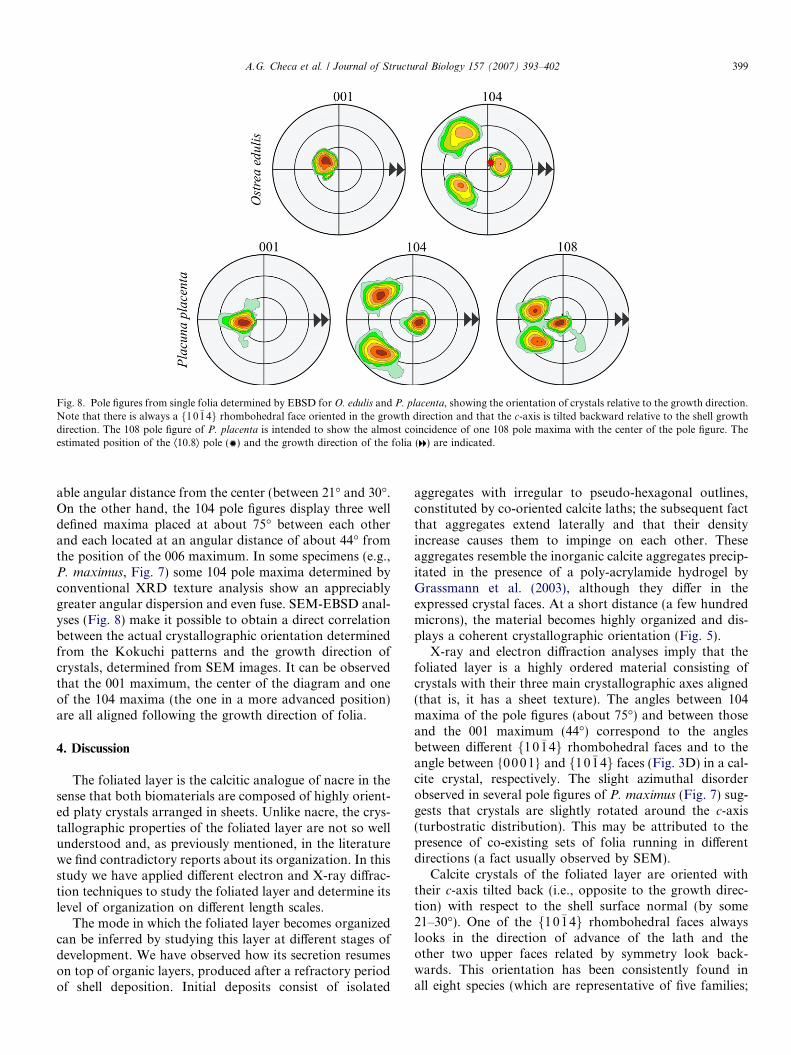
Fig. 8. Pole figures from single folia determined by EBSD for O. edulis and P. placenta, showing the orientation of crystals relative to the growth direction.Note that there is always a f10�14g rhombohedral face oriented in the growth direction and that the c-axis is tilted backward relative to the shell growthdirection. The 108 pole figure of P. placenta is intended to show the almost coincidence of one 108 pole maxima with the center of the pole figure. Theestimated position of the Æ10.8æ pole ( ) and the growth direction of the folia ( ) are indicated.
A.G. Checa et al. / Journal of Structural Biology 157 (2007) 393–402 399
able angular distance from the center (between 21� and 30�.On the other hand, the 104 pole figures display three welldefined maxima placed at about 75� between each otherand each located at an angular distance of about 44� fromthe position of the 006 maximum. In some specimens (e.g.,P. maximus, Fig. 7) some 104 pole maxima determined byconventional XRD texture analysis show an appreciablygreater angular dispersion and even fuse. SEM-EBSD anal-yses (Fig. 8) make it possible to obtain a direct correlationbetween the actual crystallographic orientation determinedfrom the Kokuchi patterns and the growth direction ofcrystals, determined from SEM images. It can be observedthat the 001 maximum, the center of the diagram and oneof the 104 maxima (the one in a more advanced position)are all aligned following the growth direction of folia.
4. Discussion
The foliated layer is the calcitic analogue of nacre in thesense that both biomaterials are composed of highly orient-ed platy crystals arranged in sheets. Unlike nacre, the crys-tallographic properties of the foliated layer are not so wellunderstood and, as previously mentioned, in the literaturewe find contradictory reports about its organization. In thisstudy we have applied different electron and X-ray diffrac-tion techniques to study the foliated layer and determine itslevel of organization on different length scales.
The mode in which the foliated layer becomes organizedcan be inferred by studying this layer at different stages ofdevelopment. We have observed how its secretion resumeson top of organic layers, produced after a refractory periodof shell deposition. Initial deposits consist of isolated
aggregates with irregular to pseudo-hexagonal outlines,constituted by co-oriented calcite laths; the subsequent factthat aggregates extend laterally and that their densityincrease causes them to impinge on each other. Theseaggregates resemble the inorganic calcite aggregates precip-itated in the presence of a poly-acrylamide hydrogel byGrassmann et al. (2003), although they differ in theexpressed crystal faces. At a short distance (a few hundredmicrons), the material becomes highly organized and dis-plays a coherent crystallographic orientation (Fig. 5).
X-ray and electron diffraction analyses imply that thefoliated layer is a highly ordered material consisting ofcrystals with their three main crystallographic axes aligned(that is, it has a sheet texture). The angles between 104maxima of the pole figures (about 75�) and between thoseand the 001 maximum (44�) correspond to the anglesbetween different f10�14g rhombohedral faces and to theangle between {00 01} and f10�14g faces (Fig. 3D) in a cal-cite crystal, respectively. The slight azimuthal disorderobserved in several pole figures of P. maximus (Fig. 7) sug-gests that crystals are slightly rotated around the c-axis(turbostratic distribution). This may be attributed to thepresence of co-existing sets of folia running in differentdirections (a fact usually observed by SEM).
Calcite crystals of the foliated layer are oriented withtheir c-axis tilted back (i.e., opposite to the growth direc-tion) with respect to the shell surface normal (by some21–30�). One of the f10�14g rhombohedral faces alwayslooks in the direction of advance of the lath and theother two upper faces related by symmetry look back-wards. This orientation has been consistently found inall eight species (which are representative of five families;
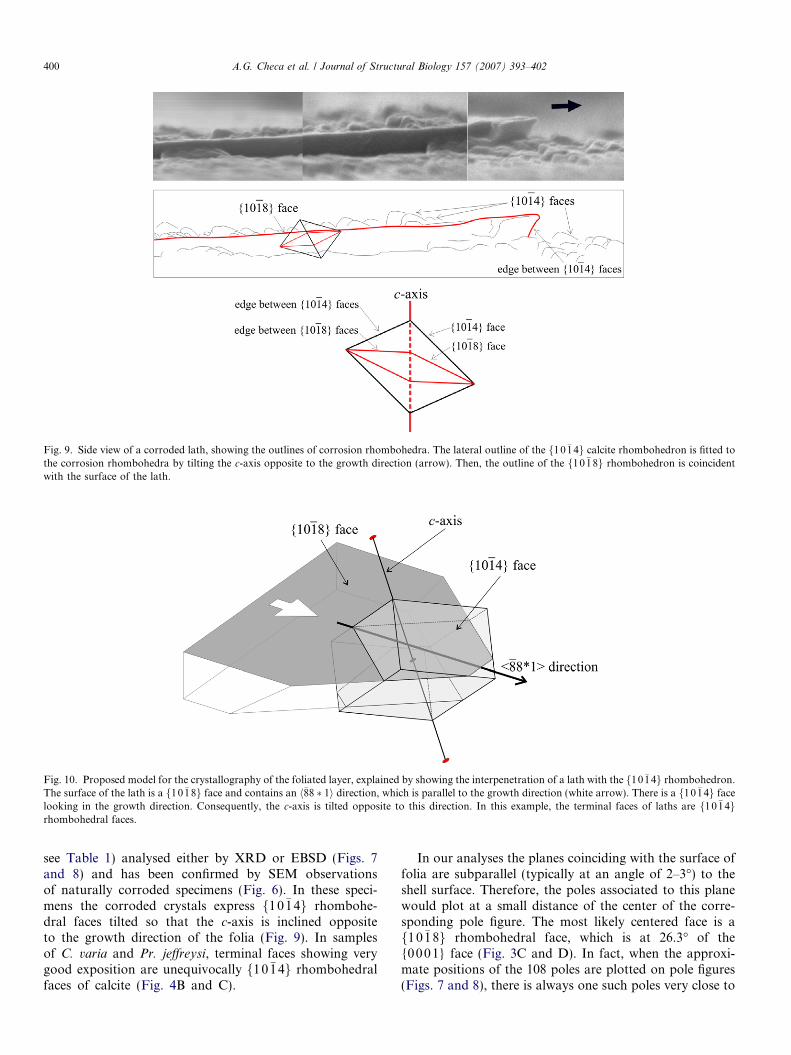
Fig. 9. Side view of a corroded lath, showing the outlines of corrosion rhombohedra. The lateral outline of the f10�14g calcite rhombohedron is fitted tothe corrosion rhombohedra by tilting the c-axis opposite to the growth direction (arrow). Then, the outline of the f10�18g rhombohedron is coincidentwith the surface of the lath.
Fig. 10. Proposed model for the crystallography of the foliated layer, explained by showing the interpenetration of a lath with the f10�14g rhombohedron.The surface of the lath is a f10�18g face and contains an h�88 � 1i direction, which is parallel to the growth direction (white arrow). There is a f10�14g facelooking in the growth direction. Consequently, the c-axis is tilted opposite to this direction. In this example, the terminal faces of laths are f10�14grhombohedral faces.
400 A.G. Checa et al. / Journal of Structural Biology 157 (2007) 393–402
see Table 1) analysed either by XRD or EBSD (Figs. 7and 8) and has been confirmed by SEM observationsof naturally corroded specimens (Fig. 6). In these speci-mens the corroded crystals express f10�14g rhombohe-dral faces tilted so that the c-axis is inclined oppositeto the growth direction of the folia (Fig. 9). In samplesof C. varia and Pr. jeffreysi, terminal faces showing verygood exposition are unequivocally f10�14g rhombohedralfaces of calcite (Fig. 4B and C).
In our analyses the planes coinciding with the surface offolia are subparallel (typically at an angle of 2–3�) to theshell surface. Therefore, the poles associated to this planewould plot at a small distance of the center of the corre-sponding pole figure. The most likely centered face is af10�18g rhombohedral face, which is at 26.3� of the{0001} face (Fig. 3C and D). In fact, when the approxi-mate positions of the 108 poles are plotted on pole figures(Figs. 7 and 8), there is always one such poles very close to

A.G. Checa et al. / Journal of Structural Biology 157 (2007) 393–402 401
the center of the pole figure (the maximal deviation mea-sured is 5�. A 108 pole figure derived from EBSD analysesis shown in Fig. 8 and it can be appreciated how a maxi-mum is located centrally. Additionally, the inclination off10�14g rhombohedral faces observed in corroded samplesimplies that one of the f10�18g faces is parallel to the lathsurface (Fig. 9). The crystallographic model so far pro-posed is depicted in Fig. 10. In brief, crystals are preferen-tially oriented with a f10�18g crystal face parallel to thesurface of the laths and a h�88 � 1i direction aligned withthe growth direction (Fig. 10).
We therefore agree with the conclusions of Taylor et al.(1969), and partly, with those of Runnegar (1984) that thelath surfaces are f10�18g rhombohedral faces (Fig. 2). Nev-ertheless, the former authors did not determine axial orien-tations, whereas, unlike us, Runnegar (1984) placed the c-axis inclined forward towards the direction of growth (hisType 2) or at 30� of it (Type 3). He came to the conclusionthat the foliated microstructure of bivalves had three differ-ent crystallographic arrangements (Fig. 2) by taking theangle between the growing edges of laths as an additionaldistinctive criterion. In our opinion, based on the constan-cy of the distribution of pole maxima in the differentgroups analyzed, there is only one crystallographic orienta-tion of calcite crystals in the foliated microstructure.
In biogenic calcite, the expression of faces other than thebasal {00 01} face or the f10�14g cleavage rhombohedraresults from their stabilization by preferential absorptionof specific organic molecules (Addadi and Weiner, 1985).For example, in sea urchin spicules normally expressed fac-es are {hki0} prismatic faces, which are parallel to the c-axis (e.g., Berman et al., 1993). The expressed f10�18g facesof calcite found in the surfaces of folia have neither beendescribed in biomineral systems nor found in inorganicallyprecipitated calcite crystals in which the negative f01�18grhombohedra is expressed instead (e.g., ‘‘nail head’’ calcite;Kostov et al., 1999). Therefore, this type of face must bestabilized by particular molecules from the organic matrix.
5. Conclusions
The combined use of SEM, electron, and X-ray diffrac-tion techniques provides complementary and highlydetailed information about the organization of shell micro-structures on different length scales.
The foliated layer is a highly ordered biomaterial witha very well defined crystallographic orientation whichconsistently displays the same characteristics in the differ-ent groups with this microstructure. Calcite crystals areoriented with their three main axes aligned. They havetheir c-axis tilted back relative to the shell normal (andthe growth direction of folia) and have one of theirf10�18g rhombohedral faces parallel to the lath surface.Further effort is necessary to define both the mechanismsinducing the expression of f10�18g crystallographicplanes and that producing such a high degree of orienta-tion of calcite crystals.
Acknowledgments
We thank Juan de Dios Bueno Perez (CIC, Univ. Gra-nada) for sample preparation, and Joaquın Ramırez andFrancisco Varela Feria (CITIUS, Univ. Sevilla) for EBSD,and SEM operation. This study was supported by ResearchProjects CGL2004-00802 and REN2003-7375 (DGI,MCyT), and by the Research Groups RNM190 andRNM179 (CICE, JA).
References
Addadi, L., Weiner, S., 1985. Interactions between acidic proteins andcrystals: stereochemical requirements in biomineralization. Proc. Natl.Acad. Sci. USA 82, 4110–4114.
Addadi, L., Weiner, S., 1992. Control and design principles in biologicalmineralization. Angew. Chem. 31, 153–169.
Beeston, B.E.P., Horne, R.W., Markham, R., 1986. Electron Diffractionand Optical Diffraction Techniques. North-Holland, Amsterdam.
Berg-Madsen, V., 1987. Tuarangia from Bornholm (Denmark) andsimilarities in Baltoscandian and Australasian late Middle CambrianFaunas. Alcheringa 11, 245–259.
Berman, A., Hanson, J., Leiserowitz, L., Koetzle, T.F., Weiner, S.,Addadi, L., 1993. Biological control of crystal texture: a widespreadstrategy for adapting crystal properties to function. Science 259, 776–779.
Carter, J.G., 1980. Guide to bivalve shell microstructures. In: Rhoads,D.C., Lutz, R.A. (Eds.), Skeletal Growth of Aquatic Organisms.Plenum Press, New York, pp. 645–673.
Carter, J.G., 1990. Chapter 10. Evolutionary significance of shellmicrostructures in the Palaeotaxodonta, Pteriomorphia and Isofili-branchia (Bivalvia: Mollusca). In: Carter, J.G. (Ed.), Skeletal Biomin-eralization: Patterns, Processes and Evolutionary Trends, vol. 1. VanNostrand Reinhold, New York, pp. 135–296.
Carter, J.G., Hall, R.M., 1990. Polyplacophora, Scaphopoda, Archaeo-gastropoda and Paragastropoda (Mollusca). Plates 122–134. In:Carter, J.G. (Ed.), Skeletal Biomineralization: Patterns, Processesand Evolutionary Trends, Atlas and Index, vol. 2. Van NostrandReinhold, New York, pp. 29–51.
Chateigner, D., Hedegaard, C., Wenk, H.-R., 2000. Mollusc shellmicrostructures and crystallographic textures. J. Struct. Geol. 22,1723–1735.
Grassmann, O., Neder, R.B., Putnis, A., Lobmann, P., 2003. Biomimeticcontrol of crystal assembly by growth in an organic hydrogel network.Am. Mineral. 88, 647–652.
Kostov, I., Kostov, R., I., 1999. Crystal habits of minerals. Pensoft, Sofia.MacKinnon, D.I., 1982. Tuarangia paparua n. gen. and n. sp., a late
Middle Cambrian pelecypod from New Zealand. J. Paleontol. 56, 589–598.
Randle, V., 2000. Theoretical framework for electron backscatteringdiffraction. In: Schwartz, A.J., Kumar, M., Adams, B.L. (Eds.),Electron Backscatter Diffraction in Materials Science. Kluwer Aca-demic, New York, pp. 19–30.
Randle, V., Engler, O., 2000. Introduction to Texture Analysis: Macro-texture, Microtexture and Orientation Mapping. Gordon and BreachScience, Amsterdam.
Rodrıguez-Navarro, A.B., Gaines, K.F., Romanek, C.S., Masson, G.R.,2002. Mineralization of clapper rail eggshell from a contaminated saltmarsh system. Arch. Environ. Con. Tox. 43, 449–460.
Runnegar, B., 1984. Crystallography of the foliated calcite shell layers ofbivalve molluscs. Alcheringa 8, 273–290.
Runnegar, B., 1985. Shell microstructures of Cambrian molluscs replicat-ed by phosphate. Alcheringa 9, 245–257.
Sykes, C.S., Wheeler, A.P., Wierzbicki, A., Mount, A.S., Dillaman, R.M.,2000. Nucleation and growth of calcite on native versus pyrolizedoyster shell folia. Biol. Bull. 198, 50–66.

402 A.G. Checa et al. / Journal of Structural Biology 157 (2007) 393–402
Taylor, P.D., Weedon, M.J., 2000. Skeletal ultrastructure and phylogenyof cyclostome bryozoans. Zool. J. Linn. Soc. Lond. 128, 337–399.
Taylor, J.D., Kennedy, W.J., Hall, A., 1969. Shell structure andmineralogy of the Bivalvia. Introduction. Nuculacae-Trigonacae. Bull.British Mus. Nat. Hist. Zool. 3 (Suppl.), 1–125.
Watabe, N., Wilbur, K.M., 1961. Studies on shell formation. IX. Anelectron microscope study of crystal layer formation in the oyster. J.Biophys. Biochem. Cy. 9, 761–771.
Watabe, N., Sharp, D.G., Wilbur, K.M., 1958. Studies on shellformation. VIII. Electron microscopy of crystal growth of thenacreous layer of the oyster Crassostrea virginica. J. Biophys.Biochem. Cy. 4, 281–286.
Williams, A., 1997. Shell structure. In: Kaesler, R.L. (Ed.), Treatise onInvertebrate Paleontology, Part H, Brachiopoda Revised. The Geo-logical Society of America Inc., The University of Kansas, Boulder,Colorado, and Lawrence, KS, pp. 267–320.