cs 376 introduction to computer graphics 01 / 24 / 2007 instructor: michael eckmann
TRANSCRIPT

CS 376Introduction to Computer Graphics
01 / 24 / 2007
Instructor: Michael Eckmann

Michael Eckmann - Skidmore College - CS 376 - Spring 2007
Today’s Topics• Color• visible light, frequency, wavelength• CIE system• chromaticity diagram
– color gamut, complementary colors, dominant wavelength
• RGB, YIQ
• CMY, CMYK, HSV

Homework• READING:
– If you haven't read Ch. 12 yet, do so.
– For next couple of lectures:
• OpenGL / JOGL introduction
• Read sections 2.8 through 2.9 of Chapter 2 – deals with
openGL (using C, but don't let that bother you, the
information is directly applicable to what we'll be doing in
Java with JOGL.)
– Put off the first 7 sections of chapter 2 for now.
Michael Eckmann - Skidmore College - CS 376 - Spring 2007
Michael Eckmann - Skidmore College - CS 376 - Spring 2007
Color
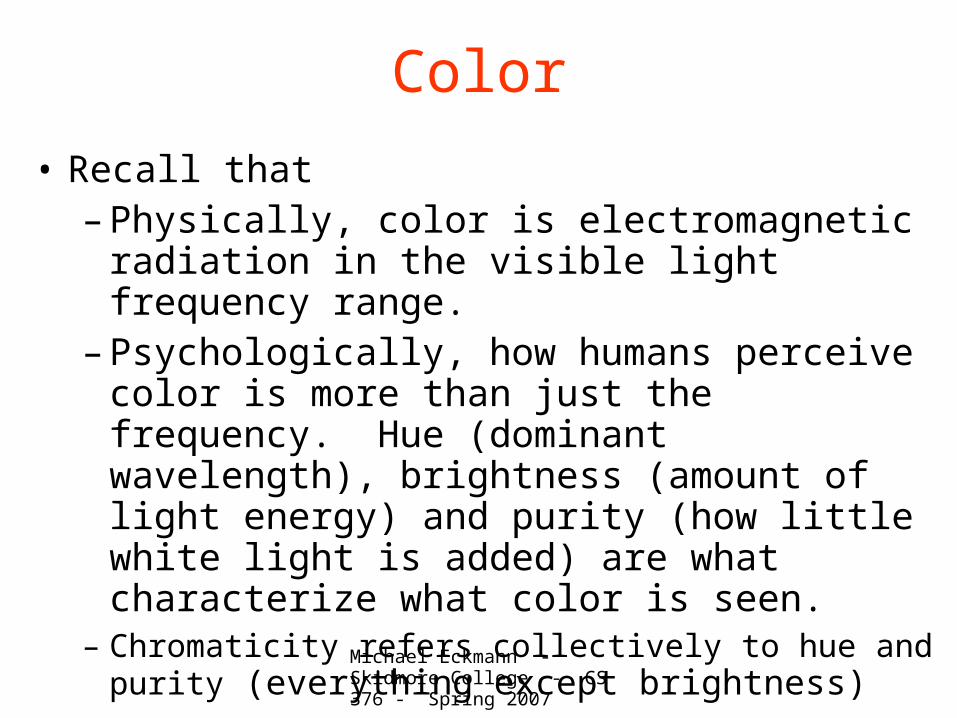
• Recall that – Physically, color is electromagnetic radiation in the
visible light frequency range.– Psychologically, how humans perceive color is more
than just the frequency. Hue (dominant wavelength), brightness (amount of light energy) and purity (how little white light is added) are what characterize what color is seen.
– Chromaticity refers collectively to hue and purity (everything except brightness)

Michael Eckmann - Skidmore College - CS 376 - Spring 2007
Color
• Frequency range of visible light is approx. from:
• (changed this) 4.3*10^14 Hz up to 7.9*10^14 Hz

Michael Eckmann - Skidmore College - CS 376 - Spring 2007
Color• Frequency is measured in Hertz (Hz) which is 1 / seconds
• Wavelength is often used to describe colors where the wavelength = speed of light / frequency
• Speed of light in a vaccum is approx. 3*10^8 m / s
• Visible light’s wavelength range is approximately:
– wavelength of the low frequency end 3.8 * 10^14 Hz is: 3*10^8 m/s / 4.3 * 10^14 Hz = 697 nm (Red end)
– wavelength of the high frequency end of 7.9 * 10^14 Hz is: 3*10^8 m/s / 7.9 * 10^14 Hz = 379 nm (Violet end)
Michael Eckmann - Skidmore College - CS 376 - Spring 2007
Color

Michael Eckmann - Skidmore College - CS 376 - Spring 2007
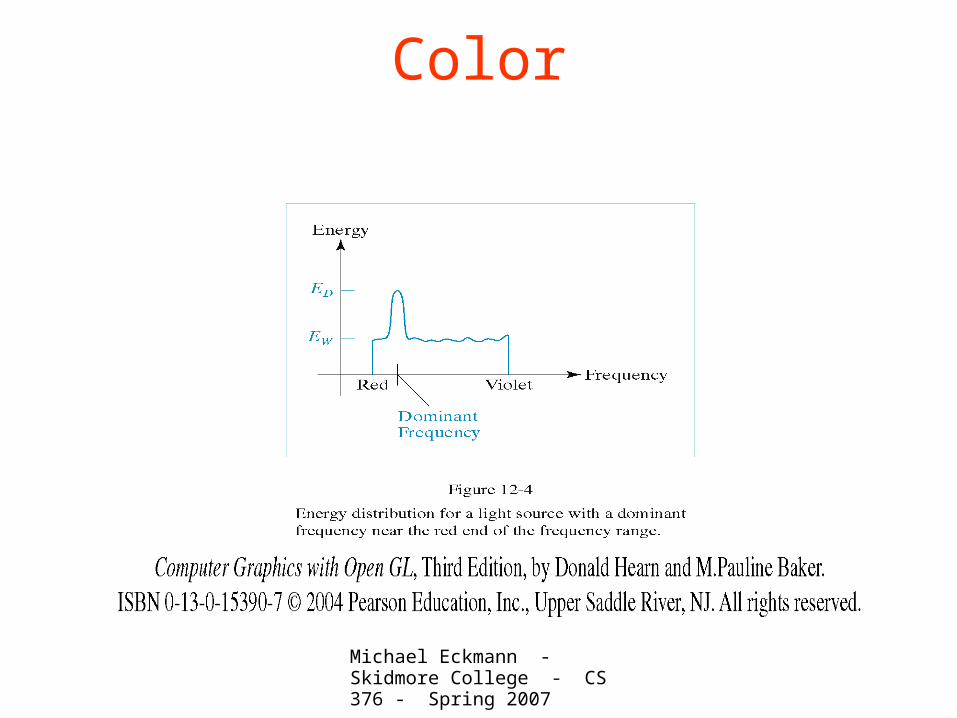
Color• The last slide shows a color that is reddish and fairly pure
due to the fact that ED is >> E
W.
• If the graph contained approximately the same amount of energy of each frequency then it would represent white.
Michael Eckmann - Skidmore College - CS 376 - Spring 2007
Color• If we combine light with different dominant frequencies, we
can create other colors. We combine primary colors in various proportions to make up a wide range of colors known as the color gamut.
• Complementary colors are any two colors that combine to produce white.
• No finite set of light sources can produce all colors. The color gamut of three primary colors is typically sufficient for most purposes.

Michael Eckmann - Skidmore College - CS 376 - Spring 2007
Color• The tristimulus theory of color perception states that the retina in the
human eye has three kinds of color sensors (cones) with peak sensitivies to red, blue and green light.
– Cones (6-8 million in retina, concentrated in fovea) for color / bright
light vision
– Rods (over 100 million in retina, none in fovea) for achromatic
brightness levels / night vision
– fovea is in center of retina --- that's where most of the cones are
– Let's look here for the rod & cone distribution throughout the retina:• http://www.cis.rit.edu/people/faculty/montag/vandplite/pages/chap_9/ch9p1.html
• http://dragon.uml.edu/psych/rodconedistribution.html

Michael Eckmann - Skidmore College - CS 376 - Spring 2007
Color• The tristimulus theory of color perception (continued)
– Experiments have shown that based on this theory that blue's peak is 440 nm, green's is 545 nm, and red's is 580 nm.
– Also, experiments have shown that the eye's response to blue light is much less strong than to red and green.
– Given 3 primary colors, we can combine them with various proportions to produce new colors. Defining colors by mixtures of three primaries is an extremely useful approach.

Michael Eckmann - Skidmore College - CS 376 - Spring 2007
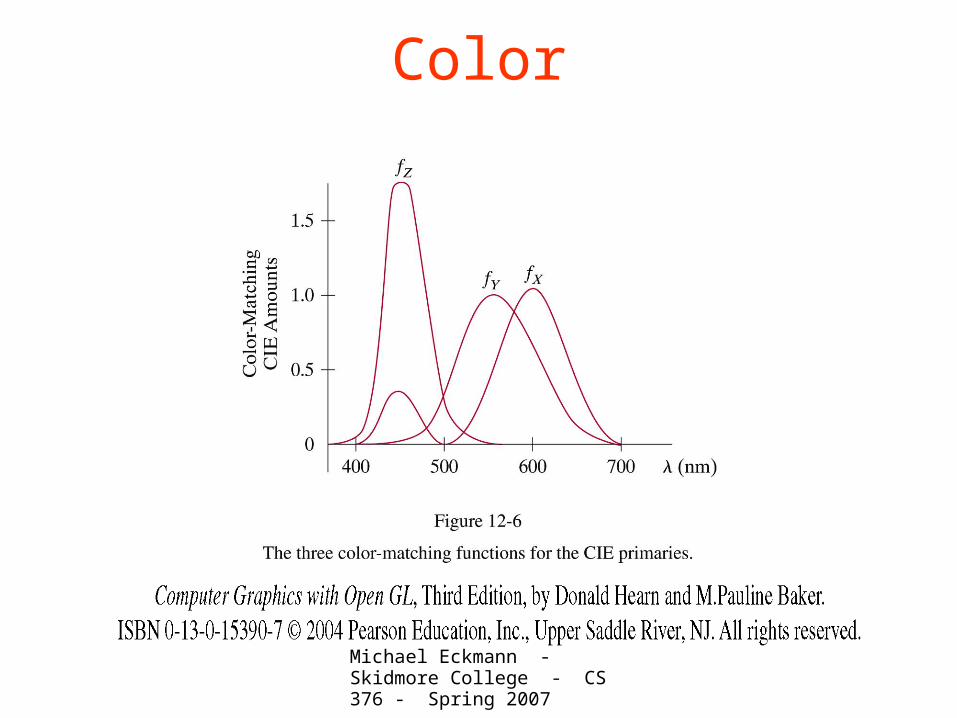
Color• The next slide shows color matching functions f
Z, f
Y and f
X for a
standard set (CIE 1931) of primaries Z, Y and X. These functions were created via experiments in 1931 given to very few subjects where they were asked to match a test color to an adjustable color made up of some combination of the three primaries.
• These three colors X, Y and Z correspond roughly to red, green, and blue respectively. (note this is corrected from last class slide)
• Notice that due to the eye being much less responsive to blue, the color matching function, f
Z, on the blue end of the graph needs
more amount than the others.
Michael Eckmann - Skidmore College - CS 376 - Spring 2007
Color

Michael Eckmann - Skidmore College - CS 376 - Spring 2007
Color• http://cvision.ucsd.edu/cie.htm contains text files with the
amounts of each of the color matching functions needed to produce colors at all the wavelengths between 360 nm and 830 nm.
• The values in the charts correspond to the graph on the last slide. The values are used as weights thusly:
• Color = xX + yY + zZ, where x, y and z are the weights applied to the primaries X, Y and Z.
• x+y+z is the total light energy. We can normalize with respect to this amount.

Michael Eckmann - Skidmore College - CS 376 - Spring 2007
Color• Color = xX + yY + zZ
• x' = x / (x+y+z)
• y' = y / (x+y+z)
• z' = z / (x+y+z)
• Since x' + y' + z' = 1, any color can be represented by just two of the x', y' and z'.
• By normalizing based on the total light energy (brightness) we are only now dealing with hue and purity (collectively known as Chromaticity)
• The graph on the next slide is in 2d and it's x axis corresponds to x' here, and y axis to y' here.

Michael Eckmann - Skidmore College - CS 376 - Spring 2007
Color

Michael Eckmann - Skidmore College - CS 376 - Spring 2007
Color• source:
Wikipedia
Michael Eckmann - Skidmore College - CS 376 - Spring 2007
Color• Chromaticity diagram on the last two slides
– White is formally defined by the point C (which
approximates sunlight)
– All perceivable colors with the same chromaticity but
different brightness map to the same point.
– The spectrally pure colors are on the outer curve.

Michael Eckmann - Skidmore College - CS 376 - Spring 2007
Color

Michael Eckmann - Skidmore College - CS 376 - Spring 2007
Color• The chromaticity diagram is useful for
– comparing color gamuts of different primaries
• is it obvious that no 3 colors within the diagram will produce a
color gamut encompassing all the visible colors?
• 2 colors can combine to make any color along the straight line
segment joining them (C1 to C
2)
– determining complementary colors • how can this be done using the diagram?

Michael Eckmann - Skidmore College - CS 376 - Spring 2007
Color• The chromaticity diagram is useful for
– comparing color gamuts of different primaries
• is it obvious that no 3 colors within the diagram will produce a
color gamut encompassing all the visible colors?
• 2 colors can combine to make any color along the straight line
segment joining them (C1 to C
2)
– determining complementary colors• recall that complementary colors are two that combine
in some way to make white• so if the line segment between two colors contains the
white point then these two are complements of each other.

Michael Eckmann - Skidmore College - CS 376 - Spring 2007
Color

Michael Eckmann - Skidmore College - CS 376 - Spring 2007
Color• The chromaticity diagram is also useful for determining purity
and hue for a color – purity (saturation): ratio of distance of line from color (eg. C
1) to C to
the distance of line from C to spectral color Cs on the outer curve.
– hue (dominant wavelength): draw a line from C through the color C1
to the spectral color curve (the intersection of this line with the outer curve is the hue)
• why? because the color C1 can be represented by some
combination of white ( C ) and the spectral color Cs on the outer
curve.– if the dominant wavelength lands on the “purple line” then ...

Michael Eckmann - Skidmore College - CS 376 - Spring 2007
Color• For the colors (called non-spectral colors) in the chromaticity
diagram that lie such that when drawing a line starting at C through the color will intersect the “purple” line
– the dominant wavelength is the complement of some wavelength
• draw a line from the color C2 through C (white) to the outer
spectral curve Csp
• the intersection is the wavelength that is subtracted from the
spectral distribution of the color
– purity (saturation): is still
• the closer to white, the less pure
• the further from white, the more pure
400 440 480 520 560 600 640 680 720
0
0.05
0.1
0.15
0.2
0.25
0.3
0.35
0.4
0.45

Michael Eckmann - Skidmore College - CS 376 - Spring 2007
Color
• Is the Chromaticity diagram useful for determining the brightness of a color?
Michael Eckmann - Skidmore College - CS 376 - Spring 2007
Color
• Is the Chromaticity diagram useful for determining the brightness of a color?– No, the brightness (light energy) was normalized to 1– recall, Color = xX + yY + zZ – x' = x / (x+y+z)– y' = y / (x+y+z)– z' = z / (x+y+z)– Since x' + y' + z' = 1, any color can be represented by just
two of the x', y' and z'. – By normalizing based on the total light energy (brightness)
we are only now dealing with hue and purity (collectively known as Chromaticity)
Michael Eckmann - Skidmore College - CS 376 - Spring 2007
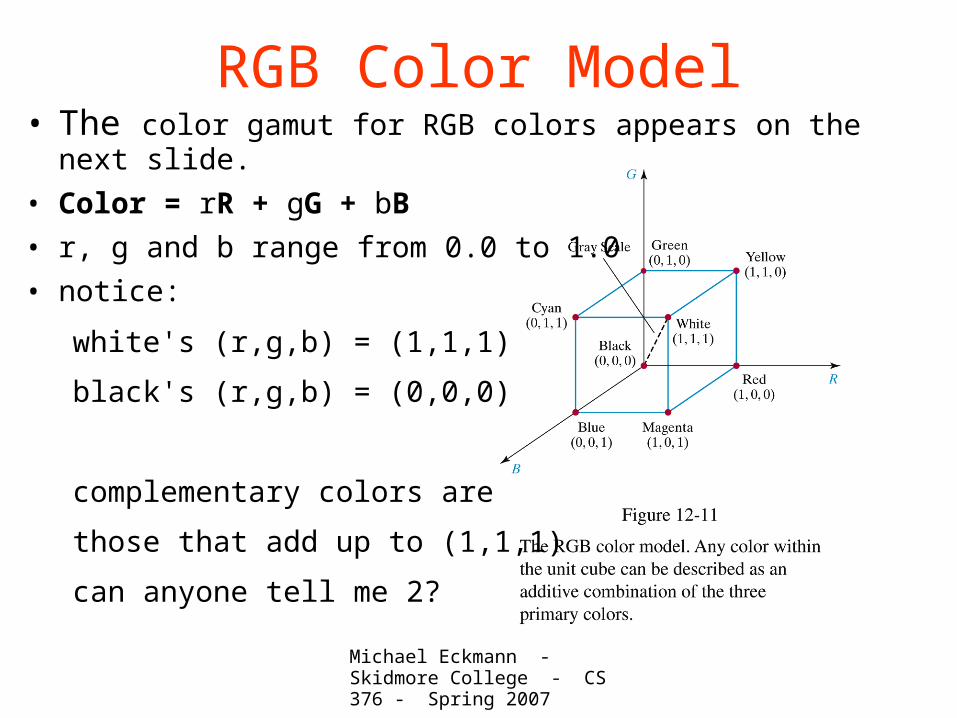
RGB Color Model• The color gamut for RGB colors appears on the next slide.
• Color = rR + gG + bB
• r, g and b range from 0.0 to 1.0
• notice:
white's (r,g,b) = (1,1,1)
black's (r,g,b) = (0,0,0)
complementary colors are
those that add up to (1,1,1)
can anyone tell me 2?

Michael Eckmann - Skidmore College - CS 376 - Spring 2007
RGB Color Model

Michael Eckmann - Skidmore College - CS 376 - Spring 2007
YIQ Color Model• Graphics monitors use RGB (separate signals for R, G and B)
• NTSC television monitors use a composite signal called the YIQ model.
• Y is luminance (brightness)
• I & Q together incorporate the hue and purity (collectively chromaticity) and some luminance
• RGB can be transformed into YIQ and vice versa which means, given RGB values, you can compute the equivalent color in YIQ and vice versa.
• See section 12.5 of textbook for transforms.
• One nice feature of YIQ is that since Y is the luminance, if that's all that is captured by the television then you end up with black & white television (grey-scale)
• Also since the human eye responds more to luminance than color (recall the number of rods vs. cones) more bandwidth is set aside for the Y value than I & Q.

Michael Eckmann - Skidmore College - CS 376 - Spring 2007
CMY & CMYK Color Models• Both RGB and YIQ color models discussed thus far are
additive models. That is, colors are produced by adding light sources. When we view a monitor or television we are looking at the light sources themselves.
• Since hard copy devices print colors, the colors we see are reflected from the paper. To print on paper something that will reflect a certain color of light requires a subtractive process. We are not viewing the light source, but instead what is reflected off the paper when white light is shown on it.

Michael Eckmann - Skidmore College - CS 376 - Spring 2007
CMY & CMYK Color Models• C = Cyan, M = Magenta, Y = Yellow
• white's (c,m,y) = (0,0,0)
• black's (c,m,y) = (1,1,1)
• cyan absorbs red (and reflects green and blue)
• magenta absorbs green
• yellow absorbs blue
• cyan & magenta ink combined
will reflect blue light (b/c red and green are absorbed)
• cyan & yellow ink combined
will reflect green light
• magenta & yellow ink combined
will reflect red light
Michael Eckmann - Skidmore College - CS 376 - Spring 2007
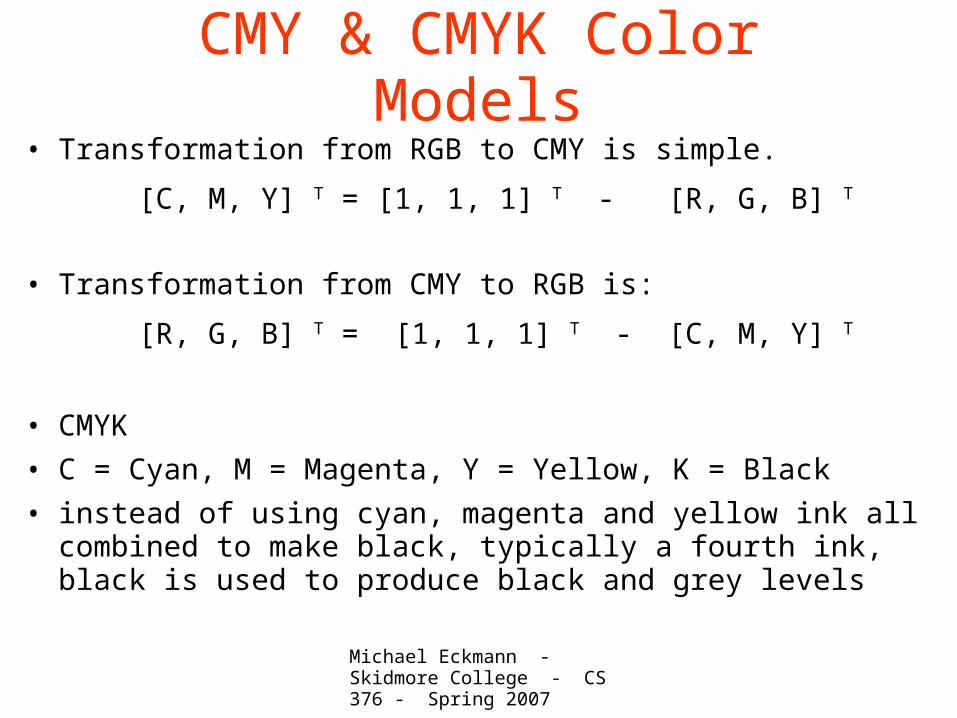
CMY & CMYK Color Models• Transformation from RGB to CMY is simple.
[C, M, Y] T = [1, 1, 1] T - [R, G, B] T
• Transformation from CMY to RGB is:
[R, G, B] T = [1, 1, 1] T - [C, M, Y] T
• CMYK
• C = Cyan, M = Magenta, Y = Yellow, K = Black
• instead of using cyan, magenta and yellow ink all combined to make black, typically a fourth ink, black is used to produce black and grey levels

Michael Eckmann - Skidmore College - CS 376 - Spring 2007
Recap on Color Models• RGB color model is an additive model. Amounts of red,
green and blue are combined by adding light sources of these colors to produce new colors.
• CMY and CMYK are subtractive models. Amounts of cyan, magenta and yellow are combined by adding pigments of these colors to produce new colors that reflect certain wavelengths of light.
– it is subtractive because adding pigments reduce what light
is reflected, when all 3 primaries (C M and Y) are put
together then the result is no light is reflected (black).

Michael Eckmann - Skidmore College - CS 376 - Spring 2007
HSV Color Model

Michael Eckmann - Skidmore College - CS 376 - Spring 2007
HSV Color Model
• Hue is an angle between 0 and 360 degrees
• Saturation (purity) is one axis and Value (luminance) is another axis
• You can picture this as a circular cone if you prefer
• or even as a cylinder
• because S is considered a ratio from the V axis (0) to max 1.

Michael Eckmann - Skidmore College - CS 376 - Spring 2007
HSV Color Model
• HSV color model is more intuitive/useful to people/artists
• Starting with the pure hue:
• Vary the saturation (add white) to get different tints
• Vary the value (add black) to get different shades

What's most important of Color theory for us in this course?
• Know the terminology – dominant wavelength, hue, brightness, luminance, purity, saturation, chromaticity, color gamut, idea of primary colors, etc.
• Know the relationship between wavelength and frequency
• Know what the CIE chromaticity digram is useful for and how
– determining:
• color gamuts, complementary colors, purity
– comparison of:
• color gamuts, purity
• Know how additive (e.g. RGB, YIQ) and subtractive color models (e.g. CMY) work to
produce new colors
• Know about more intuitive models like HSV and why they're useful
• Know that different color models can be transformed into each other by a transform matrix.
Michael Eckmann - Skidmore College - CS 376 - Spring 2007