cs global money notes 2
DESCRIPTION
CS Global Money Notes 2TRANSCRIPT
DISCLOSURE APPENDIX AT THE BACK OF THIS REPORT CONTAINS IMPORTANT DISCLOSURES AND
ANALYST CERTIFICATIONS.
CREDIT SUISSE SECURITIES RESEARCH & ANALYTICS BEYOND INFORMATION®
Client-Driven Solutions, Insights, and Access
Global Money Notes #2
A Turbulent Exit
The Federal Reserve’s historic liftoff from the zero lower bound is nearing.
Liftoff will be historic not only because the Fed has never tried to raise interest
rates from such low levels before but also for at least three other reasons.
First, the Fed will raise interest rates using new tools.
Second, the money flows that liftoff will generate, both on and offshore, will
dwarf those involved in past hiking cycles.
Third, liftoff will occur in a financial system completely redesigned through Basel
III: bank balance sheets are now subject to liquidity and funding rules that have
never been stress-tested in a hiking cycle before.
No matter how transparent the Fed has been about the start and pace of liftoff,
the combination of new tools and a redesigned financial system may cause
turbulence in money, FX and Treasury markets on purely “mechanical” grounds.
This turbulence won’t have anything to do with – but will be exacerbated by –
the much discussed decline in market liquidity due to post-crisis re-regulation.
Forewarned is forearmed.
This second issue of Global Money Notes is a reference guide for trading the
Fed’s exit. We address the following questions: where will fed funds effective
trade the day after liftoff? Will liftoff be a Libor-OIS widener? A curve flattener?
Are rates the cleanest possible way to trade the Fed’s historic exit? Or perhaps
bank equities? How about the Euro/U.S. dollar exchange rate? In our view:
1. The Fed will opt for a full allotment o/n RRP facility on the day of liftoff.
2. Fed funds effective will print around 35 bps with risks to the upside.
3. 3-mo Libor will print around 55 bps with risks strongly to the upside.
4. Liftoff will benefit some banks but hurt others. A rising tide – rising interest
rates – will not lift all boats as is typical during hiking cycles.
5. Volatility may spike in the 3-5 year segment of the U.S. Treasury curve as
deposit flows force banks to calibrate their HQLA portfolios.
6. A full allotment RRP facility could accelerate FX reserve managers’ shift
out of euros for U.S. dollars.
For the Fed to control short-term interest rates effectively, it must live with the
turbulence a full allotment RRP facility may unleash, despite all its
communication efforts to ensure the opposite. Get ready for a turbulent exit...
Research Analysts
Zoltan Pozsar
212 538 3779
James Sweeney
212 538 4648
28 August 2015
Economic Research
28 August 2015
Global Money Notes #2 2
Getting rid of excess reserves quickly is simple in principle.
The Fed could swap excess reserves for central bank bills (Fed bills), which banks could
sell to anyone outside the banking system. This is something banks cannot do with
reserves, which can only be held by banks. The sale of Fed bills would yield balance sheet
relief for banks and increase the amount of short-term instruments (“collateral”) held by
investors that are confined to holding bank deposits at present. The size of the Fed’s
balance sheet would not change, but what were excess reserves before would now be
Fed bills, and most reserves would once again be of the required kind. The Fed could go
back to its pre-crisis operating regime of targeting a level for the federal funds rate, as
opposed to a target range as at present – a goal the Fed has emphasized in the past.
There is only one problem with this simple and elegant roadmap to get “back to the future”:
the Federal Reserve Act does not allow for Fed bills. This is a problem that other central
banks – the Bank of England for instance – do not have. And short of Fed bills, the Fed’s
exit strategy is being sketched out around the use of a reverse repo (RRP) facility instead.
A Monetary Hoover Dam
RRPs are not a new tool per se.
The Fed has been using them for decades, but will use them differently this time around:
RRPs will be fixed rate, not fixed size; they will be done with money funds (mostly), not
dealers; and they will involve swapping reserves for RRPs, not reserves for bonds.
The mechanics of liftoff will be as simple as the New York Fed posting two numbers on its
website – 0.50% for IOER and 0.25% for o/n RRPs – and standing ready to passively
swap reserves for RRPs to accommodate the order flow for one instrument versus another.
It is helpful to think about RRPs as a dam – a monetary Hoover Dam.
Exhibit 1 shows the Colorado River in the Black Canyon, before construction of the Hoover
Dam began. As an analogy, think about the banking system awash with excess reserves.
Exhibit 1: The Colorado River in 1930 – Think Excess Reserves
Source: http://waterandpower.org/Construction_of_Hoover_Dam.html
28 August 2015
Global Money Notes #2 3
Exhibit 2 shows the Colorado River with the Hoover Dam in the middle. As an analogy,
think about excess reserves cordoned off on one side of the dam as a large pool of RRPs
held by money market funds, and a small pond of reserves held by banks on the other.
The river is still there (as is a large Fed balance sheet), but liquidity (central bank liabilities)
has been redistributed: away from banks to money funds and from reserves to o/n RRPs.
Exhibit 2: The Hoover Dam – Think RRPs as a Monetary Hoover Dam
Source: http://waterandpower.org/Construction_of_Hoover_Dam.html
As long as the Fed’s balance sheet remains large (and as the Fed has stated very clearly
in its exit principles, it won’t shrink it until well into the hiking cycle), a large RRP facility is
the only way to drain reserves from the banking system, i.e., to reduce those liabilities on
the Fed’s balance sheet that are relevant for controlling conditions in the fed funds market.
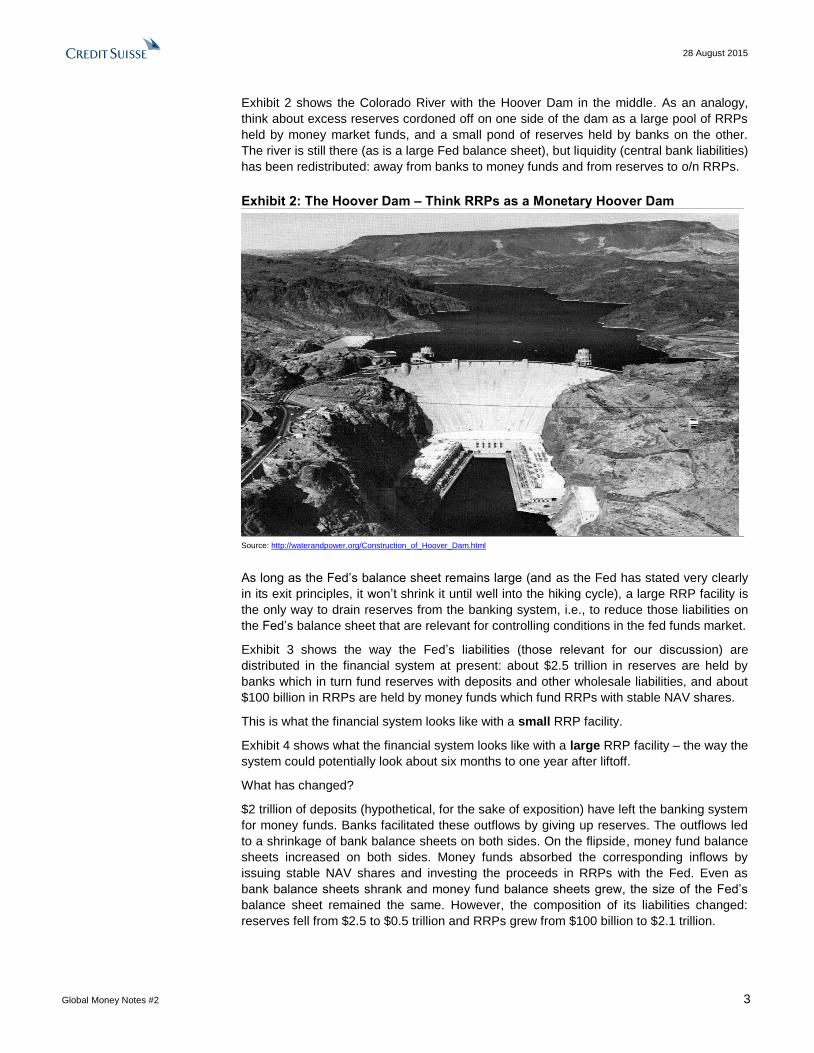
Exhibit 3 shows the way the Fed’s liabilities (those relevant for our discussion) are
distributed in the financial system at present: about $2.5 trillion in reserves are held by
banks which in turn fund reserves with deposits and other wholesale liabilities, and about
$100 billion in RRPs are held by money funds which fund RRPs with stable NAV shares.
This is what the financial system looks like with a small RRP facility.
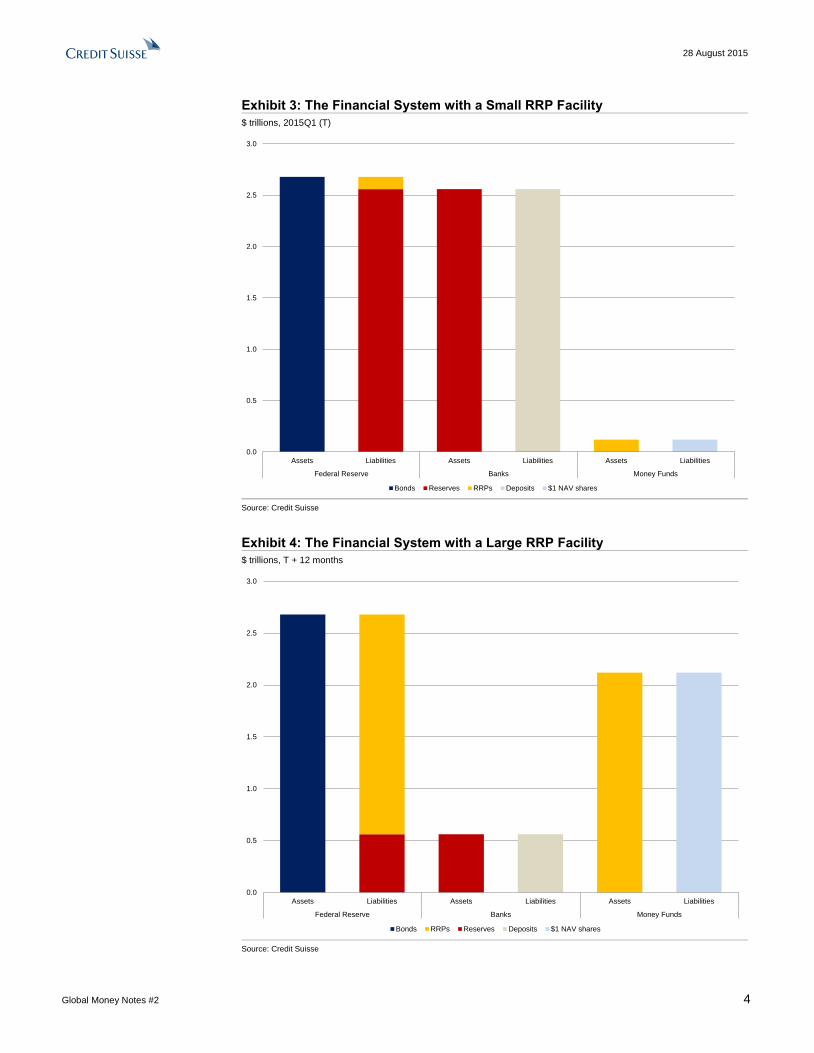
Exhibit 4 shows what the financial system looks like with a large RRP facility – the way the
system could potentially look about six months to one year after liftoff.
What has changed?
$2 trillion of deposits (hypothetical, for the sake of exposition) have left the banking system
for money funds. Banks facilitated these outflows by giving up reserves. The outflows led
to a shrinkage of bank balance sheets on both sides. On the flipside, money fund balance
sheets increased on both sides. Money funds absorbed the corresponding inflows by
issuing stable NAV shares and investing the proceeds in RRPs with the Fed. Even as
bank balance sheets shrank and money fund balance sheets grew, the size of the Fed’s
balance sheet remained the same. However, the composition of its liabilities changed:
reserves fell from $2.5 to $0.5 trillion and RRPs grew from $100 billion to $2.1 trillion.
28 August 2015
Global Money Notes #2 4
Exhibit 3: The Financial System with a Small RRP Facility
$ trillions, 2015Q1 (T)
0.0
0.5
1.0
1.5
2.0
2.5
3.0
Assets Liabilities Assets Liabilities Assets Liabilities
Federal Reserve Banks Money Funds
Bonds Reserves RRPs Deposits $1 NAV shares
Source: Credit Suisse
Exhibit 4: The Financial System with a Large RRP Facility
$ trillions, T + 12 months
0.0
0.5
1.0
1.5
2.0
2.5
3.0
Assets Liabilities Assets Liabilities Assets Liabilities
Federal Reserve Banks Money Funds
Bonds RRPs Reserves Deposits $1 NAV shares
Source: Credit Suisse

28 August 2015
Global Money Notes #2 5
No one really knows the financial system’s demand for reserves versus RRPs. Required
reserves only amount to about $100 billion at present but some banks may actually prefer
to hold on to some of their excess reserves for HQLA purposes in which case some
reserves should be thought of as “preferred” – a grey area between required and excess
reserves. Pulling off the type of flows we sketch in Exhibits 3 and 4, while not being sure
about how big they will ultimately get, points to the need for a full allotment RRP facility.
However, concerns emerged that a full allotment facility would (1) rely on money funds, (2)
disintermediate banks and (3) increase the likelihood of runs. And this led to the dilution of
the full allotment idea to a fixed rate, fixed allotment facility – an oxymoron, as one can
either fix quantities and let prices adjust, or fix prices and let quantities adjust, but not both
(for a discussion and critique of these concerns, see the Appendix at the end of this Note).
Full Allotment After All?
But the FOMC’s initial concerns over a full allotment facility seem to have faded over time.
The March FOMC minutes signaled that the Fed is presently considering two alternatives:
“a temporarily elevated aggregate cap” or “a temporary suspension of the cap” on the
o/n RRP facility to ensure control over short-term interest rates at the time of liftoff.
The minutes make it abundantly clear that come October or December, or whenever liftoff
will finally occur, the Fed will either put a very big number on the RRP facility (think $1
trillion), or make it full allotment outright – just as a few on the FOMC originally intended.
We believe the FOMC will go for full allotment.
From a communication perspective, a full allotment facility is preferable to a facility with a
large number attached to it, as a large number could easily have a sticker shock effect.
Just imagine the Fed moving IOER to 0.50% and the RRP rate to 0.25% and announcing
that the RRP facility will be upsized from $300 billion to $1 trillion.
Markets may interpret this as a more hawkish move than intended:
“Gee, the Fed not only hikes, but also drains $1 trillion in reserves. What if it over-drains?
What will that do to the liquidity that’s been pushing stocks higher all along? Sell!”
Of course, such concerns are misplaced – the amount of reserves in the system have
nothing to do with where stocks trade. But markets being markets, it’s never about how the
world actually works, but how the markets think the world works. The Fed should care
about the potential communication downsides involved in putting a large number on the
RRP facility and make the facility full allotment, with no numbers attached.
A full allotment facility would be the exact opposite of what Chairman Volcker did in 1979
when he switched the Fed’s operating regime from targeting the fed funds rate, to
targeting the volume of reserves. When the Fed went monetarist, the fed funds rate
quickly shot up to over 20%. When the Chairman had to appear in front of Congress to
explain why interest rates got so high, he said something to the effect of “I did not hike
rates; markets did.” By slowing the pace of adding reserves to the system (a control of
quantities), banks – given the pace at which they were lending and creating deposits at the
time – suddenly faced a shortage of reserves and bid interest rates up accordingly.
In today’s context, a full allotment RRP facility would leave it up to the market to determine
the right mix of reserves versus RRPs and help the Fed set interest rates precisely where
it wants them to be (a control of the price of money, that is, interest rates).
The Fed does intend to have control over short-term interest rates. Over the past five
years, we have heard nothing but assurances to that end. The Fed’s ability to control
short-term interest rates has never been in doubt before. If the Fed does not seem to be in
control after all, uncomfortable hearings in front of Congress would follow, and heat
around the Fed’s independence (already under heightened scrutiny) would intensify.
28 August 2015
Global Money Notes #2 6
The Fed is keenly aware of these risks.
According to the March, 2015 FOMC minutes, “a number of participants emphasized that
maintaining control over short-term interest rates would be paramount in the initial stages
of normalization” – (our emphases) unusually strong words for a central bank to use. The
word “paramount” appears in FOMC minutes very rarely and participants at FOMC
meetings rarely “emphasize” things – they typically note, recommend, agree, consider,
judge, discuss, anticipate, repeat and sometimes underscore, but only rarely emphasize.
These are the key arguments against calibrating the size of the RRP facility with an
incremental, trial by error approach at liftoff and going for a full allotment facility instead.
Vice Chairman Fischer noted last December that “very little works exactly as planned, and
what are the alternatives if [o/n RRPs] do not work? I think about that a great deal.”
An o/n RRP facility should work absolutely fine – at least as far as establishing a floor
under short-term interest rates is concerned (see below) – as long as it’s full allotment.
Where Will Fed Effective Trade a Day After Liftoff?
Assuming we get a full allotment RRP facility, where will fed funds effective trade “T+1”?
Around 35 bps. Here is why.
At present, the size of the fed funds market is about $50 billion, down sharply from $250
billion before the crisis. The reason for the collapse is obvious: with so many excess
reserves in the system, few banks have to borrow to meet reserve requirements.
Whatever is left of the fed funds market is mostly between Federal Home Loan Banks
(FHLBs) on the lending side and U.S. and foreign banks on the borrowing side.
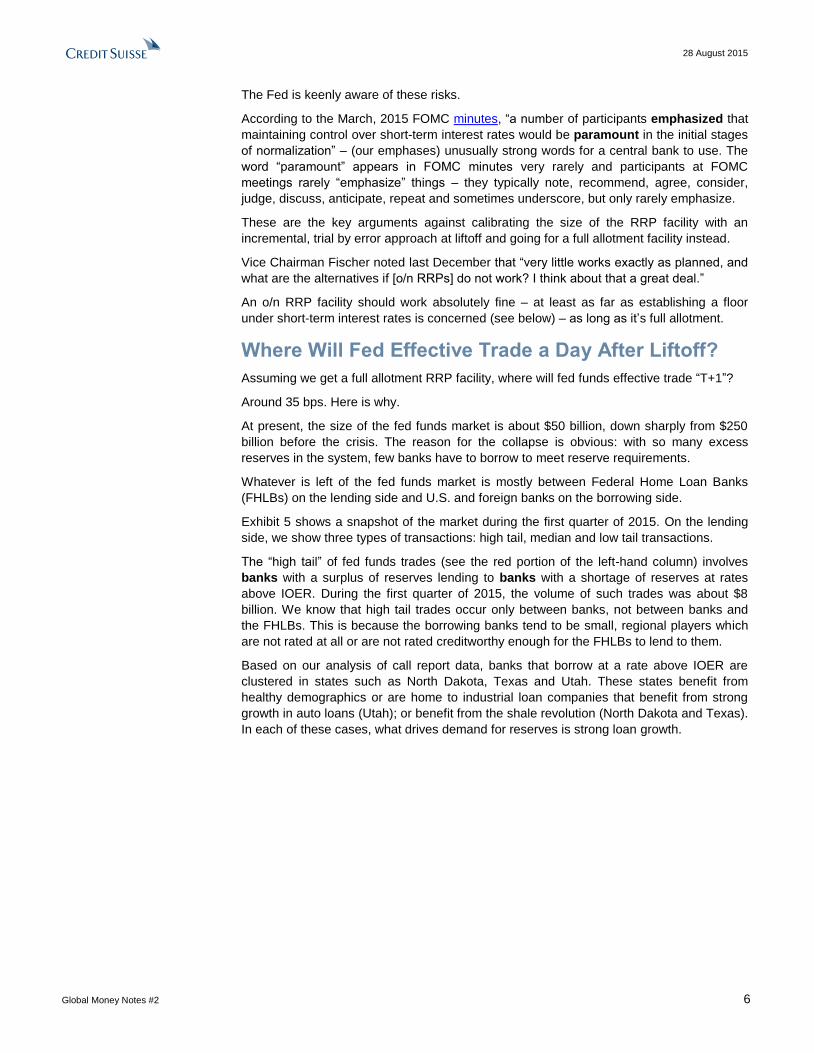
Exhibit 5 shows a snapshot of the market during the first quarter of 2015. On the lending
side, we show three types of transactions: high tail, median and low tail transactions.
The “high tail” of fed funds trades (see the red portion of the left-hand column) involves
banks with a surplus of reserves lending to banks with a shortage of reserves at rates
above IOER. During the first quarter of 2015, the volume of such trades was about $8
billion. We know that high tail trades occur only between banks, not between banks and
the FHLBs. This is because the borrowing banks tend to be small, regional players which
are not rated at all or are not rated creditworthy enough for the FHLBs to lend to them.
Based on our analysis of call report data, banks that borrow at a rate above IOER are
clustered in states such as North Dakota, Texas and Utah. These states benefit from
healthy demographics or are home to industrial loan companies that benefit from strong
growth in auto loans (Utah); or benefit from the shale revolution (North Dakota and Texas).
In each of these cases, what drives demand for reserves is strong loan growth.
28 August 2015
Global Money Notes #2 7
Exhibit 5: The Fed Funds Market Today
$ billions, 2015Q1
0
10
20
30
40
50
Sellers of Fed Funds Buyers of Fed Funds
FHLBs @ 3+ bps below EFFR FHLBs @ 3 bps below EFFR FHLBs @ FFR +/- 2 bps Banks > IOER FBOs U.S. banks
High Tail
Low Tail
Source: FDIC, Federal Reserve Bank of New York (FR2420), Federal Home Loan Banks, Credit Suisse
The “median” of fed funds trades (see the blue portion of the left-hand column) involves
trades between FHLBs and banks, and are executed at rates that are +/- 2 bps within the
effective fed funds rate (EFFR). These account for the majority of fed funds trades at
present. Their motivation is to arbitrage the difference between fed effective and interest
on reserves (these trades exploit the feature of the U.S. money market whereby only
banks can earn the IOER rate on their cash balances at the Fed, not the FHLBs; FHLBs
earn zero). During the first quarter of 2015, the volume of such trades was $37 billion.
The “low tail” of fed funds trades (see the orange portion of the left-hand column) involves
trades where FHLBs lend to banks at least 3 bps below the EFFR and sometimes below
the o/n RRP rate. These trades involve cash balances that the FHLBs receive late in the
day, at a time when the RRP facility has already closed (the facility is open only for 30
minutes between 12:45 and 1:15 EST) and the alternative for FHLBs is to earn zero
interest in their account at the Fed. During the first quarter of 2015, the volume of such
trades was about $5 billion (according to FR2420 data (see here), about $2.5 billion
printing 3 bps below EFFR and another $2.5 printing more than 3 bps below EFFR).
Thus, in a nutshell, over 80% of lending in the fed funds market is done by the FHLBs, and
on the borrowing side of the market, the split between U.S. and foreign banks is ~ 40:60.
In terms of the number of players involved, the market has a distinct “family atmosphere”.
Of the 11 FHLBs (their number fell from 12 when FHLB Seattle was merged into FHLB
Des Moines on May 31st, 2015), only 10 are active lenders in the fed funds market. On the
borrowing side, volumes are dominated by 10 foreign banks and 10 U.S. banks – so few
because FHLBs can only lend in volume on an unsecured basis (the fed funds market is
unsecured) to counterparties that are rated one of the top four investment grades. And as
it turns out, there are not so many highly rated banks left to begin with globally.
28 August 2015
Global Money Notes #2 8
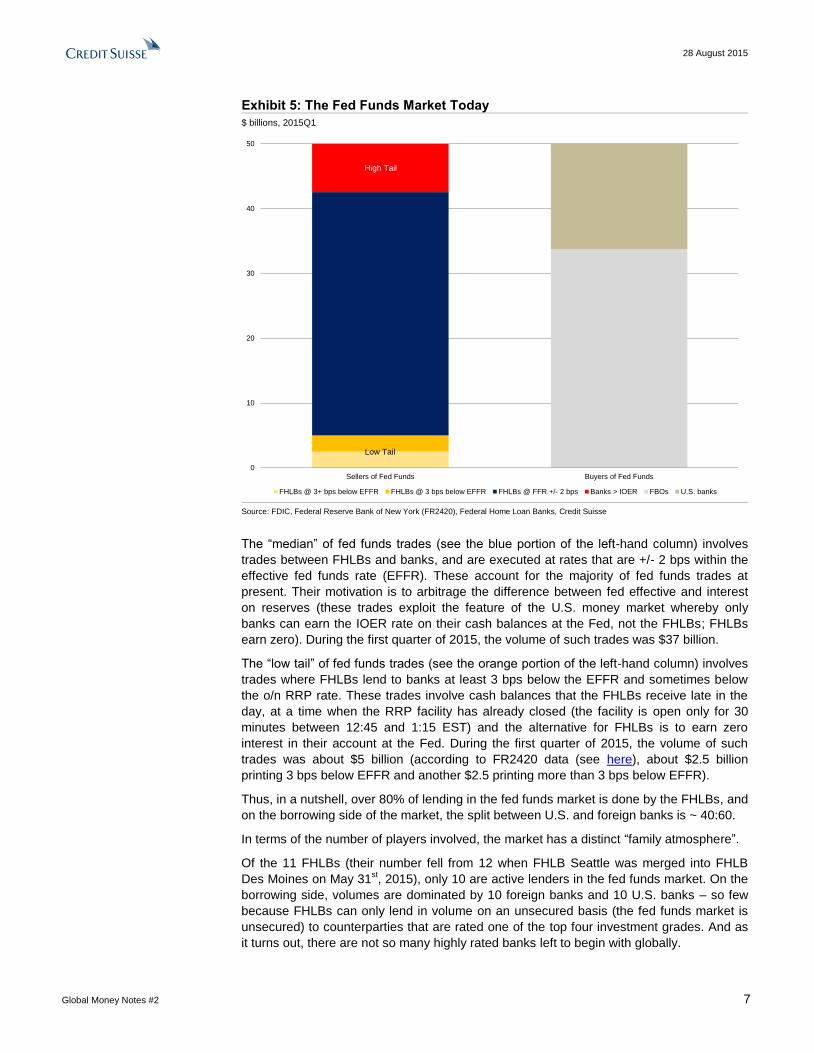
Exhibit 6 provides the list of eligible candidates for FHLBs to lend to, and Exhibit 7 (note
the overlap with the names in Exhibit 6) lists the top 10 foreign and U.S. borrowers in the
fed funds market at present. The combined borrowing of these 20 banks absorbs about
70% of the lending done by the FHLBs. In essence then, at present, the bulk of trading in
the fed funds market occurs between 10 FHLBs and 20 banks – small enough numbers to
get a sense of the character of the market by talking to the main participants, which we did.
Exhibit 6: Who are the FHLBs Willing to Face?
Banks by ratings and FHLBs’ corresponding maximum capital exposure limit (in percent)
Foreign banks
Name Fitch Limit Name Moody's Limit Name S&P Limit
1 Royal Bank of Canada AA 9 Toronto-Dominion Bank Aa1 14 Svenska Handelsbanken AB AA- 3
2 Svenska Handelsbanken AB AA- 3 Svenska Handelsbanken AB Aa2 9 Royal Bank of Canada AA- 3
3 HSBC Holdings Plc AA- 3 Bank of Nova Scotia Aa2 9 Toronto-Dominion Bank AA- 3
4 Toronto-Dominion Bank AA- 3 National Australia Bank Limited Aa2 9 Nordea Bank AB AA- 3
5 Bank of Nova Scotia AA- 3 Australia and New Zealand Banking Group LimitedAa2 9 National Australia Bank Limited AA- 3
6 Nordea Bank AB AA- 3 Westpac Banking Corporation Aa2 9 Australia and New Zealand Banking Group LimitedAA- 3
7 Bank of Montreal AA- 3 Commonwealth Bank of Australia Aa2 9 Westpac Banking Corporation AA- 3
8 Canadian Imperial Bank of CommerceAA- 3 Skandinaviska Enskilda Banken AB Aa3 3 Commonwealth Bank of Australia AA- 3
9 National Australia Bank Limited AA- 3 Swedbank AB Aa3 3 Skandinaviska Enskilda Banken ABA+ 3
10 Standard Chartered Plc AA- 3 Royal Bank of Canada Aa3 3 BNP Paribas SA A+ 3
11 Australia and New Zealand Banking Group LimitedAA- 3 Nordea Bank AB Aa3 3 Swedbank AB A+ 3
12 Westpac Banking Corporation AA- 3 Bank of Montreal Aa3 3 Bank of Nova Scotia A+ 1
13 Commonwealth Bank of Australia AA- 3 Canadian Imperial Bank of Commerce Aa3 3 Bank of Montreal A+ 1
14 Skandinaviska Enskilda Banken AB A+ 1 National Bank of Canada Aa3 3
15 BNP Paribas SA A+ 1 Standard Chartered Plc Aa3 3
16 Swedbank AB A+ 1 HSBC Holdings Plc A1 1
17 National Bank of Canada A+ 1 BNP Paribas SA A1 1
U.S. banks
Name Fitch Limit Name Moody's Limit Name S&P Limit
1 1 Wells Fargo Bank AA+ 14 Wells Fargo Bank Aa1 14 1 Wells Fargo Bank AA- 3
2 2 U.S. Bank AA+ 9 U.S. Bank Aa1 14 1 U.S. Bank AA- 3
3 2 JPMorgan Chase Bank AA+ 9 BB&T Bank Aa1 14 2 JPMorgan Chase Bank A+ 1
4 3 BB&T Bank AA- 3 JPMorgan Chase Bank Aa2 9 3 BB&T Bank A+ 1
5 3 PNC Bank AA- 3 PNC Bank Aa2 9 3 PNC Bank A+ 1
6 3 Bank of America AA- 3 Bank of America A1 1 3 Bank of America A+ 1
7 4 SunTrust Bank A- 1 SunTrust Bank A1 1 4 SunTrust Bank A- 1
Source: SNL Financial, company reports, Credit Suisse
Talking to fed funds traders at FHLBs further reinforces the notion of a family atmosphere.
Traders refer to borrowers as the “usual names” – the “scandies,” the “ozzies,” the
“Canadians,” and a few of the “bigger U.S. guys” – and indicate that most of their lending
gets done early in the day Eastern Time (this applies regardless of which time zone an
FHLB is based) and well before the window when the RRP facility is open.
Exhibit 7: Who Borrows in the Fed Funds Market?
$ billions, 2015Q1
U.S. banks Foreign banks
1 Wells Fargo 6.2 1 Bank of Nova Scotia 5.7
2 Suntrust 1.3 2 DnB NOR Bank ASA 3.5
3 Deutsche 1.3 3 Mizuho Corporate Bank 2.6
4 JPMorgan 1.2 4 Swedbank AB 2.0
5 BoNY 1.2 5 BNP Paribas 1.1
6 USBC 0.9 6 Skandinaviska Enskilda Banken 1.0
7 BB&T 0.7 7 Bank of Tokyo 0.5
8 Citi 0.2 8 Sumitomo Mitusi Banking Co 0.2
9 BoA 0.1 9 Standard Chartered Bank 0.1
10 PNC 0.0 10 Svenska Handelsbanken 0.1
Total 13.1 Total 16.9
Other U.S. banks… 12.6 Other foreign banks (residual) 7.4
…of which non-IOER arb ("high tail") trades 8.0 Source: FDIC, Call Reports (FFIEC031, FFIEC002), Credit Suisse
Most trades involve the rolling of existing trades with the “usual names.” Competition is
tight. If bids from an existing borrower are not received promptly (or aren’t good enough),
FHLBs will move their cash over to one of the 19 other banks quickly.
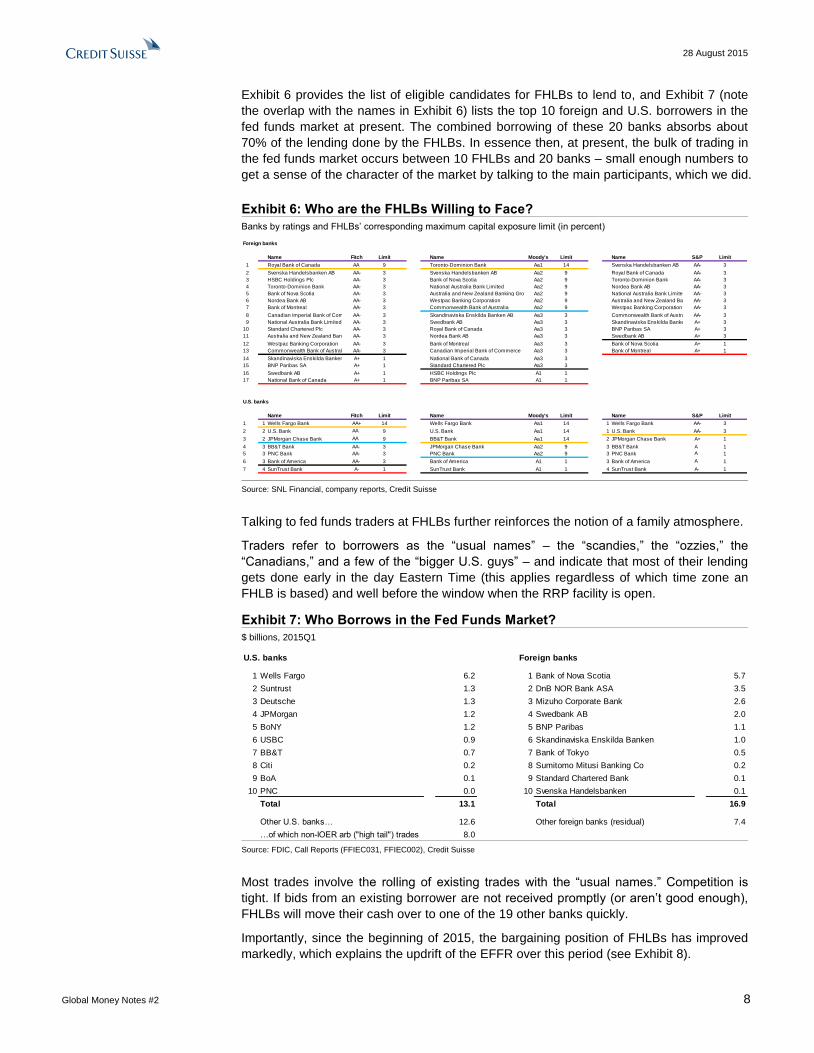
Importantly, since the beginning of 2015, the bargaining position of FHLBs has improved
markedly, which explains the updrift of the EFFR over this period (see Exhibit 8).
28 August 2015
Global Money Notes #2 9
Exhibit 8: FHLBs’ Bargaining Power on the Rise
Percent
0.00
0.05
0.10
0.15
0.20
0.25
09 10 11 12 13 14 15
o/n RRP EFFR (mean, brokered) "Shadow" IOER IOER
# of FHLB counterparties: 4 9 10
Source: Federal Reserve, Haver Analytics ®, Credit Suisse
During most of 2014, the EFFR traded only about 2-3 bps above the o/n RRP rate, but
since 2015, this spread widened to about 8 bps and recently to as much as 10 bps. What’s
behind this updrift is that the number of FHLBs with access to the RRP facility was only
four during 2014, but expanded to nine on January 16th, 2015 and ten on August 3rd,
2015 (see here, here). With more and more FHLBs having the option of investing at the
o/n RRP rate, borrowers came under pressure to pay higher rates, pushing EFFR higher
and higher.1
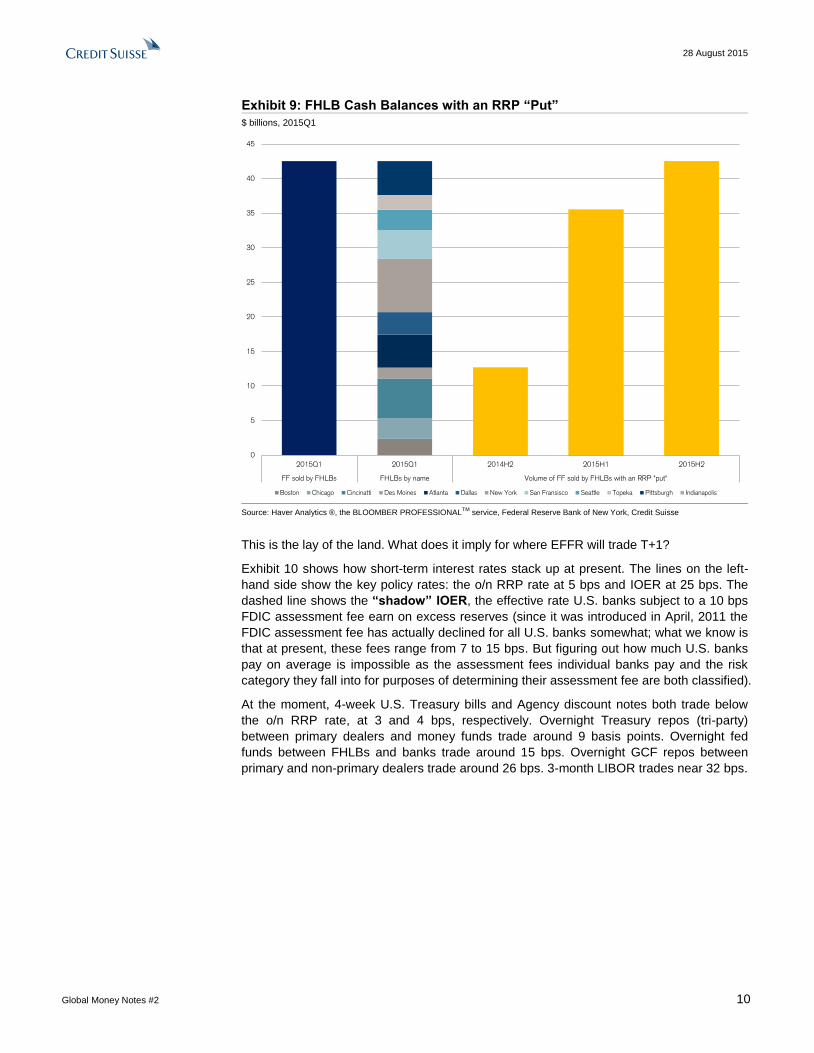
In volume terms, Exhibit 9 shows the total volume of reserves lent by each of the FHLBs
during the first quarter of 2015 and how the volume of reserves with a “put” to the RRP
facility increased over time. At the moment, all FHLBs can invest at the o/n RRP rate
except FHLB Indianapolis, which is not an active lender of federal funds presently
(according to its financial reports, it has not lent a penny since the second quarter of 2014).
1 This improvement in FHLBs’ bargaining position could also explain why EFFR did not decline when the o/n RRP rate was first
raised from 5 to 10 bps and then lowered back down to 5 bps in late 2014 – increasing the number of FHLBs as counterparties coincided with the testing of EFFR’s responsiveness to the RRP rate.
28 August 2015
Global Money Notes #2 10
Exhibit 9: FHLB Cash Balances with an RRP “Put”
$ billions, 2015Q1
0
5
10
15
20
25
30
35
40
45
2015Q1 2015Q1 2014H2 2015H1 2015H2
FF sold by FHLBs FHLBs by name Volume of FF sold by FHLBs with an RRP "put"
Boston Chicago Cincinatti Des Moines Atlanta Dallas New York San Fransisco Seattle Topeka Pittsburgh Indianapolis
Source: Haver Analytics ®, the BLOOMBER PROFESSIONAL
TM service, Federal Reserve Bank of New York, Credit Suisse
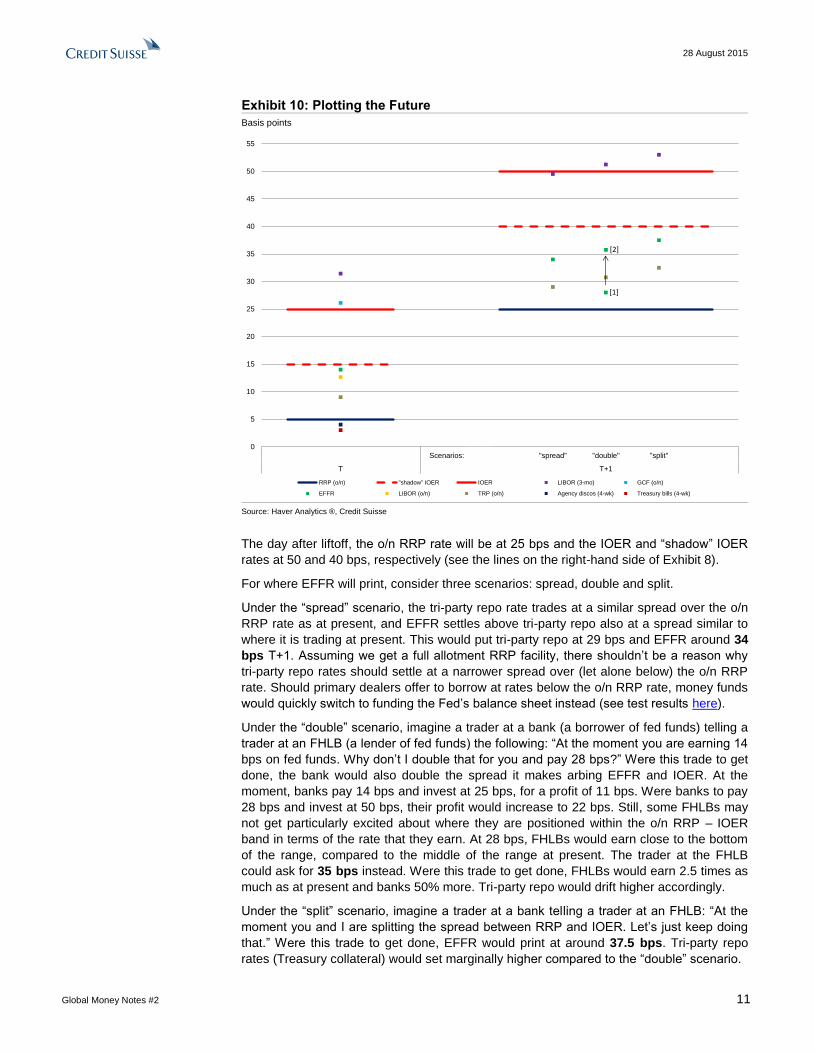
This is the lay of the land. What does it imply for where EFFR will trade T+1?
Exhibit 10 shows how short-term interest rates stack up at present. The lines on the left-
hand side show the key policy rates: the o/n RRP rate at 5 bps and IOER at 25 bps. The
dashed line shows the “shadow” IOER, the effective rate U.S. banks subject to a 10 bps
FDIC assessment fee earn on excess reserves (since it was introduced in April, 2011 the
FDIC assessment fee has actually declined for all U.S. banks somewhat; what we know is
that at present, these fees range from 7 to 15 bps. But figuring out how much U.S. banks
pay on average is impossible as the assessment fees individual banks pay and the risk
category they fall into for purposes of determining their assessment fee are both classified).
At the moment, 4-week U.S. Treasury bills and Agency discount notes both trade below
the o/n RRP rate, at 3 and 4 bps, respectively. Overnight Treasury repos (tri-party)
between primary dealers and money funds trade around 9 basis points. Overnight fed
funds between FHLBs and banks trade around 15 bps. Overnight GCF repos between
primary and non-primary dealers trade around 26 bps. 3-month LIBOR trades near 32 bps.
28 August 2015
Global Money Notes #2 11
Exhibit 10: Plotting the Future
Basis points
0
5
10
15
20
25
30
35
40
45
50
55
Scenarios: "spread" "double" "split" other
T x T+1
RRP (o/n) "shadow" IOER IOER LIBOR (3-mo) GCF (o/n)
EFFR LIBOR (o/n) TRP (o/n) Agency discos (4-wk) Treasury bills (4-wk)
hh
[1]
[2]
ff
ff
ff
Source: Haver Analytics ®, Credit Suisse
The day after liftoff, the o/n RRP rate will be at 25 bps and the IOER and “shadow” IOER
rates at 50 and 40 bps, respectively (see the lines on the right-hand side of Exhibit 8).
For where EFFR will print, consider three scenarios: spread, double and split.
Under the “spread” scenario, the tri-party repo rate trades at a similar spread over the o/n
RRP rate as at present, and EFFR settles above tri-party repo also at a spread similar to
where it is trading at present. This would put tri-party repo at 29 bps and EFFR around 34
bps T+1. Assuming we get a full allotment RRP facility, there shouldn’t be a reason why
tri-party repo rates should settle at a narrower spread over (let alone below) the o/n RRP
rate. Should primary dealers offer to borrow at rates below the o/n RRP rate, money funds
would quickly switch to funding the Fed’s balance sheet instead (see test results here).
Under the “double” scenario, imagine a trader at a bank (a borrower of fed funds) telling a
trader at an FHLB (a lender of fed funds) the following: “At the moment you are earning 14
bps on fed funds. Why don’t I double that for you and pay 28 bps?” Were this trade to get
done, the bank would also double the spread it makes arbing EFFR and IOER. At the
moment, banks pay 14 bps and invest at 25 bps, for a profit of 11 bps. Were banks to pay
28 bps and invest at 50 bps, their profit would increase to 22 bps. Still, some FHLBs may
not get particularly excited about where they are positioned within the o/n RRP – IOER
band in terms of the rate that they earn. At 28 bps, FHLBs would earn close to the bottom
of the range, compared to the middle of the range at present. The trader at the FHLB
could ask for 35 bps instead. Were this trade to get done, FHLBs would earn 2.5 times as
much as at present and banks 50% more. Tri-party repo would drift higher accordingly.
Under the “split” scenario, imagine a trader at a bank telling a trader at an FHLB: “At the
moment you and I are splitting the spread between RRP and IOER. Let’s just keep doing
that.” Were this trade to get done, EFFR would print at around 37.5 bps. Tri-party repo
rates (Treasury collateral) would set marginally higher compared to the “double” scenario.
28 August 2015
Global Money Notes #2 12
It is hard to imagine a scenario where FHLBs would ask for rates higher than 37.5 bps.
Doing so would be counterproductive. This is because above 37.5, trades would not be
profitable for U.S. banks (they only earn the “shadow” IOER rate) and were U.S. banks
stop borrowing, an already limited number of highly rated counterparties that FHLBs can
trade with would halve and be limited to foreign banks only. Were this to happen, foreign
banks would gain an upper hand and push rates offered back down. FHLBs would actually
end up earning less on their fed funds trades, not more.
It is clear from these examples that when borrowers are few, it is hard to drive a tough
bargain, and this also applies on the flipside with having the RRP facility to lend to.
Taking an average of these scenarios, EFFR should print somewhere around 35 bps T+1.
Seven questions are typically raised in response to this forecast:
First, could EFFR drift higher than forecast if smaller banks enter the market as borrowers
of fed funds in order to arbitrage the difference between EFFR and IOER?
The answer is no. FHLBs would not lend to smaller banks because they are not rated
highly enough, and banks would not lend fed funds to other banks below IOER.
Second, could EFFR drift higher than forecast if the FHLBs were to leave the fed funds
market altogether (like Fannie and Freddie did) and lend their cash at higher rates
elsewhere (for example, in GCF repos)? In such a scenario, all fed funds transactions
would be “high tail” trades, which would pull EFFR higher, possibly above IOER.
The answer is no. By regulation, FHLBs need to maintain enough liquidity to meet the
needs of their members under the following two scenarios: “inability to access debt
markets for 5 days and all advances are renewed except those for very large, highly rated
members” and “inability to access debt markets for 15 days and no advances are
renewed.” These requirements will keep the size of the market at least where it is today.
Third, could EFFR shoot through IOER if the RRP is full allotment? How close EFFR
trades to IOER is a function of how much the Fed drains, and a full allotment RRP facility
means the Fed will drain a lot. EFFR would then surely trade close to or above IOER.
The answer is yes, but with qualifiers. The Fed can’t just drain reserves on its own; the
ecosystem has to cooperate. If RRPs are full allotment and if uptake is not large, the Fed
can’t drain a lot. While we think the RRP facility will get very big, this will play out over time
and won’t necessarily be a T+1 event (more on this in the section below).
Fourth, could EFFR drift lower than forecast if the banks were to stop borrowing in the fed
funds market and opt for cheaper venues such as the tri-party repo market?
The answer is no. Banks do not borrow in the tri-party repo market; primary dealers do. In
recent months, banks accounted for only about 5% of borrowing in the tri-party repo
market against U.S. Treasury collateral. Because Basel III requires banks to hold HQLA
on an unencumbered basis, repos (because they encumber HQLAs) are simply not an
attractive source of funding for depository institutions in the ordinary course of business.
Post Basel III, repos are no longer a primary, but rather next-to-last resort source of
funding for banks. The idea behind holding more HQLA is to have enough safe assets on
hand as collateral to raise liquidity in the repo market in case outflows accelerate
unexpectedly, and not to encumber them because repo is a cheaper source of funding.
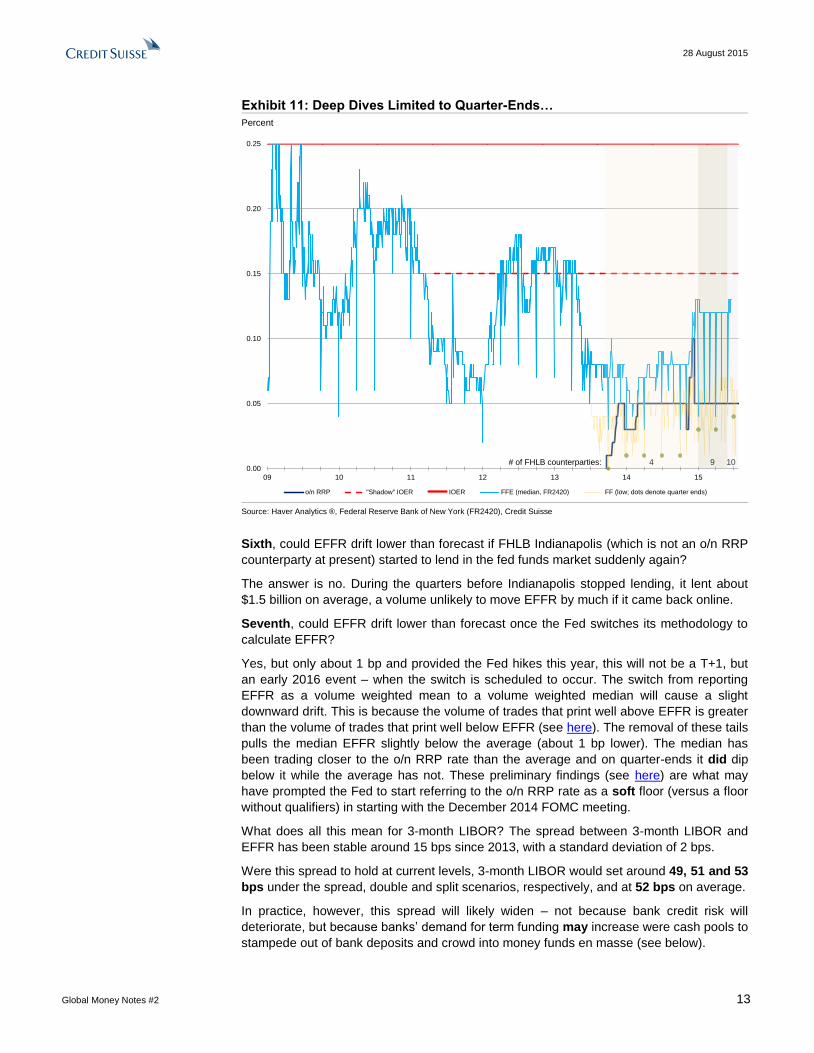
Fifth, could EFFR drift lower than forecast if late in the day trades get “low-balled” at 1 bp?
The answer is no. The “low tail” of fed funds trades is only about $5 billion, a volume that
is unlikely to move EFFR by much. In addition, the lowest rates on fed funds transactions
typically print +/- 1 bp above the o/n RRP rate. They only drop deep below the o/n RRP
rate on quarter-ends. The lowest fed funds trades will likely print around +/- 1 bps around
the o/n RRP rate (see Exhibit 11). If below, FHLBs would opt for holding U.S. Treasury
bills instead – 3 and 6-month bills auctioned at rates near 12 and 22 bps, respectively.
28 August 2015
Global Money Notes #2 13
Exhibit 11: Deep Dives Limited to Quarter-Ends…
Percent
0.00
0.05
0.10
0.15
0.20
0.25
09 10 11 12 13 14 15
o/n RRP "Shadow" IOER IOER FFE (median, FR2420) FF (low; dots denote quarter ends)
# of FHLB counterparties: 4 9 10
Source: Haver Analytics ®, Federal Reserve Bank of New York (FR2420), Credit Suisse
Sixth, could EFFR drift lower than forecast if FHLB Indianapolis (which is not an o/n RRP
counterparty at present) started to lend in the fed funds market suddenly again?
The answer is no. During the quarters before Indianapolis stopped lending, it lent about
$1.5 billion on average, a volume unlikely to move EFFR by much if it came back online.
Seventh, could EFFR drift lower than forecast once the Fed switches its methodology to
calculate EFFR?
Yes, but only about 1 bp and provided the Fed hikes this year, this will not be a T+1, but
an early 2016 event – when the switch is scheduled to occur. The switch from reporting
EFFR as a volume weighted mean to a volume weighted median will cause a slight
downward drift. This is because the volume of trades that print well above EFFR is greater
than the volume of trades that print well below EFFR (see here). The removal of these tails
pulls the median EFFR slightly below the average (about 1 bp lower). The median has
been trading closer to the o/n RRP rate than the average and on quarter-ends it did dip
below it while the average has not. These preliminary findings (see here) are what may
have prompted the Fed to start referring to the o/n RRP rate as a soft floor (versus a floor
without qualifiers) in starting with the December 2014 FOMC meeting.
What does all this mean for 3-month LIBOR? The spread between 3-month LIBOR and
EFFR has been stable around 15 bps since 2013, with a standard deviation of 2 bps.
Were this spread to hold at current levels, 3-month LIBOR would set around 49, 51 and 53
bps under the spread, double and split scenarios, respectively, and at 52 bps on average.
In practice, however, this spread will likely widen – not because bank credit risk will
deteriorate, but because banks’ demand for term funding may increase were cash pools to
stampede out of bank deposits and crowd into money funds en masse (see below).
28 August 2015
Global Money Notes #2 14
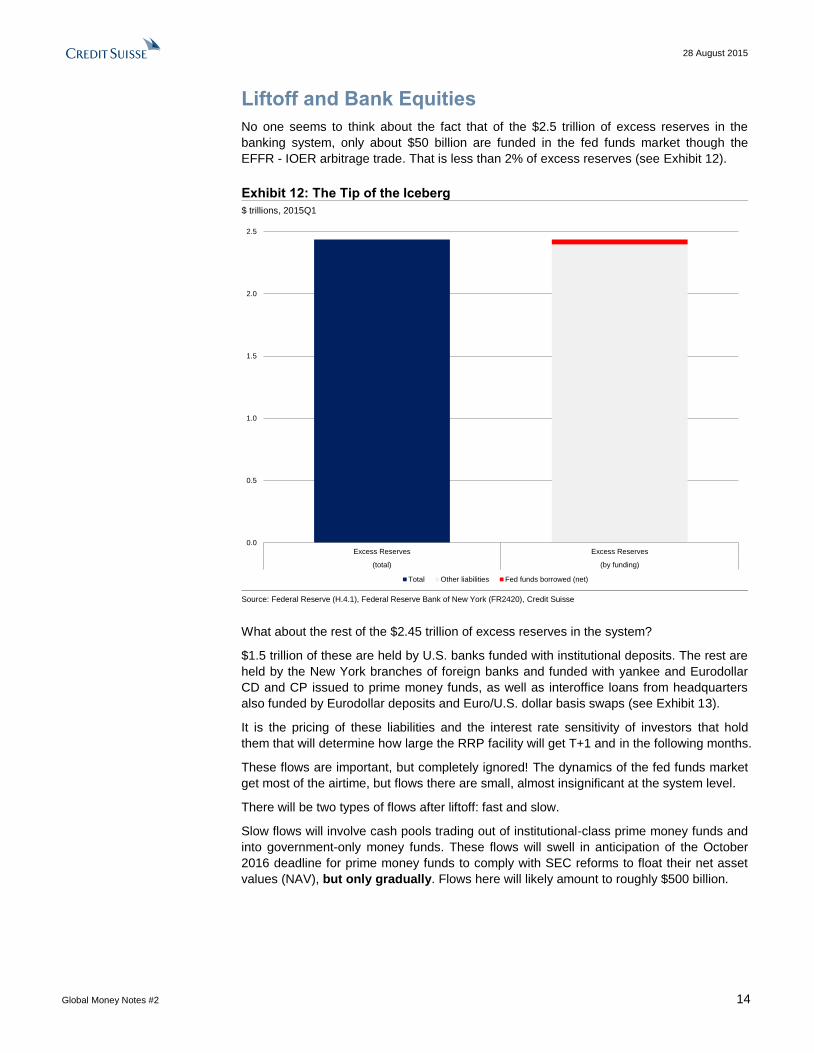
Liftoff and Bank Equities
No one seems to think about the fact that of the $2.5 trillion of excess reserves in the
banking system, only about $50 billion are funded in the fed funds market though the
EFFR - IOER arbitrage trade. That is less than 2% of excess reserves (see Exhibit 12).
Exhibit 12: The Tip of the Iceberg
$ trillions, 2015Q1
0.0
0.5
1.0
1.5
2.0
2.5
Excess Reserves Excess Reserves
(total) (by funding)
Total Other liabilities Fed funds borrowed (net)
Source: Federal Reserve (H.4.1), Federal Reserve Bank of New York (FR2420), Credit Suisse
What about the rest of the $2.45 trillion of excess reserves in the system?
$1.5 trillion of these are held by U.S. banks funded with institutional deposits. The rest are
held by the New York branches of foreign banks and funded with yankee and Eurodollar
CD and CP issued to prime money funds, as well as interoffice loans from headquarters
also funded by Eurodollar deposits and Euro/U.S. dollar basis swaps (see Exhibit 13).
It is the pricing of these liabilities and the interest rate sensitivity of investors that hold
them that will determine how large the RRP facility will get T+1 and in the following months.
These flows are important, but completely ignored! The dynamics of the fed funds market
get most of the airtime, but flows there are small, almost insignificant at the system level.
There will be two types of flows after liftoff: fast and slow.
Slow flows will involve cash pools trading out of institutional-class prime money funds and
into government-only money funds. These flows will swell in anticipation of the October
2016 deadline for prime money funds to comply with SEC reforms to float their net asset
values (NAV), but only gradually. Flows here will likely amount to roughly $500 billion.

28 August 2015
Global Money Notes #2 15
Exhibit 13: U.S. and Foreign Banks Fund Reserves Differently
Percent, 2015Q1
0%
10%
20%
30%
40%
50%
60%
70%
80%
90%
100%
U.S. banks New York branches of foreign banks
Transaction accounts Nontransaction accounts Fed funds purchased Repos Trading liabilities Net due to head office Other
Source: FDIC, Credit Suisse
Fast flows will involve cash pools trading out of bank deposits and into government-only
money funds. These flows may occur fast: either coincident with, or soon after liftoff. Flows
here will likely amount to roughly $500 billion as well.
Both fast and slow flows will ultimately net down to flows between banks and the Fed via
money funds. The RRP facility will be the enabler of these flows (see Exhibit 14).
Slow flows – the institutional prime to government-only money fund flows – are unlikely to
be disruptive. As money leaves, prime funds won’t roll the yankee and Eurodollar CDs and
CPs they bought from the foreign banks that used this funding to arbitrage the difference
between IOER and money market rates on and offshore. The dynamics of these flows will
be as simple as the example described on page 3: as foreign banks lose funding from
prime funds and give up reserves, the Fed will swap reserves for RRPs for government-
only money funds so they can absorb outflows from prime money funds, closing the loop.
Fast flows – the deposits to government-only money fund flows – may lead to unforeseen
dislocations, however. This is because the large U.S. banks that hold most of the hot
money (in the form of non-operating institutional deposits) that could leave fast once
interest rates move higher are positioned very differently for potential deposit outflows.
As it turns out, the largest U.S. banks hold similar amounts of non-operating deposits, but
the HQLA portfolios backing them vary significantly from bank to bank (see Exhibit 15).
Someone won’t get things right.
Estimating the exact amount and interest rate sensitivity on non-operating institutional
deposits is not an exact science. The concept of non-operating deposits itself is a new
concept (a creation of Basel III) and banks are presently building their systems and
models to estimate their exact volume and behavior. The potential for model risks abounds.
28 August 2015
Global Money Notes #2 16
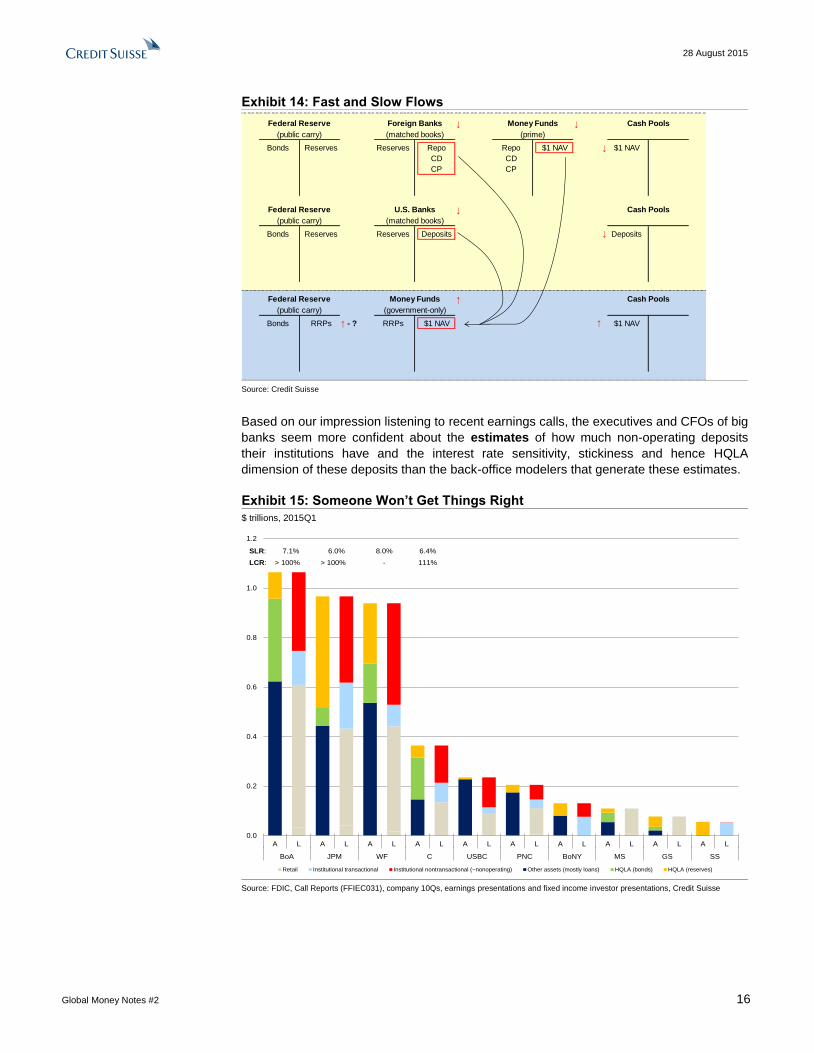
Exhibit 14: Fast and Slow Flows
↓ ↓
↓
↓
↑
Federal Reserve
(public carry)
(public carry)
(public carry)
RRPs ↑ - ?
$1 NAV
CP
Foreign Banks
CD
Cash PoolsMoney Funds
(matched books) (prime)
$1 NAVBonds Reserves Reserves Repo Repo
(matched books)
CP
U.S. Banks
Reserves Reserves Deposits
Cash Pools
Federal Reserve
CD
Federal Reserve Money Funds
(government-only)
Bonds
$1 NAV↑
Cash Pools
Deposits↓
Bonds RRPs $1 NAV
Source: Credit Suisse
Based on our impression listening to recent earnings calls, the executives and CFOs of big
banks seem more confident about the estimates of how much non-operating deposits
their institutions have and the interest rate sensitivity, stickiness and hence HQLA
dimension of these deposits than the back-office modelers that generate these estimates.
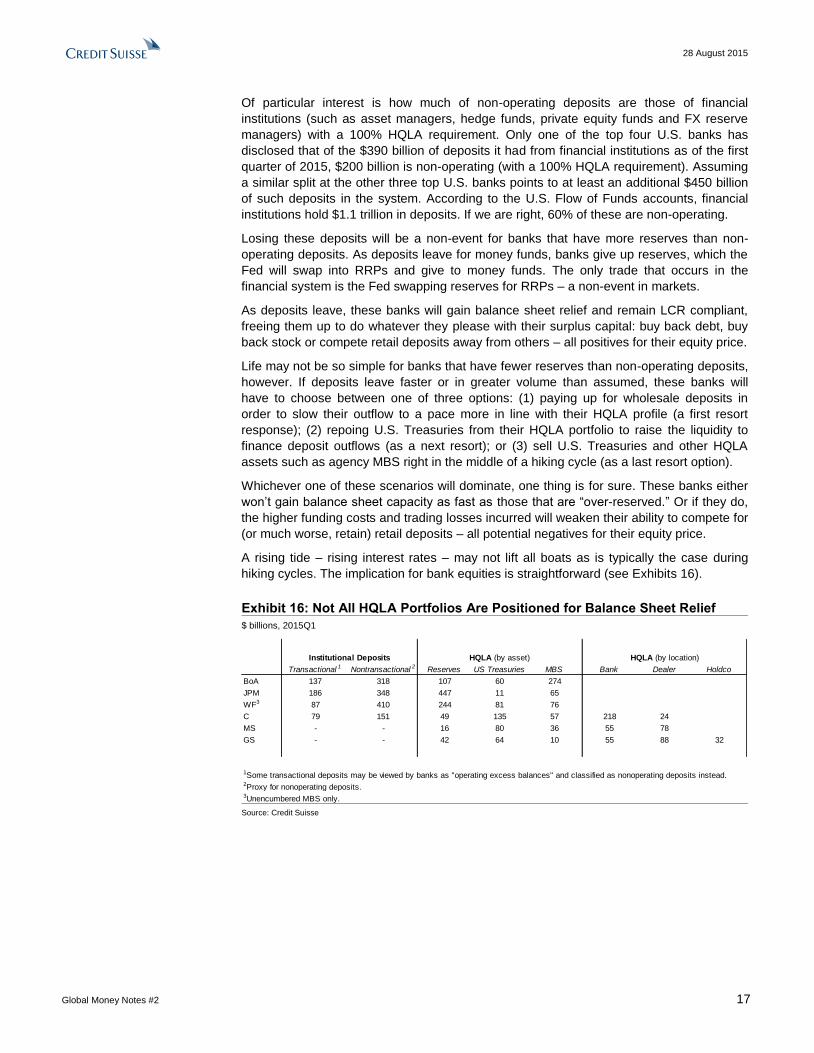
Exhibit 15: Someone Won’t Get Things Right
$ trillions, 2015Q1
0.0
0.2
0.4
0.6
0.8
1.0
1.2
A L A L A L A L A L A L A L A L A L A L
BoA JPM WF C USBC PNC BoNY MS GS SS
Retail Institutional transactional Institutional nontransactional (~nonoperating) Other assets (mostly loans) HQLA (bonds) HQLA (reserves)
SLR: 7.1% 6.0% 8.0% 6.4%
LCR: > 100% > 100% - 111%
Source: FDIC, Call Reports (FFIEC031), company 10Qs, earnings presentations and fixed income investor presentations, Credit Suisse
28 August 2015
Global Money Notes #2 17
Of particular interest is how much of non-operating deposits are those of financial
institutions (such as asset managers, hedge funds, private equity funds and FX reserve
managers) with a 100% HQLA requirement. Only one of the top four U.S. banks has
disclosed that of the $390 billion of deposits it had from financial institutions as of the first
quarter of 2015, $200 billion is non-operating (with a 100% HQLA requirement). Assuming
a similar split at the other three top U.S. banks points to at least an additional $450 billion
of such deposits in the system. According to the U.S. Flow of Funds accounts, financial
institutions hold $1.1 trillion in deposits. If we are right, 60% of these are non-operating.
Losing these deposits will be a non-event for banks that have more reserves than non-
operating deposits. As deposits leave for money funds, banks give up reserves, which the
Fed will swap into RRPs and give to money funds. The only trade that occurs in the
financial system is the Fed swapping reserves for RRPs – a non-event in markets.
As deposits leave, these banks will gain balance sheet relief and remain LCR compliant,
freeing them up to do whatever they please with their surplus capital: buy back debt, buy
back stock or compete retail deposits away from others – all positives for their equity price.
Life may not be so simple for banks that have fewer reserves than non-operating deposits,
however. If deposits leave faster or in greater volume than assumed, these banks will
have to choose between one of three options: (1) paying up for wholesale deposits in
order to slow their outflow to a pace more in line with their HQLA profile (a first resort
response); (2) repoing U.S. Treasuries from their HQLA portfolio to raise the liquidity to
finance deposit outflows (as a next resort); or (3) sell U.S. Treasuries and other HQLA
assets such as agency MBS right in the middle of a hiking cycle (as a last resort option).
Whichever one of these scenarios will dominate, one thing is for sure. These banks either
won’t gain balance sheet capacity as fast as those that are “over-reserved.” Or if they do,
the higher funding costs and trading losses incurred will weaken their ability to compete for
(or much worse, retain) retail deposits – all potential negatives for their equity price.
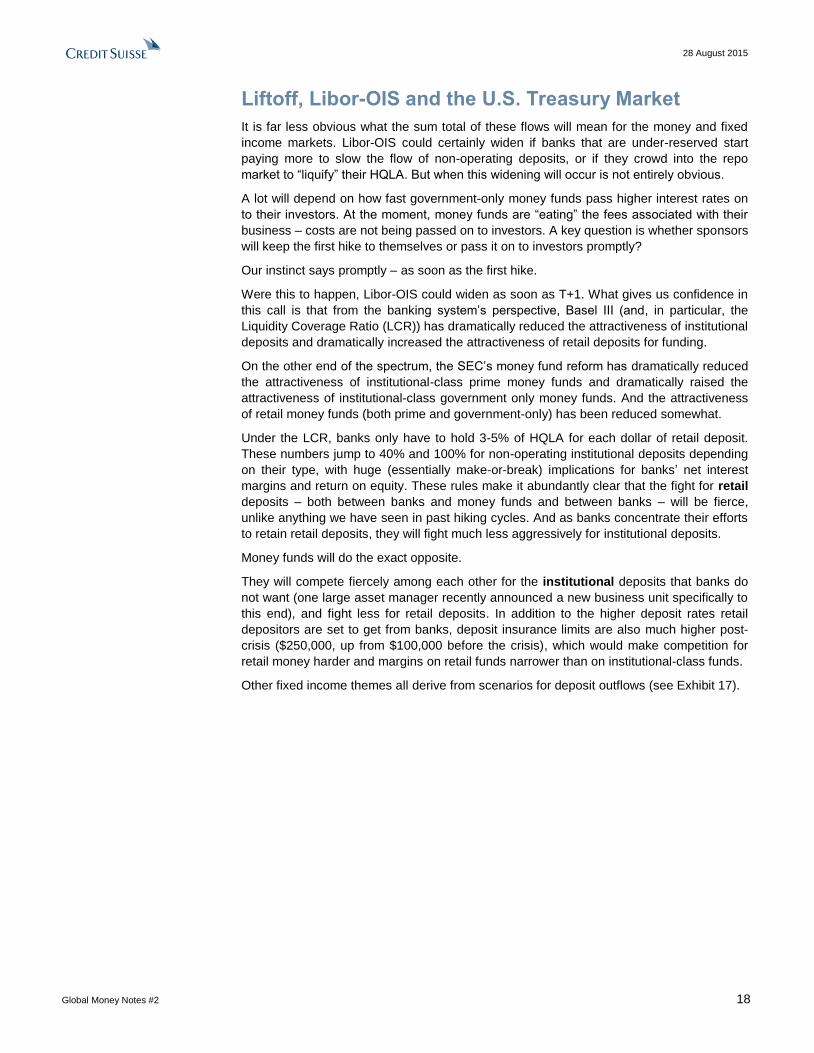
A rising tide – rising interest rates – may not lift all boats as is typically the case during
hiking cycles. The implication for bank equities is straightforward (see Exhibits 16).
Exhibit 16: Not All HQLA Portfolios Are Positioned for Balance Sheet Relief
$ billions, 2015Q1
Transactional 1 Nontransactional 2 Reserves US Treasuries MBS Bank Dealer Holdco
BoA 137 318 107 60 274
JPM 186 348 447 11 65
WF3 87 410 244 81 76
C 79 151 49 135 57 218 24
MS - - 16 80 36 55 78
GS - - 42 64 10 55 88 32
1Some transactional deposits may be viewed by banks as "operating excess balances" and classified as nonoperating deposits instead.2Proxy for nonoperating deposits.3Unencumbered MBS only.
Institutional Deposits HQLA (by asset) HQLA (by location)
Source: Credit Suisse
28 August 2015
Global Money Notes #2 18
Liftoff, Libor-OIS and the U.S. Treasury Market
It is far less obvious what the sum total of these flows will mean for the money and fixed
income markets. Libor-OIS could certainly widen if banks that are under-reserved start
paying more to slow the flow of non-operating deposits, or if they crowd into the repo
market to “liquify” their HQLA. But when this widening will occur is not entirely obvious.
A lot will depend on how fast government-only money funds pass higher interest rates on
to their investors. At the moment, money funds are “eating” the fees associated with their
business – costs are not being passed on to investors. A key question is whether sponsors
will keep the first hike to themselves or pass it on to investors promptly?
Our instinct says promptly – as soon as the first hike.
Were this to happen, Libor-OIS could widen as soon as T+1. What gives us confidence in
this call is that from the banking system’s perspective, Basel III (and, in particular, the
Liquidity Coverage Ratio (LCR)) has dramatically reduced the attractiveness of institutional
deposits and dramatically increased the attractiveness of retail deposits for funding.
On the other end of the spectrum, the SEC’s money fund reform has dramatically reduced
the attractiveness of institutional-class prime money funds and dramatically raised the
attractiveness of institutional-class government only money funds. And the attractiveness
of retail money funds (both prime and government-only) has been reduced somewhat.
Under the LCR, banks only have to hold 3-5% of HQLA for each dollar of retail deposit.
These numbers jump to 40% and 100% for non-operating institutional deposits depending
on their type, with huge (essentially make-or-break) implications for banks’ net interest
margins and return on equity. These rules make it abundantly clear that the fight for retail
deposits – both between banks and money funds and between banks – will be fierce,
unlike anything we have seen in past hiking cycles. And as banks concentrate their efforts
to retain retail deposits, they will fight much less aggressively for institutional deposits.
Money funds will do the exact opposite.
They will compete fiercely among each other for the institutional deposits that banks do
not want (one large asset manager recently announced a new business unit specifically to
this end), and fight less for retail deposits. In addition to the higher deposit rates retail
depositors are set to get from banks, deposit insurance limits are also much higher post-
crisis ($250,000, up from $100,000 before the crisis), which would make competition for
retail money harder and margins on retail funds narrower than on institutional-class funds.
Other fixed income themes all derive from scenarios for deposit outflows (see Exhibit 17).
28 August 2015
Global Money Notes #2 19
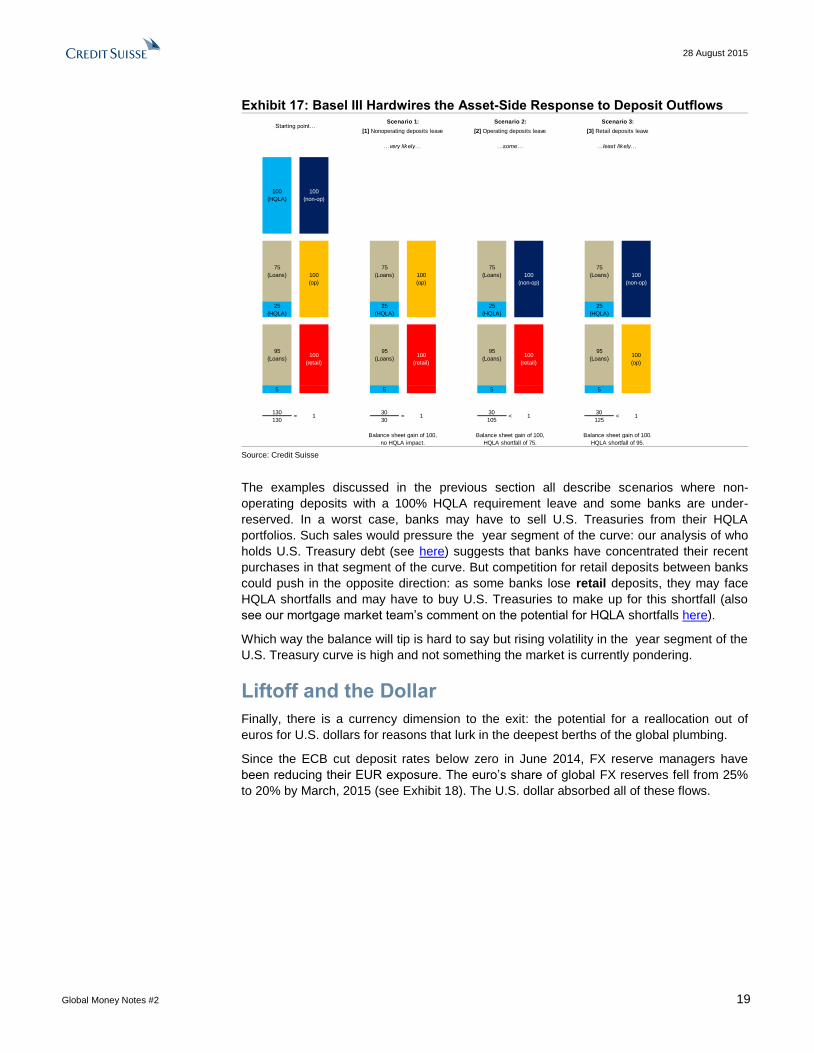
Exhibit 17: Basel III Hardwires the Asset-Side Response to Deposit Outflows
5 5 5 5
130 30 30 30
130 30 105 125
Scenario 1: Scenario 2:
Balance sheet gain of 100,
Scenario 3:
95
(Loans)
100
(non-op)
100
(op)
75
(Loans)
25
(HQLA)
<
Balance sheet gain of 100, Balance sheet gain of 100.
75
(Loans)
25
(HQLA)
100
(non-op)
HQLA shortfall of 75. HQLA shortfall of 95.no HQLA impact.
1
95
(Loans)100
(retail)
< 1= 1
75
(Loans) 100
(op)
25
(HQLA)
95
(Loans)100
(retail)
= 1
95
(Loans)100
(retail)
100
(HQLA)
100
(non-op)
100
(op)
75
(Loans)
25
(HQLA)
Starting point…[1] Nonoperating deposits leave [2] Operating deposits leave [3] Retail deposits leave
...very likely… …some… ...least likely…
Source: Credit Suisse
The examples discussed in the previous section all describe scenarios where non-
operating deposits with a 100% HQLA requirement leave and some banks are under-
reserved. In a worst case, banks may have to sell U.S. Treasuries from their HQLA
portfolios. Such sales would pressure the year segment of the curve: our analysis of who
holds U.S. Treasury debt (see here) suggests that banks have concentrated their recent
purchases in that segment of the curve. But competition for retail deposits between banks
could push in the opposite direction: as some banks lose retail deposits, they may face
HQLA shortfalls and may have to buy U.S. Treasuries to make up for this shortfall (also
see our mortgage market team’s comment on the potential for HQLA shortfalls here).
Which way the balance will tip is hard to say but rising volatility in the year segment of the
U.S. Treasury curve is high and not something the market is currently pondering.
Liftoff and the Dollar
Finally, there is a currency dimension to the exit: the potential for a reallocation out of
euros for U.S. dollars for reasons that lurk in the deepest berths of the global plumbing.
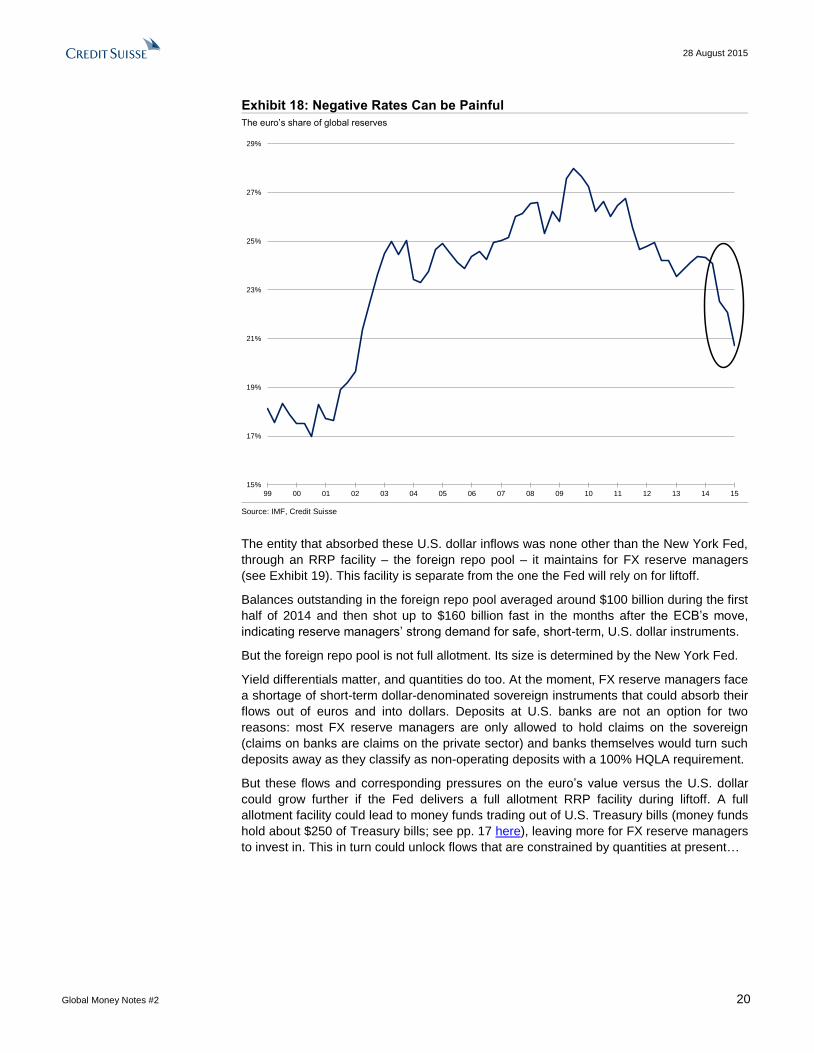
Since the ECB cut deposit rates below zero in June 2014, FX reserve managers have
been reducing their EUR exposure. The euro’s share of global FX reserves fell from 25%
to 20% by March, 2015 (see Exhibit 18). The U.S. dollar absorbed all of these flows.
28 August 2015
Global Money Notes #2 20
Exhibit 18: Negative Rates Can be Painful
The euro’s share of global reserves
15%
17%
19%
21%
23%
25%
27%
29%
99 00 01 02 03 04 05 06 07 08 09 10 11 12 13 14 15
Source: IMF, Credit Suisse
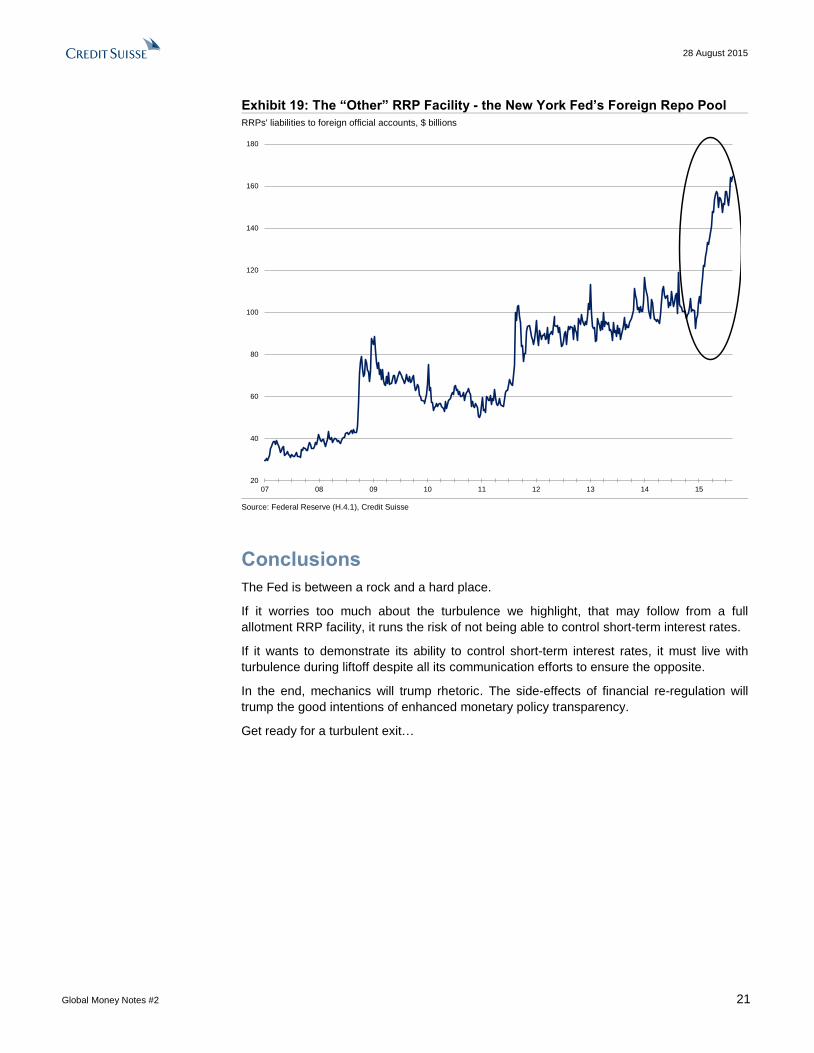
The entity that absorbed these U.S. dollar inflows was none other than the New York Fed,
through an RRP facility – the foreign repo pool – it maintains for FX reserve managers
(see Exhibit 19). This facility is separate from the one the Fed will rely on for liftoff.
Balances outstanding in the foreign repo pool averaged around $100 billion during the first
half of 2014 and then shot up to $160 billion fast in the months after the ECB’s move,
indicating reserve managers’ strong demand for safe, short-term, U.S. dollar instruments.
But the foreign repo pool is not full allotment. Its size is determined by the New York Fed.
Yield differentials matter, and quantities do too. At the moment, FX reserve managers face
a shortage of short-term dollar-denominated sovereign instruments that could absorb their
flows out of euros and into dollars. Deposits at U.S. banks are not an option for two
reasons: most FX reserve managers are only allowed to hold claims on the sovereign
(claims on banks are claims on the private sector) and banks themselves would turn such
deposits away as they classify as non-operating deposits with a 100% HQLA requirement.
But these flows and corresponding pressures on the euro’s value versus the U.S. dollar
could grow further if the Fed delivers a full allotment RRP facility during liftoff. A full
allotment facility could lead to money funds trading out of U.S. Treasury bills (money funds
hold about $250 of Treasury bills; see pp. 17 here), leaving more for FX reserve managers
to invest in. This in turn could unlock flows that are constrained by quantities at present…
28 August 2015
Global Money Notes #2 21
Exhibit 19: The “Other” RRP Facility - the New York Fed’s Foreign Repo Pool
RRPs' liabilities to foreign official accounts, $ billions
20
40
60
80
100
120
140
160
180
07 08 09 10 11 12 13 14 15
Source: Federal Reserve (H.4.1), Credit Suisse
Conclusions
The Fed is between a rock and a hard place.
If it worries too much about the turbulence we highlight, that may follow from a full
allotment RRP facility, it runs the risk of not being able to control short-term interest rates.
If it wants to demonstrate its ability to control short-term interest rates, it must live with
turbulence during liftoff despite all its communication efforts to ensure the opposite.
In the end, mechanics will trump rhetoric. The side-effects of financial re-regulation will
trump the good intentions of enhanced monetary policy transparency.
Get ready for a turbulent exit…

28 August 2015
Global Money Notes #2 22
Appendix – The Politics of the Exit
Initially, the Fed’s intention (or more precisely the New York Fed’s intention, in agreement
with then Chairman Ben Bernanke) was to turn RRPs into fixed rate, full allotment
operations. However, this idea soon hit the wall of concerns raised by regional Fed
presidents and differences between the New York Fed and the Federal Reserve Board.
Four concerns emerged in particular. The first three are entirely misplaced and the fourth
could have been dealt with through more deft communication, but never was.
The first concern (voiced mostly by regional Fed hawks) was that a full allotment RRP
facility would keep the size of the Fed’s balance sheet large for a long time to come, which
would bring with it “obvious” inflationary risks. This concern is misplaced. Inflation is
nowhere to be seen, and the size of the Fed’s balance sheet certainly does not drive it.
The second concern was that a full allotment RRP facility would “disintermediate” banks.
This concern is also misplaced. If anything, banks view excess reserves more as a burden
rather than a boon. When combined with the supplementary leverage ratio (SLR), excess
reserves dilute banks’ net interest margin and return on equity. It is true that at the
moment banks hold hundreds of billions worth of excess reserves as HQLA, but they could
hold other instruments at no haircut as well, namely U.S. Treasury securities. The liquidity
coverage ratio (LCR) does not require banks to hold ultra short-term assets – such as
reserves – but with the stock of excess reserves determined by the Fed, the banking
system as a whole simply has no choice. Some swapping of reserves for RRPs may
actually be neutral from an LCR perspective (see below), and if anything, banks would
ideally prefer more, not less choice as to how they structure their HQLA portfolios.
The third concern was that a full allotment RRP facility would increase the size of money
funds – entities not under the direct supervision of the Fed. This concern is misplaced as
well. Money funds are far more transparent and easier to understand for regulators than
banks, and with the SEC’s recently concluded reforms of the sector, a safer set of vehicles
to enable liftoff. While it is true that the Fed does not directly supervise money funds, it
does have a powerful seat on the Financial Stability Oversight Council which in turn wields
powers granted by Congress to require any financial entity to submit information, submit to
Fed supervision and in extremis meet prudential standards set by the Fed.
The fourth concern was that a full allotment RRP facility would encourage runs during a
crisis. This concern is also misplaced, but could easily have been dealt with by more deft
communication. Those in favor of a full allotment RRP facility could have articulated the
difference between the meaning of full allotment in “peace time” and “war time.”
In “peace time,” essentially now, the notion of full allotment is about how to calibrate the
mix between reserves and RRPs given no change in the size of the Fed’s balance sheet.
Here, full allotment is about the Fed’s ability to control short-term interest rates. The
question is how high to build the wall of the Hoover Dam for normal times (see above).
In “war time,” that is during systemic crises, the notion of full allotment is about the Fed
increasing the size of its balance sheet when the pressure is on to issue the supply of safe
assets. The question is how much to add to the height of the Hoover Dam when a tsunami
is about to surge downstream. It relates to a deeper question of whether to follow the Bank
of England down the path of Dealer of Last Resort that the Fed will have to spend some
time thinking about, but the way officials have been talking about RRPs so far is one sided.
Balance sheets never increase on one side only, and if during the next crisis the Fed were
to increase the supply of RRPs on the liability side of its balance sheet, it would also have
to do something else on the asset side. Whether that will be outright asset purchases from
asset managers (via dealers), repos (TOMOs) with dealers in size, or discount window
loans to banks won’t matter. What will matter is that the collateral that comes in through
either of these operations will be in exchange for central bank funding. In this context,
28 August 2015
Global Money Notes #2 23
RRPs would not facilitate a run, but provide a safe asset in a new (not yet familiar) form –
not in the form of currency or reserves but RRPs. In this context, RRPs are no different
from a surging supply of U.S. Treasury bills (in the form of SFP bills) during the 2008 crisis.
To make up for everything a fixed rate, fixed allotment facility was not, two additional tools
entered the debate – the term deposit facility (TDF) and segregated cash accounts (SCA)
– both of which have more to do with internal Federal Reserve politics than substance.
RRPs, the TDF and SCAs all aim to achieve one thing, which is to reduce the amount of
excess reserves in the banking system to a point where reserves are scarce again and
there are more incentives for banks to trade them to meet regulatory requirements.
RRPs reduce the amount of excess reserves by swapping them into a liability that can be
held by money funds. The idea of RRPs originated at the New York Fed.
TDFs reduce the amount of excess reserves by swapping reserves into term deposits,
which, unlike reserves, cannot be used to meet reserve requirements. The TDF was an
idea of the Federal Reserve Board, to address discomfort with the New York Fed’s plan to
rely on money funds as the enablers of liftoff. Banks don’t seem too excited about the TDF,
however. They typically swap existing reserves for TDs, but do not borrow to get them.
SCAs reduce the amount of excess reserves by stapling reserves to deposits such that
reserves de facto become the assets of deposit holders and cease to be the assets of
banks, such that banks would no longer be able to use them to meet reserve requirements.
SCAs were an idea of Jamie McAndrews, head of research at the New York Fed (see
here). Like the TDF, SCAs were also conceived to address discomfort with money funds.
Importantly, however, it is only RRPs that reduce excess reserves in a way that provides
balance sheet relief for banks. The TDF and SCAs do not and both are subject to the
same Basel III constraints and transmission bottlenecks as excess reserves that we
described in Global Money Notes #1 (see section “Basel III Disrupts Arbitrage” here).
On the importance on achieving reserves scarcity with balance sheet relief, consider that
the New York Fed in its flagship presentation on the exit (see here) places great emphasis
on how RRPs give banks balance sheet relief, while the TDF does not; how RRPs reduce
banks’ balance sheet costs, while the TDF does not; and how RRPs enhance welfare,
while the TDF does not. That’s three pages in a 30-page report devoted to praising the
attractiveness of o/n RRPs over the TDF, authored by someone who according to the
attendance log of the March FOMC meeting was in the room helping the Manager of the
System Open Market Account brief the FOMC on how to size the o/n RRP facility for liftoff.
On the important matter of pricing, also consider that both the TDF and SCAs cost more
than RRPs. The TDF is priced at a slight premium over IOER versus a deep discount for
RRPs, and SCAs would be priced at a slight (not a deep) discount to IOER (see here).
Pricing and balance sheet relief do matter, which is why the Fed has ultimately decided to
put more muscle behind RRPs than the TDF as the primary “crutch” under short-term
interest rates during liftoff. SCAs seem to have faded as an idea altogether.

28 August 2015
Global Money Notes #2 24
References: Pozsar, Zoltan, “The Rise and Fall of the Shadow Banking System,” Moody’s Economy.com (July, 2008) Wilmot, Jonathan, Sweeney, James, Klein, Matthias and Lantz, Carl, “Long Shadows,” Credit Suisse (May, 2009) Pozsar, Zoltan, Adrian, Tobias, Ashcraft Adam and Boesky, Hayley, “Shadow Banking,” FRBNY (July, 2010) Pozsar, Zoltan “Institutional Cash Pools and the Triffin Dilemma of the US Banking System,” IMF (August, 2011) Sweeney, James and Wilmot, Jonathan, “When Collateral Is King,” Credit Suisse (March, 2012) Mehrling, Perry, Pozsar, Zoltan, Sweeney, James and Neilson, Dan “Bagehot Was a Shadow Banker,” INET (November, 2013) Sweeney, James, “Liquidity Required: Reshaping the Financial System,” Credit Suisse (November, 2013) Pozsar, Zoltan, “Shadow Banking: The Money View”, US Treasury (July, 2014) Pozsar, Zoltan, “How the Financial System Works: An Atlas of Money Flows in the Global Financial Ecosystem,” US Treasury (July, 2014)
Pozsar, Zoltan, “A Macro View of Shadow Banking,” INET (January, 2015)
Di Iasio, Giovanni, and Pozsar, Zoltan, “A Model of Shadow Banking: Crises, Central
Banks and Regulation” Banca d’Italia (May, 2015)
Pozsar, Zoltan and Sweeney, James, “Global Money Notes #1: The Money Market Under
Government Control,” Credit Suisse (May, 2015)

GLOBAL FIXED INCOME AND ECONOMIC RESEARCH
Ric Deverell Global Head of Fixed Income and Economic Research
+1 212 538 8964 [email protected]
GLOBAL ECONOMICS AND STRATEGY
James Sweeney, Chief Economist Co-Head of Global Economics and Strategy
+1 212 538 4648 [email protected]
Neville Hill Co-Head of Global Economics and Strategy
+44 20 7888 1334 [email protected]
GLOBAL STRATEGY AND ECONOMICS
Axel Lang +1 212 538 4530 [email protected]
Jeremy Schwartz +1 212 538 6419 [email protected]
Sarah Smith +1 212 325-1022 [email protected]
Wenzhe Zhao +1 212 325 1798 [email protected]
US ECONOMICS
James Sweeney
Head of US Economics
+1 212 538 4648
Xiao Cui
+1 212 538 2511
Jay Feldman
+1 212 325 7634
Zoltan Pozsar
+1 212 538 3779
Dana Saporta
+1 212 538 3163
LATIN AMERICA (LATAM) ECONOMICS
Alonso Cervera
Head of Latam Economics
+52 55 5283 3845
Mexico, Chile
Casey Reckman
+1 212 325 5570
Argentina, Venezuela
Daniel Chodos
+1 212 325 7708
Latam Strategy
Juan Lorenzo Maldonado
+1 212 325 4245
Colombia, Ecuador, Peru
Alberto J. Rojas
+1 212 538 4125
BRAZIL ECONOMICS
Nilson Teixeira
Head of Brazil Economics
+55 11 3701 6288
Daniel Lavarda
+55 11 3701 6352
Iana Ferrao
+55 11 3701 6345
Leonardo Fonseca
+55 11 3701 6348
Paulo Coutinho
+55 11 3701-6353
EUROPEAN ECONOMICS
Neville Hill Head of European Economics +44 20 7888 1334 [email protected]
Christel Aranda-Hassel +44 20 7888 1383 [email protected]
Giovanni Zanni +44 20 7888 6827 [email protected]
Sonali Punhani +44 20 7883 4297 [email protected]
Mirco Bulega +44 20 7883 9315
EASTERN EUROPE, MIDDLE EAST AND AFRICA (EEMEA) ECONOMICS
Berna Bayazitoglu
Head of EEMEA Economics
+44 20 7883 3431
Turkey
Carlos Teixeira
+27 11 012 8054
South Africa, Sub-Saharan Africa
Alexey Pogorelov
+44 20 7883 0396
Russia, Ukraine, Kazakhstan
Nimrod Mevorach
+44 20 7888 1257
EEMEA Strategy, Israel
Chernay Johnson
+27 11 012 8068
chernay.johnson @credit-suisse.com
Nigeria, Sub-Saharan Africa
Mikhail Liluashvili +44 20 7888 7342 [email protected]
JAPAN ECONOMICS NON-JAPAN ASIA (NJA) ECONOMICS
Hiromichi Shirakawa
Head of Japan Economics
+81 3 4550 7117
Takashi Shiono
+81 3 4550 7189
Dong Tao
Head of NJA Economics
+852 2101 7469
China
Dr. Santitarn Sathirathai
+65 6212 5675
Regional, India, Indonesia, Thailand
Christiaan Tuntono
+852 2101 7409
Hong Kong, Korea, Taiwan
Deepali Bhargava
+65 6212 5699
India
Michael Wan
+65 6212 3418
Singapore, Malaysia, Philippines
Weishen Deng
+852 2101 7162
China

Disclosure Appendix
Analyst Certification Zoltan Pozsar and James Sweeney, each certify, with respect to the companies or securities that the individual analyzes, that (1) the views expressed in this report accurately reflect his or her personal views about all of the subject companies and securities and (2) no part of his or her compensation was, is or will be directly or indirectly related to the specific recommendations or views expressed in this report. References in this report to Credit Suisse include all of the subsidiaries and affiliates of Credit Suisse operating under its investment banking division. For more information on our structure, please use the following link: https://www.credit-suisse.com/who-we-areThis report may contain material that is not directed to, or intended for distribution to or use by, any person or entity who is a citizen or resident of or located in any locality, state, country or other jurisdiction where such distribution, publication, availability or use would be contrary to law or regulation or which would subject Credit Suisse AG or its affiliates ("CS") to any registration or licensing requirement within such jurisdiction. All material presented in this report, unless specifically indicated otherwise, is under copyright to CS. None of the material, nor its content, nor any copy of it, may be altered in any way, transmitted to, copied or distributed to any other party, without the prior express written permission of CS. All trademarks, service marks and logos used in this report are trademarks or service marks or registered trademarks or service marks of CS or its affiliates. The information, tools and material presented in this report are provided to you for information purposes only and are not to be used or considered as an offer or the solicitation of an offer to sell or to buy or subscribe for securities or other financial instruments. CS may not have taken any steps to ensure that the securities referred to in this report are suitable for any particular investor. CS will not treat recipients of this report as its customers by virtue of their receiving this report. The investments and services contained or referred to in this report may not be suitable for you and it is recommended that you consult an independent investment advisor if you are in doubt about such investments or investment services. Nothing in this report constitutes investment, legal, accounting or tax advice, or a representation that any investment or strategy is suitable or appropriate to your individual circumstances, or otherwise constitutes a personal recommendation to you. CS does not advise on the tax consequences of investments and you are advised to contact an independent tax adviser. Please note in particular that the bases and levels of taxation may change. Information and opinions presented in this report have been obtained or derived from sources believed by CS to be reliable, but CS makes no representation as to their accuracy or completeness. CS accepts no liability for loss arising from the use of the material presented in this report, except that this exclusion of liability does not apply to the extent that such liability arises under specific statutes or regulations applicable to CS. This report is not to be relied upon in substitution for the exercise of independent judgment. CS may have issued, and may in the future issue, other communications that are inconsistent with, and reach different conclusions from, the information presented in this report. Those communications reflect the different assumptions, views and analytical methods of the analysts who prepared them and CS is under no obligation to ensure that such other communications are brought to the attention of any recipient of this report. Some investments referred to in this report will be offered solely by a single entity and in the case of some investments solely by CS, or an associate of CS or CS may be the only market maker in such investments. Past performance should not be taken as an indication or guarantee of future performance, and no representation or warranty, express or implied, is made regarding future performance. Information, opinions and estimates contained in this report reflect a judgment at its original date of publication by CS and are subject to change without notice. The price, value of and income from any of the securities or financial instruments mentioned in this report can fall as well as rise. The value of securities and financial instruments is subject to exchange rate fluctuation that may have a positive or adverse effect on the price or income of such securities or financial instruments. Investors in securities such as ADR's, the values of which are influenced by currency volatility, effectively assume this risk. Structured securities are complex instruments, typically involve a high degree of risk and are intended for sale only to sophisticated investors who are capable of understanding and assuming the risks involved. The market value of any structured security may be affected by changes in economic, financial and political factors (including, but not limited to, spot and forward interest and exchange rates), time to maturity, market conditions and volatility, and the credit quality of any issuer or reference issuer. Any investor interested in purchasing a structured product should conduct their own investigation and analysis of the product and consult with their own professional advisers as to the risks involved in making such a purchase. Some investments discussed in this report may have a high level of volatility. High volatility investments may experience sudden and large falls in their value causing losses when that investment is realised. Those losses may equal your original investment. Indeed, in the case of some investments the potential losses may exceed the amount of initial investment and, in such circumstances, you may be required to pay more money to support those losses. Income yields from investments may fluctuate and, in consequence, initial capital paid to make the investment may be used as part of that income yield. Some investments may not be readily realisable and it may be difficult to sell or realise those investments, similarly it may prove difficult for you to obtain reliable information about the value, or risks, to which such an investment is exposed. This report may provide the addresses of, or contain hyperlinks to, websites. Except to the extent to which the report refers to website material of CS, CS has not reviewed any such site and takes no responsibility for the content contained therein. Such address or hyperlink (including addresses or hyperlinks to CS's own website material) is provided solely for your convenience and information and the content of any such website does not in any way form part of this document. Accessing such website or following such link through this report or CS's website shall be at your own risk. This report is issued and distributed in Europe (except Switzerland) by Credit Suisse Securities (Europe) Limited, One Cabot Square, London E14 4QJ, England, which is authorised by the Prudential Regulation Authority and regulated by the Financial Conduct Authority and the Prudential Regulation Authority. This report is being distributed in Germany by Credit Suisse Securities (Europe) Limited Niederlassung Frankfurt am Main regulated by the Bundesanstalt fuer Finanzdienstleistungsaufsicht ("BaFin"). This report is being distributed in the United States and Canada by Credit Suisse Securities (USA) LLC; in Switzerland by Credit Suisse AG; in Brazil by Banco de Investimentos Credit Suisse (Brasil) S.A or its affiliates; in Mexico by Banco Credit Suisse (México), S.A. (transactions related to the securities mentioned in this report will only be effected in compliance with applicable regulation); in Japan by Credit Suisse Securities (Japan) Limited, Financial Instruments Firm, Director-General of Kanto Local Finance Bureau (Kinsho) No. 66, a member of Japan Securities Dealers Association, The Financial Futures Association of Japan, Japan Investment Advisers Association, Type II Financial Instruments Firms Association; elsewhere in Asia/ Pacific by whichever of the following is the appropriately authorised entity in the relevant jurisdiction: Credit Suisse (Hong Kong) Limited, Credit Suisse Equities (Australia) Limited, Credit Suisse Securities (Thailand) Limited, regulated by the Office of the Securities and Exchange Commission, Thailand, having registered address at 990 Abdulrahim Place, 27th Floor, Unit 2701, Rama IV Road, Silom, Bangrak, Bangkok 10500, Thailand, Tel. +66 2614 6000, Credit Suisse Securities (Malaysia) Sdn Bhd, Credit Suisse AG, Singapore Branch, Credit Suisse Securities (India) Private Limited (CIN no. U67120MH1996PTC104392) regulated by the Securities and Exchange Board of India as Research Analyst (registration no. INH 000001030) and as Stock Broker (registration no. INB230970637; INF230970637; INB010970631; INF010970631), having registered address at 9th Floor, Ceejay House, Dr.A.B. Road, Worli, Mumbai - 18, India, T- +91-22 6777 3777, Credit Suisse Securities (Europe) Limited, Seoul Branch, Credit Suisse AG, Taipei Securities Branch, PT Credit Suisse Securities Indonesia, Credit Suisse Securities (Philippines ) Inc., and elsewhere in the world by the relevant authorised affiliate of the above. Research on Taiwanese securities produced by Credit Suisse AG, Taipei Securities Branch has been prepared by a registered Senior Business Person. Research provided to residents of Malaysia is authorised by the Head of Research for Credit Suisse Securities (Malaysia) Sdn Bhd, to whom they should direct any queries on +603 2723 2020. This report has been prepared and issued for distribution in Singapore to institutional investors, accredited investors and expert investors (each as defined under the Financial Advisers Regulations) only, and is also distributed by Credit Suisse AG, Singapore branch to overseas investors (as defined under the Financial Advisers Regulations). By virtue of your status as an institutional investor, accredited investor, expert investor or overseas investor, Credit Suisse AG, Singapore branch is exempted from complying with certain compliance requirements under the Financial Advisers Act, Chapter 110 of Singapore (the "FAA"), the Financial Advisers Regulations and the relevant Notices and Guidelines issued thereunder, in respect of any financial advisory service which Credit Suisse AG, Singapore branch may provide to you. This information is being distributed by Credit Suisse AG, Dubai Branch, duly licensed and regulated by the Dubai Financial Services Authority (DFSA), and is directed at Professional Clients or Market Counterparties only, as defined by the DFSA. The financial products or financial services to which the information relates will only be made available to a client who meets the regulatory criteria to be a Professional Client or Market Counterparty only, as defined by the DFSA, and is not intended for any other person. This research may not conform to Canadian disclosure requirements. In jurisdictions where CS is not already registered or licensed to trade in securities, transactions will only be effected in accordance with applicable securities legislation, which will vary from jurisdiction to jurisdiction and may require that the trade be made in accordance with applicable exemptions from registration or licensing requirements. Non-U.S. customers wishing to effect a transaction should contact a CS entity in their local jurisdiction unless governing law permits otherwise. U.S. customers wishing to effect a transaction should do so only by contacting a representative at Credit Suisse Securities (USA) LLC in the U.S. Please note that this research was originally prepared and issued by CS for distribution to their market professional and institutional investor customers. Recipients who are not market professional or institutional investor customers of CS should seek the advice of their independent financial advisor prior to taking any investment decision based on this report or for any necessary explanation of its contents. This research may relate to investments or services of a person outside of the UK or to other matters which are not authorised by the Prudential Regulation Authority and regulated by the Financial Conduct Authority and the Prudential Regulation Authority or in respect of which the protections of the Prudential Regulation Authority and Financial Conduct Authority for private customers and/or the UK compensation scheme may not be available, and further details as to where this may be the case are available upon request in respect of this report. CS may provide various services to US municipal entities or obligated persons ("municipalities"), including suggesting individual transactions or trades and entering into such transactions. Any services CS provides to municipalities are not viewed as "advice" within the meaning of Section 975 of the Dodd-Frank Wall Street Reform and Consumer Protection Act. CS is providing any such services and related information solely on an arm's length basis and not as an advisor or fiduciary to the municipality. In connection with the provision of the any such services, there is no agreement, direct or indirect, between any municipality (including the officials, management, employees or agents thereof) and CS for CS to provide advice to the municipality. Municipalities should consult with their financial, accounting and legal advisors regarding any such services provided by CS. In addition, CS is not acting for direct or indirect compensation to solicit the municipality on behalf of an unaffiliated broker, dealer, municipal securities dealer, municipal advisor, or investment adviser for the purpose of obtaining or retaining an engagement by the municipality for or in connection with Municipal Financial Products, the issuance of municipal securities, or of an investment adviser to provide investment advisory services to or on behalf of the municipality. If this report is being distributed by a financial institution other than Credit Suisse AG, or its affiliates, that financial institution is solely responsible for distribution. Clients of that institution should contact that institution to effect a transaction in the securities mentioned in this report or require further information. This report does not constitute investment advice by Credit Suisse to the clients of the distributing financial institution, and neither Credit Suisse AG, its affiliates, and their respective officers, directors and employees accept any liability whatsoever for any direct or consequential loss arising from their use of this report or its content. Principal is not guaranteed. Commission is the commission rate or the amount agreed with a customer when setting up an account or at any time after that. Copyright © 2015 CREDIT SUISSE AG and/or its affiliates. All rights reserved.
Investment principal on bonds can be eroded depending on sale price or market price. In addition, there are bonds on which investment principal can be eroded due to changes in redemption amounts. Care is required when investing in such instruments. When you purchase non-listed Japanese fixed income securities (Japanese government bonds, Japanese municipal bonds, Japanese government guaranteed bonds, Japanese corporate bonds) from CS as a seller, you will be requested to pay the purchase price only.