cs189a - capstone - cs.ucsb.educhris/teaching/cs189/doc/cs189-05.pdf · cs189a - capstone...
TRANSCRIPT

UC Santa Barbara
CS189A - Capstone
Christopher Kruegel Department of Computer Science
UC Santa Barbara http://www.cs.ucsb.edu/~chris/

UC Santa Barbara
Announcements
• Next Project Deliverable: Software Requirements Specifications (SRS) are due Wednesday, February 2nd
• Presentations on Friday

UC Santa Barbara
Project Management “The Mythical Man-Month”, F. B. Brooks, 1975
• A common disaster in software projects is not being able to deliver the project on time
• Why is this common? – Techniques of estimating cost of a project is poorly developed – Most estimating techniques confuse effort with progress, relying on
the fact that man and months are interchangeable – Since the estimates are not very reliable software managers are not
firm on the product delivery times – Progress in the project schedule is poorly monitored – When a slippage in the schedule is recognized the common
response is to add more manpower which makes matters worse

UC Santa Barbara
Mythical Man-Month
• Unit of effort used in estimating and scheduling: Man-month
• Cost may vary as the product of the number of men and the number of months, but progress does not.
• Man-month as a unit for measuring the size of a job is wrong – For most cases, a job that takes a software developer two months
cannot be done by two software developers in one month

UC Santa Barbara
Mythical Man-Month
• Men and months are interchangeable only when a task can be partitioned among many workers with no communication among them – Which is not true for software development projects
• There are sequential constraints in software development: – For example, you cannot integrate and do integration testing on two
modules before implementing both of them
• When a task cannot be partitioned because of sequential constraints, the application of more effort has no effect on the schedule – You can not cook one pie faster with two ovens

UC Santa Barbara
Mythical Man-Month
• In tasks that can be partitioned but which require communication among subtasks, the effort of communication must be added to the amount of work to be done
• Added communication has two parts: – Training
• The added worker must be trained in the technology, the goals of the effort, the overall strategy, the plan of the work
• Training cannot be partitioned – Intercommunication
• If each part of the task must be separately coordinated with each other part, the communication effort increases quadratic: n(n-1)/2
• 3 developers require 3 times as mush communication effort as 2 developers, 4 developers require 6 times as much communication effort as two developers

UC Santa Barbara
Communication Effort
3 developers, 3 communication paths
4 developers 6 communication paths
5 developers 10 communication paths
UC Santa Barbara
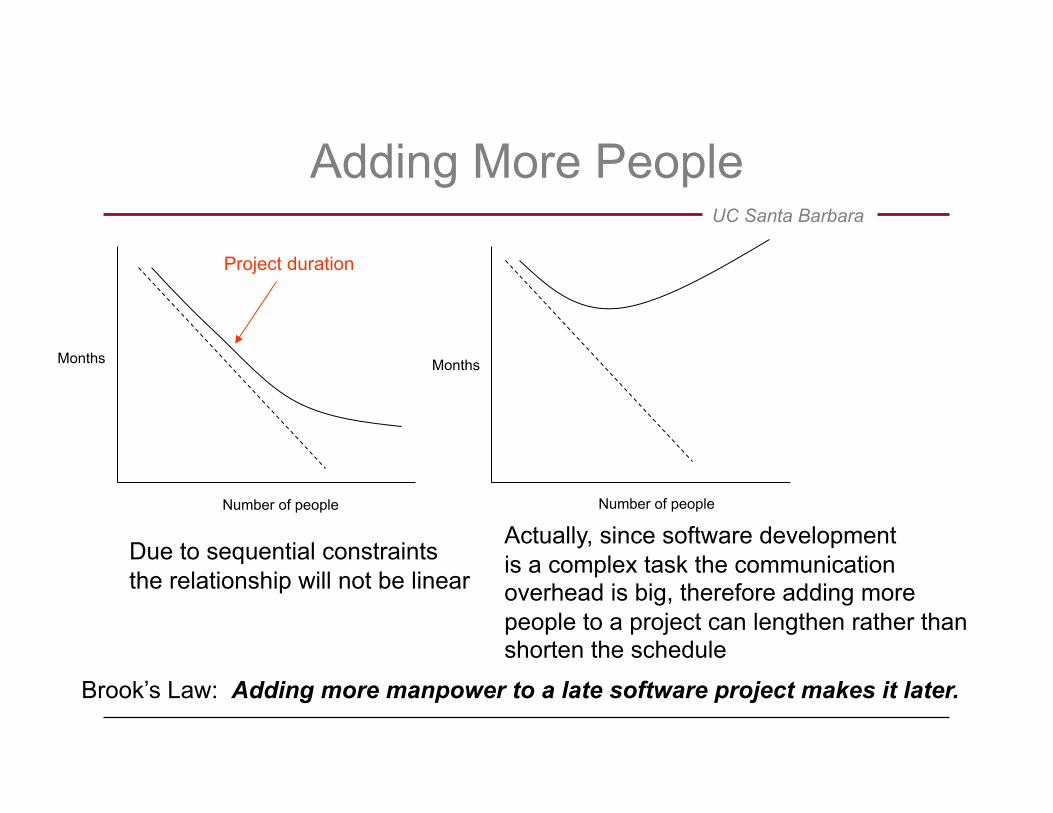
Adding More People
Due to sequential constraints the relationship will not be linear
Actually, since software development is a complex task the communication overhead is big, therefore adding more people to a project can lengthen rather than shorten the schedule
Number of people
Months
Number of people
Months
Project duration
Brook’s Law: Adding more manpower to a late software project makes it later.

UC Santa Barbara
A Side Note: Parallel Programming
• The same issues come up in parallel programming
• In parallel programming the main idea is to partition a computer program to a set of sub-programs which will run on different processors so that the result is obtained faster – Useful for scientific computing applications that require a lot of
computing power such as weather forecast
UC Santa Barbara
A Side Note: Parallel Programming
• The speed-up on P processors is defined as S(P) = (exec. time on 1 processor) / (exec. time on P processors)
• In an ideal situation one would want the speed-up to increase linearly with the number of processors
• However, sequential constraints and communication overhead prevents this – Hence, most of the time, one cannot trade execution time with
number of processors

UC Santa Barbara
A Side Note: Parallel Programming
Sequential constraints: due to parts of the program that cannot be parallelized (e.g., initialization) speed-up is not linear
P (number of processors)
S(P) (Speed-up)
P (number of processors)
S(P) (Speed-up)
Typical speed-up curve: Added communication overhead will eventually degrade the performance, i.e., adding more processors will actually slow down the program.
UC Santa Barbara
Cost Estimation, Metrics
• Estimating how long a software project will take is difficult
• Monitoring the progress in a project is crucial for project management
• For both of these, one needs good metrics – It is hard to measure software – Different phases of software require different metrics: requirements,
design, implementation
UC Santa Barbara
Size of Code as a Metric
• KLOC: Thousand Lines of Code – Different languages imply different lengths of code – The number of lines in the code will vary based on the
programmer’s ability
• DSI: Delivered Source Instructions – The number of lines of code delivered to customer
• NCSS: Non-Commented Source Statements – Ignore comments
UC Santa Barbara
Cost Estimation, Metrics
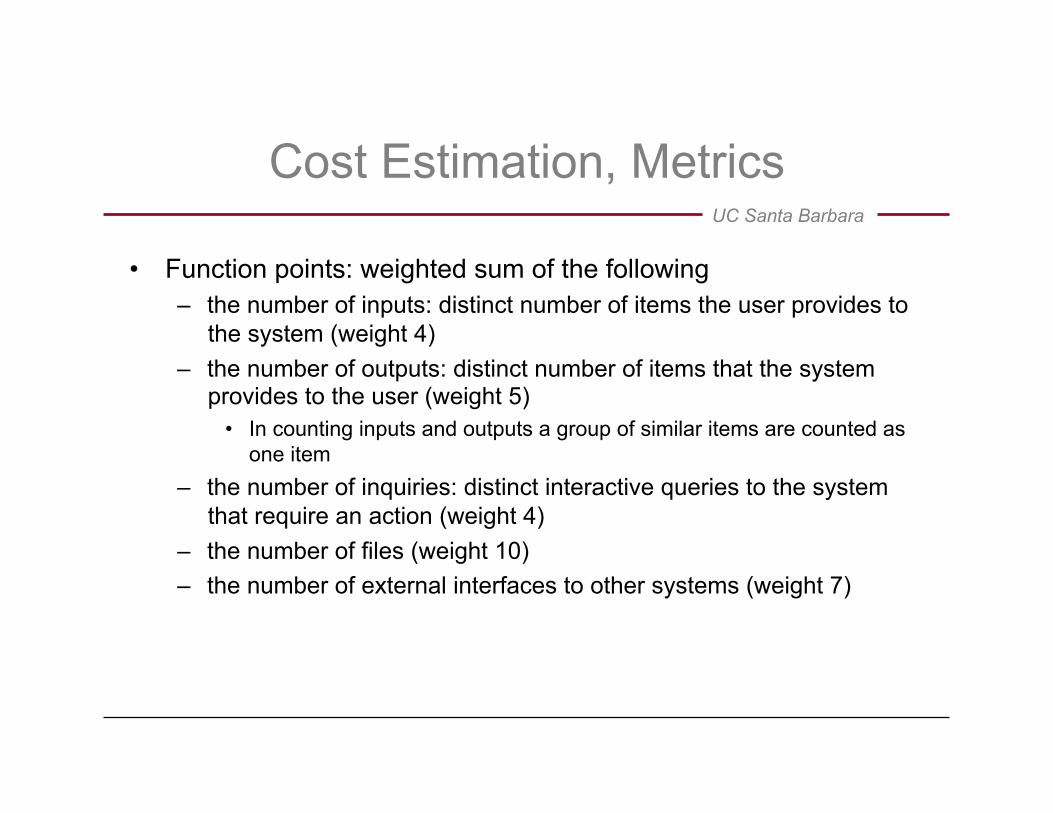
• Function points: weighted sum of the following – the number of inputs: distinct number of items the user provides to
the system (weight 4) – the number of outputs: distinct number of items that the system
provides to the user (weight 5) • In counting inputs and outputs a group of similar items are counted as
one item – the number of inquiries: distinct interactive queries to the system
that require an action (weight 4) – the number of files (weight 10) – the number of external interfaces to other systems (weight 7)

UC Santa Barbara
Causes of Inaccurate Cost Estimation
• Lederer and Prasad investigated cost estimation practices in 115 different organizations:
“Nine Management Guidelines for Better Cost Estimating,” Lederer and Prasad, Communications of the ACM, 35, pp, 51-59, February 1992.
• 35% indicated that their estimates were “moderately unsatisfactory” or “very unsatisfactory”
• Key causes for inaccurate estimates were: – Frequent requests for changes by customers – Overlooked tasks – Customers’ lack of understanding of their own requirements – Insufficient analysis when developing an estimate – Lack of coordination during development – Lack of an adequate method or guidelines for estimating

UC Santa Barbara
Causes of Inaccurate Cost Estimation
• In Lederer and Prasad study, the key influences on estimates were found to be – Complexity of the proposed application system – Required integration with existing systems – Complexity of the programs in the system – Size of the system expressed in number of functions or programs – Capabilities of the project team members – Project team’s experience with the application – Anticipated frequency of extent of potential changes in user
requirements – Project team’s experience with the programming language – Number of project team members – Extent of programming or documentation standards – Availability of supporting software tools
UC Santa Barbara
Planning and Monitoring
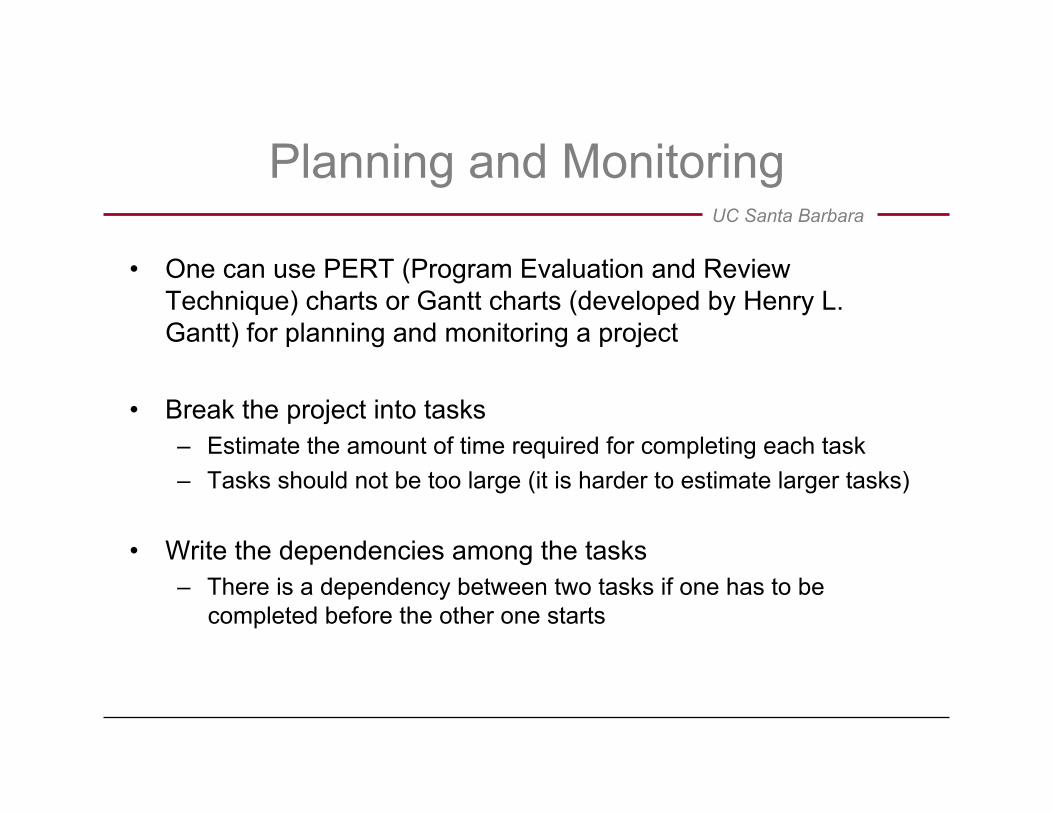
• One can use PERT (Program Evaluation and Review Technique) charts or Gantt charts (developed by Henry L. Gantt) for planning and monitoring a project
• Break the project into tasks – Estimate the amount of time required for completing each task – Tasks should not be too large (it is harder to estimate larger tasks)
• Write the dependencies among the tasks – There is a dependency between two tasks if one has to be
completed before the other one starts
UC Santa Barbara
PERT Charts
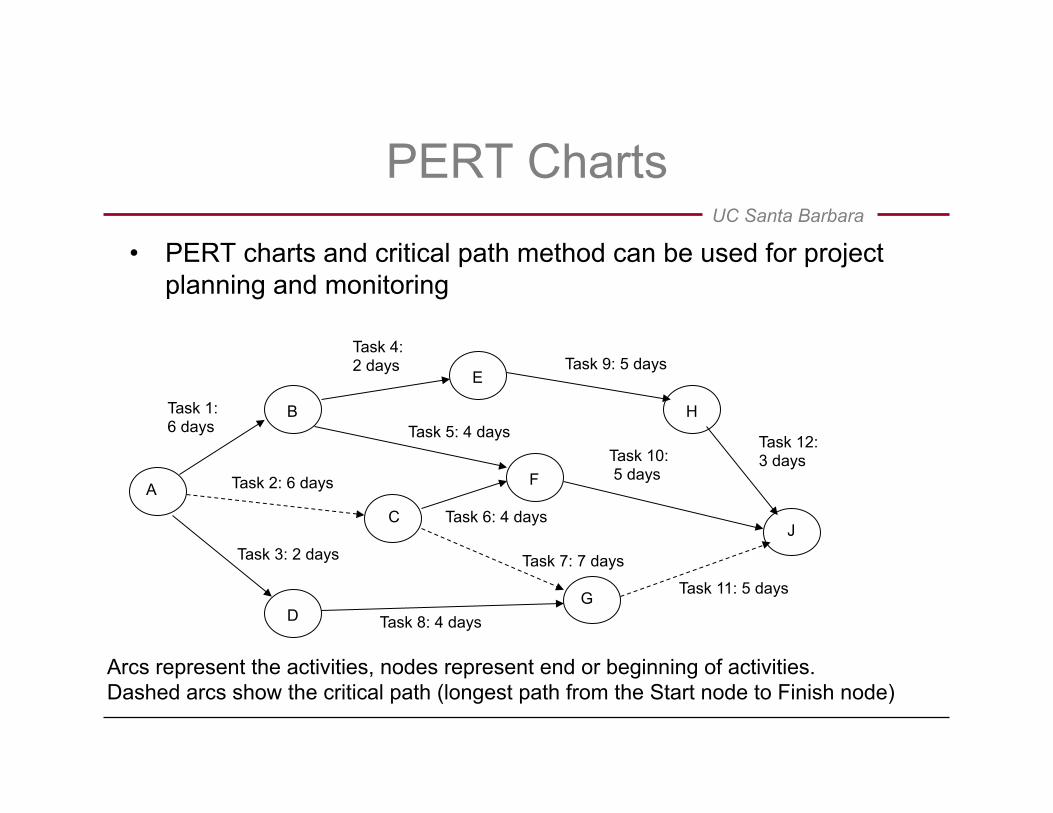
• PERT charts and critical path method can be used for project planning and monitoring
Arcs represent the activities, nodes represent end or beginning of activities. Dashed arcs show the critical path (longest path from the Start node to Finish node)
A
B
C
E
F
H
J
D G
Task 1: 6 days
Task 4: 2 days Task 9: 5 days
Task 12: 3 days
Task 5: 4 days Task 10: 5 days Task 2: 6 days
Task 6: 4 days
Task 7: 7 days
Task 11: 5 days
Task 3: 2 days
Task 8: 4 days

UC Santa Barbara
Monitoring with PERT charts
A
B
C
E
F
H
J
D G
Task 1: 6 days
Task 4: 2 days Task 9: 4 days
Task 12: 3 days Task 5: 5 days
Task 10: 5 days Task 2: 7 days
Task 6: 4 days
Task 7: 7 days
Task 11: 5 days
Task 3: 10 days
Task 8: 4 days
Thick lines indicate completed tasks. Project has to be monitored constantly and PERT chart should be updated. As seen above, the critical paths may change after the estimates are updated with the exact time spent on completed activities.

UC Santa Barbara
Gantt Charts
• Gantt Charts can also be used for project planning and scheduling
Days of the project are shown with vertical dashed lines. Tasks are shown with horizontal rectangles Lengths of the rectangles show the amount of time each task will take Tasks are scheduled based on the dependencies
Task 1
Task 2
Task 3
Task 4
Task 5
Task 6
Task 7
Task 8
Task 9
Task 10
Task 11
Task 12
Day 1
Day 18

UC Santa Barbara
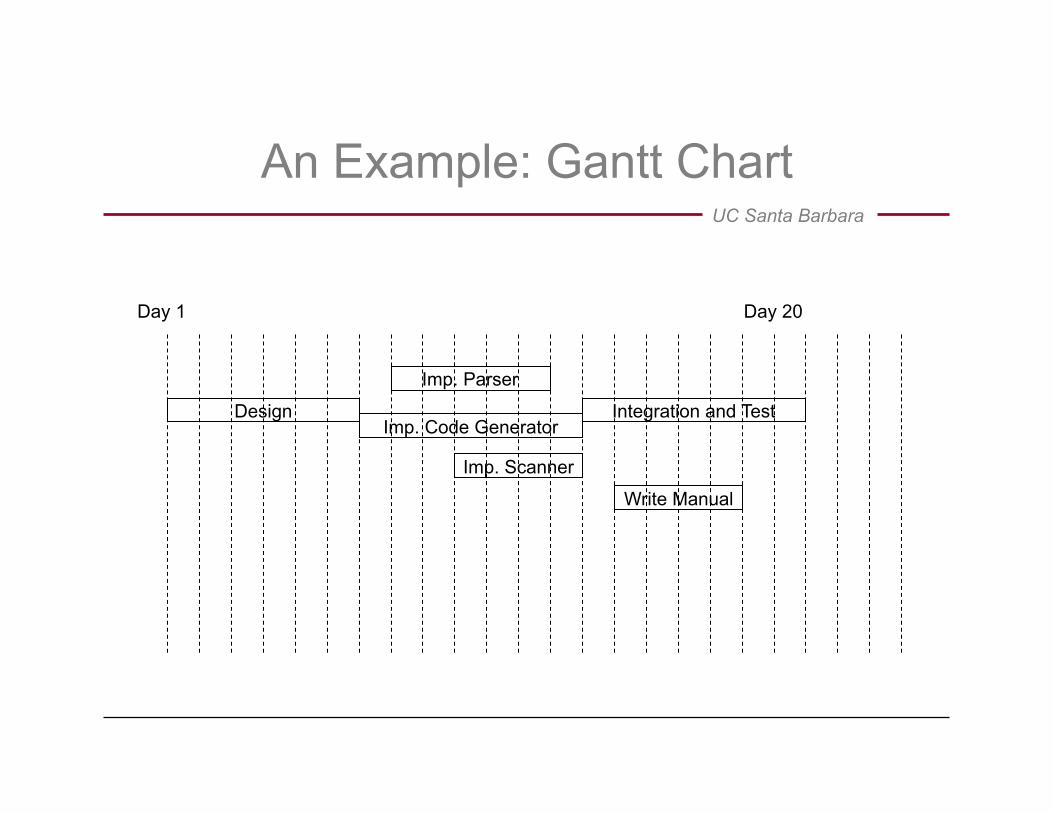
An Example
• A simple compiler project is divided in to following tasks with the associated cost estimates:
– Design (6 days) – Implement Scanner (4 days) – Implement Parser (5 days) – Implement Code Generator (7 days) – Integration and Testing (7 days) – Write Manual (4 days)
• The dependencies among these tasks are as follows: – Implementation of Scanner, Parser and Code Generator and Writing of the
Manual can start after the Design is finished – Integration and Testing can start after Implementation of Scanner, Parser
and Code Generator are all finished

UC Santa Barbara
An Example: PERT Chart
Project Start
Design Finished
Implement. Finished
Project Finished Implement Code
Generator: 7 days
Implement Parser: 5 days Design:
6 days
Implement Scanner: 4 days
Integration and Testing: 7 days
Write Manual: 4 days
Dashed arcs show the critical path
UC Santa Barbara
An Example: Gantt Chart
Design
Imp. Parser
Imp. Code Generator
Write Manual
Imp. Scanner
Integration and Test
Day 1 Day 20
UC Santa Barbara
Team Organization
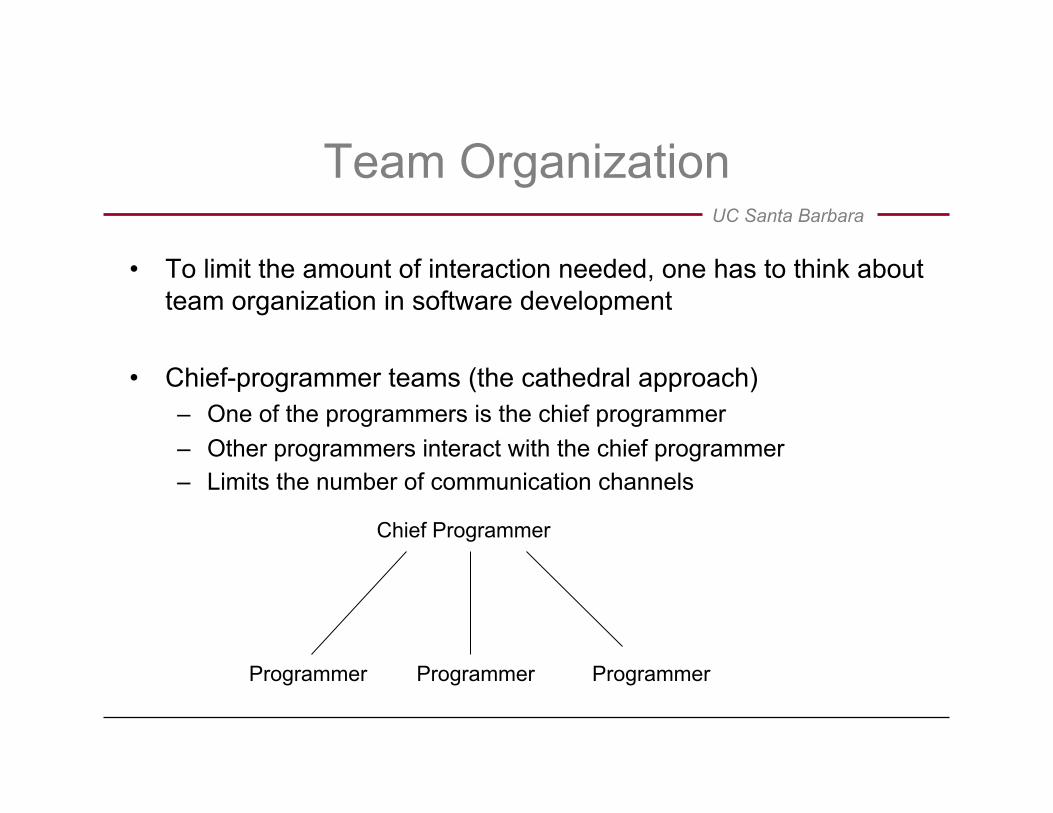
• To limit the amount of interaction needed, one has to think about team organization in software development
• Chief-programmer teams (the cathedral approach) – One of the programmers is the chief programmer – Other programmers interact with the chief programmer – Limits the number of communication channels
Chief Programmer
Programmer Programmer Programmer

UC Santa Barbara
Team Organization
• Democratic teams – Team members review each other’s work and are responsible as a
group for what every member produces
– Team members have to own all of the system, not only the part they develop. Every team member is responsible for the whole product
– Finding faults have to be encouraged and faults have to be expected
– Due to communication overhead democratic teams have to be small
UC Santa Barbara
The Cathedral and the Bazaar
• In a famous article Eric Stevens Raymond argues the merits of Open Source Software Development (the Bazaar approach):
“The Cathedral and the Bazaar,” 1997, http://www.catb.org/~esr/writings/cathedral-bazaar/
• Based on his experiences in Open Source development he states a set of observations/lessons about Open Source development
• These principles articulate the reasons behind the success (e.g., Linux) of Open Source development
• Let’s go over his observations/lessons
UC Santa Barbara
The Cathedral and the Bazaar
• On choosing a task: 1. “Every good work of software starts by scratching a developer’s
itch.” • If you want to produce good software, work on a problem that you
care about.
• On evolutionary, incremental development: 2. “Good programmers know how to write. Great ones know how to
rewrite (and reuse).” • The software evolves incrementally with a lot of reuse.
3. “Plan to throw one away; you will, anyhow.” • It is hard to understand a problem (requirements) until after the first
time you implement a solution (implementation) • Prototyping

UC Santa Barbara
The Cathedral and the Bazaar
• On maintaining open source software 4. “If you have the right attitude, interesting problems will find you.”
5. “When you lose interest in a program, your last duty to it is to hand it off to a competent successor.”
• These rely on the open source model where there are a large set of developers who volunteer for the tasks.
• It is important that the code is maintained by someone who cares about it and understands it well.

UC Santa Barbara
The Cathedral and the Bazaar
• On debugging open source software: 6. “Treating your users as co-developers is your least-hassle route to
rapid code improvement and effective debugging.” • This of course is assuming that users are programmers
7. “Release early. Release often. And listen to your customers.” • In order to take full advantage of the previous observation.
8. “Given a large enough beta-tester and co-developer base, almost every problem will be characterized quickly and the fix obvious to someone.”
• “Linus’s Law: Given enough eyeballs, all bugs are shallow” • Debugging does not suffer from the quadratic communication cost that
makes large development teams problematic
UC Santa Barbara
The Cathedral and the Bazaar
• On software design
9. “Smart data structures and dumb code works a lot better than the other way around.”
12. “Often, the most striking and innovative solutions come from realizing that your concept of the problem was wrong.”
13. “Perfection (in design) is achieved not when there is nothing more to add, but rather when there is nothing more to take away.”

UC Santa Barbara
The Cathedral and the Bazaar
• On beta-testers and users
10. “If you treat your beta-testers as if they’re your most valuable resource, they will respond by becoming your most valuable resource.”
11. “The next best thing to having good ideas is recognizing good ideas from your users. Sometimes the latter is better.”
14. “Any tool should be useful in the expected way, but a truly great tool lends itself uses you never expected.”
• The lifetime of the program may be much longer than what the developers expected and therefore it is important that the code is maintainable.