cscrpa 2013-2014 cfy tran - traditional series j …cdiacdocs.sto.ca.gov/2014-0259.pdfpricing...
TRANSCRIPT
NEW ISSUE—BOOK-ENTRY-ONLY RATINGS: S&P: Series J, K, L, M and N Bonds: “SP1+”S&P: Series O and P Bonds: “SP2”
(See “RATINGS” herein)
In the opinion of Orrick, Herrington & Sutcliffe LLP, Bond Counsel to the Authority, based upon an analysis of existing laws, regulations, rulings and courtdecisions, and assuming, among other matters, the accuracy of certain representations and compliance with certain covenants, interest on the Bonds is excluded fromgross income for federal income tax purposes under Section 103 of the Internal Revenue Code of 1986 and is exempt from State of California personal income taxes.The amount treated as interest on the Bonds and excluded from gross income may depend on the taxpayer’s election under Internal Revenue Service Notice 94-84. Inthe further opinion of Bond Counsel, interest on the Bonds is not a specific preference item for purposes of the federal individual or corporate alternative minimumtaxes, although Bond Counsel observes that such interest is included in adjusted current earnings when calculating federal corporate alternative minimum taxableincome. Bond Counsel expresses no opinion regarding any other tax consequences related to the ownership or disposition of, or the amount, accrual or receipt ofinterest on, the Bonds. See “TAX EXEMPTION” herein.
CALIFORNIA SCHOOL CASH RESERVE PROGRAM AUTHORITY$59,655,000
2013-2014 BONDS, SERIES J$59,255,000
2013-2014 BONDS, SERIES K$34,055,000
2013-2014 BONDS, SERIES L$17,285,000
2013-2014 BONDS, SERIES M$2,795,000
2013-2014 BONDS, SERIES N$21,830,000
2013-2014 BONDS, SERIES O$7,165,000
2013-2014 BONDS, SERIES P
(Sponsored by California School Boards Association Finance Corporation)
Dated: Date of Delivery Due: As shown on inside front cover
The California School Cash Reserve Program Authority (the “Authority”) is issuing its 2013-2014 Bonds, Series J (the “Series J Bonds”), its 2013-2014Bonds, Series K (the “Series K Bonds”), its 2013-2014 Bonds, Series L (the “Series L Bonds”), its 2013-2014 Bonds, Series M (the “Series M Bonds”), its 2013-2014Bonds, Series N (the “Series N Bonds”), its 2013-2014 Bonds, Series O (the “Series O Bonds”) and its 2013-2014 Bonds, Series P (the “Series P Bonds,” and togetherwith the Series J Bonds, the Series K Bonds, the Series L Bonds, the Series M Bonds, the Series N Bonds and the Series O Bonds, the “Bonds”) as fully registeredBonds and, when issued, each series of Bonds will be registered in the name of Cede & Co., as holder of the Bonds and nominee for The Depository Trust Company(“DTC”), New York, New York. DTC will act as securities depository for the Bonds. Individual purchases and sales of the Bonds may be made in book-entry formonly in denominations of $5,000 and integral multiples thereof. PURCHASERS WILL NOT RECEIVE CERTIFICATES REPRESENTING THEIR INTEREST INTHE BONDS PURCHASED. Interest on the Bonds will be payable at maturity. Principal of and interest on the Bonds will be payable by wire transfer to DTC, whichin turn is required to remit such principal and interest to the DTC Participants for subsequent disbursement to the Beneficial Owners of the Bonds, as more fullydescribed herein.
Each series of Bonds is being issued pursuant to the terms of the Indenture, dated as of July 1, 2013 (the “Original Indenture”), and a separate supplementalindenture for such series of Bonds, dated as of March 1, 2014 (the Original Indenture, together with all supplemental indentures, are collectively referred to herein asthe “Indenture”), each by and between the Authority and U.S. Bank National Association, as trustee (the “Trustee”), for the purpose of purchasing a separate pool ofcertain 2013-2014 Tax and Revenue Anticipation Notes (all such notes of all such pools are collectively referred to herein as the “Notes”), of the same maturity issuedby those California school districts and community college district identified herein (all such issuers are collectively referred to herein as the “Districts”). The requiredpayment of the principal of and interest on the Notes of a pool when due is structured to be sufficient to pay principal of and interest on the related series of Bonds whendue. Except as otherwise required by the Indenture, amounts received by the Trustee from the repayment of principal of and interest on the Notes of a pool will beapplied to repay the principal of and interest on the related series of Bonds. EXCEPT AS OTHERWISE REQUIRED BY THE INDENTURE, AMOUNTSRECEIVED FROM THE REPAYMENT OF ONE POOL OF NOTES SHALL NOT BE APPLIED TO THE REPAYMENT OF ANYUNRELATED SERIES OF BONDS OF THE AUTHORITY.
Neither the Bonds nor the Notes are subject to redemption prior to maturity.
In accordance with California law, the Note of each District is payable from the taxes, income, revenue, cash receipts and other moneys provided for FiscalYear 2013-2014 which will be received by or will accrue to the District during such fiscal year for its general fund and which are lawfully available for payment thereof(as more fully defined herein, the “Unrestricted Revenues”). As security for the payment of the principal of and interest on its Note, each District has pledged the firstUnrestricted Revenues to be received by such District in the repayment period and amounts specified herein (the “Pledged Revenues”). As provided in Section 53856 ofthe California Government Code, except as otherwise described herein, the Note of each District and the interest thereon, will be a first lien and charge against, and willbe payable from the first moneys received by the District from, the Pledged Revenues of such District. To the extent not so paid, each Note shall be paid from any othermoneys of such District lawfully available therefor. Notwithstanding the foregoing, for those Districts identified herein who have previously issued tax and revenueanticipation notes for Fiscal Year 2013-2014, such pledge and lien by each such District shall be subordinate to the pledge and lien of such Pledged Revenues createdfor the repayment of such prior notes as described herein. Each authorizing resolution (the “Resolution”) requires the applicable District to transfer to the Trusteecertain amounts to be deposited in a special fund from the first Unrestricted Revenues received by such District during the repayment period specified herein so that theamount on deposit in such fund by the applicable date set forth herein, taking into consideration anticipated investment earnings thereon, is equal to all of the principaland interest due on such Note at maturity, as more fully described herein. Because the deposits are required to be made by each District after the end of Fiscal Year2013-2014, payments to the Districts being deferred by the State of California from Fiscal Year 2013-2014 to Fiscal Year 2014-2015 will be the source of suchdeposits. See “SECURITY AND SOURCE OF PAYMENT FOR THE BONDS—Deferred Revenues.” The obligation of each District is a several and not a jointobligation and is strictly limited to such District’s repayment obligation under its Resolution and Note.
THE BONDS ARE SPECIAL OBLIGATIONS OF THE AUTHORITY PAYABLE SOLELY FROM CERTAIN FUNDS PLEDGED UNDER THEINDENTURE, SUBJECT TO THE PROVISIONS OF THE INDENTURE PERMITTING THE DISBURSEMENT THEREOF FOR OR TO THEPURPOSES AND ON THE CONDITIONS AND TERMS SET FORTH THEREIN.
This cover page contains certain information for general reference only. It is not a summary of all the provisions of the Bonds. Prospective investors areadvised to read the entire Official Statement to obtain information essential to the making of an informed investment decision.
The Bonds are offered when, as and if issued and accepted by the Underwriter, subject to the approval of legality by Orrick, Herrington & Sutcliffe LLP,Bond Counsel to the Authority. Certain legal matters will be passed upon for the Underwriter by its counsel, Kutak Rock LLP, and for the Districts by Kutak RockLLP. The Bonds, in book-entry form only, are expected to be delivered through the facilities of DTC on or about March 14, 2014, in New York, New York.
Dated: February 25, 2014.
PiperJaffrafe

PRICING INFORMATION FOR THE BONDS
$59,655,000
Series J Bonds
Maturity Date: October 1, 2014 Price: 101.039% Interest Rate: 2.000% Yield: 0.100% CUSIP No.†: 130583 GN1
$59,255,000
Series K Bonds
Maturity Date: October 1, 2014 Price: 101.039% Interest Rate: 2.000% Yield: 0.100% CUSIP No.†: 130583 GP6
$34,055,000
Series L Bonds
Maturity Date: October 1, 2014 Price: 101.028% Interest Rate: 2.000% Yield: 0.120% CUSIP No.†: 130583 GQ4
$17,285,000
Series M Bonds
Maturity Date: December 31, 2014 Price: 101.473% Interest Rate: 2.000% Yield: 0.150% CUSIP No.†: 130583 GR2
$2,795,000
Series N Bonds
Maturity Date: December 31, 2014 Price: 101.473% Interest Rate: 2.000% Yield: 0.150% CUSIP No.†: 130583 GS0
$21,830,000
Series O Bonds
Maturity Date: December 31, 2014 Price: 100.990% Interest Rate: 2.000% Yield: 0.750% CUSIP No.†: 130583 GT8
$7,165,000
Series P Bonds
Maturity Date: September 2, 2014 Price: 100.628% Interest Rate: 2.000% Yield: 0.650% CUSIP No.†: 130583 GU5
† CUSIP is a registered trademark of the American Bankers Association. CUSIP data herein is provided by CUSIP GlobalServices, managed by Standard & Poor’s Financial Services LLC on behalf of The American Bankers Association. This data isnot intended to create a database and does not serve in any way as a substitute for the CUSIP Services. Neither the Underwriter,the Authority nor the Districts are responsible for the selection or correctness of the CUSIP numbers set forth herein.

CALIFORNIA SCHOOL CASH RESERVE PROGRAM AUTHORITY
Teresa Williams, Chair
Creig Nicks, Treasurer
Michelle Williams, Secretary
PROFESSIONAL SERVICES
Bond CounselOrrick, Herrington & Sutcliffe LLP
San Francisco, California
Financial AdvisorDale Scott & Company
San Francisco, California
UnderwriterPiper Jaffray & Co.
El Segundo, California
Underwriter’s CounselKutak Rock LLPDenver, Colorado
TrusteeU.S. Bank National Association
Los Angeles, California

No broker, dealer, sales representative or other person has been authorized to give anyinformation or to make any representations other than those contained in this Official Statement inconnection with the offering made hereby and, if given or made, such information or representations mustnot be relied upon as having been authorized by the Authority, the Districts, the Financial Advisor or theUnderwriter. The information and expressions of opinions herein are subject to change without noticeand neither the delivery of this Official Statement nor any sale hereunder shall under any circumstancescreate any implication that there has been no change in the affairs of the Authority or any District sincethe date hereof. This Official Statement does not constitute an offer to sell or the solicitation of an offerto buy, nor shall there be any sale of the Bonds in any jurisdiction in which it is unlawful for such personto make such offer, solicitation or sale. The information contained in this Official Statement has beenobtained from the Districts and other sources believed by the Underwriter to be reliable, but it is notguaranteed as to accuracy or completeness and is not to be construed as a representation by theUnderwriter, by the Financial Advisor, by the Authority or by any District. This Official Statement issubmitted in connection with the sale of the Bonds referred to herein and may not be reproduced or used,in whole or in part, for any other purpose.
The Underwriter has provided the following sentence for inclusion in this Official Statement:The Underwriter has reviewed the information in this Official Statement in accordance with, and as partof, its responsibilities to investors under the federal securities laws as applied to the facts andcircumstances of this transaction, but the Underwriter does not guarantee the accuracy or completeness ofsuch information.
This Official Statement is not to be construed as a contract with the purchasers of the Bonds.Statements contained in this Official Statement which involve estimates, forecasts or matters of opinion,whether or not expressly so described herein, are intended solely as such and are not to be construed as arepresentation of facts.
IN CONNECTION WITH THIS OFFERING, THE UNDERWRITER MAY OVERALLOT OREFFECT TRANSACTIONS WHICH STABILIZE OR MAINTAIN THE MARKET PRICE OF THEBONDS AT A LEVEL ABOVE THAT WHICH MIGHT OTHERWISE PREVAIL IN THE OPENMARKET. SUCH STABILIZING, IF COMMENCED, MAY BE DISCONTINUED AT ANY TIME.THE UNDERWRITER MAY OFFER AND SELL THE BONDS TO CERTAIN SECURITIESDEALERS AND DEALER BANKS AND BANKS ACTING AS AGENT AT PRICES LOWER THANTHE PUBLIC OFFERING PRICES STATED ON THE INSIDE COVER PAGE AND SAID PUBLICOFFERING PRICES MAY BE CHANGED FROM TIME TO TIME BY THE UNDERWRITER.
Piper Jaffray & Co. Since 1895. Member SIPC and FINRA.

TABLE OF CONTENTS
Page
INTRODUCTORY STATEMENT .............................................................................................................1
The Program ...................................................................................................................................1Series J Bonds.................................................................................................................................2Series K Bonds................................................................................................................................2Series L Bonds ................................................................................................................................2Series M Bonds...............................................................................................................................2Series N Bonds................................................................................................................................3Series O Bonds................................................................................................................................3Series P Bonds ................................................................................................................................3Participating Districts......................................................................................................................4The Notes........................................................................................................................................4Security for the Notes .....................................................................................................................4Investment of Note Proceeds and Repayments...............................................................................5Sizing of Notes................................................................................................................................5Limited Obligations ........................................................................................................................6Prior Notes ......................................................................................................................................6Prior Bonds .....................................................................................................................................6Additional Bonds ............................................................................................................................7Additional Notes for Fiscal Year 2013-2014..................................................................................7Professionals Involved in the Offering ...........................................................................................7Additional Information ...................................................................................................................7
DESCRIPTION OF THE BONDS ..............................................................................................................8
Authority for Issuance.....................................................................................................................8Denominations; Payments of Principal and Interest .......................................................................8Registration of Bonds .....................................................................................................................8No Redemption Prior to Maturity ...................................................................................................9Book-Entry-Only System................................................................................................................9
SECURITY AND SOURCE OF PAYMENT FOR THE BONDS ...........................................................11
The Bonds .....................................................................................................................................11Additional Bonds ..........................................................................................................................11Prior Bonds ...................................................................................................................................11Additional Notes for Fiscal Year 2013-2014................................................................................12The Notes......................................................................................................................................12Deferred Revenues........................................................................................................................14Deposit and Pledge of Notes.........................................................................................................15Prior Notes ....................................................................................................................................15Note Repayment Period ................................................................................................................16Investments ...................................................................................................................................16Defaulted Notes ............................................................................................................................17
THE AUTHORITY ...................................................................................................................................17APPLICATION OF PROCEEDS..............................................................................................................17INVESTMENT OF DISTRICT FUNDS...................................................................................................18
General .........................................................................................................................................18County Investment Pools ..............................................................................................................18

ii
PARTICIPATING DISTRICTS ................................................................................................................19TAX EXEMPTION ...................................................................................................................................22ABSENCE OF LITIGATION ...................................................................................................................24FORWARD LOOKING STATEMENTS .................................................................................................24RATINGS ..................................................................................................................................................25UNDERWRITING ....................................................................................................................................25CERTAIN LEGAL MATTERS.................................................................................................................25TRUSTEE..................................................................................................................................................26CONTINUING DISCLOSURE.................................................................................................................26EXECUTION AND DELIVERY ..............................................................................................................29
APPENDIX A SUMMARY OF LEGAL DOCUMENTSAPPENDIX B GENERAL DISTRICT FINANCIAL INFORMATIONAPPENDIX C CERTAIN BACKGROUND INFORMATION AND PROJECTED CASH
FLOWS FOR DISTRICTSAPPENDIX D COVERAGE ANALYSISAPPENDIX E PROPOSED FORMS OF BOND COUNSEL OPINIONS

OFFICIAL STATEMENT
Relating to
CALIFORNIA SCHOOL CASH RESERVE PROGRAM AUTHORITY$59,655,000
2013-2014 BONDS, SERIES J$59,255,000
2013-2014 BONDS, SERIES K$34,055,000
2013-2014 BONDS, SERIES L$17,285,000
2013-2014 BONDS, SERIES M$2,795,000
2013-2014 BONDS, SERIES N$21,830,000
2013-2014 BONDS, SERIES O$7,165,000
2013-2014 BONDS, SERIES P
(Sponsored by California School Boards Association Finance Corporation)
INTRODUCTORY STATEMENT
This Official Statement, including the cover page and appendices hereto (the “OfficialStatement”), sets forth certain information concerning the California School Cash Reserve ProgramAuthority 2013-2014 Bonds, Series J (the “Series J Bonds”) in the aggregate principal amount of$59,655,000, the California School Cash Reserve Program Authority 2013-2014 Bonds, Series K (the“Series K Bonds”) in the aggregate principal amount of $59,255,000, the California School Cash ReserveProgram Authority 2013-2014 Bonds, Series L (the “Series L Bonds”) in the aggregate principal amountof $34,055,000, the California School Cash Reserve Program Authority 2013-2014 Bonds, Series M (the“Series M Bonds”) in the aggregate principal amount of $17,285,000, the California School Cash ReserveProgram Authority 2013-2014 Bonds, Series N (the “Series N Bonds”) in the aggregate principal amountof $2,795,000, the California School Cash Reserve Program Authority 2013-2014 Bonds, Series O (the“Series O Bonds”) in the aggregate principal amount of $21,830,000 and the California School CashReserve Program Authority 2013-2014 Bonds, Series P (the “Series P Bonds,” and together with theSeries J Bonds, the Series K Bonds, the Series L Bonds, the Series M Bonds, the Series N Bonds and theSeries O Bonds, the “Bonds”) in the aggregate principal amount of $7,165,000.
This Introductory Statement is not a summary of this Official Statement. It is only a briefdescription of and guide to, and is qualified by, more complete and detailed information contained in theentire Official Statement, including the cover page and appendices hereto, and the documents summarizedor described herein. A full review should be made of the entire Official Statement. The offering of theBonds to potential investors is made only by means of the entire Official Statement.
The Program
Pursuant to the California School Cash Reserve Program (the “Program”), participating schooldistricts, county boards of education and community college districts in the State of California (the“State”) simultaneously issue their tax and revenue anticipation notes which are then purchased withproceeds of one or more series of bonds of the same maturity to be issued by the California School CashReserve Program Authority (the “Authority”). The Bonds are authorized to be issued by the Authoritypursuant to the provisions of Article 4, Chapter 5, Division 7, Title 1 of the California Government Codeand pursuant to the provisions of an Indenture dated as of July 1, 2013 (the “Original Indenture”), by andbetween the Authority and U.S. Bank National Association, as trustee (the “Trustee”), as supplementedby the applicable supplemental indenture. The Original Indenture, as supplemented by the supplementalindentures, is hereinafter referred to as the “Indenture.”

2
Series J Bonds
The Authority is issuing the Series J Bonds pursuant to the Original Indenture, as supplementedby a Ninth Supplemental Indenture dated as of March 1, 2014 (the “Ninth Supplemental Indenture”), byand between the Authority and the Trustee. The net proceeds of the Series J Bonds will be used topurchase certain notes (the “Series J Notes”) issued by certain school districts and a community collegedistrict (the “Series J Districts”) as described herein under the caption “PARTICIPATING DISTRICTS.”Pursuant to the Original Indenture and the Ninth Supplemental Indenture, the Series J Notes will beassigned to the Trustee for the benefit of the registered owners (the “Owners”) of the Series J Bonds. Therequired payment by all Series J Districts of the aggregate principal of and interest due on all of theSeries J Notes when due is structured to be sufficient to pay all principal of and interest on the Series JBonds when due. Except as otherwise required by the Indenture, amounts received by the Trustee fromthe repayment of principal of and interest on the Series J Notes will be applied to repay all of the principalof and interest on the Series J Bonds. See “SECURITY AND SOURCE OF PAYMENT FOR THEBONDS—The Bonds” herein.
Series K Bonds
The Authority is issuing the Series K Bonds pursuant to the Original Indenture, as supplementedby a Tenth Supplemental Indenture dated as of March 1, 2014 (the “Tenth Supplemental Indenture”), byand between the Authority and the Trustee. The net proceeds of the Series K Bonds will be used topurchase certain notes (the “Series K Notes”) issued by certain school districts (the “Series K Districts”)as described herein under the caption “PARTICIPATING DISTRICTS.” Pursuant to the OriginalIndenture and the Tenth Supplemental Indenture, the Series K Notes will be assigned to the Trustee forthe benefit of the Owners of the Series K Bonds. The required payment by all Series K Districts of theaggregate principal of and interest due on all of the Series K Notes when due is structured to be sufficientto pay all principal of and interest on the Series K Bonds when due. Except as otherwise required by theIndenture, amounts received by the Trustee from the repayment of principal of and interest on theSeries K Notes will be applied to repay all of the principal of and interest on the Series K Bonds. See“SECURITY AND SOURCE OF PAYMENT FOR THE BONDS—The Bonds” herein.
Series L Bonds
The Authority is issuing the Series L Bonds pursuant to the Original Indenture, as supplementedby a Eleventh Supplemental Indenture dated as of March 1, 2014 (the “Eleventh SupplementalIndenture”), by and between the Authority and the Trustee. The net proceeds of the Series L Bonds willbe used to purchase certain notes (the “Series L Notes”) issued by certain school districts (the “Series LDistricts”) as described herein under the caption “PARTICIPATING DISTRICTS.” Pursuant to theOriginal Indenture and the Eleventh Supplemental Indenture, the Series L Notes will be assigned to theTrustee for the benefit of the Owners of the Series L Bonds. The required payment by all Series LDistricts of the aggregate principal of and interest due on all of the Series L Notes when due is structuredto be sufficient to pay all principal of and interest on the Series L Bonds when due. Except as otherwiserequired by the Indenture, amounts received by the Trustee from the repayment of principal of andinterest on the Series L Notes will be applied to repay all of the principal of and interest on the Series LBonds. See “SECURITY AND SOURCE OF PAYMENT FOR THE BONDS—The Bonds” herein.
Series M Bonds
The Authority is issuing the Series M Bonds pursuant to the Original Indenture, as supplementedby a Twelfth Supplemental Indenture dated as of March 1, 2014 (the “Twelfth Supplemental Indenture”),by and between the Authority and the Trustee. The net proceeds of the Series M Bonds will be used to

3
purchase certain notes (the “Series M Notes”) issued by certain school districts (the “Series M Districts”)as described herein under the caption “PARTICIPATING DISTRICTS.” Pursuant to the OriginalIndenture and the Twelfth Supplemental Indenture, the Series M Notes will be assigned to the Trustee forthe benefit of the Owners of the Series M Bonds. The required payment by all Series M Districts of theaggregate principal of and interest due on all of the Series M Notes when due is structured to be sufficientto pay all principal of and interest on the Series M Bonds when due. Except as otherwise required by theIndenture, amounts received by the Trustee from the repayment of principal of and interest on theSeries M Notes will be applied to repay all of the principal of and interest on the Series M Bonds. See“SECURITY AND SOURCE OF PAYMENT FOR THE BONDS—The Bonds” herein.
Series N Bonds
The Authority is issuing the Series N Bonds pursuant to the Original Indenture, as supplementedby a Thirteenth Supplemental Indenture dated as of March 1, 2014 (the “Thirteenth SupplementalIndenture”), by and between the Authority and the Trustee. The net proceeds of the Series N Bonds willbe used to purchase a certain note (the “Series N Note”) issued by a certain school district (the “Series NDistrict”) as described herein under the caption “PARTICIPATING DISTRICTS.” Pursuant to theOriginal Indenture and the Thirteenth Supplemental Indenture, the Series N Note will be assigned to theTrustee for the benefit of the Owners of the Series N Bonds. The required payment by the Series NDistrict of the aggregate principal of and interest due on its Series N Note when due is structured to besufficient to pay all principal of and interest on the Series N Bonds when due. Except as otherwiserequired by the Indenture, amounts received by the Trustee from the repayment of principal of andinterest on the Series N Note will be applied to repay all of the principal of and interest on the Series NBonds. See “SECURITY AND SOURCE OF PAYMENT FOR THE BONDS—The Bonds” herein.
Series O Bonds
The Authority is issuing the Series O Bonds pursuant to the Original Indenture, as supplementedby a Fourteenth Supplemental Indenture dated as of March 1, 2014 (the “Fourteenth SupplementalIndenture”), by and between the Authority and the Trustee. The net proceeds of the Series O Bonds willbe used to purchase a certain note (the “Series O Note”) issued by a certain school district (the “Series ODistrict”) as described herein under the caption “PARTICIPATING DISTRICTS.” Pursuant to theOriginal Indenture and the Fourteenth Supplemental Indenture, the Series O Note will be assigned to theTrustee for the benefit of the Owners of the Series O Bonds. The required payment by the Series ODistrict of the aggregate principal of and interest due on its Series O Note when due is structured to besufficient to pay all principal of and interest on the Series O Bonds when due. Except as otherwiserequired by the Indenture, amounts received by the Trustee from the repayment of principal of andinterest on the Series O Note will be applied to repay all of the principal of and interest on the Series OBonds. See “SECURITY AND SOURCE OF PAYMENT FOR THE BONDS—The Bonds” herein.
Series P Bonds
The Authority is issuing the Series P Bonds pursuant to the Original Indenture, as supplementedby a Fifteenth Supplemental Indenture dated as of March 1, 2014 (the “Fifteenth SupplementalIndenture”) by and between the Authority and the Trustee. The net proceeds of the Series P Bonds willbe used to purchase a certain note (the “Series P Note” and, together with the Series J Notes, the Series KNotes, the Series L Notes, the Series M Notes, the Series N Note and the Series O Note, the “Notes”)issued by a certain school district (the “Series P District,” and together with the Series J Districts, theSeries K Districts, the Series L Districts, the Series M Districts, the Series N District and the Series ODistrict, the “Districts”) as described herein under the caption “PARTICIPATING DISTRICTS.”Pursuant to the Original Indenture and the Fifteenth Supplemental Indenture, the Series P Note will be

4
assigned to the Trustee for the benefit of the Owners of the Series P Bonds. The required payment by theSeries P District of the aggregate principal of and interest due on the Series P Note when due is structuredto be sufficient to pay all principal of and interest on the Series P Bonds when due. Except as otherwiserequired by the Indenture, amounts received by the Trustee from the repayment of principal of andinterest on the Series P Note will be applied to repay all of the principal of and interest on the Series PBonds. See “SECURITY AND SOURCE OF PAYMENT FOR THE BONDS—The Bonds” herein.
Participating Districts
For a list of the names of the Districts and the principal amount of the Note expected to be issuedby each District, see “PARTICIPATING DISTRICTS” herein. See “APPENDIX C—CERTAINBACKGROUND INFORMATION AND PROJECTED CASH FLOWS FOR DISTRICTS” and“APPENDIX D—COVERAGE ANALYSIS” for a summary of certain information respecting eachDistrict.
The Notes
Each Note of each District is issued under the authority of Article 7.6, Chapter 4, Part 1,Division 2, Title 5 (commencing with Section 53850) of the California Government Code (the “Act”) andpursuant to a resolution of issuance, as may be supplemented in certain cases, adopted by the governingboard of each such District and, in certain situations in which such District has not established fiscalaccountability status, at the election of the Board of Supervisors of the county in which such District islocated, a resolution of issuance adopted by such Board of Supervisors (collectively, as may be amended,the “Resolution”). If the Board of Supervisors of the county in which such District is located elects not toadopt a resolution of issuance, the Note of such District will be issued pursuant to the resolution ofissuance originally adopted by the District. The issuance of the Note of each District is expected toprovide moneys to anticipate taxes, income, revenue, cash receipts and other moneys provided for thefiscal year which began on July 1, 2013 and will end on June 30, 2014 (the “Fiscal Year 2013-2014”)which will be received by or accrue to each District for its general fund during such Fiscal Year 2013-2014.
In general, the Districts are issuing the Notes in anticipation of a projected cash flow deficitoccurring during the remainder of Fiscal Year 2013-2014 caused primarily by the State's deferral ofcertain State aid payments to the Districts to the fiscal year which will begin on July 1, 2014 and end onJune 30, 2015 (the “Fiscal Year 2014-2015”) which would otherwise have been received in Fiscal Year2013-2014. Each District treats such deferred State aid payments as accrued in Fiscal Year 2013-2014 forbudgetary, financial reporting and all other relevant purposes, even though such payments are notreceived until the following fiscal year (the “Deferred Revenues”). For purposes of the Notes, DeferredRevenues do not include any Categorical Funds (as defined herein) attributable to Fiscal Year 2013-2014,the payment of a portion of which may also be deferred by the State to Fiscal Year 2014-2015. See“SECURITY AND SOURCE OF PAYMENT FOR THE BONDS—Deferred Revenues” and “—NoteRepayment Period.”
Security for the Notes
In accordance with California law, the Note of each District is payable from the taxes, income,revenue (including, but not limited to, revenue from the State and federal governments), cash receipts andother moneys provided for Fiscal Year 2013-2014 which will be received by or will accrue to the Districtduring such fiscal year for its general fund and which are lawfully available for the payment of currentexpenses and other obligations of the District (the “Unrestricted Revenues”). As security for the paymentof the principal of and interest on its Note, each District has pledged the first Unrestricted Revenues to be

5
received by such District in the repayment period (the “Repayment Period”) and amounts specified herein(the “Pledged Revenues”). Although under certain limited circumstances, Pledged Revenues mayencompass Categorical Funds attributable to Fiscal Year 2013-2014. Bond purchasers should onlyconsider the Pledged Revenues to be comprised of the Deferred Revenues. See “SECURITY ANDSOURCE OF PAYMENT FOR THE BONDS—Deferred Revenues” herein. As provided in Section53856 of the California Government Code, except as otherwise described in the Resolution of suchDistrict, the Note of each District and the interest thereon, will be a first lien and charge against, and willbe payable from the first moneys received by the District from, the Pledged Revenues of such District.To the extent not so paid, each Note shall be paid from any other moneys of such District lawfullyavailable therefor. Notwithstanding the foregoing, for those Districts identified herein who havepreviously issued tax and revenue anticipation notes for Fiscal Year 2013-2014 (collectively, the “PriorNotes”) which have not matured, such pledge and lien by each such District shall be subordinate to thepledge and lien of such Pledged Revenues created for the repayment of its Prior Notes as describedherein. See “SECURITY AND SOURCE OF PAYMENT FOR THE BONDS—Prior Notes” herein.Each Resolution requires the applicable District to transfer to the Trustee certain amounts to be depositedin a special fund from the first Unrestricted Revenues received by such District during the RepaymentPeriod described herein so that the amount on deposit in such fund by the end of such Repayment Period,taking into consideration anticipated investment earnings thereon, is equal to all of the principal andinterest due on such Note at maturity, as more fully described herein. See “SECURITY AND SOURCEOF PAYMENT FOR THE BONDS—Note Repayment Period.” Because such deposits are required to bemade after the end of Fiscal Year 2013-2014, the payments to the Districts being deferred by the Statefrom Fiscal Year 2013-2014 to Fiscal Year 2014-2015 will be the source of such deposits for suchRepayment Period. See “SECURITY AND SOURCE OF PAYMENT FOR THE BONDS—DeferredRevenues” herein.
Investment of Note Proceeds and Repayments
It is anticipated that all of the Districts will invest their respective Note proceeds and repaymentsin their respective county investment pools. See “INVESTMENT OF DISTRICT FUNDS—CountyInvestment Pools” herein. The Districts may also invest their Note proceeds and repayments in otherPermitted Investments. See “APPENDIX A—SUMMARY OF LEGAL DOCUMENTS—DEFINITIONS OF CERTAIN TERMS” herein for the definition of “Permitted Investments.” Althoughthe Districts are obligated to pay principal of and interest on their Notes, on their respective maturity datesas described herein under “SECURITY AND SOURCE OF PAYMENT FOR THE BONDS,” if there is apayment default in connection with any of the applicable investments, there may not be sufficient funds inthe Payment Accounts attributable to the Notes in the Bond Payment Fund on the maturity date to pay allof the principal of and interest on the corresponding series of Bonds.
Sizing of Notes
As part of the sizing of each District’s Note, each District is required to project the amount andtiming of anticipated cash flow deficits, and most Districts are allowed to size their Notes for the amountof a reasonable working capital reserve permitted under federal tax law. A District’s anticipated deficitsare only projections based upon such District’s expectations as of the date of issuance of its Note. ADistrict may experience actual revenues, expenditures or deficits that differ from the projections. It islikely that some Districts may not actually experience a projected cash flow deficit and, thus, may notspend any of their Note proceeds. Other Districts that do experience some level of deficits may need tospend only a portion of their Note proceeds to meet the actual deficit or may not need to spend all of theportion of their Note proceeds attributable to the sizing of a reasonably required working capital reserve.In addition, some Districts may not spend any of their Note proceeds even if they experience a deficit,because such Districts may use an alternative method of funding such deficit, especially if such deficit is

6
for a short period of time, or such Districts may adopt an accounting allocation method permitted underfederal tax law that does not require an actual expenditure of its Note proceeds. See “APPENDIX C—CERTAIN BACKGROUND INFORMATION AND PROJECTED CASH FLOWS FOR DISTRICTS”herein for the projected cash flows prepared by each District. The estimates of amounts and timing ofreceipts and disbursements in the projected cash flow tables in Appendix C are based on certainassumptions and should not be construed as statements of fact. The assumptions are based on currentlyavailable information and may be affected by numerous factors and there can be no assurance that suchestimates will actually be achieved.
Limited Obligations
THE BONDS ARE SPECIAL OBLIGATIONS OF THE AUTHORITY PAYABLE SOLELYFROM CERTAIN FUNDS PLEDGED UNDER THE INDENTURE, SUBJECT TO THE PROVISIONSOF THE INDENTURE PERMITTING THE DISBURSEMENT THEREOF FOR OR TO THEPURPOSES AND ON THE CONDITIONS AND TERMS SET FORTH THEREIN. EXCEPT ASOTHERWISE REQUIRED BY THE INDENTURE, AMOUNTS RECEIVED BY THE TRUSTEEFROM THE REPAYMENT OF ONE POOL OF NOTES WILL BE APPLIED SOLELY TO REPAYTHE RELATED SERIES OF BONDS, AND NOT TO THE REPAYMENT OF ANY UNRELATEDSERIES OF BONDS OF THE AUTHORITY. NO DISTRICT HAS ANY OBLIGATION TO PAY THEPRINCIPAL OF OR INTEREST ON THE NOTE OF ANY OTHER DISTRICT. THE OBLIGATIONOF EACH DISTRICT IS A SEVERAL AND NOT A JOINT OBLIGATION AND IS STRICTLYLIMITED TO SUCH DISTRICT’S REPAYMENT OBLIGATION UNDER ITS RESOLUTION ANDNOTE. SEE “SECURITY AND SOURCE OF PAYMENT FOR THE BONDS” HEREIN.
Prior Notes
Prior Senior Notes. Some of the Districts have previously issued Prior Notes under the Program(the “Prior Senior Notes”) which will mature prior to the maturity date for the Notes, and which are seniorto the Notes being issued by such Districts. None of the Districts issued such Prior Senior Notes afterJuly 15, 2013. Such Districts are required to deposit with the Trustee amounts sufficient to repay suchPrior Senior Notes prior to the time that such Districts are required to deposit amounts sufficient to repaytheir Notes. The Note of each such District is a “Subordinate Note” for purposes of the Resolutionpursuant to which such Note is being issued. See “PARTICIPATING DISTRICTS” herein for theoutstanding principal amount of such Prior Senior Note issued by each such District and the maturity dateapplicable to such Prior Senior Note.
Prior Other Senior Notes. King City Union School District (“King City Union”), one of theSeries M Districts, has previously issued a series of Prior Notes during Fiscal Year 2013-2014 separatefrom the Program (the “Prior Other Senior Notes” and together with the Prior Senior Notes, the “PriorNotes”). Such Prior Other Senior Notes are senior to the Note being issued by such District, and suchDistrict is required to repay its Prior Other Senior Notes prior to the time that such District is required todeposit with the Trustee amounts sufficient to repay its Note. See “PARTICIPATING DISTRICTS”herein for the outstanding principal amount of such Prior Other Senior Notes issued by such District andthe maturity date applicable to such Prior Other Senior Notes.
Prior Bonds
During the month of July of 2013, the Authority issued its Series A Bonds, Series B Bonds,Series C Bonds, Series D Bonds, Series E Bonds, Series F Bonds, Series G Bonds, Series H Bonds andSeries I Bonds. Each series is defined herein under “THE AUTHORITY” and are collectively referred toas the “Prior Bonds”. The proceeds of the Prior Bonds were applied to purchase the Prior Senior Notes

7
and tax and revenue anticipation notes of certain other school districts, county boards of education andcommunity college districts. Except as provided in the Indenture with respect to the reallocation ofamounts held by the Trustee for a District’s Note to such District’s Prior Senior Note if amounts areinsufficient to pay such Prior Senior Note, the Prior Bonds will not be payable from the payments madeby the Districts with respect to their Notes.
Additional Bonds
Upon satisfaction of certain provisions of the Indenture, the Authority may issue one or moreadditional series of bonds (the “Additional Bonds”) pursuant to a supplemental indenture or a separateindenture. The Additional Bonds, if any, will be payable from and secured by a pledge and assignment ofa separate pool of tax and revenue anticipation notes issued by certain other school districts or communitycollege districts. The Additional Bonds will not be secured by nor payable from the payments made bythe Districts with respect to their Notes. It is not expected that the Authority will issue a series ofAdditional Bonds simultaneously with the issuance of the Bonds, the proceeds of which would be appliedto purchase a separate pool of tax and revenue anticipation notes issued under the Program. See“SECURITY AND SOURCE OF PAYMENT FOR THE BONDS—Additional Bonds” and “THEAUTHORITY.”
Additional Notes for Fiscal Year 2013-2014
The Districts have covenanted to not issue any additional tax and revenue anticipation notesduring Fiscal Year 2013-2014 on parity with or senior to the Notes. Each District may issue one or moreadditional series of tax and revenue anticipation notes during Fiscal Year 2013-2014 pursuant to theProgram which are payable on a subordinate basis to its Note. ANY ADDITIONAL NOTES WILL BESUBORDINATE NOTES THAT WILL NOT MATURE PRIOR TO THESE NOTES. It cannot bedetermined at this time whether or how many of the Districts will issue Additional Notes or what the sizeof the Additional Notes may be.
Professionals Involved in the Offering
Orrick, Herrington & Sutcliffe LLP, San Francisco, California, is acting as Bond Counsel to theAuthority with respect to the Bonds. Orrick, Herrington & Sutcliffe LLP, will receive compensation fromthe Authority contingent upon the sale and delivery of the Bonds. Certain matters will be passed on forthe Underwriter (defined herein) by Kutak Rock LLP, Denver Colorado, as Underwriter's Counsel. KutakRock LLP will also issue its special opinion with respect to the issuance of the Notes by the Districts.Dale Scott & Company, San Francisco, California, is acting as Financial Advisor to the Authority withrespect to the Bonds. Kutak Rock LLP and Dale Scott & Company will receive compensation contingentupon the sale and delivery of the Bonds.
Additional Information
All capitalized words, unless otherwise defined herein, shall have the meanings set forth in“SUMMARY OF LEGAL DOCUMENTS—DEFINITIONS OF CERTAIN TERMS” in Appendix Ahereto.
Brief descriptions or summaries of the Authority, the Districts, the Notes, the Prior Notes, theBonds, the Indenture, the standard form of the Resolution and other documents, agreements and statutesare included in this Official Statement. The summaries or references herein to the Indenture, the Notes,the Prior Notes, the standard form of the Resolution and other documents, agreements and statutesreferred to herein and the description of the Bonds included herein, do not purport to be comprehensive or

8
definitive, and such summaries, references and descriptions are qualified in their entireties by reference tosuch documents, and the description herein of the Bonds is qualified in its entirety by reference to theform thereof and the information with respect thereto included in the aforesaid documents. Copies ofsuch documents are available upon request during the initial offering period from Piper Jaffray & Co.,2321 Rosecrans Avenue, Suite 3200, El Segundo, California 90245, Attention: Public Finance, andthereafter from U.S. Bank National Association, 633 West Fifth Street, 24th Floor, Los Angeles,California 90071, Attention: Corporate Trust Department (the “Principal Office”).
DESCRIPTION OF THE BONDS
Authority for Issuance
The Authority was formed pursuant to a Joint Exercise of Powers Agreement entered intopursuant to the provisions of Article 1, Chapter 5, Division 7, Title 1 of the California Government Code.See “THE AUTHORITY” herein. The Bonds are being issued by the Authority pursuant to theprovisions of Article 4, Chapter 5, Division 7, Title 1 of the California Government Code and theIndenture.
Denominations;Payments of Principal and Interest
The Bonds shall be prepared in the form of fully registered bonds and, when issued, will beregistered in the name of Cede & Co., as registered owner of the Bonds and nominee of The DepositoryTrust Company, New York, New York (“DTC”). DTC will act as securities depository for the Bonds.Individual purchases may be made in book-entry form only in denominations of $5,000 or any integralmultiple thereof. Purchasers will not receive certificates representing their interest in the Bondspurchased. So long as Cede & Co. is the registered owner of the Bonds, as nominee of DTC, referencesherein to the Owners of the Bonds or registered owners shall mean Cede & Co. and shall not mean theBeneficial Owners (as defined herein) of the Bonds.
The Bonds will be dated the date of initial delivery and execution thereof and bear interest fromthe date of their initial issuance, with interest payable at maturity. The Series J Bonds shall mature onOctober 1, 2014, and bear interest at the rate of 2.000% per annum. The Series K Bonds shall mature onOctober 1, 2014, and bear interest at the rate of 2.000% per annum. The Series L Bonds shall mature onOctober 1, 2014, and bear interest at the rate of 2.000% per annum. The Series M Bonds shall mature onDecember 31, 2014, and bear interest at the rate of 2.000% per annum. The Series N Bonds shall matureon December 31, 2014, and bear interest at the rate of 2.000% per annum. The Series O Bonds shallmature on December 31, 2014, and bear interest at the rate of 2.000% per annum. The Series P Bondsshall mature on September 2, 2014, and bear interest at the rate of 2.000% per annum. So long as Cede &Co. is the registered owner of the Bonds, the principal of and interest on the Bonds will be payable whendue by wire transfer by the Trustee, as paying agent, to Cede & Co., as nominee for DTC, which isexpected, in turn, to remit such amounts to the DTC Participants (as defined herein) for subsequentdisbursement to the Beneficial Owners. See “—Book-Entry-Only System” below. Interest payable onthe Bonds will be calculated on the basis of a 360-day year consisting of twelve 30-day months.
Registration of Bonds
The Trustee is required to maintain registration books at its Principal Office for the registration ofownership, transfer and exchange of Bonds. The Trustee may deem and treat the registered owner of anyBond as the absolute owner thereof for all purposes.

9
No Redemption Prior to Maturity
Neither the Bonds nor the Notes are subject to redemption prior to maturity.
Book-Entry-Only System
The following information concerning DTC and DTC’s book-entry system is based solely oninformation provided by DTC. Accordingly, no representations can be made concerning these matters,and neither the DTC Direct Participants and Indirect Participants (each as defined below and collectively,the “DTC Participants”) nor the Beneficial Owners should rely on the foregoing information with respectto such matters, but should instead confirm the same with DTC or the DTC Participants, as the case maybe. The current “Rules” applicable to DTC are on file with the U.S. Securities and ExchangeCommission and the current “Procedures” of DTC to be followed in dealing with DTC Participants are onfile with DTC.
DTC will act as securities depository for the Bonds. The Bonds will be issued as fully-registeredsecurities registered in the name of Cede & Co. (DTC’s partnership nominee) or such other name as maybe requested by an authorized representative of DTC. One fully registered Bond certificate will be issuedfor each series of the Bonds in the aggregate principal amount of such series of Bonds and will bedeposited with DTC.
DTC, the world’s largest securities depository, is a limited-purpose trust company organizedunder the New York Banking Law, a “banking organization” within the meaning of the New YorkBanking Law, a member of the Federal Reserve System, a “clearing corporation” within the meaning ofthe New York Uniform Commercial Code and a “clearing agency” registered pursuant to the provisionsof Section 17A of the Securities Exchange Act of 1934. DTC holds and provides asset servicing for over3.5 million issues of U.S. and non-U.S. equity issues, corporate and municipal debt issues, and moneymarket instruments (from over 100 countries) that DTC’s participants (“Direct Participants”) deposit withDTC. DTC also facilitates the post-trade settlement among Direct Participants of sales and othersecurities transactions in deposited securities, through electronic computerized book-entry transfers andpledges between Direct Participants’ accounts. This eliminates the need for physical movement ofsecurities certificates. Direct Participants include both U.S. and non-U.S. securities brokers and dealers,banks, trust companies, clearing corporations and certain other organizations. DTC is a wholly-ownedsubsidiary of The Depository Trust & Clearing Corporation (“DTCC”). DTCC is the holding companyfor DTC, National Securities Clearing Corporation and Fixed Income Clearing Corporation, all of whichare registered clearing agencies. DTCC is owned by the users of its regulated subsidiaries. Access to theDTC system is also available to others such as both U.S. and non-U.S. securities brokers and dealers,banks, trust companies and clearing corporations that clear through or maintain a custodial relationshipwith a Direct Participant, either directly or indirectly (the “Indirect Participants”). DTC has a Standard &Poor’s credit rating of AA+. The DTC Rules applicable to its Participants are on file with the Securitiesand Exchange Commission. More information about DTC can be found at www.dtcc.com andwww.dtc.org.
Purchases of Bonds under the DTC system must be made by or through Direct Participants,which will receive a credit for the Bonds on DTC’s records. The ownership interest of each actualpurchaser of each Bond (“Beneficial Owner”) is in turn to be recorded on the Direct and IndirectParticipants’ records. Beneficial Owners will not receive written confirmation from DTC of theirpurchase. Beneficial Owners, however, are expected to receive written confirmations providing details ofthe transaction, as well as periodic statements of their holdings, from the Direct or Indirect Participantthrough which the Beneficial Owner entered into the transaction. Transfers of ownership interests in theBonds are to be accomplished by entries made on the books of Direct and Indirect Participants acting on

10
behalf of Beneficial Owners. Beneficial Owners will not receive bonds representing their ownershipinterests in the Bonds, except in the event that use of the book-entry system for the Bonds is discontinued.
To facilitate subsequent transfers, all Bonds deposited by Direct Participants with DTC areregistered in the name of DTC’s partnership nominee, Cede & Co. or such other name as may berequested by an authorized representative of DTC. The deposit of Bonds with DTC and their registrationin the name of Cede & Co. or such other DTC nominee do not effect any change in beneficial ownership.DTC has no knowledge of the actual Beneficial Owners of the Bonds; DTC’s records reflect only theidentity of the Direct Participants to whose accounts such Bonds are credited, which may or may not bethe Beneficial Owners. The Direct and Indirect Participants will remain responsible for keeping accountof their holdings on behalf of their customers.
Conveyance of notices and other communications by DTC to Direct Participants, by DirectParticipants to Indirect Participants, and by Direct Participants and Indirect Participants to BeneficialOwners will be governed by arrangements among them, subject to any statutory or regulatoryrequirements as may be in effect from time to time. Beneficial Owners of the Bonds may wish to takecertain steps to augment the transmission to them of notices of significant events with respect to theBonds, such as redemptions, tenders, defaults, and proposed amendments to the Bond and Notedocuments. For example, Beneficial Owners of the Bonds may wish to ascertain that the nomineeholding the Bonds for their benefit has agreed to obtain and transmit notices to Beneficial Owners. In thealternative, Beneficial Owners may wish to provide their names and addresses to the registrar and requestthat copies of notices be provided directly to them.
Neither DTC nor Cede & Co. (nor any other DTC nominee) will consent or vote with respect tothe Bonds unless authorized by a Direct Participant in accordance with DTC’s MMI Procedures. Underits usual procedures, DTC mails an Omnibus Proxy to the Trustee as soon as possible after the recorddate. The Omnibus Proxy assigns Cede & Co.’s consenting or voting rights to those Direct Participants towhose accounts the Bonds are credited on the record date (identified in a listing attached to the OmnibusProxy).
Principal of and interest payments on the Bonds will be made to Cede & Co., or such othernominee as may be requested by an authorized representative of DTC. DTC’s practice is to credit DirectParticipants’ accounts upon DTC’s receipt of funds and corresponding detail information from theTrustee on the payable date in accordance with their respective holdings shown on DTC’s records.Payments by Participants to Beneficial Owners will be governed by standing instructions and customarypractices, as is the case with securities held for the accounts of customers in bearer form or registered in“street name,” and will be the responsibility of such Participant and not of DTC, the Trustee or theDistricts, subject to any statutory or regulatory requirements as may be in effect from time to time.Payment of principal and interest to Cede & Co. (or such other nominee as may be requested by anauthorized representative of DTC) is the responsibility of the Authority or Trustee, disbursement of suchpayments to Direct Participants shall be the responsibility of DTC, and disbursement of such payments tothe Beneficial Owners shall be the responsibility of Direct and Indirect Participants.
NEITHER THE AUTHORITY NOR THE TRUSTEE WILL HAVE ANY RESPONSIBILITYOR OBLIGATION TO DTC PARTICIPANTS, INDIRECT PARTICIPANTS OR BENEFICIALOWNERS WITH RESPECT TO THE PAYMENTS OR THE PROVIDING OF NOTICE TO DTCPARTICIPANTS, INDIRECT PARTICIPANTS OR BENEFICIAL OWNERS.
DTC may discontinue providing its services as depository with respect to the Bonds at any timeby giving reasonable notice to the Authority or the Trustee. Under such circumstances, in the event that asuccessor depository is not obtained, the Bonds are required to be printed and delivered.

11
The Authority may decide to discontinue use of the system of book-entry-only transfers throughDTC (or a successor securities depository). In that event, Bonds will be printed and delivered asdescribed in the Indenture.
The information in this section concerning DTC and DTC’s book-entry system has been obtainedfrom sources that the Authority believes to be reliable, but the Authority takes no responsibility for theaccuracy thereof.
THE AUTHORITY CANNOT AND DOES NOT GIVE ANY ASSURANCES THAT DTC,DIRECT PARTICIPANTS OR INDIRECT PARTICIPANTS WILL DISTRIBUTE TO THEBENEFICIAL OWNERS OR INDIRECT PARTICIPANTS, PAYMENTS ON THE BONDS PAID TODTC OR ITS NOMINEE AS THE REGISTERED OWNER, OR ANY NOTICES SENT TO DTC ORITS NOMINEE, OR THAT THEY WILL DO SO ON A TIMELY BASIS, OR THAT DTC WILLSERVE AND ACT IN THE MANNER DESCRIBED IN THIS OFFICIAL STATEMENT. THEAUTHORITY IS NOT RESPONSIBLE OR LIABLE FOR THE FAILURE OF DTC OR ANYPARTICIPANT TO MAKE ANY PAYMENTS OR GIVE ANY NOTICE TO A BENEFICIAL OWNERWITH RESPECT TO THE BONDS OR ANY ERROR OR DELAY RELATING THERETO.
SECURITY AND SOURCE OF PAYMENT FOR THE BONDS
The Bonds
Subject to the provisions of the Indenture permitting the application thereof for or to the purposesand on the terms and conditions set forth therein, all right, title and interest of the Authority in each poolof the Notes assigned to a series of Bonds and all payments made on all of the Notes of such pool areirrevocably assigned and pledged and transferred to the Trustee for the benefit of the respective Ownersof the corresponding series of the Bonds and, as applicable, subject to the payment priority provisionsdescribed below under “—The Notes,” the payments on each series of the Notes shall be used for thepunctual payment of principal of and interest on such series of Bonds. The aggregate principal of andinterest due on each pool of Notes when due, is structured to be sufficient to pay all principal of andinterest on the corresponding series of Bonds when due.
Additional Bonds
Pursuant to the Indenture, the Authority may at any time issue one or more series of AdditionalBonds pursuant to a supplemental indenture, secured by and payable from one or more additional pools ofadditional notes issued by other school districts, county offices of education and community collegedistricts which are separate and distinct from each pool of Notes securing each corresponding series ofBonds described herein. As described herein under “THE AUTHORITY”, the Authority does notcurrently intend to issue a separate series of Additional Bonds simultaneously with the issuance of theBonds.
Prior Bonds
As further described and defined under “THE AUTHORITY” herein, the Authority haspreviously issued its (i) Series A Bonds, Series C Bonds, Series D Bonds and Series E Bonds which willmature on April 1, 2014; (ii) Series F Bonds and Series G Bonds which will mature on May 1, 2014; and(iii) Series B Bonds, Series H Bonds and Series I Bonds which will mature on June 2, 2014, all of whichare secured by other tax and revenue anticipation notes (including the Prior Senior Notes).

12
Additional Notes for Fiscal Year 2013-2014
The Districts have covenanted to not issue any additional tax and revenue anticipation notesduring Fiscal Year 2013-2014 on parity with or senior to the Notes. Each District may issue one or moreadditional series of tax and revenue anticipation notes during Fiscal Year 2013-2014 pursuant to theProgram which are payable on a subordinate basis to its Note. ANY ADDITIONAL NOTES WILL BESUBORDINATE NOTES THAT WILL NOT MATURE PRIOR TO THESE NOTES. It cannot bedetermined at this time whether or how many of the Districts will issue Additional Notes or what the sizeof the Additional Notes may be.
The Notes
Each Note of each District is issued under the authority of the Act and pursuant to such District’sResolution. The issuance of each Note is expected to provide moneys to anticipate taxes, income,revenue, cash receipts and other moneys provided for Fiscal Year 2013-2014 which will be received by oraccrued to each District for its general fund during such Fiscal Year 2013-2014. Pursuant to the OriginalIndenture and each applicable Supplemental Indenture, each Note of each District will be purchased withproceeds of the respective series of Bonds and irrevocably deposited with and pledged and transferred tothe Trustee for the benefit of the Owners of such series of Bonds. For a list of the names of the Districts,the Notes issued by each of the Districts, and the principal amount of the Notes being issued by each ofthe Districts, see “PARTICIPATING DISTRICTS” herein.
The principal amount of each Note and, if applicable, Prior Note, of a District, together with theinterest thereon, shall be payable from the Unrestricted Revenue of such District. As security for thepayment of the principal of and interest on its Note and, if applicable, its Prior Note, subject to the firstlien and charge against prior Pledged Revenues securing Prior Notes issued separately from the Program,if applicable, and the payment priority provisions of the District’s Resolution, each District has pledgedthe Pledged Revenues by such District in the Repayment Period, with respect to the Notes, and otherrepayment periods with respect to its Prior Note, if applicable (the Repayment Period, together with therepayment periods applicable to a District’s Prior Note, are collectively referred to herein as the“Repayment Periods”). As provided in Section 53856 of the California Government Code, the Note and,if applicable, the Prior Note of each District and the interest thereon, will be a first lien and chargeagainst, and will be payable from the first moneys received by the District from, the Pledged Revenues ofsuch District, subject to the first lien and charge against prior Pledged Revenues securing Prior Notesissued separately from the Program, if applicable, and the payment priority provisions of such District’sResolution as described below.
In order to effect this pledge, each District agrees under its Resolution to the establishment andmaintenance of a Payment Account related to its Note and, if applicable, a separate Payment Accountrelated to its Prior Senior Note, each by the Trustee under the Indenture, as the responsible agent tomaintain such fund until the payment of the principal of and interest on such District’s Note and, ifapplicable, its Prior Senior Note. Each District agrees under its Resolution to cause to be deposited (andshall request specific amounts from the District’s funds on deposit with the District’s county treasurer forsuch purpose) directly therein the first Unrestricted Revenues received in the Repayment Periods asdescribed under the caption “SECURITY AND SOURCE OF PAYMENT FOR THE BONDS—NoteRepayment Period” herein with respect to such District’s Note and, if applicable, under the caption“SECURITY AND SOURCE OF PAYMENT FOR THE BONDS—Prior Notes” with respect to suchDistrict’s Prior Senior Note and any Unrestricted Revenues received thereafter until the amount ondeposit in the Payment Account related to its Note and, if applicable, in the Payment Account related toits Prior Senior Note, respectively, taking into consideration anticipated investment earnings thereon to bereceived by the maturity of such Note and, if applicable, such Prior Senior Note, respectively, is equal in

13
the respective Repayment Periods applicable to such District to the percentage of the principal andinterest due on such Note and, if applicable, such Prior Senior Note, respectively, at maturity applicable tosuch District’s Note and, if applicable, Prior Senior Note as described under the caption “SECURITYAND SOURCE OF PAYMENT FOR THE BONDS—Note Repayment Period” and under the caption“SECURITY AND SOURCE OF PAYMENT FOR THE BONDS—Prior Notes” herein.
Because the deposits to the Payment Accounts relating to the Notes are required to be made afterthe end of Fiscal Year 2013-2014, the payments to the Districts being deferred by the State from FiscalYear 2013-2014 to Fiscal Year 2014-2015 will be the source of such deposits for such Repayment Period.See “SECURITY AND SOURCE OF PAYMENT FOR THE BONDS—Deferred Revenues.”
In the event that on the third Business Day following the receipt by the District of DeferredRevenues in the Repayment Period, a District has not received sufficient Unrestricted Revenues to permitthe deposit into its Payment Account attributable to its Note and, if applicable, its Payment Accountattributable to its Prior Senior Note, of the full amount of Pledged Revenues to be deposited in suchPayment Account from its Unrestricted Revenues in such Repayment Period, then the amount of anydeficiency shall be satisfied and made up from any other moneys of such District lawfully available forthe payment of the principal of its Note, and the interest thereon, as and when such other moneys arereceived or are otherwise legally available, in the following order of priority: first, if applicable, to thePayment Account attributable to its Prior Senior Note; and second, to the Payment Account attributable toits Note.
Subject to the payment priority provisions of each Resolution with respect to a District who hasissued a Prior Senior Note, any moneys placed in the Payment Account of (i) a Series J Districtattributable to its Series J Note shall be for the benefit of the Owners of the Series J Bonds; (ii) a Series KDistrict attributable to its Series K Note shall be for the benefit of the Owners of the Series K Bonds; (iii)a Series L District attributable to its Series L Note shall be for the benefit of the Owners of the Series LBonds; (iv) a Series M District attributable to its Series M Note shall be for the benefit of the Owners ofthe Series M Bonds; (v) the Series N District attributable to its Series N Note shall be for the benefit ofthe Owners of the Series N Bonds; (vi) the Series O District attributable to its Series O Note shall be forthe benefit of the Owners of the Series O Bonds; and (vii) the Series P District attributable to its Series PNote shall be for the benefit of the Owners of the Series P Bonds. Subject to the payment priorityprovisions of each Resolution, if applicable, the moneys in such Payment Account shall be applied onlyfor the purposes for which such Payment Account is created until the principal of such Note and allinterest thereon are paid or until provision has been made for the payment of the principal of the Note atmaturity with interest to maturity.
On the maturity date of each Note, the moneys in the Payment Account of each Districtattributable to its Note shall be transferred by the Trustee to pay the principal of and interest on each suchDistrict’s Note when due. In the event that moneys in a District’s Payment Account attributable to itsNote or, if applicable, in such District’s Payment Account attributable to its Prior Senior Note, areinsufficient to pay the principal of and interest on its Note or, if applicable, its Prior Senior Note,respectively, in full when due, moneys in such Payment Account, together with moneys in the PaymentAccount of its Prior Senior Note, if applicable, shall be applied in the following order of priority: first, topay interest on such District’s Prior Senior Note, if applicable; second, to pay principal of such District’sPrior Senior Note, if applicable; and third, with respect to the Note, to make the payments correspondingto the Note equivalent to the payments described above in clauses first through second of this sentence, insuch order.

14
Deferred Revenues
Due to budgetary difficulties, the State has engaged in the practice of deferring certainapportionments to K-12 districts and community college districts (collectively, “K-14 districts”) from onefiscal year to the next fiscal year in order to assist the State in balancing its budget each year. These“cross year” deferrals have been codified, although with the passage of Proposition 30 (as defined herein)and the improvement in the State finances, the Governor of the State has proposed to eliminate suchdeferrals by the end of Fiscal Year 2014-2015. See “APPENDIX B—GENERAL DISTRICTFINANCIAL INFORMATION—State Funding of Education—Governor’s Proposed 2014-2015Budget.” The 2013-2014 State Budget (defined herein) includes a deferral of a substantial amount ofState aid payments owed to the Districts in Fiscal Year 2013-2014 to Fiscal Year 2014-2015. See“APPENDIX B—GENERAL DISTRICT FINANCIAL INFORMATION—State Funding of Education”herein. Although the State, in some cases, treats such Deferred Revenues as expenditures for the fiscalyear in which they are made, the Districts are authorized under State law to treat such deferrals asrevenues in the current fiscal year.
Under the 2013-2014 State Budget, the total inter-year K-12 district deferrals of State fundingtotal approximately $5.6 billion, from April 2014 through June 2014, with such amount to be paid in July2014.
Under the 2013-2014 State Budget, the total inter-year community college district deferrals ofapportionments total approximately $592 million from February 2014 through June 2014, with suchamount to be paid in July 2014.
The Note of each District is payable from the taxes, income, revenue, cash receipts and othermoneys provided for Fiscal Year 2013-2014 which will be received by or accrued to such District duringsuch Fiscal Year 2013-2014 for its general fund and which are legally available for payment thereof.Because each District in fact treats the Deferred Revenues as accrued in Fiscal Year 2013-2014 forbudgetary, financial reporting and all other relevant purposes, such District should be able to treat itsDeferred Revenues as revenues provided for Fiscal Year 2013-2014 and thus subject to the pledge for therepayment of its Note. Bond Counsel is expected to render an opinion addressed to Standard & Poor’sRatings Services, a Standard & Poor’s Financial Services LLC business (“S&P”) and the Trustee to theeffect that, assuming that the applicable District in fact treats the Deferred Revenues as accrued in FiscalYear 2013-2014 for budgetary, financial reporting and all other relevant purposes and that all laws citedin its opinion, the applicable Resolution of the District and Note of the District, are valid and binding,although there is no case on point and the matter is not free from doubt, if the matter were properlybriefed and presented to a court, the court should hold (a) that the Deferred Revenues of a District arerevenues of such District “provided for” Fiscal Year 2013-2014 within the meaning of Article XVI,Section 18 of the California Constitution, and (b) that the pledge of the Pledged Revenues of suchDistrict, insofar as they include such Deferred Revenues, to the repayment of such Note is a valid pledgeunder the California Government Code as revenue “accrued during the fiscal year” in which such Note isissued. Bond Counsel’s opinion speaks as of its date, is based on the assumptions, qualifications, factsand circumstances cited in the opinion, is not binding on any court, does not guarantee the outcome of thematter addressed in the opinion and, accordingly, no assurance can be given that a court could not reach acontrary conclusion and hold that Deferred Revenues cannot be pledged to pay the Bonds.
Each District has projected the timing of receipt of its Pledged Revenues, including the DeferredRevenues, based upon the most recent information available to it from the State. See “APPENDIX C—CERTAIN BACKGROUND INFORMATION AND PROJECTED CASH FLOWS FOR DISTRICTS”for the projected timing of receipt of such Pledged Revenues by each District for the repayment of itsNote. The estimates of amounts and timing of receipts and disbursements in the projected cash flow
15
tables in Appendix C are based on certain assumptions and should not be construed as statements of fact.The assumptions are based on currently available information, and each District will certify that itbelieves that such cash flow projections are reasonable. The assumptions may be affected by numerousfactors such as new legislation adopted by the State legislature (the “Legislature”), and there can be noassurance that such estimates will actually be achieved.
Deposit and Pledge of Notes
Subject to the provisions of the Indenture permitting the application thereof for or to the purposesand on the terms and conditions set forth in such Indenture, (i) all right, title and interest of the Authorityin each pool of the Notes assigned to Bonds of a series and to all payments made on such pool of Notes,are irrevocably assigned and pledged and transferred to the Trustee for the benefit of the respectiveOwners of the corresponding series of Bonds, (ii) the payments on each pool of the Notes assigned toBonds of a series shall be used for the punctual payment of the interest on and principal of its relatedseries of Bonds, and (iii) each pool of the Notes shall not be used for any other purpose (including thepayment of any other series of Bonds or other bonds of the Authority, or reimbursements to any creditenhancer related thereto) so long as any of such corresponding series of Bonds secured by such pool ofNotes remain Outstanding.
Notwithstanding any other provisions of the Indenture, to the extent, on an Interest Payment Dateor Principal Payment Date applicable to the District’s Note or Prior Senior Note, if applicable, there is adeficiency with respect to the Note or Prior Senior Note, if applicable, of such District and to the extentany payment on any Note or Prior Senior Note, if applicable, of such District is being made from moneysother than the proceeds of its Note or Prior Senior Note, if applicable, the Trustee shall apportion all suchpayments received from such District relating to its Note and Prior Senior Note, if applicable, inaccordance with the priority provisions set forth in such District’s Resolution. See “—The Notes” above.
Subject to the immediately preceding paragraph, and to the extent permitted by law, theassignment, transfer and pledge effected by the Indenture shall constitute a lien on and security interest inthe principal and interest payments of and all other rights under the Notes for the foregoing purpose inaccordance with the terms of the Indenture and shall attach, be perfected and be valid and binding fromand after delivery to the Authority of the Notes. Each District has approved, and the Trustee will accept,such assignment of such District’s Note.
The Districts shall pay directly to the Trustee all principal and interest payments on the Notes.All principal and interest payments on the Notes received by the Trustee shall be held in trust by theTrustee under the terms of the Indenture and shall be deposited by the Trustee, as and when received, inthe appropriate Payment Account attributed to each such Note within the Bond Payment Fund establishedunder the Indenture, and all moneys in such Payment Accounts shall be held in trust by the Trustee for thebenefit and security of the Owners of the related series of Bonds to the extent provided in the Indenture.
Moneys in any District’s Payment Account attributed to its Note and, if applicable, in suchDistrict’s Payment Account attributable to its Prior Senior Note shall not be used in any manner (directlyor indirectly) to make up any deficiency in any other District’s Payment Account.
Prior Notes
Certain of the Districts have previously issued their Prior Senior Notes pursuant to the Programwhich will mature on either April 1, 2014, May 1, 2014 or June 2, 2014, each pursuant to its Resolutionwhich is secured by and payable from the Pledged Revenues of each such District prior to the payment ofits respective Note. King City Union also previously issued its Prior Other Senior Notes separate from

16
the Program, which mature on April 1, 2014, and which are secured by and payable from the PledgedRevenues of such District prior to the payment of such District’s Note. See “PARTICIPATINGDISTRICTS”.
For those Districts whose Prior Senior Notes mature on April 1, 2014, all principal of and intereston each such District’s Prior Senior Note issued pursuant to the Program are to be deposited in suchDistrict’s Payment Account attributable to its Prior Senior Note (together with anticipated investmentearnings thereon to be received by the maturity of such District’s Prior Senior Note) on or beforeFebruary 28, 2014. For those Districts whose Prior Senior Notes mature on May 1, 2014 or on June 2,2014, all principal of and interest on each such District’s Prior Senior Notes issued pursuant to theProgram are to be deposited in each such District’s Payment Account attributable to its Prior Senior Note(together with anticipated investment earnings thereon to be received by the maturity of such District’sPrior Senior Note) on or before April 30, 2014.
All principal of and interest on the Prior Other Senior Notes of King City Union is to be set asidein a segregated account for such District by March 31, 2014.
Each District having issued a Prior Note is currently in compliance with the required amount tobe set aside for its Prior Note. See “PARTICIPATING DISTRICTS” herein for the principal amount ofsuch Prior Notes issued by such Districts which are currently outstanding.
Note Repayment Period
The Repayment Period and amounts to be deposited in each District’s Payment Accountattributable to its Note (together with anticipated investment earnings thereon to be received by thematurity of such District’s Note), from the first amounts received in such Repayment Period and anyamounts received thereafter attributable to Fiscal Year 2013-2014 until such amounts are on deposit, aredescribed below.
Repayment Period Applicable Percentage
July 1 through July 31, 2014 100% of principal plus interest due at maturity
Investments
On the date of issuance of the Bonds, all of the Districts are expected to invest the proceeds of thesale of the applicable series of Bonds (net of the Costs of Issuance) and repayments on their Notes (i.e.,amounts held in or withdrawn from the Proceeds Subaccounts attributable to the Notes in the ProceedsFund and to be held in the Payment Accounts attributable to the Notes in the Bond Payment Fund), and, ifapplicable, Prior Senior Notes in the respective county investment pools. See “INVESTMENT OFDISTRICT FUNDS—County Investment Pools” herein. In addition, each District may also invest thefunds attributable to its Note and, if applicable, Prior Senior Note, in other Permitted Investments. See“APPENDIX A—SUMMARY OF LEGAL DOCUMENTS—DEFINITIONS OF CERTAIN TERMS”herein for the definition of “Permitted Investments.” Income derived from the investment of suchamounts will be credited to the fund or account from which such investment was made. Although theDistricts are obligated to pay principal of and interest on their Notes and, if applicable, Prior SeniorNotes, on the maturity date for the Notes and Prior Senior Notes, as applicable, if there is a paymentdefault in connection with any of the applicable investments, there may not be sufficient funds in thePayment Accounts attributable to the Notes and Prior Senior Notes in the Bond Payment Fund on thematurity date to pay all of the principal of and interest on the corresponding series of Bonds.

17
Defaulted Notes
In the event of default by any District in the payment of any of the principal of or interest on itsNote when due, such Note shall be a Defaulted Note and the unpaid portion thereof shall be deemedoutstanding and shall not be deemed paid until all amounts due thereon have been paid in full.
THE AUTHORITY
The California School Cash Reserve Program Authority (the “Authority”) is a joint exercise ofpowers authority duly organized and existing under and pursuant to that certain Joint Exercise of PowersAgreement, as amended, by and among Newhall Elementary School District, Delano Union SchoolDistrict, Sulphur Springs Union School District and Moorpark Unified School District (collectively, the“Members”), originally dated April 15, 1993, and has the power to issue, sell and deliver bonds for anypurpose authorized under Articles 1, 2 and 4 of Chapter 5 of Division 7 of Title 1 of the CaliforniaGovernment Code. Since inception, the Program used either certificates of participation or bonds issuedby the Authority. For a variety of reasons, in recent years the Program has been structured to provide forthe delivery of bonds. On July 15, 2013, the Authority issued the Prior Bonds as set forth in the tablebelow:
California School Cash Reserve Program Authority Prior BondsPrincipalAmount
2013-2014 Senior Bonds, Series A (“Senior Series A Bonds”) $43,860,0002013-2014 Subordinate Bonds, Series A (“Subordinate Series A Bonds,” and together with the Senior
Series A Bonds, the “Series A Bonds”) 7,740,0002013-2014 Senior Bonds, Series B (“Senior Series B Bonds”) 26,795,0002013-2014 Subordinate Bonds, Series B (“Subordinate Series B Bonds,” and together with the Senior
Series B Bonds, the “Series B Bonds”) 5,000,0002013-2014 Bonds, Series C (the “Series C Bonds”) 84,125,0002013-2014 Bonds, Series D (the “Series D Bonds”) 25,545,0002013-2014 Bonds, Series E (the “Series E Bonds”) 4,890,0002013-2014 Bonds, Series F (the “Series F Bonds”) 8,460,0002013-2014 Bonds, Series G (the “Series G Bonds”) 39,050,0002013-2014 Bonds, Series H (the “Series H Bonds”) 53,495,0002013-2014 Bonds, Series I (the “Series I Bonds”) 28,265,000
The proceeds of the Prior Bonds were applied to purchase the Prior Senior Notes and tax andrevenue anticipation notes issued by certain other school districts, county offices of education andcommunity college districts participating in the Program. The Bonds do not constitute a lien or chargeupon any funds or property of the Authority, except to the extent of the pledge of funds as set forth in theIndenture. The Bonds are not a debt of any District or any Member, and no such District or Member isliable in any manner for the payment thereof.
APPLICATION OF PROCEEDS
The proceeds, including premium, from the sale of the Bonds are anticipated to be used in theaggregate amounts as follows:
Proceeds Fund $203,413,285.65Costs of Issuance* 769,166.25
Total $204,182,451.90_________*Includes legal fees, trustee fees, financial advisor fees,rating agency fees and Underwriter’s discount.

18
INVESTMENT OF DISTRICT FUNDS
General
Education Code Section 41001 et seq. provides that all school district funds, except as otherwiseset forth below, shall be deposited into the county treasury to the credit of the proper fund of such district.Education Code Section 41015 provides that funds held in a special reserve fund or any surplus moneysnot required for the immediate necessities of such district may be invested in investments specified inSection 16430 or 53601 of the Government Code. In addition, Government Code Section 53853(b)authorizes the Districts to direct the investment of their Note proceeds and amounts held by the Trusteeunder the Indenture. Accordingly, all funds of the Districts not subject to the exception, including cashreceipts and other moneys received by the Districts for deposit to the general fund and other funds notdescribed above of the Districts and attributable to Fiscal Year 2013-2014, are deposited with theapplicable county treasury, to remain on deposit therein and generally available for the payment of currentexpenses and other obligations of the Districts until deposited into such Districts’ respective ProceedsSubaccounts and Payment Accounts.
Sections 27130 through 27137 of the Government Code require the board of supervisors in acounty investing surplus funds to establish a treasury oversight committee. In general, the provisions(a) require the treasury oversight committee to consist of between three and 11 members nominated bythe treasurer and confirmed by the board of supervisors; (b) prohibit committee members from raisingmoney for the treasurer or the board of supervisors and restrict employment by members of thecommittee; (c) require the annual preparation of an investment policy to be reviewed and monitored bythe treasury oversight committee, which shall include, among other things, a list of the type of securitiesin which the county treasury may invest and the maximum term of such securities, criteria for theselection of securities brokers and dealers, the requirement that the county treasurer provide the oversightcommittee with an investment report as required by the board of supervisors, the manner of calculatingand apportioning costs, and criteria for considering requests to withdraw funds from the county treasury;(d) require performance of an annual audit by the treasury oversight committee to ensure compliance withestablished investment policies; and (e) permit the treasurer to grant withdrawal requests for the purposesof investing or depositing such funds outside of the treasury pool only upon a finding by the treasurer thatthe withdrawal will not adversely affect the other depositors in the pool.
In addition, California Government Code provisions establish a trust and fiduciary relationshipbetween the treasurer, those involved in the treasury investment process and the depositors, investors andparticipants in the treasury. Such provisions adopt the prudent investor standard for investing, establishpriorities for public investing (first safety, second liquidity and finally return on the funds invested), placeadditional limitations on permitted treasury investments, including restricting the use of reverserepurchase agreement and certain derivative instruments, and establish additional reporting requirementsfor the treasury.
County Investment Pools
Most, if not all, of the Districts have substantial amounts held and invested in the pooledinvestment fund of the county in which such District is located. All of the Districts are expected to investthe net proceeds of their Notes, and certain other funds held by the Trustee in their Proceeds Subaccountsand Payment Accounts attributable to the Notes in their respective county investment pools. In order forthe Districts to invest the net proceeds of their Notes deposited into the applicable Proceeds Subaccountsin their respective county investment pools, such Districts will withdraw such invested amounts fromtheir respective Proceeds Subaccounts. Each District must notify Dale Scott & Company of its election toinvest such funds prior to the issuance of the Bonds. All of the Districts have indicated that they intend to

19
invest such funds in its respective county investment pool. Copies of the current investment policies ofsuch counties are available upon request during the initial offering period from Dale Scott & Company.
An investment by a county of Note proceeds typically involves a requisition of the entire amounton deposit in a District’s Proceeds Subaccount, with such county treating such amount in the samemanner as other funds deposited in such District’s general fund. An investment by a county of amountsrequired to be on deposit in a District’s Payment Account requires such county to segregate such amountfrom other funds of such District.
Although State law requires conservative investment standards by county treasuries as describedabove under “—General,” there can be no assurance that a county investment pool will not suffersignificant investment losses.
On December 6, 1994, Orange County, California, filed a petition in bankruptcy. On January 24,1996, the United States Bankruptcy Court for the Central District of California held in the case of Countyof Orange v. Merrill Lynch that a State statute providing for a priority of distribution of property held intrust conflicted with, and was preempted by, federal bankruptcy law. In that case, the Court addressed thepriority of the disposition of moneys held in a county investment pool upon bankruptcy of the county, butwas not required to directly address the State statute that provides for the lien in favor of holders of taxand revenue anticipation notes. The counties within which the Districts are located hold taxes and otherrevenues that will be set aside and pledged to repay the Notes. Such taxes and other revenues, as well asthe proceeds of the Notes, and the payment of funds during the applicable Repayment Periods, areexpected to be invested by most, if not all, of the Districts in their respective County Treasury Pool. Inthe event of a petition for the adjustment of debts of a District under Chapter 9 of the Bankruptcy Code,or in the event of a bankruptcy of a county, a court might hold that the Trustee, as the registered owner ofthe Note of such District, does not have a valid and prior lien on the proceeds of the Notes, or the PledgedRevenues when such amounts are deposited in the applicable County Treasury Pool, and may not providethe Trustee with a priority interest in such amounts. Such amounts may not be available for payment ofprincipal of and interest on such District’s Note unless the Trustee could “trace” the funds which havebeen deposited in the Treasury Pool. There can be no assurance that the Trustee could successfully so“trace” such invested amounts.
PARTICIPATING DISTRICTS
There are three types of school districts within the State: elementary school districts providingeducational services for children in kindergarten through eighth grade in the State, secondary or highschool districts providing educational services for children in ninth through twelfth grade in the State, andunified school districts providing educational services for children in kindergarten through twelfth gradein the State. There are 72 community college districts in the State. Series J Notes are expected to beissued by eight elementary school districts, six unified school districts and one community collegedistrict. Series K Notes are expected to be issued by four elementary school districts and seven unifiedschool districts. Series L Notes are expected to be issued by six unified school districts. Series M Notesare expected to be issued by one elementary school district and three unified school districts. TheSeries N Note is expected to be issued by one unified school district. The Series O Note is expected to beissued by one unified school district. The Series P Note is expected to be issued by one high schooldistrict.
Certain information concerning the Districts is set forth in Appendix C and Appendix D hereto.Appendix C includes projected amounts available to be borrowed by each District from alternate cashresources. Pursuant to Education Code Section 42603, a District could temporarily borrow, for its generalfund cash flow purposes, up to 75% of funds held by such District outside its general fund. Such
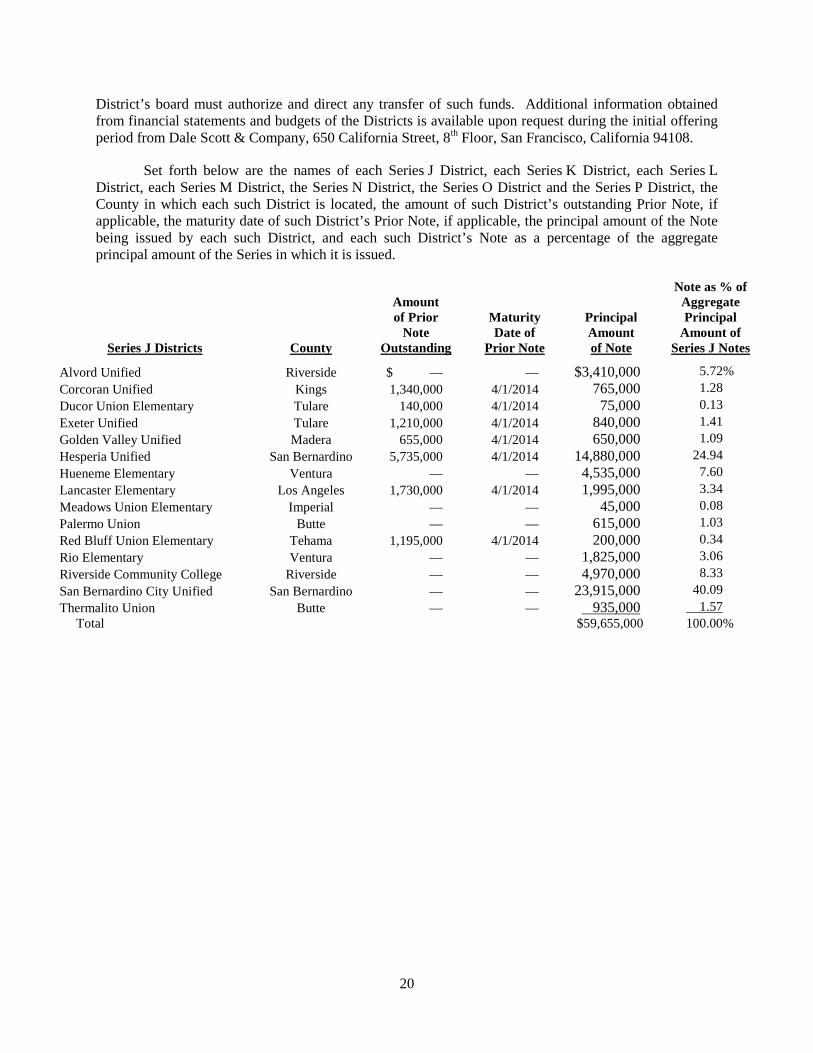
20
District’s board must authorize and direct any transfer of such funds. Additional information obtainedfrom financial statements and budgets of the Districts is available upon request during the initial offeringperiod from Dale Scott & Company, 650 California Street, 8th Floor, San Francisco, California 94108.
Set forth below are the names of each Series J District, each Series K District, each Series LDistrict, each Series M District, the Series N District, the Series O District and the Series P District, theCounty in which each such District is located, the amount of such District’s outstanding Prior Note, ifapplicable, the maturity date of such District’s Prior Note, if applicable, the principal amount of the Notebeing issued by each such District, and each such District’s Note as a percentage of the aggregateprincipal amount of the Series in which it is issued.
Series J Districts County
Amountof Prior
NoteOutstanding
MaturityDate of
Prior Note
PrincipalAmountof Note
Note as % ofAggregatePrincipal
Amount ofSeries J Notes
Alvord Unified Riverside $ — — $3,410,000 5.72%
Corcoran Unified Kings 1,340,000 4/1/2014 765,000 1.28
Ducor Union Elementary Tulare 140,000 4/1/2014 75,000 0.13
Exeter Unified Tulare 1,210,000 4/1/2014 840,000 1.41
Golden Valley Unified Madera 655,000 4/1/2014 650,000 1.09
Hesperia Unified San Bernardino 5,735,000 4/1/2014 14,880,000 24.94
Hueneme Elementary Ventura — — 4,535,000 7.60
Lancaster Elementary Los Angeles 1,730,000 4/1/2014 1,995,000 3.34
Meadows Union Elementary Imperial — — 45,000 0.08
Palermo Union Butte — — 615,000 1.03
Red Bluff Union Elementary Tehama 1,195,000 4/1/2014 200,000 0.34
Rio Elementary Ventura — — 1,825,000 3.06
Riverside Community College Riverside — — 4,970,000 8.33
San Bernardino City Unified San Bernardino — — 23,915,000 40.09
Thermalito Union Butte — — 935,000 1.57
Total $59,655,000 100.00%
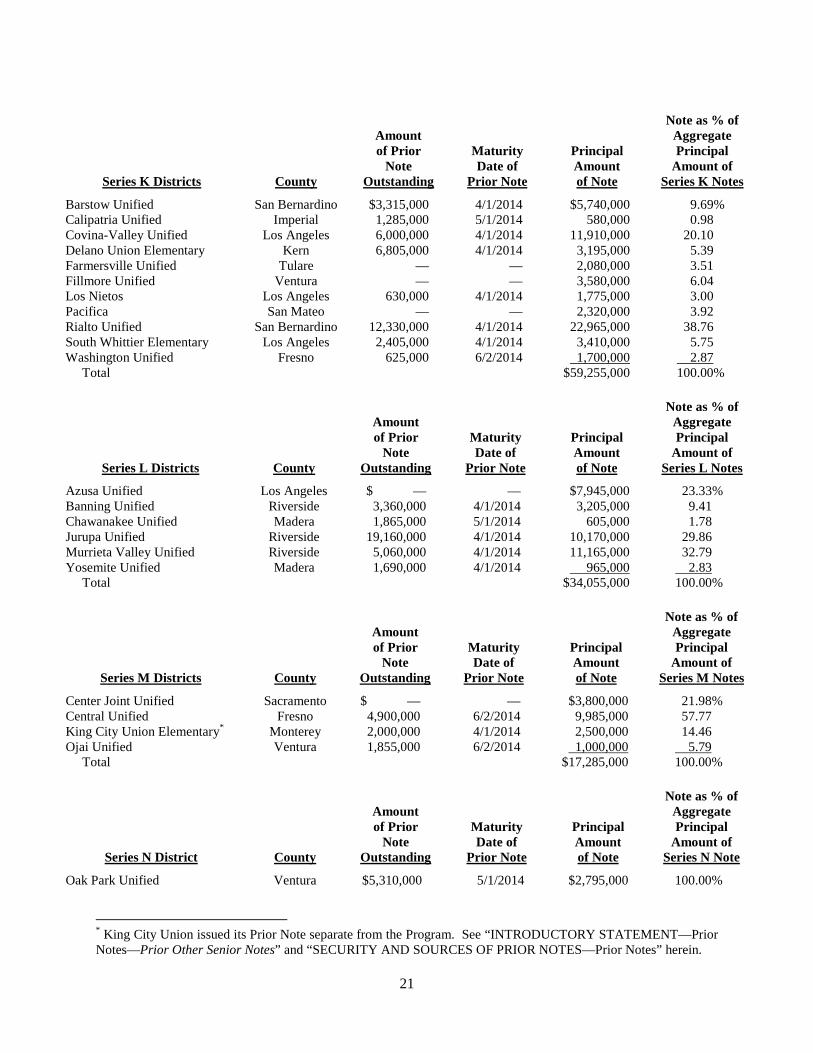
21
Series K Districts County
Amountof Prior
NoteOutstanding
MaturityDate of
Prior Note
PrincipalAmountof Note
Note as % ofAggregatePrincipal
Amount ofSeries K Notes
Barstow Unified San Bernardino $3,315,000 4/1/2014 $5,740,000 9.69%Calipatria Unified Imperial 1,285,000 5/1/2014 580,000 0.98Covina-Valley Unified Los Angeles 6,000,000 4/1/2014 11,910,000 20.10Delano Union Elementary Kern 6,805,000 4/1/2014 3,195,000 5.39Farmersville Unified Tulare — — 2,080,000 3.51Fillmore Unified Ventura — — 3,580,000 6.04Los Nietos Los Angeles 630,000 4/1/2014 1,775,000 3.00Pacifica San Mateo — — 2,320,000 3.92Rialto Unified San Bernardino 12,330,000 4/1/2014 22,965,000 38.76South Whittier Elementary Los Angeles 2,405,000 4/1/2014 3,410,000 5.75Washington Unified Fresno 625,000 6/2/2014 1,700,000 2.87
Total $59,255,000 100.00%
Series L Districts County
Amountof Prior
NoteOutstanding
MaturityDate of
Prior Note
PrincipalAmountof Note
Note as % ofAggregatePrincipal
Amount ofSeries L Notes
Azusa Unified Los Angeles $ — — $7,945,000 23.33%Banning Unified Riverside 3,360,000 4/1/2014 3,205,000 9.41Chawanakee Unified Madera 1,865,000 5/1/2014 605,000 1.78Jurupa Unified Riverside 19,160,000 4/1/2014 10,170,000 29.86Murrieta Valley Unified Riverside 5,060,000 4/1/2014 11,165,000 32.79Yosemite Unified Madera 1,690,000 4/1/2014 965,000 2.83
Total $34,055,000 100.00%
Series M Districts County
Amountof Prior
NoteOutstanding
MaturityDate of
Prior Note
PrincipalAmountof Note
Note as % ofAggregatePrincipal
Amount ofSeries M Notes
Center Joint Unified Sacramento $ — — $3,800,000 21.98%Central Unified Fresno 4,900,000 6/2/2014 9,985,000 57.77King City Union Elementary* Monterey 2,000,000 4/1/2014 2,500,000 14.46Ojai Unified Ventura 1,855,000 6/2/2014 1,000,000 5.79
Total $17,285,000 100.00%
Series N District County
Amountof Prior
NoteOutstanding
MaturityDate of
Prior Note
PrincipalAmountof Note
Note as % ofAggregatePrincipal
Amount ofSeries N Note
Oak Park Unified Ventura $5,310,000 5/1/2014 $2,795,000 100.00%
* King City Union issued its Prior Note separate from the Program. See “INTRODUCTORY STATEMENT—PriorNotes—Prior Other Senior Notes” and “SECURITY AND SOURCES OF PRIOR NOTES—Prior Notes” herein.

22
Series O District County
Amountof Prior
NoteOutstanding
MaturityDate of
Prior Note
PrincipalAmountof Note
Note as % ofAggregatePrincipal
Amount ofSeries O Note
Lake Elsinore Unified Riverside $24,315,000 4/1/2014 $21,830,000 100.00%
Series P District County
Amountof Prior
NoteOutstanding
MaturityDate of
Prior Note
PrincipalAmountof Note
Note as % ofAggregatePrincipal
Amount ofSeries P Note
Centinela Valley Union High Los Angeles $7,240,000 6/2/2014 $7,165,000 100.00%
TAX EXEMPTION
In the opinion of Orrick, Herrington & Sutcliffe LLP, Bond Counsel to the Authority, based on ananalysis of existing laws, regulations, rulings and court decisions, and assuming, among other matters, theaccuracy of certain representations and compliance with certain covenants, interest on the Bonds isexcluded from gross income for federal income tax purposes under Section 103 of the Internal RevenueCode of 1986 (the “Code”) and is exempt from State of California personal income taxes. The amounttreated as interest on the Bonds and excluded from gross income may depend upon the taxpayer’s electionunder Internal Revenue Service Notice 94-84. Bond Counsel is of the further opinion that interest on theBonds is not a specific preference item for purposes of the federal individual or corporate alternativeminimum taxes, although Bond Counsel observes that such interest is included in adjusted currentearnings when calculating federal corporate alternative minimum taxable income. Complete copies of theproposed opinions of Bond Counsel are set forth in Appendix E hereto.
Notice 94-84, 1994-2 C.B. 559, states that the Internal Revenue Service (the “IRS”) is studyingwhether the amount of the payment at maturity on short-term debt obligations (i.e., debt obligations witha stated fixed rate of interest which mature not more than one year from the date of issue) that is excludedfrom gross income for federal income tax purposes is (a) the stated interest payable at maturity or (b) thedifference between the issue price of the short-term debt obligations and the aggregate amount to be paidat maturity of the short-term debt obligations (the “original issue discount”). For this purpose, the issueprice of the short-term debt obligations is the first price at which a substantial amount of the short-termdebt obligations is sold to the public (excluding bond houses, brokers, or similar persons or organizationsacting in the capacity of underwriters, placement agents or wholesalers). Until the IRS provides furtherguidance with respect to tax-exempt short-term debt obligations, taxpayers may treat either the statedinterest payable at maturity or the original issue discount as interest that is excluded from gross incomefor federal income tax purposes. However, taxpayers must treat the amount to be paid at maturity on alltax-exempt short-term debt obligations in a consistent manner. Taxpayers should consult their own taxadvisors with respect to the tax consequences of ownership of Bonds if the taxpayer elects original issuediscount treatment.
Bonds purchased, whether at original issuance or otherwise, for an amount greater than theirprincipal amount payable at maturity (“Premium Bonds”) may be treated as having amortizable bondpremium depending upon taxpayer’s election under Internal Revenue Service Notice 94-84. Nodeduction is allowable for the amortizable bond premium in the case of obligations, like the PremiumBonds, the interest on which is excluded from gross income for federal income tax purposes. However,the amount of tax-exempt interest received, and a purchaser’s basis in a Premium Bond, will be reducedby the amount of amortizable bond premium properly allocable to such purchaser. Owners of Premium

23
Bonds should consult their own tax advisors with respect to the proper treatment of amortizable bondpremium in their particular circumstances.
The Code imposes various restrictions, conditions and requirements relating to the exclusion fromgross income for federal income tax purposes of interest on obligations such as the Bonds. The Authorityand each of the Districts have made certain representations and covenanted to comply with certainrestrictions designed to assure that interest on the Bonds will not be included in federal gross income.Inaccuracy of these representations or a failure to comply with these covenants may result in such interestbeing included in federal gross income, possibly from the date of original issuance of the Bonds. Theopinions of Bond Counsel assume the accuracy of these representations and compliance with thesecovenants. Bond Counsel has not undertaken to determine (or to inform any person) whether any actionstaken (or not taken) or events occurring (or not occurring) after the date of issuance of the Bonds mayadversely affect the value of, or the tax status of interest on, the Bonds. Accordingly, the opinions ofBond Counsel are not intended to, and may not, be relied upon in connection with such actions, events ormatters.
Other than Districts that do not expect to issue more than $5,000,000 (or in certain circumstancesup to $15,000,000) in tax-exempt obligations and certain other obligations within the calendar year (a“Small Issuer”), the Districts have covenanted to reasonably and prudently calculate the amount, if any, ofexcess investment earnings on the proceeds of its Note which must be rebated to the United States, to setaside from lawfully available sources sufficient moneys to pay such amounts and to otherwise do allthings necessary and within its power and authority to assure that interest on its Note is excluded fromgross income for federal income tax purposes. Under the Code, if such District spends 100% of theproceeds of its Note within six months after issuance, there is no requirement that there be a rebate ofinvestment profits in order for interest on the Note to be excluded from gross income for federal incometax purposes. The Code also provides that such proceeds are not deemed spent until all other availablemoneys (less a reasonable working capital reserve) are spent. Each District expects to either qualify as aSmall Issuer or satisfy the six-month expenditure test or, if it fails to do so, to make any required rebatepayments from moneys received or accrued during the 2013-2014 Fiscal Year. To the extent that anyrebate cannot be paid from such moneys, the law of California is unclear as to whether such covenantwould require the Districts to pay any such rebate. This would be an issue only if it were determined thata District’s calculation of expenditures of Note proceeds or of rebatable arbitrage profits, if any, wereincorrect.
Although Bond Counsel is of the opinion that interest on the Bonds is excluded from grossincome for federal income tax purposes and is exempt from State of California personal income taxes, theownership or disposition of, or the accrual or receipt of amounts treated as interest on, the Bonds mayotherwise affect a Bond Owner’s federal, state or local tax liability. The nature and extent of these othertax consequences depends upon the particular tax status of the Bond Owner or the Bond Owner’s otheritems of income or deduction. Bond Counsel expresses no opinion regarding any such other taxconsequences.
Current and future legislative proposals, if enacted into law, clarification of the Code or courtdecisions may cause interest on the Bonds to be subject, directly or indirectly, in whole or in part, tofederal income taxation or to be subject to or exempted from state income taxation, or otherwise preventBeneficial Owners from realizing the full current benefit of the tax status of such interest. For example,legislative proposals have been made in recent years that would limit the exclusion from gross income ofinterest on obligations like the Bonds to some extent for taxpayers who are individuals and whose incomeis subject to higher marginal income tax rates. The introduction or enactment of any such legislativeproposals or clarification of the Code or court decisions may also affect, perhaps significantly, the marketprice for, or marketability of, the Bonds. Prospective purchasers of the Bonds should consult their own

24
tax advisors regarding the potential impact of any pending or proposed federal or state tax legislation,regulations or litigation, as to which Bond Counsel is expected to express no opinion.
The opinions of Bond Counsel are based on current legal authority, cover certain matters notdirectly addressed by such authorities, and represent Bond Counsel’s judgment as to the proper treatmentof the Bonds for federal income tax purposes. It is not binding on the IRS or the courts. Furthermore,Bond Counsel cannot give and has not given any opinion or assurance about the future activities of theAuthority or the Districts, or about the effect of future changes in the Code, the applicable regulations, theinterpretation thereof or the enforcement thereof by the IRS. The Authority and the Districts havecovenanted, however, to comply with the requirements of the Code.
In recent years, the IRS has increased its audit examination of tax and/or revenue anticipationnotes, including pooled tax and/or revenue anticipation note programs, for compliance with federal taxlaw requirements. There can be no assurance that the IRS will not conduct such an audit with respect tothe Bonds. Bond Counsel’s engagement with respect to the Bonds ends with the issuance of the Bonds,and, unless separately engaged, Bond Counsel is not obligated to defend the Authority, the Districts or theBond Owners regarding the tax-exempt status of the Bonds in the event of an audit examination by theIRS. However, Orrick, Herrington & Sutcliffe LLP (“Orrick”) has been bond counsel with respect to allof the prior issues of pool bonds issued by the Authority, and Orrick expects to be bond counsel on futureissuances of bonds. In the event of an audit examination by the IRS, Orrick expects to be engaged by theAuthority to defend the Authority and the exclusion from gross income of the interest on the Bonds.
Under current procedures, parties other than the Authority, the Districts and their appointedcounsel, including the Bond Owners, would have little, if any, right to participate in the audit examinationprocess. Moreover, because achieving judicial review in connection with an audit examination of tax-exempt obligations is difficult, obtaining an independent review of IRS positions with which theAuthority or the Districts legitimately disagree, may not be practicable. Any action of the IRS, includingbut not limited to selection of the Bonds for audit, or the course or result of such audit, or an audit ofobligations presenting similar tax issues may affect the market price for, or the marketability of, theBonds, and may cause the Authority, the Districts or the Bond Owners to incur significant expense.
ABSENCE OF LITIGATION
There is no action, suit or proceeding known to be pending or threatened, restraining or enjoiningthe execution or delivery of the Bonds, the Notes, the Indenture or in any way contesting or affecting thevalidity of the foregoing or any proceedings of the Authority or the Districts taken with respect to any ofthe foregoing.
There is no litigation pending or, to the knowledge of the Authority, threatened, questioning theexistence of the Authority, or the title of the officers of the Authority to their respective offices, or thepower and authority of the Authority to issue the Bonds.
FORWARD LOOKING STATEMENTS
This Official Statement contains statements relating to future results that are “forward lookingstatements” as defined in the Private Securities Litigation Reform Act of 1995. When used in thisOfficial Statement, the words “estimate,” “forecast,” “intend,” “expect,” “budgeted” and similarexpressions identify forward looking statements. Such statements are subject to risks and uncertaintiesthat could cause actual results to differ materially from those contemplated in such forward lookingstatements. Any forecast is subject to such uncertainties. Inevitably, some assumptions used to develop
25
the forecasts will not be realized and unanticipated events and circumstances may occur. Therefore, thereare likely to be differences between forecasts and actual results, and those differences may be material.
RATINGS
Standard & Poor’s Rating Services, a Standard & Poor’s Financial Services LLC business(“S&P”) is expected to assign a rating of “SP1+” to each individual Series J District, Series K District,Series L District, Series M District and Series N District. S&P is expected to assign a rating of “SP1+”on the Series J Bonds, Series K Bonds, Series L Bonds, Series M Bonds and Series N Bonds. S&P isexpected to assign the rating of “SP2” to the Series O District and the Series P District. S&P is expectedto assign a rating of “SP2” on the Series O Bonds and the Series P Bonds. The Bonds are short-termobligations which mature within one year and thus do not qualify for a long-term rating from S&P.Certain information was supplied on behalf of the Authority and the Districts to S&P to be considered inevaluating the Bonds. Any rating issued will reflect only the views of S&P, and any explanation of thesignificance of such rating on the Bonds should be obtained from S&P as follows: Standard & Poor’sRatings Services, 55 Water Street, New York, New York 10041. There is no assurance that a ratingobtained for each of the series of Bonds will be retained for any given period of time or that the same willnot be revised downward or withdrawn entirely by S&P for the Bonds if, in its judgment, circumstancesso warrant. The Authority and the Districts undertake no responsibility either to bring to the attention ofthe Owners of the Bonds downward revision or withdrawal of any rating obtained or to oppose any suchrevision or withdrawal. Any such downward revision or withdrawal of the rating obtained may have anadverse effect on the market price of the Bonds.
UNDERWRITING
The Series J Bonds are to be purchased by the Underwriter at a price of $60,215,160.45. TheSeries K Bonds are to be purchased by the Underwriter at a price of $59,811,404.45. The Series L Bondsare to be purchased by the Underwriter at a price of $34,371,030.40. The Series M Bonds are to bepurchased by the Underwriter at a price of $17,522,323.05. The Series N Bonds are to be purchased bythe Underwriter at a price of $2,833,375.35. The Series O Bonds are to be purchased by the Underwriterat a price of $22,024,287.00. The Series P Bonds are to be purchased by the Underwriter at a price of$7,202,831.20. The Purchase Contract provides that the obligations to make such purchase being subjectto certain terms and conditions set forth in the Purchase Contract, the approval of certain legal matters bycounsel and certain other conditions.
The Underwriter may offer and sell the Bonds of each series to certain dealers and others at aprice lower than the offering price stated on the cover page hereof. The offering price may be changedfrom time to time by the Underwriter.
CERTAIN LEGAL MATTERS
At the time of the delivery of the Bonds, Orrick, Herrington & Sutcliffe LLP, San Francisco,California, Bond Counsel to the Authority, will deliver its final approving opinions. Proposed forms ofsuch approving opinions are contained in Appendix E hereto and will be delivered to The DepositoryTrust Company with the Bonds. Bond Counsel has undertaken no responsibility for the accuracy,completeness or fairness of this Official Statement.
Certain legal matters will be passed upon for the Underwriter by its counsel, Kutak Rock LLP,and for the Districts by Kutak Rock LLP. Payment of the fees of Orrick, Herrington & Sutcliffe LLP,Bond Counsel to the Authority, and Kutak Rock LLP, Underwriter’s Counsel and Special Districts’Counsel is contingent upon the issuance of the Bonds.

26
TRUSTEE
The Authority has appointed U.S. Bank National Association (the “Trustee”), a national bankingassociation organized under the laws of the United States, to serve as Trustee. The Trustee is to carry outthose duties assignable to it under the Indenture and other documents related to the Bonds. Except for thecontents of this section, the Trustee has not reviewed or participated in the preparation of this OfficialStatement and assumes no responsibility for the nature, contents, accuracy or completeness of theinformation set forth in this Official Statement or for the recitals contained in the Indenture or the Bonds,or for the validity, sufficiency, or legal effect of any of such documents.
Furthermore, the Trustee has no oversight responsibility, and is not accountable, for the use orapplication by the Authority or the Districts of any of the Bonds authenticated or delivered pursuant to theIndenture or for the use or application of the proceeds of such Bonds by the Authority or the Districts.The Trustee has not evaluated the risks, benefits, or propriety of any investment in the Bonds and makesno representation, and had reached no conclusions, regarding the value or condition of any assets orrevenues pledged or assigned as security for the Bonds, or the investment quality of the Bonds, about allof which the Trustee expresses no opinion and expressly disclaims the expertise to evaluate.
Additional information about the Trustee may be found at its website athttp://www.usbank.com/corporatetrust. The Trustee’s website is not incorporated into this OfficialStatement by such reference and is not a part hereof.
CONTINUING DISCLOSURE
Pursuant to a Continuing Disclosure Agreement related to all series of Bonds, dated as ofMarch 1, 2014 (the “Continuing Disclosure Agreement”), by and between the Authority and U.S. BankNational Association, as Dissemination Agent, the Authority has agreed (the “Undertaking”) for thebenefit of the holders and beneficial owners of each series of the Bonds as follows, pursuant to therequirements of Section (b)(5)(i) of Securities and Exchange Commission Rule 15c2-12 (17 C.F.R. Part240, Section 240.15c2-12) (the “Rule”).
The Authority shall give, or cause to be given, through the Dissemination Agent, notice of theoccurrence of any of the following events with respect to the applicable series of the Bonds not later thanten business days after the occurrence of an event: (a) principal and interest payment delinquencies; (b)unscheduled draws on debt service reserves reflecting financial difficulties; (c) unscheduled draws oncredit enhancements reflecting financial difficulties; (d) substitution of credit or liquidity providers, ortheir failure to perform; (e) adverse tax opinions, issuance by the Internal Revenue Service of proposed orfinal determination of taxability or a Notice of Proposed Issue (IRS Form 5701 TEB); (f) tender offers;(g) defeasances; (h) rating changes; or (i) bankruptcy, insolvency, receivership or similar event of theobligated person.
For the purposes of the event identified in (i) above, the event is considered to occur when any ofthe following occur: the appointment of a receiver, fiscal agent or similar officer for an obligated personin a proceeding under the U.S. Bankruptcy Code or in any other proceeding under state or federal law inwhich a court or governmental authority has assumed jurisdiction over substantially all of the assets orbusiness of the obligated person, or if such jurisdiction has been assumed by leaving the existinggovernmental body and officials or officers in possession but subject to the supervision and orders of acourt or governmental authority, or the entry of an order confirming a plan of reorganization, arrangementor liquidation by a court or governmental authority having supervision or jurisdiction over substantiallyall of the assets or business of the obligated person.
27
The Authority shall also give, or cause to be given, through the Dissemination Agent, notice ofthe occurrence of any of the following events with respect to the applicable series of Bonds, if material,not later than ten business days after the occurrence of the event: (i) unless described in (e) above, othermaterial notices or determinations with respect to the tax status of such series of Bonds or other materialevents affecting the tax status of such Bonds; (ii) modifications to rights of the Owners of such series ofBonds; (iii) optional, unscheduled or contingent Bond calls; (iv) release, substitution or sale of propertysecuring repayment of such series of Bonds; (v) non-payment related defaults; (vi) the consummation of amerger, consolidation, or acquisition involving an obligated person or the sale of all or substantially all ofthe assets of the obligated person, other than in the ordinary course of business, the entry into a definitiveagreement to undertake such an action or the termination of a definitive agreement relating to any suchactions, other than pursuant to its terms; or (vii) appointment of a successor or additional trustee or thechange of name of a trustee.
The Authority’s obligations under the Continuing Disclosure Agreement shall terminate upon thelegal defeasance, prior redemption or payment in full of all of the applicable series of Bonds. If suchtermination occurs prior to the final maturity of the applicable series of Bonds, the Authority shall givenotice of such termination in the same manner as for a Material Event.
Notwithstanding any other provision of the Continuing Disclosure Agreement, the Authority andthe Dissemination Agent may amend the Continuing Disclosure Agreement, and any provision of theContinuing Disclosure Agreement may be waived, provided that the following conditions are satisfied:
(a) If the amendment or waiver relates to the provisions regarding the giving of aMaterial Event Notice, it may only be made in connection with a change in circumstances thatarises from a change in legal requirements, change in law, or change in the identity, nature orstatus of an obligated person with respect to the Bonds, or the type of business conducted;
(b) The undertaking, as amended or taking into account such waiver, would, in theopinion of nationally recognized bond counsel, have complied with the requirements of the Ruleat the time of the original issuance of the Bonds, after taking into account any amendments orinterpretations of the Rule, as well as any change in circumstances; and
(c) The amendment or waiver either (i) is approved by the holders or BeneficialOwners of the Bonds in the same manner as provided in the Indenture for amendments to theIndenture with the consent of holders or Beneficial Owners, or (ii) does not, in the opinion ofnationally recognized bond counsel, materially impair the interests of the holders or BeneficialOwners of the Bonds.
In the event of any amendment or waiver of a provision of the Continuing Disclosure Agreement, noticeof such change shall be given in the same manner as for a Material Event, and shall include, as applicable,a narrative explanation of the reason for the amendment or waiver.
Nothing in the Continuing Disclosure Agreement shall be deemed to prevent the Authority fromdisseminating any other information, using the means of dissemination set forth in the ContinuingDisclosure Agreement or any other means of communication, or including any other notice of occurrenceof a Material Event, in addition to that which is required by the Continuing Disclosure Agreement. If theAuthority chooses to include any information in any notice of occurrence of a Material Event in additionto that which is specifically required by the Continuing Disclosure Agreement, the Authority shall haveno obligation under the Continuing Disclosure Agreement to update such information or include it in anyfuture notice of occurrence of a Material Event.

28
In the event of a failure of the Authority to comply with any provision of the ContinuingDisclosure Agreement, any holder or Beneficial Owner of the applicable series of Bonds may take suchactions as may be necessary and appropriate, including seeking mandate or specific performance by courtorder, to cause the Authority to comply with its obligations under the Continuing Disclosure Agreement.A default under the Continuing Disclosure Agreement shall not be deemed an Event of Default under theIndenture, and the sole remedy under the Continuing Disclosure Agreement in the event of any failure ofthe Authority to comply with the Continuing Disclosure Agreement shall be an action to compelperformance.
A failure by the Authority to comply in any material respect with the terms of the ContinuingDisclosure Agreement must be reported in accordance with the Rule and must be considered by anybroker, dealer or municipal securities dealer before recommending the purchase or sale of the applicableseries of Bonds in the secondary market. Consequently, such a failure may adversely affect thetransferability and liquidity of the Bonds and their market price.
The Authority has never failed to comply in any material respect with any previous undertakingwith regard to said Rule to provide annual reports or notices of material events, as applicable.
The Districts have covenanted to notify the Trustee within 5 days of any Default or Event ofDefault of which such District has knowledge, setting forth the details of such Default or Event of Defaultand any and all action which such District has taken or proposes to take with respect thereto.

29
EXECUTION AND DELIVERY
The execution and delivery of this Official Statement by the Authority, acting on behalf of itselfand each of the Districts, has been duly authorized by the Authority and each District under its respectiveResolution.
CALIFORNIA SCHOOL CASH RESERVEPROGRAM AUTHORITY
By /s/ Teresa Williams
Title Chair
APPENDIX A
SUMMARY OF LEGAL DOCUMENTS
The following summary discussion of selected provisions of the form of Resolution and theIndenture is made subject to all of the provisions of such documents. This summary discussion does notpurport to be a complete statement of such provisions and prospective purchasers of the Bonds arereferred to the complete texts of such documents, copies of which are available during the initial offeringperiod from the Underwriter, and thereafter from the Trustee.
DEFINITIONS OF CERTAIN TERMS
The following terms shall have the following meanings unless the context expressly or bynecessary implication requires otherwise:
“Additional Bonds” means all additional bonds of the Authority authorized by and at any timeOutstanding pursuant to the Indenture and a Supplemental Indenture.
“Authority” means the California School Cash Reserve Program Authority, duly organized andexisting under and by virtue of the laws of the State of California.
“Authorized District Representative” means the President, Chair or Secretary or Clerk of thegoverning board of a District or Superintendent of a District or such other officers of a District designatedin such District’s Resolution or any other person at the time designated to act on behalf of such District bywritten certificate furnished to the Trustee, containing the specimen signature of such person and signedon behalf of such District by the Chair, President, Clerk or the Secretary of the governing board of suchDistrict or Superintendent of such District.
“Bond Payment Fund” means the fund by that name established in the Indenture.
“Bonds” means, collectively, the Series J Bonds, the Series K Bonds, the Series L Bonds, theSeries M Bonds, the Series N Bonds, the Series O Bonds and the Series P Bonds.
“Business Day” means any day except (a) Saturday, (b) Sunday or (c) any day on which bankslocated in the city in which the designated trust office of the Trustee is located, or in San Francisco,California, Los Angeles, California, or New York, New York, are required or authorized to remainclosed.
“Certificate” or “Request” with respect to a District means an instrument in writing signed onbehalf of such District by an Authorized District Representative, and with respect to the Authority, meansan instrument in writing signed on behalf of the Authority by its Chair, Secretary, Treasurer or ExecutiveDirector or other person at the time designated to act on behalf of the Authority by written certificatefurnished to the Trustee.
“Code” means the Internal Revenue Code of 1986 and the regulations issued or applicablethereunder.
“Costs of Issuance” means all items of expense directly or indirectly payable by or reimbursableto a District or the Authority and related to the authorization, execution and delivery of the Notes and therelated sale of the Bonds, which may include but are not limited to costs of preparation, reproduction anddelivery of documents, filing and recording fees, fees and charges of the Trustee, Trustee counsel fees,

A-2
bond counsel fees and charges, other legal fees and charges, fees and disbursements of consultants andprofessionals, fees and charges for preparation, execution, safekeeping and delivery of the Bonds and anyother costs, charges or fees (including any supplemental credit enhancement on any individual Note) inconnection with the original issuance of the Notes and the Bonds.
“Costs of Issuance Account” means the account by that name created in the Costs of IssuanceFund pursuant to the Indenture.
“Costs of Issuance Fund” means the fund by that name established pursuant to the Indenture.
“Default Rate” means the rate of interest per annum payable with respect to each outstandingportion of each Defaulted Note which is the rate of interest per annum sufficient to produce a yield on theoutstanding portion of such Defaulted Note equal to the rates of interest payable on the applicable seriesof Bonds thereto (or applicable portions thereof) computed on the basis of a 360-day year consisting oftwelve thirty-day months.
“Defaulted Note” means a Note any of the principal of or interest on which is not paid on theMaturity Date.
“Districts” means the California school districts and the community college district, and, whereappropriate, the counties electing to be the issuers of the Notes for the school districts that are not fiscallyaccountable, and in each case their successors and assigns, which are participating in the Program andissuing the Notes.
“Eleventh Supplemental Indenture” means the Eleventh Supplemental Indenture dated as ofMarch 1, 2014, by and between the Trustee and the Authority providing for the issuance of the Series LBonds.
“Fifteenth Supplemental Indenture” means the Fifteenth Supplemental Indenture dated as ofMarch 1, 2014, by and between the Trustee and the Authority providing for the issuance of the Series PBonds.
“Financial Advisor” means Dale Scott & Company and its successors and assigns or such otherfinancial advisory firm appointed by the Authority.
“Fourteenth Supplemental Indenture” means the Fourteenth Supplemental Indenture dated as ofMarch 1, 2014, by and between the Trustee and the Authority providing for the issuance of the Series OBonds.
“Indenture” means the Original Indenture, as originally executed and entered into and as it mayfrom time to time be amended or supplemented in accordance therewith.
“Interest Payment Date” means the date on which the interest on each Note becomes due andpayable, being the Maturity Date applicable thereto.
“Maturity Date” means the date on which the principal and interest on each Note becomes dueand payable, being October 1, 2014 with respect to the Series J Notes, October 1, 2014 with respect to theSeries K Notes, October 1, 2014 with respect to the Series L Notes, December 31, 2014 with respect tothe Series M Notes, December 31, 2014 with respect to the Series N Note, December 31, 2014 withrespect to the Series O Note and September 2, 2014 with respect to the Series P Note.

A-3
“Moody’s” means Moody’s Investors Service, and its successors and assigns, except that if suchcorporation shall be dissolved or liquidated or shall no longer perform the functions of a securities ratingagency, then the term “Moody’s” shall be deemed to refer to any other nationally recognized securitiesrating agency selected by the Authority.
“Ninth Supplemental Indenture” means the Ninth Supplemental Indenture dated as of March 1,2014, by and between the Trustee and the Authority providing for the issuance of the Series J Bonds.
“Note Documents” means, at any time, each of the following as in effect or as outstanding, as thecase may be, at such time: (a) the Notes, (b) the Indenture, (c) the Purchase Agreements, (d) theResolutions, (e) the Purchase Contract, (f) the Bonds, and (g) the closing certificates delivered by theDistricts in connection with the issuance of the Notes.
“Notes” means, collectively, the Series J Notes, the Series K Notes, the Series L Notes, theSeries M Notes, the Series N Note, the Series O Note and the Series P Note.
“Opinion of Counsel” means a written opinion of counsel of recognized national standing in thefield of law relating to municipal bonds, appointed by the Authority and satisfactory to and approved bythe Trustee (who shall be under no liability by reason of such approval).
“Original Indenture” means the Indenture executed and entered into as of July 1, 2013, by andbetween the Trustee and the Authority.
“Outstanding” means all Bonds except—
(a) Bonds cancelled by the Trustee or surrendered to the Trustee for cancellation;
(b) Bonds paid or deemed to have been paid within the meaning of the Indenture;and
(c) Bonds in lieu of or in exchange or substitution for which other Bonds shall havebeen authenticated and delivered by the Trustee under the Indenture.
“Owner” means the registered owner of any Outstanding Bond.
“Payment Accounts” means the subaccounts created in the Bond Payment Fund under theIndenture.
“Permitted Investments” means any of the following to the extent then permitted by law:
(a) United States of America Treasury bills, notes, bonds or certificates ofindebtedness, or obligations of, or obligations guaranteed directly or indirectly as to full andtimely payment, by the United States of America or securities or other instruments evidencingownership interest in such obligations and rated in the highest applicable rating category by theRating Agency then rating the applicable series of Bonds or in specified portions of the intereston or principal of such obligations stripped at Treasury level;
(b) Any obligations which are then legal investments for moneys of the Districtsunder the laws of the State of California; provided, that if such investments are not fully insuredby the Federal Deposit Insurance Corporation, such investments shall be, or shall be issued byentities the debt securities of which are, rated in the highest short-term (with regard to any

A-4
modifiers) or one of the two highest long-term rating categories by Moody’s and S&P, (orwhichever one of them is then rating the applicable series of Bonds);
(c) Units of a money-market fund portfolio composed solely of obligationsguaranteed by the full faith and credit of the United States of America rated in one of the twohighest rating categories by Moody’s and S&P (or whichever one of them is then rating theapplicable series of Bonds);
(d) Units of a money-market fund portfolio rated in the highest rating category byS&P and Moody’s;
(e) The applicable investment agreement, if any, related to the applicable series ofBonds, or any substitute therefor which substitution results in a maintenance of the original ratingon the applicable series of Bonds, pursuant to which a portion of the net proceeds of such seriesof Bonds are to be invested; provided such agreement is with a financial entity (the “Provider”),or with a financial entity whose obligations are guaranteed or insured by a financial entity (the“Guarantor”), the Provider’s or the Guarantor’s senior debt or investment contracts or obligationsunder its investment contracts being rated in one of the two highest long-term rating categories byMoody’s and S&P (or whichever one of them is then rating the applicable series of Bonds) orwhose commercial paper rating is in the highest rating category (with regard to any modifiers) ofeach such rating agencies (or whichever one of them is then rating the applicable series of Bonds)or is fully collateralized by investments listed in subsection (a) hereof as required by S&P andMoody’s (or whichever one of them is then rating the applicable series of Bonds) to be rated inone of the two highest rating categories;
(f) Any other prudent investment rated in one of the two highest rating categories byMoody’s and S&P (or whichever one of them is then rating the applicable series of Bonds)approved by the Authority;
(g) The Local Agency Investment Fund managed by the office of the Treasurer ofthe State of California; or
(h) Any County Treasury of a County in which the District is situated, the proceedsof whose note are to be invested, provided that the investment of such proceeds by the applicableCounty Treasurer is made in compliance with California Government Code Section 53601.
“Pool Interest Fund” means the fund by that name established in the Indenture.
“Pool Principal Fund” means the fund by that name established by the Indenture.
“Pricing Confirmation” means, collectively, those certain pricing confirmation supplementsexpected at the time of pricing each of the series of Notes and attached as Schedule I to the PurchaseAgreement applicable to such series of Notes.
“Principal Office of the Trustee” means the principal corporate trust office of the Trustee, which,for the Trustee initially appointed under the Indenture, is located in Los Angeles, California; provided thatfor transfer, exchange, payment and registration of Bonds, “Principal Office of the Trustee” means thecorporate trust office of U.S. Bank National Association in Los Angeles, California, or such other officespecified by the Trustee.

A-5
“Principal Payment Date” means the date on which principal on the Bonds becomes due andpayable, being October 1, 2014 with respect to the Series J Bonds, October 1, 2014 with respect to theSeries K Bonds, October 1, 2014 with respect to the Series L Bonds, December 31, 2014 with respect tothe Series M Bonds, December 31, 2014 with respect to the Series N Bonds, December 31, 2014 withrespect to the Series O Bonds and September 2, 2014 with respect to the Series P Bonds.
“Prior Bonds” means, collectively, the Series A Bonds, the Series B Bonds, the Series C Bonds,the Series D Bonds, the Series E Bonds, the Series F Bonds, the Series G Bonds, the Series H Bonds andthe Series I Bonds.
“Prior Note” means, collectively, the Prior Other Senior Notes and the Prior Senior Notes.
“Prior Other Senior Notes” means the tax and revenue anticipation notes issued during FiscalYear 2013-2014 by King City Union School District separate from the Program, which mature on April 1,2014.
“Prior Senior Note” means the series of tax and revenue anticipation notes, if any, of a Districtpreviously issued by such District under the Program during its Fiscal Year 2013-2014.
“Proceeds Fund” means the fund by that name established in the Indenture.
“Proceeds Subaccounts” means the Proceeds Subaccounts created in the Proceeds Fund under theIndenture relating to a series of Notes.
“Program” means the California School Cash Reserve Program pursuant to which the Bonds areissued to assist Districts in financing cash flow deficits.
“Purchase Agreement” means, collectively, those certain Purchase Agreements by and betweenthe respective Districts and the Authority relating to the purchase of the applicable series of Notes.
“Purchaser” means Piper Jaffray & Co., as the underwriter and purchaser of the Bonds.
“Rating Agency” means Moody’s and S&P, or whichever one of them is then rating theapplicable series of Bonds.
“Resolutions” means the respective resolutions adopted by the governing boards of the Districts,as may be supplemented in certain cases, and, where applicable (and if a respective county elected to doso), in the case of a school district or community college district that is not fiscally accountable, therespective resolutions adopted by the county boards of supervisors, in each case authorizing the issuanceof the Notes and approving the execution and delivery of the Indenture and the Bonds.
“S&P” means Standard & Poor’s Ratings Services, a Standard & Poor’s Financial Services LLCbusiness, and its successors and assigns, except that if such corporation shall be dissolved or liquidated orshall no longer perform the functions of a securities rating agency, then the term “S&P” shall be deemedto refer to any other nationally recognized securities rating agency selected by the Authority.
“Series A Bonds” means, collectively, the 2013-2014 Senior Bonds, Series A in the aggregateprincipal amount of $43,860,000 and the 2013-2014 Subordinate Bonds, Series A, in the aggregateprincipal amount of $7,740,000 issued by the Authority on July 15, 2013.

A-6
“Series B Bonds” means, collectively, the 2013-2014 Senior Bonds, Series B in the aggregateprincipal amount of $26,795,000 and the 2013-2014 Subordinate Bonds, Series B, in the aggregateprincipal amount of $5,000,000 issued by the Authority on July 15, 2013.
“Series C Bonds” means the 2013-2014 Bonds, Series C in the aggregate principal amount of$84,125,000 issued by the Authority on July 15, 2013.
“Series D Bonds” means the 2013-2014 Bonds, Series D in the aggregate principal amount of$25,545,000 issued by the Authority on July 15, 2013.
“Series E Bonds” means the 2013-2014 Bonds, Series E in the aggregate principal amount of$4,890,000 issued by the Authority on July 15, 2013.
“Series F Bonds” means the 2013-2014 Bonds, Series F in the aggregate principal amount of$8,460,000 issued by the Authority on July 2, 2013.
“Series G Bonds” means the 2013-2014 Bonds, Series G in the aggregate principal amount of$39,050,000 issued by the Authority on July 15, 2013.
“Series H Bonds” means the 2013-2014 Bonds, Series H in the aggregate principal amount of$53,495,000 issued by the Authority on July 15, 2013.
“Series I Bonds” means the 2013-2014 Bonds, Series I in the aggregate principal amount of$28,265,000 issued by the Authority on July 15, 2013.
“Series J Bonds” means the 2013-2014 Bonds, Series J, being issued by the Authority in theaggregate principal amount of $59,655,000.
“Series J Notes” means the tax and revenue anticipation notes issued by the Districts in therespective principal amounts described in the Ninth Supplemental Indenture.
“Series K Bonds” means the 2013-2014 Bonds, Series K, being issued by the Authority in theaggregate principal amount of $59,255,000.
“Series K Notes” means the tax and revenue anticipation notes issued by the Districts in therespective principal amounts described in the Tenth Supplemental Indenture.
“Series L Bonds” means the 2013-2014 Bonds, Series L, being issued by the Authority in theaggregate principal amount of $34,055,000.
“Series L Notes” means the tax and revenue anticipation notes issued by the Districts in therespective principal amounts described in the Eleventh Supplemental Indenture.
“Series M Bonds” means the 2013-2014 Bonds, Series M, being issued by the Authority in theaggregate principal amount of $17,285,000.
“Series M Notes” means the tax and revenue anticipation notes issued by the Districts in therespective principal amounts described in the Twelfth Supplemental Indenture.
“Series N Bonds” means the 2013-2014 Bonds, Series N, being issued by the Authority in theaggregate principal amount of $2,795,000.

A-7
“Series N Note” means the tax and revenue anticipation note issued by the applicable District inthe principal amount described in the Thirteenth Supplemental Indenture.
“Series O Bonds” means the 2013-2014 Bonds, Series O, being issued by the Authority in theaggregate principal amount of $21,830,000.
“Series O Note” means the tax and revenue anticipation note issued by the applicable District inthe principal amount described in the Fourteenth Supplemental Indenture.
“Series P Bonds” means the 2013-2014 Bonds, Series P, being issued by the Authority in theaggregate principal amount of $7,165,000.
“Series P Note” means the tax and revenue anticipation note issued by the applicable District inthe principal amount described in the Fifteenth Supplemental Indenture.
“Supplemental Indenture” means any indenture approved by the Authority in accordance with theIndenture amending or supplementing the Indenture or any Supplemental Indenture, or providing for theissuance of Additional Bonds.
“Tenth Supplemental Indenture” means the Tenth Supplemental Indenture dated as of March 1,2014, by and between the Trustee and the Authority providing for the issuance of the Series K Bonds.
“Thirteenth Supplemental Indenture” means the Thirteenth Supplemental Indenture dated as ofMarch 1, 2014, by and between the Trustee and the Authority providing for the issuance of the Series NBonds.
“Trustee” means U.S. Bank National Association, a national banking association duly organizedand existing under and by virtue of the laws of the United States of America, at its corporate trust officein Los Angeles, California, or any other bank or trust company at its corporate trust office which may atany time be substituted in its place as Trustee as provided in the Indenture.
“Twelfth Supplemental Indenture” means the Twelfth Supplemental Indenture dated as ofMarch 1, 2014, by and between the Trustee and the Authority providing for the issuance of the Series MBonds.
“Underwriter” means Piper Jaffray & Co.
SUMMARY OF DISTRICT RESOLUTIONS
The following is a summary of certain provisions of the form of the Resolution adopted by eachDistrict not heretofore summarized under the caption “SECURITY AND SOURCE OF PAYMENT FORTHE BONDS” contained herein. Reference is made to each Resolution in its entirety for a full recital ofthe provisions thereof.
Disposition of Proceeds of Note
The moneys received from the sale of the Note allocable to such District’s share of the Costs ofIssuance shall be deposited in the applicable Costs of Issuance Account of the Costs of Issuance Fundcreated pursuant to and held and invested by the Trustee under the Indenture and shall be expended asdirected by the Authority on the Costs of Issuance as provided in the Indenture. The moneys receivedfrom the sale of the Note designated the “Deposit to Proceeds Subaccount” shall be deposited in such

A-8
District’s Proceeds Subaccount attributable to its Note created pursuant to, and held and invested by theTrustee under the Indenture for such District and may be used and expended by such District for anypurpose for which it is authorized to use and expend funds, upon requisition from such ProceedsSubaccount as specified in the Indenture. Subject to the provisions in each Resolution summarized underthe caption “SECURITY AND SOURCE OF PAYMENT FOR THE BONDS,” each District covenantsand agrees to replenish amounts on deposit in its Proceeds Subaccount attributable to its Note to theextent practicable from any source of available funds up to an amount equal to the unreplenishedwithdrawals from such Proceeds Subaccount attributable to such Note.
The Trustee shall transfer to the Payment Account of such District attributable to its Note fromamounts on deposit in the Proceeds Subaccount attributable to such Note on the first day of theRepayment Period applicable to such Note amounts which, taking into consideration anticipated earningsthereon to be received by the maturity date of its Note, are equal to the percentages of the principal andinterest due on its Note at maturity required to be on deposit therein for the Repayment Period applicableto the Notes as described under the caption “SECURITY AND SOURCE OF PAYMENT FOR THEBONDS—Note Repayment Period”; provided, however, that on the first day of the Repayment Period forsuch Note, the Trustee shall transfer all remaining amounts in such District’s Proceeds Subaccountattributable to its Note to its Payment Account attributable to its Note; provided further, however, thatwith respect to the transfer in such Repayment Period, if the amount on deposit in such ProceedsSubaccount attributable to its Note is less than the corresponding percentage for such Repayment Periodapplicable to such Note of the principal and interest due with respect to such Note at maturity, the Trusteeshall transfer to the Payment Account attributable to the Note of such District all amounts on deposit insuch Proceeds Subaccount attributable to its Note on the day designated for such Repayment Period.
Each District which issued a Prior Senior Note covenants and agrees, subject to its Resolution, toreplenish amounts on deposit in the Proceeds Subaccount attributable to its Note and the ProceedsSubaccount attributable to its Prior Senior Note in the following order of priority: first, the ProceedsSubaccount attributable to its Prior Senior Note and second, the Proceeds Subaccount attributable to itsNote.
Additional Payments
Each District agrees to pay, or cause to be paid, in addition to the amounts payable under its Noteand, if applicable, amounts payable under its Prior Senior Note, any fees or expenses of the Trustee, (i)arising out of an “Event of Default” under its Resolution or (ii) arising out of any other event (other thanan event arising solely as a result of or otherwise attributable to a default by any other District). In thecase described in (ii) above, each District shall owe only the percentage of such fees and expenses equalto the ratio of the Principal Amount of its Note over the aggregate Principal Amounts of all tax andrevenue anticipation notes assigned to the applicable series of Bonds issued by the Authority inconnection with such Note at the time of original issuance of such Bonds. Such additional amounts willbe paid by each District within 25 days of receipt by such District of a bill therefor from the Trustee.
No Joint Obligation; Bond Owners’ Rights
The Series J Note of each Series J District will be issued in conjunction with the Series J Notes ofother Series J Districts and will be assigned to a pool of the Series J Notes to secure the Series J Bonds.The Series K Note of each Series K District will be issued in conjunction with the Series K Notes of otherSeries K Districts and will be assigned to a pool of the Series K Notes to secure the Series K Bonds. TheSeries L Note of each Series L District will be issued in conjunction with the Series L Notes of otherSeries L Districts and will be assigned to a pool of the Series L Notes to secure the Series L Bonds. TheSeries M Note of each Series M District will be issued in conjunction with the Series M Notes of other

A-9
Series M Districts and will be assigned to a pool of the Series M Notes to secure the Series M Bonds.The Series N Note of the Series N District will be assigned to secure the Series N Bonds. The Series ONote of the Series O District will be assigned to secure the Series O Bonds. The Series P Note of theSeries P District will be assigned to secure the Series P Bonds. The obligation of each District to makepayment on its Note is a several and not a joint obligation and is strictly limited to such District’srepayment obligation under its Resolution and its Note.
Defaults and Remedies
Defaults. If any of the following events occurs under a Resolution, it is an “Event of Default”under such Resolution:
(a) failure by the District to make, or cause to be made, the deposits to its PaymentAccount related to its Note or, if applicable, to its Payment Account related to its Prior SeniorNote required to be made under its Resolution on or before the fifteenth day after the date onwhich such deposit is due and payable, or failure by the District to make or cause to be made anyother payment required to be paid under its Resolution on or before the date on which suchpayment is due and payable;
(b) failure by the District to observe and perform any covenant, condition oragreement on its part to be observed or performed under its Resolution, for a period of 15 daysafter written notice, specifying such failure and requesting that it be remedied, is given to suchDistrict by the Trustee, unless the Trustee shall agree in writing to an extension of such time priorto its expiration;
(c) any warranty, representation or other statement by or on behalf of the Districtcontained in its Resolution or its Purchase Agreement, or in any requisition delivered by suchDistrict or in any instrument furnished in compliance with or in reference to its Resolution or itsPurchase Agreement, or in connection with its Note or, if applicable, its Prior Senior Note, isfalse or misleading in any material respect;
(d) any event of default constituting a payment default occurs in connection with anyother bonds, notes or other outstanding debt of the District;
(e) a petition is filed against the District under any bankruptcy, reorganization,arrangement, insolvency, readjustment of debt, dissolution or liquidation law of any jurisdiction,whether now or hereafter in effect and is not dismissed within 30 days after such filing, but theTrustee shall have the right to intervene in the proceedings prior to the expiration of such 30 daysto protect its and the Bond owners’ (or Noteholders’) interests;
(f) the District files a petition in voluntary bankruptcy or seeking relief under anyprovision of any bankruptcy, reorganization, arrangement, insolvency, readjustment of debt,dissolution or liquidation law of any jurisdiction, whether now or hereafter in effect, or consentsto the filing of any petition against it under such law;
(g) the District admits insolvency or bankruptcy or is generally not paying its debtsas such debts become due, or becomes insolvent or bankrupt or makes an assignment for thebenefit of creditors, or a custodian (including without limitation a receiver, liquidator or trustee)of the District or any of its property is appointed by court order or appointed by the StateSuperintendent of Public Instruction or takes possession thereof and such order remains in effector such possession continues for more than 30 days, but the Trustee shall have the right to

A-10
intervene in the proceedings prior to the expiration of such 30 days to protect its and the Bondowners’ or Noteholders’ interests; and
(h) an “Event of Default” by the County under the terms of the resolution, if any, ofthe County providing for the issuance of the District’s Note or, if applicable, Prior Senior Note.
Remedies. Whenever any Event of Default shall have happened and be continuing under aResolution, the Trustee shall, in addition to any other remedies provided in the Resolution or by law orunder the Indenture, have the right, at its option without any further demand or notice, to take one or anycombination of the following remedial steps:
(a) without declaring the Note or, if applicable, the Prior Senior Note of thedefaulting District to be immediately due and payable, require such District to pay to the Trustee,for deposit into the Payment Account of such District attributable to its Note in the Bond PaymentFund under the Indenture (and, if applicable, the Payment Account applicable to the Prior SeniorNote), an amount equal to all of the principal of its Note and, if applicable, its Prior Senior Noteand interest thereon to maturity, plus all other amounts due under its Resolution, and upon noticeto such District, the same shall become immediately due and payable by such District withoutfurther notice or demand; and
(b) take whatever other action at law or in equity (except for acceleration of paymenton the Note and, if applicable, the Prior Senior Note of such District) which may appearnecessary or desirable to collect the amounts then due and thereafter to become due under theResolution or to enforce any other of its rights thereunder.
If any of the principal of and/or interest on a District’s Note remains unpaid after the maturitydate of the Note, such Note shall become a Defaulted Note, and the unpaid portion (including the interestcomponent, if applicable) thereof shall be deemed outstanding and shall bear interest at the Default Rateuntil the District’s obligation on the Defaulted Note is paid in full or payment is duly provided for, allsubject to such District’s Resolution.
Certain Representations and Covenants of the Districts
Each District has represented or covenanted under its Resolution, among other things, that:
(a) such District has (or will have prior to the issuance of its Note) duly, regularlyand properly adopted a budget for Fiscal Year 2013-2014 setting forth expected revenues andexpenditures and has (or will have prior to the issuance of its Note) complied with all statutoryand regulatory requirements with respect to the adoption of such budget, and the Districtcovenants that it will (i) duly, regularly and properly prepare and adopt its revised or final budgetfor Fiscal Year 2013-2014; (ii) provide to the Trustee and the Underwriter, promptly uponadoption, copies of such revised or final budget and of any subsequent revisions, modifications oramendments thereto; and (iii) comply with all applicable law pertaining to its budget;
(b) the county in which such District is located has experienced an ad valoremproperty tax collection rate of not less than 85% of the average aggregate amount of ad valoremproperty taxes levied within such District in each of the five fiscal years, from Fiscal Year 2007-2008 through Fiscal Year 2011-2012, and such District, as of the date of adoption of itsResolution and on the date of issuance of its Note and, if applicable, Prior Senior Note under theProgram, reasonably expects such county to have collected and to collect at least 85% of suchamount for Fiscal Years 2012-2013 and 2013-2014, respectively;

A-11
(c) such District (i) is not currently in default on any debt obligation; (ii) to the bestof its knowledge, has never defaulted on any debt obligation; and (iii) has never filed a petition inbankruptcy;
(d) such District’s most recent audited financial statements present fairly thefinancial condition of such District as of the date thereof and the results of operation for theperiod covered thereby, and except as has been disclosed to the Underwriter, there has been nochange in the financial condition of such District since the date of such audited financialstatements that will, in the reasonable opinion of such District, materially impair its ability toperform its obligations under its Resolution, its Note, and, if applicable, its Prior Senior Note;
(e) there is no action, suit, proceeding, inquiry or investigation, at law or in equity,before or by any court, arbitrator, governmental or other board, body or official, pending or, tothe best knowledge of such District, threatened against or affecting such District questioning thevalidity of any proceeding taken or to be taken by such District in connection with its Note, itsPrior Senior Note (if applicable), its Purchase Agreement, the Indenture or its Resolution, orseeking to prohibit, restrain or enjoin the execution, delivery or performance by such District ofany of the foregoing, or wherein an unfavorable decision, ruling or finding would have amaterially adverse effect on such District’s financial condition or results of operations or on theability of such District to conduct its activities as presently conducted or as proposed orcontemplated to be conducted or would materially adversely affect the validity or enforceabilityof, or the authority or ability of such District to perform its obligations under, its Note, and, ifapplicable, its Prior Senior Note (if applicable), its Purchase Agreement, the Indenture or itsResolution;
(f) such District will not directly or indirectly amend, supplement, repeal or waiveany portion of its Resolution in any way that would materially adversely affect the interests of theNoteholders or the Bond Owners provided, however, that such District may adopt one or moreSupplemental Resolutions without any such consents in order to increase the maximum amountof borrowing in connection with the issuance of one or more series of additional notes asprovided in the Resolution;
(g) such District will not incur any indebtedness that is not issued in connection withthe Program under its Resolution and that is secured by a pledge of its Unrestricted Revenuesunless such pledge is subordinate in all respects to the pledge of Unrestricted Revenues under itsResolution;
(h) so long as any Bonds are Outstanding applicable to such District’s Note, suchDistrict will not create or suffer to be created any pledge of or lien on its Note other than thepledge and lien of the Indenture;
(i) as of the date of adoption of its Resolution, based on the most recent reportprepared by the Superintendent of Public Instruction of the State, such District did not have anegative certification (or except as disclosed in writing, a qualified certification) applicable to theFiscal Year 2012-2013 within the meaning of Section 42133 of the California Education Code.Each District has covenanted that it will immediately deliver a written notice to the Authority, theUnderwriter and Bond Counsel if it (or, in the case of a County Board of Education, the CountySuperintendent of Schools) files with the County Superintendent of Schools, the County Board ofEducation or the State Superintendent of Public Instruction, or receives from the CountySuperintendent of Schools or the State Superintendent of Public Instruction, a qualified or
A-12
negative certification applicable to Fiscal Year 2012-2013 or Fiscal Year 2013-2014 prior to thematurity of its Note; and
(j) the District will maintain an investment policy consistent with the policy set forthin its Resolution.
Each District also covenants under its Resolution that it will not take any action or fail to take anyaction if such action or failure to take such action would adversely affect the exclusion from gross incomeof the interest payable on the applicable series of Bonds under Section 103 of the Code. Without limitingthe generality of the foregoing, each District will not make any use of the proceeds of its Note or anyother of its funds which would cause the applicable series of Bonds to be an “arbitrage bond” within themeaning of Section 148 of the Code, a “private activity bond” within the meaning of Section 141(a) of theCode, or an obligation the interest on which is subject to federal income taxation because it is “federallyguaranteed” as provided in Section 149(b) of the Code. Each District, with respect to the proceeds of itsNote (or any Bonds related thereto), will comply with all requirements of such sections of the Code andall regulations of the United States Department of the Treasury issued or applicable thereunder to theextent that such requirements are, at the time, applicable and in effect.
SUMMARY OF INDENTURE
The following is a summary of certain provisions of the Indenture not heretofore summarizedunder the captions “DESCRIPTION OF THE BONDS” and “SECURITY AND SOURCE OFPAYMENT FOR THE BONDS” contained herein. Reference is made to the Indenture in its entirety for afull recital of the provisions thereof. All capitalized words in the “SUMMARY OF INDENTURE,”unless otherwise defined herein, shall have the meanings set forth under the caption “DEFINITIONS OFCERTAIN TERMS” in this Appendix A, or if not defined thereunder, then as set forth in the Indenture.
Funds and Accounts
Under the Indenture, the Trustee agrees to establish and maintain, in trust, the Costs of IssuanceFund and therein a Costs of Issuance Account for each series of Bonds, the Proceeds Fund and therein theProceeds Subaccount attributable to each Note of each District, the Bond Payment Fund and therein thePayment Account attributable to each Note of each District, the Pool Interest Fund and therein the Series JInterest Account, the Series K Interest Account, the Series L Interest Account, the Series M InterestAccount, the Series N Interest Account, the Series O Interest Account and the Series P Interest Accountand the Pool Principal Fund and therein the Series J Principal Account, the Series K Principal Account,the Series L Principal Account, the Series M Principal Account, the Series N Principal Account, theSeries O Principal Account and the Series P Principal Account. If Additional Bonds are issued by theAuthority, the Trustee will establish accounts in such funds applicable to each series of Additional Bondsand each series of notes related thereto.
Costs of Issuance Fund
The moneys in each applicable Costs of Issuance Account shall be used and withdrawn by theTrustee to pay the Costs of Issuance of the corresponding series of Bonds upon receipt of (i) a Request ofthe Authority, which shall be sequentially numbered, stating the person to whom payment is to be made,the amount to be paid, the purpose for which the obligation was incurred and that such payment is aproper charge against said account; and (ii) an original invoice or invoices submitted by the FinancialAdvisor or evidence of the Financial Advisor’s payment of an invoice when such payment is inreimbursement thereof. On the earliest of July 1, 2014, or on such earlier date upon Request of theAuthority, amounts, if any, remaining in each Costs of Issuance Account related to each series of Bonds

A-13
(and not required to pay identified Costs of Issuance, including any additional fees or expenses of theTrustee) shall be transferred to the Bond Payment Fund and credited to the Payment Accounts thereinattributable to the applicable Notes in proportion to the amounts initially deposited in such Costs ofIssuance Account attributable to each District.
Proceeds Fund and Proceeds Subaccounts
All money in the Proceeds Fund shall be held by the Trustee in trust. Net proceeds of the Bondsdeposited in the Proceeds Fund shall be credited to the applicable Proceeds Subaccounts, one of whichshall be established for each Note of each of the Districts, initially in amounts set forth in the scheduleattached to the applicable Supplemental Indenture. Moneys in the Proceeds Subaccount related to theNote and, if applicable, moneys in the Proceeds Subaccount related to the Prior Senior Note of eachDistrict shall be disbursed to that District from time to time to but excluding the first day of, (i) withrespect to each Note, the first Repayment Period applicable to such Note (as set forth on the face of suchNote), and (ii) with respect to each Prior Senior Note, the last Repayment Period applicable to such PriorSenior Note (as set forth on the face of such Prior Senior Note), or if only one Repayment Period isapplicable to such Note or Prior Senior Note (if applicable), the first day of such Repayment Period, assoon as practical, pursuant to a Requisition of the District submitted in advance of the requesteddisbursement date, as required to comply with the disbursement provisions, if any, of PermittedInvestments in which such District has invested, as applicable, for any purpose for which the District isauthorized to expend moneys. Notwithstanding the foregoing, the Trustee shall not disburse any moneysfrom a Proceeds Subaccount if the Trustee has received written notice or actual knowledge that an Eventof Default has occurred and is continuing as defined in the Resolution of such District, or if the Trusteehas received written notification from the Financial Advisor that such District’s financial certificationunder the California Education Code has been downgraded from the financial certification held by theDistrict on the date the Bonds or the Prior Bonds, if applicable, were issued, except that if such Districtprovides a certification from the county superintendent or State Superintendent of Public Instruction, asapplicable, that repayment of such District’s Note and Prior Senior Note, if applicable, is probable isgiven, moneys may be disbursed if the downgrade is to a qualified certification.
Payments made by each District with respect to the Note and, if applicable, the Prior Senior Noteof that District prior to the first day of the first Repayment Period for such District’s Note or Prior SeniorNote, if applicable, shall be credited to that District’s Proceeds Subaccount applicable to the Note or PriorSenior Note, if applicable, and, except as otherwise specifically provided in the Indenture, shall beavailable for further disbursement to that District from time to time; provided, however, that paymentsmade with respect to the Note or Prior Senior Note, if applicable, shall, to the extent of any deficiencywith respect to payments due on its Note or Prior Senior Note, if applicable, of such District in anyRepayment Period applicable to its Note or Prior Senior Note, if applicable, be applied to such deficiencyand deposited in the deficient Payment Account in accordance with the priority provisions set forth insuch District’s Resolution, and such amount shall not be available for further disbursement to suchDistrict. A District shall not be allowed to deposit in its Proceeds Subaccounts applicable to its Note or, ifapplicable, its Prior Senior Note, an amount that exceeds the amount, if any, of its then unreplenishedwithdrawals from each such Proceeds Subaccount.
There shall be transferred to each District’s Payment Account applicable to its Note in the BondPayment Fund from the Proceeds Subaccount of each such District applicable to its Note (taking intoconsideration anticipated investment earnings thereon) (a) on the first day of each such District’sRepayment Periods designated for such Note (up to, but not including the last Repayment Period for suchDistrict) amounts which are equal to the percentages of the principal and interest due on such District’sNote at maturity for the corresponding Repayment Period as described under the caption “SECURITYAND SOURCE OF PAYMENT FOR THE BONDS—Note Repayment Period”; and (b) on the first day

A-14
of such District’s last Repayment Period designated for such Note an amount equal to the lesser of (i) theprincipal of and interest on that District’s Note less that District’s portion of amounts transferred to itsPayment Account from excess amounts in the applicable Costs of Issuance Account and less (withoutduplication) any amounts then on deposit in such District’s Payment Account for payment of its Note;and (ii) the total amount, if any, remaining in such District’s Proceeds Subaccount applicable to its Note.If on the first day of such District’s first Repayment Period designated for such Note the amount in suchDistrict’s Proceeds Subaccount applicable to the Note is less than the amount required to be transferred tothe Payment Account applicable to the Note of such District on such day, the Trustee shall transfer theentire amount in such District’s Proceeds Subaccount applicable to its Note to the corresponding PaymentAccount in the Bond Payment Fund on such day. Any amounts remaining in a Proceeds Subaccountapplicable to its Note after the amounts required to be transferred under the Indenture to the BondPayment Fund have been transferred, shall be returned to the District after the last day of the lastRepayment Period applicable to its Note.
Bond Payment Fund and Payment Accounts
All principal and interest payments on the Notes and, if applicable, the Prior Senior Notes shall bepaid directly by the Districts to the Trustee. All principal and interest payments on the Notes and, ifapplicable, the Prior Senior Notes received by the Trustee shall be held in trust by the Trustee under theterms of the Indenture and shall be deposited by it, as and when received, in the applicable PaymentAccount attributed to the corresponding Notes and, if applicable, Prior Senior Notes within the BondPayment Fund (except as otherwise provided in the Indenture and there is a deficiency in the PaymentAccount attributable to a District’s Prior Senior Note, if applicable), which fund the Trustee has agreed tomaintain so long as any Bonds applicable to such District’s Note or, if applicable, any Prior Bonds withrespect to such District’s Prior Senior Note are Outstanding, and all money in such fund shall be held intrust by the Trustee for the benefit and security of, with respect to the Payment Accounts applicable to theNotes, the Owners of the corresponding series of Bonds, and, if applicable, with respect to the PaymentAccounts applicable to the Prior Senior Notes and the registered owners of the corresponding series ofPrior Bonds, to the extent set forth in the Indenture.
Pursuant to each District’s Resolution, each District is required to deposit amounts with theTrustee in the periods identified as such District’s Repayment Periods (as defined in such District’sResolution and indicated on the face of such District’s Note and, if applicable, Prior Senior Notes) untilthe amount on deposit in such District’s Payment Account attributed to its Note, and, if applicable, insuch District’s Payment Account attributed to its Prior Senior Note, taking into consideration anticipatedinvestment earnings thereon to be received by the maturity date for such Note or, if applicable, PriorSenior Note, is equal to the percentages of the principal and interest due on such District’s Note or, ifapplicable, Prior Senior Note, required in such Repayment Period as indicated on the face of suchDistrict’s Note or Prior Senior Note, if applicable. See “SECURITY AND SOURCE OF PAYMENTFOR THE BONDS—Deposit and Pledge of Notes,” “—Prior Notes,” and “—Note Repayment Period”herein. If any District fails to make the required deposits, the Trustee shall as soon as practical (but in anyevent within three Business Days) notify such District of such failure. If the amount on deposit in aDistrict’s Payment Account attributable to its Note or, if applicable, in its Payment Account attributableto its Prior Senior Note is in excess of the amounts required to pay the principal of and interest due onsuch District’s Note or, if applicable, Prior Senior Note on the maturity date for such Note or Prior SeniorNote, if applicable, such excess amounts shall remain in such Payment Account and shall be transferred tosuch District following (1) payment of the corresponding series of Bonds, and (2) to the extent suchexcess amounts do not constitute proceeds of such Note or, if applicable, Prior Senior Note, payment ofany other Note of such District in accordance with the priority provisions set forth in such District’sResolution.

A-15
Notwithstanding any other provision of the Indenture, to the extent, on any interest payment dateor principal payment date applicable thereto, there is a deficiency with respect to its Note or, if applicable,its Prior Senior Note, and to the extent any payment on its Note or, if applicable, its Prior Senior Note isbeing made from moneys other than proceeds of such Note or, if applicable, Prior Senior Note, theTrustee shall apportion all such payments received from such District relating to its Note or, if applicable,its Prior Senior Note in accordance with the priority provisions set forth in such District’s Resolution.See “SECURITY AND SOURCE OF PAYMENT FOR THE BONDS—The Notes” and “—Deposit andPledge of Notes.”
Pool Interest Fund and Pool Principal Fund
The Trustee shall, after making any apportionments required by the Indenture among PaymentAccounts of a District applicable to its Note and, if applicable, its Prior Senior Note, transfer the moneycontained in the applicable Payment Accounts in the Bond Payment Fund attributable to the Notes at thefollowing respective times to the following respective funds and accounts in the manner described below,each of which funds and accounts the Trustee has agreed to maintain for so long as any of the applicableseries of Bonds are Outstanding, and the money in each of such funds and accounts shall be disbursedonly for the purposes and uses authorized.
(a) Interest Account in the Pool Interest Fund. The Trustee, on each InterestPayment Date, shall deposit in the applicable Interest Account in the Pool Interest Fund thatamount of money representing the interest becoming due and payable on the corresponding seriesof Bonds on such Interest Payment Date. All moneys in such Interest Account in the PoolInterest Fund shall be used and withdrawn by the Trustee solely for the purpose of paying theinterest on the corresponding series of Bonds on the applicable Interest Payment Date.
(b) Principal Account in the Pool Principal Fund. The Trustee, at maturity, shall,after having made any transfers required to be made pursuant to (a) above, deposit in theapplicable Principal Account in the Pool Principal Fund that amount of money representing theprincipal becoming due and payable on the corresponding series of Bonds at maturity. Allmoneys in such Principal Account in the Pool Principal Fund shall be used and withdrawn by theTrustee solely for the purpose of paying the principal of the corresponding series of Bonds atmaturity.
Defaults and Remedies
Action on Default. If any default in the payment of principal of or interest on a Note or, ifapplicable, a Prior Senior Note, or any other “Event of Default” defined in a Resolution shall occur and becontinuing, then such default shall constitute an “Event of Default” under the Indenture, and in each andevery such case during the continuance of such Event of Default the Trustee or, the Owners and registeredowners of not less than a majority in aggregate principal amount of the corresponding series of Bonds andPrior Bonds, if applicable, at the time Outstanding shall be entitled, upon notice in writing to suchDistrict, to exercise the remedies provided to the owner of the Note or the Prior Senor Note, if applicable,then in default or under the Resolution pursuant to which it was issued.
Other Remedies of the Trustee. The Trustee shall have the right:
(a) by mandamus or other action or proceeding or suit at law or in equity to enforceits rights against any District or any trustee, member, officer or employee thereof, and to compelsuch District or any such trustee, member, officer or employee thereof to observe or perform itsor his duties under applicable law and the agreements, conditions, covenants and terms contained

A-16
in the Indenture, or in the applicable Note or, if applicable, Prior Senior Note and Resolution,required to be observed or performed by it or him;
(b) by suit in equity to enjoin any acts or things which are unlawful or violate therights of the Trustee, the Owners or the registered owners of the Prior Bonds and AdditionalBonds, if any; or
(c) by suit in equity upon the happening of any default under the Indenture to requireany District and any trustee, member, officer and employee thereof to account as the trustee ofany express trust.
Nonwaiver. A waiver by the Trustee of any default under the Indenture or breach of anyobligation under the Indenture shall not affect any subsequent default under the Indenture or anysubsequent breach of an obligation under the Indenture or impair any rights or remedies on any suchsubsequent default thereunder or on any such subsequent breach of an obligation thereunder. No delay oromission by the Trustee to exercise any right or remedy accruing upon any default under the Indentureshall impair any such right or remedy or shall be construed to be a waiver of any such default thereunderor an acquiescence therein, and every right or remedy conferred upon the Trustee by applicable law or bythe Indenture may be enforced and exercised from time to time and as often as shall be deemed expedientby the Trustee.
If any action, proceeding or suit to enforce any right or to exercise any remedy is abandoned ordetermined adversely to the Trustee, the Authority or the Districts, then such parties shall be restored totheir former positions, rights and remedies as if such action, proceeding or suit had not been brought ortaken.
Application of Funds. All moneys received by the Trustee pursuant to any right given or actiontaken under the provisions set forth under the caption “SUMMARY OF INDENTURE—Defaults andRemedies” shall be apportioned by the Trustee, after payment of the Trustee’s compensation and otherfees of the Trustee, in accordance with the priority provisions set forth in the applicable District’sResolution. Each such apportioned payment shall be deposited into the segregated Payment Accountsattributable to the corresponding series of Notes and Prior Senior Notes, as applicable, of the defaultingDistrict in the Bond Payment Fund and shall be applied by the Trustee in the following order uponpresentation of the several affected series of Bonds, Prior Bonds and other series of Additional Bonds, asapplicable, and the stamping thereon of the payment if only partially paid, or upon the surrender thereof iffully paid:
FIRST, to the payment of the costs and expenses of the Trustee and of the Owners andregistered owners of Prior Bonds and Additional Bonds in declaring such Event of Default,including reasonable compensation to its or their agents, attorneys and counsel;
SECOND, to the payment to the persons entitled thereto of all payments of interest on theapplicable series of Bonds, Prior Bonds, or Additional Bonds then due in the order of the due dateof such payments and, if the amount available shall not be sufficient to pay in full any payment orpayments coming due on the same date, then to the payment thereof ratably, according to theamounts due thereon, to the persons entitled thereto, without any discrimination or preference;and
THIRD, to the payment to the persons entitled thereto of the unpaid principal of theapplicable series of Bonds, Prior Bonds, or Additional Bonds which shall have become due, in theorder of their due dates, with interest on the overdue principal and interest on the applicable series

A-17
of Bonds, Prior Bonds, or Additional Bonds at a rate equal to the applicable Default Rate and, ifthe amount available shall not be sufficient to pay in full all the amounts due with respect to theapplicable series of Bonds, Prior Bonds, or Additional Bonds on any date, together with suchinterest, then to the payment thereof ratably, according to the amounts of principal due on suchdate to the persons entitled thereto, without any discrimination or preference;
provided, that the Trustee shall follow the instructions contained in an Opinion of Counsel provided bythe Authority and rebate or set aside for rebate from the specified funds held under the Indenture anyamount pursuant to such instructions required to be paid to the United States of America under the Code.
Remedies Not Exclusive. No remedy conferred in the Indenture upon or reserved therein to theTrustee is intended to be exclusive, and all remedies shall be cumulative and each remedy shall be inaddition to every other remedy given thereunder or now or hereafter existing under applicable law orequity or by statute or otherwise and may be exercised without exhausting and without regard to any otherremedy conferred by any other applicable law.
Exercise of Remedies
Upon the exercise by the requisite number of Owners and registered owners of the Prior Bondsand the Additional Bonds, the Trustee of its right of action to institute suit directly against a District toenforce payment of a Note or Prior Senior Note, as applicable, any moneys recovered by such action shallbe deposited with the Trustee and applied as provided above under “—Application of Funds.”
Limited Liability of the Authority
Except as expressly provided in the Indenture, the Authority shall not have any obligation orliability to the Trustee or the Owners with respect to the payment when due of the Notes by the Districts,or with respect to the observance or performance by the Districts of the other agreements, conditions,covenants and terms contained in the Notes and the Resolutions, or with respect to the performance by theTrustee of any obligation contained in the Indenture required to be performed by it.
Limited Liability of the Districts
Except as expressly provided in the respective Notes and the Resolutions, the Districts shall nothave any obligation or liability to the Authority, the Trustee, or the Owners of the Bonds with respect tothe Indenture or the preparation, execution, delivery, transfer, exchange or cancellation of the Bonds orthe receipt, deposit or disbursement of the principal of and interest on the Notes by the Trustee, or withrespect to the performance by the Trustee of any obligation contained in the Indenture required to beperformed by it.
Notwithstanding anything to the contrary in the Indenture or in any Note or documentreferred to therein, no District shall incur any obligation thereunder except to the extent payablefrom unencumbered revenues attributable to Fiscal Year 2013-2014, nor shall any District incurany obligation on account of any default, action or omission of any other District.
Limited Liability of the Trustee
Except as expressly provided in the Indenture, the Trustee shall not have any obligation orliability to the Owners with respect to the payment when due of the Notes by the Districts, or with respectto the observance or performance by the Districts of the other agreements, conditions, covenants andterms contained in the Notes and the Resolutions.
A-18
Amendment or Supplement of Indenture
The Indenture and the rights and obligations of the Owners and the Trustee under the Indenturemay be amended or supplemented at any time by an amendment thereof or supplement thereto whichshall become binding when the written consents of the Owners and the registered owners of the PriorBonds and the Additional Bonds of a majority in aggregate principal amount of the Bonds, the PriorBonds and the Additional Bonds then outstanding are filed with the Trustee. No such amendment orsupplement shall: (i) reduce the rate of interest on any Bond or extend the time of payment thereof orreduce the amount of principal of any Bond or extend the Maturity Date thereof or modify the paymentpriority for any Bond without the prior written consent of the Owner of the Bond so affected; (ii) reducethe percentage of Owners and registered owners of the Prior Bonds and the Additional Bonds whoseconsent is required by the terms of the Indenture for the execution of certain amendments thereof orsupplements thereto; or (iii) modify any of the rights or obligations of the Trustee without the Trustee’sprior written consent thereto.
The Indenture and the rights and obligations of the Owners, the registered owners of the PriorBonds and the Additional Bonds and the Trustee thereunder may also be amended or supplemented at anytime by an amendment thereof or supplement thereto, but without the written consents of any Owners orregistered owners of the Prior Bonds and the Additional Bonds in order to make any modifications orchanges to certain exhibits to the Indenture or to make any modifications or changes necessary orappropriate in the Opinion of Counsel to preserve or protect the exclusion from gross income of intereston any or all of the Bonds, the Prior Bonds and Additional Bonds for federal income tax purposes or, butonly to the extent that such amendment shall not materially adversely affect the interests of the Ownersand the registered owners of the Prior Bonds and the Additional Bonds for any purpose including, withoutlimitation, one or more of the following purposes:
(a) to add to the agreements, conditions, covenants and terms contained in theIndenture required to be observed or performed by the Authority, other agreements, conditions,covenants and terms thereafter to be observed or performed by the Authority, or to surrender anyright reserved in the Indenture to or conferred therein on the Authority;
(b) to make such provisions for the purpose of curing any ambiguity or of correcting,curing or supplementing any defective provision contained in the Indenture or in regard toquestions arising thereunder which the Authority may deem desirable or necessary; or
(c) to modify, amend or supplement the Indenture or any supplement thereto in suchmanner as to permit the qualification thereof under the Trust Indenture Act of 1939, as amended,or any similar federal statute hereafter in effect or to permit the qualification of the Bonds, thePrior Bonds or Additional Bonds for sale under the securities laws of the United States ofAmerica or of any of the states of the United States of America and, if the Authority or BondCounsel so determine, to add to the Indenture or any supplement thereto such other terms,conditions and provisions as may be permitted by said Trust Indenture Act of 1939, as amended,or similar federal statute.
The Indenture and the rights and obligations of the Owners, the registered owners of the PriorBonds and the Additional Bonds and the Trustee under the Indenture may also be amended orsupplemented at any time by an amendment thereof or supplement thereto which shall become bindingupon execution without the prior written consent of any Owners, for the purpose of issuing and securingone or more series of Additional Bonds, if any.

A-19
Defeasance
If the Trustee shall pay or cause to be paid or there shall otherwise be paid to the Owners of allOutstanding Bonds of a series the interest and principal thereof at the times and in the manner provided insuch series of Bonds and the Indenture, then such Owners shall cease to be entitled to the pledge of andlien on the Notes and Note payments applicable thereto and any interest in the funds held under theIndenture as provided therein, and all agreements and covenants of the Authority to such Owners underthe Indenture shall thereupon cease, terminate and become void and shall be discharged and satisfied
Any Outstanding Bonds shall on their Maturity Date be deemed to have been paid within themeaning of and with the effect expressed in the preceding paragraph if there shall be on deposit with theTrustee moneys which are sufficient to pay the interest on and principal of such Bonds payable on andprior to their Maturity Date.
Any Outstanding Bonds shall prior to their Maturity Date be deemed to have been paid within themeaning of and with the effect expressed in the second preceding paragraph if there shall have beendeposited with the Trustee either moneys in an amount which shall be sufficient or United States Treasurybills, notes, bonds or certificates of indebtedness, or obligations for which the full faith and credit of theUnited States of America are pledged for the payment of interest and principal, and which are purchasedwith moneys and are not subject to redemption except by the holder thereof prior to maturity (includingany such securities issued or held in book entry form on the books of the Department of the Treasury ofthe United States of America), the interest on and principal of which when paid will provide moneywhich, together with the moneys, if any, deposited with the Trustee at the same time, shall be sufficient,in the opinion of an independent certified public accountant delivered to the Trustee, to pay when due theinterest on such Bonds and the principal of such Bonds on the applicable Maturity Date.
After the payment of the interest on and principal of all Outstanding Bonds as provided in thissection, at the Request of the Authority (if provided), the Trustee shall execute and deliver to theAuthority and the Districts all such instruments as they may deem necessary or desirable to evidence thedischarge and satisfaction of the Indenture, and the Trustee shall pay over or deliver to the Districts allmoney or deposits or investments held by it pursuant to the Indenture (except for moneys held in theRebate Fund) which are not required for the payment of the interest on and principal of such Bonds.
Notwithstanding anything to the contrary in the Indenture, the Indenture shall not be dischargeduntil all Prior Bonds, the Bonds and Additional Bonds have been paid or deemed to have been paid in thesame manner as the Bonds as described above.
Investments
Any money held by the Trustee in each Payment Account and each Proceeds Subaccountattributable to the Bonds and the Prior Bonds shall be invested by the Trustee, to the fullest extentpracticable, upon the Request of any District, with respect to the corresponding Proceeds Subaccount orPayment Account, in Permitted Investments which will mature on or before the dates on which suchmoney is anticipated to be needed for disbursement under the Indenture. The Trustee may act as principalor agent in the acquisition or disposition of any such deposit or investment and may at its sole discretion,for the purpose of any such deposit or investment, except as otherwise set forth in the Indenture,commingle any of the money held by it under the Indenture. The Trustee shall not be liable orresponsible for any loss suffered in connection with any such deposit or investment made by it under theterms of and in accordance with the Indenture. To the extent the Trustee has not received any instructionwith respect to the investment of funds in a Payment Account or a Proceeds Subaccount, such amountsshall be invested by the Trustee in a money market fund offered by the Trustee or any of its affiliates

A-20
meeting the requirements set forth in clause (d) of the definition of Permitted Investments. The amountsheld in the several Payment Accounts and Proceeds Subaccounts will be accounted for separately for therespective Districts. The Trustee may present for redemption or sell any such deposit or investmentwhenever it shall be necessary in order to provide money to meet any payment of the money so depositedor invested, and the Trustee shall not be liable or responsible for any losses resulting from any suchdeposit or investment presented for redemption or sold. Any interest or profits on such deposits andinvestments received by the Trustee shall be credited to the fund or account from which such investmentwas made.
Moneys held by the Trustee in the Costs of Issuance Fund, Pool Principal Fund and the PoolInterest Fund shall be invested in Permitted Investments as directed by the Authority.
Removal and Resignation of Trustee
The Authority may at any time remove the Trustee by giving written notice of such removal bymail to the Trustee, all of the Districts, all Owners of Bonds and registered owners of the Prior Bonds andthe Additional Bonds and the Trustee may at any time resign by giving written notice by mail of suchresignation to the Districts, all Owners of Bonds and registered owners of the Prior Bonds and AdditionalBonds, if any. Upon giving any such notice of removal or upon receiving any such notice of removal orresignation, the Authority shall promptly appoint a successor Trustee by an instrument in writing;provided that if the Authority does not appoint a successor Trustee within 60 days following the giving ofany such notice of removal or the receipt of any such notice of resignation, the removed or resigningTrustee may petition any appropriate court having jurisdiction to appoint a successor Trustee. Anysuccessor Trustee shall be a commercial bank with trust powers or trust company in good standing, doingbusiness and having a principal corporate trust office either in Los Angeles or San Francisco, California,having a combined capital (exclusive of borrowed capital) and surplus of at least $75,000,000 and subjectto supervision or examination by state or national authorities.
Any removal or resignation of a Trustee and appointment of a successor Trustee shall becomeeffective only when the Trustee has provided written acceptance of its appointment to the Authority.
APPENDIX B
GENERAL DISTRICT FINANCIAL INFORMATION
The information in this Appendix concerning certain financial information related to schooldistricts and community college districts is provided as supplementary information only, and it should notbe inferred from the inclusion of this information in this Official Statement that the principal of or intereston the Notes is expected to be paid from sources other than the Pledged Revenues, including the DeferredRevenues, for deposits required to be made after June 30, 2014. See “SECURITY AND SOURCE OFPAYMENT FOR THE BONDS—Deferred Revenues” herein.
Sources of Funds—School Districts
General. On average, school districts in the State have historically received most of their incomeunder a formula known as the “State Revenue Limit.” This apportionment, the majority of which hashistorically been funded by State apportionments of basic and equalization aid with the remainder fundedby local property taxes was allocated to the school districts based on a revenue limit per unit of theaverage daily attendance (“ADA”) of the school districts. ADA is determined by school districts twice ayear, in December (“First Period ADA”) and April (“Second Period ADA”). Generally, the Stateapportionment amounted to the difference between a district’s revenue limit and its actual local propertytax receipts (after any redevelopment agency tax increment or other deductions or “shifts” that may be ineffect under State law).
Historically, approximately 57% of all money for public education comes from the State budget,and about 22% from local property taxes. The Legislature and the State governor (the “Governor”)determine the total from both sources annually. See “—Constitutional and Statutory Provisions AffectingSchool District Revenues and Appropriations” for a more detailed discussion on Proposition 13.Statewide, about 8% of school districts’ revenues come from the federal government, and about 6% comefrom local miscellaneous sources. The latter category includes such small items as food sales, moneyfrom debt repayment, interest on reserves and, in some cases, such larger items as developer fees andparcel taxes. Many school districts seek grants or contributions, which are sometimes channeled throughprivate foundations established to solicit donations from local families and businesses.
Each district receives a portion of the local property taxes collected within the district boundaries.This amount has been compared to the total revenue limit for the district; the balance was received in theform of State aid. Therefore, the sum of the property taxes and State aid was equal to the district’srevenue limit. Districts which receive the minimum amount of State aid have been known as “basic aid”districts. All other districts have been known as “revenue limit” districts. Upon the implementation ofthe 2013-2014 State Budget, basic aid districts will have local property tax collections that equal orexceed such districts’ LCFF (defined below) target allocation (see “—Local Control Funding Formula”herein for a description thereof), and will receive no State apportionment aid.
Local Control Funding Formula. State Assembly Bill 97 (Chapter 47, Statutes of 2013) (“A.B.97”), enacted as part of the 2013-2014 State Budget, establishes a new system for funding school districts,charter schools and county offices of education. This new system replaces the revenue limit fundingsystem for determining State apportionments, as well as the majority of categorical program funding. Thenew system can also affect whether a district qualifies as a basic aid or revenue limit district.
The primary component of A.B. 97 is the implementation of the Local Control Funding Formula(“LCFF”). Beginning in Fiscal Year 2013-2014, the bulk of funding for school districts will be provided
B-2
on the basis of target base funding grants per unit of ADA (each, a “Base Grant”) assigned to each of fourgrade spans. Each Base Grant is subject to certain adjustments, as further described herein. According toa report published by the State Legislative Analyst’s Office, the State general fund cost of fullyimplementing the LCFF in Fiscal Year 2013-2014 would have been approximately $18 billion more thanwhat was spent on education in the prior fiscal year (assuming current levels of property tax revenue,ADA and enrollment). Given this cost, the LCFF will be implemented over a span of eight fiscal years,during which time school districts will receive annual funding increases based on the gap between theirrespective prior-year funding level and the target LCFF allocation following full implementation. In eachyear, each school district is expected to see the same proportion of their funding gap closed, with dollaramounts varying depending on the size of district’s funding gap. The State cost to fund the LCFF in eachfiscal year will fluctuate depending on a number of factors, including the provision of cost of livingadjustments (“COLAs”), fluctuations in ADA and student demographics, and growth in property taxrevenues.
The specific Base Grants, per unit of ADA, for each grade span are as follows: (i) $6,845 forgrades K-3; (ii) $6,947 for grades 4-6; (iii) $7,154 for grades 7-8; and (iv) $8,289 for grades 9-12. Thedifferences among Base Grants are linked to differentials in the Fiscal Year 2012-2013 statewide averagerevenue limit rates by district type, and are intended to recognize the generally higher costs of educationat higher grade levels.
The Base Grants for grades K-3 and 9-12 are subject to adjustments of 10.4% and 2.6%,respectively, to cover the costs of class size reduction in early grades and support college and careerreadiness programs in high schools. As adjusted, the Base Grants per unit of ADA for grades K-3 and 9-12 are $7,557 and $8,505, respectively. Following full implementation of the new funding system, andunless otherwise collectively bargained for, school districts serving students in grades K-3 must maintainan average class enrollment of 24 or fewer students in grades K-3 at each school site in order to continuereceiving the adjustment to the K-3 Base Grant. Such school districts must also make progress towardsthis class size reduction goal in proportion to the growth in their funding over the implementation period.Supplemental funds derived from the adjustment to the Base Grant for grades 9-12 must be spent toadvance college and career readiness goals outlined in the respective district’s LCAP (as defined herein).
School districts that serve students of limited English proficiency (“EL” students), students fromlow income families that are eligible for free or reduced priced meals (“LI” students) and foster youth areeligible to receive additional funding grants. Enrollment counts are unduplicated, such that students maynot be counted as both EL and LI. Foster youth automatically meet the eligibility requirements for free orreduced priced meals, and are therefore not discussed herein separately. A.B. 97 authorizes asupplemental grant add-on (each, a “Supplemental Grant”) for school districts that serve EL/LI students,equal to 20% of the applicable adjusted Base Grant multiplied by such districts’ percentage ofunduplicated EL/LI student enrollment. In addition, school districts whose EL/LI populations exceed55% of their total enrollment are eligible for a concentration grant add-on (each, a “Concentration Grant”)equal to 50% of the applicable adjusted Base Grant multiplied the percentage of such district’sunduplicated EL/LI student enrollment in excess of the 55% threshold.
For certain school districts that would have received greater funding levels under the priorrevenue limit system, A.B. 97 provides for a permanent economic recovery target (“ERT”) add-on, equalto the difference between the revenue limit allocations such districts would have received under the priorsystem in Fiscal Year 2020-2021, and the target LCFF allocations owed to such districts in the same year.To derive the projected funding levels, A.B. 97 assumes the discontinuance of deficit revenue limitfunding, implementation of a 1.94% COLA in Fiscal Years 2014-2015 through 2020-2021, andrestoration of categorical funding to pre-recession levels. The ERT add-on will be paid incrementallyover the eight-year implementing period of the LCFF.

B-3
The sum of a school district’s adjusted Base, Supplemental and Concentration Grants will bemultiplied by such district’s P-2 ADA for the current or prior year, whichever is greater (with certainadjustments applicable to small school districts). This funding amount, together with any applicable ERTor categorical block grant add-ons, will yield a district’s total LCFF allocation. Generally, the amount ofannual State apportionments received by a school district will amount to the difference between such totalLCFF allocation and such district’s share of applicable local property taxes. Most school districts receivea significant portion of their funding from such State apportionments. As a result, decreases in Staterevenues may significantly affect appropriations made by the Legislature to school districts.
Certain schools districts, known as “basic aid” districts, have allocable local property taxcollections that equal or exceed such districts’ total LCFF allocation, and result in the receipt of no Stateapportionment aid. Basic aid school districts receive only special categorical funding, which is deemed tosatisfy the “basic aid” requirement of $120 per student per year guaranteed by Article IX, Section 6 of theState Constitution. The implication for basic aid districts is that the legislatively determined allocationsto school districts, and other politically determined factors, are less significant in determining theirprimary funding sources. Rather, property tax growth and the local economy are the primarydeterminants.
Accountability. The State Board of Education (“SBE”) is required to promulgate regulations onor before January 31, 2014 regarding the expenditure of supplemental and concentration funding. Theseregulations will include a requirement that school districts increase or improve services for EL/LI studentsin proportion to the increase in funds apportioned to such districts on the basis of the number andconcentration of such EL/LI students, as well as the conditions under which school districts can usesupplemental or concentration funding on a school-wide or district-wide basis.
School districts are also required to adopt local control and accountability plans (“LCAPs”)disclosing annual goals for all students, as well as certain numerically significant student subgroups, to beachieved in eight areas of State priority identified by A.B. 97. LCAPs may also specify additional localpriorities. LCAPs must specify the actions to be taken to achieve each goal, including actions to correctidentified deficiencies with regard to areas of State priority. LCAPs are required to be adopted everythree years, beginning in Fiscal Year 2014-2015, and updated annually thereafter. The SBE is required todevelop and adopt a template LCAP on or before March 31, 2014 for use by school districts.
Support and Intervention. A.B. 97 establishes a new system of support and intervention to assistschool districts meet the performance expectations outlined in their respective LCAPs. School districtsmust adopt their LCAPs (or annual updates thereto) in tandem with their annual operating budgets, andnot later than five days thereafter submit such LCAPs or updates to their respective countysuperintendents of schools. On or before August 15 of each year, a county superintendent may seekclarification regarding the contents of a district’s LCAP (or annual update thereto), and the district isrequired to respond to such a request within 15 days. Within 15 days of receiving such a response, thecounty superintendent can submit non-binding recommendations for amending the LCAP or annualupdate, and such recommendations must be considered by the respective school district at a publichearing within 15 days. A district’s LCAP or annual update must be approved by the countysuperintendent by October 8 of each year if the superintendent determines that (i) the LCAP or annualupdate adheres to the SBE template, and (ii) the district’s budgeted expenditures are sufficient toimplement the actions and strategies outlined in the LCAP.
A school district is required to receive additional support if its respective LCAP or annual updatethereto is not approved, if the district requests technical assistance from its respective countysuperintendent, or if the district does not improve student achievement across more than one State priorityfor one or more student subgroups. Such support can include a review of a district’s strengths and

B-4
weaknesses in the eight State priorities, or the assignment of an academic expert to assist the district toidentify and implement programs designed to improve outcomes. Assistance may be provided by theCalifornia Collaborative for Educational Excellence, a state agency created by A.B. 97 and charged withassisting school districts to achieve the goals set forth in their LCAPs. On or before October 1, 2015, theSBE is required to develop rubrics to assess school district performance and the need for support andintervention.
A.B. 97 also authorizes the State Superintendent of Public Instruction (the “StateSuperintendent”), with the approval of the SBE, to intervene in the management of persistentlyunderperforming school districts. The State Superintendent may intervene directly or assign an academictrustee to act on his or her behalf. In so doing, the State Superintendent is authorized to (i) modify adistrict’s LCAP, (ii) impose budget revisions designed to improve student outcomes, and (iii) stay orrescind actions of the local governing board that would prevent such district from improving studentoutcomes; provided, however, that the State Superintendent is not authorized under A.B. 97 to rescind anaction required by a local collective bargaining agreement.
In addition to State allocations determined pursuant to the LCFF, the school districts receive otherState revenues consisting primarily of restricted revenues designed to implement State mandatedprograms. Beginning in Fiscal Year 2013-2014, categorical spending restrictions associated with amajority of State mandated programs were eliminated, and funding for these programs was folded into theLCFF. Categorical funding for 14 programs was excluded from the LCFF—including, among others,child nutrition, after school education and safety, special education, and State preschool—and schooldistricts will continue to receive restricted State revenues to fund these programs.
Other Revenue Sources. A small part of a school district’s budget is from local sources otherthan property taxes, such as developer fees, interest income, donations and sales of property. The rest of aschool district’s budget comes from categorical funds provided exclusively by the State and federalgovernment. These funds are to be used for specific programs and typically cannot be used for any otherpurpose (“Categorical Funds”). See, however, the discussion above under “—Support and Intervention”about the elimination of a majority of State mandated programs which are being folded into the LCFF.
Those few school districts that still have unused school buildings or sites can lease or sell themfor miscellaneous income. Since January 1987, school districts have been able to levy a fee on newresidential or commercial development within their boundaries to finance the construction or renovationof school facilities.
A significant number of school districts have secured the required two-thirds approval from localvoters to levy special taxes on parcels or residences. A significant number of other districts have wonvoter approval, with either a two-thirds vote or a 55% majority, to sell general obligation bonds or toestablish special taxing districts for the construction of schools. Use of such taxes is restricted by law.
The final revenue source is the State Lottery. Approved by voters in late 1984, the lotterygenerates less than 2% of total school revenues. Every school district receives the same amount of lotteryfunds per pupil from the State; however, these are not Categorical Funds as they are not for particularprograms or children. Such funds may be spent for instructional but not capital purposes, with 50% of theincrease in State Lottery revenues over 1997-98 levels restricted to use on instructional materials.
No other source of general purpose revenue is currently permitted for schools. Proposition 13eliminated the possibility of raising additional property taxes for general school support, and State courtshave declared that fees may not be charged for school-related activities (other than for busing services).

B-5
Sources of Funds—Community College Districts
Historically, California community college districts (other than Basic Aid Districts, as describedbelow) have received, on average, approximately 52% of their funds from the State, 44% from localsources, and 4% from federal sources. State funds include general apportionment, Categorical Funds,capital construction, the State lottery (which is less than 3%), and other minor sources. Local fundsinclude property taxes, student fees, and miscellaneous sources.
In the past, a community college district determined its revenue allocation using a program basedmodel which was instituted in 1991. A bill passed by the Legislature (“SB 361”) and signed by theGovernor on September 29, 2006, established a new community college funding system with immediateeffect. The new system includes allocation of state general apportionment revenues to community collegedistricts based on criteria developed by the Board of Governors of the California Community Colleges(the “Board of Governors”) in accordance with prescribed statewide minimum requirements. Inestablishing these minimum requirements, the Board of Governors will be required to acknowledge theneed of each community college district to receive an annual allocation based on the number of collegesand comprehensive centers in each such district, plus funding received based on the number of credit andnoncredit full time equivalent students (“FTES”) in such district.
SB 361 also specifies that, commencing with Fiscal Year 2006-2007, the minimum funding perFTES will be: (a) not less than $4,367 per credit FTES (subject to cost of living adjustments fundedthrough the budget act in subsequent fiscal years); (b) at a uniform rate of $2,626 per noncredit FTES(adjusted for the change in cost of living provided in the budget act in subsequent fiscal years); and (c) setat $3,092 per FTES (adjusted for the change in cost of living provided in the budget act in subsequentfiscal years) for a new instructional category of “career development and college preparation.” Pursuantto SB 361, the Chancellor of the California Community Colleges (the “Chancellor”) will develop criteriafor one-time grants for districts that would have received more funding under the prior system or aproposed rural college access grant, than under the new system.
Local revenues are first used to satisfy community college district expenditures. The major localrevenue source is local property taxes that are collected from within such district’s boundaries. Studentenrollment fees from the local community college district generally account for the remainder of localrevenues for such district. Property taxes and student enrollment fees are applied towards fulfilling suchdistrict’s financial needs. Once these sources are exhausted, State funds are used. State aid is subject tothe appropriation of funds in the State’s annual budget. Decreases in State revenues may affectappropriations made by the Legislature to such district. A district’s Revenue Limit generally comprisesthe property taxes, student enrollment fees, and State aid received by such district.
“Basic Aid” community college districts are those districts whose local property tax and studentenrollment fee collections exceed the revenue allocation determined by the program based model. Basicaid districts do not receive any funds from the State. The current law in California allows these districtsto keep the excess funds without penalty. The implication for Basic Aid Districts is that the legislativelydetermined annual cost of living adjustment and other politically determined factors are less significant indetermining such districts’ primary funding sources. Rather, property tax growth and the local economybecome the determinant factors.
A small part of a community college district’s budget is from local sources other than propertytaxes and student enrollment fees, such as interest income, donations and sales of property. Everycommunity college district receives the same amount of lottery funds per student from the State; however,these are not Categorical Funds as they are not for particular programs or students. Such funds arerequired to be used for instructional purposes, but are prohibited for capital purposes.

B-6
District Budget Process
General. The fiscal year for all California school districts and community college districts beginson the first day of July of each year and ends on the thirtieth day of June of the following year.
School Districts. School districts are required by provisions of the State Education Code tomaintain a balanced budget each year, in which the sum of expenditures and the ending fund balancecannot exceed the sum of revenues and the carry-over fund balance from the previous year. Schooldistricts’ annual general fund expenditures are characterized in large part by multi-year expenditurecommitments such as union contracts. Year-to-year fluctuations in State and local funding of schooldistrict general funds could result in revenue decreases which, if large enough, may not easily be offset byan equal reduction in expenditures until at least the following fiscal year. School districts are required byState law to maintain general fund reserves that can be drawn upon in the event of a resulting excess ofexpenditures over revenues for a given fiscal year. The State Department of Education imposes a uniformbudgeting and accounting format for school districts.
School districts must adopt a budget no later than June 30 of each year. The budget must besubmitted to the county superintendent of schools (the “County Superintendent”), within five days ofadoption or by July 1, whichever occurs first. A district may be on either a dual or single budget cycle.The dual budget cycle requires a revised and readopted budget by September 1 that is subject to Statemandated standards and criteria. The revised budget must reflect changes in projected income andexpenses subsequent to July 1. The single budget is only readopted if it is disapproved by the CountySuperintendent or the State Superintendent, as applicable, or as needed.
For both dual and single budgets submitted on July l, the County Superintendent will (a) examinethe adopted budget for compliance with the standards and criteria adopted by the State Board ofEducation and identify technical corrections necessary to bring the budget into compliance, (b) determineif the budget allows the district to meet its current obligations, and (c) determine if the budget isconsistent with a financial plan that will enable the district to meet its multi-year financial commitments.On or before August 15, the County Superintendent will approve or disapprove the adopted budget foreach school district.
Budgets will be disapproved if they fail the above standards. The district board must be notifiedby August 15 of the County Superintendent’s recommendations for revision and reasons for therecommendations. The County Superintendent may assign a fiscal advisor or appoint a committee toexamine and comment on the recommendations. The committee must report its findings no later thanAugust 20. Any recommendations made by the County Superintendent must be made available by thedistrict for public inspection. The law does not provide for conditional approvals; budgets must be eitherapproved or disapproved. No later than August 20, the County Superintendent must notify the StateSuperintendent of all school districts whose budget has been disapproved.
Each dual budget option district and each single budget option districts whose budgets have beendisapproved must revise and readopt its budget by August 20, reflecting changes in projected income andexpenses since July 1, including responding to the County Superintendent’s recommendations for schooldistricts, and the State Superintendent’s recommendations for county offices of education. The CountySuperintendent must determine if the budget conforms with the standards and criteria applicable to finaldistrict budgets, and not later than October 8, must approve or disapprove the revised budgets. If thebudget is disapproved, the County Superintendent will call for the formation of a budget reviewcommittee pursuant to Education Code Section 42127.1. Until a district’s budget is approved, the districtwill operate on the lesser of its proposed budget for the current fiscal year or the last budget adopted andreviewed for the prior fiscal year.

B-7
After approving the districts’ budgets, the County Superintendent will monitor, throughout thefiscal year, each school district under his or her jurisdiction pursuant to its adopted budget to determine ona continuing basis if the district can meet its current or subsequent year financial obligations. If a CountySuperintendent determines that a district cannot meet its current or subsequent year obligations, theCounty Superintendent will notify the district’s governing board of the determination, and the CountySuperintendent may do either or both of the following: (a) assign a fiscal advisor to enable the district tomeet those obligations, or (b) if a study and recommendations are made and a district fails to takeappropriate action to meet its financial obligations, the County Superintendent must so notify the StateSuperintendent, and then may do any or all of the following for the remainder of the fiscal year:(i) request additional information regarding the district’s budget and operations; (ii) develop and impose,after also consulting with the district’s board, revisions to the budget that will enable the district to meetits financial obligations; and (iii) stay or rescind any action inconsistent with such revisions. However,the County Superintendent may not abrogate any provision of any collective bargaining agreement thatwas entered into prior to the date upon which the County Superintendent assumed authority. The sameprocedure applies to county boards of education, except that the State Superintendent conducts suchprocess rather than the County Superintendent.
At a minimum, each school district files with its County Superintendent and the State Departmentof Education a First Interim Financial Report by December 15 covering financial operations from July 1through October 31, and a Second Interim Financial Report by March 17 covering financial operationsfrom November 1 through January 31. Section 42131 of the Education Code requires that each interimreport be certified by the school board as either (a) ”positive,” certifying that the district, “based uponcurrent projections, will meet its financial obligations for the current fiscal year and subsequent two fiscalyears,” (b) ”qualified,” certifying that the district, “based upon current projections, may not meet itsfinancial obligations for the current fiscal year or two subsequent fiscal years,” or (c) ”negative,”certifying that the district, “based upon current projections, will be unable to meet its financial obligationsfor the remainder of the fiscal year or the subsequent fiscal year.” A certification by a school board maybe revised by the County Superintendent. If either the First or Second Interim Report is not “positive,”the County Superintendent may require the district to provide a Third Interim Financial Report coveringfinancial operations from February 1 through April 30 by June 1. If not required, a Third InterimFinancial Report is not prepared. Each interim report shows fiscal year-to-date financial operations andthe current budget, with any budget amendments made in light of operations and conditions to that point.After the close of the fiscal year on June 30, an unaudited financial report for the fiscal year is preparedand filed without certification with the County Superintendent and the State Department of Education.
None of the Districts have received a negative certification for Fiscal Year 2012-2013 or FiscalYear 2013-2014. Eight of the Districts have received a qualified certification for the First or SecondInterim Report for Fiscal Year 2012-2013 and four of the Districts have received or reported a qualifiedcertification for the First Interim Report for Fiscal Year 2013-2014. In order for any such Districtreceiving or reporting a qualified certification for Fiscal Year 2012-2013 or Fiscal Year 2013-2014 toissue its Note in connection with this offering, the County Superintendent of Schools for such Districtmust determine, pursuant to criteria established by the State Superintendent, that such District’srepayment of its respective Notes is probable. All of the Districts who received or reported a qualifiedcertification prior to the issuance of their respective Notes will have received a determination by theirrespective County Superintendent of Schools by the date of issuance of the Bonds that such District’srepayment of its Note is probable.

B-8
Following is a list of the Districts that have received or reported a qualified certification for FiscalYear 2012-2013 and Fiscal Year 2013-2014:
District County2013-2014
First Interim2012-2013
Second Interim2012-2013
First Interim
Azusa Unified Los Angeles Positive Qualified Qualified
Chawanakee Unified Madera Qualified Qualified Qualified
Yosemite Unified Madera Qualified Qualified Qualified
Banning Unified Riverside Positive Qualified Qualified
Jurupa Unified Riverside Positive Qualified Qualified
Lake Elsinore Unified Riverside Positive Qualified Qualified
Murrieta Valley Unified Riverside Positive Qualified Qualified
Center Joint Unified Sacramento Qualified Qualified Qualified
Ojai Unified Ventura Qualified Positive Positive
___________Source: California Department of Education; Districts
Community College Districts. In response to growing concern for accountability, the statewideBoard of Governors and the Chancellor’s Office of the California Community Colleges (the“Chancellor”) have, through enabling legislation (AB 2910, Chapter 1486, Statutes of 1986), establishedexpectations for sound district fiscal management and a process for monitoring and evaluating thefinancial condition to ensure the financial health of California’s community college districts. Inaccordance with statutory and regulatory provisions, the Chancellor has been given the responsibility toidentify districts at risk and, when necessary, the authority to intervene to bring about improvement intheir financial condition. To stabilize a district’s financial condition, the Chancellor may, as a last resort,seek an appropriation for an emergency apportionment.
The monitoring and evaluation process is designed to provide early detection and ameliorationthat will stabilize the financial condition of the community college district before an emergencyapportionment is necessary. This is accomplished by (1) assessing the financial condition of communitycollege districts through the use of various information sources and (2) taking appropriate and timelyfollow up action to bring about improvement in a community college district’s financial condition, asneeded. A variety of instruments and sources of information are used to provide a composite of eachcommunity college district’s financial condition, including quarterly financial status reports, annualfinancial and budget reports, attendance reports, annual district audit reports, district input and otherfinancial records. In assessing each community college district’s financial condition, the Chancellor willpay special attention to each district’s general fund balance, spending patterns, and FTES patterns. Thosecommunity college districts with greater financial difficulty will receive follow up visits from theChancellor’s Office where financial solutions to the district’s problems will be addressed andimplemented.
Accounting Practices
The accounting policies of California school districts conform to generally accepted accountingprinciples in accordance with policies and procedures of the California School Accounting Manual. Thismanual, according to Section 41010 of the Education Code, is to be followed by all California schooldistricts. Revenues are recognized in the period in which they become both measurable and available tofinance expenditures of the current fiscal period. Expenditures are recognized in the period in which theliability is incurred.

B-9
State Funding of Education
General. The California Constitution, Article XVI, Section 8, requires that the moneys to beapplied by the State for support of the public school system and public institutions of higher educationshall first be set apart from all State revenues. As discussed above, school districts and communitycollege districts in the State receive a significant portion of their funding from State appropriations.
The availability of State funds for public education is a function of Constitutional provisionsaffecting school district revenues and expenditures, the condition of the State economy (which affectstotal revenues available to the State general fund) and the annual State budget process.
Annual State apportionments of State aid to school districts and community college districts aredetermined as described above under “—Sources of Funds—School Districts” and “—Sources ofFunds—Community College Districts,” respectively.
On November 8, 1988, California voters approved an initiative constitutional amendment andstatute known as Proposition 98. This initiative made changes in the way the State funds public schoolsbelow the university level and treats excess revenues. On June 5, 1990, the California voters approved aninitiative constitutional amendment known as Proposition 111, which modified the CaliforniaConstitution to alter the spending limit and educational funding provisions of Proposition 98. See“—Constitutional and Statutory Provisions Affecting School District Revenues and Appropriations” for amore detailed discussion on Propositions 98 and 111.
The total amount required to be appropriated by the State for K-14 education is based on prior-year funding, as adjusted through various formulas and tests that take into account State proceeds oftaxes, local property tax proceeds, school enrollment, per-capita personal income, and other factors. TheState’s share of the guaranteed amount is based on State general fund tax proceeds and is not based on thegeneral fund in total or on the State budget. The local share of the guaranteed amount is derived fromlocal property taxes. The total guarantee amount varies from year to year throughout the stages of anygiven fiscal year’s budget, from the initial Governor’s budget proposal to actual expenditures, as thevarious factors change.
State Budget Process. The State budget approval process begins with the release of theGovernor’s proposed budget for the next fiscal year by January 10 to the Legislature. State fiscal yearsbegin July 1. In May, the Governor submits a “May Revision” of the proposed budget that reflectsupdated estimates of revenues and expenditures. After a series of public hearings and the other steps inthe legislative process, the budget must be approved by a majority vote in each house of the Legislatureand submitted to the Governor. The State budget becomes law upon the signature of the Governor, whomay reduce or eliminate any appropriation through the line-item veto. Although the budget is required bythe Constitution to be approved no later than June 15, the budget is frequently not approved until later inthe year.
While the Constitution in large part dictates the formulae for determining the allocation of Staterevenues to the kindergarten through twelfth grade (“K-12”) education portion of the State budgetpursuant to Proposition 98 and other provisions, the Governor and Legislature still have significantleeway in deciding whether and by how much to exceed or, in effect, reduce such allocation in the actualfunding of K-12 school districts, and in deciding what funds will be general purpose or restricted purpose,in the State budget process.
State Budget for Prior Fiscal Years. Following a severe recession in the early 1990s, the State’sfinancial condition improved markedly starting in 1995-1996, due to a combination of better-than-
B-10
expected revenues, slowdown in growth of social welfare programs, and continued spending restraintbased on actions taken in earlier years. The economy grew strongly between 1994 and 2000, generallyoutpacing the nation, and as a result, for the five Fiscal Years from 1995-1996 to 1999-2000, the GeneralFund tax revenues exceeded the estimates made at the time the budgets were enacted. These additionalfunds were largely directed to school spending as mandated by Proposition 98, to make up shortfalls fromreduced federal health and welfare aid in 1995-1996 and 1996-1997, and to fund new program initiatives,including education spending above Proposition 98 minimums, tax reductions, aid to local governmentsand infrastructure expenditures.
Starting in early 2001, the State faced significant financial challenges, with an economicrecession in 2001 and a sluggish recovery in 2002 and 2003 (with greatest impacts in the high technology,internet, and telecommunications sectors, especially in northern California); weakened exports; and mostparticularly, large stock market declines between 2000 and 2002 (with attendant declines in stock optionvalues and capital gains realizations). These adverse fiscal and economic factors resulted in an erosion ofState general fund tax revenues. The three largest State general fund tax sources are personal income,sales and use, and corporate taxes. The bulk of the revenue declines were from personal income taxes,principally from reduced capital gains realizations and stock option income. This revenue drop resultedin a shortfall between State revenues and anticipated spending demands during the Fiscal Years 2001-2002 through 2003-2004 resulting in a total accumulated deficit of approximately $22 billion.
Two measures intended to address the cumulative budget deficit and to implement structuralreform were both approved at the March 10, 2004 statewide primary election. The California EconomicRecovery Bond Act (Proposition 57) authorized the issuance of up to $15 billion of economic recoverybonds to finance the negative State general fund reserve balance as of June 30, 2004 and other Stategeneral fund obligations undertaken prior to June 30, 2004. The first two series of economic recoverybonds, which were issued on May 11, 2004, provided approximately $8.339 billion of net proceeds to theState’s general fund. A third series of economic recovery bonds in the principal amount of $2.974 billionwas issued on June 16, 2004. The Balanced Budget Amendment (Proposition 58) requires the State toadopt and maintain a balanced budget and establish a reserve, and restricts future long-term deficit-relatedborrowing.
During the second half of 2003 and during 2004, the recovery of the California economybroadened and strengthened (although with continuing weakness in job growth) and further moderategrowth continued in 2005 through 2007. However, commencing in 2008, the State experienced a severeeconomic downturn, similar to the trends throughout the United States, particularly with regard to thesubprime mortgage market. Since early 2007, the delinquency rate of subprime and other mortgages(particularly those with adjustable interest rates) rose, and the foreclosure rate increased significantly.Such losses in the mortgage market rippled into other financial markets. The unemployment rate inCalifornia rose to over 10% but has improved to its current level at 9.4%.
Cash Management Legislation. Due to budgetary difficulties, since 2002 the State has engagedin the practice of deferring certain apportionments to K-12 districts and community college districts fromone fiscal year to the next fiscal year in order to assist the State in balancing its budget each year. These“cross year” deferrals have been codified and are expected to be reduced in future fiscal years. Currently,the Governor plans to eliminate such deferrals by the end of the Fiscal Year 2014-2015. See“SECURITY AND SOURCES OF PAYMENT FOR THE BONDS—Deferred Revenues” in the forepartof this Official Statement for a discussion of such deferrals from Fiscal Year 2013-2014 to FiscalYear 2014-2015.
The Governor’s Proposed Budget (defined below) includes a plan to eliminate and pay down suchapportionment deferrals over time as a result of the additional revenue generated as a result of the passage

B-11
of Proposition 30. See “—Governor’s Proposed 2014-2015 Budget” below and “—Constitutional andStatutory Provisions Affecting School District Revenues and Appropriations—Proposition 30” below.
In addition to the cross year deferrals, the State has engaged in the practice of deferringapportionments within each fiscal year for K-14 districts. The State has not adopted such legislation forthe intra-year deferral of payments during the Fiscal Year 2013-2014 at this time. The Districts cannotpredict if additional “cross year” or any “intra-year” deferrals will be made in Fiscal Year 2013-2014 orany future fiscal years.
Dissolution of Redevelopment Agencies. The adopted State budget for Fiscal Year 2011-2012included as trailer bills Assembly Bill No. 26 (First Extraordinary Session) (“AB1X 26”) and AssemblyBill No. 27 (First Extraordinary Session) (“AB1X 27”), which the Governor signed on June 29, 2011.AB1X 26 suspended most redevelopment agency activities and prohibited redevelopment agencies fromincurring indebtedness, making loans or grants, or entering into contracts after June 29, 2011. AB1X 26dissolves all redevelopment agencies in existence and designates “successor agencies” and “oversightboards” to satisfy “enforceable obligations” of the former redevelopment agencies and administerdissolution and wind down of the former redevelopment agencies. Certain provisions of AB1X 26 aredescribed further below. As signed by the Governor, AB1X 27 would have allowed a redevelopmentagency to continue to exist, notwithstanding AB1X 26, upon the enactment by the city or county thatcreated the redevelopment agency of an ordinance to comply with AB1X 27’s provisions and thesatisfaction of certain other conditions.
In July of 2011, various parties filed an action before the Supreme Court of the State of California(the “Court”) challenging the validity of AB1X 26 and AB1X 27 on various grounds (CaliforniaRedevelopment Association v. Matosantos (“Matosantos”). The Court subsequently stayed theimplementation of a portion of AB1X 26 and all of AB1X 27 pending its decision in Matosantos. OnDecember 29, 2011, the Court rendered its decision in Matosantos upholding virtually all of AB1X 26and invalidating AB1X 27. In its decision, the Court also modified various deadlines for theimplementation of AB1X 26. The deadlines for implementation of AB1X 26 below take into account themodifications made by the Court in Matosantos.
After Matosantos, AB1X 26 continues to suspend most redevelopment agency activities andcontinues to prohibit redevelopment agencies from incurring indebtedness, making loans or grants, orentering into contracts. After redevelopment agencies are dissolved on February 1, 2012, AB1X 26requires redevelopment agencies to continue to make scheduled payments on and perform obligationsrequired under its “enforceable obligations.” For this purpose, AB1X 26 defines “enforceable obligations”to include “bonds, including the required debt service, reserve set-asides, and any other paymentsrequired under the indenture or similar documents governing the issuance of outstanding bonds of theformer redevelopment agency” and “any legally binding and enforceable agreement or contract that is nototherwise void as violating the debt limit or public policy.” AB1X 26 specifies that only paymentsincluded on an “enforceable obligation payment schedule” adopted by a redevelopment agency shall bemade by a redevelopment agency until its dissolution.
On February 1, 2012, and pursuant to Matosantos, AB1X 26 dissolved all redevelopmentagencies in existence and designated “successor agencies” and “oversight boards” to satisfy “enforceableobligations” of the former redevelopment agencies and administer dissolution and wind down of theformer redevelopment agencies. With limited exceptions, all assets, properties, contracts, leases, records,buildings and equipment, including cash and cash equivalents of a former redevelopment agency will betransferred to the control of the successor agency and, unless otherwise required pursuant to the terms ofan enforceable obligation, distributed to various taxing agencies pursuant to AB1X 26.

B-12
AB1X 26 requires each successor agency to continue to make payments on enforceableobligations of the former redevelopment agencies. However, until a successor agency adopts a“recognized obligation payment schedule” the only payments permitted to be made are payments onenforceable obligations included on an enforceable obligation payment schedule. The initial enforceableobligation payment schedule will be the enforceable obligation payment schedule adopted by the formerredevelopment agency. A successor agency may amend the enforceable obligation payment schedule atany public meeting, subject to the approval of its oversight board.
Under AB1X 26, commencing February 1, 2012, property taxes that would have been allocated toeach redevelopment agency if the agencies had not been dissolved will instead be deposited in a“redevelopment property tax trust fund” created for each former redevelopment agency by the relatedcounty auditor-controller and held and administered by the related county auditor-controller as providedin AB1X 26. AB1X 26 generally requires each county auditor-controller, on May 16, 2012 and June 1,2012 and each January 16 and June 1 thereafter, to apply amounts in a related redevelopment property taxtrust fund, after deduction of the county auditor-controller’s administrative costs, in the following order ofpriority:
• To pay pass-through payments to affected taxing entities in the amounts that would havebeen owed had the former redevelopment agency not been dissolved; provided, however,that if a successor agency determines that insufficient funds will be available to makepayments on the recognized obligation payment schedule and the county auditor-controller and State Controller verify such determination, pass-through payments that hadpreviously been subordinated to debt service may be reduced;
• To the former redevelopment agency’s successor agency for payments listed on thesuccessor agency’s recognized obligation payment schedule for the ensuing six-monthperiod;
• To the former redevelopment agency’s successor agency for payment of administrativecosts; and
• Any remaining balance to school entities and local taxing agencies.
It is possible that there will be additional legislation proposed and/or enacted to “clean up”various inconsistencies contained in AB1X 26 and there may be additional legislation proposed and/orenacted in the future affecting the current scheme of dissolution and winding up of redevelopmentagencies currently contemplated by AB1X 26.
Recent Litigation Regarding State Budgetary Provisions. On September 28, 2011, theCalifornia School Boards Association, the Association of California School Administrators, the LosAngeles Unified School District, the San Francisco Unified School District and the Turlock UnifiedSchool District filed a petition for a writ of mandate in the Superior Court of the State of California in andfor the County of San Francisco (the “CSBA Lawsuit”). The petitioners allege that the 2011-2012 Statebudget improperly diverted sales tax revenues away from the State general fund, resulting in a reductionto the minimum funding guarantee of approximately $2.1 billion. The CSBA Lawsuit seeks an order fromthe court compelling the State Director of Finance, Superintendent of Public Instruction and the StateController to recalculate the minimum funding guarantee in accordance with the provisions of theCalifornia Constitution. On May 31, 2012, the court denied the CSBA Lawsuit, finding thatProposition 98 does not prohibit the State from assigning sales tax revenues to a special fund thatpreviously were deposited into the State general fund. The court also found that, upon doing so, the Statewas not required to rebench the minimum funding guarantee. On July 27, 2012, the petitioners filed a

B-13
notice of appeal of the court’s decision. On February 26, 2013, the appeals court dismissed the appealand affirmed the trial court’s ruling.
Neither the Authority nor any of the Districts make any representations regarding the viability ofthe claims in the matter, nor can the Authority or any of the Districts predict whether the petitioners willbe successful. Moreover, neither the Authority nor any of the Districts make any representations as tohow any final decision by the court would affect the State’s ability to fund education in Fiscal Year 2013-2014, or in future fiscal years.
The following information concerning the State’s budget has been obtained from publiclyavailable information which the Authority believes to be reliable; however the Authority does notguarantee the accuracy or completeness of this information and has not independently verified suchinformation. The State has not entered into any contractual commitment with the Authority, the Districts,the Underwriter or the Owners of the Bonds to provide State budget information to the Authority, theDistricts, the Underwriter or the Owners of the Bonds. Although they believe the State sources ofinformation listed above are reliable, neither the Authority, the Districts nor the Underwriter assumesany responsibility for the accuracy of the State budget information set forth or referred to herein orincorporated by reference herein. Additional information regarding State budgets is available at variousState-maintained websites including www.dof.ca.gov, which website is not incorporated herein byreference.
2013-2014 State Budget. Governor Brown signed the 2013-2014 State Budget (the “2013-2014State Budget”) into law on June 27, 2013. The centerpiece of the 2013-2014 State Budget is therestructuring of the State's funding formula for K-12 schools through the implementation of the “LocalControl Funding Formula.” The 2013-2014 State Budget allocates $2.1 billion to commence transitioningthe State to the new formula, allocating proportionately more money to school districts with high levels oflow-income students, those with limited English proficiency and foster children. Overall, the 2013-2014State Budget boosts K-12 and community college funding to $55.3 billion.
Proposition 98. The 2013-2014 State Budget provides that the Proposition 98 guarantee will be$55.3 billion for Fiscal Year 2013-2014, an increase of more than $8 billion over the Fiscal Year 2011-2012 level, and projects an increase in Proposition 98 funding for K-12 schools of approximately $20billion from Fiscal Year 2011-2012 through Fiscal Year 2016-17, representing an increase ofapproximately $2,800 per student.
Local Control Funding Formula. The Local Control Funding Formula includes the followingcomponents:
A base grant for each local education agency equivalent to $7,643 per unit of average dailyattendance (“ADA”). This amount includes an adjustment of 10.4% to the base grant tosupport lowering class sizes in grades K-3, and an adjustment of 2.6% to reflect the cost ofoperating career technical education programs in high schools.
20% supplemental grant for English learners, students from low-income families, and fosteryouth to reflect increased costs associated with educating those students.
An additional concentration grant of up to 22.5% of a local education agency’s base grant,based on the number of English learners, students from low-income families, and fosteryouth served by the local agency that comprise more than 55% of enrollment.

B-14
An “Economic Recovery Target” to ensure that almost every local education agency receivesat least their pre-recession funding level, adjusted for inflation, at full implementation of theLocal Control Funding Formula.
Of the more than $25 billion in funding to be invested through the Local Control FundingFormula over the next eight years, the vast majority of new funding will be provided for base grants.Specifically, of every dollar invested through the Local Control Funding Formula, 84 cents will go tobase grants, 10 cents will go to supplemental grants, and 6 cents will go to concentration grants. Underthe 2013-2014 State Budget, the average base grant is $7,643, which is an increase of $2,375 from thecurrent average revenue limit.
Local Control Funding Formula Accountability. The Local Control Funding Formula movesfrom a State-controlled system that emphasizes inputs to a locally-controlled system focused onimproved outcomes. Local education agencies will decide the best way to target funds but will berequired to increase or improve services for English learner, low income, and foster youth students inproportion to supplemental and concentration grant funding. Additionally, the new system is designed toalign the State’s accountability structure with the existing local budget process. All school districts,county offices of education, and charter schools will be required to develop and adopt local control andaccountability plans, which will identify local goals in areas that are priorities for the State, includingpupil achievement, parent engagement, and school climate. County superintendents will be required toreview and provide support to the districts under their jurisdiction. The Superintendent of PublicInstruction will perform a corresponding role for county offices of education. In addition, the 2013-2014State Budget creates the California Collaborative for Education Excellence to advise and assist schooldistricts, county offices of education, and charter schools in achieving the goals identified in their plans.
Significant features of the 2013-2014 State Budget as it relates to funding of education includethe following:
Local Control Funding Formula—An increase of $2.1 billion Proposition 98 General Fundfor school districts and charter schools, and $32 million Proposition 98 General Fund forcounty offices of education, to support first-year funding provided through the Local ControlFunding Formula.
Common Core Implementation—An increase of $1.25 billion in one-time Proposition 98General Fund to support the implementation of the Common Core — new standards forevaluating student achievement in English-language arts and math. Funding will bedistributed to local education agencies on the basis of enrollment to support necessaryinvestments in professional development, instructional materials, and technology.
Career Technical Education Pathways Grant Program—An increase of $250 millionProposition 98 General Fund for one-time competitive capacity-building grants for K-12
school districts and community colleges to support programs focused on work-basedlearning. K-12 schools and community colleges must obtain funding commitments fromprogram partners to support ongoing program costs.
K-12 Mandates Block Grant—An increase of $50 million Proposition 98 General Fund toreflect the inclusion of the Graduation Requirements mandate within the block grant program.This increase will be distributed to school districts, county offices of education and charterschools with enrollment in grades 9-12.

B-15
K-12 Deferrals—An increase of $1.6 billion Proposition 98 General Fund in 2012-2013 andan increase of $242.3 million Proposition 98 General Fund in 2013-2014 for the repayment ofinter-year budgetary deferrals. When combined, total funding over the two-year period will
reduce K-12 inter-year deferrals to $5.6 billion by the end of Fiscal Year 2013-2014. Thiswill reduce total outstanding deferrals by more than 40% of their peak value, when more than$9.5 billion was deferred.
Deferral Buy Down—As it relates to community colleges, the 2013-2014 State Budgetincludes $178.6 million Proposition 98 General Fund in Fiscal Year 2012-2013 and $30million Proposition 98 General Fund in Fiscal Year 2013-2014 to retire apportionmentdeferrals. This will reduce borrowing costs at community colleges and reduce theoutstanding community colleges deferral debt to $592.5 million.
Apportionments—As it relates to community colleges, the 2013-2014 State Budget includesincreases of $89.4 million Proposition 98 General Fund for apportionment growth to increasecourse offerings and $87.5 million Proposition 98 General Fund for a cost-of-livingadjustment.
Adult Education—The 2013-2014 State Budget includes $25 million Proposition 98 GeneralFund for planning and implementation grants to support local coordination efforts of adulteducation providers.
Proposition 39 Implementation—The 2013-2014 State Budget allocates $381 millionProposition 98 General Fund to K-12 local education agencies to support energy efficiencyprojects approved by the California Energy Commission. Of this amount, 85% will bedistributed based on ADA and 15% will be distributed based on free and reduced-price mealeligibility. The 2013-2014 State Budget establishes minimum grant levels of $15,000 and$50,000 for small and exceptionally small local education agencies and allows these agenciesto receive an advance on a future grant allocation. The 2013-2014 State Budget will provideother local education agencies the greater of $100,000 or their weighted distribution amount.The 2013-2014 State Budget provides $28 million for interest-free revolving loans to assisteligible energy projects at schools and community colleges. Additionally, the 2013-2014State Budget appropriates $3 million to the California Workforce Investment Board todevelop and implement a competitive grant program for eligible workforce trainingorganizations that prepare disadvantaged youth or veterans for employment in energy relatedfields.
Special Education Funding Reform—The 2013-2014 State Budget includes severalconsolidations for various special education programs in an effort to simplify specialeducation finance and provide Special Education Local Plan Areas with additional fundingflexibility.
Categorical Programs—The 2013-2014 State Budget includes an increase of $118 millionProposition 98 General Fund for categorical programs.
Fiscal Outlook Report. In November 2013, the LAO released a summary of its revisedprojections for State general fund tax revenues and related spending (the “Fiscal Outlook Report”). Thefollowing report is drawn from the Fiscal Outlook Report.

B-16
The Fiscal Outlook Report provided the LAO’s projections of the State’s general fund revenuesand expenditures for Fiscal Year 2013-2014 through Fiscal Year 2019-2020 under current law. TheLAO’s projections primarily reflected current-law spending requirements and tax provisions, whilerelying on the LAO’s independent assessment of the outlook for the State’s economy, demographics,revenues and expenditures.
The LAO projects that the State will have a $5.6 billion general fund reserve at the end of FiscalYear 2014-2015. This projected reserve is the sum of (i) a $234 million ending reserve for Fiscal Year2012-2013, (ii) a $2.2 billion projected operating surplus in Fiscal Year 2013-2014, and (iii) a $3.2 billionprojected operating surplus in Fiscal Year 2014-2015.
The LAO currently projects that general fund revenue for Fiscal Year 2012-2013 will be $99.8billion (approximately $1.65 billion higher than projected in the 2013-2014 State Budget). This increaseis principally due to higher than expected personal income tax collections. As a result, the LAO currentlyprojects that the Proposition 98 minimum funding guarantee for Fiscal Year 2012-2013 will be $58.2billion (approximately $1.74 billion more than was assumed in the 2013-2014 State Budget), including$42.2 billion of support from the State’s general fund (approximately $1.75 billion more than wasassumed in the 2013-2014 State Budget). The higher State revenues result in more than a dollar-for-dollar increase in the Proposition 98 minimum funding guarantee due to the State’s decision to makemaintenance factor payments under Test 1 of Proposition 98. The State is required to make maintenancefactor payments when year-to-year growth in state General Fund revenues is relatively strong, such thatincreases in education funding are accelerated. The State will be making a $5.4 billion maintenancefactor payment in Fiscal Year 2012-2013, which will leave approximately $5.6 billion in outstandingmaintenance factor.
For Fiscal Year 2013-2014, the LAO currently projects an operating surplus of approximately$2.4 billion which is approximately $1.3 billion higher than was assumed in the 2013-2014 State Budget.This projection is based primarily on $4.7 billion in higher revenues, largely due to (i) approximately $5.2billion in higher than assumed personal income tax collections, (ii) approximately $3.1 billion in higherthan assumed general fund Proposition 98 general fund spending, and (iii) $300 million in higher-than-assumed non-Proposition 98 general fund spending. The LAO currently projects that Proposition 98minimum funding guarantee for Fiscal Year 2013-2014 will be $57.96 billion (approximately $2.67billion more than was projected in the 2013-2014 State Budget), including $42.1 billion of support fromthe State’s general fund (approximately $3.07 billion more than was assumed in the 2013-2014 StateBudget). This projected increase in the general fund Proposition 98 funding is due in part to the LAO’sforecast that local property taxes will be $393 million lower than assumed in the 2013-2014 State Budget.For Fiscal Year 2013-2014, the LAO estimates that a $941 million maintenance factor will be created.
For Fiscal Year 2014-2015, the LAO projects an operating surplus of approximately $3.2 billion.This projection is based primarily on the LAO’s assumption that: (i) general fund revenues will increaseto $107.62 billion ($5.8 billion more than projected 2013-2014 general fund revenues of $101.85 billion),(ii) approximately $3.3 billion in higher general fund Proposition 98 minimum funding spending over theprojected Fiscal Year 2013-2014 levels, and (iii) $1.5 billion in higher non-Proposition 98 general fundspending over the projected Fiscal Year 2013-2014 levels. The LAO currently projects thatProposition 98 minimum funding guarantee for Fiscal Year 2014-2015 will be $62.2 billion, including$45.4 billion of support from the State’s general fund.
The Fiscal Outlook Report provides projections through Fiscal Year 2019-2020. While the LAOprojects that the Proposition 98 minimum funding guarantee will increase to $73.7 billion in Fiscal Year2019-2020, the LAO currently projects that the general fund contribution to Proposition 98 funding overthat period will only increase to $49.1 billion due to expected increases in property tax revenues. The

B-17
LAO also notes that under their current forecast, the State will be unable to meet the time frame it set forfull implementation of the Local Control Funding Formula. By 2019-2020, the LAO currently forecaststhat the State can fund approximately 90% of the full Local Control Funding Formula cost.
Additional information regarding the Fiscal Outlook Report may be obtained from the LAO atwww.lao.ca.gov. However, such information is not incorporated by reference.
Governor’s Proposed 2014-2015 Budget. On January 9, 2014, the Governor released hisproposed State budget for Fiscal Year 2014-2015 (the “2014-2015 Proposed Budget”). The followinginformation is drawn from the State Department of Finance’s summary of the 2014-2015 ProposedBudget.
The 2014-2015 Proposed Budget assumes, for Fiscal Year 2013-2014, total general fund revenuesof $100.1 billion and total expenditures of $98.5 billion. The State is projected to end the Fiscal Year2013-2014 with a general fund surplus of $3.3 billion. For Fiscal Year 2014-2015, the 2014-2015Proposed Budget assumes total general fund revenues of $104.5 billion and authorizes expenditures of$106.8 billion. The 2014-2015 Proposed Budget also authorizes a deposit of $1.6 billion to the BudgetStabilization Account (discussed herein). The State is projected to end the Fiscal Year 2014-2015 with a$967 million general fund surplus.
The 2014-2015 Proposed Budget retroactively increases the Proposition 98 minimum fundingguarantee for Fiscal Year 2012-2013 to $58.3 billion, an increase of $1.8 billion over the revised level setby the 2013-2014 Budget. For Fiscal Year 2013-2014, the Proposition 98 minimum funding guarantee isrevised to $56.8 billion, an increase of $1.5 billion over the prior level. The 2014-2015 Proposed Budgetallocates this two-year increase, totaling $3.3 billion, to retire outstanding K-12 apportionment deferrals,as further discussed herein.
The growth in prior year revenues also drives a growth in the Proposition 98 minimum fundingguarantee for Fiscal Year 2014-2015, which the 2014-2015 Proposed Budget sets at $61.6 billion.Ongoing Proposition 98 per-pupil expenditures are projected to be $9,194, and total per-pupilexpenditures from all sources are projected to be $12,833.
Other significant proposals or adjustments with respect to K-12 education funding include thefollowing:
Repayment of K-12 Deferrals. An increase of $2.2 billion in Proposition 98 funding which,together with the $3.3 billion increase in funding allocable to Fiscal Years 2012-2013 and2013-2014 (as discussed above), would be used to eliminate all remaining outstanding K-12apportionment deferrals.
Local Control Funding Formula. $4.5 billion of Proposition 98 funding to school districtsand charter schools to continue the implementation of the LCFF, reflecting an increase of10.9% from the prior year. This amount would be sufficient to eliminate more than 28% ofthe remaining funding gap. The Governor also proposes legislation to create a continuousappropriation for LCFF funding in future years. With respect to county offices of education,the 2014-2015 Proposed Budget provides an increase of $25.9 million of Proposition 98funding to continue the implementation of the LCFF.
Common Core. An increase of $46.5 million in Proposition 98 funding to implementAssembly Bill 484 (Stats. 2013, Chapter 489), which established a revised student assessmentsystem aligned with the new Common Core standards.

B-18
Charter Schools. An increase of $74.3 million in Proposition 98 funding to support aprojected growth in charter school ADA.
Categorical Programs. $33.3 million to support a 0.86% COLA for categorical programsoutside of the LCFF, including the Special Education, Child Nutrition, American IndianEducation Centers, and American Indian Early Childhood Education Programs.
Special Education. A decrease of $16.2 million in Proposition 98 funding to reflect a declinein special education ADA.
Stability Funding. As part of the 2014-2015 Proposed Budget, the Governor proposes aconstitutional amendment to strengthen existing provisions of law that require the State toadopt a balanced budget in each year and deposit a portion of State general fund revenuesinto a Budget Stabilization Account. A key component of this constitutional amendmentwould be the creation of a Proposition 98 reserve account to smooth out year-to-year schoolspending. The Governor’s proposed amendment would not make changes to the guaranteedfunding levels required under Proposition 98.
Proposition 39 Implementation. The 2014-2015 Proposed Budget allocated $316 million offunds derived from Proposition 39 state corporate tax revenues to K-12 school districts tofund energy efficiency project grants. The 2014-2015 Proposed Budget also allocates $5million of such funds to the California Conservation Corps for continued technical assistanceto K-12 school districts.
School Facilities Funding. The 2014-2015 Proposed Budget authorizes the transfer of $211million of remaining State bonding authority from specialized programs to the school facilitycore new construction and modernization programs. The 2014-2015 Proposed Budget alsodedicates $188.1 million of one-time Proposition 98 funding to the State’s Emergency RepairProgram to provide grants or reimbursement to local educational agencies for the cost ofrepairing or replacing building systems that pose a health and safety threat to students andstaff at eligible school sites.
For additional information regarding the 2014-2015 Proposed Budget, see the Department ofFinance website at www.dof.ca.gov. However, the information presented on such website is notincorporated herein by reference. The final Fiscal Year 2014-2015 State budget, which requires approvalby a majority vote of each house of the State Legislature, may differ substantially from the Governor’s2014-2015 Proposed Budget. Accordingly, neither the Districts nor the Authority can predict the impactthat the final Fiscal Year 2014-2015 State budget, or subsequent State budgets, will have on its financesand operations.
Future State Budgets. Neither the Authority nor the Districts can predict what actions will betaken in the future by the Legislature and the Governor with respect to the State’s current or futurebudgets. State budgets will be affected by national and State economic conditions, including the currenteconomic downturn, over which the Districts have no control, and other factors over which the Districtswill have no control. To the extent that the State budget process results in reduced revenues or increasedexpenses for the Districts, the Districts will be required to make adjustments to their respective budgets.State budget shortfalls in future fiscal years may also have an adverse financial impact on the financialcondition of the Districts.
Periodic Reports. Periodic reports on revenues and/or expenditures during the fiscal year areissued by the Governor’s Office, the State Controller’s Office and the LAO. The Department of Finance

B-19
issues a monthly Bulletin which reports the most recent revenue receipts as reported by State departments,comparing them to Budget projections. The Governor’s Office also formally updates its budgetprojections three times during each fiscal year, in January, May and at budget enactment. These bulletinsand other reports are available on the Internet.
State Funding of Schools Without a State Budget. On May 29, 2002, the Court of Appeal of theState of California for the Second Appellate District in White v. Davis et al. (combined with HowardJarvis Taxpayers Association et al. v. Westly in appeal) held, among other things, that absent adoption ofa budget bill or an emergency appropriation by the Legislature, the State Controller may disburse Statefunds authorized by (a) a continuing appropriation enacted by the Legislature, (b) a self-executingprovision of the State constitution, including payment of certain funds for public schools underArticle XVI, Section 8.5 of the constitution, and (c) mandate of federal law, such as prompt payment ofminimum wage and overtime compensation mandated by the federal Fair Labor Standards Act andbenefits under federal food stamp, foster care and adoption, child support and child welfare programs.The Court of Appeal specifically concluded that Article XVI, Section 8.0 does not constitute a self-executing authorization to disburse revenue limit apportionment to school districts; legislativeappropriation is required for revenue limit disbursement. On May 1, 2003, the California Supreme Courtin its decision in White v. Davis et al. granted review to two other matters and let these particularconclusions of the Court of Appeal stand without ruling on them.
During the 2003-2004 State budget impasse, the State Controller announced that only “paymentsof prior year obligations, constitutional authorizations, federal mandates and continuous legislativeappropriations would be made.” The State Controller concluded that revenue limit apportionments toschool districts, under provisions of the Education Code implementing Article XVI, Section 8 of the Stateconstitution, are authorized as continuous legislative appropriations, so disbursed these funds without abudget bill or emergency appropriation enacted. The State Controller did not disburse certain categoricaland other funds to school districts until the 2003-2004 State Budget Act was enacted.
The Budget Act and Proposition 98. The effect of Proposition 98 has proven especially difficultto accurately predict when State general fund revenues do not meet expectations. For several years in theearly 1990s, as the State’s economy was sliding into a recession, the State’s budget allocations for K-14districts proved to be more than Proposition 98 would have required. The excess amounts were latertreated by the State as advances to K-14 districts against subsequent years’ Proposition 98 minimumfunding levels, resulting in aggregate funding reductions of over $1 billion in those years. In 2002-2003and 2003-2004, the worsening State financial position again resulted in retroactive adjustments as well ascurrent-year cuts. The Legislative Analyst reported that legislative actions in mid-Fiscal Year 2002-2003eliminated $2.5 billion from budgeted Proposition 98 funding through a combination of deferral ofexpenditures to Fiscal Year 2003-2004, use of one-time funds, captured program savings, and other cuts.In general, deferral of education expenditures and reductions in the components of revenue limit fundinghave the effect of reducing the base from which future Proposition 98 minimum funding levels arecalculated. Legislation enacted in March 2003 permanently defers the appointment of Proposition 98funds scheduled each year in June to each July, and thus from one fiscal year to the next. Legislation insubsequent fiscal years has resulted in additional permanent deferrals of apportionment of Proposition 98funds from one fiscal year to the next. See “—State Funding of Education—Cash ManagementLegislation” above. These and other techniques significantly reduce the minimum guarantee requirementfor Fiscal Years 2003-2004 and beyond.
State Retirement Programs
School districts and community college districts participate in retirement plans with the CaliforniaState Teachers’ Retirement System (“STRS”). STRS covers all full-time and most part-time employees

B-20
with teaching certificates. In order to receive STRS benefits, an employee must be at least 55 years oldand have provided five years of service to California public schools. School districts and communitycollege districts also participate in the State of California Public Employees Retirement System(“PERS”). PERS covers certain classified personnel, generally those employees without teachingcertificates, who are employed at least four hours per day. In order to receive PERS benefits, anemployee must be at least 50 years old and have had five years of covered PERS service as a publicemployee.
Contribution rates to PERS varies with changes in actuarial assumptions and other factors, suchas changes in benefits and investment performance, and are set by a State retirement board for PERS. Assuch, all districts share the same contribution rate in each year, which fluctuates from year to year. Thecontribution rates are set by statute for STRS at a constant 8.25% of salary. STRS has a substantial State-wide unfunded liability. Under current law, the liability is determined at the State level and is notcalculated for each individual school district. From time to time, proposals have been suggested thatwould modify districts’ obligation to STRS closely parallel the full cost of the retirement benefitsprovided by STRS, which proposals would include components for unfunded liability. If adopted, theDistricts’ annual obligations to STRS may increase significantly.
Each of STRS and PERS issues a separate comprehensive financial report that includes financialstatements and required supplemental information. Copies of such financial reports may be obtainedfrom each of STRS and PERS as follows: (i) STRS, P.O. Box 15275, Sacramento, California 95851-0275; (ii) PERS, P.O. Box 942703, Sacramento, California 94229-2703. Moreover, each of STRS andPERS maintains a website, as follows: (i) STRS: www.calstrs.com; (ii) PERS: www.calpers.ca.gov.However, the information presented in such financial reports or on such websites is not incorporated intothis Official Statement by any reference.
Both STRS and PERS have substantial statewide unfunded liabilities. The amount of theseunfunded liabilities will vary depending on actuarial assumptions, returns on investments, salary scalesand participant contributions. The following table summarizes information regarding the actuarially-determined accrued liability for PERS.
FUNDED STATUSPERS
As of the June 30, 2012 Valuation Date(Dollar Amounts in Millions)1
PlanAccruedLiability
Value of TrustAssets
UnfundedLiability
Public Employees Retirement Fund (PERS) $59,439 $44,8542 $(14,585)______________________1 Amounts may not add due to rounding.2 Reflects market value of assets as of June 30, 2012.Source: CalPERS State & Schools Actuarial Valuation
The following table summarizes information regarding the actuarially-determined accruedliability for STRS.

B-21
FUNDED STATUSSTRS (Defined Benefit Program)
As of the June 30, 2012 Valuation Date(Dollar Amounts in Millions)1
PlanAccruedLiability
Value of TrustAssets
UnfundedLiability
State Teachers’ Retirement Fund DefinedBenefit Program (STRS) $215,189 $144,2322 $(70,957)
______________________1 Amounts may not add due to rounding.2 Reflects actuarial value of assets as of June 30, 2012.Source: CalSTRS Defined Benefit Program Actuarial Valuation
Unlike PERS, STRS contribution rates for participant employers, current employees and the Stateare set by statute and do not currently vary from year-to-year based on actuarial valuations. In recentyears, the combined employer, employee and State contributions to STRS have been significantly lessthan actuarially required amounts. As a result, and due in part to investment losses, the unfunded liabilityof STRS has increased significantly. This unfunded liability is expected to continue to increase in theabsence of legislation requiring additional or increased contributions. None of the Districts can make anyrepresentations regarding the future program liabilities of STRS, or whether the Districts will be requiredto make larger contributions to STRS in the future. None of Districts can provide any assurances that theDistrict’s required contributions to PERS will not increase in the future.
California Public Employees’ Pension Reform Act of 2013. On September 12, 2012, GovernorBrown signed AB 340, a bill that enacts the California Public Employees’ Pension Reform Act of 2013(“PEPRA”) and that amends various sections of the California Education and Government Codes. AB340 (i) increases the retirement age for new State, school, and city and local agency employees dependingon job function, (ii) caps the annual PERS and STRS pension benefit payouts, (iii) addresses numerousabuses of the system, and (iv) requires State, school, and certain city and local agency employees to payat least half of the costs of their PERS pension benefits. PEPRA will apply to all public employers exceptthe University of California, charter cities and charter counties (except to the extent they contract withPERS.)
The provisions of AB 340 went into effect on January 1, 2013 with respect to new State, school,and city and local agency employees hired on that date and after; existing employees who are members ofemployee associations, including employee associations of the Districts, will have a five-year window tonegotiate compliance with AB 340 through collective bargaining. If no deal is reached by January 1,2018, a city, public agency or school district could force employees to pay their half of the costs of PERSpension benefits, up to 8 percent of pay for civil workers and 11 percent or 12 percent for public safetyworkers.
PERS has predicted that the impact of AB 340 on employers, including the Districts and otheremployers in the STRS system, and employees will vary, based on each employer’s current level ofbenefits. To the extent that the new formulas lower retirement benefits, employer contribution rates coulddecrease over time as current employees retire and employees subject to the new formulas make up alarger percentage of the workforce. This change would, in some circumstances, result in a lowerretirement benefit for employees than they currently earn. Additionally, PERS has noted that changesarising from AB 340 could ultimately have an adverse impact on public sector recruitment in areas that

B-22
have historically experienced recruitment challenges due to higher pay for similar jobs in the privatesector.
The Districts are not unable to predict what the amount of PERS or STRS liabilities will be in thefuture or the amount of the PERS and STRS contributions which the Districts may be required to make,all as a result of the implementation of AB 340, and as a result of negotiations with its employeeassociations.
More information about AB 340 can be accessed through the PERS’s web site atwww.calpers.ca.gov/index.jsp?bc=/member/retirement/pension-reform-impacts.xml&pst=ACT&pca=STand through the STRS web site at http://www.calstrs.com/Newsroom/whats_new/AB340_detailed_impact_analysis.pdf. The references to these internet websites are shown for reference andconvenience only; the information contained within the websites may not be current and have not beenreviewed by the Authority or Districts and is not incorporated herein by reference.
Post-Employment Benefits
In addition to the pension benefits described above, many school districts and county boards ofeducation provide post-employment health benefits for eligible employees upon retirement. The amountand length of these benefits vary dramatically among those districts offering such benefits. In addition,the amount and length of such benefits typically depend on a variety of factors, including age atretirement, length of service, and status as a certificated, classified or management employee.
On June 21, 2004, the Governmental Accounting Standards Board (“GASB”) released itsGovernmental Accounting Standards Board Statement No. 45 (“Statement No. 45”), Accounting andFinancial Reporting by Employers for Postemployment Benefits Other Than Pensions. Statement No. 45establishes standards for measuring, recognizing and disclosing post-employment healthcare as well asother forms of post-employment benefits, such as life insurance, when provided separately from a pensionplan expense or expenditures and related liabilities in the financial reports of state and local governments(such other post-employment benefits are referred to herein as “OPEB”). Under Statement No. 45,governments will be required to: (i) measure the cost of benefits, and recognize other post-employmentbenefits expense, on the accrual basis of accounting in periods that approximate employees’ years ofservice; (ii) provide information about the actuarial liabilities for promised benefits associated with pastservices and whether, or to what extent, those benefits have been funded; and (iii) provide informationuseful in assessing potential demands on the employer’s future cash flows. The Districts’post-employment health benefits fall under Statement No. 45.
The core requirement of Statement No. 45 is that at least biennially an actuarial analysis must beprepared with respect to projected benefits (“Plan Liabilities”); against this would be measured theactuarially determined value of the related assets (the “Plan Assets”). To the extent that Plan Liabilitiesexceeded Plan Assets, then similar to the actuarial and accounting practices for pension plan liabilities,the difference would be amortized over a period which could be up to 30 years. The method of financialreporting for OPEB costs would be similar to financial reporting for pension plan normal costs andunfunded actuarial accrued liability. The requirements that Statement No. 45 impose on the Districts onlyaffect the Districts’ financial statements and would not impose any requirements regarding the funding ofany OPEB plans.
Information related to any actuarial studies to determine the estimated liability for such post-employment liability is available upon request during the initial offering period from Dale Scott &Company, 650 California Street, 8th Floor, San Francisco, California 94108.

B-23
State Emergency Loan Program
General. The California Education Code provides that a governing board of a school district thatdetermines during a fiscal year that its revenues are less than the amount necessary to meet its currentyear expenditure obligations may request an emergency apportionment from the State through the StateSuperintendent of Public Instruction (the “State Superintendent”).
As a condition to the making of any such emergency apportionment, the following requirementsmust be met:
(a) The district requesting the apportionment must submit to the countysuperintendent of schools having jurisdiction over the district: (i) a report issued by anindependent auditor approved by the county superintendent of schools (the “CountySuperintendent”) on the financial conditions and budgetary controls of the district; (ii) a writtenmanagement review conducted by a qualified management consultant approved by the CountySuperintendent; and (iii) a fiscal plan adopted by the governing board to resolve the financialproblems of the district.
(b) The County Superintendent must review, and provide written comment on, theindependent auditor’s report, the management review and the district plan. If the CountySuperintendent disapproves the plan, the governing board must revise the district plan to respondto the concerns expressed by the County Superintendent.
(c) Upon his or her approval of the district plan, the County Superintendent mustsubmit copies of the report, review, plan and written comments to the State Superintendent, theJoint Legislative Audit Committee, the Joint Legislative Budget Committee, the Director ofFinance and the State Controller.
(d) The State Superintendent must review the reports and comments submitted tohim or her by the County Superintendent and must certify to the Director of Finance that theaction taken to correct the financial problems of the district is realistic and will result in placingthe district on a sound financial basis.
(e) The district must develop a schedule to repay the emergency loan and submit it tothe County Superintendent, who after reviewing and commenting on it submits it to the StateSuperintendent for approval or disapproval. Upon the approval of the repayment schedule and ofthe other reports, reviews, plans and the appointment of the trustee (as described below), the StateSuperintendent must request the State Controller to disburse the proceeds of the emergency loanto the district.
(f) The district requesting the apportionment must reimburse the CountySuperintendent for the costs incurred by the superintendent in performing such duties.
In addition, the acceptance by the district of the apportionments made pursuant to the EducationCode constitutes the agreement by the district to the following conditions:
(a) The State Superintendent shall appoint a trustee who shall have recognizedexpertise in management and finance. The State Superintendent shall establish the terms andconditions of the employment, including the remuneration of the trustee, and the trustee shallserve at the pleasure of, and report directly to, the State Superintendent until the loan is repaid,the district has adequate fiscal systems and controls in place, and the State Superintendent has

B-24
determined that the district’s future compliance with the fiscal plan approved for the district isprobable. Before the district repays its loan, the recipient of the loan shall select an auditor froma list established by the State Superintendent and the State Controller to conduct an audit of itsfiscal systems. If the fiscal systems are deemed to be inadequate, the State Superintendent mayretain the trustee until the deficiencies are corrected.
(b) The trustee appointed by the State Superintendent shall monitor and review theoperation of the district. During the period of his or her service, the trustee may stay or rescindany action of the local district governing board that, in the judgment of the trustee, may affect thefinancial condition of the district. The trustee shall approve or reject all reports and othermaterials required from the district as a condition of receiving the apportionment.
On or before February 15 of each year, the State Department of Education shall report to theLegislature on the status of school districts that have received emergency apportionments. On or beforeOctober 31 of the year following receipt of an emergency apportionment, and each year thereafter untilthe emergency apportionment is repaid, the governing board of the district shall prepare, under the reviewand with the approval of the trustee, a report on the financial condition of the district which shall betransmitted to the County Superintendent, the State Superintendent and the State Controller. The reportshall include all of the following information: (a) specific actions taken to reduce expenditures or increaseincome, and the cost savings and increased income resulting from those actions; (b) a copy of the adoptedbudget for the current fiscal year; (c) reserves for economic uncertainties; (d) status of employeecontracts; and (e) obstacles to the implementation of the adopted recovery plan.
The emergency apportionment is required to be repaid to the State over a five-year period, or less,together with interest at a rate determined in accordance with the Education Code.
The Legislature expressly provides that these provisions of the Education Code are not intendedto authorize emergency loans to school districts for the purpose of meeting cash-flow requirementspending the receipt of local taxes and other funds. Furthermore, no such emergency apportionment willbe made unless funds have been specifically appropriated therefor by the Legislature.
Butt v. State of California. In December 1992, the California Supreme Court, in Butt v. State ofCalifornia, upheld a lower court’s ruling that the State could not refuse to fund education in theRichmond School District (“Richmond”) after Richmond decided to terminate classroom instruction sixweeks before the scheduled end of the school year due to lack of funds. The Court upheld the lowercourt’s ruling that the State constitution requires the State to ensure a full year’s education for children inall school districts. However, because the Court overturned that portion of the original order relating tothe source of State funds used to make an emergency loan to Richmond, the decision leaves unclear justwhere the State must find funds to make any future loans of this kind. No prediction can be made at thistime as to what actions ultimately will be taken by the Legislature and the Governor to provideemergency funds to districts under court orders such as that imposed in Butt v. State of California.
Assessed Valuation and Tax Collections
Ad valorem Property Taxation. Prior to Fiscal Year 1981-1982, County Assessors generallyassessed all properties at 25% of full cash value (market value). The State Board of Equalization assessedpublic utility properties at 25% of full cash value. Since Fiscal Year 1981-1982, all property has beenassessed at 100% of the “full value” of the property, as defined in Article XIIIA of the State Constitution.For a discussion of how properties currently are assessed, see “—Constitutional and Statutory ProvisionsAffecting School District Revenues and Appropriations—Article XIIIA of the California Constitution”herein. The Constitution of the State and various statutes provide exemptions from ad valorem property

B-25
taxation for certain classes of property, such as churches, colleges, nonprofit hospitals and charitableinstitutions. No reimbursement is made by the State for such exemptions.
State law allows exemptions from ad valorem property taxation of $7,000 of full owner-occupieddwellings. However, the State reimburses all local taxing authorities for the loss of revenues imputed tothese exemptions.
Taxes are levied for each fiscal year on taxable real and personal property which is situated in acounty as of the preceding January 1. For assessment and collection purposes, property is classified eitheras “secured” or “unsecured,” and is listed accordingly on separate parts of the assessment roll. The“secured roll” is that part of the assessment roll containing State assessed property and property securedby a lien on real property that is sufficient, in the opinion of a county assessor, to secure payment of thetaxes. Other property is assessed on the “unsecured roll.” A supplemental roll is developed whenproperty changes hands or new construction is completed. Each county levies and collects all taxes forproperty falling within that county’s boundaries.
Counties levy a 1% property tax on behalf of all taxing agencies in the counties. The taxescollected are allocated on the basis of a formula established by State law enacted in 1979. Under thisformula, each county and all other taxing entities in each county receive a base year allocation plus anallocation on the basis of “situs” growth in assessed value (new construction, change of ownership, and a2% not-to-exceed inflation factor) prorated among the jurisdictions which serve the tax rate areas withinwhich the growth occurs. Tax rate areas are specifically defined geographic areas which were developedto permit the levying of taxes for less than county–wide or less than city–wide special districts. Localagencies and schools share the growth of “base” revenues from the tax rate areas. Each year’s growthallocation becomes part of each agency’s allocation in the following year.
The California Community Redevelopment Law authorized redevelopment agencies to issuebonds payable from the allocation of tax revenues resulting from increases in assessed valuations ofproperties within designated project areas. In effect, local taxing authorities, such as the Districts, in suchproject areas, realize tax revenues only on the frozen base assessed valuations. See however “—StateFunding of Education—Dissolution of Redevelopment Agencies” for a discussion regarding dissolutionof redevelopment agencies.
Secured Real Property Taxes. State and county taxes on real property are due and becomedelinquent each year in all counties of the State as follows:
The first real property tax installment is due November 1 and becomes delinquent afterDecember 10. The second real property tax installment is due February 1 and becomes delinquent afterApril 10. The entire tax may be paid at the time the first installment is due.
For taxes due and payable in Fiscal Year 2011-2012, a penalty of 10% is added to the firstinstallment if not paid on or before December 10; and 10% to the second installment if not paid on orbefore April 10 together with $10.00 of costs also added for each described parcel. At the end of the firstyear of delinquency, property is sold to the State.
In redeeming property on the secured rolls for delinquent taxes, penalties are added at the rate of1-1/2% per month, plus costs and a redemption fee on each separately valued parcel sold to the State. Ifnot redeemed at the end of five years from July 1 of the year first becoming delinquent, the property willbe deeded to the State and may thereafter be sold at public auction by the county tax collector.

B-26
Unsecured Property Taxes. Taxes on property assessed on the unsecured roll as unsecuredproperty (separate from real estate) are due as of the January 1 lien date and become delinquent if unpaidon August 31. A 10% penalty attaches to the taxes when they become delinquent. If unpaid at 5:00 p.m.on October 31, a 1-1/2% penalty is added on the first day of each month until paid or until a courtjudgment is entered. The taxing authority has four ways of collecting delinquent unsecured personalproperty taxes: (a) bringing a civil action against the taxpayer; (b) filing a certificate in the office of theCounty Clerk specifying certain facts in order to obtain a judgment lien on certain property of thetaxpayer; (c) filing a certificate of delinquency for record in the County Clerk and County Recorder’soffice, in order to obtain a lien on certain property of the taxpayer; and (d) seizure and sale of personalproperty, improvements or possessory interests belonging or assessed to the assessee.
The Teeter Plan. Most of the 58 counties in the State operate under provisions of the AlternativeMethod of Distribution of Tax Levies and Collections and of Tax Sale Proceeds (commonly referred to asthe “Teeter Plan”) as provided for in the California Revenue and Taxation Code Sections 4701-4716.Pursuant to the Teeter Plan, each participating local agency levying property taxes, including K-14districts, receives their total secured tax levies irrespective of actual collections and delinquencies.Pursuant to said provisions, each county operating under the Teeter Plan receives and retains delinquentpayments, penalties and interest as collected that would have been due the local agency. Each suchcounty establishes a delinquency reserve and assumes responsibility for all secured delinquenciesassuming that certain conditions are met.
Because of this method of tax collection, the K-14 districts located in counties operating underthe Teeter Plan and participating in the Teeter Plan are assured of 100% collection of their total securedtax levies assuming that the conditions established under the applicable county’s Teeter Plan are met.However, such districts are no longer entitled to share in any penalties or interest due to delinquentpayments. This method of tax collection and distribution is subject to future discontinuance by theapplicable county or if demanded by the participating entities. Tax delinquencies in excess of a certainpercentage for a tax levying agency could trigger a discontinuance by certain counties of their TeeterPlans with respect to such agency.
Projected Increases in Property Tax Delinquencies. Current economic conditions suggest thatthere may be an increased rate of delinquencies in the payment of ad valorem property taxes and specialassessments throughout the State of California. Some factors in the projected increase in suchdelinquencies include fallout from the subprime home mortgage loan industry and general negativeeconomic factors, such as increased unemployment rates. Any substantial increase in the number of loanforeclosures within the boundaries of a District may result in delays or suspensions of the correspondingpayment of property taxes for a period of time for those Districts whose boundaries are within a countythat does not operate under the Teeter Plan. Even for those Districts within counties operating under theTeeter Plan, a substantial amount of delinquencies in ad valorem tax payments could result in adiscontinuance in the Teeter Plan with respect to such District, which may delay or suspend thecorresponding payment of property taxes for a period of time. However, such taxes continue to be dueand owing with respect to foreclosed-upon property by its legal owner and would be satisfied, if required,from the proceeds of a tax sale of such property, administered by the applicable County.
Appeals of Assessed Valuation. Under California law, property owners may apply for areduction of their property tax assessment by filing a written application, in form prescribed by the StateBoard of Equalization, with the appropriate county board of equalization or assessment appeals board.County assessors may independently reduce assessed values as well based upon the above factors orreductions in the fair market value of the taxable property. In most cases, an appeal is filed because theapplicant believes that present market conditions (such as residential home prices) cause the property tobe worth less than its current assessed value. Any reduction in the assessment ultimately granted as a

B-27
result of such appeal applies to the year for which application is made and during which the writtenapplication was filed. Such reductions are subject to yearly reappraisals and may be adjusted back to theiroriginal values when market conditions improve. Once the property has regained its prior value, adjustedfor inflation, it once again is subject to the annual inflationary factor growth rate allowed underArticle XIIIA.
A second type of assessment appeal involves a challenge to the base year value of an assessedproperty. Appeals for reduction in the base year value of an assessment, if successful, reduce theassessment for the year in which the appeal is taken and prospectively thereafter. The base year isdetermined by the completion date of new construction or the date of change of ownership. Any baseyear appeal must be made within four years of the change of ownership or new construction date.
Many of the Districts have experienced a significant reduction in assessed valuation over the lastthree years. No assurance can be given that property tax appeals or unilateral county reductions in thefuture will not significantly reduce the assessed valuation of property within Districts.
Constitutional and Statutory Provisions AffectingSchool District Revenues and Appropriations
Article XIIIA of the California Constitution. California voters approved Proposition 13, astatewide initiative relating to the taxation of real property that added Article XIIIA to the CaliforniaConstitution, on June 6, 1978. Among other things, Proposition 13: (a) limits ad valorem property taxeson all real property to 1% of the full cash value of the property; (b) exempts from the 1% limitation anyindebtedness approved by the voters prior to July 1, 1978, or any bonded indebtedness for the acquisitionor improvement of real property approved on or after July 1, 1978, by two-thirds of the votes cast bythose voting on the proposition; (c) defines “full cash value” as the county assessor’s appraised value ofreal property as of March 1, 1975, adjusted by changes in the Consumer Price Index--not to exceed 2%per year; (d) permits establishment of a new “full cash value” when there is new construction or a changein ownership (subject to certain exceptions); (e) permits the reassessment, up to the March 1, 1975 value,of property which was not current on the 1975-76 assessment roll; (f) requires counties to collect the 1%property tax and to “apportion according to law to the districts within the counties”; (g) prohibits newad valorem taxes on real property, or sales or transaction taxes on the sale of real property; (h) permits theimposition of special taxes by local agencies, other than those prohibited, by a two-thirds vote of the“qualified electors” of such agencies; and (i) requires a two-thirds vote of all members of both houses ofthe Legislature for any changes in State taxes that would result in increased revenues. Additionally,Proposition 39, which was approved by the State’s voters on November 7, 2000, permits bondedindebtedness to be incurred by a school district or community college district for the construction,reconstruction, rehabilitation or replacement of school facilities or the acquisition or lease of real propertyfor school facilities, if approved by 55% of the voters of the district, but only if certain accountabilitymeasures are included in the proposition. See “—Proposition 39” herein.
Since its adoption, Article XIIIA has been amended a number of times. These amendments havecreated a number of exceptions to the requirement that property be reassessed when purchased, newlyconstructed or a change in ownership has occurred. These exceptions include certain transfers of realproperty between family members, certain purchases of replacement dwellings for persons over age 55and by property owners whose original property has been destroyed in a declared disaster, and certainimprovements to accommodate disabled persons and for seismic upgrades to property.
Both the California State Supreme Court and the United States Supreme Court have upheld thevalidity of Article XIIIA.

B-28
Legislation Implementing Article XIIIA. Legislation has been enacted and amended a numberof times since 1978 to implement Article XIIIA. Under current law, local agencies are no longerpermitted to levy directly any property tax (except to pay voter-approved indebtedness). The 1% propertytax is automatically levied by the county and distributed according to a formula among taxing agencies.The formula apportions the tax roughly in proportion to the relative shares of taxes levied prior to 1979.
Increases of assessed valuation resulting from reappraisals of property due to new construction,change in ownership or the 2% annual adjustment are allocated among the various jurisdictions in the“taxing area” based upon their respective “situs.” Any such allocation made to a local agency continuesas part of its allocation in future years.
Unitary Property. Some amount of property tax revenue is derived from utility property which isconsidered part of a utility system with components located in many taxing jurisdictions (“unitaryproperty”). Under the State Constitution, such property is assessed by the State Board of Equalization(“SBE”) as part of a “going concern” rather than as individual pieces of real or personal property. State-assessed unitary and certain other property is allocated to the counties by SBE, taxed at specialcounty-wide rates, and the tax revenues distributed to taxing jurisdictions (including the Districts)according to statutory formulae generally based on the distribution of taxes in the prior year.
The California electric utility industry has been undergoing significant changes in its structureand in the way in which components of the industry are regulated and owned. Sale of electric generationassets to largely unregulated, nonutility companies may affect how those assets are assessed, and whichlocal agencies are to receive the property taxes. The Districts are unable to predict the impact of thesechanges on its utility property tax revenues, or whether legislation may be proposed or adopted inresponse to industry restructuring, or whether any future litigation may affect ownership of utility assetsor the State’s methods of assessing utility property and the allocation of assessed value to local taxingagencies, including the Districts.
Article XIIIB of the California Constitution. An initiative constitutional amendment entitled“Limitation of Government Appropriations” was approved by California voters on November 6, 1979.Under the amendment, which adds Article XIIIB to the California Constitution, state and localgovernment agencies are subject to an annual “appropriations limit,” and are prohibited from spending“appropriations subject to limitation” above that limit. Article XIIIB was modified substantially byPropositions 98 and 111 in 1988 and 1990, respectively. “Appropriations subject to limitation,” for localgovernment purposes, consist of “tax revenues,” state subventions and certain other funds (together hereinreferred to as “proceeds of taxes”). The amendment does not affect the appropriation of money excludedfrom the definition of “appropriations subject to limitation,” such as debt service on indebtedness existingor authorized by January 1, 1979, or subsequently authorized by the voters and appropriations mandatedby the courts. The amendment also excludes from limitation the appropriation of proceeds fromregulatory licenses, user charges or other fees to the extent that such proceeds equal “the costs reasonablyborne by such entity in providing the regulation, product or service.”
The appropriation limit for each agency in each year is based on the limit for the prior year,adjusted annually for changes in the cost of living and changes in population, and adjusted, whereapplicable, for transfer of financial responsibility of providing services to or from another unit ofgovernment and for certain declared emergencies. As amended, Article XIIIB defines (a) the “change inthe cost of living” with respect to school districts to mean the percentage change in State per capitapersonal income from the preceding year; and (b) the “change in population” with respect to schooldistricts to mean the percentage change in the average daily attendance of the school districts from thepreceding fiscal year. Either test is likely to be greater than the change in the cost-of-living index, whichwas used prior to the enactment of Proposition 111.
B-29
As amended by Proposition 111, the appropriations limit is tested over consecutive two-yearperiods. Any excess of the aggregate “proceeds of taxes” received by an agency over such two-yearperiod above the combined appropriations limits for those two fiscal years is to be returned to taxpayersby reductions in tax rates or fee schedules over the subsequent two fiscal years.
Section 4 of Article XIIIB provides that the appropriations limit imposed on any entity ofgovernment may be changed by the electors of such entity, provided that the duration of any such changeshall not exceed four years from the most recent vote of the electors.
As originally enacted in 1979, the appropriations limit for each agency was based on 1978-79fiscal year authorizations to expend proceeds of taxes and was adjusted annually to reflect changes in costof living and population (using different definitions, which were modified by Proposition 111). Startingin the 1990-91 Fiscal Year, each agency’s appropriations limit was recalculated by taking the actual1986-1987 limit, and applying the annual adjustments as if Proposition 111 had been in effect.
The appropriations of an entity of local government subject to Article XIIIB limitations includethe proceeds of taxes levied by or for that entity and the proceeds of certain state subventions to thatentity. “Proceeds of taxes” include, but are not limited to, all tax revenues and the proceeds to the entityfrom (a) regulatory licenses, user charges and user fees (but only to the extent that these proceeds exceedthe reasonable costs in providing the regulation, product or service), and (b) the investment of taxrevenues.
Appropriations subject to limitation do not include (a) refunds of taxes, (b) appropriations forcertain debt service, (c) appropriations required to comply with certain mandates of the courts or thefederal government, (d) appropriations of certain special districts, (e) appropriations for all qualifiedcapital outlay projects as defined by the Legislature, (f) appropriations derived from certain fuel andvehicle taxes and (g) appropriations derived from certain taxes on tobacco products.
Article XIIIB also includes a requirement that 50% of all revenues received by the State in afiscal year and in the fiscal year immediately following it in excess of the amount permitted to beappropriated during that fiscal year and the fiscal year immediately following it shall be transferred andallocated to the State School Fund pursuant to Section 8.5 of Article XVI of the State Constitution. See“—Propositions 98 and 111” below.
Article XIIIC and Article XIIID of the California Constitution. On November 5, 1996,California voters approved Proposition 218—Voters Approval for Local Government Taxes—Limitationon Fees, Assessments, and Charges—Initiative Constitutional Amendment. Proposition 218 addedArticles XIIIC and XIIID to the California Constitution, imposing certain vote requirements and otherlimitations on the imposition of new or increased taxes, assessments and property-related fees andcharges. Proposition 218 states that all taxes imposed by local governments shall be deemed to be eithergeneral taxes or special taxes. Special purpose districts, including school districts, have no power to levygeneral taxes. No local government may impose, extend or increase any general tax unless and until suchtax is submitted to the electorate and approved by a majority vote. No local government may impose,extend or increase any special tax unless and until such tax is submitted to the electorate and approved bya two-thirds vote.
Proposition 218 also provides that no tax, assessment, fee or charge shall be assessed by anyagency upon any parcel of property or upon any person as an incident of property ownership except:(a) the ad valorem property tax imposed pursuant to Article XIII and Article XIIIA of the CaliforniaConstitution, (b) any special tax receiving a two-thirds vote pursuant to the California Constitution, and(c) assessments, fees and charges for property related services as provided in Proposition 218.

B-30
Proposition 218 also adds voter requirements for assessments and fees and charges imposed as an incidentof property ownership, other than fees and charges for sewer, water, and refuse collection services. Inaddition, all assessments and fees and charges imposed as an incident of property ownership, includingsewer, water, and refuse collection services, are subjected to various additional procedures, such ashearings and stricter and more individualized benefit requirements and findings. The effect of suchprovisions will presumably be to increase the difficulty a local agency will have in imposing, increasingor extending such assessments, fees and charges.
Proposition 218 also extended the initiative power to reducing or repealing any local taxes,assessments, fees and charges. This extension of the initiative power is not limited to taxes imposed on orafter November 6, 1996, the effective date of Proposition 218, and could result in retroactive repeal orreduction in any existing taxes, assessments, fees and charges, subject to overriding federal constitutionalprinciples relating to the impairment of contracts.
The Districts’ largest revenue source is revenue limit income from the State in accordance withthe revenue limit per unit of average daily attendance. In general, the Districts have not historically beenfunded through the imposition of special taxes or general taxes not already subject to a two-thirds voterapproval. Proposition 218 could, however, restrict the Districts’ ability to raise future revenues and couldsubject existing sources of revenue to reduction or repeal. The Districts are not able to predict at this timethe effect Proposition 218 will have on the Districts’ future revenues.
Proposition 26. On November 2, 2010, voters in the State approved Proposition 26.Proposition 26 amends Article XIIIC of the State Constitution to expand the definition of “tax” to include“any levy, charge, or exaction of any kind imposed by a local government” except the following: (1) acharge imposed for a specific benefit conferred or privilege granted directly to the payor that is notprovided to those not charged, and which does not exceed the reasonable costs to the local government ofconferring the benefit or granting the privilege; (2) a charge imposed for a specific government service orproduct provided directly to the payor that is not provided to those not charged, and which does notexceed the reasonable costs to the local government of providing the service or product; (3) a chargeimposed for the reasonable regulatory costs to a local government for issuing licenses and permits,performing investigations, inspections, and audits, enforcing agricultural marketing orders, and theadministrative enforcement and adjudication thereof; (4) a charge imposed for entrance to or use of localgovernment property, or the purchase, rental, or lease of local government property; (5) a fine, penalty, orother monetary charge imposed by the judicial branch of government or a local government, as a result ofa violation of law; (6) a charge imposed as a condition of property development; and (7) assessments andproperty-related fees imposed in accordance with the provisions of Article XIIID. Proposition 26provides that the local government bears the burden of proving by a preponderance of the evidence that alevy, charge, or other exaction is not a tax, that the amount is no more than necessary to cover thereasonable costs of the governmental activity, and that the manner in which those costs are allocated to apayor bear a fair or reasonable relationship to the payor’s burdens on, or benefits received from, thegovernmental entity.
Propositions 98 and 111. On November 8, 1988, voters approved Proposition 98, a combinedinitiative constitutional amendment and statute called the “Classroom Instructional Improvement andAccountability Act” (“Proposition 98”). In addition to adding certain provisions to the CaliforniaEducation Code, Proposition 98 also amended Article XIIIB and Section 8 of Article XVI of the StateConstitution and added Section 8.5 of Article XVI to the State Constitution, establishing a minimum levelof State funding for school districts, allocating to school districts, within limits, State revenues in excessof the State’s appropriations limit and exempting such excess funds from school district appropriationslimits.
B-31
On June 5, 1990, the voters approved Proposition 111 (Senate Constitutional Amendment No. 1)called the “Traffic Congestion Relief and Spending Limit Act of 1990” (“Proposition 111”) which furthermodified Article XIIIB and Sections 8 and 8.5 of Article XVI of the State Constitution with respect toappropriations limitations and school funding priority and allocation.
Article XIIIB, as amended by both Proposition 98 and Proposition 111, is discussed above under“—Article XIIIB of the California Constitution.”
The provisions of Sections 8 and 8.5 of Article XVI, as added and/or amended by Propositions 98and 111, may be summarized as follows:
(a) State Funding of Schools (Section 8). Moneys to be applied by the State for thesupport of school districts must be at a level equal to the greater of the following “tests”:
(i) The amount which, as a percentage of the State general fund (“GeneralFund”) revenues which may be appropriated pursuant to Article XIIIB, equals thepercentage of General Fund revenues appropriated for school districts in Fiscal Year1986-1987;
(ii) The amount actually appropriated to school districts in the prior fiscalyear from General Fund proceeds and from allocated local proceeds of taxes (excludingany excess State revenues allocated pursuant to Section 8.5), adjusted for changes inenrollment and for the change in the cost of living (operative only in a fiscal year inwhich the percentage growth in California per capita personal income is less than orequal to the percentage growth in per capita General Fund revenues plus one-half of onepercent); and
(iii) The amount actually appropriated to school districts in the prior fiscalyear from General Fund proceeds and from allocated local proceeds of taxes (excludingany excess State revenues allocated pursuant to Section 8.5) adjusted for changes inenrollment and for the change in per capita General Fund revenues, and, in addition, anamount equal to one-half of one percent times the prior year appropriations (excludingany excess State revenues) adjusted for changes in enrollment (operative only in a fiscalyear in which the percentage growth in California per capita personal income is greaterthan the percentage growth in per capita General Fund revenues plus one-half of onepercent).
If the third test is used in any year, the difference between the third test and the secondtest will become a “credit” to schools which will be paid in future years when the General Fundrevenue growth exceeds personal income growth. Legislation adopted prior to the end of the1988-1989 Fiscal Year implementing Proposition 98 determined the K-14 schools’ fundingguarantee under Test 1 to be 40.3% of the General Fund tax revenues, based on 1986-1987appropriations. However, that percent has been adjusted to approximately 35% to account for asubsequent redirection of local property taxes since such redirection directly affects the share ofState General Fund revenues to schools.
The Legislature by a two-thirds vote of both houses, with the Governor’s concurrence,may suspend for one year the minimum funding provisions for school districts as provided for inSection 8.

B-32
(a) Allocations to the State School Fund (Section 8.5). In addition to the amountsapplied to school districts under the tests discussed above, the State Controller is directed toallocate available excess State revenues (pursuant to Article XIIIB) to the State School Fund.However, no such allocation is required at any time that the Director of Finance and theSuperintendent of Public Instruction mutually determine that current annual expenditures perstudent equal or exceed the average annual expenditures per student of the 10 states with thehighest annual expenditures per student and the average class size equals or is less than theaverage class size of the 10 states with the lowest class size.
Such allocations do not constitute appropriations subject to Article XIIIB limitations and are to bemade in an equal amount per enrollment.
Proposition 39. On November 7, 2000, California voters approved Proposition 39, called the“Smaller Classes, Safer Schools and Financial Accountability Act” (the “Smaller Classes Act”) whichamends Section 1 of Article XIIIA, Section 18 of Article XVI of the California Constitution and Section47614 of the California Education Code and allows an alternative means of seeking voter approval forbonded indebtedness by 55% of the vote, rather than the two-thirds majority required under Section 18 ofArticle XVI of the Constitution. The 55% voter requirement applies only if the bond measure submittedto the voters includes, among other items: (a) a restriction that the proceeds of the bonds may be used for“the construction, reconstruction, rehabilitation, or replacement of school facilities, including thefurnishing and equipping of school facilities, or the acquisition or lease of real property for schoolfacilities,” (b) a list of projects to be funded and a certification that the school district board has evaluated“safety, class size reduction, and information technology needs in developing that list,” and (c) thatannual, independent performance and financial audits will be conducted regarding the expenditure anduse of the bonds proceeds.
Section 1(b)(3) of Article XIIIA has been added to except from the 1% ad valorem tax limitationunder Section 1(a) of Article XIIIA of the Constitution levies to pay bonds approved by 55% of thevoters, subject to the restrictions explained above.
The Legislature enacted AB 1908, Chapter 44, which became effective upon passage ofProposition 39 and amends various sections of the Education Code. Under amendments to Section 15268and 15270 of the Education Code, the following limits on ad valorem taxes apply in any single election:(a) for a school district, indebtedness shall not exceed $30 per $100,000 of taxable property, (b) for aunified school district, indebtedness shall not exceed $60 per $100,000 of taxable property, and (c) for acommunity college district, indebtedness shall not exceed $25 per $100,000 of taxable property. Finally,AB 1908 required that a citizens’ oversight committee must be appointed, and must review the use of thebond funds and inform the public about their proper usage.
Proposition 1A. On November 2, 2004, California voters approved Proposition 1A, whichamends the State Constitution to significantly reduce the State’s authority over major local governmentrevenue sources. Under Proposition 1A, the State cannot (a) reduce local sales tax rates or alter themethod of allocating the revenue generated by such taxes, (b) shift property taxes from local governmentsto schools or community colleges, (c) change how property tax revenues are shared among localgovernments without two-thirds approval of both houses of the Legislature, or (d) decrease VehicleLicense Fee revenues without providing local governments with equal replacement funding. Beginning in2008-2009, the State may shift to schools and community colleges a limited amount of local governmentproperty tax revenue if certain conditions are met, including: (i) a proclamation by the Governor that theshift is needed due to a severe financial hardship of the State, and (ii) approval of the shift by theLegislature with a two-thirds vote of both houses. Under such a shift, the State must repay localgovernments for the property tax losses, with interest, within three years. Proposition 1A does allow the

B-33
State to approve voluntary exchanges of local sales tax and property tax revenues among localgovernments within a county. Proposition 1A also amends the State Constitution to require the State tosuspend certain State laws creating mandates in any year that the State does not fully reimburse localgovernments for their costs to comply with the mandates. This provision does not apply to mandatesrelating to schools or community colleges or to those mandates relating to employee rights.
Proposition 22. On November 2, 2010, California’s voters approved Proposition 22, aconstitutional initiative entitled the “Local Taxpayer, Public Safety, and Transportation Act of 2010.”Proposition 22 prohibits the State from enacting new laws that require redevelopment agencies to shiftfunds to schools or other agencies and eliminates the State’s authority to shift property taxes temporarilyduring a severe financial hardship of the State. In addition, Proposition 22 restricts the State’s authorityto use State fuel tax revenues to pay debt service on state transportation bonds, to borrow or change thedistribution of state fuel tax revenues, and to use vehicle license fee revenues to reimburse localgovernments for state mandated costs. Proposition 22 impacts resources in the State’s general fund andtransportation funds, the State’s main funding source for schools and community colleges, as well asuniversities, prisons and health and social services programs. According to an analysis of Proposition 22submitted by the LAO on July 15, 2010, the expected reduction in resources available for the State tospend on these other programs as a consequence of the passage of Proposition 22 will be approximately$1 billion in Fiscal Year 2010-2011, with an estimated immediate fiscal effect equal to approximately 1%of the State’s total general fund spending. The longer-term effect of Proposition 22, according to theLAO analysis, will be an increase in the State’s general fund costs by approximately $1 billion annuallyfor several decades.
As a result of the decision of the Court in Matosantos, all redevelopment agencies in Californiawere dissolved as of February 1, 2012, and all net tax increment revenues, after payment of property taxrevenue to taxing agencies, including the Districts, that would have been paid to such taxing agencies hadthe redevelopment agencies continued in existence, redevelopment bonds debt service and administrativecosts, will be distributed to cities, counties, special districts and school districts. As a result of thecontinuing ongoing implementation of AB1X 26, the Districts can make no representations regardingwhat affect such implementation of AB1X 26 will have on each District’s future receipt of tax incrementrevenues. See “State Funding of Education—Dissolution of Redevelopment Agencies” herein.
Proposition 30. On November 6, 2012, California voters approved Proposition 30 entitled theTemporary Taxes to Fund Education, Guaranteed Local Public Safety Funding, Initiative ConstitutionalAmendment. Proposition 30 temporarily increases the State sales and use tax as well as the State personalincome tax rates on higher incomes. Proposition 30 temporarily imposes an additional tax on all retailers,at the rate of 1/4% of gross receipts of any retailer from the sale of all tangible personal property sold inthe State from January 1, 2013 to December 31, 2017. Proposition 30 also imposes an additional excisetax on the storage, use, or other consumption in the State of tangible personal property purchased from aretailer on and after January 1, 2013, and before January 1, 2017, for storage, use, or other consumption inthe State, at the rate of 1/4% of the sales price of the property. For personal income taxes imposedbeginning in the taxable year commencing January 1, 2012 and ending January 1, 2019, Proposition 30increases the marginal personal income tax rate by: (i) 1% for taxable income over $250,000 but less than$300,000 (over $340,000 but less than $408,000 for joint filers); (ii) 2% for taxable income over$300,000 but less than $500,000 (over $408,000 but less than $680,000 for joint filers); and (iii) 3% fortaxable income over $500,000 (over $608,000 for joint filers).
The revenues generated from the temporary tax increases are included in the calculation of theProposition 98 minimum funding guarantee for K-14 districts. See “—Constitutional and StatutoryProvisions Affecting School District Revenues and Appropriations–Propositions 98 and 111” above.From an accounting perspective, the revenues generated from the temporary tax increases will be

B-34
deposited into the State account created pursuant to Proposition 30 called the Education ProtectionAccount (the “EPA”). Pursuant to Proposition 30, funds in the EPA will be allocated quarterly, with 89%of such funds provided to school districts and 11% provided to community college districts. The fundswill be distributed to K-14 districts in the same manner as existing unrestricted per-student funding,except that no school district will receive less than $200 per unit of A.D.A. and no community collegedistrict will receive less than $100 per full time equivalent student. The governing board of each K-14district is granted sole authority to determine how the moneys received from the EPA are spent.However, the appropriate governing board of each K-14 district is required to make these spendingdeterminations in open session at a public meeting and such local governing boards are prohibited fromusing any funds from the EPA for salaries or benefits of administrators or any other administrative costs.
Application of Constitutional and Statutory Provisions. The application of Proposition 98 andother statutory regulations has become increasingly difficult to accurately predict in recent years. For adiscussion of how the provisions of Proposition 98 have been applied to school funding, see“APPENDIX B—GENERAL DISTRICT FINANCIAL INFORMATION—State Funding of Education”herein.
Possible Future Actions. Article XIIIA, Article XIIIB, Article XIIIC, Article XIIID andPropositions 26, 98 and 111 were each adopted as measures that qualified for the ballot pursuant to theState’s initiative process. From time to time other initiative measures could be adopted, further affectingthe Districts’ revenues or the Districts’ ability to expend revenues. There is no assurance that theCalifornia electorate or Legislature will not at some future time approve additional limitations whichcould reduce property or other tax revenues or otherwise adversely affect the revenues of the Districts.

APPENDIX C
CERTAIN BACKGROUND INFORMATIONAND PROJECTED CASH FLOWS FOR DISTRICTS

CERTAIN BACKGROUND INFORMATIONAND PROJECTED CASH FLOWS FOR SERIES J DISTRICTS

Alvord Unified Alvord UnifiedRiverside Riverside
Fiscal Year 2013-14 Fiscal Year 2014-15Jul 2013 Aug 2013 Sep 2013 Oct 2013 Nov 2013 Dec 2013 Jan 2014 Feb 2014 Mar 2014 Apr 2014 May 2014 Jun 2014 Accruals Total
Actual / Projected Actual Actual Actual Actual Actual Actual Projected Projected Projected Projected Projected Projected Projected 2013-14Beginning Cash 17,071,433 14,251,859 10,711,445 17,475,130 15,766,888 14,967,987 24,411,342 26,190,656 22,892,069 26,769,350 21,864,129 10,295,350 Receipts
LCFF/Revenue LimitApportionment 4,394,625 4,369,643 12,389,926 7,887,963 7,887,899 12,389,926 7,887,899 7,887,899 12,389,926 4,908,026 245,401 4,502,027 23,352,368 110,493,528 Property Taxes - 857,618 836,106 - 580,084 5,949,007 3,551,170 - - 2,850,539 - 1,007,694 - 15,632,218 Other - - - - - - - - - - - - - -
Federal Revenues - 427,247 2,227,137 (25,095) 591,478 1,083,302 1,202,878 11,728 529,451 181,982 1,497,608 545,588 3,577,213 11,850,517 Other State Revenues - - 4,157,564 939,072 2,660,273 694,643 456,977 547,733 599,988 685,108 735,183 330,542 459,188 12,266,271 Other Local Revenues (4,130) 492,970 12,472 471,085 877,108 497,697 1,306,490 333,793 348,264 266,601 242,322 546,745 29,086 5,420,502 Interfund Transfers In - - - - - - - - - - - - - - Other Financing Sources - - - - - - - - - - - - - -
Total Receipts 4,390,495 6,147,478 19,623,205 9,273,025 12,596,842 20,614,575 14,405,414 8,781,153 13,867,629 8,892,256 2,720,514 6,932,596 27,417,855 155,663,037 Disbursements
Certificated Salaries 3,702,988 6,486,618 6,711,804 6,795,445 6,912,275 6,875,332 7,766,332 7,766,332 8,033,974 7,866,332 7,833,697 7,833,697 - 84,584,826 Classified Salaries 866,561 1,318,711 1,467,378 1,520,347 1,583,352 1,520,347 1,583,352 1,182,196 1,617,133 1,520,347 1,541,445 1,348,489 - 17,069,658 Employee Benefits 4,367,967 2,040,016 3,486,632 1,695,256 2,608,401 2,260,936 1,970,684 2,011,778 2,648,855 2,415,931 2,494,098 2,783,775 - 30,784,329 Supplies and Services 944,909 1,525,841 1,393,152 1,849,260 1,814,187 1,242,402 1,310,774 1,286,186 1,115,906 1,994,867 2,420,053 2,420,053 12,205,580 31,523,171 Capital Outlay - - - - - - - - - - - - 10,000 10,000 Other Outgo - - - - 114,450 - - (166,346) - - - - (226,744) (278,640) Interfund Transfers Out - - - - - - - - - - - - 333,536 333,536 Other Financing Uses - - - - - - - - - - - - - -
Total Disbursements 9,882,425 11,371,186 13,058,966 11,860,308 13,032,665 11,899,017 12,631,142 12,080,146 13,415,868 13,797,477 14,289,293 14,386,014 12,322,372 164,026,879 Asset TransactionsDeferred Apportionment 9,245,470 5,859,272 15,104,742 Accounts Receivable 8,257,812 1,531,755 206,405 1,093,401 1,640,750 727,797 5,042 - - - - - - 13,462,962 Due From Other Funds - - - - - - - - - - - - - - Other - - - - - - - 406 - - - - - 406 SUBTOTAL ASSETS 17,503,282 7,391,027 206,405 1,093,401 1,640,750 727,797 5,042 406 - - - - - 28,568,110 Accounts Payable 3,296,926 464,615 6,959 214,360 2,003,828 - - - - - - - - 5,986,688 Due To Other Funds - - - - - - - - - - - - - - Current Loan - - - - - - - - - - - - - - Other - - - - - - - - - - - - - - SUBTOTAL LIABILITIES 3,296,926 464,615 6,959 214,360 2,003,828 - - - - - - - - 5,986,688
Total PY Transactions 14,206,356 6,926,412 199,446 879,041 (363,078) 727,797 5,042 406 - - - - - 22,581,422 Net Increase/Decrease 8,714,426 1,702,704 6,763,685 (1,708,242) (798,901) 9,443,355 1,779,314 (3,298,587) 451,761 (4,905,221) (11,568,779) (7,453,418) 15,095,483
FY TRAN Deposits - - - - - - - - - - - - - - FY TRAN Repayments - - - - - - - - - - - - - - CY TRAN Deposits - - - - - - - - 3,425,520 - - - - 3,425,520 CY TRAN Repayments (11,534,000) (5,243,118) - - - - - - - - - - - (16,777,118)
Ending Cash with TRAN 14,251,859 10,711,445 17,475,130 15,766,888 14,967,987 24,411,342 26,190,656 22,892,069 26,769,350 21,864,129 10,295,350 2,841,932 TRAN Balance 5,178,000 - - - - - - - 3,425,520 3,425,520 3,425,520 3,425,520 Ending Cash without TRAN 9,073,859 10,711,445 17,475,130 15,766,888 14,967,987 24,411,342 26,190,656 22,892,069 23,343,830 18,438,609 6,869,830 (583,588) Source: The District
Summary of Revenues, Expenditures & Changes in General Fund Balance Projected Alternate Cash Resources2010-11 2011-12 2012-13 2013-14 2014-15 Set-Aside 1 Maturity
(Audited) (Audited) (Audited) (Projected) (Projected) Fund Name Jul 31, 2014 Oct 01, 2014Beginning Fund Balance 18,276,221 18,978,252 19,910,689 17,758,587 12,789,934 14 - Deferred Maintenance (R) - -
25 - Capital Facilities (R) 3,000,000 3,000,000 Total Revenues 147,928,422 147,665,191 147,073,376 154,140,027 159,410,149 35 - County School Facilities (R) 11,000,000 9,000,000
40 - Special Reserve for Cap Outlay (U) 2,000,000 2,000,000 Total Expenditures 147,226,391 146,618,304 145,089,351 158,775,144 150,738,910 67 - Self-Insurance (R) 5,087,620 5,087,620
Other Sources & Uses - (114,450) (4,012,679) (333,536) -
Ending Fund Balance 18,978,252 19,910,689 17,882,035 12,789,934 21,461,173 Source: District Annual Financial Statements & the District.
Total Other Restricted Funds (R) 19,087,620 17,087,620 Total Other Unrestricted Funds (U) 2,000,000 2,000,000 Grand Total 21,087,620 19,087,620
Excludes Bond Proceed, Bond Interest & Redemption and Debt Service Funds.Source: The District.
C-3 C-4

Alvord UnifiedRiverside
Fiscal Year 2014-15Jul 2014 Aug 2014 Sep 2014 Oct 2014 Nov 2014 Dec 2014 Jan 2015 Feb 2015 Mar 2015 Apr 2015 May 2015 Jun 2015 Accruals Total
Actual / Projected Projected Projected Projected Projected Projected Projected Projected Projected Projected Projected Projected Projected Projected 2014-15Beginning Cash 2,841,932 14,851,506 12,222,630 19,156,988 18,638,389 18,477,194 29,794,665 33,632,422 32,299,396 34,824,292 35,344,246 33,523,201 Receipts
LCFF/Revenue LimitApportionment 4,941,734 4,941,734 13,970,285 8,895,120 8,895,120 13,970,285 8,895,120 8,895,120 13,970,285 8,895,120 8,895,120 13,970,285 - 119,135,331 Property Taxes - 924,795 897,595 - 625,596 6,419,164 3,835,178 - - 3,073,583 - 1,087,994 - 16,863,905 Other - - - - - - - - - - - - - -
Federal Revenues - 348,384 1,813,332 (20,266) 481,561 882,057 979,527 9,651 431,378 148,618 1,219,825 443,924 2,913,491 9,651,482 Other State Revenues - - 2,826,247 638,803 1,808,831 472,014 311,062 372,774 407,800 466,176 499,534 224,332 311,896 8,339,471 Other Local Revenues (4,336) 492,724 12,467 471,042 877,037 497,602 1,306,341 333,903 347,996 266,689 242,296 546,929 29,271 5,419,960 Interfund Transfers In - - - - - - - - - - - - - - Other Financing Sources - - - - - - - - - - - - - -
Total Receipts 4,937,397 6,707,636 19,519,926 9,984,699 12,688,146 22,241,123 15,327,230 9,611,448 15,157,460 12,850,186 10,856,776 16,273,464 3,254,658 159,410,149 Disbursements
Certificated Salaries 3,784,912 6,625,632 6,853,540 6,943,076 7,065,170 7,024,472 7,024,472 7,024,472 7,577,964 7,024,472 6,991,913 7,455,870 - 81,395,965 Classified Salaries 876,851 1,334,263 1,484,432 1,537,941 1,601,806 1,537,941 1,601,806 1,196,176 1,634,601 1,537,941 1,558,654 1,363,606 - 17,266,016 Employee Benefits 4,425,159 2,067,569 3,533,267 1,718,297 2,641,374 2,288,983 1,995,844 2,039,503 2,681,915 2,448,027 2,525,989 2,819,129 - 31,185,055 Supplies and Services 625,494 1,009,131 921,561 1,223,883 1,200,949 821,482 867,352 850,672 738,083 1,319,793 1,601,265 1,601,265 8,073,044 20,853,974 Capital Outlay - - - - - - - - - - - - - - Other Outgo - - - - 114,437 - - (166,348) - - - - (226,757) (278,668) Interfund Transfers Out - - - - - - - - - - - - 316,568 316,568 Other Financing Uses - - - - - - - - - - - - - -
Total Disbursements 9,712,416 11,036,594 12,792,800 11,423,197 12,623,736 11,672,878 11,489,473 10,944,474 12,632,563 12,330,232 12,677,821 13,239,871 8,162,855 150,738,910 Asset TransactionsDeferred Apportionment 23,352,368 - - - - - - - - - - - - 23,352,368 Accounts Receivable - 2,137,247 207,233 1,115,868 1,673,802 749,226 - - - - - - - 5,883,376 Due From Other Funds - - - - - - - - - - - - - - Other - - - - - - - - - - - - - - SUBTOTAL ASSETS 23,352,368 2,137,247 207,233 1,115,868 1,673,802 749,226 - - - - - - - 29,235,744 Accounts Payable 3,120,454 437,165 - 195,971 1,899,407 - - - - - - - - 5,652,996 Due To Other Funds - - - - - - - - - - - - - - Current Loan - - - - - - - - - - - - - - Other - - - - - - - - - - - - - - SUBTOTAL LIABILITIES 3,120,454 437,165 - 195,971 1,899,407 - - - - - - - - 5,652,996
Total PY Transactions 20,231,914 1,700,082 207,233 919,898 (225,605) 749,226 - - - - - - - 23,582,748 Net Increase/Decrease 15,456,895 (2,628,876) 6,934,359 (518,600) (161,194) 11,317,471 3,837,757 (1,333,026) 2,524,896 519,954 (1,821,045) 3,033,593 (4,908,197)
FY TRAN Deposits - - - - - - - - - - - - - FY TRAN Repayments - - - - - - - - - - - - - CY TRAN Deposits - - - - - - - - - - - - - CY TRAN Repayments (3,447,321) - - - - - - - - - - - (3,447,321)
Ending Cash with TRAN 14,851,506 12,222,630 19,156,988 18,638,389 18,477,194 29,794,665 33,632,422 32,299,396 34,824,292 35,344,246 33,523,201 36,556,794 TRAN Balance - - - - - - - - - - - - Ending Cash without TRAN 14,851,506 12,222,630 19,156,988 18,638,389 18,477,194 29,794,665 33,632,422 32,299,396 34,824,292 35,344,246 33,523,201 36,556,794 Source: The District
003
C-4

Corcoran Unified Corcoran UnifiedKings Kings
Fiscal Year 2013-14 Fiscal Year 2014-15Jul 2013 Aug 2013 Sep 2013 Oct 2013 Nov 2013 Dec 2013 Jan 2014 Feb 2014 Mar 2014 Apr 2014 May 2014 Jun 2014 Accruals Total
Actual / Projected Actual Actual Actual Actual Actual Actual Projected Projected Projected Projected Projected Projected Projected 2013-14Beginning Cash 8,030,140 8,555,122 7,409,159 8,101,769 7,554,592 5,924,970 7,896,852 7,319,052 5,382,193 5,570,839 4,638,185 2,401,256 Receipts
LCFF/Revenue LimitApportionment 718,872 1,242,713 2,092,040 1,365,876 1,421,627 2,092,039 1,712,403 1,712,403 1,712,403 1,065,495 53,275 - 4,200,050 19,389,198 Property Taxes 216,576 - - - - 1,232,669 - - - 292,054 - - - 1,741,300 Other - - - - (228,644) - (2,261) (2,261) (2,261) (2,261) (2,261) (2,261) - (242,210)
Federal Revenues - 20,403 165,123 1,965 405 749,991 189,695 189,695 189,695 189,695 189,695 189,695 - 2,076,059 Other State Revenues (7,176) (3,190) 688,637 26,323 255,019 142,034 131,300 131,300 131,300 131,300 131,300 131,300 - 1,889,447 Other Local Revenues 69,410 55,020 125,846 134,325 79,308 123,001 170,455 170,455 170,455 170,455 170,455 170,455 - 1,609,643 Interfund Transfers In - - - - - - - - - - - - - - Other Financing Sources - - - - - - - - - - - - - -
Total Receipts 997,683 1,314,947 3,071,646 1,528,489 1,527,715 4,339,734 2,201,593 2,201,593 2,201,593 1,846,740 542,465 489,190 4,200,050 26,463,437 Disbursements
Certificated Salaries 90,112 1,118,949 1,093,676 1,110,969 1,180,278 1,131,522 1,165,678 1,165,678 1,165,678 1,165,678 1,165,678 1,165,678 - 12,719,575 Classified Salaries 136,872 250,072 254,235 248,868 285,747 257,362 294,798 294,798 294,798 294,798 294,798 294,798 - 3,201,942 Employee Benefits 283,447 201,807 445,187 465,129 479,073 472,283 538,049 538,049 538,049 538,049 538,049 538,049 - 5,575,224 Supplies and Services 347,951 546,446 372,748 390,851 330,551 600,147 627,947 627,947 627,947 627,947 627,947 627,947 - 6,356,377 Capital Outlay - 42,854 10,570 86,252 (36,736) 5,979 4,631 4,631 4,631 4,631 4,631 4,631 - 136,703 Other Outgo 144,880 234,483 - 26,176 - 26,176 18,917 18,917 18,917 18,917 18,917 18,917 - 545,219 Interfund Transfers Out - - - 1,130 1,154,117 - - - - - - - - 1,155,247 Other Financing Uses - - - - - - - - - - - - - -
Total Disbursements 1,003,263 2,394,611 2,176,416 2,329,376 3,393,030 2,493,470 2,650,020 2,650,020 2,650,020 2,650,020 2,650,020 2,650,020 - 29,690,288 Asset TransactionsDeferred Apportionment 1,780,966 - 1,780,966 Accounts Receivable 1,462,244 826,530 144,686 169,668 229,409 - 5,804 5,804 5,804 5,804 5,804 5,804 - 2,867,361 Due From Other Funds - 41,000 - - - - - - - - - - - 41,000 Other - - - - - - - - - - - - - - SUBTOTAL ASSETS 3,243,210 867,530 144,686 169,668 229,409 - 5,804 5,804 5,804 5,804 5,804 5,804 - 4,689,327 Accounts Payable 1,602,437 43,265 347,306 (54,216) (6,284) (125,618) 129,950 129,950 129,950 129,950 129,950 129,949 - 2,586,588 Due To Other Funds 590,270 - - - - - - - - - - - - 590,270 Current Loan - - - - - - - - - - - - - - Other (1,540) 20,403 - (29,826) - - 5,228 5,228 5,228 5,228 5,228 5,228 - 20,403 SUBTOTAL LIABILITIES 2,191,167 63,669 347,306 (84,042) (6,284) (125,618) 135,177 135,177 135,177 135,177 135,177 135,177 - 3,197,261
Total PY Transactions 1,052,043 803,861 (202,620) 253,710 235,693 125,618 (129,373) (129,373) (129,373) (129,373) (129,373) (129,373) - 1,492,066 Net Increase/Decrease 1,046,463 (275,803) 692,610 (547,177) (1,629,622) 1,971,882 (577,800) (577,800) (577,800) (932,654) (2,236,929) (2,290,204) 4,200,050
FY TRAN Deposits 1,345,518 - - - - - - - - - - - - 1,345,518 FY TRAN Repayments - - - - - - - (1,359,058) - - - - - (1,359,058) CY TRAN Deposits - - - - - - - - 766,446 - - - - 766,446 CY TRAN Repayments (1,867,000) (870,159) - - - - - - - - - - - (2,737,159)
Ending Cash with TRAN 8,555,122 7,409,159 8,101,769 7,554,592 5,924,970 7,896,852 7,319,052 5,382,193 5,570,839 4,638,185 2,401,256 111,052 TRAN Balance 2,195,136 1,345,518 1,345,518 1,345,518 1,345,518 1,345,518 1,345,518 - 766,446 766,446 766,446 766,446 Ending Cash without TRAN 6,359,986 6,063,641 6,756,251 6,209,074 4,579,452 6,551,334 5,973,533 5,382,193 4,804,393 3,871,739 1,634,810 (655,394) Source: The District
Summary of Revenues, Expenditures & Changes in General Fund Balance Projected Alternate Cash Resources2010-11 2011-12 2012-13 2013-14 2014-15 Set-Aside 1 Maturity
(Audited) (Audited) (Audited) (Projected) (Projected) Fund Name Jul 31, 2014 Oct 01, 2014Beginning Fund Balance 5,974,423 7,371,019 7,179,381 6,817,208 3,408,599 12 - Child Development (R) - -
13 - Cafeteria Special Revenue (R) 50,000 - Total Revenues 28,650,882 26,731,981 27,099,116 25,984,609 29,450,295 14 - Deferred Maintenance (R) 400,000 350,000
25 - Capital Facilities (R) 282,000 282,000 Total Expenditures 27,255,177 27,030,867 27,340,967 28,237,972 29,475,882 40 - Special Reserve for Cap Outlay (U) 1,200,000 1,200,000
Other Sources & Uses 891 307,791 (120,322) (1,155,247) -
Ending Fund Balance 7,371,019 7,379,924 6,817,208 3,408,599 3,383,013 Source: District Annual Financial Statements & the District.
Total Other Restricted Funds (R) 732,000 632,000 Total Other Unrestricted Funds (U) 1,200,000 1,200,000 Grand Total 1,932,000 1,832,000
Excludes Bond Proceed, Bond Interest & Redemption and Debt Service Funds.Source: The District.
C-5 C-6

Corcoran UnifiedKings
Fiscal Year 2014-15Jul 2014 Aug 2014 Sep 2014 Oct 2014 Nov 2014 Dec 2014 Jan 2015 Feb 2015 Mar 2015 Apr 2015 May 2015 Jun 2015 Accruals Total
Actual / Projected Projected Projected Projected Projected Projected Projected Projected Projected Projected Projected Projected Projected Projected 2014-15Beginning Cash 111,052 1,662,114 1,167,444 2,153,834 1,824,986 1,109,012 2,075,707 1,359,734 643,760 769,336 894,481 178,508 Receipts
LCFF/Revenue LimitApportionment 879,697 879,697 2,425,005 1,583,455 1,583,455 2,425,005 1,583,455 1,583,455 2,425,005 1,583,455 1,583,455 2,425,005 - 20,960,143 Property Taxes 239,674 - - - - 841,119 - - - 841,119 - - - 1,921,912 Other - - - - (33,916) (33,916) (33,916) (33,916) (33,916) (33,916) (33,916) (33,916) - (271,329)
Federal Revenues - 19,385 157,256 1,780 224,905 224,905 224,905 224,905 224,905 224,905 224,905 224,905 - 1,977,663 Other State Revenues (7,214) (3,119) 688,616 26,320 155,582 155,582 155,582 155,582 155,582 155,582 155,582 155,582 - 1,949,259 Other Local Revenues 60,687 48,196 110,145 117,463 115,697 115,697 115,697 115,697 115,697 115,697 115,697 115,697 - 1,262,064 Interfund Transfers In - - - - - - - - - - - - - - Other Financing Sources - - - - - - - - - - - - - -
Total Receipts 1,172,844 944,159 3,381,022 1,729,018 2,045,723 3,728,391 2,045,723 2,045,723 2,887,272 2,886,842 2,045,723 2,887,272 - 27,799,712 Disbursements
Certificated Salaries 94,352 1,169,435 1,142,857 1,161,462 1,214,618 1,214,618 1,214,618 1,214,618 1,214,618 1,214,618 1,214,618 1,214,618 - 13,285,051 Classified Salaries 142,469 260,203 264,490 258,884 296,480 296,480 296,480 296,480 296,480 296,480 296,480 296,480 - 3,297,885 Employee Benefits 286,915 204,216 450,625 470,878 526,573 526,573 526,573 526,573 526,573 526,573 526,573 526,573 - 5,625,220 Supplies and Services 328,754 516,530 352,442 369,776 526,352 526,352 526,352 526,352 526,352 526,352 526,352 526,352 - 5,778,321 Capital Outlay - 20,911 5,156 42,083 (180) (180) (180) (180) (180) (180) (180) (180) - 66,710 Other Outgo 82,563 133,648 - 14,915 9,944 9,944 9,944 9,944 9,944 9,944 9,944 9,944 - 310,674 Interfund Transfers Out - - - - 139,003 139,003 139,003 139,003 139,003 139,003 139,003 139,003 - 1,112,021 Other Financing Uses - - - - - - - - - - - - - -
Total Disbursements 935,052 2,304,944 2,215,571 2,317,998 2,712,790 2,712,790 2,712,790 2,712,790 2,712,790 2,712,790 2,712,790 2,712,790 - 29,475,882 Asset TransactionsDeferred Apportionment 4,200,050 - - - - - - - - - - - - 4,200,050 Accounts Receivable - 884,044 155,681 180,701 33,360 33,360 33,360 33,360 33,360 33,360 33,360 33,360 - 1,487,306 Due From Other Funds - 44,480 - - - - - - - - - - - 44,480 Other - - - - - - - - - - - - - - SUBTOTAL ASSETS 4,200,050 928,524 155,681 180,701 33,360 33,360 33,360 33,360 33,360 33,360 33,360 33,360 - 5,731,837 Accounts Payable 2,116,245 42,552 334,741 (51,062) 79,430 79,430 79,430 79,430 79,430 79,430 79,430 79,430 - 3,077,916 Due To Other Funds - - - - - - - - - - - - - - Current Loan - - - - - - - - - - - - - - Other (2,837) 19,858 - (28,368) 2,837 2,837 2,837 2,837 2,837 2,837 2,837 2,837 - 11,347 SUBTOTAL LIABILITIES 2,113,408 62,409 334,741 (79,430) 82,267 82,267 82,267 82,267 82,267 82,267 82,267 82,267 - 3,089,264
Total PY Transactions 2,086,642 866,115 (179,060) 260,131 (48,907) (48,907) (48,907) (48,907) (48,907) (48,907) (48,907) (48,907) - 2,642,573 Net Increase/Decrease 2,324,434 (494,670) 986,390 (328,848) (715,974) 966,695 (715,974) (715,974) 125,576 125,145 (715,974) 125,576 -
FY TRAN Deposits - - - - - - - - - - - - - FY TRAN Repayments - - - - - - - - - - - - - CY TRAN Deposits - - - - - - - - - - - - - CY TRAN Repayments (773,373) - - - - - - - - - - - (773,373)
Ending Cash with TRAN 1,662,114 1,167,444 2,153,834 1,824,986 1,109,012 2,075,707 1,359,734 643,760 769,336 894,481 178,508 304,084 TRAN Balance - - - - - - - - - - - - Ending Cash without TRAN 1,662,114 1,167,444 2,153,834 1,824,986 1,109,012 2,075,707 1,359,734 643,760 769,336 894,481 178,508 304,084 Source: The District
005
C-6

Ducor Union Elementary Ducor Union ElementaryTulare Tulare
Fiscal Year 2013-14 Fiscal Year 2014-15Jul 2013 Aug 2013 Sep 2013 Oct 2013 Nov 2013 Dec 2013 Jan 2014 Feb 2014 Mar 2014 Apr 2014 May 2014 Jun 2014 Accruals Total
Actual / Projected Actual Actual Actual Actual Actual Actual Projected Projected Projected Projected Projected Projected Projected 2013-14Beginning Cash 43,213 222,150 175,517 187,494 188,963 167,412 275,652 270,881 120,614 252,789 226,068 162,314 Receipts
LCFF/Revenue LimitApportionment 59,930 45,677 124,284 82,514 82,514 124,283 85,374 85,374 126,390 53,122 2,656 41,016 170,733 1,083,867 Property Taxes - - - - - 62,783 36,442 - - 20,441 33,480 37,236 - 190,382 Other - - - - - - - - - - - - - -
Federal Revenues - - 3,952 22,226 3,209 39,275 20,399 - 37,642 - 4,528 17 - 131,248 Other State Revenues 43,406 165 - 8,855 23,041 - 5,508 4,805 756 7,612 1,313 (1,293) - 94,167 Other Local Revenues (56) - 418 - 48 652 225 - 2,088 10 157 999 - 4,542 Interfund Transfers In - - - - - - - - - - - - - - Other Financing Sources - - - - - - - - - - - - - -
Total Receipts 103,280 45,842 128,654 113,595 108,812 226,993 147,948 90,180 166,876 81,185 42,134 77,974 170,733 1,504,207 Disbursements
Certificated Salaries 15,242 48,405 52,078 53,398 58,892 58,491 52,572 52,749 53,221 53,693 53,339 68,815 - 620,895 Classified Salaries 14,222 13,820 27,395 27,937 27,807 27,514 22,995 23,325 23,767 23,832 24,191 22,275 - 279,079 Employee Benefits 5,171 9,973 28,413 28,646 29,344 29,312 25,700 25,775 25,873 26,002 26,053 29,457 - 289,719 Supplies and Services 23,208 30,138 17,640 11,686 27,429 11,640 22,577 7,031 10,718 7,608 13,417 61,372 - 244,464 Capital Outlay - 6,505 - - - - - - - - - (6,505) - - Other Outgo - - - - - - - - - - - 4,644 - 4,644 Interfund Transfers Out - - - - - - - - - - - - - - Other Financing Uses - - - - - - - - - - - - - -
Total Disbursements 57,842 108,841 125,526 121,667 143,472 126,957 123,844 108,880 113,580 111,134 117,001 180,057 - 1,438,801 Asset TransactionsDeferred Apportionment 109,929 49,275 159,204 Accounts Receivable - - - - - - - - - - - - - - Due From Other Funds - - - (150) - - - - - - - - - (150) Other 56 - - - - - - - - - - - - 56 SUBTOTAL ASSETS 109,985 49,275 - (150) - - - - - - - - - 159,110 Accounts Payable 57,612 14,195 (8,848) (9,691) (13,110) (8,204) 28,876 (10,425) (5,599) (3,229) (11,113) (14,736) - 15,729 Due To Other Funds 16,000 - - - - - - - - - - - - 16,000 Current Loan - - - - - - - - - - - - - - Other - - - - - - - - - - - - - - SUBTOTAL LIABILITIES 73,612 14,195 (8,848) (9,691) (13,110) (8,204) 28,876 (10,425) (5,599) (3,229) (11,113) (14,736) - 31,729
Total PY Transactions 36,373 35,080 8,848 9,541 13,110 8,204 (28,876) 10,425 5,599 3,229 11,113 14,736 - 127,381 Net Increase/Decrease 81,811 (27,920) 11,977 1,469 (21,550) 108,240 (4,772) (8,276) 58,896 (26,721) (63,753) (87,346) 170,733
FY TRAN Deposits 139,127 - - - - - - - - - - - - 139,127 FY TRAN Repayments - - - - - - - (141,991) - - - - - (141,991) CY TRAN Deposits - - - - - - - - 73,279 - - - - 73,279 CY TRAN Repayments (42,000) (18,713) - - - - - - - - - - - (60,713)
Ending Cash with TRAN 222,150 175,517 187,494 188,963 167,412 275,652 270,881 120,614 252,789 226,068 162,314 74,968 TRAN Balance 155,259 139,127 139,127 139,127 139,127 139,127 139,127 - 73,279 73,279 73,279 73,279 Ending Cash without TRAN 66,891 36,391 48,368 49,836 28,286 136,526 131,754 120,614 179,510 152,789 89,035 1,689 Source: The District
Summary of Revenues, Expenditures & Changes in General Fund Balance Projected Alternate Cash Resources2010-11 2011-12 2012-13 2013-14 2014-15 Set-Aside 1 Maturity
(Audited) (Audited) (Audited) (Projected) (Projected) Fund Name Jul 31, 2014 Oct 01, 2014Beginning Fund Balance 407,408 394,613 245,383 150,880 162,741 13 - Cafeteria Special Revenue (R) 11,200 12,000
25 - Capital Facilities (R) 15,450 15,450 Total Revenues 1,537,475 1,478,649 1,466,024 1,436,621 1,570,584 35 - County School Facilities (R) 25,000 10,000
Total Expenditures 1,543,270 1,627,879 1,570,528 1,424,760 1,400,793
Other Sources & Uses (7,000) - - - -
Ending Fund Balance 394,613 245,383 140,879 162,741 332,532 Source: District Annual Financial Statements & the District.
Total Other Restricted Funds (R) 51,650 37,450 Total Other Unrestricted Funds (U) - - Grand Total 51,650 37,450
Excludes Bond Proceed, Bond Interest & Redemption and Debt Service Funds.Source: The District.
C-7 C-8

Ducor Union ElementaryTulare
Fiscal Year 2014-15Jul 2014 Aug 2014 Sep 2014 Oct 2014 Nov 2014 Dec 2014 Jan 2015 Feb 2015 Mar 2015 Apr 2015 May 2015 Jun 2015 Accruals Total
Actual / Projected Projected Projected Projected Projected Projected Projected Projected Projected Projected Projected Projected Projected Projected 2014-15Beginning Cash 74,968 152,628 89,484 95,467 110,372 101,831 178,399 184,053 186,198 254,474 270,431 295,293 Receipts
LCFF/Revenue LimitApportionment 82,834 53,222 137,004 95,800 95,800 137,004 95,800 95,800 137,004 95,800 95,800 137,004 - 1,258,869 Property Taxes - - - - - 43,174 36,442 - - 20,441 33,480 37,236 - 170,773 Other - - - - - - - - - - - - - -
Federal Revenues - - 3,952 22,226 21,357 - 20,399 - 36,409 - - 17 - 104,360 Other State Revenues 15,368 165 - 8,855 1,819 1,017 5,508 4,805 756 7,612 1,313 (1,293) 8,854 54,778 Other Local Revenues - - 418 - 358 4,177 225 - 2,088 10 157 3,980 - 11,415 Interfund Transfers In - - - - - - - - - - - - - - Other Financing Sources - - - - - - - - - - - - - -
Total Receipts 98,202 53,387 141,374 126,881 119,334 185,371 158,374 100,605 176,257 123,863 130,750 176,944 8,854 1,600,194 Disbursements
Certificated Salaries 15,242 48,405 52,078 53,398 54,240 52,985 52,572 52,749 53,221 53,693 53,339 55,246 - 597,168 Classified Salaries 14,222 13,820 27,395 27,937 31,160 23,251 22,995 23,325 23,767 23,832 24,191 20,960 - 276,854 Employee Benefits 5,171 9,973 28,413 28,646 26,858 25,724 25,700 25,775 25,873 26,002 26,053 33,013 - 287,202 Supplies and Services 23,208 30,138 17,640 11,686 28,727 15,046 22,577 7,031 10,718 7,608 13,417 51,773 - 239,569 Capital Outlay - - - - - - - - - - - - - - Other Outgo - - - - - - - - - - - - - - Interfund Transfers Out - - - - - - - - - - - - - - Other Financing Uses - - - - - - - - - - - - - -
Total Disbursements 57,842 102,336 125,526 121,667 140,985 117,007 123,844 108,880 113,580 111,134 117,001 160,992 - 1,400,793 Asset TransactionsDeferred Apportionment 170,733 - - - - - - - - - - - - 170,733 Accounts Receivable - - - - - - - - - - - - - - Due From Other Funds - - - - - - - - - - - - - - Other - - - - - - - - - - - - - - SUBTOTAL ASSETS 170,733 - - - - - - - - - - - - 170,733 Accounts Payable 57,612 14,195 (8,848) (9,691) (13,110) (8,204) 28,876 (10,420) (5,599) (3,229) (11,113) (14,736) - 15,733 Due To Other Funds - - - - - - - - - - - - - - Current Loan - - 18,713 - - - - - - - - - - 18,713 Other - - - - - - - - - - - - - - SUBTOTAL LIABILITIES 57,612 14,195 9,865 (9,691) (13,110) (8,204) 28,876 (10,420) (5,599) (3,229) (11,113) (14,736) - 34,447
Total PY Transactions 113,121 (14,195) (9,865) 9,691 13,110 8,204 (28,876) 10,420 5,599 3,229 11,113 14,736 - 136,286 Net Increase/Decrease 153,481 (63,144) 5,983 14,904 (8,541) 76,568 5,654 2,145 68,276 15,957 24,862 30,688 8,854
FY TRAN Deposits - - - - - - - - - - - - - FY TRAN Repayments - - - - - - - - - - - - - CY TRAN Deposits - - - - - - - - - - - - - CY TRAN Repayments (75,821) - - - - - - - - - - - (75,821)
Ending Cash with TRAN 152,628 89,484 95,467 110,372 101,831 178,399 184,053 186,198 254,474 270,431 295,293 325,981 TRAN Balance - - - - - - - - - - - - Ending Cash without TRAN 152,628 89,484 95,467 110,372 101,831 178,399 184,053 186,198 254,474 270,431 295,293 325,981 Source: The District
007
C-8

Exeter Unified Exeter UnifiedTulare Tulare
Fiscal Year 2013-14 Fiscal Year 2014-15Jul 2013 Aug 2013 Sep 2013 Oct 2013 Nov 2013 Dec 2013 Jan 2014 Feb 2014 Mar 2014 Apr 2014 May 2014 Jun 2014 Accruals Total
Actual / Projected Actual Actual Actual Actual Actual Actual Projected Projected Projected Projected Projected Projected Projected 2013-14Beginning Cash 1 3,317,119 2,748,304 5,326,771 5,044,733 4,906,887 5,833,150 6,236,005 4,049,085 4,967,116 4,180,809 2,678,751 Receipts
LCFF/Revenue LimitApportionment 674,197 674,197 1,925,894 1,213,554 1,213,554 1,925,894 1,213,554 1,213,554 1,964,462 755,100 37,755 750,908 3,886,638 17,449,260 Property Taxes - - - - - 90,144 1,026,344 - - 359,675 622,099 364,834 - 2,463,097 Other - - - - - - - - - - - - - -
Federal Revenues 49,085 - 163,544 45,104 229,289 421,395 55,478 - 292,082 57,461 - 146,834 221,409 1,681,682 Other State Revenues 517,986 68,926 392,825 155,883 407,921 143,775 107,577 18,379 15,934 12,300 18,502 19,645 - 1,879,654 Other Local Revenues - 313,836 243,697 178,221 70,920 146,015 73,326 4,027 17,967 138,054 28,319 173,980 - 1,388,361 Interfund Transfers In - - - - - - - - - - - - - - Other Financing Sources - - - - - - - - - - - - - -
Total Receipts 1,241,267 1,056,959 2,725,960 1,592,763 1,921,684 2,727,222 2,476,279 1,235,961 2,290,445 1,322,590 706,675 1,456,201 4,108,047 24,862,054 Disbursements
Certificated Salaries 571,869 881,773 900,560 925,225 938,065 895,774 914,060 922,238 911,382 892,621 926,930 959,034 - 10,639,530 Classified Salaries 186,628 268,631 274,154 271,783 292,281 279,699 282,013 316,993 298,540 257,893 319,736 286,277 - 3,334,629 Employee Benefits 290,771 467,243 444,846 455,022 460,444 453,433 476,657 441,142 443,032 434,800 446,431 529,651 - 5,343,472 Supplies and Services 101,672 334,585 401,260 267,295 378,056 202,835 389,610 503,758 549,507 507,853 502,000 603,000 355,445 5,096,877 Capital Outlay - 10,874 - 44,485 21,417 - 11,541 11,541 11,541 11,541 11,541 11,597 23,749 169,828 Other Outgo - - - - - - - - - 4,189 2,095 430,122 - 436,406 Interfund Transfers Out - - - - - - - - - - - 128,837 - 128,837 Other Financing Uses - - - - - - - - - - - - - -
Total Disbursements 1,150,941 1,963,106 2,020,819 1,963,811 2,090,262 1,831,741 2,073,881 2,195,673 2,214,002 2,108,897 2,208,733 2,948,519 379,195 25,149,579 Asset TransactionsDeferred Apportionment 1,405,450 890,696 2,296,146 Accounts Receivable 1,918,045 1,360 (732,142) 678 61 (114) 457 - - - - - - 1,188,345 Due From Other Funds - - (40,240) - - - - - - - - - - (40,240) Other - - - - - - - - - - - - - - SUBTOTAL ASSETS 3,323,495 892,056 (772,382) 678 61 (114) 457 - - - - - - 3,444,251 Accounts Payable 296,738 82,248 (825,102) (78,332) (30,671) (30,896) - - - - - - - (586,016) Due To Other Funds (52) - (413,319) (10,000) - - - - - - - - - (423,371) Current Loan - - (1,407,287) - - - - - - - - - - (1,407,287) Other - - - - - - - - - - - - - - SUBTOTAL LIABILITIES 296,686 82,248 (2,645,709) (88,332) (30,671) (30,896) - - - - - - - (2,416,675)
Total PY Transactions 3,026,809 809,808 1,873,327 89,010 30,733 30,782 457 - - - - - - 5,860,926 Net Increase/Decrease 3,117,135 (96,339) 2,578,467 (282,038) (137,846) 926,263 402,855 (959,712) 76,444 (786,307) (1,502,058) (1,492,318) 3,728,853
FY TRAN Deposits 1,214,983 - - - - - - - - - - - - 1,214,983 FY TRAN Repayments - - - - - - - (1,227,209) - - - - - (1,227,209) CY TRAN Deposits - - - - - - - - 841,588 - - - - 841,588 CY TRAN Repayments (1,015,000) (472,477) - - - - - - - - - - - (1,487,477)
Ending Cash with TRAN 3,317,119 2,748,304 5,326,771 5,044,733 4,906,887 5,833,150 6,236,005 4,049,085 4,967,116 4,180,809 2,678,751 1,186,434 TRAN Balance 1,214,983 1,214,983 1,214,983 1,214,983 1,214,983 1,214,983 1,214,983 - 841,588 841,588 841,588 841,588 Ending Cash without TRAN 2,102,136 1,533,321 4,111,788 3,829,750 3,691,904 4,618,167 5,021,023 4,049,085 4,125,528 3,339,222 1,837,164 344,846 Source: The District
Summary of Revenues, Expenditures & Changes in General Fund Balance Projected Alternate Cash Resources2010-11 2011-12 2012-13 2013-14 2014-15 Set-Aside 1 Maturity
(Audited) (Audited) (Audited) (Projected) (Projected) Fund Name Jul 31, 2014 Oct 01, 2014Beginning Fund Balance 4,844,877 6,738,506 6,116,595 - 4,820,408 13 - Cafeteria Special Revenue (R) 130,000 120,000
14 - Deferred Maintenance (R) 180,000 170,000 Total Revenues 24,993,420 24,071,860 22,710,504 24,862,054 24,719,251 25 - Capital Facilities (R) 210,000 215,000
40 - Special Reserve for Cap Outlay (R) 250,000 150,000 Total Expenditures 22,961,166 24,600,146 23,723,320 25,145,653 24,819,733 63 - Other Enterprise (R) 22,000 22,000
67 - Self-Insurance (R) 82,000 82,100 Other Sources & Uses (138,625) (93,625) 35,912 5,104,007 -
Ending Fund Balance 6,738,506 6,116,595 5,139,691 4,820,408 4,719,926 Source: District Annual Financial Statements & the District.
Total Other Restricted Funds (R) 874,000 759,100 Total Other Unrestricted Funds (U) - - Grand Total 874,000 759,100
Excludes Bond Proceed, Bond Interest & Redemption and Debt Service Funds.Source: The District.
C-9 C-10

Exeter UnifiedTulare
Fiscal Year 2014-15Jul 2014 Aug 2014 Sep 2014 Oct 2014 Nov 2014 Dec 2014 Jan 2015 Feb 2015 Mar 2015 Apr 2015 May 2015 Jun 2015 Accruals Total
Actual / Projected Projected Projected Projected Projected Projected Projected Projected Projected Projected Projected Projected Projected Projected 2014-15Beginning Cash 1,186,434 3,679,813 3,069,244 4,242,308 3,651,478 2,833,385 4,463,450 4,677,430 3,687,524 4,355,833 4,009,168 3,635,242 Receipts
LCFF/Revenue LimitApportionment 611,950 611,950 1,748,302 1,101,510 1,101,510 1,748,302 1,101,510 1,101,510 1,748,302 1,101,510 1,101,510 1,748,302 - 14,826,172 Property Taxes - - - - - 771,807 692,967 - - 367,231 636,949 373,455 - 2,842,409 Other - - 769,733 - - 769,733 - - 769,733 - - 769,733 - 3,078,931
Federal Revenues 48,095 - 160,206 23,629 101,051 153,001 351,583 - 286,227 56,307 - 278,518 217,016 1,675,632 Other State Revenues 333,910 44,385 253,200 55,347 33,101 25,148 33,961 63,407 16,765 59,538 31,274 32,026 92,747 1,074,809 Other Local Revenues - 314,638 244,284 123,241 31,024 35,788 84,889 4,031 17,955 138,387 28,337 198,725 - 1,221,297 Interfund Transfers In - - - - - - - - - - - - - - Other Financing Sources - - - - - - - - - - - - - -
Total Receipts 993,956 970,973 3,175,725 1,303,728 1,266,686 3,503,778 2,264,909 1,168,949 2,838,982 1,722,974 1,798,070 3,400,759 309,763 24,719,251 Disbursements
Certificated Salaries 582,642 898,964 918,530 934,836 967,446 933,749 931,575 940,271 929,401 909,834 944,619 977,229 - 10,869,096 Classified Salaries 190,521 274,089 279,592 269,963 331,865 296,787 287,501 323,267 304,353 263,084 326,018 291,972 - 3,439,013 Employee Benefits 296,813 476,634 453,886 451,178 450,094 460,927 486,384 450,094 451,719 443,595 455,511 540,005 - 5,416,841 Supplies and Services 88,849 292,387 350,653 233,583 330,375 177,253 340,472 440,223 480,203 443,803 438,687 526,949 310,616 4,454,054 Capital Outlay - 4,710 - 4,998 4,998 4,998 4,998 4,998 4,998 4,998 4,998 5,022 10,284 60,000 Other Outgo - - - - - - - - - 4,324 2,162 443,969 - 450,456 Interfund Transfers Out - - - - - - - - - - - - - - Other Financing Uses - - - - - - - - - - - - - -
Total Disbursements 1,158,826 1,946,785 2,002,661 1,894,557 2,084,779 1,873,714 2,050,930 2,158,854 2,170,673 2,069,639 2,171,996 2,785,147 320,900 24,689,460 Asset TransactionsDeferred Apportionment 3,886,638 - - - - - - - - - - - - 3,886,638 Accounts Receivable 0 365,242 - - - - - - - - - - - 365,242 Due From Other Funds - - - - - - - - - - - - - - Other - - - - - - - - - - - - - - SUBTOTAL ASSETS 3,886,638 365,242 - - - - - - - - - - - 4,251,880 Accounts Payable 379,195 - - - - - - - - - - - - 379,195 Due To Other Funds - - - - - - - - - - - - - - Current Loan - - - - - - - - - - - - - - Other - - - - - - - - - - - - - - SUBTOTAL LIABILITIES 379,195 - - - - - - - - - - - - 379,195
Total PY Transactions 3,507,443 365,242 - - - - - - - - - - - 3,872,685 Net Increase/Decrease 3,342,573 (610,570) 1,173,064 (590,830) (818,093) 1,630,065 213,980 (989,905) 668,308 (346,665) (373,926) 615,612 (11,137)
FY TRAN Deposits - - - - - - - - - - - - - FY TRAN Repayments - - - - - - - - - - - - - CY TRAN Deposits - - - - - - - - - - - - - CY TRAN Repayments (849,193) - - - - - - - - - - - (849,193)
Ending Cash with TRAN 3,679,813 3,069,244 4,242,308 3,651,478 2,833,385 4,463,450 4,677,430 3,687,524 4,355,833 4,009,168 3,635,242 4,250,854 TRAN Balance - - - - - - - - - - - - Ending Cash without TRAN 3,679,813 3,069,244 4,242,308 3,651,478 2,833,385 4,463,450 4,677,430 3,687,524 4,355,833 4,009,168 3,635,242 4,250,854 Source: The District
009
C-10

Golden Valley Unified Golden Valley UnifiedMadera Madera
Fiscal Year 2013-14 Fiscal Year 2014-15Jul 2013 Aug 2013 Sep 2013 Oct 2013 Nov 2013 Dec 2013 Jan 2014 Feb 2014 Mar 2014 Apr 2014 May 2014 Jun 2014 Accruals Total
Actual / Projected Actual Actual Actual Actual Actual Actual Projected Projected Projected Projected Projected Projected Projected 2013-14Beginning Cash 2,770,165 3,224,118 2,601,707 2,474,461 1,835,444 1,658,541 3,826,181 3,251,610 2,129,042 2,828,312 1,975,159 1,031,000 Receipts
LCFF/Revenue LimitApportionment 406,539 406,539 1,240,803 731,771 731,771 1,240,084 731,771 729,946 1,239,983 454,189 22,709 510,037 1,699,615 10,145,757 Property Taxes - - 144,983 - - 2,061,002 - - - - 601,834 503,487 - 3,311,306 Other 16 (81) (163) (109) (109) (109) (100) (100) (100) (100) (100) (100) - (1,154)
Federal Revenues 2,209 304 3,511 6,280 5,102 78,783 481 481 103,874 481 1,257 103,874 26,356 332,991 Other State Revenues 2,354 - 196,700 26,282 268,778 124,097 - 67,611 79,791 - 46,889 57,908 96,031 966,441 Other Local Revenues 26,864 30,152 53,279 59,232 52,209 54,834 55,793 64,914 52,823 55,793 64,915 63,870 48,665 683,343 Interfund Transfers In - - - - - - - - - - - - - - Other Financing Sources - - - - - - - - - - - - - -
Total Receipts 437,982 436,913 1,639,113 823,456 1,057,751 3,558,691 787,945 862,852 1,476,371 510,362 737,504 1,239,076 1,870,667 15,438,684 Disbursements
Certificated Salaries 140,721 607,870 808,790 617,750 639,670 618,599 639,044 639,044 639,044 639,044 639,044 639,045 - 7,267,663 Classified Salaries 117,938 227,129 311,613 237,920 258,750 241,530 231,800 231,799 231,799 231,799 231,799 231,799 - 2,785,676 Employee Benefits 80,187 274,760 322,946 290,025 289,702 289,359 300,660 300,660 300,660 301,660 301,660 301,660 - 3,353,939 Supplies and Services 316,648 78,607 392,992 339,873 116,785 164,471 232,999 232,999 232,999 232,999 250,999 232,999 - 2,825,371 Capital Outlay - - - 29,639 - (396) - - - - - - - 29,243 Other Outgo - - - - - - - - - - - - - - Interfund Transfers Out - - - 47,523 - 134,000 - - 107,100 - 341,560 - - 630,183 Other Financing Uses - - - - - - - - - - - - - -
Total Disbursements 655,494 1,188,366 1,836,341 1,562,729 1,304,906 1,447,564 1,404,503 1,404,502 1,511,602 1,405,502 1,765,062 1,405,503 - 16,892,074 Asset TransactionsDeferred Apportionment 983,698 623,413 1,607,111 Accounts Receivable 896,458 62,931 - 87,092 - - 13,583 13,583 13,583 13,583 13,583 13,583 - 1,127,977 Due From Other Funds - - - - - - - - - - - - - - Other - - - - - - - - - - - - - - SUBTOTAL ASSETS 1,880,156 686,344 - 87,092 - - 13,583 13,583 13,583 13,583 13,583 13,583 - 2,735,088 Accounts Payable 671,301 (9,609) (69,981) (24,738) (70,252) (56,512) (28,405) (69,815) (69,815) (28,405) (69,815) (69,815) - 104,140 Due To Other Funds - - - - - - - - - - - - - - Current Loan - - - - - - - - - - - - - - Other - - - 11,573 - - - - - - - - - 11,573 SUBTOTAL LIABILITIES 671,301 (9,609) (69,981) (13,165) (70,252) (56,512) (28,405) (69,815) (69,815) (28,405) (69,815) (69,815) - 115,713
Total PY Transactions 1,208,855 695,953 69,981 100,257 70,252 56,512 41,987 83,398 83,398 41,987 83,398 83,398 - 2,619,375 Net Increase/Decrease 991,343 (55,500) (127,246) (639,017) (176,903) 2,167,640 (574,571) (458,253) 48,167 (853,152) (944,160) (83,030) 1,870,667
FY TRAN Deposits 657,610 - - - - - - - - - - - - 657,610 FY TRAN Repayments - - - - - - - (664,316) - - - - - (664,316) CY TRAN Deposits - - - - - - - - 651,104 - - - - 651,104 CY TRAN Repayments (1,195,000) (566,911) - - - - - - - - - - - (1,761,911)
Ending Cash with TRAN 3,224,118 2,601,707 2,474,461 1,835,444 1,658,541 3,826,181 3,251,610 2,129,042 2,828,312 1,975,159 1,031,000 947,970 TRAN Balance 1,204,777 657,610 657,610 657,610 657,610 657,610 657,610 - 651,104 651,104 651,104 651,104 Ending Cash without TRAN 2,019,341 1,944,097 1,816,851 1,177,834 1,000,931 3,168,571 2,594,000 2,129,042 2,177,208 1,324,056 379,896 296,867 Source: The District
Summary of Revenues, Expenditures & Changes in General Fund Balance Projected Alternate Cash Resources2010-11 2011-12 2012-13 2013-14 2014-15 Set-Aside 1 Maturity
(Audited) (Audited) (Audited) (Projected) (Projected) Fund Name Jul 31, 2014 Oct 01, 2014Beginning Fund Balance 2,351,910 2,992,517 3,104,180 3,020,781 1,971,917 11 - Adult Education (R) 272 272
13 - Cafeteria Special Revenue (R) - 20,000 Total Revenues 15,035,444 14,515,430 14,701,996 15,555,400 15,777,971 14 - Deferred Maintenance (R) - 20,000
25 - Capital Facilities (R) 20,000 20,000 Total Expenditures 14,394,569 14,403,767 14,793,263 16,015,492 16,123,114 30 - State School Building Lease-Purchase (R) 76 76
35 - County School Facilities (R) 13 13 Other Sources & Uses - - 7,868 (588,772) - 40 - Special Reserve for Cap Outlay (R) 45,434 45,434
Ending Fund Balance 2,992,785 3,104,180 3,020,781 1,971,917 1,626,774 Source: District Annual Financial Statements & the District.
Total Other Restricted Funds (R) 65,796 105,796 Total Other Unrestricted Funds (U) - - Grand Total 65,796 105,796
Excludes Bond Proceed, Bond Interest & Redemption and Debt Service Funds.Source: The District.
C-11 C-12
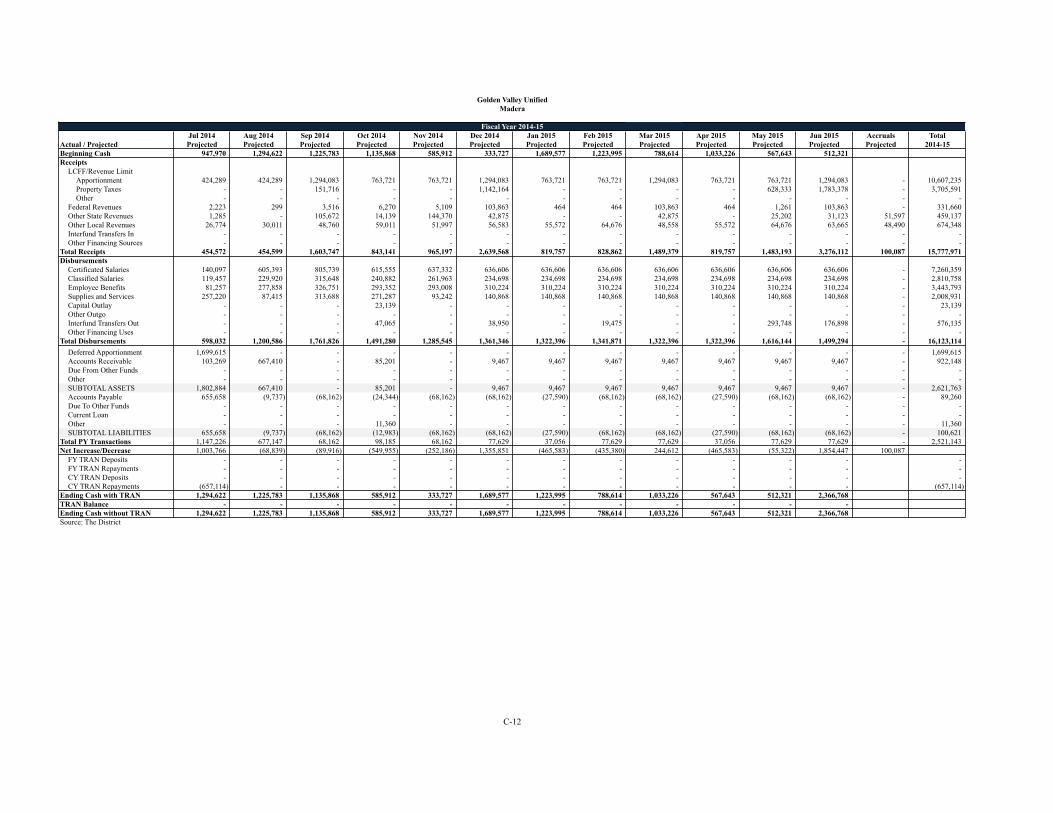
Golden Valley UnifiedMadera
Fiscal Year 2014-15Jul 2014 Aug 2014 Sep 2014 Oct 2014 Nov 2014 Dec 2014 Jan 2015 Feb 2015 Mar 2015 Apr 2015 May 2015 Jun 2015 Accruals Total
Actual / Projected Projected Projected Projected Projected Projected Projected Projected Projected Projected Projected Projected Projected Projected 2014-15Beginning Cash 947,970 1,294,622 1,225,783 1,135,868 585,912 333,727 1,689,577 1,223,995 788,614 1,033,226 567,643 512,321 Receipts
LCFF/Revenue LimitApportionment 424,289 424,289 1,294,083 763,721 763,721 1,294,083 763,721 763,721 1,294,083 763,721 763,721 1,294,083 - 10,607,235 Property Taxes - - 151,716 - - 1,142,164 - - - - 628,333 1,783,378 - 3,705,591 Other - - - - - - - - - - - - - -
Federal Revenues 2,223 299 3,516 6,270 5,109 103,863 464 464 103,863 464 1,261 103,863 - 331,660 Other State Revenues 1,285 - 105,672 14,139 144,370 42,875 - - 42,875 - 25,202 31,123 51,597 459,137 Other Local Revenues 26,774 30,011 48,760 59,011 51,997 56,583 55,572 64,676 48,558 55,572 64,676 63,665 48,490 674,348 Interfund Transfers In - - - - - - - - - - - - - - Other Financing Sources - - - - - - - - - - - - - -
Total Receipts 454,572 454,599 1,603,747 843,141 965,197 2,639,568 819,757 828,862 1,489,379 819,757 1,483,193 3,276,112 100,087 15,777,971 Disbursements
Certificated Salaries 140,097 605,393 805,739 615,555 637,332 636,606 636,606 636,606 636,606 636,606 636,606 636,606 - 7,260,359 Classified Salaries 119,457 229,920 315,648 240,882 261,963 234,698 234,698 234,698 234,698 234,698 234,698 234,698 - 2,810,758 Employee Benefits 81,257 277,858 326,751 293,352 293,008 310,224 310,224 310,224 310,224 310,224 310,224 310,224 - 3,443,793 Supplies and Services 257,220 87,415 313,688 271,287 93,242 140,868 140,868 140,868 140,868 140,868 140,868 140,868 - 2,008,931 Capital Outlay - - - 23,139 - - - - - - - - - 23,139 Other Outgo - - - - - - - - - - - - - - Interfund Transfers Out - - - 47,065 - 38,950 - 19,475 - - 293,748 176,898 - 576,135 Other Financing Uses - - - - - - - - - - - - - -
Total Disbursements 598,032 1,200,586 1,761,826 1,491,280 1,285,545 1,361,346 1,322,396 1,341,871 1,322,396 1,322,396 1,616,144 1,499,294 - 16,123,114 Asset TransactionsDeferred Apportionment 1,699,615 - - - - - - - - - - - - 1,699,615 Accounts Receivable 103,269 667,410 - 85,201 - 9,467 9,467 9,467 9,467 9,467 9,467 9,467 - 922,148 Due From Other Funds - - - - - - - - - - - - - - Other - - - - - - - - - - - - - - SUBTOTAL ASSETS 1,802,884 667,410 - 85,201 - 9,467 9,467 9,467 9,467 9,467 9,467 9,467 - 2,621,763 Accounts Payable 655,658 (9,737) (68,162) (24,344) (68,162) (68,162) (27,590) (68,162) (68,162) (27,590) (68,162) (68,162) - 89,260 Due To Other Funds - - - - - - - - - - - - - - Current Loan - - - - - - - - - - - - - - Other - - - 11,360 - - - - - - - - - 11,360 SUBTOTAL LIABILITIES 655,658 (9,737) (68,162) (12,983) (68,162) (68,162) (27,590) (68,162) (68,162) (27,590) (68,162) (68,162) - 100,621
Total PY Transactions 1,147,226 677,147 68,162 98,185 68,162 77,629 37,056 77,629 77,629 37,056 77,629 77,629 - 2,521,143 Net Increase/Decrease 1,003,766 (68,839) (89,916) (549,955) (252,186) 1,355,851 (465,583) (435,380) 244,612 (465,583) (55,322) 1,854,447 100,087
FY TRAN Deposits - - - - - - - - - - - - - FY TRAN Repayments - - - - - - - - - - - - - CY TRAN Deposits - - - - - - - - - - - - - CY TRAN Repayments (657,114) - - - - - - - - - - - (657,114)
Ending Cash with TRAN 1,294,622 1,225,783 1,135,868 585,912 333,727 1,689,577 1,223,995 788,614 1,033,226 567,643 512,321 2,366,768 TRAN Balance - - - - - - - - - - - - Ending Cash without TRAN 1,294,622 1,225,783 1,135,868 585,912 333,727 1,689,577 1,223,995 788,614 1,033,226 567,643 512,321 2,366,768 Source: The District
011
C-12

Hesperia Unified Hesperia UnifiedSan Bernardino San Bernardino
Fiscal Year 2013-14 Fiscal Year 2014-15Jul 2013 Aug 2013 Sep 2013 Oct 2013 Nov 2013 Dec 2013 Jan 2014 Feb 2014 Mar 2014 Apr 2014 May 2014 Jun 2014 Accruals Total
Actual / Projected Actual Actual Actual Actual Actual Actual Projected Projected Projected Projected Projected Projected Projected 2013-14Beginning Cash 25,350,117 29,578,485 27,632,925 32,400,434 30,518,296 32,184,389 37,440,494 37,415,112 26,244,523 37,951,656 29,731,211 16,880,783 Receipts
LCFF/Revenue LimitApportionment 5,135,928 5,135,928 14,037,830 9,244,670 9,244,670 14,037,830 8,676,135 9,027,626 13,820,786 5,597,128 270,829 4,793,160 24,345,718 123,368,237 Property Taxes 317,206 - - - 2,136,644 1,761,395 892,066 302,475 152,805 1,714,300 229,168 48,699 - 7,554,758 Other - - (87,917) - (78,148) (39,074) - - (270,353) - - - (192,204) (667,697)
Federal Revenues - 53,886 1,290,457 (585,492) 175,426 680,531 1,374,086 744,691 1,584,303 755,491 2,289,058 517,275 2,274,953 11,154,664 Other State Revenues 3,045,479 134,121 2,246,977 (3,127,461) 2,894,045 200,367 635,773 23,913 23,974 864,143 640 - 1,820,134 8,762,104 Other Local Revenues 80,966 2,112,256 97,026 (1,003,159) 849,484 2,301,979 629,505 830,611 564,548 806,778 873,930 618,364 245,908 9,008,196 Interfund Transfers In - - - - - - - - - - - - - - Other Financing Sources - - - - - - - - - - - - - -
Total Receipts 8,579,579 7,436,191 17,584,372 4,528,558 15,222,120 18,943,028 12,207,564 10,929,315 15,876,063 9,737,841 3,663,625 5,977,498 28,494,508 159,180,261 Disbursements
Certificated Salaries - 2,243,953 6,019,899 6,420,586 6,342,752 8,226,395 6,992,436 6,995,419 7,055,126 7,085,277 7,079,217 7,018,673 811,802 72,291,535 Classified Salaries 1,057,354 2,018,699 2,096,664 2,153,367 2,530,831 2,390,850 2,319,124 2,284,337 2,261,494 2,238,879 2,194,101 2,128,278 56,217 25,730,194 Employee Benefits 731,181 1,578,480 2,062,969 2,118,980 2,187,305 2,378,936 2,973,670 2,961,288 2,969,419 2,973,525 2,972,700 2,947,965 387,238 29,243,656 Supplies and Services 921,440 2,358,844 1,918,071 2,252,615 1,455,004 1,598,570 1,741,995 2,144,306 6,869,609 5,656,579 3,554,840 6,359,466 1,539,170 38,370,509 Capital Outlay (0) - 5,972 54,692 22,114 3,531 - 91,672 - - - - - 177,981 Other Outgo - 3,393 - 347,960 (347,960) 3,011 - - 3,011 - 713,000 4,156 (340,292) 386,280 Interfund Transfers Out - - - - - - 1,881,026 1,799,822 - - - - - 3,680,848 Other Financing Uses - - - - - - - - - - - - - -
Total Disbursements 2,709,975 8,203,370 12,103,575 13,348,198 12,190,047 14,601,293 15,908,251 16,276,845 19,158,659 17,954,261 16,513,857 18,458,538 2,454,135 169,881,002 Asset TransactionsDeferred Apportionment 18,841,964 7,377,688 26,219,652 Accounts Receivable 66,391 874,989 398,783 7,028,754 19,860 1,424,516 16,913 - - - - - - 9,830,206 Due From Other Funds 24,983 (6,580) 14,018 40,396 - - - - - - - - - 72,817 Other - - - 379 - - 28,840 - - - - - - 29,219 SUBTOTAL ASSETS 18,933,338 8,246,097 412,801 7,069,529 19,860 1,424,516 45,753 - - - - - - 36,151,893 Accounts Payable 8,738,132 1,407,339 1,126,089 132,027 1,385,840 510,146 (3,629,552) 6,494 6,494 4,026 195 - 15,260 9,702,488 Due To Other Funds - - - - - - - - - - - - - - Current Loan - - - - - - - - - - - - - - Other - - - - - - - - - - - - - - SUBTOTAL LIABILITIES 8,738,132 1,407,339 1,126,089 132,027 1,385,840 510,146 (3,629,552) 6,494 6,494 4,026 195 - 15,260 9,702,488
Total PY Transactions 10,195,207 6,838,759 (713,288) 6,937,502 (1,365,980) 914,370 3,675,305 (6,494) (6,494) (4,026) (195) - (15,260) 26,449,405 Net Increase/Decrease 16,064,811 6,071,579 4,767,510 (1,882,139) 1,666,093 5,256,105 (25,382) (5,354,024) (3,289,090) (8,220,446) (12,850,427) (12,481,040) 26,025,113
FY TRAN Deposits 5,781,557 - - - - - - - - - - - - 5,781,557 FY TRAN Repayments - - - - - - - (5,816,564) - - - - - (5,816,564) CY TRAN Deposits - - - - - - - - 14,996,223 - - - - 14,996,223 CY TRAN Repayments (17,618,000) (8,017,139) - - - - - - - - - - - (25,635,139)
Ending Cash with TRAN 29,578,485 27,632,925 32,400,434 30,518,296 32,184,389 37,440,494 37,415,112 26,244,523 37,951,656 29,731,211 16,880,783 4,399,744 TRAN Balance 13,694,724 5,781,557 5,781,557 5,781,557 5,781,557 5,781,557 5,781,557 - 14,996,223 14,996,223 14,996,223 14,996,223 Ending Cash without TRAN 15,883,761 21,851,368 26,618,878 24,736,739 26,402,832 31,658,937 31,633,555 26,244,523 22,955,433 14,734,988 1,884,560 (10,596,480) Source: The District
Summary of Revenues, Expenditures & Changes in General Fund Balance Projected Alternate Cash Resources2010-11 2011-12 2012-13 2013-14 2014-15 Set-Aside 1 Maturity
(Audited) (Audited) (Audited) (Projected) (Projected) Fund Name Jul 31, 2014 Oct 01, 2014Beginning Fund Balance 14,052,135 22,712,379 28,772,913 26,271,852 15,150,452 11 - Adult Education (R) 337,730 337,730
13 - Cafeteria Special Revenue (R) 4,385,882 5,756,181 Total Revenues 150,309,861 156,036,667 150,997,061 156,956,251 153,622,372 14 - Deferred Maintenance (R) 501,016 101,016
17 - Special Reserve Other than Cap Outlay (U) 902,870 902,870 Total Expenditures 143,006,676 149,702,523 152,285,305 166,196,625 158,809,520 25 - Capital Facilities (R) 1,946,951 1,946,951
30 - State School Building Lease-Purchase (R) 160,995 160,995 Other Sources & Uses 1,357,059 (273,610) 673,464 (1,881,026) - 35 - County School Facilities (R) 13,969,564 13,969,564
40 - Special Reserve for Cap Outlay (R) 1,235,483 1,235,483 Ending Fund Balance 22,712,379 28,772,913 28,158,133 15,150,452 9,963,305
Source: District Annual Financial Statements & the District.Total Other Restricted Funds (R) 22,537,621 23,507,920 Total Other Unrestricted Funds (U) 902,870 902,870 Grand Total 23,440,491 24,410,790
Excludes Bond Proceed, Bond Interest & Redemption and Debt Service Funds.Source: The District.
C-13 C-14

Hesperia UnifiedSan Bernardino
Fiscal Year 2014-15Jul 2014 Aug 2014 Sep 2014 Oct 2014 Nov 2014 Dec 2014 Jan 2015 Feb 2015 Mar 2015 Apr 2015 May 2015 Jun 2015 Accruals Total
Actual / Projected Projected Projected Projected Projected Projected Projected Projected Projected Projected Projected Projected Projected Projected 2014-15Beginning Cash 4,399,744 15,382,736 13,148,997 15,377,617 13,235,931 11,742,116 15,213,207 14,468,495 12,470,942 13,871,202 13,189,045 12,545,286 Receipts
LCFF/Revenue LimitApportionment 5,393,207 5,393,207 14,500,932 9,707,772 9,707,772 14,500,932 9,707,772 9,707,772 14,500,932 9,707,772 9,707,772 14,500,932 - 127,036,773 Property Taxes 317,206 - - - 1,519,096 1,777,938 892,066 302,475 152,805 1,714,300 229,168 48,699 - 6,953,753 Other - - (87,917) - - (87,917) - - (245,932) - - - (245,932) (667,697)
Federal Revenues - 53,886 4,289 32,466 106,424 41,789 970,238 703,638 1,230,719 714,439 1,934,271 267,127 2,883,801 8,943,086 Other State Revenues - - - - 753,435 - 656,031 - 2,625 871,166 - - 1,911,224 4,194,480 Other Local Revenues 80,966 123,266 97,016 122,912 316,734 490,850 486,122 987,476 772,997 1,002,970 1,083,783 809,019 787,864 7,161,975 Interfund Transfers In - - - - - - - - - - - - - - Other Financing Sources - - - - - - - - - - - - - -
Total Receipts 5,791,379 5,570,358 14,514,319 9,863,149 12,403,460 16,723,593 12,712,229 11,701,362 16,414,146 14,010,647 12,954,994 15,625,777 5,336,957 153,622,370 Disbursements
Certificated Salaries - 2,309,939 6,085,708 6,486,747 6,407,640 7,389,897 6,369,954 6,372,598 6,425,498 6,452,212 6,446,843 6,285,915 6,052,523 73,085,473 Classified Salaries 1,057,354 2,102,195 2,180,159 2,236,862 2,578,396 2,356,239 2,367,603 2,333,341 2,355,840 2,367,202 2,364,918 2,296,475 135,552 26,732,135 Employee Benefits 731,181 1,611,301 2,095,791 2,151,801 2,650,219 2,650,219 2,652,794 2,645,031 2,650,129 2,652,703 2,652,185 2,636,678 1,857,050 29,637,082 Supplies and Services 921,440 2,358,844 1,918,071 2,252,615 2,199,992 1,814,193 1,978,391 2,255,426 3,710,261 3,131,562 2,042,290 3,369,900 841,114 28,794,099 Capital Outlay (0) - 5,972 54,692 86,173 - 27,614 - - - - - - 174,450 Other Outgo - 3,393 - - 3,393 89,125 89,125 92,518 89,125 89,125 92,518 89,125 (251,167) 386,280 Interfund Transfers Out - - - - - - - - - - - - - - Other Financing Uses - - - - - - - - - - - - - -
Total Disbursements 2,709,975 8,385,672 12,285,700 13,182,716 13,925,814 14,299,673 13,485,481 13,698,914 15,230,852 14,692,803 13,598,754 14,678,093 8,635,072 158,809,520 Asset TransactionsDeferred Apportionment 24,345,718 - - - - - - - - - - - - 24,345,718 Accounts Receivable 1,402,858 231,576 - 1,177,881 28,539 1,047,171 28,539 - 216,966 - - - - 4,133,530 Due From Other Funds - - - - - - - - - - - - - - Other - - - - - - - - - - - - - - SUBTOTAL ASSETS 25,748,576 231,576 - 1,177,881 28,539 1,047,171 28,539 - 216,966 - - - - 28,479,248 Accounts Payable 2,804,135 (350,000) - - - - - - - - - - - 2,454,135 Due To Other Funds - - - - - - - - - - - - - - Current Loan - - - - - - - - - - - - - - Other - - - - - - - - - - - - - - SUBTOTAL LIABILITIES 2,804,135 (350,000) - - - - - - - - - - - 2,454,135
Total PY Transactions 22,944,441 581,576 - 1,177,881 28,539 1,047,171 28,539 - 216,966 - - - - 26,025,113 Net Increase/Decrease 26,025,845 (2,233,738) 2,228,620 (2,141,686) (1,493,815) 3,471,091 (744,712) (1,997,553) 1,400,260 (682,157) (643,760) 947,684 (3,298,115)
FY TRAN Deposits - - - - - - - - - - - - - FY TRAN Repayments - - - - - - - - - - - - - CY TRAN Deposits - - - - - - - - - - - - - CY TRAN Repayments (15,042,853) - - - - - - - - - - - (15,042,853)
Ending Cash with TRAN 15,382,736 13,148,997 15,377,617 13,235,931 11,742,116 15,213,207 14,468,495 12,470,942 13,871,202 13,189,045 12,545,286 13,492,970 TRAN Balance - - - - - - - - - - - - Ending Cash without TRAN 15,382,736 13,148,997 15,377,617 13,235,931 11,742,116 15,213,207 14,468,495 12,470,942 13,871,202 13,189,045 12,545,286 13,492,970 Source: The District
013
C-14

Hueneme Elementary Hueneme ElementaryVentura Ventura
Fiscal Year 2013-14 Fiscal Year 2014-15Jul 2013 Aug 2013 Sep 2013 Oct 2013 Nov 2013 Dec 2013 Jan 2014 Feb 2014 Mar 2014 Apr 2014 May 2014 Jun 2014 Accruals Total
Actual / Projected Actual Actual Actual Actual Actual Actual Projected Projected Projected Projected Projected Projected Projected 2013-14Beginning Cash 9,644,335 11,556,198 8,847,972 11,294,108 10,434,417 10,135,314 14,104,461 12,817,791 11,142,793 14,652,500 11,075,693 6,489,074 Receipts
LCFF/Revenue LimitApportionment 1,888,088 1,888,088 5,231,015 3,398,558 3,398,558 5,830,230 3,398,558 3,398,558 5,084,891 2,114,658 105,733 1,686,333 10,877,832 48,301,099 Property Taxes 47,010 35,417 - 25,528 152,219 2,652,491 189,717 63,239 21,080 674,548 484,832 674,548 - 5,020,628 Other - 0 - - - - - - - - - (0) - -
Federal Revenues - 32,152 192,554 89,855 26,183 942,705 836,921 199,267 1,633,987 239,120 677,508 318,827 846,651 6,035,730 Other State Revenues 1,387,106 (1,203,064) 1,646,555 245,068 876,029 130,000 553,102 525,446 580,757 304,206 387,171 110,620 - 5,542,996 Other Local Revenues 174,550 176,644 321,554 346,240 402,496 561,211 471,294 124,754 83,169 55,446 27,723 194,064 1,119,085 4,058,229 Interfund Transfers In - - - - - - - - - - - - - - Other Financing Sources 46,401 (46,401) - - - - - - - - - - - -
Total Receipts 3,543,154 882,836 7,391,678 4,105,248 4,855,484 10,116,637 5,449,592 4,311,264 7,403,883 3,387,979 1,682,967 2,984,392 12,843,568 68,958,682 Disbursements
Certificated Salaries 226,508 2,882,838 2,836,561 2,920,107 3,179,123 2,993,491 3,179,123 3,179,123 4,226,731 3,290,392 3,290,392 3,290,392 - 35,494,781 Classified Salaries 315,715 485,520 730,269 739,593 733,137 853,297 739,593 739,593 804,355 804,355 804,355 804,355 - 8,554,137 Employee Benefits 194,960 998,854 1,064,529 1,086,937 1,101,541 1,168,176 1,101,541 1,101,541 2,458,169 1,208,834 1,208,834 1,208,834 - 13,902,750 Supplies and Services 336,021 1,189,885 595,163 921,776 524,564 568,366 1,092,344 1,092,344 1,092,344 1,092,344 1,092,344 1,092,344 - 10,689,838 Capital Outlay - - - 55,221 - 117,920 21,254 21,254 21,254 21,254 21,254 21,254 - 300,666 Other Outgo - - (13,405) - - - 750,000 - - 695,200 - 172,646 - 1,604,441 Interfund Transfers Out - - - - - - - - - - - - - - Other Financing Uses - - - - - - - - - - - - - -
Total Disbursements 1,073,204 5,557,097 5,213,116 5,723,634 5,538,365 5,701,250 6,883,855 6,133,855 8,602,853 7,112,379 6,417,179 6,589,825 - 70,546,613 Asset TransactionsDeferred Apportionment 3,985,923 2,526,059 6,511,982 Accounts Receivable 3,027,089 2,228,912 207,845 509,171 207,376 (117,878) - - - - - - - 6,062,516 Due From Other Funds - 25,981 - 156,100 - - - - - - - - - 182,081 Other 34,354 - 2,401 8,055 (6,657) (4,687) - - - - - - - 33,466 SUBTOTAL ASSETS 7,047,366 4,780,952 210,246 673,326 200,719 (122,565) - - - - - - - 12,790,045 Accounts Payable 1,673,635 115,516 (57,328) (85,368) (183,058) 323,675 (147,593) (147,593) (147,593) (147,593) (147,593) (147,593) - 901,512 Due To Other Funds 33,818 - - - - - - - - - - - - 33,818 Current Loan - - - - - - - - - - - - - - Other - - - - - - - - - - - - - - SUBTOTAL LIABILITIES 1,707,453 115,516 (57,328) (85,368) (183,058) 323,675 (147,593) (147,593) (147,593) (147,593) (147,593) (147,593) - 935,330
Total PY Transactions 5,339,913 4,665,436 267,574 758,695 383,777 (446,240) 147,593 147,593 147,593 147,593 147,593 147,593 - 11,854,715 Net Increase/Decrease 7,809,864 (8,825) 2,446,136 (859,691) (299,103) 3,969,147 (1,286,670) (1,674,998) (1,051,377) (3,576,807) (4,586,619) (3,457,840) 12,843,568
FY TRAN Deposits - - - - - - - - - - - - - - FY TRAN Repayments - - - - - - - - - - - - - - CY TRAN Deposits - - - - - - - - 4,561,084 - - - - 4,561,084 CY TRAN Repayments (5,898,000) (2,699,401) - - - - - - - - - - - (8,597,401)
Ending Cash with TRAN 11,556,198 8,847,972 11,294,108 10,434,417 10,135,314 14,104,461 12,817,791 11,142,793 14,652,500 11,075,693 6,489,074 3,031,234 TRAN Balance 2,646,685 - - - - - - - 4,561,084 4,561,084 4,561,084 4,561,084 Ending Cash without TRAN 8,909,513 8,847,972 11,294,108 10,434,417 10,135,314 14,104,461 12,817,791 11,142,793 10,091,417 6,514,609 1,927,990 (1,529,850) Source: The District
Summary of Revenues, Expenditures & Changes in General Fund Balance Projected Alternate Cash Resources2010-11 2011-12 2012-13 2013-14 2014-15 Set-Aside 1 Maturity
(Audited) (Audited) (Audited) (Projected) (Projected) Fund Name Jul 31, 2014 Oct 01, 2014Beginning Fund Balance 7,269,516 8,582,824 10,762,256 10,068,913 11,525,858 13 - Cafeteria Special Revenue (R) 1,620,143 963,745
25 - Capital Facilities (R) 450,000 500,000 Total Revenues 63,735,360 63,505,324 62,399,294 67,284,062 72,051,461
Total Expenditures 62,422,052 61,325,892 63,092,639 65,827,117 64,600,822
Other Sources & Uses - - - - -
Ending Fund Balance 8,582,824 10,762,256 10,068,911 11,525,858 18,976,497 Source: District Annual Financial Statements & the District.
Total Other Restricted Funds (R) 2,070,143 1,463,745 Total Other Unrestricted Funds (U) - - Grand Total 2,070,143 1,463,745
Excludes Bond Proceed, Bond Interest & Redemption and Debt Service Funds.Source: The District.
C-15 C-16

Hueneme ElementaryVentura
Fiscal Year 2014-15Jul 2014 Aug 2014 Sep 2014 Oct 2014 Nov 2014 Dec 2014 Jan 2015 Feb 2015 Mar 2015 Apr 2015 May 2015 Jun 2015 Accruals Total
Actual / Projected Projected Projected Projected Projected Projected Projected Projected Projected Projected Projected Projected Projected Projected 2014-15Beginning Cash 3,031,234 10,459,244 7,379,437 9,988,611 9,068,886 9,046,544 12,535,423 11,575,583 10,218,594 12,374,098 10,741,213 10,085,889 Receipts
LCFF/Revenue LimitApportionment 2,172,642 2,172,642 6,020,092 3,910,756 3,910,756 6,020,092 3,910,756 3,910,756 6,020,092 3,910,756 3,910,756 6,020,092 - 51,890,191 Property Taxes 51,529 40,078 - 28,627 166,039 2,776,867 206,118 68,706 22,902 738,589 526,746 738,589 - 5,364,792 Other - - - - - - - - - - - - - -
Federal Revenues - 32,071 192,426 90,006 26,381 79,660 836,948 199,150 1,634,066 238,980 677,628 318,640 846,776 5,172,731 Other State Revenues 1,386,993 (1,202,899) 1,646,554 245,268 875,875 304,155 552,853 525,411 580,868 304,155 387,055 110,342 - 5,716,629 Other Local Revenues 173,849 175,803 319,961 344,573 400,440 427,396 468,807 124,234 82,823 55,085 27,738 192,992 1,113,417 3,907,118 Interfund Transfers In - - - - - - - - - - - - - - Other Financing Sources - - - - - - - - - - - - - -
Total Receipts 3,785,014 1,217,695 8,179,033 4,619,230 5,379,491 9,608,170 5,975,483 4,828,257 8,340,750 5,247,566 5,529,922 7,380,656 1,960,193 72,051,461 Disbursements
Certificated Salaries 234,436 2,983,737 3,290,392 3,290,392 3,290,392 3,290,392 3,290,392 3,290,392 3,290,392 3,290,392 3,290,392 3,290,392 - 36,122,093 Classified Salaries 317,153 487,928 804,355 804,355 804,355 804,355 804,355 804,355 804,355 804,355 804,355 804,355 - 8,848,631 Employee Benefits 190,369 978,188 1,204,592 1,204,592 1,204,592 1,204,592 1,204,592 1,204,592 1,204,592 1,204,592 1,204,592 1,204,592 - 13,214,477 Supplies and Services 316,163 1,118,087 559,043 865,784 493,089 960,005 1,025,960 1,025,960 1,025,960 1,025,960 1,025,960 1,025,960 - 10,467,928 Capital Outlay - - - 5,414 - 2,084 2,084 2,084 2,084 2,084 2,084 2,084 - 20,002 Other Outgo - - (13,477) - - - 750,076 - - 695,204 - 172,638 - 1,604,441 Interfund Transfers Out - - - - - - - - - - - - - - Other Financing Uses - - - - - - - - - - - - - -
Total Disbursements 1,058,121 5,567,940 5,844,905 6,170,537 5,792,428 6,261,428 7,077,459 6,327,383 6,327,383 7,022,587 6,327,383 6,500,020 - 70,277,572 Asset TransactionsDeferred Apportionment 10,877,832 - - - - - - - - - - - - 10,877,832 Accounts Receivable - 1,396,025 223,360 547,592 223,360 - - - - - - - - 2,390,338 Due From Other Funds - - - - - - - - - - - - - - Other 36,026 - - - (7,205) - - - - - - - - 28,821 SUBTOTAL ASSETS 10,913,858 1,396,025 223,360 547,592 216,155 - - - - - - - - 13,296,990 Accounts Payable 1,595,804 125,588 (51,686) (83,990) (174,440) (142,136) (142,136) (142,136) (142,136) (142,136) (142,136) (142,136) - 416,322 Due To Other Funds 32,304 - - - - - - - - - - - - 32,304 Current Loan - - - - - - - - - - - - - - Other - - - - - - - - - - - - - - SUBTOTAL LIABILITIES 1,628,108 125,588 (51,686) (83,990) (174,440) (142,136) (142,136) (142,136) (142,136) (142,136) (142,136) (142,136) - 448,625
Total PY Transactions 9,285,750 1,270,437 275,046 631,582 390,595 142,136 142,136 142,136 142,136 142,136 142,136 142,136 - 12,848,365 Net Increase/Decrease 12,012,643 (3,079,807) 2,609,174 (919,725) (22,341) 3,488,879 (959,840) (1,356,989) 2,155,504 (1,632,885) (655,324) 1,022,772 1,960,193
FY TRAN Deposits - - - - - - - - - - - - - FY TRAN Repayments - - - - - - - - - - - - - CY TRAN Deposits - - - - - - - - - - - - - CY TRAN Repayments (4,584,633) - - - - - - - - - - - (4,584,633)
Ending Cash with TRAN 10,459,244 7,379,437 9,988,611 9,068,886 9,046,544 12,535,423 11,575,583 10,218,594 12,374,098 10,741,213 10,085,889 11,108,662 TRAN Balance - - - - - - - - - - - - Ending Cash without TRAN 10,459,244 7,379,437 9,988,611 9,068,886 9,046,544 12,535,423 11,575,583 10,218,594 12,374,098 10,741,213 10,085,889 11,108,662 Source: The District
015
C-16
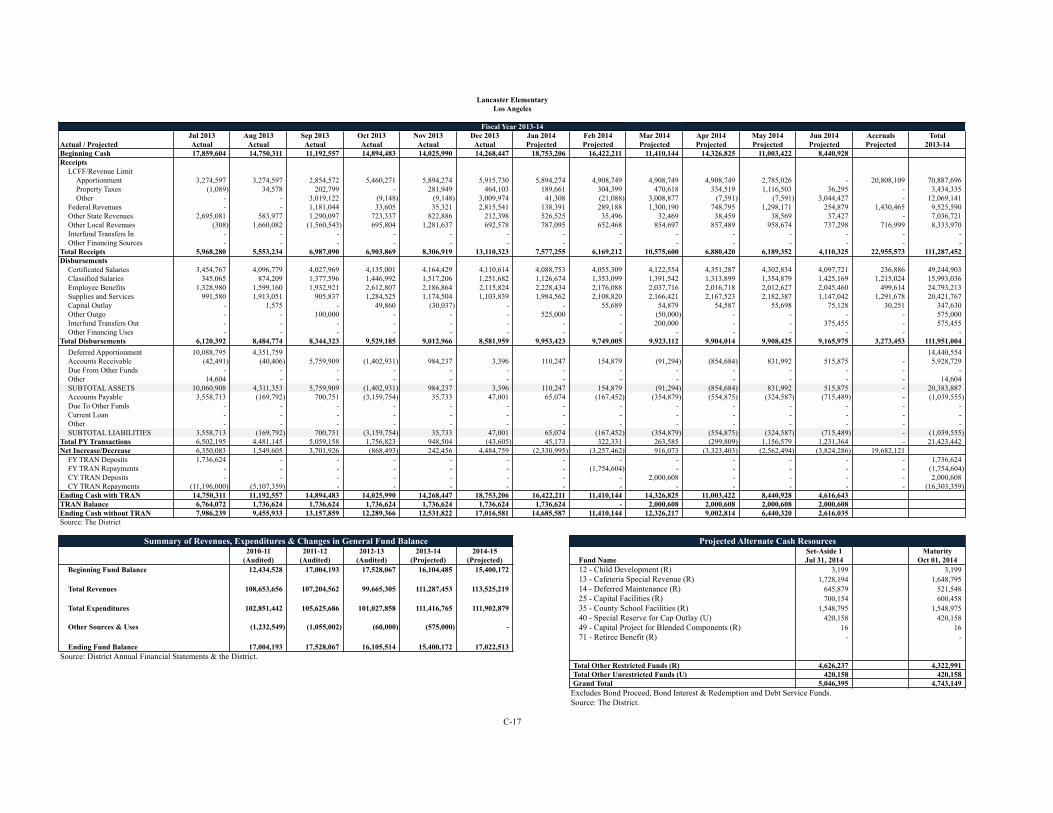
Lancaster Elementary Lancaster ElementaryLos Angeles Los Angeles
Fiscal Year 2013-14 Fiscal Year 2014-15Jul 2013 Aug 2013 Sep 2013 Oct 2013 Nov 2013 Dec 2013 Jan 2014 Feb 2014 Mar 2014 Apr 2014 May 2014 Jun 2014 Accruals Total
Actual / Projected Actual Actual Actual Actual Actual Actual Projected Projected Projected Projected Projected Projected Projected 2013-14Beginning Cash 17,859,604 14,750,311 11,192,557 14,894,483 14,025,990 14,268,447 18,753,206 16,422,211 11,410,144 14,326,825 11,003,422 8,440,928 Receipts
LCFF/Revenue LimitApportionment 3,274,597 3,274,597 2,854,572 5,460,271 5,894,274 5,915,730 5,894,274 4,908,749 4,908,749 4,908,749 2,785,026 - 20,808,109 70,887,696 Property Taxes (1,089) 34,578 202,799 - 281,949 464,103 189,661 304,399 470,618 334,519 1,116,503 36,295 - 3,434,335 Other - - 3,019,122 (9,148) (9,148) 3,009,974 41,308 (21,088) 3,008,877 (7,591) (7,591) 3,044,427 - 12,069,141
Federal Revenues - - 1,181,044 33,605 35,321 2,815,541 138,391 289,188 1,300,190 748,795 1,298,171 254,879 1,430,465 9,525,590 Other State Revenues 2,695,081 583,977 1,290,097 723,337 822,886 212,398 526,525 35,496 32,469 38,459 38,569 37,427 - 7,036,721 Other Local Revenues (308) 1,660,082 (1,560,543) 695,804 1,281,637 692,578 787,095 652,468 854,697 857,489 958,674 737,298 716,999 8,333,970 Interfund Transfers In - - - - - - - - - - - - - - Other Financing Sources - - - - - - - - - - - - - -
Total Receipts 5,968,280 5,553,234 6,987,090 6,903,869 8,306,919 13,110,323 7,577,255 6,169,212 10,575,600 6,880,420 6,189,352 4,110,325 22,955,573 111,287,452 Disbursements
Certificated Salaries 3,454,767 4,096,779 4,027,969 4,135,001 4,164,429 4,110,614 4,088,753 4,055,309 4,122,554 4,351,287 4,302,834 4,097,721 236,886 49,244,903 Classified Salaries 345,065 874,209 1,377,596 1,446,992 1,517,206 1,251,682 1,126,674 1,353,099 1,391,542 1,313,899 1,354,879 1,425,169 1,215,024 15,993,036 Employee Benefits 1,328,980 1,599,160 1,932,921 2,612,807 2,186,864 2,115,824 2,228,434 2,176,088 2,037,716 2,016,718 2,012,627 2,045,460 499,614 24,793,213 Supplies and Services 991,580 1,913,051 905,837 1,284,525 1,174,504 1,103,839 1,984,562 2,108,820 2,166,421 2,167,523 2,182,387 1,147,042 1,291,678 20,421,767 Capital Outlay - 1,575 - 49,860 (30,037) - - 55,689 54,879 54,587 55,698 75,128 30,251 347,630 Other Outgo - - 100,000 - - - 525,000 - (50,000) - - - - 575,000 Interfund Transfers Out - - - - - - - - 200,000 - - 375,455 - 575,455 Other Financing Uses - - - - - - - - - - - - - -
Total Disbursements 6,120,392 8,484,774 8,344,323 9,529,185 9,012,966 8,581,959 9,953,423 9,749,005 9,923,112 9,904,014 9,908,425 9,165,975 3,273,453 111,951,004 Asset TransactionsDeferred Apportionment 10,088,795 4,351,759 14,440,554 Accounts Receivable (42,491) (40,406) 5,759,909 (1,402,931) 984,237 3,396 110,247 154,879 (91,294) (854,684) 831,992 515,875 - 5,928,729 Due From Other Funds - - - - - - - - - - - - - - Other 14,604 - - - - - - - - - - - - 14,604 SUBTOTAL ASSETS 10,060,908 4,311,353 5,759,909 (1,402,931) 984,237 3,396 110,247 154,879 (91,294) (854,684) 831,992 515,875 - 20,383,887 Accounts Payable 3,558,713 (169,792) 700,751 (3,159,754) 35,733 47,001 65,074 (167,452) (354,879) (554,875) (324,587) (715,489) - (1,039,555) Due To Other Funds - - - - - - - - - - - - - - Current Loan - - - - - - - - - - - - - - Other - - - - - - - - - - - - - - SUBTOTAL LIABILITIES 3,558,713 (169,792) 700,751 (3,159,754) 35,733 47,001 65,074 (167,452) (354,879) (554,875) (324,587) (715,489) - (1,039,555)
Total PY Transactions 6,502,195 4,481,145 5,059,158 1,756,823 948,504 (43,605) 45,173 322,331 263,585 (299,809) 1,156,579 1,231,364 - 21,423,442 Net Increase/Decrease 6,350,083 1,549,605 3,701,926 (868,493) 242,456 4,484,759 (2,330,995) (3,257,462) 916,073 (3,323,403) (2,562,494) (3,824,286) 19,682,121
FY TRAN Deposits 1,736,624 - - - - - - - - - - - - 1,736,624 FY TRAN Repayments - - - - - - - (1,754,604) - - - - - (1,754,604) CY TRAN Deposits - - - - - - - - 2,000,608 - - - - 2,000,608 CY TRAN Repayments (11,196,000) (5,107,359) - - - - - - - - - - - (16,303,359)
Ending Cash with TRAN 14,750,311 11,192,557 14,894,483 14,025,990 14,268,447 18,753,206 16,422,211 11,410,144 14,326,825 11,003,422 8,440,928 4,616,643 TRAN Balance 6,764,072 1,736,624 1,736,624 1,736,624 1,736,624 1,736,624 1,736,624 - 2,000,608 2,000,608 2,000,608 2,000,608 Ending Cash without TRAN 7,986,239 9,455,933 13,157,859 12,289,366 12,531,822 17,016,581 14,685,587 11,410,144 12,326,217 9,002,814 6,440,320 2,616,035 Source: The District
Summary of Revenues, Expenditures & Changes in General Fund Balance Projected Alternate Cash Resources2010-11 2011-12 2012-13 2013-14 2014-15 Set-Aside 1 Maturity
(Audited) (Audited) (Audited) (Projected) (Projected) Fund Name Jul 31, 2014 Oct 01, 2014Beginning Fund Balance 12,434,528 17,004,193 17,528,067 16,104,485 15,400,172 12 - Child Development (R) 3,199 3,199
13 - Cafeteria Special Revenue (R) 1,728,194 1,648,795 Total Revenues 108,653,656 107,204,562 99,665,305 111,287,453 113,525,219 14 - Deferred Maintenance (R) 645,879 521,548
25 - Capital Facilities (R) 700,154 600,458 Total Expenditures 102,851,442 105,625,686 101,027,858 111,416,765 111,902,879 35 - County School Facilities (R) 1,548,795 1,548,975
40 - Special Reserve for Cap Outlay (U) 420,158 420,158 Other Sources & Uses (1,232,549) (1,055,002) (60,000) (575,000) - 49 - Capital Project for Blended Components (R) 16 16
71 - Retiree Benefit (R) - - Ending Fund Balance 17,004,193 17,528,067 16,105,514 15,400,172 17,022,513
Source: District Annual Financial Statements & the District.Total Other Restricted Funds (R) 4,626,237 4,322,991 Total Other Unrestricted Funds (U) 420,158 420,158 Grand Total 5,046,395 4,743,149
Excludes Bond Proceed, Bond Interest & Redemption and Debt Service Funds.Source: The District.
C-17 C-18

Lancaster ElementaryLos Angeles
Fiscal Year 2014-15Jul 2014 Aug 2014 Sep 2014 Oct 2014 Nov 2014 Dec 2014 Jan 2015 Feb 2015 Mar 2015 Apr 2015 May 2015 Jun 2015 Accruals Total
Actual / Projected Projected Projected Projected Projected Projected Projected Projected Projected Projected Projected Projected Projected Projected 2014-15Beginning Cash 4,616,643 20,335,080 15,471,909 17,460,980 17,396,030 18,488,486 20,185,110 21,322,225 20,990,904 24,315,075 24,448,443 25,042,115 Receipts
LCFF/Revenue LimitApportionment 3,871,881 3,871,881 6,969,387 6,969,387 6,969,387 6,969,387 6,969,387 6,969,387 6,969,387 6,969,387 6,969,387 6,969,387 - 77,437,628 Property Taxes (1,089) 34,577 202,799 - 292,756 468,597 1,245,879 352,486 470,618 356,428 954,287 - 89,604 4,466,942 Other - (20,581) 3,019,122 (25,248) - 3,019,122 - - 3,019,122 - - 3,019,122 (19,155) 12,011,504
Federal Revenues - - 1,181,044 633,605 1,654,879 126,148 1,048,759 584,579 489,759 544,795 1,036,599 254,879 372,748 7,927,794 Other State Revenues 698,579 554,876 524,587 254,689 152,896 89,587 154,268 184,579 54,268 89,754 94,689 54,896 327,036 3,234,704 Other Local Revenues 524,879 1,245,698 854,785 874,859 878,487 754,896 356,428 458,796 556,487 854,968 548,756 425,478 112,130 8,446,647 Interfund Transfers In - - - - - - - - - - - - - - Other Financing Sources - - - - - - - - - - - - - -
Total Receipts 5,094,250 5,686,451 12,751,724 8,707,291 9,948,405 11,427,736 9,774,721 8,549,827 11,559,641 8,815,332 9,603,718 10,723,762 882,363 113,525,219 Disbursements
Certificated Salaries 3,454,767 4,089,465 4,054,879 4,075,496 4,087,485 4,055,489 4,151,874 4,089,678 4,197,589 4,201,245 4,201,549 4,267,548 1,056,511 49,983,575 Classified Salaries 389,458 1,078,458 1,345,879 1,347,456 1,326,145 1,368,792 1,304,975 1,348,689 1,387,946 1,385,648 1,345,643 1,401,245 1,202,596 16,232,930 Employee Benefits 1,328,980 1,999,658 2,132,154 2,134,356 2,135,487 2,133,546 2,136,235 2,135,496 2,146,145 2,149,443 2,145,789 2,149,687 241,155 24,968,131 Supplies and Services 1,622,016 3,367,343 3,215,487 1,160,057 1,297,175 1,247,040 1,002,477 802,296 492,243 916,082 1,123,059 746,150 1,503,731 18,495,156 Capital Outlay 245,878 14,698 14,254 54,876 9,657 51,245 15,469 4,989 11,546 29,546 20,125 15,428 159,921 647,632 Other Outgo - - - - - 875,000 26,575 - - - - - - 901,575 Interfund Transfers Out - - - - - - - 500,000 - - 173,880 - - 673,880 Other Financing Uses - - - - - - - - - - - - - -
Total Disbursements 7,041,099 10,549,622 10,762,653 8,772,241 8,855,949 9,731,112 8,637,605 8,881,148 8,235,469 8,681,964 9,010,045 8,580,058 4,163,914 111,902,879 Asset TransactionsDeferred Apportionment 20,808,109 - - - - - - - - - - - - 20,808,109 Accounts Receivable 2,147,464 - - - - - - - - - - - - 2,147,464 Due From Other Funds - - - - - - - - - - - - - - Other - - - - - - - - - - - - - - SUBTOTAL ASSETS 22,955,573 - - - - - - - - - - - - 22,955,573 Accounts Payable 3,273,453 - - - - - - - - - - - - 3,273,453 Due To Other Funds - - - - - - - - - - - - - - Current Loan - - - - - - - - - - - - - - Other - - - - - - - - - - - - - - SUBTOTAL LIABILITIES 3,273,453 - - - - - - - - - - - - 3,273,453
Total PY Transactions 19,682,120 - - - - - - - - - - - - 19,682,120 Net Increase/Decrease 17,735,271 (4,863,171) 1,989,071 (64,950) 1,092,456 1,696,624 1,137,116 (331,321) 3,324,172 133,368 593,673 2,143,704 (3,281,551)
FY TRAN Deposits - - - - - - - - - - - - - FY TRAN Repayments - - - - - - - - - - - - - CY TRAN Deposits - - - - - - - - - - - - - CY TRAN Repayments (2,016,834) - - - - - - - - - - - (2,016,834)
Ending Cash with TRAN 20,335,080 15,471,909 17,460,980 17,396,030 18,488,486 20,185,110 21,322,225 20,990,904 24,315,075 24,448,443 25,042,115 27,185,819 TRAN Balance - - - - - - - - - - - - Ending Cash without TRAN 20,335,080 15,471,909 17,460,980 17,396,030 18,488,486 20,185,110 21,322,225 20,990,904 24,315,075 24,448,443 25,042,115 27,185,819 Source: The District
017
C-18

Meadows Union Elementary Meadows Union ElementaryImperial Imperial
Fiscal Year 2013-14 Fiscal Year 2014-15Jul 2013 Aug 2013 Sep 2013 Oct 2013 Nov 2013 Dec 2013 Jan 2014 Feb 2014 Mar 2014 Apr 2014 May 2014 Jun 2014 Accruals Total
Actual / Projected Actual Actual Actual Actual Actual Actual Projected Projected Projected Projected Projected Projected Projected 2013-14Beginning Cash 576,257 404,216 347,510 450,907 371,735 279,813 864,475 489,771 348,078 434,917 304,612 379,047 Receipts
LCFF/Revenue LimitApportionment 114,206 132,058 311,399 205,571 205,571 311,400 205,571 216,374 322,207 134,633 6,732 117,133 544,625 2,827,479 Property Taxes - - - 43,599 - 99,706 - - - 90,740 - (32,256) - 201,788 Other - - - - - 91,650 - - - - - - - 91,650
Federal Revenues - - 13,319 4,272 25,107 71,527 18,481 10,440 58,940 17,521 11,440 54,950 94,638 380,636 Other State Revenues 16,175 15,435 145,000 7,192 60,688 55,858 - - 39,588 14,750 351,800 149 52,603 759,237 Other Local Revenues 4,942 4,942 8,895 9,757 8,918 31,938 9,807 8,895 8,895 5,535 2,139 465 21,320 126,447 Interfund Transfers In - - - - - 20,541 - - - - - - - 20,541 Other Financing Sources - - - - - - - - - - - - - -
Total Receipts 135,323 152,436 478,613 270,390 300,284 682,620 233,859 235,709 429,630 263,178 372,110 140,440 713,186 4,407,778 Disbursements
Certificated Salaries 36,879 172,143 184,874 184,874 180,114 - 374,311 180,874 180,874 180,874 180,874 174,256 - 2,030,948 Classified Salaries 37,874 34,810 70,439 76,643 79,229 79,292 76,645 76,645 76,645 76,645 76,645 64,877 - 826,390 Employee Benefits 21,327 35,945 76,200 77,037 77,037 27,562 80,085 80,085 80,085 80,085 80,085 173,208 - 888,741 Supplies and Services 61,794 64,243 75,569 51,791 86,721 24,981 77,522 39,798 48,154 55,879 54,985 74,297 16,575 732,309 Capital Outlay - - - - - - - - - - - - - - Other Outgo - - - - - - - - - - - (25,460) - (25,460) Interfund Transfers Out - - - - - - - - - - - - - - Other Financing Uses - - - - - - - - - - - - - -
Total Disbursements 157,874 307,141 407,082 390,345 423,101 131,835 608,563 377,402 385,758 393,483 392,589 461,178 16,575 4,452,927 Asset TransactionsDeferred Apportionment 365,572 231,680 597,252 Accounts Receivable 195,568 41,923 32,370 33,666 49,662 7,304 - - - - - - - 360,493 Due From Other Funds - - - - - - - - - - - 28,005 - 28,005 Other - - - - - - - - - - - - - - SUBTOTAL ASSETS 561,140 273,603 32,370 33,666 49,662 7,304 - - - - - 28,005 - 985,750 Accounts Payable 398,629 35,055 505 2,751 - - - - - - (94,913) 29 - 342,056 Due To Other Funds 156,000 68,873 - - - - - - - - - - - 224,873 Current Loan - - - - - - - - - - - - - - Other - - - (9,868) 18,767 (26,573) - - - - - - - (17,674) SUBTOTAL LIABILITIES 554,629 103,928 505 (7,116) 18,767 (26,573) - - - - (94,913) 29 - 549,255
Total PY Transactions 6,511 169,675 31,866 40,782 30,894 33,877 - - - - 94,913 27,977 - 436,496 Net Increase/Decrease (16,040) 14,969 103,397 (79,172) (91,922) 584,662 (374,704) (141,693) 43,872 (130,305) 74,435 (292,761) 696,610
FY TRAN Deposits - - - - - - - - - - - - - - FY TRAN Repayments - - - - - - - - - - - - - - CY TRAN Deposits - - - - - - - - 42,968 - - - - 42,968 CY TRAN Repayments (156,000) (71,675) - - - - - - - - - - - (227,675)
Ending Cash with TRAN 404,216 347,510 450,907 371,735 279,813 864,475 489,771 348,078 434,917 304,612 379,047 86,285 TRAN Balance 68,873 - - - - - - - 42,968 42,968 42,968 42,968 Ending Cash without TRAN 335,343 347,510 450,907 371,735 279,813 864,475 489,771 348,078 391,950 261,645 336,079 43,318 Source: The District
Summary of Revenues, Expenditures & Changes in General Fund Balance Projected Alternate Cash Resources2010-11 2011-12 2012-13 2013-14 2014-15 Set-Aside 1 Maturity
(Audited) (Audited) (Audited) (Projected) (Projected) Fund Name Jul 31, 2014 Oct 01, 2014Beginning Fund Balance 1,189,137 1,123,710 1,261,192 995,656 791,923 13 - Cafeteria Special Revenue (R) 36,800 47,500
17 - Special Reserve Other than Cap Outlay (U) 11,250 11,250 Total Revenues 4,554,014 4,200,208 4,092,793 4,318,790 4,186,133 20 - Special Reserve for Post Employment Benefits (U) 107,200 107,200
25 - Capital Facilities (R) 131,200 131,200 Total Expenditures 4,660,274 4,062,727 4,219,526 4,537,983 4,480,762
Other Sources & Uses 40,833 - - 15,460 -
Ending Fund Balance 1,123,710 1,261,191 1,134,459 791,923 497,294 Source: District Annual Financial Statements & the District.
Total Other Restricted Funds (R) 168,000 178,700 Total Other Unrestricted Funds (U) 118,450 118,450 Grand Total 286,450 297,150
Excludes Bond Proceed, Bond Interest & Redemption and Debt Service Funds.Source: The District.
C-19 C-20
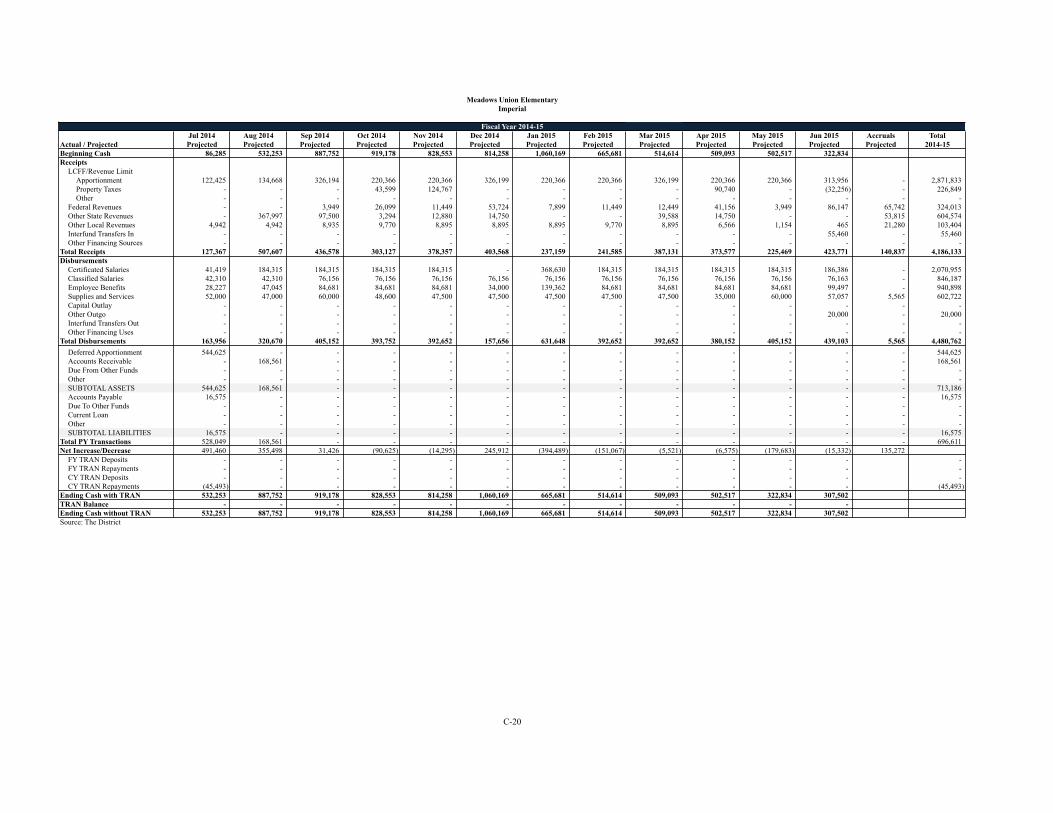
Meadows Union ElementaryImperial
Fiscal Year 2014-15Jul 2014 Aug 2014 Sep 2014 Oct 2014 Nov 2014 Dec 2014 Jan 2015 Feb 2015 Mar 2015 Apr 2015 May 2015 Jun 2015 Accruals Total
Actual / Projected Projected Projected Projected Projected Projected Projected Projected Projected Projected Projected Projected Projected Projected 2014-15Beginning Cash 86,285 532,253 887,752 919,178 828,553 814,258 1,060,169 665,681 514,614 509,093 502,517 322,834 Receipts
LCFF/Revenue LimitApportionment 122,425 134,668 326,194 220,366 220,366 326,199 220,366 220,366 326,199 220,366 220,366 313,956 - 2,871,833 Property Taxes - - - 43,599 124,767 - - - - 90,740 - (32,256) - 226,849 Other - - - - - - - - - - - - - -
Federal Revenues - - 3,949 26,099 11,449 53,724 7,899 11,449 12,449 41,156 3,949 86,147 65,742 324,013 Other State Revenues - 367,997 97,500 3,294 12,880 14,750 - - 39,588 14,750 - - 53,815 604,574 Other Local Revenues 4,942 4,942 8,935 9,770 8,895 8,895 8,895 9,770 8,895 6,566 1,154 465 21,280 103,404 Interfund Transfers In - - - - - - - - - - - 55,460 - 55,460 Other Financing Sources - - - - - - - - - - - - - -
Total Receipts 127,367 507,607 436,578 303,127 378,357 403,568 237,159 241,585 387,131 373,577 225,469 423,771 140,837 4,186,133 Disbursements
Certificated Salaries 41,419 184,315 184,315 184,315 184,315 - 368,630 184,315 184,315 184,315 184,315 186,386 - 2,070,955 Classified Salaries 42,310 42,310 76,156 76,156 76,156 76,156 76,156 76,156 76,156 76,156 76,156 76,163 - 846,187 Employee Benefits 28,227 47,045 84,681 84,681 84,681 34,000 139,362 84,681 84,681 84,681 84,681 99,497 - 940,898 Supplies and Services 52,000 47,000 60,000 48,600 47,500 47,500 47,500 47,500 47,500 35,000 60,000 57,057 5,565 602,722 Capital Outlay - - - - - - - - - - - - - - Other Outgo - - - - - - - - - - - 20,000 - 20,000 Interfund Transfers Out - - - - - - - - - - - - - - Other Financing Uses - - - - - - - - - - - - - -
Total Disbursements 163,956 320,670 405,152 393,752 392,652 157,656 631,648 392,652 392,652 380,152 405,152 439,103 5,565 4,480,762 Asset TransactionsDeferred Apportionment 544,625 - - - - - - - - - - - - 544,625 Accounts Receivable - 168,561 - - - - - - - - - - - 168,561 Due From Other Funds - - - - - - - - - - - - - - Other - - - - - - - - - - - - - - SUBTOTAL ASSETS 544,625 168,561 - - - - - - - - - - - 713,186 Accounts Payable 16,575 - - - - - - - - - - - - 16,575 Due To Other Funds - - - - - - - - - - - - - - Current Loan - - - - - - - - - - - - - - Other - - - - - - - - - - - - - - SUBTOTAL LIABILITIES 16,575 - - - - - - - - - - - - 16,575
Total PY Transactions 528,049 168,561 - - - - - - - - - - - 696,611 Net Increase/Decrease 491,460 355,498 31,426 (90,625) (14,295) 245,912 (394,489) (151,067) (5,521) (6,575) (179,683) (15,332) 135,272
FY TRAN Deposits - - - - - - - - - - - - - FY TRAN Repayments - - - - - - - - - - - - - CY TRAN Deposits - - - - - - - - - - - - - CY TRAN Repayments (45,493) - - - - - - - - - - - (45,493)
Ending Cash with TRAN 532,253 887,752 919,178 828,553 814,258 1,060,169 665,681 514,614 509,093 502,517 322,834 307,502 TRAN Balance - - - - - - - - - - - - Ending Cash without TRAN 532,253 887,752 919,178 828,553 814,258 1,060,169 665,681 514,614 509,093 502,517 322,834 307,502 Source: The District
019
C-20

Palermo Union Palermo UnionButte Butte
Fiscal Year 2013-14 Fiscal Year 2014-15Jul 2013 Aug 2013 Sep 2013 Oct 2013 Nov 2013 Dec 2013 Jan 2014 Feb 2014 Mar 2014 Apr 2014 May 2014 Jun 2014 Accruals Total
Actual / Projected Actual Actual Actual Actual Actual Actual Projected Projected Projected Projected Projected Projected Projected 2013-14Beginning Cash 719,577 842,749 893,985 1,132,488 982,499 1,055,116 1,938,054 1,836,027 1,179,909 1,599,885 1,284,874 833,750 Receipts
LCFF/Revenue LimitApportionment 307,876 304,239 828,929 543,720 543,720 828,929 543,720 245,215 531,759 139,347 7,850 285,209 1,290,571 6,401,084 Property Taxes - - - 61,084 5,395 675,625 - 514 - 362,588 5,418 81,686 - 1,192,310 Other - 165 (1,001) (445) (445) (445) (510) (510) (510) (510) (510) (510) - (5,234)
Federal Revenues 18,829 7,325 15,792 1,519 92,838 181,613 232,628 13,369 175,331 16,272 139,860 26,228 - 921,604 Other State Revenues 73,914 18,633 238,239 93,172 315,722 98,834 149,276 55,712 168,833 134,024 98,367 67,242 - 1,511,968 Other Local Revenues 828 1,113 20,141 59,762 14,643 29,473 28,560 24,177 15,373 15,770 19,700 9,048 - 238,587 Interfund Transfers In - - - - - - - - - - - - - - Other Financing Sources - - - - - - - - - - - - - -
Total Receipts 401,447 331,475 1,102,100 758,811 971,873 1,814,029 953,674 338,476 890,786 667,490 270,685 468,903 1,290,571 10,260,319 Disbursements
Certificated Salaries 658,270 624,317 723,286 729,243 734,011 729,446 757,973 843,186 1,002,541 788,127 656,103 949,289 - 9,195,791 Classified Salaries - - - - - - - - - - - - - - Employee Benefits - - - - - - - - - - - - - - Supplies and Services 163,408 60,504 139,174 179,558 165,245 201,645 297,727 151,408 84,045 194,373 65,706 244,501 - 1,947,294 Capital Outlay - - - - - - - - - - - - - - Other Outgo - - - - - - - - - - - - - - Interfund Transfers Out 750,000 1,138 - - - - - - - 751,138 Other Financing Uses - - - - - - - - - - - - - -
Total Disbursements 1,571,678 684,821 863,597 908,800 899,256 931,091 1,055,700 994,594 1,086,585 982,501 721,809 1,193,791 - 11,894,223 Asset TransactionsDeferred Apportionment 590,215 374,046 964,261 Accounts Receivable 703,188 30,536 - - - - - - - - - - - 733,724 Due From Other Funds - - - - - - - - - - - - - - Other - - - - - - - - - - - - - - SUBTOTAL ASSETS 1,293,403 404,582 - - - - - - - - - - - 1,697,985 Accounts Payable - - - - - - - - - - - - - - Due To Other Funds - - - - - - - - - - - - - - Current Loan - - - - - - - - - - - - - - Other - - - - - - - - - - - - - - SUBTOTAL LIABILITIES - - - - - - - - - - - - - -
Total PY Transactions 1,293,403 404,582 - - - - - - - - - - - 1,697,985 Net Increase/Decrease 123,172 51,236 238,503 (149,989) 72,617 882,938 (102,026) (656,118) (195,800) (315,011) (451,124) (724,888) 1,290,571
FY TRAN Deposits - - - - - - - - - - - - - - FY TRAN Repayments - - - - - - - - - - - - - - CY TRAN Deposits - - - - - - - - 615,775 - - - - 615,775 CY TRAN Repayments - - - - - - - - - - - - - -
Ending Cash with TRAN 842,749 893,985 1,132,488 982,499 1,055,116 1,938,054 1,836,027 1,179,909 1,599,885 1,284,874 833,750 108,862 TRAN Balance - - - - - - - - 615,775 615,775 615,775 615,775 Ending Cash without TRAN 842,749 893,985 1,132,488 982,499 1,055,116 1,938,054 1,836,027 1,179,909 984,110 669,099 217,975 (506,913) Source: The District
Summary of Revenues, Expenditures & Changes in General Fund Balance Projected Alternate Cash Resources2010-11 2011-12 2012-13 2013-14 2014-15 Set-Aside 1 Maturity
(Audited) (Audited) (Audited) (Projected) (Projected) Fund Name Jul 31, 2014 Oct 01, 2014Beginning Fund Balance 2,835,497 2,731,170 2,231,194 1,413,203 1,249,170 12 - Child Development (R) 6,487 37,939
13 - Cafeteria Special Revenue (R) 23,768 - Total Revenues 11,033,431 10,609,271 9,894,259 10,435,584 10,577,547 17 - Special Reserve Other than Cap Outlay (U) 407,127 407,209
25 - Capital Facilities (R) - - Total Expenditures 11,132,332 11,104,331 10,305,066 10,598,479 10,697,284 35 - County School Facilities (R) 13,347 13,347
Other Sources & Uses (5,426) (4,916) (3,598) (1,138) -
Ending Fund Balance 2,731,170 2,231,194 1,816,789 1,249,170 1,129,433 Source: District Annual Financial Statements & the District.
Total Other Restricted Funds (R) 43,602 51,286 Total Other Unrestricted Funds (U) 407,127 407,209 Grand Total 450,729 458,495
Excludes Bond Proceed, Bond Interest & Redemption and Debt Service Funds.Source: The District.
C-21 C-22

Palermo UnionButte
Fiscal Year 2014-15Jul 2014 Aug 2014 Sep 2014 Oct 2014 Nov 2014 Dec 2014 Jan 2015 Feb 2015 Mar 2015 Apr 2015 May 2015 Jun 2015 Accruals Total
Actual / Projected Projected Projected Projected Projected Projected Projected Projected Projected Projected Projected Projected Projected Projected 2014-15Beginning Cash 108,862 423,999 431,282 699,318 497,912 326,976 912,512 796,095 435,038 737,053 824,428 892,436 Receipts
LCFF/Revenue LimitApportionment 254,665 254,665 698,772 458,397 458,397 698,772 458,397 458,397 698,772 458,397 458,397 698,772 - 6,054,798 Property Taxes - - - 57,927 4,945 528,408 - 706 - 342,618 4,945 77,001 - 1,016,550 Other - - (706) (706) (706) (706) (706) (706) (706) (706) (706) (706) - (7,064)
Federal Revenues 17,947 7,013 15,081 1,433 48,863 87,999 221,844 12,744 167,175 15,534 133,393 25,035 - 754,058 Other State Revenues 137,381 34,723 443,090 173,361 263,439 211,607 277,529 103,665 314,013 249,348 182,923 125,052 - 2,516,130 Other Local Revenues 875 1,191 21,342 63,345 24 36,923 30,263 25,620 16,286 16,724 20,880 9,601 - 243,075 Interfund Transfers In - - - - - - - - - - - - - - Other Financing Sources - - - - - - - - - - - - - -
Total Receipts 410,867 297,591 1,177,579 753,757 774,961 1,563,002 987,326 600,425 1,195,539 1,081,914 799,831 934,754 - 10,577,547 Disbursements
Certificated Salaries 700,481 664,541 769,300 775,605 780,653 775,821 806,016 810,074 809,480 800,166 666,117 963,802 - 9,322,055 Classified Salaries - - - - - - - - - - - - - - Employee Benefits - - - - - - - - - - - - - - Supplies and Services 163,408 60,504 139,174 179,558 165,245 201,645 297,727 151,408 84,045 194,373 65,706 244,501 - 1,947,294 Capital Outlay - - - - - - - - - - - - - - Other Outgo - - - - - - - - - - - - - Interfund Transfers Out - - 1,070 - - - - - - - - - - 1,070 Other Financing Uses - - - - - - - - - - - - - -
Total Disbursements 863,889 725,045 909,543 955,163 945,898 977,466 1,103,743 961,481 893,524 994,539 731,822 1,208,303 - 11,270,418 Asset TransactionsDeferred Apportionment 1,283,178 - - - - - - - - - - - - 1,283,178 Accounts Receivable 106,712 434,737 - - - - - - - - - - - 541,449 Due From Other Funds - - - - - - - - - - - - - - Other - - - - - - - - - - - - - - SUBTOTAL ASSETS 1,389,890 434,737 - - - - - - - - - - - 1,824,627 Accounts Payable - - - - - - - - - - - - - - Due To Other Funds - - - - - - - - - - - - - - Current Loan - - - - - - - - - - - - - - Other - - - - - - - - - - - - - - SUBTOTAL LIABILITIES - - - - - - - - - - - - - -
Total PY Transactions 1,389,890 434,737 - - - - - - - - - - - 1,824,627 Net Increase/Decrease 936,868 7,283 268,036 (201,406) (170,936) 585,537 (116,417) (361,057) 302,015 87,374 68,009 (273,549) -
FY TRAN Deposits - - - - - - - - - - - - - FY TRAN Repayments - - - - - - - - - - - - - CY TRAN Deposits - - - - - - - - - - - - - CY TRAN Repayments (621,731) - - - - - - - - - - - (621,731)
Ending Cash with TRAN 423,999 431,282 699,318 497,912 326,976 912,512 796,095 435,038 737,053 824,428 892,436 618,887 TRAN Balance - - - - - - - - - - - - Ending Cash without TRAN 423,999 431,282 699,318 497,912 326,976 912,512 796,095 435,038 737,053 824,428 892,436 618,887 Source: The District
021
C-22

Red Bluff Union Elementary Red Bluff Union ElementaryTehama Tehama
Fiscal Year 2013-14 Fiscal Year 2014-15Jul 2013 Aug 2013 Sep 2013 Oct 2013 Nov 2013 Dec 2013 Jan 2014 Feb 2014 Mar 2014 Apr 2014 May 2014 Jun 2014 Accruals Total
Actual / Projected Actual Actual Actual Actual Actual Actual Projected Projected Projected Projected Projected Projected Projected 2013-14Beginning Cash 1,909,196 3,865,911 3,095,263 3,384,306 3,001,627 3,264,091 4,893,544 5,180,773 3,573,720 3,827,033 3,378,869 2,474,640 Receipts
LCFF/Revenue LimitApportionment 457,045 457,045 1,313,673 822,681 822,681 1,313,673 822,681 822,681 1,313,673 511,890 462,864 490,992 1,930,558 11,542,137 Property Taxes 472 - - 135,823 201,747 1,315,256 523,422 - - 512,304 - - - 2,689,024 Other - (4,814) - (16,048) (6,420) (5,131) (6,420) (6,420) (10,805) (6,420) (6,420) (11,342) - (80,240)
Federal Revenues - - 481 7,219 - 83,353 182,217 182,217 182,217 182,217 182,217 182,217 866,647 2,051,001 Other State Revenues - - 218,100 - 382,436 - - - - - - 113,178 295,000 1,008,714 Other Local Revenues - 1,250 4,822 5,762 274,299 67,805 67,085 67,085 67,085 67,085 67,085 67,084 254,639 1,011,086 Interfund Transfers In - - - - - - 330,663 - - - - - - 330,663 Other Financing Sources - - - - - - - - - - - - - -
Total Receipts 457,517 453,481 1,537,076 955,437 1,674,744 2,774,956 1,919,648 1,065,563 1,552,170 1,267,076 705,746 842,128 3,346,844 18,552,385 Disbursements
Certificated Salaries 70,387 656,096 666,645 660,059 666,468 659,802 667,000 667,000 667,000 667,000 667,000 550,924 - 7,265,381 Classified Salaries 83,812 221,901 202,196 204,916 207,617 207,816 208,000 208,000 208,000 208,000 208,000 146,753 - 2,315,011 Employee Benefits 97,104 352,559 322,252 339,092 335,977 342,847 336,000 336,000 336,000 336,000 336,000 333,542 - 3,803,373 Supplies and Services 440,146 255,846 257,172 235,331 214,535 294,919 249,620 249,620 287,435 398,975 398,975 1,371,396 - 4,653,970 Capital Outlay - 8,186 - - - - 100,000 - - 105,266 - - - 213,452 Other Outgo - 5,000 22,234 - 3,385 - - - - - - 364,385 - 395,004 Interfund Transfers Out - - - - - - 120,799 - - - - 120,799 - 241,598 Other Financing Uses - - - - - - - - - - - - - -
Total Disbursements 691,449 1,499,587 1,470,499 1,439,398 1,427,982 1,505,384 1,681,419 1,460,620 1,498,435 1,715,241 1,609,975 2,887,799 - 18,887,789 Asset TransactionsDeferred Apportionment 879,558 557,416 1,436,974 Accounts Receivable 872,948 37,592 416,262 100,704 15,306 359,710 - - - - - - - 1,802,521 Due From Other Funds - - - - - - 42,000 - - - - - - 42,000 Other 7,984 23,194 9,577 - - - 7,000 - - - - - - 47,755 SUBTOTAL ASSETS 1,760,490 618,202 425,839 100,704 15,306 359,710 49,000 - - - - - - 3,329,250 Accounts Payable 165,763 61,340 203,373 (579) (397) (171) - - - - - - - 429,330 Due To Other Funds - - - - - - - - - - - - - - Current Loan - - - - - - - - - - - - - - Other - - - - - - - - - - - - - - SUBTOTAL LIABILITIES 165,763 61,340 203,373 (579) (397) (171) - - - - - - - 429,330
Total PY Transactions 1,594,726 556,861 222,466 101,282 15,703 359,881 49,000 - - - - - - 2,899,920 Net Increase/Decrease 1,360,793 (489,245) 289,043 (382,679) 262,464 1,629,453 287,229 (395,057) 53,735 (448,165) (904,229) (2,045,670) 3,346,844
FY TRAN Deposits 1,199,921 - - - - - - - - - - - - 1,199,921 FY TRAN Repayments - - - - - - - (1,211,996) - - - - - (1,211,996) CY TRAN Deposits - - - - - - - - 199,578 - - - - 199,578 CY TRAN Repayments (604,000) (281,403) - - - - - - - - - - - (885,403)
Ending Cash with TRAN 3,865,911 3,095,263 3,384,306 3,001,627 3,264,091 4,893,544 5,180,773 3,573,720 3,827,033 3,378,869 2,474,640 428,969 TRAN Balance 1,472,710 1,199,921 1,199,921 1,199,921 1,199,921 1,199,921 1,199,921 - 199,578 199,578 199,578 199,578 Ending Cash without TRAN 2,393,200 1,895,342 2,184,385 1,801,706 2,064,170 3,693,623 3,980,852 3,573,720 3,627,455 3,179,291 2,275,062 229,391 Source: The District
Summary of Revenues, Expenditures & Changes in General Fund Balance Projected Alternate Cash Resources2010-11 2011-12 2012-13 2013-14 2014-15 Set-Aside 1 Maturity
(Audited) (Audited) (Audited) (Projected) (Projected) Fund Name Jul 31, 2014 Oct 01, 2014Beginning Fund Balance 3,806,850 3,647,122 4,344,260 3,511,968 3,176,664 13 - Cafeteria Special Revenue (R) 300,000 300,000
14 - Deferred Maintenance (R) 140,000 120,000 Total Revenues 16,553,289 15,650,590 15,259,682 18,220,747 18,719,669 20 - Special Reserve for Post Employment Benefits (U) 340,593 -
25 - Capital Facilities (R) 400,000 200,000 Total Expenditures 16,625,497 16,777,905 15,416,393 18,645,116 17,748,673
Other Sources & Uses (87,520) 1,753,069 12 89,065 -
Ending Fund Balance 3,647,122 4,272,876 4,187,561 3,176,664 4,147,660 Source: District Annual Financial Statements & the District.
Total Other Restricted Funds (R) 840,000 620,000 Total Other Unrestricted Funds (U) 340,593 - Grand Total 1,180,593 620,000
Excludes Bond Proceed, Bond Interest & Redemption and Debt Service Funds.Source: The District.
C-23 C-24

Red Bluff Union ElementaryTehama
Fiscal Year 2014-15Jul 2014 Aug 2014 Sep 2014 Oct 2014 Nov 2014 Dec 2014 Jan 2015 Feb 2015 Mar 2015 Apr 2015 May 2015 Jun 2015 Accruals Total
Actual / Projected Projected Projected Projected Projected Projected Projected Projected Projected Projected Projected Projected Projected Projected 2014-15Beginning Cash 428,969 1,785,981 1,423,572 1,853,362 1,638,142 1,905,202 3,778,316 4,247,245 3,955,082 4,381,123 4,474,496 4,070,476 Receipts
LCFF/Revenue LimitApportionment 512,010 512,010 1,471,822 921,618 921,618 1,471,822 921,618 921,618 1,471,822 921,618 921,618 1,471,822 - 12,441,013 Property Taxes - - - 152,038 225,753 1,243,948 586,652 - 201,182 600,474 - - - 3,010,046 Other - (6,143) - (18,429) (7,679) (7,679) (7,679) (7,679) (12,286) (7,679) (7,679) (10,750) - (93,680)
Federal Revenues - - 289 5,061 - 140,973 128,394 128,394 128,394 128,394 128,394 128,394 528,757 1,445,443 Other State Revenues - - 123,324 - 216,244 - - - - - - 64,000 166,846 570,414 Other Local Revenues - 1,212 4,849 5,758 274,346 67,071 67,071 67,071 67,071 67,071 67,071 67,071 254,346 1,010,010 Interfund Transfers In - - - - - - 336,423 - - - - - - 336,423 Other Financing Sources - - - - - - - - - - - - - -
Total Receipts 512,010 507,079 1,600,283 1,066,045 1,630,283 2,916,135 2,032,479 1,109,404 1,856,183 1,709,878 1,109,404 1,720,537 949,949 18,719,669 Disbursements
Certificated Salaries 70,842 659,484 670,439 663,136 669,709 670,439 670,439 670,439 670,439 670,439 670,439 546,284 - 7,302,528 Classified Salaries 84,055 222,676 202,707 205,494 208,280 208,512 208,512 208,512 208,512 208,512 208,512 146,980 - 2,321,265 Employee Benefits 96,986 352,573 322,146 339,261 335,838 335,838 335,838 335,838 335,838 335,838 335,838 340,402 - 3,802,232 Supplies and Services 329,650 191,657 192,702 176,324 160,643 186,778 186,778 186,778 215,352 298,636 298,636 1,060,036 - 3,483,971 Capital Outlay - 8,026 - - - - 97,917 - - 103,079 - - - 209,021 Other Outgo - 5,108 22,644 - 3,459 - - - - - - 371,039 - 402,250 Interfund Transfers Out - - - - - - 113,703 - - - - 113,703 - 227,406 Other Financing Uses - - - - - - - - - - - - - -
Total Disbursements 581,532 1,439,523 1,410,639 1,384,215 1,377,929 1,401,567 1,613,187 1,401,567 1,430,142 1,616,504 1,513,425 2,578,443 - 17,748,673 Asset TransactionsDeferred Apportionment 1,930,558 - - - - - - - - - - - - 1,930,558 Accounts Receivable (152,847) 602,988 422,827 102,949 14,707 360,322 - - - - - - - 1,350,946 Due From Other Funds - - - - - - 42,283 - - - - - - 42,283 Other 7,354 23,899 9,192 - - - 7,354 - - - - - - 47,798 SUBTOTAL ASSETS 1,785,065 626,887 432,019 102,949 14,707 360,322 49,636 - - - - - - 3,371,585 Accounts Payable 156,341 56,851 191,874 - - 1,777 - - - - - - - 406,843 Due To Other Funds - - - - - - - - - - - - - - Current Loan - - - - - - - - - - - - - - Other - - - - - - - - - - - - - - SUBTOTAL LIABILITIES 156,341 56,851 191,874 - - 1,777 - - - - - - - 406,843
Total PY Transactions 1,628,723 570,036 240,145 102,949 14,707 358,546 49,636 - - - - - - 2,964,742 Net Increase/Decrease 1,559,201 (362,409) 429,789 (215,220) 267,061 1,873,113 468,929 (292,163) 426,041 93,374 (404,021) (857,906) 949,949
FY TRAN Deposits - - - - - - - - - - - - - FY TRAN Repayments - - - - - - - - - - - - - CY TRAN Deposits - - - - - - - - - - - - - CY TRAN Repayments (202,189) - - - - - - - - - - - (202,189)
Ending Cash with TRAN 1,785,981 1,423,572 1,853,362 1,638,142 1,905,202 3,778,316 4,247,245 3,955,082 4,381,123 4,474,496 4,070,476 3,212,569 TRAN Balance - - - - - - - - - - - - Ending Cash without TRAN 1,785,981 1,423,572 1,853,362 1,638,142 1,905,202 3,778,316 4,247,245 3,955,082 4,381,123 4,474,496 4,070,476 3,212,569 Source: The District
023
C-24
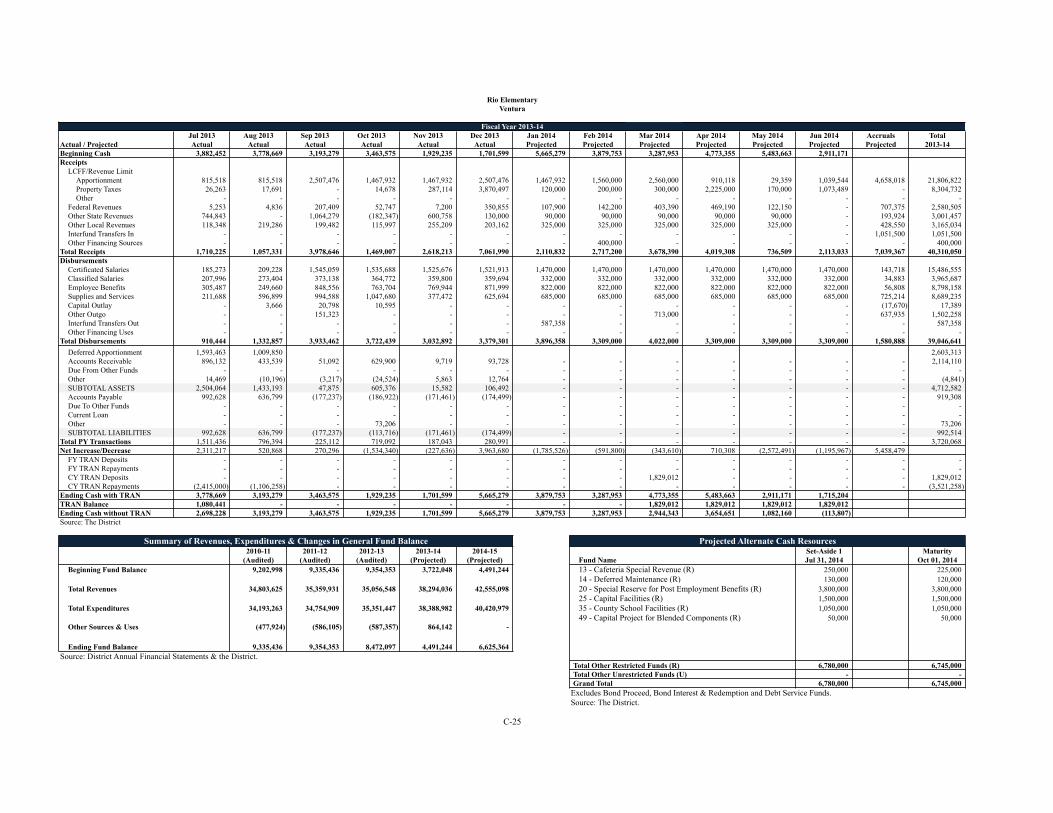
Rio Elementary Rio ElementaryVentura Ventura
Fiscal Year 2013-14 Fiscal Year 2014-15Jul 2013 Aug 2013 Sep 2013 Oct 2013 Nov 2013 Dec 2013 Jan 2014 Feb 2014 Mar 2014 Apr 2014 May 2014 Jun 2014 Accruals Total
Actual / Projected Actual Actual Actual Actual Actual Actual Projected Projected Projected Projected Projected Projected Projected 2013-14Beginning Cash 3,882,452 3,778,669 3,193,279 3,463,575 1,929,235 1,701,599 5,665,279 3,879,753 3,287,953 4,773,355 5,483,663 2,911,171 Receipts
LCFF/Revenue LimitApportionment 815,518 815,518 2,507,476 1,467,932 1,467,932 2,507,476 1,467,932 1,560,000 2,560,000 910,118 29,359 1,039,544 4,658,018 21,806,822 Property Taxes 26,263 17,691 - 14,678 287,114 3,870,497 120,000 200,000 300,000 2,225,000 170,000 1,073,489 - 8,304,732 Other - - - - - - - - - - - - - -
Federal Revenues 5,253 4,836 207,409 52,747 7,200 350,855 107,900 142,200 403,390 469,190 122,150 - 707,375 2,580,505 Other State Revenues 744,843 - 1,064,279 (182,347) 600,758 130,000 90,000 90,000 90,000 90,000 90,000 - 193,924 3,001,457 Other Local Revenues 118,348 219,286 199,482 115,997 255,209 203,162 325,000 325,000 325,000 325,000 325,000 - 428,550 3,165,034 Interfund Transfers In - - - - - - - - - - - - 1,051,500 1,051,500 Other Financing Sources - - - - - - - 400,000 - - - - - 400,000
Total Receipts 1,710,225 1,057,331 3,978,646 1,469,007 2,618,213 7,061,990 2,110,832 2,717,200 3,678,390 4,019,308 736,509 2,113,033 7,039,367 40,310,050 Disbursements
Certificated Salaries 185,273 209,228 1,545,059 1,535,688 1,525,676 1,521,913 1,470,000 1,470,000 1,470,000 1,470,000 1,470,000 1,470,000 143,718 15,486,555 Classified Salaries 207,996 273,404 373,138 364,772 359,800 359,694 332,000 332,000 332,000 332,000 332,000 332,000 34,883 3,965,687 Employee Benefits 305,487 249,660 848,556 763,704 769,944 871,999 822,000 822,000 822,000 822,000 822,000 822,000 56,808 8,798,158 Supplies and Services 211,688 596,899 994,588 1,047,680 377,472 625,694 685,000 685,000 685,000 685,000 685,000 685,000 725,214 8,689,235 Capital Outlay - 3,666 20,798 10,595 - - - - - - - - (17,670) 17,389 Other Outgo - - 151,323 - - - - - 713,000 - - - 637,935 1,502,258 Interfund Transfers Out - - - - - - 587,358 - - - - - - 587,358 Other Financing Uses - - - - - - - - - - - - - -
Total Disbursements 910,444 1,332,857 3,933,462 3,722,439 3,032,892 3,379,301 3,896,358 3,309,000 4,022,000 3,309,000 3,309,000 3,309,000 1,580,888 39,046,641 Asset TransactionsDeferred Apportionment 1,593,463 1,009,850 2,603,313 Accounts Receivable 896,132 433,539 51,092 629,900 9,719 93,728 - - - - - - - 2,114,110 Due From Other Funds - - - - - - - - - - - - - - Other 14,469 (10,196) (3,217) (24,524) 5,863 12,764 - - - - - - - (4,841) SUBTOTAL ASSETS 2,504,064 1,433,193 47,875 605,376 15,582 106,492 - - - - - - - 4,712,582 Accounts Payable 992,628 636,799 (177,237) (186,922) (171,461) (174,499) - - - - - - - 919,308 Due To Other Funds - - - - - - - - - - - - - - Current Loan - - - - - - - - - - - - - - Other - - - 73,206 - - - - - - - - - 73,206 SUBTOTAL LIABILITIES 992,628 636,799 (177,237) (113,716) (171,461) (174,499) - - - - - - - 992,514
Total PY Transactions 1,511,436 796,394 225,112 719,092 187,043 280,991 - - - - - - - 3,720,068 Net Increase/Decrease 2,311,217 520,868 270,296 (1,534,340) (227,636) 3,963,680 (1,785,526) (591,800) (343,610) 710,308 (2,572,491) (1,195,967) 5,458,479
FY TRAN Deposits - - - - - - - - - - - - - - FY TRAN Repayments - - - - - - - - - - - - - - CY TRAN Deposits - - - - - - - - 1,829,012 - - - - 1,829,012 CY TRAN Repayments (2,415,000) (1,106,258) - - - - - - - - - - - (3,521,258)
Ending Cash with TRAN 3,778,669 3,193,279 3,463,575 1,929,235 1,701,599 5,665,279 3,879,753 3,287,953 4,773,355 5,483,663 2,911,171 1,715,204 TRAN Balance 1,080,441 - - - - - - - 1,829,012 1,829,012 1,829,012 1,829,012 Ending Cash without TRAN 2,698,228 3,193,279 3,463,575 1,929,235 1,701,599 5,665,279 3,879,753 3,287,953 2,944,343 3,654,651 1,082,160 (113,807) Source: The District
Summary of Revenues, Expenditures & Changes in General Fund Balance Projected Alternate Cash Resources2010-11 2011-12 2012-13 2013-14 2014-15 Set-Aside 1 Maturity
(Audited) (Audited) (Audited) (Projected) (Projected) Fund Name Jul 31, 2014 Oct 01, 2014Beginning Fund Balance 9,202,998 9,335,436 9,354,353 3,722,048 4,491,244 13 - Cafeteria Special Revenue (R) 250,000 225,000
14 - Deferred Maintenance (R) 130,000 120,000 Total Revenues 34,803,625 35,359,931 35,056,548 38,294,036 42,555,098 20 - Special Reserve for Post Employment Benefits (R) 3,800,000 3,800,000
25 - Capital Facilities (R) 1,500,000 1,500,000 Total Expenditures 34,193,263 34,754,909 35,351,447 38,388,982 40,420,979 35 - County School Facilities (R) 1,050,000 1,050,000
49 - Capital Project for Blended Components (R) 50,000 50,000 Other Sources & Uses (477,924) (586,105) (587,357) 864,142 -
Ending Fund Balance 9,335,436 9,354,353 8,472,097 4,491,244 6,625,364 Source: District Annual Financial Statements & the District.
Total Other Restricted Funds (R) 6,780,000 6,745,000 Total Other Unrestricted Funds (U) - - Grand Total 6,780,000 6,745,000
Excludes Bond Proceed, Bond Interest & Redemption and Debt Service Funds.Source: The District.
C-25 C-26

Rio ElementaryVentura
Fiscal Year 2014-15Jul 2014 Aug 2014 Sep 2014 Oct 2014 Nov 2014 Dec 2014 Jan 2015 Feb 2015 Mar 2015 Apr 2015 May 2015 Jun 2015 Accruals Total
Actual / Projected Projected Projected Projected Projected Projected Projected Projected Projected Projected Projected Projected Projected Projected 2014-15Beginning Cash 1,715,204 4,203,206 4,025,995 4,363,760 3,110,661 2,908,727 7,132,125 5,492,494 4,588,408 4,592,672 6,325,177 5,367,241 Receipts
LCFF/Revenue LimitApportionment 988,769 988,769 3,039,784 1,779,783 1,779,783 3,039,784 1,779,783 1,779,783 3,039,784 1,779,783 1,779,783 3,039,784 - 24,815,373 Property Taxes 30,353 20,235 - 16,863 327,139 3,868,338 134,903 225,962 340,630 2,532,800 192,237 1,220,870 - 8,910,331 Other - - - - - - - - - - - - - -
Federal Revenues 5,334 4,849 209,247 53,100 7,274 176,515 108,867 143,297 406,856 473,049 123,172 - 713,332 2,424,892 Other State Revenues 507,663 - 725,463 (124,342) 409,562 61,364 61,364 61,364 61,364 61,364 61,364 - 132,214 2,018,742 Other Local Revenues 118,327 219,233 199,512 116,026 255,060 325,070 325,070 325,070 325,070 325,070 325,070 - 428,606 3,287,183 Interfund Transfers In - - - - - - - - - - - - 1,098,577 1,098,577 Other Financing Sources - - - - - - - - - - - - - -
Total Receipts 1,650,445 1,233,086 4,174,007 1,841,430 2,778,818 7,471,070 2,409,986 2,535,476 4,173,703 5,172,066 2,481,626 4,260,654 2,372,729 42,555,098 Disbursements
Certificated Salaries 189,141 214,360 1,577,751 1,568,294 1,557,261 1,500,519 1,500,519 1,500,519 1,500,519 1,500,519 1,500,519 1,500,519 146,584 15,757,023 Classified Salaries 231,077 303,726 414,888 405,260 400,008 368,935 368,935 368,935 368,935 368,935 368,935 368,935 38,950 4,376,455 Employee Benefits 336,337 274,659 934,806 841,325 848,071 905,894 905,894 905,894 905,894 905,894 905,894 905,894 62,642 9,639,101 Supplies and Services 205,287 578,536 964,509 1,016,255 365,614 664,213 664,213 664,213 664,213 664,213 664,213 664,213 703,235 8,482,927 Capital Outlay - 3,697 20,974 10,685 - - - - - - - - (17,821) 17,535 Other Outgo - - 154,865 - - - - - 729,878 - - - 653,138 1,537,880 Interfund Transfers Out - - - - - - 610,056 - - - - - - 610,056 Other Financing Uses - - - - - - - - - - - - - -
Total Disbursements 961,842 1,374,978 4,067,793 3,841,819 3,170,955 3,439,561 4,049,618 3,439,561 4,169,439 3,439,561 3,439,561 3,439,561 1,586,728 40,420,979 Asset TransactionsDeferred Apportionment 4,658,018 - - - - - - - - - - - - 4,658,018 Accounts Receivable - 635,654 53,892 655,001 8,291 2,143,262 - - - - - - - 3,496,101 Due From Other Funds - - - - - - - - - - - - - - Other 16,582 (12,437) (4,146) (24,873) 4,146 - - - - - - - - (20,728) SUBTOTAL ASSETS 4,674,600 623,217 49,747 630,127 12,437 2,143,262 - - - - - - - 8,133,390 Accounts Payable 1,030,228 658,538 (181,805) (193,925) (177,765) 1,951,372 - - - - - - - 3,086,643 Due To Other Funds - - - - - - - - - - - - - - Current Loan - - - - - - - - - - - - - - Other - - - 76,762 - - - - - - - - - 76,762 SUBTOTAL LIABILITIES 1,030,228 658,538 (181,805) (117,163) (177,765) 1,951,372 - - - - - - - 3,163,405
Total PY Transactions 3,644,372 (35,320) 231,552 747,291 190,201 191,890 - - - - - - - 4,969,985 Net Increase/Decrease 4,332,976 (177,212) 337,766 (1,253,099) (201,935) 4,223,399 (1,639,631) (904,086) 4,264 1,732,505 (957,936) 821,093 786,002
FY TRAN Deposits - - - - - - - - - - - - - FY TRAN Repayments - - - - - - - - - - - - - CY TRAN Deposits - - - - - - - - - - - - - CY TRAN Repayments (1,844,974) - - - - - - - - - - - (1,844,974)
Ending Cash with TRAN 4,203,206 4,025,995 4,363,760 3,110,661 2,908,727 7,132,125 5,492,494 4,588,408 4,592,672 6,325,177 5,367,241 6,188,334 TRAN Balance - - - - - - - - - - - - Ending Cash without TRAN 4,203,206 4,025,995 4,363,760 3,110,661 2,908,727 7,132,125 5,492,494 4,588,408 4,592,672 6,325,177 5,367,241 6,188,334 Source: The District
025
C-26

Riverside Community College Riverside Community CollegeRiverside Riverside
Fiscal Year 2013-14 Fiscal Year 2014-15Jul 2013 Aug 2013 Sep 2013 Oct 2013 Nov 2013 Dec 2013 Jan 2014 Feb 2014 Mar 2014 Apr 2014 May 2014 Jun 2014 Accruals Total
Actual / Projected Actual Actual Actual Actual Actual Actual Projected Projected Projected Projected Projected Projected ProjectedBeginning Cash 13,887,063 15,201,505 19,148,954 25,674,605 20,322,291 18,688,198 22,072,159 25,878,266 25,731,565 20,753,009 15,183,192 10,385,613 Receipts
State Revenue 6,454,717 6,445,138 13,973,275 8,255,715 8,324,757 8,799,144 7,418,103 5,620,524 8,022,137 4,394,058 3,721,792 7,972,072 14,847,992 104,249,424 Federal Revenue 12,241 12,242 690,247 682,165 1,163,786 135,228 862,356 1,080,065 777,880 1,411,932 559,242 1,559,310 - 8,946,694 Local Revenue 646,493 4,943,752 3,400,351 945,488 1,349,893 10,709,423 9,251,826 3,990,351 1,607,678 4,069,076 5,248,475 2,702,474 - 48,865,280 Interfund Borrowing - - (519,392) - - - - - - - - - - (519,392) Other Sources - - - - - (944,000) - - (944,000) - - (942,000) - (2,830,000)
- - - - - - - - - - - - - - - - - - - - - - - - - - - - - - - - - - - - - - - - - -
Total Receipts 7,113,451 11,401,132 17,544,481 9,883,368 10,838,436 18,699,795 17,532,285 10,690,940 9,463,695 9,875,066 9,529,509 11,291,856 14,847,992 158,712,006
Salaries & Benefits 9,284,571 8,293,291 8,549,438 13,967,180 10,448,271 13,723,914 11,778,761 10,688,320 11,825,534 12,170,846 12,022,365 14,934,925 - 137,687,416 Other Expenses 2,401,617 2,280,354 3,344,607 2,552,952 2,122,830 1,677,831 1,947,918 2,462,075 2,625,749 3,338,040 2,352,911 3,267,238 - 30,374,122
- - - - - - - - - - - - - - - - - - - - - - - - - - - - - - - - - - - - - - - - - - - - - - - - - - - - - - - - - - - - - - - - - - - - - - - - - - - - - - - - - - - -
Total Disbursements 11,686,188 10,573,645 11,894,045 16,520,132 12,571,101 15,401,745 13,726,679 13,150,395 14,451,283 15,508,886 14,375,276 18,202,163 - 168,061,538 Asset TransactionsDeferred Apportionment 26,646,912 - 26,646,912 Accounts Receivable 1,514,192 3,639,859 878,332 1,284,450 98,572 85,005 501 12,754 9,032 64,003 48,188 366 - 7,635,254 Due From Other Funds - - - - - - - - - - - - - - Other - - - - - - - - - - - - - - SUBTOTAL ASSETS 28,161,104 3,639,859 878,332 1,284,450 98,572 85,005 501 12,754 9,032 64,003 48,188 366 - 34,282,166 Accounts Payable 2,277,986 519,897 3,117 - - (906) - 2,700,000 - - - - - 5,500,094 Due To Other Funds - - - - - - - - - - - - - - Current Loan - - - - - - - - - - - - - - Other (75,328) - - - - - - - - - - - - (75,328) SUBTOTAL LIABILITIES 2,202,658 519,897 3,117 - - (906) - 2,700,000 - - - - - 5,424,766
Total PY Transactions 25,958,446 3,119,962 875,215 1,284,450 98,572 85,911 501 (2,687,246) 9,032 64,003 48,188 366 - 28,857,400 Net Increase/Decrease 21,385,709 3,947,449 6,525,651 (5,352,314) (1,634,093) 3,383,961 3,806,107 (5,146,701) (4,978,556) (5,569,817) (4,797,579) (6,909,941) 14,847,992
FY TRAN Deposits - - - - - - - - - - - - - - FY TRAN Repayments - - - - - - - - - - - - - - CY TRAN Deposits - - - - - - - - 4,999,273 - - - - 4,999,273 CY TRAN Repayments (20,071,267) - - - - - - - - - - - - (20,071,267)
Ending Cash with TRAN 15,201,505 19,148,954 25,674,605 20,322,291 18,688,198 22,072,159 25,878,266 20,731,565 20,752,282 15,182,465 10,384,886 3,474,945 TRAN Balance - - - - - - - - 4,999,273 4,999,273 4,999,273 4,999,273 Ending Cash without TRAN 15,201,505 19,148,954 25,674,605 20,322,291 18,688,198 22,072,159 25,878,266 20,731,565 15,753,009 10,183,192 5,385,613 (1,524,328) Source: The District
Summary of Revenues, Expenditures & Changes in General Fund Balance Projected Alternate Cash Resources2010-11 2011-12 2012-13 2013-14 2014-15 Set-Aside 1 Maturity
(Audited) (Audited) (Audited) (1st Interim) (Projected) Fund Name Jul 31, 2014 Oct 01, 2014Beginning Fund Balance 22,136,151 24,903,237 15,388,779 20,415,832 18,133,374 Resource 3200 - Food Services (R) 344,072 370,911
Resource 3300 - Child Care (R) 177,012 197,130 Total Revenues 176,675,854 156,240,026 164,216,919 179,645,860 173,005,242 Resource 4130 - La Sierra Capital (R) 7,178,436 6,031,551
Resource 6100 - Self-Ins Health/Liab (R) 2,001,869 1,267,123 Total Expenditures 174,034,002 165,378,164 158,445,907 181,928,318 170,943,585 Resource 6110 - Self-Ins Wkr Cmp (R) 5,187,419 4,910,322
Other Sources & Uses - (376,320) (743,955) - -
Ending Fund Balance 24,778,003 15,388,779 20,415,836 18,133,374 20,195,031 Source: District Annual Financial Statements & the District.
Total Other Restricted Funds (R) 14,888,808 12,777,037 Total Other Unrestricted Funds (U) - - Grand Total 14,888,808 12,777,037
Excludes Bond Proceed, Bond Interest & Redemption and Debt Service Funds.Source: The District.
C-27 C-28

Riverside Community CollegeRiverside
Fiscal Year 2014-15Jul 2014 Aug 2014 Sep 2014 Oct 2014 Nov 2014 Dec 2014 Jan 2015 Feb 2015 Mar 2015 Apr 2015 May 2015 Jun 2015 Accruals Total
Actual / Projected Projected Projected Projected Projected Projected Projected Projected Projected Projected Projected Projected Projected ProjectedBeginning Cash 3,474,945 9,659,413 10,828,245 17,696,224 11,354,273 10,176,121 15,610,582 20,314,753 19,800,888 20,076,078 18,558,804 17,613,190 Receipts
State Revenue 6,669,424 6,659,526 14,438,076 8,530,330 8,601,668 9,091,835 7,664,856 7,165,852 11,784,862 8,036,100 7,341,472 11,733,132 - 107,717,133 Federal Revenue 16,519 16,520 931,473 920,566 1,570,503 182,487 1,163,730 1,457,524 1,049,732 1,905,371 754,685 2,104,254 - 12,073,363 Local Revenue 686,915 5,252,859 3,612,957 1,004,604 1,434,295 11,379,028 9,830,295 4,239,847 1,708,198 4,323,494 5,576,635 2,871,446 - 51,920,573 Interfund Borrowing - - - - - - - - - - - - - - Other Sources - - - - - 431,696 - - 431,696 - - 430,781 - 1,294,173
- - - - - - - - - - - - - - - - - - - - - - - - - - - - - - - - - - - - - - - - - -
Total Receipts 7,372,858 11,928,906 18,982,506 10,455,500 11,606,466 21,085,046 18,658,881 12,863,223 14,974,487 14,264,965 13,672,792 17,139,612 - 173,005,242
Salaries & Benefits 9,420,600 8,414,797 8,674,696 14,171,814 10,601,349 13,924,984 11,951,333 10,844,915 11,998,791 12,349,162 12,198,506 15,153,738 - 139,704,685 Other Expenses 2,469,993 2,345,278 3,439,831 2,625,637 2,183,269 1,725,600 2,003,377 2,532,172 2,700,506 3,433,077 2,419,900 3,360,259 - 31,238,900
- - - - - - - - - - - - - - - - - - - - - - - - - - - - - - - - - - - - - - - - - - - - - - - - - - - - - - - - - - - - - - - - - - - - - - - - - - - - - - - - - - - -
Total Disbursements 11,890,593 10,760,074 12,114,527 16,797,451 12,784,618 15,650,584 13,954,709 13,377,088 14,699,297 15,782,239 14,618,406 18,513,997 - 170,943,585 Asset TransactionsDeferred Apportionment 14,847,992 - - - - - - - - - - - - 14,847,992 Accounts Receivable 2,599,945 - - - - - - - - - - - - 2,599,945 Due From Other Funds - - - - - - - - - - - - - - Other - - - - - - - - - - - - - - SUBTOTAL ASSETS 17,447,937 - - - - - - - - - - - - 17,447,937 Accounts Payable 1,721,340 - - - - - - - - - - - - 1,721,340 Due To Other Funds - - - - - - - - - - - - - - Current Loan - - - - - - - - - - - - - - Other - - - - - - - - - - - - - - SUBTOTAL LIABILITIES 1,721,340 - - - - - - - - - - - - 1,721,340
Total PY Transactions 15,726,597 - - - - - - - - - - - - 15,726,597 Net Increase/Decrease 11,208,862 1,168,832 6,867,979 (6,341,951) (1,178,152) 5,434,461 4,704,171 (513,865) 275,190 (1,517,274) (945,614) (1,374,384) -
FY TRAN Deposits - - - - - - - - - - - - - FY TRAN Repayments - - - - - - - - - - - - - CY TRAN Deposits - - - - - - - - - - - - - CY TRAN Repayments (5,024,394) - - - - - - - - - - - (5,024,394)
Ending Cash with TRAN 9,659,413 10,828,245 17,696,224 11,354,273 10,176,121 15,610,582 20,314,753 19,800,888 20,076,078 18,558,804 17,613,190 16,238,805 TRAN Balance - - - - - - - - - - - - Ending Cash without TRAN 9,659,413 10,828,245 17,696,224 11,354,273 10,176,121 15,610,582 20,314,753 19,800,888 20,076,078 18,558,804 17,613,190 16,238,805 Source: The District
C-28

San Bernardino City Unified San Bernardino City UnifiedSan Bernardino San Bernardino
Fiscal Year 2013-14 Fiscal Year 2014-15Jul 2013 Aug 2013 Sep 2013 Oct 2013 Nov 2013 Dec 2013 Jan 2014 Feb 2014 Mar 2014 Apr 2014 May 2014 Jun 2014 Accruals Total
Actual / Projected Actual Actual Actual Actual Actual Actual Projected Projected Projected Projected Projected Projected Projected 2013-14Beginning Cash 66,363,902 66,944,700 55,935,350 78,342,017 43,710,682 53,709,707 73,558,731 69,747,500 64,795,200 100,662,962 79,296,385 59,437,601 Receipts
LCFF/Revenue LimitApportionment 23,165,545 10,758,289 36,441,889 27,258,674 22,734,402 36,427,065 23,384,912 23,384,912 34,824,754 12,056,660 23,384,912 11,439,842 52,920,015 338,181,872 Property Taxes 872,010 - - - 3,259,743 5,232,223 1,023,411 1,125,325 466,314 3,799,011 3,021,280 54,750 (1,476,197) 17,377,871 Other 1,845 (68,939) (124,029) (84,028) (128,876) (157,886) (96,178) (96,724) (134,011) (120,458) (54,429) (105,627) (159,508) (1,328,848)
Federal Revenues 112,322 261,916 4,921,616 139,883 2,515,864 8,335,751 5,338,545 489,163 11,423,483 871,057 6,612,812 6,309,035 13,813,104 61,144,552 Other State Revenues 21,606,953 5,881,947 6,108,300 (14,297,377) 9,023,563 3,050,700 4,475,484 5,134,929 5,182,792 4,336,652 3,335,529 3,291,054 12,513,439 69,643,965 Other Local Revenues 250,929 426,353 655,452 (510,936) 247,083 1,722,207 (145,821) 822,879 267,283 532,378 1,651,370 2,719 (168,551) 5,753,343 Interfund Transfers In - - - - - - - - - - - - - - Other Financing Sources - - - - - - - - - - - - - -
Total Receipts 46,009,604 17,259,566 48,003,228 12,506,215 37,651,778 54,610,060 33,980,354 30,860,485 52,030,616 21,475,300 37,951,475 20,991,772 77,442,302 490,772,754 Disbursements
Certificated Salaries 245 17,009,211 17,673,888 19,734,693 18,734,300 18,767,563 18,292,196 18,431,883 18,853,945 18,888,794 19,371,030 21,116,582 17,132,378 224,006,707 Classified Salaries 3,418,420 4,465,045 4,637,787 6,515,213 5,975,338 5,668,432 6,221,584 5,062,350 5,789,453 6,230,230 5,145,591 7,640,170 (155,791) 66,613,823 Employee Benefits 8,652,909 7,108,312 7,003,773 7,405,054 7,248,203 7,323,952 7,118,917 7,385,897 7,462,751 7,220,524 8,068,725 10,874,309 4,953,479 97,826,805 Supplies and Services 1,759,473 4,118,623 6,152,044 10,962,772 5,214,076 3,875,477 5,578,532 6,902,868 7,687,622 10,401,169 24,351,152 16,730,397 13,373,684 117,107,890 Capital Outlay 9,575 7,351 26,973 69,903 52,059 8,817 693,816 169,990 609,012 508,438 897,970 606,230 2,386,979 6,047,113 Other Outgo 1,305,312 (1,280,037) (84,962) (91,533) (115,000) 1,963 1,627,122 (2,172,879) (162,535) (407,280) (24,209) (48,220) (689,483) (2,141,740) Interfund Transfers Out - - - - - 254 35,747 32,676 34,669 - - 51,408 599,746 754,500 Other Financing Uses - - - - - - - - - - - - - -
Total Disbursements 15,145,934 31,428,506 35,409,502 44,596,102 37,108,975 35,646,458 39,567,915 35,812,785 40,274,916 42,841,877 57,810,259 56,970,876 37,600,992 510,215,098 Asset TransactionsDeferred Apportionment 32,272,869 20,452,774 52,725,643 Accounts Receivable - (374,569) 13,203,637 20,721,458 9,469,688 135,383 - - - - - - - 43,155,596 Due From Other Funds - 564,489 - - - - 1,776,330 - - - - - - 2,340,819 Other 108,242 (56,572) 10,027 (63,820) 45,515 54,261 - - - - - - - 97,654 SUBTOTAL ASSETS 32,381,111 20,586,122 13,213,663 20,657,639 9,515,204 189,644 1,776,330 - - - - - - 98,319,712 Accounts Payable 35,063,983 (19,970,149) 3,193,597 63,431,890 2,299,073 327,774 - - - - - - - 84,346,166 Due To Other Funds - 22,922,365 - - - - - - - - - - - 22,922,365 Current Loan - 528,606 207,125 (40,232,803) - - - - - - - - - (39,497,072) Other - 1,424,316 - - (2,240,091) (1,023,553) - - - - - - - (1,839,328) SUBTOTAL LIABILITIES 35,063,983 4,905,138 3,400,722 23,199,087 58,982 (695,779) - - - - - - - 65,932,131
Total PY Transactions (2,682,872) 15,680,984 9,812,941 (2,541,448) 9,456,222 885,423 1,776,330 - - - - - - 32,387,581 Net Increase/Decrease 28,180,798 1,512,044 22,406,667 (34,631,335) 9,999,025 19,849,025 (3,811,231) (4,952,300) 11,755,699 (21,366,577) (19,858,784) (35,979,103) 39,841,310
FY TRAN Deposits - - - - - - - - - - - - - - FY TRAN Repayments - - - - - - - - - - - - - - CY TRAN Deposits - - - - - - - - 24,112,062 - - - - 24,112,062 CY TRAN Repayments (27,600,000) (12,521,394) - - - - - - - - - - - (40,121,394)
Ending Cash with TRAN 66,944,700 55,935,350 78,342,017 43,710,682 53,709,707 73,558,731 69,747,500 64,795,200 100,662,962 79,296,385 59,437,601 23,458,498 TRAN Balance 12,396,675 - - - - - - - 24,112,062 24,112,062 24,112,062 24,112,062 Ending Cash without TRAN 54,548,025 55,935,350 78,342,017 43,710,682 53,709,707 73,558,731 69,747,500 64,795,200 76,550,900 55,184,323 35,325,539 (653,564) Source: The District
Summary of Revenues, Expenditures & Changes in General Fund Balance Projected Alternate Cash Resources2010-11 2011-12 2012-13 2013-14 2014-15 Set-Aside 1 Maturity
(Audited) (Audited) (Audited) (Projected) (Projected) Fund Name Jul 31, 2014 Oct 01, 2014Beginning Fund Balance 66,099,028 54,084,072 62,503,506 62,148,755 33,490,198 11 - Adult Education (R) 1,161,355 1,230,661
12 - Child Development (R) 4,268,940 4,762,362 Total Revenues 476,770,376 488,415,632 471,660,861 481,556,542 488,534,216 25 - Capital Facilities (R) 16,937,638 16,747,370
35 - County School Facilities (R) 89,744,693 92,483,461 Total Expenditures 489,054,660 479,598,203 471,955,601 509,460,599 499,297,762 40 - Special Reserve for Cap Outlay (U) 41,285 -
67 - Self-Insurance (R) 32,664,495 34,000,099 Other Sources & Uses 269,328 (397,995) (60,011) (754,500) - 73 - Foundation Private-Purpose Trust (R) 363,078 357,396
61 - Cafeteria Enterprise (R) 5,098,680 5,505,219 Ending Fund Balance 54,084,072 62,503,506 62,148,755 33,490,198 22,726,652
Source: District Annual Financial Statements & the District.Total Other Restricted Funds (R) 150,238,879 155,086,568 Total Other Unrestricted Funds (U) 41,285 - Grand Total 150,280,164 155,086,568
Excludes Bond Proceed, Bond Interest & Redemption and Debt Service Funds.Source: The District.
C-29 C-30

San Bernardino City UnifiedSan Bernardino
Fiscal Year 2014-15Jul 2014 Aug 2014 Sep 2014 Oct 2014 Nov 2014 Dec 2014 Jan 2015 Feb 2015 Mar 2015 Apr 2015 May 2015 Jun 2015 Accruals Total
Actual / Projected Projected Projected Projected Projected Projected Projected Projected Projected Projected Projected Projected Projected Projected 2014-15Beginning Cash 23,458,498 44,973,721 54,217,375 76,877,590 15,461,094 12,354,430 20,878,910 17,544,565 14,245,231 30,156,147 49,052,383 33,669,295 Receipts
LCFF/Revenue LimitApportionment 15,020,889 15,020,889 40,404,129 27,037,601 27,037,601 40,404,129 27,037,601 27,037,601 40,404,129 27,037,601 27,037,601 40,404,129 - 353,883,897 Property Taxes 872,010 - - - 2,147,864 4,867,905 1,023,411 1,125,325 466,314 3,799,011 3,021,280 54,750 - 17,377,871 Other 1,875 (70,069) (126,063) (85,406) (251,468) (121,131) (97,755) (98,310) (136,209) (122,434) (55,321) (107,360) (81,045) (1,350,695)
Federal Revenues 97,121 226,471 4,255,574 120,953 7,282,478 7,666,904 4,616,080 424,432 9,911,814 755,790 5,737,739 5,474,160 6,299,879 52,869,394 Other State Revenues 18,709,461 5,092,002 5,289,177 (12,434,429) 3,621,348 5,560,440 3,892,328 4,465,847 4,507,475 3,759,877 2,900,910 2,862,229 12,078,585 60,305,250 Other Local Revenues 237,630 403,756 620,713 (483,857) 198,367 1,489,701 (138,092) 779,267 253,117 504,162 1,563,847 2,575 17,313 5,448,498 Interfund Transfers In - - - - - - - - - - - - - - Other Financing Sources - - - - - - - - - - - - - -
Total Receipts 34,938,985 20,673,048 50,443,529 14,154,862 40,036,191 59,867,948 36,333,572 33,734,162 55,406,639 35,734,007 40,206,056 48,690,484 18,314,733 488,534,216 Disbursements
Certificated Salaries - 16,784,689 17,440,592 19,474,195 18,760,933 18,779,545 18,050,739 18,188,582 18,605,073 18,639,462 19,115,332 20,837,843 16,374,582 221,051,567 Classified Salaries 3,394,833 4,434,237 4,605,786 6,470,258 6,467,750 4,624,818 6,178,655 5,027,420 5,749,506 6,187,242 5,110,086 7,590,388 316,112 66,157,091 Employee Benefits 8,957,492 7,358,525 7,250,306 7,665,712 8,052,726 7,782,455 7,369,502 7,645,880 7,725,440 7,474,687 8,352,744 11,257,084 4,375,648 101,268,202 Supplies and Services 1,605,584 3,770,326 5,634,714 10,022,186 7,869,683 4,804,771 5,107,342 6,319,466 7,037,726 9,521,352 22,289,336 15,313,791 7,889,435 107,185,711 Capital Outlay 7,953 6,106 22,404 58,061 110,246 261,743 576,284 141,194 505,845 422,309 745,854 503,535 1,661,152 5,022,684 Other Outgo 1,305,312 (1,280,037) (84,962) (91,533) 921 (162,807) 1,627,122 (2,172,879) (162,535) (407,280) (24,209) (48,220) (640,633) (2,141,740) Interfund Transfers Out - - - - - - 35,747 32,676 34,669 - - 51,154 600,000 754,246 Other Financing Uses - - - - - - - - - - - - - -
Total Disbursements 15,271,173 31,073,846 34,868,840 43,598,880 41,262,258 36,090,525 38,945,392 35,182,338 39,495,724 41,837,771 55,589,144 55,505,574 30,576,296 499,297,762 Asset TransactionsDeferred Apportionment 52,920,015 - - - - - - - - - - - - 52,920,015 Accounts Receivable - 3,766,328 9,535,178 (2,779,177) 381,929 1,946,731 - - - - - - - 12,850,989 Due From Other Funds - 560,000 - - - - 1,540,000 - - - - - - 2,100,000 Other - - - - - - - - - - - - - - SUBTOTAL ASSETS 52,920,015 4,326,328 9,535,178 (2,779,177) 381,929 1,946,731 1,540,000 - - - - - - 67,871,004 Accounts Payable 26,895,867 (15,318,125) 2,449,652 29,193,301 2,262,525 17,199,675 2,262,525 1,851,157 - - - - - 66,796,578 Due To Other Funds - - - - - - - - - (25,000,000) - - - (25,000,000) Current Loan - - - - - - - - - - - - - - Other - - - - - - - - - - - - - - SUBTOTAL LIABILITIES 26,895,867 (15,318,125) 2,449,652 29,193,301 2,262,525 17,199,675 2,262,525 1,851,157 - (25,000,000) - - - 41,796,578
Total PY Transactions 26,024,148 19,644,453 7,085,525 (31,972,478) (1,880,596) (15,252,944) (722,525) (1,851,157) - 25,000,000 - - - 26,074,426 Net Increase/Decrease 45,691,960 9,243,654 22,660,215 (61,416,496) (3,106,664) 8,524,479 (3,334,345) (3,299,333) 15,910,916 18,896,236 (15,383,088) (6,815,091) (12,261,563)
FY TRAN Deposits - - - - - - - - - - - - - FY TRAN Repayments - - - - - - - - - - - - - CY TRAN Deposits - - - - - - - - - - - - - CY TRAN Repayments (24,176,736) - - - - - - - - - - - (24,176,736)
Ending Cash with TRAN 44,973,721 54,217,375 76,877,590 15,461,094 12,354,430 20,878,910 17,544,565 14,245,231 30,156,147 49,052,383 33,669,295 26,854,204 TRAN Balance - - - - - - - - - - - - Ending Cash without TRAN 44,973,721 54,217,375 76,877,590 15,461,094 12,354,430 20,878,910 17,544,565 14,245,231 30,156,147 49,052,383 33,669,295 26,854,204 Source: The District
029
C-30

Thermalito Union Thermalito UnionButte Butte
Fiscal Year 2013-14 Fiscal Year 2014-15Jul 2013 Aug 2013 Sep 2013 Oct 2013 Nov 2013 Dec 2013 Jan 2014 Feb 2014 Mar 2014 Apr 2014 May 2014 Jun 2014 Accruals Total
Actual / Projected Actual Actual Actual Actual Actual Actual Projected Projected Projected Projected Projected Projected Projected 2013-14Beginning Cash 1,256,539 1,021,049 507,069 1,134,806 976,698 859,116 2,273,228 1,824,856 1,340,855 2,192,987 1,999,117 1,079,991 Receipts
LCFF/Revenue LimitApportionment 321,525 321,525 872,305 578,746 578,746 872,305 578,746 578,746 872,305 358,822 11,575 293,559 1,794,988 8,033,892 Property Taxes - - - 65,798 5,545 656,148 (1,637) - - - 143,591 - - 869,445 Other - (1,737) (1,737) (772) (772) (772) (772) (772) (772) (772) (772) (772) 1,073 (9,349)
Federal Revenues - 1,394 301,683 232 - 623,708 74,595 3,372 41,678 403,346 - 414,319 200,002 2,064,329 Other State Revenues 18,942 18,942 167,296 91,742 182,990 137,321 48,508 48,508 48,508 76,093 19,083 - 268,333 1,126,266 Other Local Revenues 229 21 9,631 2,576 319 150 3,397 2,200 2,200 2,200 2,200 24,261 6,285 55,669 Interfund Transfers In - - - - - - - - - - - - - - Other Financing Sources - - - - - - - - - - - - - -
Total Receipts 340,696 340,145 1,349,178 738,323 766,828 2,288,860 702,837 632,054 963,918 839,689 175,677 731,367 2,270,681 12,140,252 Disbursements
Certificated Salaries 658,592 683,690 763,464 784,026 808,781 880,439 834,874 835,961 830,961 831,961 835,961 830,961 65,051 9,644,722 Classified Salaries - - - - - - - - - - - - - - Employee Benefits - - - - - - - - - - - - - - Supplies and Services 62,408 262,716 100,460 155,958 82,035 83,300 389,601 238,000 175,500 175,500 258,000 402,587 84,449 2,470,513 Capital Outlay - - - - - - - - - - - - - - Other Outgo - - - - - - - - - - - - - - Interfund Transfers Out - - - - - - - - - - - - - - Other Financing Uses - - - - - - - - - - - - - -
Total Disbursements 721,000 946,406 863,924 939,984 890,816 963,739 1,224,475 1,073,961 1,006,461 1,007,461 1,093,961 1,233,548 149,500 12,115,236 Asset TransactionsDeferred Apportionment 648,935 411,259 1,060,194 Accounts Receivable 475,848 38,268 69,703 43,553 73,281 106,686 73,266 - - - - - 232,282 1,112,886 Due From Other Funds - - 72,993 - - - - - - - - - - 72,993 Other - - - - - - - - - - - - - - SUBTOTAL ASSETS 1,124,783 449,527 142,696 43,553 73,281 106,686 73,266 - - - - - 232,282 2,246,074 Accounts Payable 227,968 3,900 212 - 66,875 17,695 - 42,093 42,093 26,098 842 23,940 - 451,716 Due To Other Funds - - - - - - - - - - - - - - Current Loan - - - - - - - - - - - - - - Other - - - - - - - - - - - - - - SUBTOTAL LIABILITIES 227,968 3,900 212 - 66,875 17,695 - 42,093 42,093 26,098 842 23,940 - 451,716
Total PY Transactions 896,814 445,627 142,484 43,553 6,406 88,991 73,266 (42,093) (42,093) (26,098) (842) (23,940) 232,282 1,794,357 Net Increase/Decrease 516,510 (160,634) 627,738 (158,109) (117,582) 1,414,112 (448,372) (484,001) (84,636) (193,870) (919,126) (526,121) 2,353,463
FY TRAN Deposits - - - - - - - - - - - - - - FY TRAN Repayments - - - - - - - - - - - - - - CY TRAN Deposits - - - - - - - - 936,767 - - - - 936,767 CY TRAN Repayments (752,000) (353,347) - - - - - - - - - - - (1,105,347)
Ending Cash with TRAN 1,021,049 507,069 1,134,806 976,698 859,116 2,273,228 1,824,856 1,340,855 2,192,987 1,999,117 1,079,991 553,870 TRAN Balance 337,935 - - - - - - - 936,767 936,767 936,767 936,767 Ending Cash without TRAN 683,114 507,069 1,134,806 976,698 859,116 2,273,228 1,824,856 1,340,855 1,256,220 1,062,350 143,224 (382,897) Source: The District
Summary of Revenues, Expenditures & Changes in General Fund Balance Projected Alternate Cash Resources2010-11 2011-12 2012-13 2013-14 2014-15 Set-Aside 1 Maturity
(Audited) (Audited) (Audited) (Projected) (Projected) Fund Name Jul 31, 2014 Oct 01, 2014Beginning Fund Balance 1,679,078 1,656,625 1,526,101 1,408,050 1,623,226 12 - Child Development (R) - 78,658
13 - Cafeteria Special Revenue (R) - - Total Revenues 12,441,304 12,080,447 11,000,868 12,041,855 12,658,430 25 - Capital Facilities (R) 28,796 28,796
35 - County School Facilities (R) 66,806 66,806 Total Expenditures 12,463,757 12,210,971 11,118,918 11,826,679 11,810,707
Other Sources & Uses - - - - -
Ending Fund Balance 1,656,625 1,526,101 1,408,051 1,623,226 2,470,949 Source: District Annual Financial Statements & the District.
Total Other Restricted Funds (R) 95,602 174,260 Total Other Unrestricted Funds (U) - - Grand Total 95,602 174,260
Excludes Bond Proceed, Bond Interest & Redemption and Debt Service Funds.Source: The District.
C-31 C-32

Thermalito UnionButte
Fiscal Year 2014-15Jul 2014 Aug 2014 Sep 2014 Oct 2014 Nov 2014 Dec 2014 Jan 2015 Feb 2015 Mar 2015 Apr 2015 May 2015 Jun 2015 Accruals Total
Actual / Projected Projected Projected Projected Projected Projected Projected Projected Projected Projected Projected Projected Projected Projected 2014-15Beginning Cash 553,870 1,039,200 412,454 1,004,492 972,412 840,531 2,213,594 2,109,888 1,874,320 2,441,343 2,278,837 2,120,056 Receipts
LCFF/Revenue LimitApportionment 394,739 394,739 1,051,433 710,531 710,531 1,051,433 710,531 710,531 1,051,433 710,531 710,531 1,051,432 - 9,258,395 Property Taxes 28,500 - - 66,000 5,500 405,000 190,000 - - - 100,000 74,444 - 869,444 Other (482) (482) (868) (868) (868) (868) (868) (868) (868) (868) (868) (864) - (9,640)
Federal Revenues - 7,500 390,896 - 7,500 460,583 - 7,500 425,740 - 7,500 234,537 191,202 1,732,958 Other State Revenues 18,942 18,942 34,096 136,764 34,098 62,610 76,212 62,611 48,355 90,468 52,382 34,099 94,883 764,462 Other Local Revenues 750 750 2,950 2,950 2,950 2,950 2,950 2,950 2,950 2,950 14,761 2,950 - 42,811 Interfund Transfers In - - - - - - - - - - - - - - Other Financing Sources - - - - - - - - - - - - - -
Total Receipts 442,449 421,449 1,478,507 915,377 759,711 1,981,708 978,825 782,724 1,527,610 803,081 884,306 1,396,598 286,085 12,658,430 Disbursements
Certificated Salaries 686,414 802,914 797,414 812,414 816,414 816,414 820,414 810,414 810,414 815,414 810,414 810,414 24,055 9,633,523 Classified Salaries - - - - - - - - - - - - - - Employee Benefits - - - - - - - - - - - - - - Supplies and Services 65,000 225,281 86,409 135,043 75,178 71,936 379,098 207,878 150,173 150,173 232,673 379,374 18,968 2,177,184 Capital Outlay - - - - - - - - - - - - - - Other Outgo - - - - - - - - - - - - - - Interfund Transfers Out - - - - - - - - - - - - - - Other Financing Uses - - - - - - - - - - - - - -
Total Disbursements 751,414 1,028,195 883,823 947,457 891,592 888,350 1,199,512 1,018,292 960,587 965,587 1,043,087 1,189,788 43,023 11,810,707 Asset TransactionsDeferred Apportionment 1,794,988 - - - - - - - - - - - - 1,794,988 Accounts Receivable (16,299) - - - - 315,176 116,981 - - - - - 116,981 532,839 Due From Other Funds 45,839 - - - - - - - - - - - - 45,839 Other - - - - - - - - - - - - - - SUBTOTAL ASSETS 1,824,528 - - - - 315,176 116,981 - - - - - 116,981 2,373,666 Accounts Payable 85,000 20,000 2,646 - - 35,471 - - - - - - - 143,117 Due To Other Funds - - - - - - - - - - - - - - Current Loan - - - - - - - - - - - - - - Other - - - - - - - - - - - - - - SUBTOTAL LIABILITIES 85,000 20,000 2,646 - - 35,471 - - - - - - - 143,117
Total PY Transactions 1,739,528 (20,000) (2,646) - - 279,705 116,981 - - - - - 116,981 2,230,549 Net Increase/Decrease 1,430,563 (626,746) 592,038 (32,080) (131,881) 1,373,063 (103,706) (235,568) 567,023 (162,506) (158,781) 206,810 360,043
FY TRAN Deposits - - - - - - - - - - - - - FY TRAN Repayments - - - - - - - - - - - - - CY TRAN Deposits - - - - - - - - - - - - - CY TRAN Repayments (945,233) - - - - - - - - - - - (945,233)
Ending Cash with TRAN 1,039,200 412,454 1,004,492 972,412 840,531 2,213,594 2,109,888 1,874,320 2,441,343 2,278,837 2,120,056 2,326,866 TRAN Balance - - - - - - - - - - - - Ending Cash without TRAN 1,039,200 412,454 1,004,492 972,412 840,531 2,213,594 2,109,888 1,874,320 2,441,343 2,278,837 2,120,056 2,326,866 Source: The District
031
C-32

CERTAIN BACKGROUND INFORMATIONAND PROJECTED CASH FLOWS FOR SERIES K DISTRICTS

Barstow Unified Barstow UnifiedSan Bernardino San Bernardino
Fiscal Year 2013-14 Fiscal Year 2014-15Jul 2013 Aug 2013 Sep 2013 Oct 2013 Nov 2013 Dec 2013 Jan 2014 Feb 2014 Mar 2014 Apr 2014 May 2014 Jun 2014 Accruals Total
Actual / Projected Actual Actual Actual Actual Actual Actual Projected Projected Projected Projected Projected Projected Projected 2013-14Beginning Cash 8,562,183 10,123,082 9,270,081 11,755,057 9,994,185 9,615,847 11,101,500 10,359,983 5,146,679 10,494,935 8,723,432 5,293,602 Receipts
LCFF/Revenue LimitApportionment 1,445,718 1,445,718 3,969,611 2,602,292 2,602,292 3,969,611 2,602,292 2,602,293 3,969,612 1,613,421 52,046 1,367,319 6,141,411 34,383,635 Property Taxes 152,232 - 74,766 - 426,577 240,612 401,595 240,042 75,409 833,325 532,865 65,678 - 3,043,101 Other - - - - - - (352,611) - - - - - - (352,611)
Federal Revenues - 5,750 666,593 (1,317,954) 27,799 743,186 498,511 262,643 507,575 246,282 438,116 51,752 - 2,130,253 Other State Revenues 1,112,335 44,344 670,511 (807,930) 798,938 96,850 171,072 (76,698) 24,772 170,597 - - - 2,204,791 Other Local Revenues 51,738 757,699 240,918 (164,388) 131,305 132,776 154,356 194,774 194,774 147,447 112,781 89,334 - 2,043,516 Interfund Transfers In - - - - - - - - - - - - - - Other Financing Sources - - - - - - - - - - - - - -
Total Receipts 2,762,023 2,253,511 5,622,400 312,020 3,986,911 5,183,035 3,475,216 3,223,054 4,772,141 3,011,072 1,135,807 1,574,083 6,141,411 43,452,685 Disbursements
Certificated Salaries - 183,802 1,842,862 1,822,537 1,836,800 1,896,802 1,732,069 2,165,087 2,035,182 2,014,830 1,994,681 2,039,614 - 19,564,266 Classified Salaries 311,902 649,576 643,268 670,673 668,335 695,862 681,944 797,875 781,918 774,098 766,357 34,967 - 7,476,776 Employee Benefits 75,365 301,391 801,040 808,349 796,465 811,373 521,585 704,139 706,252 699,189 697,091 1,319,478 - 8,241,717 Supplies and Services 420,571 996,639 731,361 805,611 603,277 498,584 971,334 1,217,268 1,668,735 1,294,459 1,107,507 1,009,365 - 11,324,712 Capital Outlay - - 17,746 - - - - 267,597 - - - - - 285,343 Other Outgo - 77,754 1,916 3,832 - 6,309 93,336 (77,754) 5,607 - - - - 111,000 Interfund Transfers Out 4,522 - (4,522) - - - - - - - - - - - Other Financing Uses - - - - - - - - - - - - - -
Total Disbursements 812,360 2,209,162 4,033,671 4,111,002 3,904,876 3,908,930 4,000,269 5,074,212 5,197,693 4,782,576 4,565,637 4,403,425 - 47,003,813 Asset TransactionsDeferred Apportionment 3,300,451 2,091,645 5,392,096 Accounts Receivable - 114,159 321,343 9,224,687 - 3,918 24,769 - - - - - - 9,688,875 Due From Other Funds 7,190 27,880 (29,097) 1,971 (17,096) 3,144 73,478 - - - - - - 67,470 Other - - - - - - - - - - - - - - SUBTOTAL ASSETS 3,307,641 2,233,684 292,246 9,226,658 (17,096) 7,062 98,246 - - - - - - 15,148,441 Accounts Payable 2,090,419 861,528 (608,523) 7,188,548 443,277 (204,486) 321,117 - - - - - - 10,091,880 Due To Other Funds - - - - - - - - - - - - - - Current Loan - 1,884 4,522 - - - (6,406) - - - - - - - Other - - - - - - - - - - - - - - SUBTOTAL LIABILITIES 2,090,419 863,413 (604,001) 7,188,548 443,277 (204,486) 314,710 - - - - - - 10,091,880
Total PY Transactions 1,217,222 1,370,271 896,247 2,038,110 (460,373) 211,548 (216,464) - - - - - - 5,056,561 Net Increase/Decrease 3,166,886 1,414,619 2,484,976 (1,760,872) (378,337) 1,485,653 (741,517) (1,851,158) (425,552) (1,771,504) (3,429,830) (2,829,341) 6,141,411
FY TRAN Deposits 3,337,014 - - - - - - - - - - - - 3,337,014 FY TRAN Repayments - - - - - - - (3,362,147) - - - - - (3,362,147) CY TRAN Deposits - - - - - - - - 5,773,809 - - - - 5,773,809 CY TRAN Repayments (4,943,000) (2,267,621) - - - - - - - - - - - (7,210,621)
Ending Cash with TRAN 10,123,082 9,270,081 11,755,057 9,994,185 9,615,847 11,101,500 10,359,983 5,146,679 10,494,935 8,723,432 5,293,602 2,464,260 TRAN Balance 5,553,148 3,337,014 3,337,014 3,337,014 3,337,014 3,337,014 3,337,014 - 5,773,809 5,773,809 5,773,809 5,773,809 Ending Cash without TRAN 4,569,935 5,933,067 8,418,043 6,657,171 6,278,834 7,764,487 7,022,969 5,146,679 4,721,127 2,949,623 (480,207) (3,309,548) Source: The District
Summary of Revenues, Expenditures & Changes in General Fund Balance Projected Alternate Cash Resources2010-11 2011-12 2012-13 2013-14 2014-15 Set-Aside 1 Maturity
(Audited) (Audited) (Audited) (Projected) (Projected) Fund Name Jul 31, 2014 Oct 01, 2014Beginning Fund Balance 12,804,071 13,830,804 11,479,210 8,401,648 8,379,736 11 - Adult Education (R) 67,612 67,612
13 - Cafeteria Special Revenue (R) 825,294 502,638 Total Revenues 48,097,631 44,060,592 45,171,598 46,938,878 44,809,520 14 - Deferred Maintenance (R) 111,150 111,150
20 - Special Reserve for Post Employment Benefits (U) 893,952 893,952 Total Expenditures 47,015,975 46,789,054 47,419,897 46,960,790 46,188,049 25 - Capital Facilities (R) 98,597 98,597
Other Sources & Uses (54,923) 376,868 39,689 - -
Ending Fund Balance 13,830,804 11,479,210 9,270,600 8,379,736 7,001,207 Source: District Annual Financial Statements & the District.
Total Other Restricted Funds (R) 1,102,653 779,997 Total Other Unrestricted Funds (U) 893,952 893,952 Grand Total 1,996,605 1,673,949
Excludes Bond Proceed, Bond Interest & Redemption and Debt Service Funds.Source: The District.
C-34 C-35

Barstow UnifiedSan Bernardino
Fiscal Year 2014-15Jul 2014 Aug 2014 Sep 2014 Oct 2014 Nov 2014 Dec 2014 Jan 2015 Feb 2015 Mar 2015 Apr 2015 May 2015 Jun 2015 Accruals Total
Actual / Projected Projected Projected Projected Projected Projected Projected Projected Projected Projected Projected Projected Projected Projected 2014-15Beginning Cash 2,464,260 3,822,792 4,565,767 5,052,319 4,453,531 3,209,147 5,067,214 3,842,507 2,706,695 3,289,859 3,226,722 2,711,534 Receipts
LCFF/Revenue LimitApportionment 1,581,403 1,581,403 4,213,845 2,846,526 2,846,526 4,213,845 2,846,526 2,846,526 4,213,845 2,846,526 2,846,526 4,213,845 - 37,097,339 Property Taxes 152,232 - 74,766 - 10,292 990,453 401,595 240,042 75,409 833,325 199,310 65,678 - 3,043,102 Other - - - - - - (427,611) - - - - - - (427,611)
Federal Revenues - 5,750 143,264 1,495 4,659 3,000 352,655 239,826 356,210 226,465 568,532 76,548 221,862 2,200,264 Other State Revenues - - - 298,932 200,330 - 176,725 - 24,772 176,250 - - - 877,009 Other Local Revenues 51,540 408,464 21,557 9,709 440 348,169 170,114 135,449 347,013 170,114 135,449 221,399 - 2,019,418 Interfund Transfers In - - - - - - - - - - - - - - Other Financing Sources - - - - - - - - - - - - - -
Total Receipts 1,785,175 1,995,617 4,453,432 3,156,662 3,062,246 5,555,467 3,520,004 3,461,842 5,017,249 4,252,680 3,749,816 4,577,469 221,862 44,809,520 Disbursements
Certificated Salaries - 183,802 1,812,685 1,894,256 1,875,314 1,969,079 2,057,688 2,016,534 2,077,030 2,056,260 2,035,697 1,986,525 - 19,964,871 Classified Salaries 311,902 649,576 736,799 722,063 714,842 711,268 782,395 766,747 743,744 728,869 714,292 10,169 - 7,592,666 Employee Benefits 75,365 301,391 801,040 808,349 796,465 801,951 826,010 817,750 820,203 812,001 809,565 961,549 - 8,631,638 Supplies and Services 420,571 996,639 731,361 805,611 914,614 991,601 1,083,222 996,070 863,635 718,686 705,450 659,862 - 9,887,322 Capital Outlay - - - - - - - 553 - - - - - 553 Other Outgo - - - 101,000 10,000 - - - - - - - - 111,000 Interfund Transfers Out - - - - - - - - - - - - - - Other Financing Uses - - - - - - - - - - - - - -
Total Disbursements 807,838 2,131,408 4,081,885 4,331,279 4,311,234 4,473,899 4,749,314 4,597,654 4,504,613 4,315,816 4,265,004 3,618,105 - 46,188,049 Asset TransactionsDeferred Apportionment 6,141,411 - - - - - - - - - - - - 6,141,411 Accounts Receivable 1,039,950 778,766 115,005 575,830 4,603 776,499 4,603 - 70,528 - - - - 3,365,783 Due From Other Funds - - - - - - - - - - - - - - Other - - - - - - - - - - - - - - SUBTOTAL ASSETS 7,181,360 778,766 115,005 575,830 4,603 776,499 4,603 - 70,528 - - - - 9,507,194 Accounts Payable 997,344 (100,000) - - - - - - - - - - - 897,344 Due To Other Funds - - - - - - - - - - - - - - Current Loan - - - - - - - - - - - - - - Other - - - - - - - - - - - - - - SUBTOTAL LIABILITIES 997,344 (100,000) - - - - - - - - - - - 897,344
Total PY Transactions 6,184,017 878,766 115,005 575,830 4,603 776,499 4,603 - 70,528 - - - - 8,609,850 Net Increase/Decrease 7,161,353 742,975 486,552 (598,787) (1,244,385) 1,858,067 (1,224,707) (1,135,812) 583,164 (63,137) (515,188) 959,364 221,862
FY TRAN Deposits - - - - - - - - - - - - - FY TRAN Repayments - - - - - - - - - - - - - CY TRAN Deposits - - - - - - - - - - - - - CY TRAN Repayments (5,802,821) - - - - - - - - - - - (5,802,821)
Ending Cash with TRAN 3,822,792 4,565,767 5,052,319 4,453,531 3,209,147 5,067,214 3,842,507 2,706,695 3,289,859 3,226,722 2,711,534 3,670,899 TRAN Balance - - - - - - - - - - - - Ending Cash without TRAN 3,822,792 4,565,767 5,052,319 4,453,531 3,209,147 5,067,214 3,842,507 2,706,695 3,289,859 3,226,722 2,711,534 3,670,899 Source: The District
034
C-35
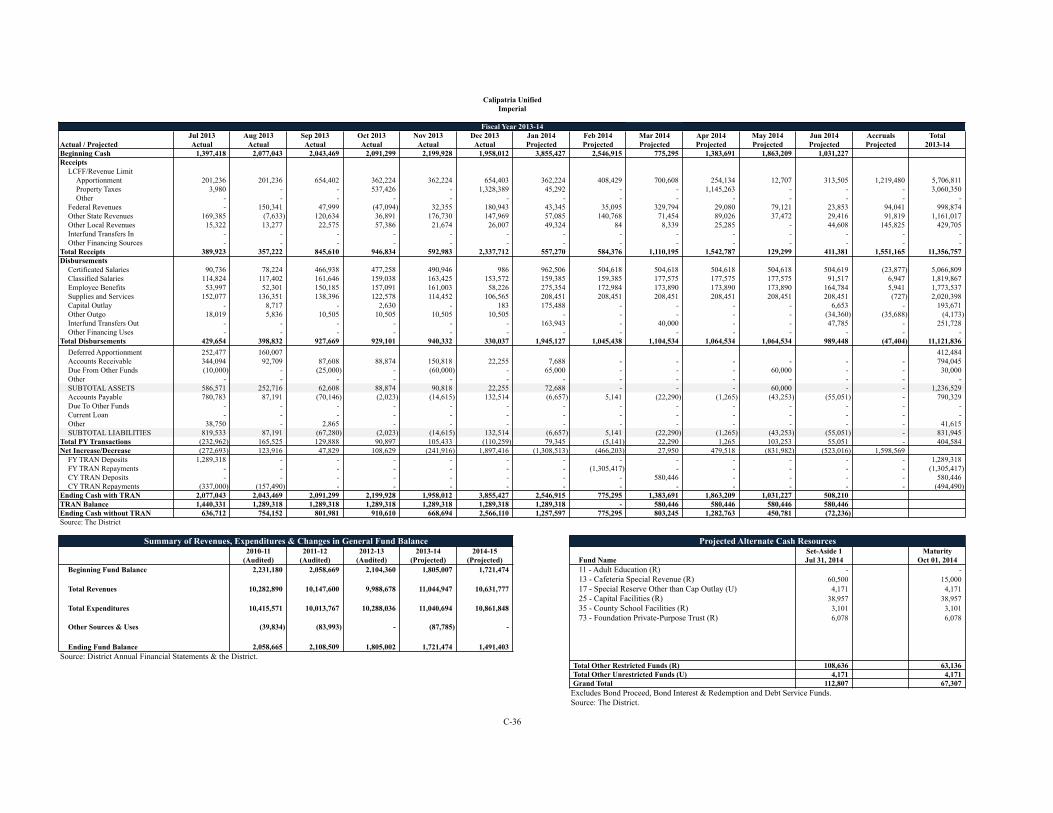
Calipatria Unified Calipatria UnifiedImperial Imperial
Fiscal Year 2013-14 Fiscal Year 2014-15Jul 2013 Aug 2013 Sep 2013 Oct 2013 Nov 2013 Dec 2013 Jan 2014 Feb 2014 Mar 2014 Apr 2014 May 2014 Jun 2014 Accruals Total
Actual / Projected Actual Actual Actual Actual Actual Actual Projected Projected Projected Projected Projected Projected Projected 2013-14Beginning Cash 1,397,418 2,077,043 2,043,469 2,091,299 2,199,928 1,958,012 3,855,427 2,546,915 775,295 1,383,691 1,863,209 1,031,227 Receipts
LCFF/Revenue LimitApportionment 201,236 201,236 654,402 362,224 362,224 654,403 362,224 408,429 700,608 254,134 12,707 313,505 1,219,480 5,706,811 Property Taxes 3,980 - - 537,426 - 1,328,389 45,292 - - 1,145,263 - - - 3,060,350 Other - - - - - - - - - - - - - -
Federal Revenues - 150,341 47,999 (47,094) 32,355 180,943 43,345 35,095 329,794 29,080 79,121 23,853 94,041 998,874 Other State Revenues 169,385 (7,633) 120,634 36,891 176,730 147,969 57,085 140,768 71,454 89,026 37,472 29,416 91,819 1,161,017 Other Local Revenues 15,322 13,277 22,575 57,386 21,674 26,007 49,324 84 8,339 25,285 - 44,608 145,825 429,705 Interfund Transfers In - - - - - - - - - - - - - - Other Financing Sources - - - - - - - - - - - - - -
Total Receipts 389,923 357,222 845,610 946,834 592,983 2,337,712 557,270 584,376 1,110,195 1,542,787 129,299 411,381 1,551,165 11,356,757 Disbursements
Certificated Salaries 90,736 78,224 466,938 477,258 490,946 986 962,506 504,618 504,618 504,618 504,618 504,619 (23,877) 5,066,809 Classified Salaries 114,824 117,402 161,646 159,038 163,425 153,572 159,385 159,385 177,575 177,575 177,575 91,517 6,947 1,819,867 Employee Benefits 53,997 52,301 150,185 157,091 161,003 58,226 275,354 172,984 173,890 173,890 173,890 164,784 5,941 1,773,537 Supplies and Services 152,077 136,351 138,396 122,578 114,452 106,565 208,451 208,451 208,451 208,451 208,451 208,451 (727) 2,020,398 Capital Outlay - 8,717 - 2,630 - 183 175,488 - - - - 6,653 - 193,671 Other Outgo 18,019 5,836 10,505 10,505 10,505 10,505 - - - - - (34,360) (35,688) (4,173) Interfund Transfers Out - - - - - - 163,943 - 40,000 - - 47,785 - 251,728 Other Financing Uses - - - - - - - - - - - - - -
Total Disbursements 429,654 398,832 927,669 929,101 940,332 330,037 1,945,127 1,045,438 1,104,534 1,064,534 1,064,534 989,448 (47,404) 11,121,836 Asset TransactionsDeferred Apportionment 252,477 160,007 412,484 Accounts Receivable 344,094 92,709 87,608 88,874 150,818 22,255 7,688 - - - - - - 794,045 Due From Other Funds (10,000) - (25,000) - (60,000) - 65,000 - - - 60,000 - - 30,000 Other - - - - - - - - - - - - - - SUBTOTAL ASSETS 586,571 252,716 62,608 88,874 90,818 22,255 72,688 - - - 60,000 - - 1,236,529 Accounts Payable 780,783 87,191 (70,146) (2,023) (14,615) 132,514 (6,657) 5,141 (22,290) (1,265) (43,253) (55,051) - 790,329 Due To Other Funds - - - - - - - - - - - - - - Current Loan - - - - - - - - - - - - - - Other 38,750 - 2,865 - - - - - - - - - - 41,615 SUBTOTAL LIABILITIES 819,533 87,191 (67,280) (2,023) (14,615) 132,514 (6,657) 5,141 (22,290) (1,265) (43,253) (55,051) - 831,945
Total PY Transactions (232,962) 165,525 129,888 90,897 105,433 (110,259) 79,345 (5,141) 22,290 1,265 103,253 55,051 - 404,584 Net Increase/Decrease (272,693) 123,916 47,829 108,629 (241,916) 1,897,416 (1,308,513) (466,203) 27,950 479,518 (831,982) (523,016) 1,598,569
FY TRAN Deposits 1,289,318 - - - - - - - - - - - - 1,289,318 FY TRAN Repayments - - - - - - - (1,305,417) - - - - - (1,305,417) CY TRAN Deposits - - - - - - - - 580,446 - - - - 580,446 CY TRAN Repayments (337,000) (157,490) - - - - - - - - - - - (494,490)
Ending Cash with TRAN 2,077,043 2,043,469 2,091,299 2,199,928 1,958,012 3,855,427 2,546,915 775,295 1,383,691 1,863,209 1,031,227 508,210 TRAN Balance 1,440,331 1,289,318 1,289,318 1,289,318 1,289,318 1,289,318 1,289,318 - 580,446 580,446 580,446 580,446 Ending Cash without TRAN 636,712 754,152 801,981 910,610 668,694 2,566,110 1,257,597 775,295 803,245 1,282,763 450,781 (72,236) Source: The District
Summary of Revenues, Expenditures & Changes in General Fund Balance Projected Alternate Cash Resources2010-11 2011-12 2012-13 2013-14 2014-15 Set-Aside 1 Maturity
(Audited) (Audited) (Audited) (Projected) (Projected) Fund Name Jul 31, 2014 Oct 01, 2014Beginning Fund Balance 2,231,180 2,058,669 2,104,360 1,805,007 1,721,474 11 - Adult Education (R) - -
13 - Cafeteria Special Revenue (R) 60,500 15,000 Total Revenues 10,282,890 10,147,600 9,988,678 11,044,947 10,631,777 17 - Special Reserve Other than Cap Outlay (U) 4,171 4,171
25 - Capital Facilities (R) 38,957 38,957 Total Expenditures 10,415,571 10,013,767 10,288,036 11,040,694 10,861,848 35 - County School Facilities (R) 3,101 3,101
73 - Foundation Private-Purpose Trust (R) 6,078 6,078 Other Sources & Uses (39,834) (83,993) - (87,785) -
Ending Fund Balance 2,058,665 2,108,509 1,805,002 1,721,474 1,491,403 Source: District Annual Financial Statements & the District.
Total Other Restricted Funds (R) 108,636 63,136 Total Other Unrestricted Funds (U) 4,171 4,171 Grand Total 112,807 67,307
Excludes Bond Proceed, Bond Interest & Redemption and Debt Service Funds.Source: The District.
C-36 C-37

Calipatria UnifiedImperial
Fiscal Year 2014-15Jul 2014 Aug 2014 Sep 2014 Oct 2014 Nov 2014 Dec 2014 Jan 2015 Feb 2015 Mar 2015 Apr 2015 May 2015 Jun 2015 Accruals Total
Actual / Projected Projected Projected Projected Projected Projected Projected Projected Projected Projected Projected Projected Projected Projected 2014-15Beginning Cash 508,210 244,590 394,835 452,438 596,172 298,103 2,123,602 1,041,513 531,518 539,145 1,149,716 607,784 Receipts
LCFF/Revenue LimitApportionment 224,803 224,803 730,971 404,645 404,645 730,971 404,645 404,645 730,971 404,645 404,645 730,971 - 5,801,357 Property Taxes 4,356 - - 546,246 - 1,343,399 - - - 1,163,930 - 148,105 (295,339) 2,910,697 Other - - - - - - - - - - - - - -
Federal Revenues - 138,079 44,130 (43,213) 29,726 145,051 1,009 56,791 305,425 26,698 72,663 42,479 98,719 917,558 Other State Revenues 83,749 (3,789) 59,641 18,254 87,366 58,894 44,085 69,571 35,302 44,027 18,541 17,106 41,272 574,019 Other Local Revenues 15,286 13,231 22,480 57,163 21,581 24,064 46,758 86 8,307 25,177 - 44,446 149,566 428,145 Interfund Transfers In - - - - - - - - - - - - - - Other Financing Sources - - - - - - - - - - - - - -
Total Receipts 328,194 372,324 857,222 983,095 543,317 2,302,380 496,497 531,093 1,080,005 1,664,478 495,849 983,106 (5,781) 10,631,777 Disbursements
Certificated Salaries 92,945 79,964 478,746 489,131 503,150 - 986,569 517,170 517,170 517,170 517,170 517,170 (24,405) 5,191,949 Classified Salaries 115,984 118,565 163,188 160,607 165,032 160,976 160,976 160,976 179,415 179,415 179,415 92,381 7,007 1,843,937 Employee Benefits 54,626 52,829 151,658 158,666 162,619 64,509 278,160 174,659 175,557 175,557 175,557 166,393 5,930 1,796,719 Supplies and Services 133,404 119,707 121,486 107,612 100,497 99,608 182,852 182,852 182,852 182,852 182,852 182,852 (711) 1,778,714 Capital Outlay - 812 - 245 - 16,326 - - - - - 619 - 18,002 Other Outgo 17,706 5,736 10,327 10,327 10,327 161,117 - - - - - (33,770) (35,075) 146,697 Interfund Transfers Out - - - - - - 46,717 - 39,112 - - - - 85,830 Other Financing Uses - - - - - - - - - - - - - -
Total Disbursements 414,664 377,613 925,406 926,588 941,627 502,536 1,655,274 1,035,656 1,094,106 1,054,994 1,054,994 925,645 (47,255) 10,861,848 Asset TransactionsDeferred Apportionment 1,219,480 - - - - - - - - - - - - 1,219,480 Accounts Receivable - 240,277 83,991 85,054 143,528 19,137 8,505 - - - - - - 580,492 Due From Other Funds (9,569) - (23,390) - (57,411) - 61,664 - - - 57,411 - - 28,706 Other - - - - - - - - - - - - - - SUBTOTAL ASSETS 1,209,911 240,277 60,601 85,054 86,117 19,137 70,169 - - - 57,411 - - 1,828,678 Accounts Payable 762,688 84,743 (68,446) (2,173) (14,124) (6,519) (6,519) 5,432 (21,729) (1,086) 40,199 - - 772,466 Due To Other Funds - - - - - - - - - - - - - - Current Loan - - - - - - - - - - - - - - Other 38,026 - 3,259 - - - - - - - - - - 41,285 SUBTOTAL LIABILITIES 800,714 84,743 (65,187) (2,173) (14,124) (6,519) (6,519) 5,432 (21,729) (1,086) 40,199 - - 813,751
Total PY Transactions 409,198 155,534 125,788 87,227 100,241 25,656 76,688 (5,432) 21,729 1,086 17,213 - - 1,014,927 Net Increase/Decrease 322,728 150,245 57,603 143,733 (298,069) 1,825,500 (1,082,089) (509,996) 7,628 610,571 (541,932) 57,461 41,473
FY TRAN Deposits - - - - - - - - - - - - - FY TRAN Repayments - - - - - - - - - - - - - CY TRAN Deposits - - - - - - - - - - - - - CY TRAN Repayments (586,348) - - - - - - - - - - - (586,348)
Ending Cash with TRAN 244,590 394,835 452,438 596,172 298,103 2,123,602 1,041,513 531,518 539,145 1,149,716 607,784 665,245 TRAN Balance - - - - - - - - - - - - Ending Cash without TRAN 244,590 394,835 452,438 596,172 298,103 2,123,602 1,041,513 531,518 539,145 1,149,716 607,784 665,245 Source: The District
036
C-37

Covina-Valley Unified Covina-Valley UnifiedLos Angeles Los Angeles
Fiscal Year 2013-14 Fiscal Year 2014-15Jul 2013 Aug 2013 Sep 2013 Oct 2013 Nov 2013 Dec 2013 Jan 2014 Feb 2014 Mar 2014 Apr 2014 May 2014 Jun 2014 Accruals Total
Actual / Projected Actual Actual Actual Actual Actual Actual Projected Projected Projected Projected Projected Projected Projected 2013-14Beginning Cash 26,796,773 38,859,138 53,586,350 48,484,556 46,317,839 30,102,071 33,469,922 33,874,640 22,927,973 34,854,931 29,534,558 23,863,614 Receipts
LCFF/Revenue LimitApportionment 4,877,090 6,909,598 8,456,770 3,770,583 (6,679,050) 8,850,463 5,769,438 4,105,779 7,185,421 2,922,810 1,054,965 4,072,346 13,146,991 64,443,205 Property Taxes 192,143 58,190 (33,690) - 404,218 4,031,690 3,025,541 523,328 886,648 1,546,069 2,172,525 104,390 (1,740,365) 11,170,686 Other - - - - - - - - - - - (2,100,000) - (2,100,000)
Federal Revenues 76,395 27,946 666,261 17,630 1,892,133 (991,968) 765,921 - 456,045 - 32,588 - 3,267,714 6,210,665 Other State Revenues 1,695,000 5,862,792 1,225,961 (301,437) (1,949,941) 666,543 1,466,067 - 1,509,895 749,126 1,516,662 - 4,583,571 17,024,240 Other Local Revenues 11,037 1,348 59,038 77,102 81,815 20,906 4,250 4,250 4,250 4,250 4,250 4,250 5,529,412 5,806,157 Interfund Transfers In - - - - - - - - - - - - 102,085 102,085 Other Financing Sources - - - - - - - - - - - - - -
Total Receipts 6,851,665 12,859,874 10,374,340 3,563,878 (6,250,825) 12,577,634 11,031,217 4,633,357 10,042,260 5,222,255 4,780,990 2,080,986 24,889,407 102,657,038 Disbursements
Certificated Salaries 146,847 482,721 4,511,110 4,685,705 4,788,009 4,648,231 4,709,918 4,622,422 4,714,481 4,726,589 4,636,807 9,512,555 161,255 52,346,650 Classified Salaries 805,113 1,084,875 1,459,946 1,450,615 1,553,068 1,462,464 1,649,001 1,630,823 1,640,975 1,536,023 1,563,120 1,609,080 (225,414) 17,219,689 Employee Benefits 167,460 245,622 993,560 1,825,664 1,892,218 1,968,005 2,177,159 2,031,250 2,147,474 1,914,165 2,204,039 3,685,621 (60,976) 21,191,261 Supplies and Services 315,444 785,727 1,076,741 1,436,395 1,368,234 937,877 2,026,912 1,147,080 1,537,666 2,039,325 1,906,671 4,962,260 (780,378) 18,759,954 Capital Outlay 2,699 265 - 68,839 - 135,502 140,549 817 30,386 30,386 79,303 549,505 - 1,038,252 Other Outgo 4,249 45,459 25,050 92,056 14,310 195,017 (77,040) 62,298 42,655 296,140 61,994 783,203 5,536,673 7,082,065 Interfund Transfers Out - 10,093 10,093 20,186 349,105 (137,314) - - - - - (480,672) 179,962 (48,546) Other Financing Uses - - - - - - - - - - - 96,230 - 96,230
Total Disbursements 1,441,813 2,654,761 8,076,501 9,579,461 9,964,943 9,209,783 10,626,499 9,494,691 10,113,637 10,542,628 10,451,934 20,717,782 4,811,124 117,685,555 Asset TransactionsDeferred Apportionment 14,509,787 9,195,507 23,705,294 Accounts Receivable 2,522,394 - 158,219 3,618,987 - - - - - - - - - 6,299,600 Due From Other Funds - - - - - - - - - - - - - - Other - - 6,930,627 - - - - - - - - - - 6,930,627 SUBTOTAL ASSETS 17,032,181 9,195,507 7,088,847 3,618,987 - - - - - - - - - 36,935,522 Accounts Payable 6,885,875 332,450 14,488,481 (229,879) - - - - - - - - - 21,476,927 Due To Other Funds - - - - - - - - - - - - - - Current Loan - - - - - - - - - - - - - - Other - - - - - - - - - - - - - - SUBTOTAL LIABILITIES 6,885,875 332,450 14,488,481 (229,879) - - - - - - - - - 21,476,927
Total PY Transactions 10,146,305 8,863,057 (7,399,634) 3,848,866 - - - - - - - - - 15,458,595 Net Increase/Decrease 15,556,158 19,068,170 (5,101,795) (2,166,717) (16,215,768) 3,367,851 404,718 (4,861,333) (71,377) (5,320,373) (5,670,944) (18,636,796) 20,078,284
FY TRAN Deposits 6,048,208 - - - - - - - - - - - - 6,048,208 FY TRAN Repayments - - - - - - - (6,085,333) - - - - - (6,085,333) CY TRAN Deposits - - - - - - - - 11,998,335 - - - - 11,998,335 CY TRAN Repayments (9,542,000) (4,340,958) - - - - - - - - - - - (13,882,958)
Ending Cash with TRAN 38,859,138 53,586,350 48,484,556 46,317,839 30,102,071 33,469,922 33,874,640 22,927,973 34,854,931 29,534,558 23,863,614 5,226,818 TRAN Balance 10,332,521 6,048,208 6,048,208 6,048,208 6,048,208 6,048,208 6,048,208 - 11,998,335 11,998,335 11,998,335 11,998,335 Ending Cash without TRAN 28,526,618 47,538,142 42,436,348 40,269,631 24,053,863 27,421,714 27,826,432 22,927,973 22,856,596 17,536,223 11,865,279 (6,771,517) Source: The District
Summary of Revenues, Expenditures & Changes in General Fund Balance Projected Alternate Cash Resources2010-11 2011-12 2012-13 2013-14 2014-15 Set-Aside 1 Maturity
(Audited) (Audited) (Audited) (Projected) (Projected) Fund Name Jul 31, 2014 Oct 01, 2014Beginning Fund Balance 20,657,628 22,958,832 26,681,101 23,100,347 19,804,226 11 - Adult Education (R) 500,000 500,000
12 - Child Development (R) 100,000 100,000 Total Revenues 113,607,423 120,261,892 116,329,411 114,287,349 114,447,784 13 - Cafeteria Special Revenue (R) 4,300,000 4,300,000
14 - Deferred Maintenance (R) 250,000 850,000 Total Expenditures 112,518,804 117,349,148 116,089,639 117,589,326 116,147,484 25 - Capital Facilities (R) 2,100,000 2,100,000
35 - County School Facilities (R) - - Other Sources & Uses 1,212,586 809,525 (2,602,007) 5,855 -
Ending Fund Balance 22,958,833 26,681,101 24,318,866 19,804,226 18,104,526 Source: District Annual Financial Statements & the District.
Total Other Restricted Funds (R) 7,250,000 7,850,000 Total Other Unrestricted Funds (U) - - Grand Total 7,250,000 7,850,000
Excludes Bond Proceed, Bond Interest & Redemption and Debt Service Funds.Source: The District.
C-38 C-39

Covina-Valley UnifiedLos Angeles
Fiscal Year 2014-15Jul 2014 Aug 2014 Sep 2014 Oct 2014 Nov 2014 Dec 2014 Jan 2015 Feb 2015 Mar 2015 Apr 2015 May 2015 Jun 2015 Accruals Total
Actual / Projected Projected Projected Projected Projected Projected Projected Projected Projected Projected Projected Projected Projected Projected 2014-15Beginning Cash 5,226,818 2,943,199 15,290,351 17,916,725 14,208,147 10,264,915 14,127,257 14,872,159 11,838,584 14,378,209 12,205,272 11,410,905 Receipts
LCFF/Revenue LimitApportionment 3,173,248 3,173,248 9,784,193 5,711,847 5,711,847 9,784,193 5,711,847 5,711,847 9,784,193 5,711,847 5,711,847 9,784,193 - 79,754,354 Property Taxes 192,143 58,190 (33,690) - 404,218 4,031,690 3,025,541 523,328 886,648 1,546,069 2,172,525 104,390 (1,740,365) 11,170,686 Other - - - - - - - - - - - (2,155,779) - (2,155,779)
Federal Revenues 76,395 27,946 666,261 17,630 1,892,133 (991,968) 765,921 - 456,045 - 32,588 - 3,267,714 6,210,665 Other State Revenues 227,866 4,734,889 698,201 757,727 (1,635,831) 559,172 1,229,903 - 1,266,671 628,452 1,272,348 - 3,845,219 13,584,616 Other Local Revenues 11,037 1,348 59,038 77,102 81,815 20,906 4,250 4,250 4,250 4,250 4,250 4,250 5,529,412 5,806,157 Interfund Transfers In - - - - - - - - - - - - 77,085 77,085 Other Financing Sources - - - - - - - - - - - - - -
Total Receipts 3,680,690 7,995,621 11,174,003 6,564,306 6,454,181 13,403,993 10,737,462 6,239,425 12,397,808 7,890,618 9,193,558 7,737,054 10,979,064 114,447,784 Disbursements
Certificated Salaries - 4,780,284 4,780,284 4,780,284 4,780,284 4,780,284 4,780,284 4,780,284 4,780,284 4,780,284 4,780,284 4,780,284 - 52,583,128 Classified Salaries 697,381 1,080,327 1,533,165 1,539,500 1,658,335 1,520,577 1,617,444 1,599,613 1,609,571 1,506,628 1,533,206 1,578,287 (221,100) 17,252,935 Employee Benefits 176,431 391,398 1,232,743 2,185,924 2,221,099 2,174,693 2,162,015 2,017,121 2,132,537 1,900,851 2,188,708 3,659,984 (60,551) 22,382,952 Supplies and Services 1,386,015 1,122,125 911,924 1,491,561 1,054,376 1,043,195 1,501,678 820,296 1,297,664 1,611,093 1,430,314 3,404,331 (785,748) 16,288,824 Capital Outlay - - - - - - - - - - - 1,038,252 - 1,038,252 Other Outgo - 16,751 89,513 275,614 683,319 22,903 (68,860) 55,684 38,126 264,699 55,412 700,051 4,948,852 7,082,065 Interfund Transfers Out - - - - - - - - - - - (15,590) (465,082) (480,672) Other Financing Uses - - - - - - - - - - - - - -
Total Disbursements 2,259,826 7,390,886 8,547,630 10,272,883 10,397,413 9,541,652 9,992,560 9,273,000 9,858,183 10,063,555 9,987,926 15,145,600 3,416,370 116,147,484 Asset TransactionsDeferred Apportionment 13,146,991 - - - - - - - - - - - - 13,146,991 Accounts Receivable - 11,742,417 - - - - - - - - - - - 11,742,417 Due From Other Funds - - - - - - - - - - - - - - Other - - - - - - - - - - - - - - SUBTOTAL ASSETS 13,146,991 11,742,417 - - - - - - - - - - - 24,889,407 Accounts Payable 4,811,124 - - - - - - - - - - - - 4,811,124 Due To Other Funds - - - - - - - - - - - - - - Current Loan - - - - - - - - - - - - - - Other - - - - - - - - - - - - - - SUBTOTAL LIABILITIES 4,811,124 - - - - - - - - - - - - 4,811,124
Total PY Transactions 8,335,867 11,742,417 - - - - - - - - - - - 20,078,284 Net Increase/Decrease 9,756,730 12,347,152 2,626,373 (3,708,578) (3,943,232) 3,862,341 744,902 (3,033,574) 2,539,625 (2,172,937) (794,368) (7,408,546) 7,562,694
FY TRAN Deposits - - - - - - - - - - - - - FY TRAN Repayments - - - - - - - - - - - - - CY TRAN Deposits - - - - - - - - - - - - - CY TRAN Repayments (12,040,348) - - - - - - - - - - - (12,040,348)
Ending Cash with TRAN 2,943,199 15,290,351 17,916,725 14,208,147 10,264,915 14,127,257 14,872,159 11,838,584 14,378,209 12,205,272 11,410,905 4,002,359 TRAN Balance - - - - - - - - - - - - Ending Cash without TRAN 2,943,199 15,290,351 17,916,725 14,208,147 10,264,915 14,127,257 14,872,159 11,838,584 14,378,209 12,205,272 11,410,905 4,002,359 Source: The District
038
C-39

Delano Union Elementary Delano Union ElementaryKern Kern
Fiscal Year 2013-14 Fiscal Year 2014-15Jul 2013 Aug 2013 Sep 2013 Oct 2013 Nov 2013 Dec 2013 Jan 2014 Feb 2014 Mar 2014 Apr 2014 May 2014 Jun 2014 Accruals Total
Actual / Projected Actual Actual Actual Actual Actual Actual Projected Projected Projected Projected Projected Projected Projected 2013-14Beginning Cash 3,704,190 8,623,392 8,689,629 10,673,113 7,050,529 7,075,024 9,217,569 9,523,622 2,103,361 5,884,618 4,796,302 808,125 Receipts
LCFF/Revenue LimitApportionment 1,564,817 1,564,817 4,037,080 2,816,671 2,816,671 4,037,080 2,816,671 2,816,670 4,037,079 1,746,336 84,500 1,220,409 8,462,281 38,021,082 Property Taxes 36,923 26,350 159,500 186,790 40,112 1,472,535 (52,650) 328,796 52,053 845,504 (185,727) 229,996 - 3,140,182 Other (3,703) (7,241) (25,177) (14,785) (14,785) (14,785) (3,021) (176,356) (244,743) (114,065) (13,849) (151,230) - (783,740)
Federal Revenues 10,136 18,933 922,944 34,840 213,727 1,407,709 1,776,056 41,586 1,160,729 830,669 59,694 781,947 - 7,258,970 Other State Revenues 52,156 1,787,018 (239,275) 12,869 696,955 130,000 157,737 698,584 215,567 469,049 156,118 59,123 - 4,195,901 Other Local Revenues 46,794 316,811 547,406 331,596 7,048 452,742 538,858 478,244 422,228 146,593 651,130 1,361,418 - 5,300,868 Interfund Transfers In - - - - - - - - - - - 737,124 - 737,124 Other Financing Sources - - - - - - - - - - - - - -
Total Receipts 1,707,123 3,706,688 5,402,479 3,367,980 3,759,729 7,485,281 5,233,650 4,187,524 5,642,913 3,924,086 751,867 4,238,787 8,462,281 57,870,388 Disbursements
Certificated Salaries 1,979,629 2,075,835 2,233,870 2,107,588 2,112,222 2,143,021 2,047,699 1,990,111 2,070,666 2,066,060 2,096,831 2,141,497 - 25,065,029 Classified Salaries 624,040 703,563 720,649 740,412 715,782 740,276 698,988 702,442 739,612 738,961 736,520 873,550 - 8,734,796 Employee Benefits 1,029,227 1,026,919 1,030,135 962,600 1,518,138 988,801 1,101,219 1,101,199 1,198,915 1,109,785 1,111,991 873,634 - 13,052,564 Supplies and Services 582,111 539,108 618,884 1,230,339 535,086 1,164,929 882,890 715,450 864,163 900,794 597,901 2,757,568 - 11,389,221 Capital Outlay 272,823 95,070 56,542 79,405 499,693 - - - - - - 14,562 - 1,018,094 Other Outgo 56,887 - 120,700 335,832 120,700 422,526 - - - - - (510,112) - 546,533 Interfund Transfers Out - - - - - - - - - - - 552,124 - 552,124 Other Financing Uses - - - - - - - - - - - - - -
Total Disbursements 4,544,717 4,440,496 4,780,780 5,456,176 5,501,621 5,459,553 4,730,796 4,509,202 4,873,356 4,815,601 4,543,242 6,702,823 - 60,358,362 Asset TransactionsDeferred Apportionment 2,379,709 1,508,129 3,887,838 Accounts Receivable 3,385,882 1,089,665 1,647,713 2,325,072 2,142,897 76,370 (121,258) (121,258) (121,258) (121,258) (121,258) (121,256) - 9,940,053 Due From Other Funds - - - - - - - - - - - - - - Other - - - - - - - - - - - - - - SUBTOTAL ASSETS 5,765,591 2,597,794 1,647,713 2,325,072 2,142,897 76,370 (121,258) (121,258) (121,258) (121,258) (121,258) (121,256) - 13,827,891 Accounts Payable 1,394,037 208,246 285,929 3,888,698 376,510 (40,448) 75,543 75,543 75,543 75,543 75,543 75,543 - 6,566,230 Due To Other Funds - - - - - - - - - - - (2,000,000) - (2,000,000) Current Loan - - - (29,238) - - - - - - - - - (29,238) Other - - - - - - - - - - - - - - SUBTOTAL LIABILITIES 1,394,037 208,246 285,929 3,859,461 376,510 (40,448) 75,543 75,543 75,543 75,543 75,543 (1,924,457) - 4,536,993
Total PY Transactions 4,371,554 2,389,549 1,361,785 (1,534,389) 1,766,387 116,817 (196,801) (196,801) (196,801) (196,801) (196,801) 1,803,201 - 9,290,898 Net Increase/Decrease 1,533,959 1,655,741 1,983,484 (3,622,584) 24,495 2,142,546 306,053 (518,479) 572,755 (1,088,316) (3,988,176) (660,834) 8,462,281
FY TRAN Deposits 6,860,243 - - - - - - - - - - - - 6,860,243 FY TRAN Repayments - - - - - - - (6,901,782) - - - - - (6,901,782) CY TRAN Deposits - - - - - - - - 3,208,501 - - - - 3,208,501 CY TRAN Repayments (3,475,000) (1,589,504) - - - - - - - - - - - (5,064,504)
Ending Cash with TRAN 8,623,392 8,689,629 10,673,113 7,050,529 7,075,024 9,217,569 9,523,622 2,103,361 5,884,618 4,796,302 808,125 147,291 TRAN Balance 8,420,498 6,860,243 6,860,243 6,860,243 6,860,243 6,860,243 6,860,243 - 3,208,501 3,208,501 3,208,501 3,208,501 Ending Cash without TRAN 202,894 1,829,386 3,812,870 190,286 214,781 2,357,326 2,663,379 2,103,361 2,676,117 1,587,801 (2,400,376) (3,061,210) Source: The District
Summary of Revenues, Expenditures & Changes in General Fund Balance Projected Alternate Cash Resources2010-11 2011-12 2012-13 2013-14 2014-15 Set-Aside 1 Maturity
(Audited) (Audited) (Audited) (Projected) (Projected) Fund Name Jul 31, 2014 Oct 01, 2014Beginning Fund Balance 16,439,785 15,733,522 22,801,903 5,955,099 3,787,305 09 - Charter Schools Special Revenue (R) 1,911,970 5,108,987
12 - Child Development (R) 166,976 33,888 Total Revenues 61,804,189 54,323,361 51,061,069 57,133,263 61,354,811 13 - Cafeteria Special Revenue (R) 468,693 630,760
14 - Deferred Maintenance (R) - - Total Expenditures 61,722,915 69,241,956 64,180,311 59,486,057 56,398,439 15 - Pupil Transportation Equipment (R) 390,052 390,052
20 - Special Reserve for Post Employment Benefits (R) 1,305,794 3,305,794 Other Sources & Uses (787,537) 21,986,976 1,533,917 185,000 - 25 - Capital Facilities (R) 291,172 272,050
35 - County School Facilities (R) 909,379 909,379 Ending Fund Balance 15,733,522 22,801,903 11,216,578 3,787,305 8,743,678 40 - Special Reserve for Cap Outlay (U) 885,107 885,107
Source: District Annual Financial Statements & the District. 67 - Self-Insurance (R) 1,907,320 1,721,356 Total Other Restricted Funds (R) 7,351,356 12,372,266 Total Other Unrestricted Funds (U) 885,107 885,107 Grand Total 8,236,463 13,257,373
Excludes Bond Proceed, Bond Interest & Redemption and Debt Service Funds.Source: The District.
C-40 C-41

Delano Union ElementaryKern
Fiscal Year 2014-15Jul 2014 Aug 2014 Sep 2014 Oct 2014 Nov 2014 Dec 2014 Jan 2015 Feb 2015 Mar 2015 Apr 2015 May 2015 Jun 2015 Accruals Total
Actual / Projected Projected Projected Projected Projected Projected Projected Projected Projected Projected Projected Projected Projected Projected 2014-15Beginning Cash 147,291 3,888,626 2,715,261 4,963,035 1,863,004 2,080,074 3,535,616 3,294,794 3,228,564 4,479,905 3,968,226 3,743,049 Receipts
LCFF/Revenue LimitApportionment 1,789,603 1,789,603 4,616,602 3,221,286 3,221,286 4,616,602 3,221,286 3,221,286 4,616,602 3,221,286 3,221,286 4,616,602 - 41,373,331 Property Taxes 39,541 30,754 175,739 202,100 118,624 1,269,714 (57,115) 355,871 57,115 918,236 (202,100) 505,249 - 3,413,728 Other (4,393) (8,787) (26,361) (17,574) (96,656) (96,656) (4,393) (193,313) (268,002) (123,017) (13,180) - - (852,334)
Federal Revenues 8,803 16,349 799,219 30,183 79,859 320,065 1,538,701 35,842 1,005,469 719,360 918,064 816,197 - 6,288,111 Other State Revenues 30,706 1,054,642 (141,147) 7,676 107,718 178,539 93,108 412,298 127,280 276,847 92,117 236,731 - 2,476,514 Other Local Revenues 47,130 320,271 553,244 335,267 584,307 394,180 544,675 483,084 426,849 148,353 144,068 1,375,344 - 5,356,771 Interfund Transfers In - - - - - - - - - - - 737,296 - 737,296 Other Financing Sources - - - - - - - - - - - - - -
Total Receipts 1,911,390 3,202,832 5,977,295 3,778,938 4,015,137 6,682,442 5,336,261 4,315,069 5,965,313 5,161,064 4,160,256 8,287,419 - 58,793,417 Disbursements
Certificated Salaries 1,988,063 2,083,450 2,241,592 2,116,083 2,028,226 2,030,737 2,050,818 1,993,084 2,073,410 2,068,389 2,101,022 2,326,938 - 25,101,812 Classified Salaries 621,840 702,303 718,921 739,036 738,162 730,290 699,679 703,178 740,786 739,911 737,287 874,599 - 8,745,993 Employee Benefits 943,842 941,450 945,038 882,833 1,014,421 1,015,617 1,009,636 1,009,636 1,099,355 1,016,814 1,019,206 1,065,860 - 11,963,708 Supplies and Services 487,676 451,410 519,169 1,031,658 600,290 874,190 739,626 599,335 724,356 754,895 449,501 2,311,449 - 9,543,556 Capital Outlay - - - - - - - - - - - - - - Other Outgo 56,894 - 120,674 335,845 2,678 2,678 3,935 2,678 2,678 9,346 5,028 4,154 - 546,588 Interfund Transfers Out - - - - 62,098 62,098 62,098 62,098 62,098 62,098 62,098 62,098 - 496,782 Other Financing Uses - - - - - - - - - - - - - -
Total Disbursements 4,098,316 4,178,613 4,545,395 5,105,455 4,445,875 4,715,610 4,565,792 4,370,009 4,702,682 4,651,453 4,374,142 6,645,098 - 56,398,439 Asset TransactionsDeferred Apportionment 8,462,281 - - - - - - - - - - - - 8,462,281 Accounts Receivable - - 1,581,200 2,333,803 1,497,814 - - - - - - - - 5,412,817 Due From Other Funds - - - - - - - - - - - - - - Other - - - - - - - - - - - - - - SUBTOTAL ASSETS 8,462,281 - 1,581,200 2,333,803 1,497,814 - - - - - - - - 13,875,098 Accounts Payable 1,304,053 197,584 265,327 3,635,543 350,006 11,291 11,291 11,291 11,291 11,291 11,291 11,291 - 5,831,546 Due To Other Funds - - 500,000 500,000 500,000 500,000 - - - - - - - 2,000,000 Current Loan - - - (28,226) - - - - - - - - - (28,226) Other - - - - - - - - - - - - - - SUBTOTAL LIABILITIES 1,304,053 197,584 765,327 4,107,317 850,006 511,291 11,291 11,291 11,291 11,291 11,291 11,291 - 7,803,320
Total PY Transactions 7,158,228 (197,584) 815,873 (1,773,514) 647,808 (511,291) (11,291) (11,291) (11,291) (11,291) (11,291) (11,291) - 6,071,778 Net Increase/Decrease 4,971,302 (1,173,365) 2,247,774 (3,100,031) 217,071 1,455,542 759,178 (66,230) 1,251,341 498,321 (225,177) 1,631,030 -
FY TRAN Deposits 2,000,000 - - - - - - - - - - - 2,000,000 FY TRAN Repayments - - - - - - (1,000,000) - - (1,010,000) - - (2,010,000) CY TRAN Deposits - - - - - - - - - - - - - CY TRAN Repayments (3,229,968) - - - - - - - - - - - (3,229,968)
Ending Cash with TRAN 3,888,626 2,715,261 4,963,035 1,863,004 2,080,074 3,535,616 3,294,794 3,228,564 4,479,905 3,968,226 3,743,049 5,374,080 TRAN Balance 2,000,000 2,000,000 2,000,000 2,000,000 2,000,000 2,000,000 1,000,000 1,000,000 1,000,000 - - - Ending Cash without TRAN 1,888,626 715,261 2,963,035 (136,996) 80,074 1,535,616 2,294,794 2,228,564 3,479,905 3,968,226 3,743,049 5,374,080 Source: The District
040
C-41

Farmersville Unified Farmersville UnifiedTulare Tulare
Fiscal Year 2013-14 Fiscal Year 2014-15Jul 2013 Aug 2013 Sep 2013 Oct 2013 Nov 2013 Dec 2013 Jan 2014 Feb 2014 Mar 2014 Apr 2014 May 2014 Jun 2014 Accruals Total
Actual / Projected Actual Actual Actual Actual Actual Actual Projected Projected Projected Projected Projected Projected Projected 2013-14Beginning Cash 4,638,285 4,611,970 3,718,773 4,184,849 3,685,169 3,746,426 3,720,665 3,954,776 2,961,696 5,047,421 3,910,510 2,289,760 Receipts
LCFF/Revenue LimitApportionment 881,073 689,103 1,900,527 1,280,934 1,280,934 1,900,527 1,280,934 1,280,934 1,900,527 794,179 25,619 619,593 3,023,004 16,857,888 Property Taxes - - - - - 279,497 123,375 - - 99,771 155,947 121,162 - 779,752 Other - - - - - - - - - - - - - -
Federal Revenues - - 256,544 30,588 224,143 560,377 406,565 77,639 131,206 203,831 352,208 110,994 250,277 2,604,372 Other State Revenues 588,483 23,176 264,600 159,408 548,295 140,868 83,211 5,968 114,000 104,956 5,968 116,000 184,617 2,339,549 Other Local Revenues 49,361 226,865 67,601 66,368 89,062 122,722 167,427 11,866 57,818 28,106 45,094 14,238 243,609 1,190,136 Interfund Transfers In - - - - - - - - - - - - - - Other Financing Sources - - - - - - - - - - - 2,180 - 2,180
Total Receipts 1,518,917 939,144 2,489,272 1,537,299 2,142,433 3,003,991 2,061,512 1,376,407 2,203,551 1,230,843 584,835 984,167 3,701,507 23,773,877 Disbursements
Certificated Salaries 823,589 900,440 882,445 891,489 911,159 888,149 877,387 898,642 1,178,875 932,271 930,231 966,476 - 11,081,152 Classified Salaries 138,903 241,582 276,659 264,210 301,120 266,498 258,599 263,923 272,937 254,895 263,343 277,692 - 3,080,360 Employee Benefits 334,097 411,357 424,047 419,612 429,933 420,503 430,984 418,077 470,950 466,134 438,247 516,127 - 5,180,068 Supplies and Services 377,004 352,472 457,474 284,084 464,175 226,197 232,420 616,482 300,144 699,535 595,052 330,664 - 4,935,703 Capital Outlay - - - - 9,848 - - - - - - - - 9,848 Other Outgo 153,922 - 9,586 - - - 45,167 211,813 - - - 68,992 155,254 644,734 Interfund Transfers Out - - - - - 1,384,310 - - - - - - - 1,384,310 Other Financing Uses - - - - - - - - - - - - - -
Total Disbursements 1,827,515 1,905,852 2,050,211 1,859,396 2,116,235 3,185,657 1,844,556 2,408,937 2,222,906 2,352,834 2,226,873 2,159,951 155,254 26,316,176 Asset TransactionsDeferred Apportionment 2,295,092 938,788 3,233,880 Accounts Receivable - (2,520) (111) 26 459 211 - 20 (153) 10 10 1,072 (10) (987) Due From Other Funds - - - (150,000) - 150,000 70,293 - - - - - - 70,293 Other 5,975 - - - - - - - - - - (5,975) - - SUBTOTAL ASSETS 2,301,067 936,268 (111) (149,974) 459 150,211 70,293 20 (153) 10 10 (4,903) (10) 3,303,186 Accounts Payable 117,783 (23,996) (27,127) 27,609 (34,600) (5,694) 53,138 (39,429) (18,827) 14,929 (21,278) (35,927) 18,318 24,900 Due To Other Funds - - - - - - - - - - - - - - Current Loan - - - - - - - - - - - - - - Other - - - - - - - - - - - - - - SUBTOTAL LIABILITIES 117,783 (23,996) (27,127) 27,609 (34,600) (5,694) 53,138 (39,429) (18,827) 14,929 (21,278) (35,927) 18,318 24,900
Total PY Transactions 2,183,283 960,264 27,015 (177,583) 35,059 155,905 17,155 39,449 18,674 (14,919) 21,288 31,024 (18,328) 3,278,286 Net Increase/Decrease 1,874,685 (6,444) 466,076 (499,680) 61,257 (25,761) 234,111 (993,080) (681) (1,136,911) (1,620,750) (1,144,760) 3,527,925
FY TRAN Deposits - - - - - - - - - - - - - - FY TRAN Repayments - - - - - - - - - - - - - - CY TRAN Deposits - - - - - - - - 2,086,406 - - - - 2,086,406 CY TRAN Repayments (1,901,000) (886,754) - - - - - - - - - - - (2,787,754)
Ending Cash with TRAN 4,611,970 3,718,773 4,184,849 3,685,169 3,746,426 3,720,665 3,954,776 2,961,696 5,047,421 3,910,510 2,289,760 1,145,001 TRAN Balance 865,833 - - - - - - - 2,086,406 2,086,406 2,086,406 2,086,406 Ending Cash without TRAN 3,746,138 3,718,773 4,184,849 3,685,169 3,746,426 3,720,665 3,954,776 2,961,696 2,961,015 1,824,104 203,354 (941,406) Source: The District
Summary of Revenues, Expenditures & Changes in General Fund Balance Projected Alternate Cash Resources2010-11 2011-12 2012-13 2013-14 2014-15 Set-Aside 1 Maturity
(Audited) (Audited) (Audited) (Projected) (Projected) Fund Name Jul 31, 2014 Oct 01, 2014Beginning Fund Balance 5,545,471 6,604,898 7,097,009 6,428,265 5,659,267 13 - Cafeteria Special Revenue (R) 353,220 57,699
14 - Deferred Maintenance (R) 10,508 8,508 Total Revenues 24,320,503 23,498,231 22,394,262 23,198,772 28,450,749 25 - Capital Facilities (R) 33,846 38,846
35 - County School Facilities (R) 852,883 800,883 Total Expenditures 23,261,076 22,750,356 22,812,395 23,967,770 25,718,746
Other Sources & Uses - (255,764) (262,843) - -
Ending Fund Balance 6,604,898 7,097,009 6,416,033 5,659,267 8,391,269 Source: District Annual Financial Statements & the District.
Total Other Restricted Funds (R) 1,250,457 905,936 Total Other Unrestricted Funds (U) - - Grand Total 1,250,457 905,936
Excludes Bond Proceed, Bond Interest & Redemption and Debt Service Funds.Source: The District.
C-42 C-43
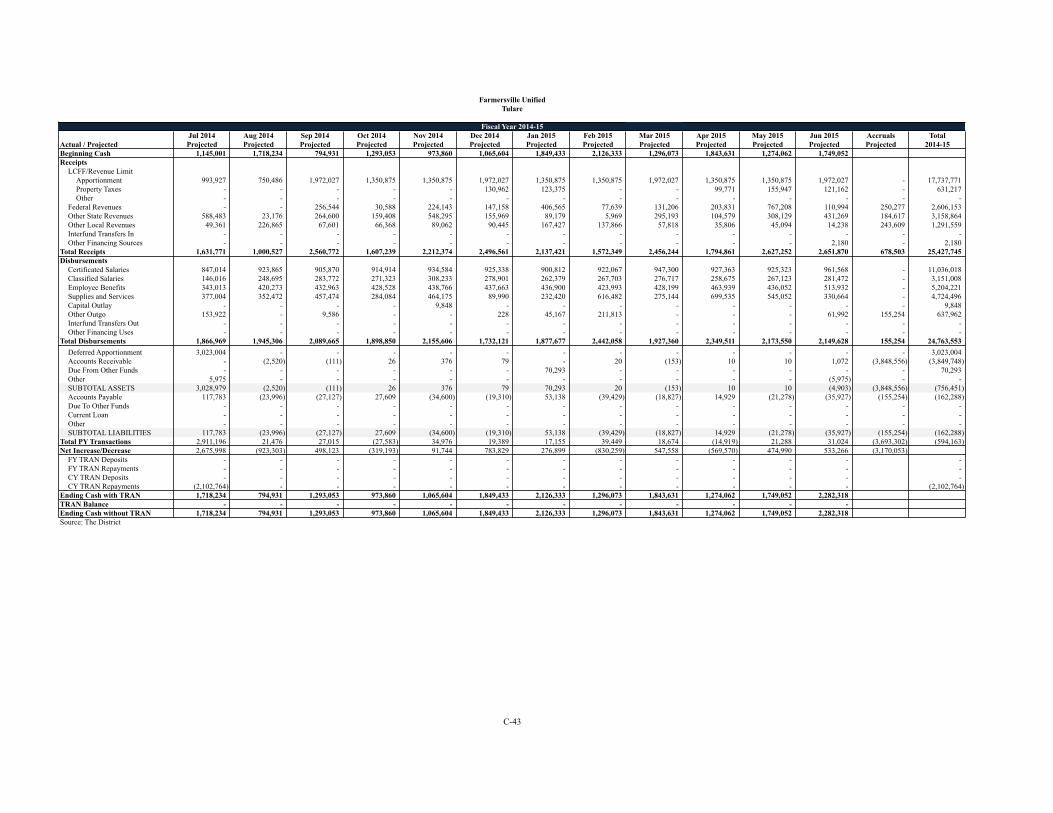
Farmersville UnifiedTulare
Fiscal Year 2014-15Jul 2014 Aug 2014 Sep 2014 Oct 2014 Nov 2014 Dec 2014 Jan 2015 Feb 2015 Mar 2015 Apr 2015 May 2015 Jun 2015 Accruals Total
Actual / Projected Projected Projected Projected Projected Projected Projected Projected Projected Projected Projected Projected Projected Projected 2014-15Beginning Cash 1,145,001 1,718,234 794,931 1,293,053 973,860 1,065,604 1,849,433 2,126,333 1,296,073 1,843,631 1,274,062 1,749,052 Receipts
LCFF/Revenue LimitApportionment 993,927 750,486 1,972,027 1,350,875 1,350,875 1,972,027 1,350,875 1,350,875 1,972,027 1,350,875 1,350,875 1,972,027 - 17,737,771 Property Taxes - - - - - 130,962 123,375 - - 99,771 155,947 121,162 - 631,217 Other - - - - - - - - - - - - - -
Federal Revenues - - 256,544 30,588 224,143 147,158 406,565 77,639 131,206 203,831 767,208 110,994 250,277 2,606,153 Other State Revenues 588,483 23,176 264,600 159,408 548,295 155,969 89,179 5,969 295,193 104,579 308,129 431,269 184,617 3,158,864 Other Local Revenues 49,361 226,865 67,601 66,368 89,062 90,445 167,427 137,866 57,818 35,806 45,094 14,238 243,609 1,291,559 Interfund Transfers In - - - - - - - - - - - - - - Other Financing Sources - - - - - - - - - - - 2,180 - 2,180
Total Receipts 1,631,771 1,000,527 2,560,772 1,607,239 2,212,374 2,496,561 2,137,421 1,572,349 2,456,244 1,794,861 2,627,252 2,651,870 678,503 25,427,745 Disbursements
Certificated Salaries 847,014 923,865 905,870 914,914 934,584 925,338 900,812 922,067 947,300 927,363 925,323 961,568 - 11,036,018 Classified Salaries 146,016 248,695 283,772 271,323 308,233 278,901 262,379 267,703 276,717 258,675 267,123 281,472 - 3,151,008 Employee Benefits 343,013 420,273 432,963 428,528 438,766 437,663 436,900 423,993 428,199 463,939 436,052 513,932 - 5,204,221 Supplies and Services 377,004 352,472 457,474 284,084 464,175 89,990 232,420 616,482 275,144 699,535 545,052 330,664 - 4,724,496 Capital Outlay - - - - 9,848 - - - - - - - - 9,848 Other Outgo 153,922 - 9,586 - - 228 45,167 211,813 - - - 61,992 155,254 637,962 Interfund Transfers Out - - - - - - - - - - - - - - Other Financing Uses - - - - - - - - - - - - - -
Total Disbursements 1,866,969 1,945,306 2,089,665 1,898,850 2,155,606 1,732,121 1,877,677 2,442,058 1,927,360 2,349,511 2,173,550 2,149,628 155,254 24,763,553 Asset TransactionsDeferred Apportionment 3,023,004 - - - - - - - - - - - - 3,023,004 Accounts Receivable - (2,520) (111) 26 376 79 - 20 (153) 10 10 1,072 (3,848,556) (3,849,748) Due From Other Funds - - - - - - 70,293 - - - - - - 70,293 Other 5,975 - - - - - - - - - - (5,975) - - SUBTOTAL ASSETS 3,028,979 (2,520) (111) 26 376 79 70,293 20 (153) 10 10 (4,903) (3,848,556) (756,451) Accounts Payable 117,783 (23,996) (27,127) 27,609 (34,600) (19,310) 53,138 (39,429) (18,827) 14,929 (21,278) (35,927) (155,254) (162,288) Due To Other Funds - - - - - - - - - - - - - - Current Loan - - - - - - - - - - - - - - Other - - - - - - - - - - - - - - SUBTOTAL LIABILITIES 117,783 (23,996) (27,127) 27,609 (34,600) (19,310) 53,138 (39,429) (18,827) 14,929 (21,278) (35,927) (155,254) (162,288)
Total PY Transactions 2,911,196 21,476 27,015 (27,583) 34,976 19,389 17,155 39,449 18,674 (14,919) 21,288 31,024 (3,693,302) (594,163) Net Increase/Decrease 2,675,998 (923,303) 498,123 (319,193) 91,744 783,829 276,899 (830,259) 547,558 (569,570) 474,990 533,266 (3,170,053)
FY TRAN Deposits - - - - - - - - - - - - - FY TRAN Repayments - - - - - - - - - - - - - CY TRAN Deposits - - - - - - - - - - - - - CY TRAN Repayments (2,102,764) - - - - - - - - - - - (2,102,764)
Ending Cash with TRAN 1,718,234 794,931 1,293,053 973,860 1,065,604 1,849,433 2,126,333 1,296,073 1,843,631 1,274,062 1,749,052 2,282,318 TRAN Balance - - - - - - - - - - - - Ending Cash without TRAN 1,718,234 794,931 1,293,053 973,860 1,065,604 1,849,433 2,126,333 1,296,073 1,843,631 1,274,062 1,749,052 2,282,318 Source: The District
042
C-43

Fillmore Unified Fillmore UnifiedVentura Ventura
Fiscal Year 2013-14 Fiscal Year 2014-15Jul 2013 Aug 2013 Sep 2013 Oct 2013 Nov 2013 Dec 2013 Jan 2014 Feb 2014 Mar 2014 Apr 2014 May 2014 Jun 2014 Accruals Total
Actual / Projected Actual Actual Actual Actual Actual Actual Projected Projected Projected Projected Projected Projected Projected 2013-14Beginning Cash 4,343,806 2,931,588 1,328,603 2,495,068 2,019,521 1,986,627 4,578,599 4,229,114 3,285,877 7,352,599 5,685,434 3,014,041 Receipts
LCFF/Revenue LimitApportionment 823,340 823,340 2,346,794 1,482,011 1,482,011 2,346,794 1,482,011 1,482,011 2,346,794 922,140 46,107 942,177 3,997,086 20,522,616 Property Taxes 21,727 16,106 - 11,967 179,630 1,899,305 500,000 - 40,060 100,695 100,000 420,370 - 3,289,861 Other - - - - - - - - - - - 308 - 308
Federal Revenues - - 754 78,549 13,694 483,924 100,000 85,000 575,000 25,000 60,000 - 1,121,377 2,543,298 Other State Revenues 457,892 3,535 717,684 (115,228) 384,870 140,338 141,752 - 126,000 - - - 125,321 1,982,163 Other Local Revenues 127,441 136,439 202,127 249,805 153,620 238,095 141,752 141,752 141,752 100,000 100,000 100,000 975,514 2,808,297 Interfund Transfers In - - - - - - - - - - - - - - Other Financing Sources - - - - - - - - - - - - - -
Total Receipts 1,430,401 979,420 3,267,359 1,707,104 2,213,825 5,108,456 2,365,515 1,708,763 3,229,606 1,147,835 306,107 1,462,855 6,219,298 31,146,543 Disbursements
Certificated Salaries 129,821 1,120,825 1,190,424 1,214,450 1,226,732 1,230,484 1,200,000 1,200,000 1,200,000 1,200,000 1,200,000 1,254,602 - 13,367,338 Classified Salaries 253,711 361,039 393,351 405,039 411,876 410,865 385,000 390,000 390,000 385,000 385,000 337,788 - 4,508,669 Employee Benefits 536,398 803,738 561,203 578,937 599,549 579,828 600,000 600,000 600,000 600,000 600,000 600,000 33,447 7,293,099 Supplies and Services 223,913 826,569 374,972 601,203 362,589 421,563 500,000 450,000 550,000 600,000 600,000 800,000 1,744,897 8,055,707 Capital Outlay - - - - 32,025 - - - - - - 6,257 - 38,282 Other Outgo 24,730 (1,704) - 1,865 3,446 19,722 30,000 12,000 20,000 30,000 5,000 31,265 - 176,323 Interfund Transfers Out - - - - - - - - - - 187,500 - - 187,500 Other Financing Uses - - - - - - - - - - - - - -
Total Disbursements 1,168,573 3,110,467 2,519,949 2,801,493 2,636,217 2,662,462 2,715,000 2,652,000 2,760,000 2,815,000 2,977,500 3,029,912 1,778,344 33,626,918 Asset TransactionsDeferred Apportionment 1,794,506 1,137,260 2,931,766 Accounts Receivable 710,297 540,588 272,722 537,202 157,197 61,910 - - - - - - - 2,279,916 Due From Other Funds - - 393,350 (100,000) 100,000 - - - - - - - - 393,350 Other 337,967 - - - - - - - - - - - - 337,967 SUBTOTAL ASSETS 2,842,770 1,677,848 666,072 437,202 257,197 61,910 - - - - - - - 5,943,000 Accounts Payable 1,959,816 (48,742) (75,075) (267,934) (132,301) (309,001) - - - - - - - 1,126,763 Due To Other Funds - - 322,091 - - - - - - - - - - 322,091 Current Loan - - - - - - - - - - - - - - Other - - - 86,295 - 224,933 - - - - - - - 311,228 SUBTOTAL LIABILITIES 1,959,816 (48,742) 247,016 (181,639) (132,301) (84,068) - - - - - - - 1,760,082
Total PY Transactions 882,955 1,726,590 419,056 618,842 389,498 145,978 - - - - - - - 4,182,918 Net Increase/Decrease 1,144,782 (404,458) 1,166,465 (475,547) (32,894) 2,591,972 (349,485) (943,237) 469,606 (1,667,165) (2,671,393) (1,567,057) 4,440,954
FY TRAN Deposits - - - - - - - - - - - - - - FY TRAN Repayments - - - - - - - - - - - - - - CY TRAN Deposits - - - - - - - - 3,597,116 - - - - 3,597,116 CY TRAN Repayments (2,557,000) (1,198,528) - - - - - - - - - - - (3,755,528)
Ending Cash with TRAN 2,931,588 1,328,603 2,495,068 2,019,521 1,986,627 4,578,599 4,229,114 3,285,877 7,352,599 5,685,434 3,014,041 1,446,984 TRAN Balance 1,172,066 - - - - - - - 3,597,116 3,597,116 3,597,116 3,597,116 Ending Cash without TRAN 1,759,522 1,328,603 2,495,068 2,019,521 1,986,627 4,578,599 4,229,114 3,285,877 3,755,483 2,088,318 (583,075) (2,150,132) Source: The District
Summary of Revenues, Expenditures & Changes in General Fund Balance Projected Alternate Cash Resources2010-11 2011-12 2012-13 2013-14 2014-15 Set-Aside 1 Maturity
(Audited) (Audited) (Audited) (Projected) (Projected) Fund Name Jul 31, 2014 Oct 01, 2014Beginning Fund Balance 3,376,693 3,575,330 4,756,597 4,287,793 1,807,418 13 - Cafeteria Special Revenue (R) 200,000 200,000
14 - Deferred Maintenance (R) 400,000 400,000 Total Revenues 30,003,393 30,206,416 28,604,679 31,146,543 31,765,143 25 - Capital Facilities (R) 1,000,000 1,000,000
35 - County School Facilities (R) 400,000 400,000 Total Expenditures 29,793,726 28,962,633 28,622,142 33,439,418 31,968,123
Other Sources & Uses (11,030) (62,500) (451,341) (187,500) (187,500)
Ending Fund Balance 3,575,330 4,756,613 4,287,793 1,807,418 1,416,938 Source: District Annual Financial Statements & the District.
Total Other Restricted Funds (R) 2,000,000 2,000,000 Total Other Unrestricted Funds (U) - - Grand Total 2,000,000 2,000,000
Excludes Bond Proceed, Bond Interest & Redemption and Debt Service Funds.Source: The District.
C-44 C-45

Fillmore UnifiedVentura
Fiscal Year 2014-15Jul 2014 Aug 2014 Sep 2014 Oct 2014 Nov 2014 Dec 2014 Jan 2015 Feb 2015 Mar 2015 Apr 2015 May 2015 Jun 2015 Accruals Total
Actual / Projected Projected Projected Projected Projected Projected Projected Projected Projected Projected Projected Projected Projected Projected 2014-15Beginning Cash 1,446,984 2,195,933 920,081 2,127,700 1,966,130 1,990,075 4,910,327 4,263,877 3,538,365 4,176,043 2,843,639 1,895,801 Receipts
LCFF/Revenue LimitApportionment 930,739 930,739 2,652,921 1,675,330 1,675,330 2,652,921 1,675,330 1,675,330 2,652,921 1,675,330 1,675,330 2,652,921 - 22,525,145 Property Taxes 23,524 18,296 - 13,069 196,030 2,085,758 548,884 - 44,433 109,777 109,777 462,631 - 3,612,178 Other - - - - - - - - - - - - - -
Federal Revenues - - 556 57,224 10,000 352,416 72,780 61,853 418,714 18,149 43,705 - 816,501 1,851,897 Other State Revenues 252,589 1,968 395,942 (63,530) 212,350 77,417 78,182 - 69,544 - - - 69,107 1,093,570 Other Local Revenues 121,784 130,368 193,137 238,739 146,731 227,473 135,464 135,464 135,464 95,496 95,496 95,496 931,887 2,682,998 Interfund Transfers In - - - - - - - - - - - - - - Other Financing Sources - - - - - - - - - - - - - -
Total Receipts 1,328,636 1,081,371 3,242,557 1,920,831 2,240,441 5,395,986 2,510,640 1,872,648 3,321,077 1,898,751 1,924,307 3,211,048 1,817,495 31,765,789 Disbursements
Certificated Salaries 132,422 1,144,015 1,216,370 1,240,943 1,253,229 1,257,325 1,225,926 1,225,926 1,225,926 1,225,926 1,225,926 1,281,898 - 13,655,832 Classified Salaries 256,706 365,225 397,598 409,453 416,748 415,380 389,391 394,406 394,406 389,391 389,391 341,515 - 4,559,609 Employee Benefits 562,763 843,762 588,796 607,937 629,376 608,703 630,141 630,141 630,141 630,141 630,141 630,141 35,221 7,657,406 Supplies and Services 163,808 604,559 273,996 439,572 265,158 308,172 365,918 329,385 402,450 438,983 438,983 585,115 1,276,292 5,892,392 Capital Outlay - - - - 32,626 - - - - - - 6,372 - 38,998 Other Outgo 37,705 (2,607) - 2,849 5,241 30,073 45,714 18,302 30,476 45,714 7,632 47,649 - 268,748 Interfund Transfers Out - - - - - - - - - - 180,071 - - 180,071 Other Financing Uses - - - - - - - - - - - - - -
Total Disbursements 1,153,405 2,954,954 2,476,759 2,700,754 2,602,377 2,619,653 2,657,090 2,598,160 2,683,400 2,730,155 2,872,145 2,892,690 1,311,513 32,253,056 Asset TransactionsDeferred Apportionment 3,997,086 - - - - - - - - - - - - 3,997,086 Accounts Receivable 724,245 552,713 279,533 546,360 158,826 63,530 - - - - - - - 2,325,208 Due From Other Funds - - 400,241 (101,648) 101,648 - - - - - - - - 400,241 Other 346,240 - - - - - - - - - - - - 346,240 SUBTOTAL ASSETS 5,067,571 552,713 679,774 444,712 260,474 63,530 - - - - - - - 7,068,775 Accounts Payable 1,874,673 (45,018) (70,742) (257,245) (125,407) (295,832) - - - - - - - 1,080,429 Due To Other Funds - - 308,694 - - - - - - - - - - 308,694 Current Loan - - - - - - - - - - - - - - Other - - - 83,605 - 215,443 - - - - - - - 299,047 SUBTOTAL LIABILITIES 1,874,673 (45,018) 237,952 (173,640) (125,407) (80,389) - - - - - - - 1,688,170
Total PY Transactions 3,192,898 597,731 441,822 618,352 385,881 143,919 - - - - - - - 5,380,605 Net Increase/Decrease 3,368,130 (1,275,852) 1,207,620 (161,570) 23,945 2,920,252 (146,449) (725,512) 637,677 (831,404) (947,838) 318,358 505,983
FY TRAN Deposits 1,000,000 - - - - - - - - - - - 1,000,000 FY TRAN Repayments - - - - - - (500,000) - - (501,000) - - (1,001,000) CY TRAN Deposits - - - - - - - - - - - - - CY TRAN Repayments (3,619,181) - - - - - - - - - - - (3,619,181)
Ending Cash with TRAN 2,195,933 920,081 2,127,700 1,966,130 1,990,075 4,910,327 4,263,877 3,538,365 4,176,043 2,843,639 1,895,801 2,214,159 TRAN Balance 1,000,000 1,000,000 1,000,000 1,000,000 1,000,000 1,000,000 500,000 500,000 500,000 - - - Ending Cash without TRAN 1,195,933 (79,919) 1,127,700 966,130 990,075 3,910,327 3,763,877 3,038,365 3,676,043 2,843,639 1,895,801 2,214,159 Source: The District
044
C-45

Los Nietos Los NietosLos Angeles Los Angeles
Fiscal Year 2013-14 Fiscal Year 2014-15Jul 2013 Aug 2013 Sep 2013 Oct 2013 Nov 2013 Dec 2013 Jan 2014 Feb 2014 Mar 2014 Apr 2014 May 2014 Jun 2014 Accruals Total
Actual / Projected Actual Actual Actual Actual Actual Actual Actual Projected Projected Projected Projected Projected Projected 2013-14Beginning Cash 1,210,505 1,229,985 254,417 231,499 287,895 313,868 1,083,243 990,251 (216,677) 1,945,123 1,804,806 934,494 Receipts
LCFF/Revenue LimitApportionment 471,741 687,534 977,527 652,548 733,361 1,158,259 733,361 (133,529) 1,158,258 454,683 14,688 424,908 1,975,813 9,309,152 Property Taxes 3,938 (9,131) 13,285 - 57,073 821,219 191,373 100,000 150,000 450,000 150,000 155,438 - 2,083,195 Other - - - - - - - - - - - - - -
Federal Revenues 1,113 2,300 - 1,825 41,256 174,829 4,657 (52,895) 50,000 50,000 125,000 200,000 374,290 972,375 Other State Revenues 407,166 110,344 373,241 219,957 563,122 - 366,294 (920,000) 200,000 - - 119,275 128,043 1,567,442 Other Local Revenues 2,470 47,631 (2,832) 145,958 95,551 88,455 159,088 100,000 100,000 100,000 100,000 50,000 208,948 1,195,269 Interfund Transfers In - - - - - - - - - - - - - - Other Financing Sources - - - - - - - - - - - - - -
Total Receipts 886,428 838,678 1,361,221 1,020,288 1,490,363 2,242,762 1,454,773 (906,424) 1,658,258 1,054,683 389,688 949,621 2,687,094 15,127,433 Disbursements
Certificated Salaries 59,979 687,029 654,933 665,285 676,166 672,540 671,355 660,000 670,000 670,000 670,000 100,000 15,321 6,872,608 Classified Salaries 100,597 233,200 279,837 277,590 207,110 284,123 275,654 210,000 165,000 150,000 150,000 70,000 5,862 2,408,973 Employee Benefits 32,787 306,733 313,724 315,438 291,227 325,605 311,413 300,000 265,000 200,000 265,000 170,000 17,525 3,114,452 Supplies and Services 134,975 423,599 229,079 202,898 205,803 240,356 778,844 215,000 215,000 215,000 175,000 175,000 232,824 3,443,378 Capital Outlay - - - - - - - - - - - - - - Other Outgo - - - - (6,314) - - - - - - 81,314 - 75,000 Interfund Transfers Out - - - - - - - - - - - 75,000 - 75,000 Other Financing Uses - - - - - - - - - - - - - -
Total Disbursements 328,338 1,650,561 1,477,573 1,461,211 1,373,992 1,522,624 2,037,266 1,385,000 1,315,000 1,235,000 1,260,000 671,314 271,532 15,989,411 Asset TransactionsDeferred Apportionment 718,901 455,600 1,174,501 Accounts Receivable - - 22,542 (7,809) (3,919) (3,593) 193,033 1,723,456 40,000 40,000 - - - 2,003,710 Due From Other Funds - - - - - - - - - - - - - - Other - - - - - - - - - - - - - - SUBTOTAL ASSETS 718,901 455,600 22,542 (7,809) (3,919) (3,593) 193,033 1,723,456 40,000 40,000 - - - 3,178,211 Accounts Payable 566,330 (29,181) (70,892) (55,128) 86,479 (52,830) (296,468) - - - - - - 148,310 Due To Other Funds - - - (450,000) - - - - - - - 450,000 - - Current Loan - - - - - - - - - - - - - - Other - - - - - - - - - - - - - - SUBTOTAL LIABILITIES 566,330 (29,181) (70,892) (505,128) 86,479 (52,830) (296,468) - - - - 450,000 - 148,310
Total PY Transactions 152,571 484,781 93,434 497,319 (90,398) 49,237 489,501 1,723,456 40,000 40,000 - (450,000) - 3,029,901 Net Increase/Decrease 710,661 (327,102) (22,918) 56,396 25,973 769,375 (92,992) (567,968) 383,258 (140,317) (870,312) (171,693) 2,415,562
FY TRAN Deposits 631,819 - - - - - - - - - - - - 631,819 FY TRAN Repayments - - - - - - - (638,960) - - - - - (638,960) CY TRAN Deposits - - - - - - - - 1,778,542 - - - - 1,778,542 CY TRAN Repayments (1,323,000) (648,467) - - - - - - - - - - - (1,971,467)
Ending Cash with TRAN 1,229,985 254,417 231,499 287,895 313,868 1,083,243 990,251 (216,677) 1,945,123 1,804,806 934,494 762,801 TRAN Balance 1,246,762 631,819 631,819 631,819 631,819 631,819 631,819 - 1,778,542 1,778,542 1,778,542 1,778,542 Ending Cash without TRAN (16,776) (377,403) (400,321) (343,925) (317,952) 451,423 358,431 (216,677) 166,581 26,264 (844,048) (1,015,741) Source: The District
Summary of Revenues, Expenditures & Changes in General Fund Balance Projected Alternate Cash Resources2010-11 2011-12 2012-13 2013-14 2014-15 Set-Aside 1 Maturity
(Audited) (Audited) (Audited) (Projected) (Projected) Fund Name Jul 31, 2014 Oct 01, 2014Beginning Fund Balance 1,571,510 2,195,383 1,389,089 1,008,201 930,271 14 - Deferred Maintenance (R) 10,000 10,000
17 - Special Reserve Other than Cap Outlay (U) 150,000 150,000 Total Revenues 16,911,978 15,475,160 15,470,611 15,911,481 15,547,407 25 - Capital Facilities (R) 250,000 250,000
40 - Special Reserve for Cap Outlay (R) 125,000 125,000 Total Expenditures 16,288,105 16,281,454 15,678,184 15,914,411 15,515,875
Other Sources & Uses - - - (75,000) -
Ending Fund Balance 2,195,383 1,389,089 1,181,516 930,271 961,803 Source: District Annual Financial Statements & the District.
Total Other Restricted Funds (R) 385,000 385,000 Total Other Unrestricted Funds (U) 150,000 150,000 Grand Total 535,000 535,000
Excludes Bond Proceed, Bond Interest & Redemption and Debt Service Funds.Source: The District.
C-46 C-47

Los NietosLos Angeles
Fiscal Year 2014-15Jul 2014 Aug 2014 Sep 2014 Oct 2014 Nov 2014 Dec 2014 Jan 2015 Feb 2015 Mar 2015 Apr 2015 May 2015 Jun 2015 Accruals Total
Actual / Projected Projected Projected Projected Projected Projected Projected Projected Projected Projected Projected Projected Projected Projected 2014-15Beginning Cash 762,801 1,013,314 389,253 546,051 401,941 477,831 958,070 1,158,960 639,850 805,089 835,979 486,869 Receipts
LCFF/Revenue LimitApportionment 444,939 444,939 1,275,239 800,890 800,890 1,275,239 800,890 800,890 1,275,239 800,890 800,890 1,275,238 - 10,796,173 Property Taxes - - 10,000 25,000 50,000 375,000 700,000 - 150,000 400,000 100,000 24,479 - 1,834,479 Other - - - - - - - - - - - - - -
Federal Revenues - - 50,000 50,000 75,000 50,000 75,000 50,000 50,000 150,000 75,000 75,000 207,000 907,000 Other State Revenues - 51,000 70,000 300,000 20,000 70,000 - - - - - 200,000 113,755 824,755 Other Local Revenues 10,000 - 100,000 100,000 100,000 100,000 100,000 100,000 100,000 100,000 100,000 100,000 175,000 1,185,000 Interfund Transfers In - - - - - - - - - - - - - - Other Financing Sources - - - - - - - - - - - - - -
Total Receipts 454,939 495,939 1,505,239 1,275,890 1,045,890 1,870,239 1,675,890 950,890 1,575,239 1,450,890 1,075,890 1,674,717 495,755 15,547,407 Disbursements
Certificated Salaries 100,000 670,000 670,000 670,000 670,000 670,000 670,000 670,000 670,000 670,000 670,000 75,000 25,000 6,900,000 Classified Salaries 100,000 210,000 230,000 240,000 240,000 210,000 250,000 240,000 210,000 220,000 215,000 80,000 15,000 2,460,000 Employee Benefits 65,000 280,000 300,000 300,000 300,000 300,000 315,000 315,000 315,000 315,000 315,000 40,000 15,000 3,175,000 Supplies and Services 145,000 210,000 255,000 210,000 210,000 210,000 240,000 245,000 215,000 215,000 225,000 235,000 265,000 2,880,000 Capital Outlay - - - - - - - - - - - - - - Other Outgo - - - - - - - - - - - 75,000 - 75,000 Interfund Transfers Out - - - - - - - - - - - 75,000 - 75,000 Other Financing Uses - - - - - - - - - - - (49,125) - (49,125)
Total Disbursements 410,000 1,370,000 1,455,000 1,420,000 1,420,000 1,390,000 1,475,000 1,470,000 1,410,000 1,420,000 1,425,000 530,875 320,000 15,515,875 Asset TransactionsDeferred Apportionment 1,975,813 - - - - - - - - - - - - 1,975,813 Accounts Receivable 224,187 300,000 132,980 - - - - - - - - - - 657,167 Due From Other Funds - - - - - - - - - - - - - - Other - - - - - - - - - - - - - - SUBTOTAL ASSETS 2,200,000 300,000 132,980 - - - - - - - - - - 2,632,980 Accounts Payable 200,000 50,000 26,421 - - - - - - - - - - 276,421 Due To Other Funds - - - - (450,000) - - - - - - 450,000 - - Current Loan - - - - - - - - - - - - - - Other - - - - - - - - - - - - - - SUBTOTAL LIABILITIES 200,000 50,000 26,421 - (450,000) - - - - - - 450,000 - 276,421
Total PY Transactions 2,000,000 250,000 106,559 - 450,000 - - - - - - (450,000) - 2,356,559 Net Increase/Decrease 2,044,939 (624,061) 156,798 (144,110) 75,890 480,239 200,890 (519,110) 165,239 30,890 (349,110) 693,842 175,755
FY TRAN Deposits - - - - - - - - - - - - - FY TRAN Repayments - - - - - - - - - - - - - CY TRAN Deposits - - - - - - - - - - - - - CY TRAN Repayments (1,794,426) - - - - - - - - - - - (1,794,426)
Ending Cash with TRAN 1,013,314 389,253 546,051 401,941 477,831 958,070 1,158,960 639,850 805,089 835,979 486,869 1,180,711 TRAN Balance - - - - - - - - - - - - Ending Cash without TRAN 1,013,314 389,253 546,051 401,941 477,831 958,070 1,158,960 639,850 805,089 835,979 486,869 1,180,711 Source: The District
046
C-47

Pacifica PacificaSan Mateo San Mateo
Fiscal Year 2013-14 Fiscal Year 2014-15Jul 2013 Aug 2013 Sep 2013 Oct 2013 Nov 2013 Dec 2013 Jan 2014 Feb 2014 Mar 2014 Apr 2014 May 2014 Jun 2014 Accruals Total
Actual / Projected Actual Actual Actual Actual Actual Actual Projected Projected Projected Projected Projected Projected Projected 2013-14Beginning Cash 3,537,698 3,297,679 2,761,191 3,507,625 3,569,457 2,145,946 2,943,264 3,455,456 3,024,956 4,220,400 2,225,671 614,712 Receipts
LCFF/Revenue LimitApportionment 3,747,532 (2,071,891) 2,169,445 1,699,056 1,461,270 2,169,444 2,107,805 1,461,720 1,636,445 - - 646,535 4,300,621 19,327,982 Property Taxes - (20,609) - 695,642 (630,725) 202,542 - - (200,534) - - (46,316) - - Other - - - - - (15,694) 554,562 - - 45,365 - 485,622 315,156 1,385,011
Federal Revenues - 26,151 31,003 (258,425) 237,694 98,017 58,985 165,852 105,525 150,700 145,985 12,500 94,492 868,479 Other State Revenues 677,621 (580,895) 156,044 266,850 413,491 130,000 45,255 15,255 45,255 45,422 45,355 15,777 25,641 1,301,071 Other Local Revenues 4,233 352,690 50,046 180,011 38,553 749,805 287,558 168,952 251,252 125,685 458,985 154,896 209,385 3,032,051 Interfund Transfers In - - - - - - - - - - - - - - Other Financing Sources - - - - - - - - - - - - - -
Total Receipts 4,429,386 (2,294,554) 2,406,538 2,583,134 1,520,283 3,334,114 3,054,165 1,811,779 1,837,943 367,172 650,325 1,269,014 4,945,295 25,914,594 Disbursements
Certificated Salaries 54,501 1,182,821 868,072 1,058,596 1,066,786 1,049,383 1,084,596 1,045,868 1,471,985 1,142,634 1,025,652 99,256 - 11,150,150 Classified Salaries 160,672 286,224 290,426 296,847 317,752 304,791 302,152 294,568 452,212 349,539 310,522 245,411 8,500 3,619,616 Employee Benefits 52,540 616,263 621,659 866,719 630,262 1,296,393 458,985 475,858 625,652 426,585 465,252 465,252 65,895 7,067,315 Supplies and Services 235,988 169,427 344,395 311,331 392,802 261,117 406,585 425,985 421,310 443,143 459,858 368,598 135,652 4,376,191 Capital Outlay - - - - - - - - - - - - - - Other Outgo 20,000 50,388 - (72,923) - - 289,655 - - - - 152,194 278,598 717,912 Interfund Transfers Out - - - - - - - - - - - - - - Other Financing Uses - - - - - - - - - - - - - -
Total Disbursements 523,701 2,305,123 2,124,552 2,460,570 2,407,602 2,911,684 2,541,973 2,242,279 2,971,159 2,361,901 2,261,284 1,330,711 488,645 26,931,184 Asset TransactionsDeferred Apportionment 1,943,104 1,231,433 3,174,537 Accounts Receivable (3,783,415) 3,764,646 2,006,473 221,518 (43,646) - - - - - - - - 2,165,576 Due From Other Funds - - - - - - - - - - - - - - Other - - - - - - - - - - - - - - SUBTOTAL ASSETS (1,840,311) 4,996,079 2,006,473 221,518 (43,646) - - - - - - - - 5,340,113 Accounts Payable 980,393 315,063 1,542,025 282,250 178,464 (374,888) - - - - - - - 2,923,307 Due To Other Funds - - - - 314,082 - - - - - - - - 314,082 Current Loan - - - - - - - - - - - - - - Other - - - - - - - - - - - - - - SUBTOTAL LIABILITIES 980,393 315,063 1,542,025 282,250 492,546 (374,888) - - - - - - - 3,237,389
Total PY Transactions (2,820,704) 4,681,016 464,448 (60,732) (536,192) 374,888 - - - - - - - 2,102,724 Net Increase/Decrease 1,084,981 81,339 746,434 61,832 (1,423,511) 797,318 512,192 (430,500) (1,133,216) (1,994,729) (1,610,959) (61,697) 4,456,650
FY TRAN Deposits - - - - - - - - - - - - - - FY TRAN Repayments - - - - - - - - - - - - - - CY TRAN Deposits - - - - - - - - 2,328,660 - - - - 2,328,660 CY TRAN Repayments (1,325,000) (617,827) - - - - - - - - - - - (1,942,827)
Ending Cash with TRAN 3,297,679 2,761,191 3,507,625 3,569,457 2,145,946 2,943,264 3,455,456 3,024,956 4,220,400 2,225,671 614,712 553,015 TRAN Balance 600,201 - - - - - - - 2,328,660 2,328,660 2,328,660 2,328,660 Ending Cash without TRAN 2,697,478 2,761,191 3,507,625 3,569,457 2,145,946 2,943,264 3,455,456 3,024,956 1,891,740 (102,989) (1,713,948) (1,775,645) Source: The District
Summary of Revenues, Expenditures & Changes in General Fund Balance Projected Alternate Cash Resources2010-11 2011-12 2012-13 2013-14 2014-15 Set-Aside 1 Maturity
(Audited) (Audited) (Audited) (Projected) (Projected) Fund Name Jul 31, 2014 Oct 01, 2014Beginning Fund Balance 3,652,857 4,432,688 4,984,597 3,271,624 2,255,034 13 - Cafeteria Special Revenue (R) 50,000 50,000
14 - Deferred Maintenance (R) 100,000 100,000 Total Revenues 24,166,073 24,694,442 24,729,135 25,914,594 26,121,115 17 - Special Reserve Other than Cap Outlay (U) 710,000 710,000
25 - Capital Facilities (R) 75,000 75,000 Total Expenditures 23,388,119 24,761,921 25,084,000 26,931,184 27,144,000 40 - Special Reserve for Cap Outlay (U) 200,000 200,000
71 - Retiree Benefit (R) 500,000 600,000 Other Sources & Uses 1,877 (13,345) - - -
Ending Fund Balance 4,432,688 4,351,864 4,629,732 2,255,034 1,232,149 Source: District Annual Financial Statements & the District.
Total Other Restricted Funds (R) 725,000 825,000 Total Other Unrestricted Funds (U) 910,000 910,000 Grand Total 1,635,000 1,735,000
Excludes Bond Proceed, Bond Interest & Redemption and Debt Service Funds.Source: The District.
C-48 C-49

PacificaSan Mateo
Fiscal Year 2014-15Jul 2014 Aug 2014 Sep 2014 Oct 2014 Nov 2014 Dec 2014 Jan 2015 Feb 2015 Mar 2015 Apr 2015 May 2015 Jun 2015 Accruals Total
Actual / Projected Projected Projected Projected Projected Projected Projected Projected Projected Projected Projected Projected Projected Projected 2014-15Beginning Cash 553,015 2,994,557 1,228,980 1,197,747 1,011,450 302,068 1,758,147 1,137,211 528,109 575,740 279,010 367,126 Receipts
LCFF/Revenue LimitApportionment 859,911 859,911 2,297,673 1,547,839 1,547,839 2,297,673 1,547,839 1,547,839 2,297,673 1,547,839 1,547,839 2,297,673 - 20,197,547 Property Taxes - (21,646) - 727,294 (129,874) - - - (209,963) - - (365,811) - - Other - - - - - 580,103 - - - 257,583 - 506,508 103,899 1,448,093
Federal Revenues - 26,664 31,625 (263,629) 177 617,260 3,278 3,278 3,898 3,278 211,364 12,756 235,990 885,938 Other State Revenues 342,572 (293,699) 78,868 134,911 209,042 22,891 63,542 22,891 22,891 22,957 22,957 7,959 - 657,780 Other Local Revenues 4,105 340,998 48,379 174,164 27,854 637,135 277,958 121,680 243,067 248,345 631,564 149,828 26,682 2,931,758 Interfund Transfers In - - - - - - - - - - - - - - Other Financing Sources - - - - - - - - - - - - - -
Total Receipts 1,206,587 912,228 2,456,544 2,320,578 1,655,039 4,155,061 1,892,617 1,695,687 2,357,566 2,080,001 2,413,723 2,608,913 366,571 26,121,115 Disbursements
Certificated Salaries 56,369 1,218,014 1,165,889 1,098,585 1,098,645 1,107,487 1,116,329 1,098,589 1,088,697 1,063,276 1,102,565 101,685 86,212 11,402,342 Classified Salaries 166,794 312,552 312,598 326,585 356,859 307,347 313,817 325,652 317,052 310,222 322,444 254,864 62,188 3,688,975 Employee Benefits 54,633 638,340 644,091 897,845 652,717 637,621 657,749 623,963 647,685 646,247 634,746 425,652 128,674 7,289,964 Supplies and Services 356,200 458,500 365,200 256,800 256,200 356,850 425,658 256,585 256,500 356,985 265,852 215,265 116,337 3,942,932 Capital Outlay - - . - - - - - - - - - - - Other Outgo 20,030 50,397 - (72,940) - 289,677 - - - - - 254,000 278,622 819,786 Interfund Transfers Out - - - - - - - - - - - - - - Other Financing Uses - - - - - - - - - - - - - -
Total Disbursements 654,026 2,677,804 2,487,778 2,506,876 2,364,421 2,698,982 2,513,553 2,304,789 2,309,935 2,376,731 2,325,607 1,251,467 672,033 27,144,000 Asset TransactionsDeferred Apportionment 4,300,621 - - - - - - - - - - - - 4,300,621 Accounts Receivable 644,674 - - - - - - - - - - - - 644,674 Due From Other Funds - - - - - - - - - - - - - - Other - - - - - - - - - - - - - - SUBTOTAL ASSETS 4,945,295 - - - - - - - - - - - - 4,945,295 Accounts Payable 710,924 - - - - - - - - - - - - 710,924 Due To Other Funds - - - - - - - - - - - - - - Current Loan - - - - - - - - - - - - - - Other - - - - - - - - - - - - - - SUBTOTAL LIABILITIES 710,924 - - - - - - - - - - - - 710,924
Total PY Transactions 4,234,371 - - - - - - - - - - - - 4,234,371 Net Increase/Decrease 4,786,933 (1,765,576) (31,233) (186,297) (709,381) 1,456,079 (620,937) (609,102) 47,631 (296,730) 88,116 1,357,446 (305,462)
FY TRAN Deposits - - - - - - - - - - - - - FY TRAN Repayments - - - - - - - - - - - - - CY TRAN Deposits - - - - - - - - - - - - - CY TRAN Repayments (2,345,391) - - - - - - - - - - - (2,345,391)
Ending Cash with TRAN 2,994,557 1,228,980 1,197,747 1,011,450 302,068 1,758,147 1,137,211 528,109 575,740 279,010 367,126 1,724,572 TRAN Balance - - - - - - - - - - - - Ending Cash without TRAN 2,994,557 1,228,980 1,197,747 1,011,450 302,068 1,758,147 1,137,211 528,109 575,740 279,010 367,126 1,724,572 Source: The District
048
C-49

Rialto Unified Rialto UnifiedSan Bernardino San Bernardino
Fiscal Year 2013-14 Fiscal Year 2014-15Jul 2013 Aug 2013 Sep 2013 Oct 2013 Nov 2013 Dec 2013 Jan 2014 Feb 2014 Mar 2014 Apr 2014 May 2014 Jun 2014 Accruals Total
Actual / Projected Actual Actual Actual Actual Actual Actual Projected Projected Projected Projected Projected Projected Projected 2013-14Beginning Cash 29,667,013 36,375,773 34,340,086 39,501,622 32,417,554 34,193,937 42,644,947 42,943,354 29,041,954 52,602,469 41,742,512 25,873,196 Receipts
LCFF/Revenue LimitApportionment 6,205,343 6,398,667 18,386,001 11,744,026 11,744,026 17,941,093 11,744,026 12,785,229 18,932,793 7,926,842 255,705 6,048,558 30,173,139 160,285,448 Property Taxes 476,382 - - - 1,403,619 2,982,607 427,716 224,074 135,112 1,215,145 2,326,335 41,323 - 9,232,314 Other - - - - - - - - - - - - - -
Federal Revenues 70,364 80,488 (1,243,463) 55,970 258,226 2,833,559 3,024,750 778,998 3,249,027 931,935 1,940,541 821,536 2,678,653 15,480,583 Other State Revenues 3,754,940 348,379 (1,452,654) 3,629,533 5,393,293 390,391 4,508,520 521,198 452,051 554,442 313,251 391,395 1,155,041 19,959,780 Other Local Revenues 268,360 4,975,219 (3,979,338) 841,726 883,613 1,515,307 899,246 1,628,780 653,949 511,911 496,960 370,267 3,593,518 12,659,518 Interfund Transfers In - - - 24,238 - - - - - - - - - 24,238 Other Financing Sources - - - - - - - - - - - - - -
Total Receipts 10,775,389 11,802,752 11,710,545 16,295,493 19,682,777 25,662,957 20,604,258 15,938,279 23,422,933 11,140,275 5,332,791 7,673,079 37,600,352 217,641,881 Disbursements
Certificated Salaries (13,737) 4,812,386 8,704,333 9,073,647 9,089,600 9,170,323 8,866,083 9,348,728 9,723,505 9,617,508 9,515,737 9,708,579 5,347,622 102,964,313 Classified Salaries 2,129,464 2,527,218 3,067,595 3,504,892 2,463,151 2,590,213 2,570,326 2,900,101 3,358,140 2,965,791 2,649,159 2,216,113 217,013 33,159,175 Employee Benefits 3,850,222 3,269,724 3,939,685 4,188,995 3,697,100 3,823,534 4,022,975 4,124,445 4,347,886 4,170,580 4,035,911 5,444,803 545,706 49,461,567 Supplies and Services 130,193 2,418,433 (309,154) 4,224,439 1,900,939 1,585,717 4,272,806 2,319,217 4,539,544 4,497,550 4,919,279 3,342,709 10,852,256 44,693,929 Capital Outlay - - - 847 214,346 - 456,353 31,228 9,277 55,258 11,625 75,126 39,633 893,694 Other Outgo - 24,986 (61,441) 503,369 100,299 441,291 (252,806) 147,831 - 612,274 - (305,943) 597,070 1,806,929 Interfund Transfers Out - - - - - - - - - - - - - - Other Financing Uses - - - - - - - - - - - - - -
Total Disbursements 6,096,142 13,052,747 15,341,018 21,496,190 17,465,435 17,611,078 19,935,737 18,871,550 21,978,353 21,918,961 21,131,710 20,481,386 17,599,301 232,979,607 Asset TransactionsDeferred Apportionment 15,010,456 9,512,803 24,523,259 Accounts Receivable 7,206,101 146,561 11,717,619 2,973,662 - - - 16,893 - - - - - 22,060,836 Due From Other Funds - - - - (400,000) 400,000 - - - - - - - - Other 88,936 (50,101) 12,648 14,021 4,829 (19,517) 7,585 68,940 (52,396) (32,806) 69,296 109,074 - 220,508 SUBTOTAL ASSETS 22,305,493 9,609,263 11,730,267 2,987,683 (395,171) 380,483 7,585 85,833 (52,396) (32,806) 69,296 109,074 - 46,804,603 Accounts Payable 7,555,129 27,230 3,057,136 4,176,637 4,576 130 11,207 - - - - - - 14,832,045 Due To Other Funds - - - - - - - - - - - - - - Current Loan - - - - - - - - - - - - - - Other 2,102,851 (67,728) (118,877) 694,416 41,212 (18,778) 366,492 (1,451,397) 984,809 48,464 139,693 (2,721,157) - - SUBTOTAL LIABILITIES 9,657,980 (40,498) 2,938,259 4,871,054 45,787 (18,648) 377,699 (1,451,397) 984,809 48,464 139,693 (2,721,157) - 14,832,045
Total PY Transactions 12,647,513 9,649,761 8,792,008 (1,883,371) (440,958) 399,132 (370,114) 1,537,230 (1,037,206) (81,271) (70,398) 2,830,231 - 31,972,558 Net Increase/Decrease 17,326,760 8,399,766 5,161,536 (7,084,068) 1,776,384 8,451,010 298,407 (1,396,040) 407,373 (10,859,957) (15,869,316) (9,978,075) 20,001,051
FY TRAN Deposits 12,330,000 - - - - - - - - - - - - 12,330,000 FY TRAN Repayments - - - - - - - (12,505,360) - - - - - (12,505,360) CY TRAN Deposits - - - - - - - - 23,153,141 - - - - 23,153,141 CY TRAN Repayments (22,948,000) (10,435,454) - - - - - - - - - - - (33,383,454)
Ending Cash with TRAN 36,375,773 34,340,086 39,501,622 32,417,554 34,193,937 42,644,947 42,943,354 29,041,954 52,602,469 41,742,512 25,873,196 15,895,121 TRAN Balance 22,635,964 12,330,000 12,330,000 12,330,000 12,330,000 12,330,000 12,330,000 - 23,153,141 23,153,141 23,153,141 23,153,141 Ending Cash without TRAN 13,739,809 22,010,086 27,171,622 20,087,554 21,863,937 30,314,947 30,613,354 29,041,954 29,449,328 18,589,371 2,720,055 (7,258,021) Source: The District
Summary of Revenues, Expenditures & Changes in General Fund Balance Projected Alternate Cash Resources2010-11 2011-12 2012-13 2013-14 2014-15 Set-Aside 1 Maturity
(Audited) (Audited) (Audited) (Projected) (Projected) Fund Name Jul 31, 2014 Oct 01, 2014Beginning Fund Balance 43,404,952 38,018,092 32,748,412 28,322,974 14,941,951 12 - Child Development (R) 220,000 220,000
25 - Capital Facilities (R) 1,110,000 1,110,000 Total Revenues 217,198,073 215,919,193 211,094,900 217,627,533 233,301,221 35 - County School Facilities (R) - -
40 - Special Reserve for Cap Outlay (U) - - Total Expenditures 224,518,411 222,431,158 215,227,043 231,008,557 224,672,958 13 - Cafeteria Special Revenue (R) 11,000,000 11,000,000
Other Sources & Uses 1,933,478 1,242,285 (293,295) - -
Ending Fund Balance 38,018,092 32,748,412 28,322,974 14,941,951 23,570,214 Source: District Annual Financial Statements & the District.
Total Other Restricted Funds (R) 12,330,000 12,330,000 Total Other Unrestricted Funds (U) - - Grand Total 12,330,000 12,330,000
Excludes Bond Proceed, Bond Interest & Redemption and Debt Service Funds.Source: The District.
C-50 C-51

Rialto UnifiedSan Bernardino
Fiscal Year 2014-15Jul 2014 Aug 2014 Sep 2014 Oct 2014 Nov 2014 Dec 2014 Jan 2015 Feb 2015 Mar 2015 Apr 2015 May 2015 Jun 2015 Accruals Total
Actual / Projected Projected Projected Projected Projected Projected Projected Projected Projected Projected Projected Projected Projected Projected 2014-15Beginning Cash 15,895,121 19,127,311 16,782,047 12,349,488 8,393,163 8,719,298 16,819,804 16,450,429 18,594,553 25,737,411 25,951,425 28,865,418 Receipts
LCFF/Revenue LimitApportionment 6,524,459 6,524,459 17,874,395 11,744,026 11,744,026 17,874,395 11,744,026 17,719,457 23,849,827 17,719,457 17,719,457 6,130,370 17,719,457 184,887,810 Property Taxes - - - - 1,479,985 3,144,881 450,987 236,265 142,463 1,281,257 2,452,903 43,571 - 9,232,314 Other - - - - - - - - - - - - - -
Federal Revenues 69,608 79,623 (1,230,108) 55,368 255,453 2,803,124 2,992,261 770,631 3,214,129 921,925 1,919,698 812,712 2,649,882 15,314,308 Other State Revenues 2,102,305 195,049 (813,308) 2,032,093 3,019,582 218,571 2,524,218 291,807 253,093 310,420 175,382 219,133 646,681 11,175,026 Other Local Revenues 269,044 4,987,891 (3,989,474) 843,870 885,863 1,519,166 901,537 1,632,929 655,615 513,215 498,226 371,210 3,602,671 12,691,763 Interfund Transfers In - - - - - - - - - - - - - - Other Financing Sources - - - - - - - - - - - - - -
Total Receipts 8,965,416 11,787,022 11,841,506 14,675,357 17,384,909 25,560,138 18,613,028 20,651,089 28,115,128 20,746,274 22,765,667 7,576,996 24,618,692 233,301,221 Disbursements
Certificated Salaries (13,815) 4,839,441 8,753,270 9,124,660 9,140,702 9,221,880 8,915,928 9,401,287 9,778,171 9,671,578 9,569,235 9,763,161 5,377,687 103,543,185 Classified Salaries 2,122,868 2,519,389 3,058,093 3,494,035 2,455,521 2,582,190 2,562,365 2,891,118 3,347,738 2,956,605 2,640,953 2,209,248 216,340 33,056,464 Employee Benefits 3,890,708 3,304,105 3,981,111 4,233,043 3,735,976 3,863,739 4,065,277 4,167,814 4,393,605 4,214,434 4,078,350 5,502,056 551,445 49,981,662 Supplies and Services 97,488 2,072,716 (395,679) 3,510,137 1,602,503 1,286,565 3,425,160 1,809,261 3,402,077 3,392,685 3,615,865 5,390,895 5,986,467 35,196,140 Capital Outlay - - - 507 128,232 - 273,011 18,682 5,550 33,058 6,955 44,944 23,711 534,649 Other Outgo - 974,380 - (252,806) - 488,451 (252,806) 278,180 - 235,644 - (252,806) 1,142,623 2,360,858 Interfund Transfers Out - - - - - - - - - - - - - - Other Financing Uses - - - - - - - - - - - - - -
Total Disbursements 6,097,249 13,710,032 15,396,796 20,109,576 17,062,933 17,442,823 18,988,935 18,566,342 20,927,142 20,504,004 19,911,357 22,657,497 13,298,272 224,672,958 Asset TransactionsDeferred Apportionment 30,173,139 - - - - - - - - - - - - 30,173,139 Accounts Receivable 107,333 78,048 5,776,013 1,465,819 - - - - - - - - - 7,427,213 Due From Other Funds - - - - - - - - - - - - - - Other 76,599 (41,885) 10,894 12,076 4,159 (16,809) 6,532 59,376 (45,128) (28,255) 59,683 52,759 - 150,000 SUBTOTAL ASSETS 30,357,071 36,163 5,786,907 1,477,895 4,159 (16,809) 6,532 59,376 (45,128) (28,255) 59,683 52,759 - 37,750,352 Accounts Payable 6,776,708 458,417 6,664,176 - - - - - - - - 3,700,000 - 17,599,301 Due To Other Funds - - - - - - - - - - - - - - Current Loan - - - - - - - - - - - - - - Other - - - - - - - - - - - - - - SUBTOTAL LIABILITIES 6,776,708 458,417 6,664,176 - - - - - - - - 3,700,000 - 17,599,301
Total PY Transactions 23,580,363 (422,254) (877,270) 1,477,895 4,159 (16,809) 6,532 59,376 (45,128) (28,255) 59,683 (3,647,241) - 20,151,051 Net Increase/Decrease 26,448,530 (2,345,264) (4,432,559) (3,956,324) 326,135 8,100,505 (369,375) 2,144,124 7,142,858 214,014 2,913,992 (18,727,742) 11,320,421
FY TRAN Deposits - - - - - - - - - - - - - FY TRAN Repayments - - - - - - - - - - - - - CY TRAN Deposits - - - - - - - - - - - - - CY TRAN Repayments (23,216,339) - - - - - - - - - - - (23,216,339)
Ending Cash with TRAN 19,127,311 16,782,047 12,349,488 8,393,163 8,719,298 16,819,804 16,450,429 18,594,553 25,737,411 25,951,425 28,865,418 10,137,675 TRAN Balance - - - - - - - - - - - - Ending Cash without TRAN 19,127,311 16,782,047 12,349,488 8,393,163 8,719,298 16,819,804 16,450,429 18,594,553 25,737,411 25,951,425 28,865,418 10,137,675 Source: The District
050
C-51

South Whittier Elementary South Whittier ElementaryLos Angeles Los Angeles
Fiscal Year 2013-14 Fiscal Year 2014-15Jul 2013 Aug 2013 Sep 2013 Oct 2013 Nov 2013 Dec 2013 Jan 2014 Feb 2014 Mar 2014 Apr 2014 May 2014 Jun 2014 Accruals Total
Actual / Projected Actual Actual Actual Actual Actual Actual Projected Projected Projected Projected Projected Projected Projected 2013-14Beginning Cash 3,915,135 4,673,458 4,634,027 5,457,292 4,763,908 4,136,804 5,948,380 5,614,030 2,405,990 5,070,147 3,844,234 1,894,579 Receipts
LCFF/Revenue LimitApportionment 740,270 740,270 1,782,050 148,631 1,332,486 3,105,076 1,187,486 1,187,486 1,140,118 738,880 36,944 752,632 3,612,480 16,504,809 Property Taxes 24,179 (8,860) 25,990 - 97,565 1,031,266 521,000 112,000 101,000 138,000 216,000 186,000 382,668 2,826,808 Other 8,000 (8,000) - - - - - - - - - - - -
Federal Revenues - - 107,979 (73,421) 42,215 540,275 - 117,710 147,878 - - 181,733 862,563 1,926,932 Other State Revenues 185,067 - 1,169,619 (252,530) 422,858 (656,509) 342,989 188,129 194,379 355,788 188,129 188,129 1,834,273 4,160,321 Other Local Revenues 6,077 5,426 183,598 25,179 248,959 234,288 118,854 118,854 118,854 23,954 3,698 - 448,862 1,536,603 Interfund Transfers In - - - - - - - - - - - - - - Other Financing Sources - - - - - - - - - - - - - -
Total Receipts 963,593 728,836 3,269,236 (152,141) 2,144,083 4,254,396 2,170,329 1,724,179 1,702,229 1,256,622 444,771 1,308,494 7,140,846 26,955,473 Disbursements
Certificated Salaries 41,963 154,488 1,197,147 1,139,514 1,180,914 1,142,343 1,235,437 1,242,388 1,235,585 1,230,132 1,243,053 1,274,881 288,889 12,606,734 Classified Salaries 604 247,227 321,058 333,142 341,037 326,642 329,068 335,905 336,550 338,631 313,546 294,950 91,833 3,610,194 Employee Benefits 34,469 92,857 505,966 519,267 524,809 509,361 531,328 520,340 479,884 472,568 467,763 450,154 167,305 5,276,071 Supplies and Services 202,943 424,986 323,949 909,738 261,050 630,010 408,565 394,382 403,444 432,800 361,930 690,887 202,785 5,647,469 Capital Outlay - - - - - - - - 7,848 7,848 7,848 31,391 39,240 94,175 Other Outgo - - - - - - 281 - 281 556 286 371 35,583 37,358 Interfund Transfers Out - - - - - - - - - - - - - - Other Financing Uses - - - - - - - - - - - - - -
Total Disbursements 279,979 919,558 2,348,120 2,901,661 2,307,810 2,608,357 2,504,679 2,493,015 2,463,592 2,482,535 2,394,426 2,742,634 825,635 27,272,001 Asset TransactionsDeferred Apportionment 1,378,658 873,718 2,252,376 Accounts Receivable 212,774 215,285 5,124 1,751,281 (7,297) 161,527 - - - - - - - 2,338,695 Due From Other Funds - - - - - - - - - - - - - - Other - 3,777 (989) - - - - - - - - - - 2,788 SUBTOTAL ASSETS 1,591,432 1,092,780 4,135 1,751,281 (7,297) 161,527 - - - - - - - 4,593,859 Accounts Payable 2,133,039 102,996 101,986 (608,817) 456,084 200,735 - - - - - - - 2,386,023 Due To Other Funds - - - - - - - - - - - - - - Current Loan - - - - - - - - - - - - - - Other - - - (320) (4) (204,745) - - - - - - - (205,069) SUBTOTAL LIABILITIES 2,133,039 102,996 101,986 (609,137) 456,080 (4,010) - - - - - - - 2,180,954
Total PY Transactions (541,607) 989,784 (97,851) 2,360,418 (463,377) 165,537 - - - - - - - 2,412,905 Net Increase/Decrease 142,007 799,062 823,265 (693,384) (627,104) 1,811,576 (334,350) (768,836) (761,363) (1,225,913) (1,949,655) (1,434,140) 6,315,211
FY TRAN Deposits 2,419,316 - - - - - - - - - - - - 2,419,316 FY TRAN Repayments - - - - - - - (2,439,204) - - - - - (2,439,204) CY TRAN Deposits - - - - - - - - 3,425,520 - - - - 3,425,520 CY TRAN Repayments (1,803,000) (838,493) - - - - - - - - - - - (2,641,493)
Ending Cash with TRAN 4,673,458 4,634,027 5,457,292 4,763,908 4,136,804 5,948,380 5,614,030 2,405,990 5,070,147 3,844,234 1,894,579 460,439 TRAN Balance 3,229,058 2,419,316 2,419,316 2,419,316 2,419,316 2,419,316 2,419,316 - 3,425,520 3,425,520 3,425,520 3,425,520 Ending Cash without TRAN 1,444,401 2,214,711 3,037,976 2,344,592 1,717,488 3,529,064 3,194,714 2,405,990 1,644,627 418,714 (1,530,941) (2,965,081) Source: The District
Summary of Revenues, Expenditures & Changes in General Fund Balance Projected Alternate Cash Resources2010-11 2011-12 2012-13 2013-14 2014-15 Set-Aside 1 Maturity
(Audited) (Audited) (Audited) (Projected) (Projected) Fund Name Jul 31, 2014 Oct 01, 2014Beginning Fund Balance 1,798,194 2,517,455 2,613,100 2,109,121 1,626,862 13 - Cafeteria Special Revenue (R) 725,000 960,000
14 - Deferred Maintenance (R) 65,000 162,000 Total Revenues 28,815,940 28,050,770 26,611,152 26,791,994 29,416,067 25 - Capital Facilities (R) 100,000 75,000
35 - County School Facilities (R) - - Total Expenditures 27,948,371 27,955,125 27,115,131 27,274,253 29,862,465 40 - Special Reserve for Cap Outlay (U) 143,000 143,000
Other Sources & Uses (148,308) - - - -
Ending Fund Balance 2,517,455 2,613,100 2,109,121 1,626,862 1,180,464 Source: District Annual Financial Statements & the District.
Total Other Restricted Funds (R) 890,000 1,197,000 Total Other Unrestricted Funds (U) 143,000 143,000 Grand Total 1,033,000 1,340,000
Excludes Bond Proceed, Bond Interest & Redemption and Debt Service Funds.Source: The District.
C-52 C-53

South Whittier ElementaryLos Angeles
Fiscal Year 2014-15Jul 2014 Aug 2014 Sep 2014 Oct 2014 Nov 2014 Dec 2014 Jan 2015 Feb 2015 Mar 2015 Apr 2015 May 2015 Jun 2015 Accruals Total
Actual / Projected Projected Projected Projected Projected Projected Projected Projected Projected Projected Projected Projected Projected Projected 2014-15Beginning Cash 460,439 1,872,374 2,433,078 2,158,232 1,309,485 1,006,430 1,320,260 1,494,361 1,343,144 1,322,361 1,638,278 1,683,200 Receipts
LCFF/Revenue LimitApportionment 1,023,264 1,023,264 1,841,876 1,841,876 1,841,876 1,841,876 1,841,876 1,841,876 1,841,876 1,841,876 1,841,876 1,841,872 - 20,465,284 Property Taxes 24,179 (8,860) 25,990 - 64,124 459,000 721,000 112,000 151,000 338,000 616,000 324,373 - 2,826,806 Other - - - - - - - - - - - - - -
Federal Revenues - - 107,980 - - 313,320 - 267,710 347,878 481,733 - - 311,842 1,830,463 Other State Revenues - - - - 288,000 288,000 288,000 288,000 288,000 288,100 288,100 288,000 566,450 2,870,650 Other Local Revenues 6,000 5,500 184,000 25,000 120,000 120,000 120,000 120,000 120,000 74,000 4,000 - 524,364 1,422,864 Interfund Transfers In - - - - - - - - - - - - - - Other Financing Sources - - - - - - - - - - - - - -
Total Receipts 1,053,443 1,019,904 2,159,846 1,866,876 2,314,000 3,022,196 2,970,876 2,629,586 2,748,754 3,023,709 2,749,976 2,454,245 1,402,656 29,416,067 Disbursements
Certificated Salaries 47,800 174,500 1,352,610 1,287,635 1,402,129 1,384,666 1,396,044 1,403,898 1,396,211 1,390,050 1,403,520 1,440,615 270,066 14,349,744 Classified Salaries 750 304,056 393,671 409,765 415,250 413,965 404,754 413,164 413,957 416,520 385,662 362,788 118,394 4,452,696 Employee Benefits 38,382 102,400 563,411 578,223 509,676 519,735 535,977 523,741 534,369 526,222 520,872 501,263 420,833 5,875,104 Supplies and Services 50,000 125,000 125,000 440,000 290,000 390,000 460,000 440,000 425,000 375,000 395,000 620,000 1,022,279 5,157,279 Capital Outlay - - - - - - - - - - - - - - Other Outgo - - - - - - - - - - - - (102,358) (102,358) Interfund Transfers Out - - - - - - - - - - - - 130,000 130,000 Other Financing Uses - - - - - - - - - - - - - -
Total Disbursements 136,932 705,956 2,434,692 2,715,623 2,617,055 2,708,366 2,796,775 2,780,803 2,769,537 2,707,792 2,705,054 2,924,666 1,859,214 29,862,465 Asset TransactionsDeferred Apportionment 3,612,480 - - - - - - - - - - - - 3,612,480 Accounts Receivable 878,292 524,364 - - - - - - - - - - - 1,402,656 Due From Other Funds - - - - - - - - - - - - - - Other - - - - - - - - - - - - - - SUBTOTAL ASSETS 4,490,772 524,364 - - - - - - - - - - - 5,015,136 Accounts Payable 548,027 277,608 - - - - - - - - - - - 825,635 Due To Other Funds - - - - - - - - - - - - - - Current Loan - - - - - - - - - - - - - - Other - - - - - - - - - - - - - - SUBTOTAL LIABILITIES 548,027 277,608 - - - - - - - - - - - 825,635
Total PY Transactions 3,942,745 246,756 - - - - - - - - - - - 4,189,501 Net Increase/Decrease 4,859,256 560,704 (274,846) (848,747) (303,055) 313,830 174,101 (151,217) (20,783) 315,917 44,922 (470,421) (456,558)
FY TRAN Deposits - - - - - - - - - - - - - FY TRAN Repayments - - - - - - - - - - - - - CY TRAN Deposits - - - - - - - - - - - - - CY TRAN Repayments (3,447,321) - - - - - - - - - - - (3,447,321)
Ending Cash with TRAN 1,872,374 2,433,078 2,158,232 1,309,485 1,006,430 1,320,260 1,494,361 1,343,144 1,322,361 1,638,278 1,683,200 1,212,779 TRAN Balance - - - - - - - - - - - - Ending Cash without TRAN 1,872,374 2,433,078 2,158,232 1,309,485 1,006,430 1,320,260 1,494,361 1,343,144 1,322,361 1,638,278 1,683,200 1,212,779 Source: The District
052
C-53
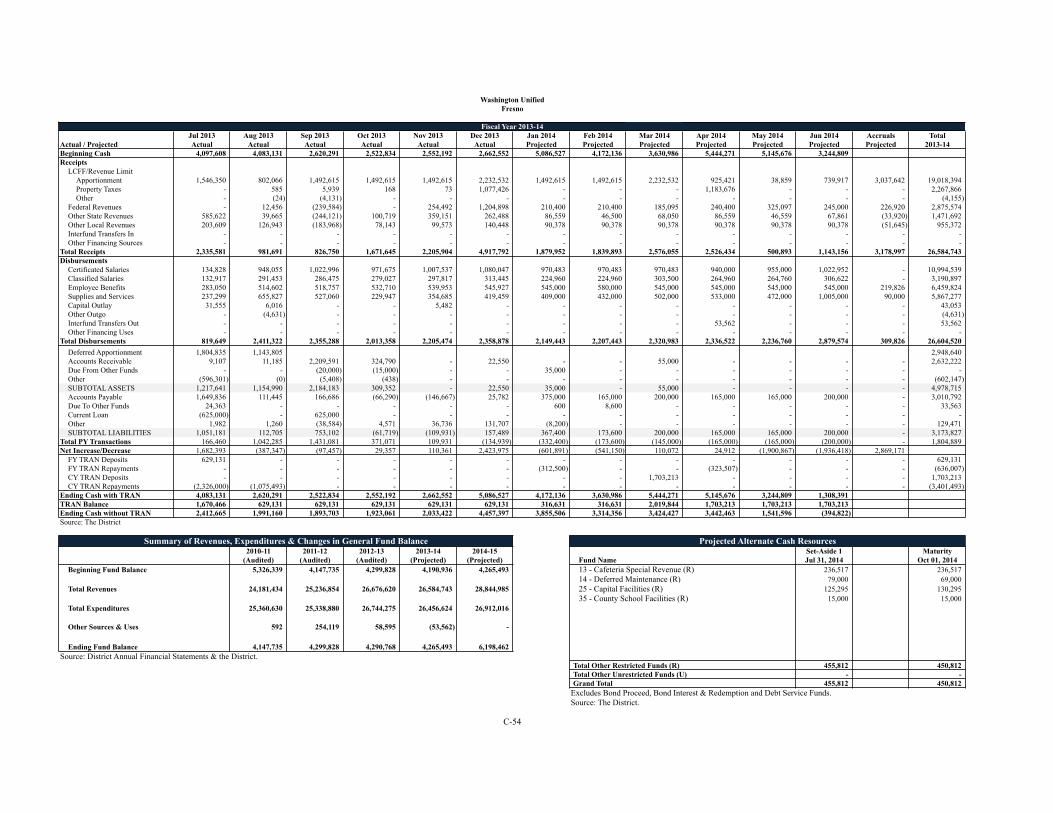
Washington Unified Washington UnifiedFresno Fresno
Fiscal Year 2013-14 Fiscal Year 2014-15Jul 2013 Aug 2013 Sep 2013 Oct 2013 Nov 2013 Dec 2013 Jan 2014 Feb 2014 Mar 2014 Apr 2014 May 2014 Jun 2014 Accruals Total
Actual / Projected Actual Actual Actual Actual Actual Actual Projected Projected Projected Projected Projected Projected Projected 2013-14Beginning Cash 4,097,608 4,083,131 2,620,291 2,522,834 2,552,192 2,662,552 5,086,527 4,172,136 3,630,986 5,444,271 5,145,676 3,244,809 Receipts
LCFF/Revenue LimitApportionment 1,546,350 802,066 1,492,615 1,492,615 1,492,615 2,232,532 1,492,615 1,492,615 2,232,532 925,421 38,859 739,917 3,037,642 19,018,394 Property Taxes - 585 5,939 168 73 1,077,426 - - - 1,183,676 - - - 2,267,866 Other - (24) (4,131) - - - - - - - - - - (4,155)
Federal Revenues - 12,456 (239,584) - 254,492 1,204,898 210,400 210,400 185,095 240,400 325,097 245,000 226,920 2,875,574 Other State Revenues 585,622 39,665 (244,121) 100,719 359,151 262,488 86,559 46,500 68,050 86,559 46,559 67,861 (33,920) 1,471,692 Other Local Revenues 203,609 126,943 (183,968) 78,143 99,573 140,448 90,378 90,378 90,378 90,378 90,378 90,378 (51,645) 955,372 Interfund Transfers In - - - - - - - - - - - - - - Other Financing Sources - - - - - - - - - - - - - -
Total Receipts 2,335,581 981,691 826,750 1,671,645 2,205,904 4,917,792 1,879,952 1,839,893 2,576,055 2,526,434 500,893 1,143,156 3,178,997 26,584,743 Disbursements
Certificated Salaries 134,828 948,055 1,022,996 971,675 1,007,537 1,080,047 970,483 970,483 970,483 940,000 955,000 1,022,952 - 10,994,539 Classified Salaries 132,917 291,453 286,475 279,027 297,817 313,445 224,960 224,960 303,500 264,960 264,760 306,622 - 3,190,897 Employee Benefits 283,050 514,602 518,757 532,710 539,953 545,927 545,000 580,000 545,000 545,000 545,000 545,000 219,826 6,459,824 Supplies and Services 237,299 655,827 527,060 229,947 354,685 419,459 409,000 432,000 502,000 533,000 472,000 1,005,000 90,000 5,867,277 Capital Outlay 31,555 6,016 - - 5,482 - - - - - - - - 43,053 Other Outgo - (4,631) - - - - - - - - - - - (4,631) Interfund Transfers Out - - - - - - - - - 53,562 - - - 53,562 Other Financing Uses - - - - - - - - - - - - - -
Total Disbursements 819,649 2,411,322 2,355,288 2,013,358 2,205,474 2,358,878 2,149,443 2,207,443 2,320,983 2,336,522 2,236,760 2,879,574 309,826 26,604,520 Asset TransactionsDeferred Apportionment 1,804,835 1,143,805 2,948,640 Accounts Receivable 9,107 11,185 2,209,591 324,790 - 22,550 - - 55,000 - - - - 2,632,222 Due From Other Funds - - (20,000) (15,000) - - 35,000 - - - - - - - Other (596,301) (0) (5,408) (438) - - - - - - - - - (602,147) SUBTOTAL ASSETS 1,217,641 1,154,990 2,184,183 309,352 - 22,550 35,000 - 55,000 - - - - 4,978,715 Accounts Payable 1,649,836 111,445 166,686 (66,290) (146,667) 25,782 375,000 165,000 200,000 165,000 165,000 200,000 - 3,010,792 Due To Other Funds 24,363 - - - - - 600 8,600 - - - - - 33,563 Current Loan (625,000) - 625,000 - - - - - - - - - - - Other 1,982 1,260 (38,584) 4,571 36,736 131,707 (8,200) - - - - - - 129,471 SUBTOTAL LIABILITIES 1,051,181 112,705 753,102 (61,719) (109,931) 157,489 367,400 173,600 200,000 165,000 165,000 200,000 - 3,173,827
Total PY Transactions 166,460 1,042,285 1,431,081 371,071 109,931 (134,939) (332,400) (173,600) (145,000) (165,000) (165,000) (200,000) - 1,804,889 Net Increase/Decrease 1,682,393 (387,347) (97,457) 29,357 110,361 2,423,975 (601,891) (541,150) 110,072 24,912 (1,900,867) (1,936,418) 2,869,171
FY TRAN Deposits 629,131 - - - - - - - - - - - - 629,131 FY TRAN Repayments - - - - - - (312,500) - - (323,507) - - - (636,007) CY TRAN Deposits - - - - - - - - 1,703,213 - - - - 1,703,213 CY TRAN Repayments (2,326,000) (1,075,493) - - - - - - - - - - - (3,401,493)
Ending Cash with TRAN 4,083,131 2,620,291 2,522,834 2,552,192 2,662,552 5,086,527 4,172,136 3,630,986 5,444,271 5,145,676 3,244,809 1,308,391 TRAN Balance 1,670,466 629,131 629,131 629,131 629,131 629,131 316,631 316,631 2,019,844 1,703,213 1,703,213 1,703,213 Ending Cash without TRAN 2,412,665 1,991,160 1,893,703 1,923,061 2,033,422 4,457,397 3,855,506 3,314,356 3,424,427 3,442,463 1,541,596 (394,822) Source: The District
Summary of Revenues, Expenditures & Changes in General Fund Balance Projected Alternate Cash Resources2010-11 2011-12 2012-13 2013-14 2014-15 Set-Aside 1 Maturity
(Audited) (Audited) (Audited) (Projected) (Projected) Fund Name Jul 31, 2014 Oct 01, 2014Beginning Fund Balance 5,326,339 4,147,735 4,299,828 4,190,936 4,265,493 13 - Cafeteria Special Revenue (R) 236,517 236,517
14 - Deferred Maintenance (R) 79,000 69,000 Total Revenues 24,181,434 25,236,854 26,676,620 26,584,743 28,844,985 25 - Capital Facilities (R) 125,295 130,295
35 - County School Facilities (R) 15,000 15,000 Total Expenditures 25,360,630 25,338,880 26,744,275 26,456,624 26,912,016
Other Sources & Uses 592 254,119 58,595 (53,562) -
Ending Fund Balance 4,147,735 4,299,828 4,290,768 4,265,493 6,198,462 Source: District Annual Financial Statements & the District.
Total Other Restricted Funds (R) 455,812 450,812 Total Other Unrestricted Funds (U) - - Grand Total 455,812 450,812
Excludes Bond Proceed, Bond Interest & Redemption and Debt Service Funds.Source: The District.
C-54 C-55

Washington UnifiedFresno
Fiscal Year 2014-15Jul 2014 Aug 2014 Sep 2014 Oct 2014 Nov 2014 Dec 2014 Jan 2015 Feb 2015 Mar 2015 Apr 2015 May 2015 Jun 2015 Accruals Total
Actual / Projected Projected Projected Projected Projected Projected Projected Projected Projected Projected Projected Projected Projected Projected 2014-15Beginning Cash 1,308,391 1,734,869 205,754 1,266,035 1,283,069 1,375,660 2,841,222 2,265,320 1,979,515 2,322,485 3,084,577 2,751,991 Receipts
LCFF/Revenue LimitApportionment 839,522 839,522 2,260,041 1,511,139 1,511,139 2,260,041 1,511,139 1,511,139 2,260,041 1,511,139 1,511,139 2,260,041 - 19,786,044 Property Taxes - - 6,499 - - 977,062 - - - 1,204,537 - - - 2,188,099 Other - - - - - - (151,650) - - - - - (158,150) (309,800)
Federal Revenues - 12,365 (239,535) - 254,488 406,894 406,894 406,894 406,894 406,894 406,894 406,894 - 2,875,574 Other State Revenues 585,586 39,736 (244,154) 100,664 359,093 129,950 86,535 86,535 86,535 86,535 86,535 67,845 - 1,471,398 Other Local Revenues 203,590 126,969 (184,005) 78,149 99,550 7,930 90,378 90,378 90,378 90,378 90,378 90,378 80,920 955,372 Interfund Transfers In - - - - - - - - - - - - - - Other Financing Sources - - - - - - - - - - - - - -
Total Receipts 1,628,698 1,018,591 1,598,847 1,689,953 2,224,270 3,781,877 1,943,296 2,094,947 2,843,849 3,299,484 2,094,947 2,825,158 (77,230) 26,966,687 Disbursements
Certificated Salaries 136,425 962,738 1,038,160 986,030 1,022,632 1,050,361 984,921 984,921 984,921 953,865 959,411 1,025,960 - 11,090,346 Classified Salaries 135,009 295,673 290,863 283,167 302,408 286,373 228,329 228,329 308,180 269,056 268,736 311,066 - 3,207,190 Employee Benefits 291,429 529,992 534,618 548,495 556,425 553,121 561,051 561,051 561,051 561,051 561,051 561,051 226,667 6,607,054 Supplies and Services 237,348 655,891 526,796 229,822 354,864 259,925 409,280 431,857 501,904 533,164 471,801 1,004,966 171,354 5,788,972 Capital Outlay 31,558 6,015 - - 5,478 - - - - - - - 71,083 114,135 Other Outgo - (4,630) - - - - - - - - - - 55,228 50,598 Interfund Transfers Out - - - - - - - - - 53,721 - - - 53,721 Other Financing Uses - - - - - - - - - - - - - -
Total Disbursements 831,770 2,445,679 2,390,437 2,047,514 2,241,808 2,149,780 2,183,582 2,206,159 2,356,056 2,370,858 2,260,999 2,903,043 524,332 26,912,016 Asset TransactionsDeferred Apportionment 3,037,642 - - - - - - - - - - - - 3,037,642 Accounts Receivable 8,090 10,787 2,002,375 328,997 - - - - 56,631 - - - - 2,406,880 Due From Other Funds - - (21,574) (16,180) - - 35,057 - - - - - - (2,697) Other - - - - - - - - - - - - - - SUBTOTAL ASSETS 3,045,732 10,787 1,980,801 312,817 - - 35,057 - 56,631 - - - - 5,441,825 Accounts Payable 1,670,717 112,814 169,221 (67,151) (147,732) 69,837 378,732 166,535 201,453 166,535 166,535 201,453 - 3,088,947 Due To Other Funds 24,174 - - - - - - 8,058 - - - - - 32,232 Current Loan - - - - - - - - - - - - - - Other 2,686 - (40,291) 5,372 37,605 96,697 (8,058) - - - - - - 94,011 SUBTOTAL LIABILITIES 1,697,578 112,814 128,930 (61,779) (110,128) 166,535 370,674 174,593 201,453 166,535 166,535 201,453 - 3,215,191
Total PY Transactions 1,348,155 (102,027) 1,851,871 374,596 110,128 (166,535) (335,617) (174,593) (144,822) (166,535) (166,535) (201,453) - 2,226,635 Net Increase/Decrease 2,145,083 (1,529,115) 1,060,281 17,034 92,590 1,465,562 (575,902) (285,805) 342,970 762,092 (332,587) (279,338) (601,562)
FY TRAN Deposits - - - - - - - - - - - - - FY TRAN Repayments - - - - - - - - - - - - - CY TRAN Deposits - - - - - - - - - - - - - CY TRAN Repayments (1,718,606) - - - - - - - - - - - (1,718,606)
Ending Cash with TRAN 1,734,869 205,754 1,266,035 1,283,069 1,375,660 2,841,222 2,265,320 1,979,515 2,322,485 3,084,577 2,751,991 2,472,653 TRAN Balance - - - - - - - - - - - - Ending Cash without TRAN 1,734,869 205,754 1,266,035 1,283,069 1,375,660 2,841,222 2,265,320 1,979,515 2,322,485 3,084,577 2,751,991 2,472,653 Source: The District
054
C-55

CERTAIN BACKGROUND INFORMATIONAND PROJECTED CASH FLOWS FOR SERIES L DISTRICTS

Azusa Unified Azusa UnifiedLos Angeles Los Angeles
Fiscal Year 2013-14 Fiscal Year 2014-15Jul 2013 Aug 2013 Sep 2013 Oct 2013 Nov 2013 Dec 2013 Jan 2014 Feb 2014 Mar 2014 Apr 2014 May 2014 Jun 2014 Accruals Total
Actual / Projected Actual Actual Actual Actual Actual Actual Projected Projected Projected Projected Projected Projected Projected 2013-14Beginning Cash 17,067,676 20,888,964 24,232,547 16,635,779 15,029,563 13,333,517 17,429,210 15,620,870 12,588,194 17,899,017 13,500,626 8,879,931 Receipts
LCFF/Revenue LimitApportionment 1,848,298 1,848,298 5,683,121 3,787,746 4,576,168 4,144,677 2,167,665 1,754,793 3,228,507 460,995 - 2,356,186 15,793,660 47,650,114 Property Taxes 97,048 (46,605) (14,369) - 281,549 2,872,508 1,159,272 405,268 272,581 635,750 1,409,280 - 925,628 7,997,910 Other - - - - - - - - - - - - - -
Federal Revenues 233,917 5,563 1,316,038 (247,750) 654,436 2,692,485 773,889 303,497 131,162 174,628 174,628 174,628 1,085,079 7,472,200 Other State Revenues 2,414,860 (818,716) 3,664,786 1,339,181 1,327,307 736,284 1,057,385 1,190,867 494,077 1,203,081 477,864 275,850 2,597,748 15,960,574 Other Local Revenues 759,255 342,433 329,196 59,369 258,478 263,838 210,262 346,001 1,053,057 842,633 640,713 145,000 2,720,912 7,971,147 Interfund Transfers In - - - - - - - - - - - - 108,717 108,717 Other Financing Sources - - - - - - - - - - - - 1,739,435 1,739,435
Total Receipts 5,353,378 1,330,973 10,978,772 4,938,546 7,097,938 10,709,792 5,368,473 4,000,426 5,179,384 3,317,087 2,702,485 2,951,664 24,971,179 88,900,097 Disbursements
Certificated Salaries 51,427 360,374 3,636,184 3,700,508 3,750,672 4,183,055 3,916,169 3,916,169 3,916,169 3,916,169 3,916,169 3,916,169 4,007,847 43,187,081 Classified Salaries 4,128 636,152 946,625 1,226,907 1,298,047 1,413,808 1,192,142 1,192,142 1,192,142 1,192,142 1,192,142 1,192,142 1,657,300 14,335,819 Employee Benefits 776,813 214,384 1,718,248 1,249,206 1,735,617 773,939 1,221,806 1,221,806 1,221,806 1,221,806 1,221,806 1,221,806 2,242 13,801,285 Supplies and Services 259,308 1,284,116 1,499,051 1,040,595 2,020,645 830,285 800,862 675,264 1,442,039 1,290,361 643,063 692,535 3,863,120 16,341,244 Capital Outlay - 1,513 5,409 - - - - - - - - - 71,774 78,696 Other Outgo 9,713 18,799 - 29,351 - - 45,834 27,721 91,634 95,000 350,000 4,070,970 493,660 5,232,682 Interfund Transfers Out - - - - - - - - - - - - (248,217) (248,217) Other Financing Uses - - - - - - - - - - - - - -
Total Disbursements 1,101,389 2,515,338 7,805,517 7,246,567 8,804,981 7,201,087 7,176,813 7,033,102 7,863,790 7,715,478 7,323,180 11,093,622 9,847,726 92,728,590 Asset TransactionsDeferred Apportionment 5,237,977 3,319,542 8,557,519 Accounts Receivable 1,573,978 5,920,361 (14,864) 651,089 (262,199) 623,772 - - - - - - - 8,492,137 Due From Other Funds - - - - - - - - - - - 3,385,306 - 3,385,306 Other - - - - - - - - - - - - - - SUBTOTAL ASSETS 6,811,955 9,239,903 (14,864) 651,089 (262,199) 623,772 - - - - - 3,385,306 - 20,434,962 Accounts Payable 99,998 1,569,711 712,806 (54,366) (268,372) 37,137 - - - - - - - 2,096,914 Due To Other Funds 242,658 (753) (644) 3,650 (4,824) (353) - - - - - - - 239,734 Current Loan - - - - - - - - - - - - - - Other - - 10,042,997 - - - - - - - - - - 10,042,997 SUBTOTAL LIABILITIES 342,656 1,568,958 10,755,159 (50,716) (273,196) 36,784 - - - - - - - 12,379,645
Total PY Transactions 6,469,299 7,670,945 (10,770,023) 701,805 10,997 586,988 - - - - - 3,385,306 - 8,055,317 Net Increase/Decrease 10,721,288 6,486,580 (7,596,768) (1,606,216) (1,696,046) 4,095,693 (1,808,340) (3,032,676) (2,684,406) (4,398,391) (4,620,695) (4,756,652) 15,123,453
FY TRAN Deposits - - - - - - - - - - - - - - FY TRAN Repayments - - - - - - - - - - - - - - CY TRAN Deposits - - - - - - - - 7,995,230 - - - - 7,995,230 CY TRAN Repayments (6,900,000) (3,142,997) - - - - - - - - - - - (10,042,997)
Ending Cash with TRAN 20,888,964 24,232,547 16,635,779 15,029,563 13,333,517 17,429,210 15,620,870 12,588,194 17,899,017 13,500,626 8,879,931 4,123,279 TRAN Balance 3,096,979 - - - - - - - 7,995,230 7,995,230 7,995,230 7,995,230 Ending Cash without TRAN 17,791,986 24,232,547 16,635,779 15,029,563 13,333,517 17,429,210 15,620,870 12,588,194 9,903,788 5,505,397 884,702 (3,871,950) Source: The District
Summary of Revenues, Expenditures & Changes in General Fund Balance Projected Alternate Cash Resources2010-11 2011-12 2012-13 2013-14 2014-15 Set-Aside 1 Maturity
(Audited) (Audited) (Audited) (Projected) (Projected) Fund Name Jul 31, 2014 Oct 01, 2014Beginning Fund Balance 20,652,081 20,129,350 18,077,983 11,609,722 7,781,226 11 - Adult Education (R) - 165,903
17 - Special Reserve Other than Cap Outlay (U) - 3,385,306 Total Revenues 94,870,305 93,131,206 89,669,420 87,160,662 93,286,602 25 - Capital Facilities (R) 64,881 64,881
Total Expenditures 96,093,193 95,436,645 90,633,314 92,728,593 88,063,017
Other Sources & Uses 700,157 1,043,412 2,006 1,739,435 -
Ending Fund Balance 20,129,350 18,867,323 17,116,095 7,781,226 13,004,811 Source: District Annual Financial Statements & the District.
Total Other Restricted Funds (R) 64,881 230,784 Total Other Unrestricted Funds (U) - 3,385,306 Grand Total 64,881 3,616,090
Excludes Bond Proceed, Bond Interest & Redemption and Debt Service Funds.Source: The District.
C-57 C-58

Azusa UnifiedLos Angeles
Fiscal Year 2014-15Jul 2014 Aug 2014 Sep 2014 Oct 2014 Nov 2014 Dec 2014 Jan 2015 Feb 2015 Mar 2015 Apr 2015 May 2015 Jun 2015 Accruals Total
Actual / Projected Projected Projected Projected Projected Projected Projected Projected Projected Projected Projected Projected Projected Projected 2014-15Beginning Cash 4,123,279 5,172,777 8,753,283 16,484,426 14,705,022 13,824,368 16,424,110 17,574,165 17,410,496 18,987,087 16,019,689 13,274,618 Receipts
LCFF/Revenue LimitApportionment 445,255 2,498,115 7,129,624 4,496,607 4,288,798 5,241,825 3,337,335 4,335,075 7,373,360 667,444 35,527 11,801,449 - 51,650,414 Property Taxes 97,048 - - - 207,809 1,887,799 1,159,272 405,268 - 2,271,569 1,409,280 - 560,065 7,998,110 Other - - - - - - - - - - - - - -
Federal Revenues 233,917 5,563 1,316,038 - 339,551 190,032 773,889 303,497 1,131,162 174,628 - 174,628 2,829,295 7,472,200 Other State Revenues 2,414,860 1,339,181 1,704,395 1,339,181 1,327,307 1,815,198 2,557,385 1,190,867 494,077 1,203,081 477,864 275,850 220,768 16,360,014 Other Local Revenues 759,255 342,433 329,196 59,369 258,478 133,863 210,262 346,001 153,057 142,633 640,713 145,000 4,450,887 7,971,147 Interfund Transfers In - - - - - - - - - - 1,726,000 - 108,717 1,834,717 Other Financing Sources - - - - - - - - - - - - - -
Total Receipts 3,950,335 4,185,292 10,479,253 5,895,157 6,421,943 9,268,717 8,038,143 6,580,708 9,151,656 4,459,355 4,289,384 12,396,927 8,169,732 93,286,602 Disbursements
Certificated Salaries 101,135 389,936 3,579,688 3,579,688 3,579,688 3,579,688 3,579,688 3,579,688 3,579,688 3,579,688 3,579,688 3,579,688 4,743,640 41,031,591 Classified Salaries - 647,867 936,430 1,243,410 1,243,410 1,243,410 1,243,410 1,243,410 1,243,410 1,243,410 1,243,410 1,243,410 1,198,326 13,973,313 Employee Benefits 451,734 207,443 1,218,294 1,218,294 1,218,294 1,218,294 1,218,294 1,218,294 1,218,294 1,218,294 1,218,294 1,218,294 907,464 13,749,581 Supplies and Services 181,467 793,228 1,417,415 1,557,576 800,323 615,485 800,862 675,264 1,442,039 1,290,361 643,063 588,655 3,762,795 14,568,533 Capital Outlay 10,440 - - 37,059 - - - - - - - - 31,195 78,694 Other Outgo - (1,600) 26,449 38,534 460,882 12,098 45,834 27,721 91,634 95,000 350,000 3,460,325 475,807 5,082,684 Interfund Transfers Out - - - - - - - - - - - - (325,734) (325,734) Other Financing Uses - - - - - - - - - - - - - -
Total Disbursements 744,776 2,036,874 7,178,276 7,674,561 7,302,597 6,668,975 6,888,088 6,744,377 7,575,065 7,426,753 7,034,455 10,090,372 10,793,493 88,158,662 Asset TransactionsDeferred Apportionment 10,799,756 - - - - - - - - - - - - 10,799,756 Accounts Receivable - 6,355,951 7,815,472 - - - - - - - - - - 14,171,423 Due From Other Funds - - - - - - - - - - - - - - Other - - - - - - - - - - - - - - SUBTOTAL ASSETS 10,799,756 6,355,951 7,815,472 - - - - - - - - - - 24,971,179 Accounts Payable 4,923,864 4,923,864 - - - - - - - - - - - 9,847,727 Due To Other Funds - - - - - - - - - - - - - - Current Loan - - - - - - - - - - - - - - Other - - 3,385,306 - - - - - - - - - - 3,385,306 SUBTOTAL LIABILITIES 4,923,864 4,923,864 3,385,306 - - - - - - - - - - 13,233,033
Total PY Transactions 5,875,893 1,432,088 4,430,166 - - - - - - - - - - 11,738,146 Net Increase/Decrease 9,081,452 3,580,506 7,731,143 (1,779,404) (880,654) 2,599,742 1,150,055 (163,669) 1,576,591 (2,967,398) (2,745,071) 2,306,555 (2,623,761)
FY TRAN Deposits - - - - - - - - - - - - - FY TRAN Repayments - - - - - - - - - - - - - CY TRAN Deposits - - - - - - - - - - - - - CY TRAN Repayments (8,031,954) - - - - - - - - - - - (8,031,954)
Ending Cash with TRAN 5,172,777 8,753,283 16,484,426 14,705,022 13,824,368 16,424,110 17,574,165 17,410,496 18,987,087 16,019,689 13,274,618 15,581,173 TRAN Balance - - - - - - - - - - - - Ending Cash without TRAN 5,172,777 8,753,283 16,484,426 14,705,022 13,824,368 16,424,110 17,574,165 17,410,496 18,987,087 16,019,689 13,274,618 15,581,173 Source: The District
057
C-58

Banning Unified Banning UnifiedRiverside Riverside
Fiscal Year 2013-14 Fiscal Year 2014-15Jul 2013 Aug 2013 Sep 2013 Oct 2013 Nov 2013 Dec 2013 Jan 2014 Feb 2014 Mar 2014 Apr 2014 May 2014 Jun 2014 Accruals Total
Actual / Projected Actual Actual Actual Actual Actual Actual Projected Projected Projected Projected Projected Projected Projected 2013-14Beginning Cash 3,135,079 5,329,290 3,776,133 4,415,249 3,151,275 2,833,128 5,019,048 4,930,897 461,737 4,329,574 3,821,733 1,358,959 Receipts
LCFF/Revenue LimitApportionment 929,922 929,922 2,690,611 1,669,961 1,673,859 2,686,713 1,728,541 1,673,859 2,686,713 1,037,793 33,477 1,012,854 4,004,989 22,759,214 Property Taxes - 244,648 293,348 - 203,826 1,789,819 806,482 - - 453,646 - 1,248,745 - 5,040,515 Other 3,915 (4,108) - 3,898 - - - - - - - - (3,705) -
Federal Revenues 23,986 110,126 185,497 27,219 30,450 538,452 309,191 93,835 798,486 902,828 543,397 75,000 744,840 4,383,307 Other State Revenues - - 452,400 66,194 456,755 131,470 385,693 244,403 366,775 373,620 292,288 300,000 721,303 3,790,901 Other Local Revenues 8,130 78,447 75,268 72,612 81,190 83,442 147,557 147,557 147,557 147,557 147,557 151,555 99,269 1,387,698 Interfund Transfers In - - - - - - - - - - - - - - Other Financing Sources - - - - - - - - - - - - - -
Total Receipts 965,953 1,359,035 3,697,124 1,839,884 2,446,080 5,229,896 3,377,464 2,159,654 3,999,531 2,915,444 1,016,719 2,788,154 5,566,696 37,361,634 Disbursements
Certificated Salaries 263,735 1,555,271 1,541,897 1,573,851 1,573,330 1,566,332 1,610,000 1,600,000 1,600,000 1,600,000 1,600,000 721,494 - 16,805,910 Classified Salaries 284,633 405,666 447,176 506,032 460,146 443,190 468,067 468,067 468,067 468,067 468,067 231,056 - 5,118,234 Employee Benefits 400,828 716,664 763,791 456,265 590,946 567,068 617,896 617,896 617,896 617,896 617,896 474,015 - 7,059,057 Supplies and Services 448,115 751,931 712,726 830,258 513,603 522,342 454,957 516,041 595,106 715,546 834,194 813,794 1,176,654 8,885,267 Capital Outlay - 14,800 500 4,000 7,004 49,923 304,695 4,916 - - - - - 385,838 Other Outgo - 2,445 - - 15,436 - 10,001 - - - - - (108,704) (80,822) Interfund Transfers Out - - - - - - - - - - - - - - Other Financing Uses - - - - - - - - - - - - - -
Total Disbursements 1,397,311 3,446,777 3,466,090 3,370,406 3,160,465 3,148,855 3,465,616 3,206,920 3,281,069 3,401,509 3,520,157 2,240,359 1,067,950 38,173,484 Asset TransactionsDeferred Apportionment 1,731,280 1,097,191 2,828,471 Accounts Receivable 1,030,178 814,819 433,097 464,756 411,230 104,879 - 39,893 14,156 55,989 118,428 118,428 - 3,605,853 Due From Other Funds - - - - - - - - - - - - - - Other - - - - - - - - - - - - - - SUBTOTAL ASSETS 2,761,458 1,912,010 433,097 464,756 411,230 104,879 - 39,893 14,156 55,989 118,428 118,428 - 6,434,324 Accounts Payable 586,425 181,690 25,015 198,208 14,992 - - 54,000 83,023 77,765 77,765 71,144 - 1,370,027 Due To Other Funds - - - - - - - - - - - - - - Current Loan - - - - - - - - - - - - - - Other - - - - - - - - - - - - - - SUBTOTAL LIABILITIES 586,425 181,690 25,015 198,208 14,992 - - 54,000 83,023 77,765 77,765 71,144 - 1,370,027
Total PY Transactions 2,175,033 1,730,320 408,082 266,548 396,238 104,879 - (14,107) (68,867) (21,776) 40,663 47,284 - 5,064,297 Net Increase/Decrease 1,743,675 (357,422) 639,116 (1,263,974) (318,147) 2,185,920 (88,152) (1,061,373) 649,595 (507,841) (2,462,775) 595,079 4,498,746
FY TRAN Deposits 3,382,536 - - - - - - - - - - - - 3,382,536 FY TRAN Repayments - - - - - - - (3,407,787) - - - - - (3,407,787) CY TRAN Deposits - - - - - - - - 3,218,242 - - - - 3,218,242 CY TRAN Repayments (2,932,000) (1,195,735) - - - - - - - - - - - (4,127,735)
Ending Cash with TRAN 5,329,290 3,776,133 4,415,249 3,151,275 2,833,128 5,019,048 4,930,897 461,737 4,329,574 3,821,733 1,358,959 1,954,038 TRAN Balance 4,546,451 3,382,536 3,382,536 3,382,536 3,382,536 3,382,536 3,382,536 - 3,218,242 3,218,242 3,218,242 3,218,242 Ending Cash without TRAN 782,839 393,597 1,032,713 (231,261) (549,408) 1,636,512 1,548,360 461,737 1,111,332 603,491 (1,859,284) (1,264,205) Source: The District
Summary of Revenues, Expenditures & Changes in General Fund Balance Projected Alternate Cash Resources2010-11 2011-12 2012-13 2013-14 2014-15 Set-Aside 1 Maturity
(Audited) (Audited) (Audited) (Projected) (Projected) Fund Name Jul 31, 2014 Oct 01, 2014Beginning Fund Balance 5,948,890 3,594,677 2,919,369 3,284,195 2,970,558 11 - Adult Education (R) 1,600 1,650
13 - Cafeteria Special Revenue (R) 1,800,000 1,810,000 Total Revenues 37,820,807 37,317,753 35,345,216 37,859,847 38,225,762 14 - Deferred Maintenance (R) 705 710
25 - Capital Facilities (R) 1,099,477 1,100,000 Total Expenditures 40,175,020 37,993,061 34,978,143 38,173,485 36,832,237 35 - County School Facilities (R) 450 460
Other Sources & Uses - - - - -
Ending Fund Balance 3,594,677 2,919,369 3,286,442 2,970,558 4,364,083 Source: District Annual Financial Statements & the District.
Total Other Restricted Funds (R) 2,902,232 2,912,820 Total Other Unrestricted Funds (U) - - Grand Total 2,902,232 2,912,820
Excludes Bond Proceed, Bond Interest & Redemption and Debt Service Funds.Source: The District.
C-59 C-60

Banning UnifiedRiverside
Fiscal Year 2014-15Jul 2014 Aug 2014 Sep 2014 Oct 2014 Nov 2014 Dec 2014 Jan 2015 Feb 2015 Mar 2015 Apr 2015 May 2015 Jun 2015 Accruals Total
Actual / Projected Projected Projected Projected Projected Projected Projected Projected Projected Projected Projected Projected Projected Projected 2014-15Beginning Cash 1,954,038 2,282,825 1,270,262 1,705,940 808,895 3,139 2,374,049 2,624,777 1,792,297 2,508,538 2,691,515 2,027,149 Receipts
LCFF/Revenue LimitApportionment 1,087,371 1,087,371 2,970,122 1,957,268 1,957,268 2,970,122 1,957,268 1,957,268 2,970,122 1,957,268 1,957,268 2,970,122 - 25,798,837 Property Taxes - 201,621 201,621 151,215 25,203 2,066,611 806,482 - - 453,646 - 1,134,116 - 5,040,515 Other - - - - - - - - - - - - - -
Federal Revenues 19,156 87,420 147,325 21,594 24,032 429,087 245,541 74,533 634,576 717,468 431,874 59,557 590,692 3,482,853 Other State Revenues - - 312,109 45,783 315,248 6,802 266,064 168,743 253,245 257,954 201,707 206,939 581,574 2,616,169 Other Local Revenues 7,596 72,737 69,776 67,330 75,312 83,551 136,849 136,849 136,849 136,849 136,849 140,583 86,255 1,287,388 Interfund Transfers In - - - - - - - - - - - - - - Other Financing Sources - - - - - - - - - - - - - -
Total Receipts 1,114,122 1,449,149 3,700,953 2,243,190 2,397,063 5,556,174 3,412,205 2,337,393 3,994,792 3,523,186 2,727,698 4,511,316 1,258,521 38,225,762 Disbursements
Certificated Salaries 275,609 1,623,813 1,609,769 1,643,123 1,643,123 1,671,211 1,681,744 1,671,211 1,671,211 1,671,211 1,671,211 721,500 - 17,554,736 Classified Salaries 289,582 413,020 455,207 515,103 468,228 476,561 476,561 476,561 476,561 476,561 476,561 207,812 - 5,208,317 Employee Benefits 366,865 655,578 698,852 417,244 540,609 565,153 565,153 565,153 565,153 565,153 565,153 388,825 - 6,458,893 Supplies and Services 375,683 627,076 600,256 708,337 545,895 468,721 382,620 440,715 502,760 612,507 705,533 687,555 865,996 7,523,654 Capital Outlay - 6,430 218 1,742 3,048 108,497 45,398 2,127 - - - - - 167,459 Other Outgo - 2,445 - - 15,435 - 10,001 - - - - - (108,704) (80,822) Interfund Transfers Out - - - - - - - - - - - - - - Other Financing Uses - - - - - - - - - - - - - -
Total Disbursements 1,307,740 3,328,362 3,364,302 3,285,549 3,216,339 3,290,143 3,161,477 3,155,766 3,215,685 3,325,432 3,418,458 2,005,692 757,292 36,832,237 Asset TransactionsDeferred Apportionment 4,004,989 - - - - - - - - - - - - 4,004,989 Accounts Receivable - 917,209 290,188 172,440 21,877 104,879 - 39,893 14,156 55,989 97,159 49,173 - 1,762,963 Due From Other Funds - - - - - - - - - - - - - - Other - - - - - - - - - - - - - - SUBTOTAL ASSETS 4,004,989 917,209 290,188 172,440 21,877 104,879 - 39,893 14,156 55,989 97,159 49,173 - 5,767,952 Accounts Payable 242,507 50,558 191,161 27,126 8,357 - - 54,000 77,023 70,765 70,765 73,444 - 865,706 Due To Other Funds - - - - - - - - - - - - - - Current Loan - - - - - - - - - - - - - - Other - - - - - - - - - - - - - - SUBTOTAL LIABILITIES 242,507 50,558 191,161 27,126 8,357 - - 54,000 77,023 70,765 70,765 73,444 - 865,706
Total PY Transactions 3,762,482 866,651 99,027 145,314 13,520 104,879 - (14,107) (62,867) (14,776) 26,394 (24,271) - 4,902,246 Net Increase/Decrease 3,568,864 (1,012,562) 435,678 (897,045) (805,756) 2,370,910 250,728 (832,480) 716,240 182,978 (664,366) 2,481,353 501,229
FY TRAN Deposits - - - - - - - - - - - - - FY TRAN Repayments - - - - - - - - - - - - - CY TRAN Deposits - - - - - - - - - - - - - CY TRAN Repayments (3,240,077) - - - - - - - - - - - (3,240,077)
Ending Cash with TRAN 2,282,825 1,270,262 1,705,940 808,895 3,139 2,374,049 2,624,777 1,792,297 2,508,538 2,691,515 2,027,149 4,508,502 TRAN Balance - - - - - - - - - - - - Ending Cash without TRAN 2,282,825 1,270,262 1,705,940 808,895 3,139 2,374,049 2,624,777 1,792,297 2,508,538 2,691,515 2,027,149 4,508,502 Source: The District
059
C-60

Chawanakee Unified Chawanakee UnifiedMadera Madera
Fiscal Year 2013-14 Fiscal Year 2014-15Jul 2013 Aug 2013 Sep 2013 Oct 2013 Nov 2013 Dec 2013 Jan 2014 Feb 2014 Mar 2014 Apr 2014 May 2014 Jun 2014 Accruals Total
Actual / Projected Actual Actual Actual Actual Actual Actual Projected Projected Projected Projected Projected Projected Projected 2013-14Beginning Cash 304,969 2,265,517 2,082,402 2,716,754 2,238,454 2,013,029 3,297,432 2,996,058 749,196 851,028 345,822 377,013 Receipts
LCFF/Revenue LimitApportionment 595,522 595,522 861,818 595,522 - 266,296 238,209 269,970 536,284 160,746 (11,713) 248,781 637,130 4,994,087 Property Taxes - - 95,097 - - 1,778,038 - - - - 537,902 798,543 - 3,209,581 Other - (214) (427) (285) (285) (311,032) (50,734) (50,734) (88,785) (44,392) (44,392) (44,392) - (635,672)
Federal Revenues - - 110,929 - 4,114 41,564 91,753 7,200 85,033 23,158 12,893 102,056 - 478,701 Other State Revenues 60,403 - 112,564 11,571 117,332 16,362 47,135 15,729 15,729 65,754 15,729 - - 478,308 Other Local Revenues 31,880 9,888 21,629 39,790 18,470 139,839 45,917 67,259 45,610 42,360 42,360 45,608 78,176 628,786 Interfund Transfers In - - - - - - - - - - - - - - Other Financing Sources - - - - - - - - - - - - - -
Total Receipts 687,805 605,196 1,201,611 646,598 139,631 1,931,066 372,280 309,424 593,872 247,627 552,780 1,150,596 715,306 9,153,791 Disbursements
Certificated Salaries 135,114 258,548 295,519 285,393 286,496 293,818 286,367 286,367 286,367 286,367 286,367 286,367 - 3,273,089 Classified Salaries 151,144 99,903 110,666 121,472 116,882 110,710 111,469 111,469 111,469 111,469 111,469 111,469 - 1,379,589 Employee Benefits 53,527 102,139 125,205 120,627 110,480 117,438 128,151 128,151 128,151 128,151 128,151 128,151 - 1,398,322 Supplies and Services 72,666 180,047 104,820 282,698 83,954 139,423 143,456 143,456 143,456 143,456 143,456 143,456 - 1,724,344 Capital Outlay - - - - - - 6,250 6,250 6,250 6,250 6,250 6,250 - 37,500 Other Outgo - - 667 352,887 3,219 - - - 436,000 29,900 29,900 29,900 - 882,473 Interfund Transfers Out - - 9,000 - - - 12,000 - - - - - - 21,000 Other Financing Uses - - - - - - - - - - - - - -
Total Disbursements 412,451 640,637 645,876 1,163,077 601,031 661,390 687,693 675,693 1,111,693 705,592 705,592 705,592 - 8,716,317 Asset TransactionsDeferred Apportionment 198,500 125,799 324,299 Accounts Receivable 348,827 66,676 118,431 30,628 - - - - - - 169,964 - - 734,526 Due From Other Funds - - - - 203,222 - - - - - - - - 203,222 Other - - - - - - - - - - - - - - SUBTOTAL ASSETS 547,327 192,475 118,431 30,628 203,222 - - - - - 169,964 - - 1,262,047 Accounts Payable 286,262 113,268 (23,734) (7,552) (32,753) (14,726) (14,039) (14,039) (14,039) 47,241 (14,039) (14,039) - 297,811 Due To Other Funds - - - - - - - - - - - - - - Current Loan - - - - - - - - - - - - - - Other - - 63,548 - - - - - - - - - - 63,548 SUBTOTAL LIABILITIES 286,262 113,268 39,814 (7,552) (32,753) (14,726) (14,039) (14,039) (14,039) 47,241 (14,039) (14,039) - 361,359
Total PY Transactions 261,065 79,207 78,618 38,180 235,975 14,726 14,039 14,039 14,039 (47,241) 184,003 14,039 - 900,688 Net Increase/Decrease 536,419 43,765 634,352 (478,300) (225,425) 1,284,403 (301,374) (352,230) (503,782) (505,206) 31,191 459,043 715,306
FY TRAN Deposits 1,872,129 - - - - - - - - - - - - 1,872,129 FY TRAN Repayments - - - - - - - (1,894,633) - - - - - (1,894,633) CY TRAN Deposits - - - - - - - - 605,614 - - - - 605,614 CY TRAN Repayments (448,000) (226,881) - - - - - - - - - - - (674,881)
Ending Cash with TRAN 2,265,517 2,082,402 2,716,754 2,238,454 2,013,029 3,297,432 2,996,058 749,196 851,028 345,822 377,013 836,056 TRAN Balance 2,079,024 1,872,129 1,872,129 1,872,129 1,872,129 1,872,129 1,872,129 - 605,614 605,614 605,614 605,614 Ending Cash without TRAN 186,493 210,273 844,625 366,325 140,901 1,425,303 1,123,929 749,196 245,414 (259,792) (228,602) 230,441 Source: The District
Summary of Revenues, Expenditures & Changes in General Fund Balance Projected Alternate Cash Resources2010-11 2011-12 2012-13 2013-14 2014-15 Set-Aside 1 Maturity
(Audited) (Audited) (Audited) (Projected) (Projected) Fund Name Jul 31, 2014 Oct 01, 2014Beginning Fund Balance 977,933 921,961 601,368 334,816 124,083 09 - Charter Schools Special Revenue (R) - 50,000
11 - Adult Education (R) 100 100 Total Revenues 8,798,490 8,721,447 8,131,306 8,634,548 8,844,494 12 - Child Development (R) 11,571 6,000
13 - Cafeteria Special Revenue (R) 16,261 15,000 Total Expenditures 8,994,107 9,081,415 8,406,827 8,824,281 8,881,766 14 - Deferred Maintenance (R) 30,981 20,981
17 - Special Reserve Other than Cap Outlay (U) 1 1 Other Sources & Uses 139,643 29,900 (26,556) (21,000) (20,000) 20 - Special Reserve for Post Employment Benefits (U) 401 401
25 - Capital Facilities (R) 54,374 40,374 Ending Fund Balance 921,959 591,893 299,291 124,083 66,811 35 - County School Facilities (R) 6,777 6,777
Source: District Annual Financial Statements & the District. 40 - Special Reserve for Cap Outlay (U) 7,042 7,042 Total Other Restricted Funds (R) 120,065 139,232 Total Other Unrestricted Funds (U) 7,443 7,443 Grand Total 127,508 146,675
Excludes Bond Proceed, Bond Interest & Redemption and Debt Service Funds.Source: The District.
C-61 C-62

Chawanakee UnifiedMadera
Fiscal Year 2014-15Jul 2014 Aug 2014 Sep 2014 Oct 2014 Nov 2014 Dec 2014 Jan 2015 Feb 2015 Mar 2015 Apr 2015 May 2015 Jun 2015 Accruals Total
Actual / Projected Projected Projected Projected Projected Projected Projected Projected Projected Projected Projected Projected Projected Projected 2014-15Beginning Cash 836,056 1,190,379 1,163,780 1,440,203 1,109,034 445,037 2,039,266 1,695,177 1,060,839 666,477 153,219 47,752 Receipts
LCFF/Revenue LimitApportionment 580,676 580,676 846,990 580,676 - 266,314 232,270 263,240 529,554 232,270 263,240 529,554 - 4,905,460 Property Taxes - - - - - 1,962,874 - - - - 561,677 685,030 - 3,209,581 Other (39,787) (54,387) (54,387) (54,387) (54,387) (54,387) (54,387) (54,387) (54,387) (54,387) (54,387) (54,387) - (638,044)
Federal Revenues 12,942 14,154 37,454 9,436 9,436 35,223 97,074 16,512 89,895 11,185 17,549 99,065 - 449,925 Other State Revenues - 31,938 31,938 31,938 31,938 31,938 31,938 31,938 31,938 31,938 31,938 - 35,486 354,862 Other Local Revenues 31,042 52,384 49,167 45,917 45,917 49,167 45,917 67,259 45,610 42,360 42,360 45,608 - 562,711 Interfund Transfers In - - - - - - - - - - - - - - Other Financing Sources - - - - - - - - - - - - - -
Total Receipts 584,873 624,764 911,162 613,580 32,904 2,291,129 352,812 324,562 642,610 263,366 862,377 1,304,870 35,486 8,844,494 Disbursements
Certificated Salaries 135,114 295,599 295,599 295,599 295,599 295,599 295,599 295,599 295,599 295,599 295,599 295,599 - 3,386,703 Classified Salaries 118,687 118,687 118,687 118,687 118,687 118,687 118,687 118,687 118,687 118,687 118,687 118,687 - 1,424,244 Employee Benefits 53,527 131,642 131,642 131,642 131,642 131,642 131,642 131,642 131,642 131,642 131,642 131,642 - 1,501,589 Supplies and Services 57,676 158,761 158,761 158,761 158,761 158,761 158,761 158,761 158,761 158,761 158,761 158,761 - 1,804,047 Capital Outlay - - - - 6,250 6,250 6,250 6,250 6,250 6,250 6,250 6,250 - 50,000 Other Outgo - - 667 278,240 - - - - 340,072 18,444 18,444 18,444 - 674,312 Interfund Transfers Out - - 8,000 - - - - 12,000 - - - - - 20,000 Other Financing Uses 14,990 25,881 - - - - - - - - - - - 40,871
Total Disbursements 379,994 730,570 713,356 982,929 710,939 710,939 710,939 722,939 1,051,011 729,383 729,383 729,383 - 8,901,766 Asset TransactionsDeferred Apportionment 637,130 - - - - - - - - - - - - 637,130 Accounts Receivable (89,803) 192,475 118,431 30,628 - - - - - - - - - 251,731 Due From Other Funds - - - - - - - - - - - - - - Other - - - - - - - - - - - - - - SUBTOTAL ASSETS 547,327 192,475 118,431 30,628 - - - - - - - - - 888,861 Accounts Payable 286,262 113,268 (23,734) (7,552) (14,039) (14,039) (14,039) (14,039) (14,039) 47,241 (14,039) (14,039) - 317,213 Due To Other Funds - - - - - - - - - - - - - - Current Loan - - - - - - - - - - - - - - Other - - 63,548 - - - - - - - - - - 63,548 SUBTOTAL LIABILITIES 286,262 113,268 39,814 (7,552) (14,039) (14,039) (14,039) (14,039) (14,039) 47,241 (14,039) (14,039) - 380,761
Total PY Transactions 261,065 79,207 78,618 38,180 14,039 14,039 14,039 14,039 14,039 (47,241) 14,039 14,039 - 508,101 Net Increase/Decrease 465,945 (26,599) 276,423 (331,170) (663,997) 1,594,229 (344,088) (384,338) (394,362) (513,258) 147,032 589,526 35,486
FY TRAN Deposits 500,000 - - - - - - - - - - - 500,000 FY TRAN Repayments - - - - - - - (250,000) - - (252,500) - (502,500) CY TRAN Deposits - - - - - - - - - - - - - CY TRAN Repayments (611,621) - - - - - - - - - - - (611,621)
Ending Cash with TRAN 1,190,379 1,163,780 1,440,203 1,109,034 445,037 2,039,266 1,695,177 1,060,839 666,477 153,219 47,752 637,278 TRAN Balance 500,000 500,000 500,000 500,000 500,000 500,000 500,000 250,000 250,000 250,000 - - Ending Cash without TRAN 690,379 663,780 940,203 609,034 (54,963) 1,539,266 1,195,177 810,839 416,477 (96,781) 47,752 637,278 Source: The District
061
C-62

Jurupa Unified Jurupa UnifiedRiverside Riverside
Fiscal Year 2013-14 Fiscal Year 2014-15Jul 2013 Aug 2013 Sep 2013 Oct 2013 Nov 2013 Dec 2013 Jan 2014 Feb 2014 Mar 2014 Apr 2014 May 2014 Jun 2014 Accruals Total
Actual / Projected Actual Actual Actual Actual Actual Actual Projected Projected Projected Projected Projected Projected Projected 2013-14Beginning Cash 17,468,123 37,634,002 32,689,468 37,166,953 32,447,405 32,433,154 38,703,365 39,829,541 15,705,489 27,426,465 21,514,208 10,837,393 Receipts
LCFF/Revenue LimitApportionment 4,637,892 4,637,892 12,893,682 8,348,205 8,348,205 12,913,575 8,341,114 8,348,205 12,893,682 5,194,439 259,722 4,545,477 21,904,941 113,267,031 Property Taxes - 788,638 682,840 - 474,542 4,561,955 3,195,084 (0) (0) 1,539,352 2,373,435 724,547 - 14,340,392 Other 19,460 (19,460) - - - - - - - - - - - -
Federal Revenues 138,812 134,141 1,995,094 57,693 253,206 2,627,084 1,277,221 12,048 1,434,739 1,213,436 1,842,988 329,887 2,297,894 13,614,243 Other State Revenues - - 3,045,600 884,796 2,658,355 14,421 610,564 - 1,145,342 647,267 149,198 30,866 2,192,577 11,378,986 Other Local Revenues 3,487 603,899 48,274 580,679 544,653 509,418 1,965,955 565,294 548,720 472,815 119,708 275,917 3,445,993 9,684,812 Interfund Transfers In - - - - - - - - - - 52,545 421,038 - 473,583 Other Financing Sources - - - - - - - - - - - - - -
Total Receipts 4,799,651 6,145,109 18,665,491 9,871,372 12,278,962 20,626,453 15,389,938 8,925,547 16,022,483 9,067,309 4,797,596 6,327,732 29,841,405 162,759,048 Disbursements
Certificated Salaries 872,150 7,705,092 7,401,092 7,936,096 7,521,872 7,911,504 7,482,129 7,521,804 7,576,189 7,615,904 7,513,696 2,958,673 112,602 80,128,803 Classified Salaries 1,576,481 1,798,555 1,603,963 2,933,615 1,500,424 2,402,036 1,869,693 1,501,604 1,986,359 2,068,000 2,100,366 1,085,313 1,279,139 23,705,548 Employee Benefits 3,270,728 2,696,044 2,646,784 2,290,747 2,329,023 2,608,307 1,727,909 2,417,700 2,448,968 2,590,495 2,686,096 1,779,694 647,197 30,139,694 Supplies and Services 1,686,664 1,229,747 1,686,999 1,921,559 1,801,327 1,260,049 2,526,598 2,215,495 2,359,222 2,492,849 2,859,916 2,506,069 4,208,958 28,755,453 Capital Outlay - - - - 14,858 - 15,024 11,416 - 13,757 - - - 55,054 Other Outgo 54,926 424,293 204,527 196,406 72,702 211,569 209,894 16,414 208,411 198,561 195,556 198,977 64,220 2,256,456 Interfund Transfers Out - - - - - - - - - - - 1,398,719 1,335,094 2,733,813 Other Financing Uses - - - - - - - - - - - - - -
Total Disbursements 7,460,949 13,853,732 13,543,365 15,278,425 13,240,205 14,393,465 13,831,246 13,684,433 14,579,149 14,979,566 15,355,630 9,927,445 7,647,210 167,774,820 Asset TransactionsDeferred Apportionment 9,551,241 6,053,053 15,604,294 Accounts Receivable 8,030,785 1,714,891 186,527 769,857 1,059,118 37,223 59,217 67,332 36,765 - - 116,434 - 12,078,149 Due From Other Funds - - - - - - - - - - - - - - Other 45,340 10,975 (8,240) (5,483) (7,427) - - - - - - - - 35,166 SUBTOTAL ASSETS 17,627,366 7,778,919 178,287 764,375 1,051,692 37,223 59,217 67,332 36,765 - - 116,434 - 27,717,608 Accounts Payable 4,836,393 777,520 128,528 76,870 104,699 - 491,733 - - - 118,781 67,051 - 6,601,574 Due To Other Funds - - - - - - - - - - - - - - Current Loan - - - - - - - - - - - - - - Other - - 694,401 - - - - - - - - - - 694,401 SUBTOTAL LIABILITIES 4,836,393 777,520 822,929 76,870 104,699 - 491,733 - - - 118,781 67,051 - 7,295,975
Total PY Transactions 12,790,973 7,001,399 (644,641) 687,505 946,992 37,223 (432,516) 67,332 36,765 - (118,781) 49,383 - 20,421,634 Net Increase/Decrease 10,129,674 (707,223) 4,477,485 (4,719,548) (14,251) 6,270,211 1,126,177 (4,691,555) 1,480,098 (5,912,257) (10,676,815) (3,550,330) 22,194,195
FY TRAN Deposits 19,358,205 - - - - - - - - - - - - 19,358,205 FY TRAN Repayments - - - - - - - (19,432,498) - - - - - (19,432,498) CY TRAN Deposits - - - - - - - - 10,240,878 - - - - 10,240,878 CY TRAN Repayments (9,322,000) (4,237,311) - - - - - - - - - - - (13,559,311)
Ending Cash with TRAN 37,634,002 32,689,468 37,166,953 32,447,405 32,433,154 38,703,365 39,829,541 15,705,489 27,426,465 21,514,208 10,837,393 7,287,063 TRAN Balance 23,541,613 19,358,205 19,358,205 19,358,205 19,358,205 19,358,205 19,358,205 - 10,240,878 10,240,878 10,240,878 10,240,878 Ending Cash without TRAN 14,092,389 13,331,263 17,808,748 13,089,200 13,074,949 19,345,160 20,471,337 15,705,489 17,185,587 11,273,330 596,515 (2,953,814) Source: The District
Summary of Revenues, Expenditures & Changes in General Fund Balance Projected Alternate Cash Resources2010-11 2011-12 2012-13 2013-14 2014-15 Set-Aside 1 Maturity
(Audited) (Audited) (Audited) (Projected) (Projected) Fund Name Jul 31, 2014 Oct 01, 2014Beginning Fund Balance 18,229,371 24,546,861 26,853,675 24,281,639 19,269,843 11 - Adult Education (R) 13,000 41,000
12 - Child Development (R) 80,000 80,000 Total Revenues 156,425,678 156,722,371 150,498,401 162,285,465 167,311,030 13 - Cafeteria Special Revenue (R) 3,400,000 2,600,000
25 - Capital Facilities (R) 1,000,000 1,000,000 Total Expenditures 148,566,301 151,090,496 150,766,849 165,037,031 160,341,154 30 - State School Building Lease-Purchase (R) 92,100 92,100
35 - County School Facilities (R) 1,000,000 1,000,000 Other Sources & Uses (1,541,887) (3,015,103) (2,303,588) (2,260,230) - 40 - Special Reserve for Cap Outlay (R) 2,000,000 1,800,000
Ending Fund Balance 24,546,861 27,163,633 24,281,639 19,269,843 26,239,720 Source: District Annual Financial Statements & the District.
Total Other Restricted Funds (R) 7,585,100 6,613,100 Total Other Unrestricted Funds (U) - - Grand Total 7,585,100 6,613,100
Excludes Bond Proceed, Bond Interest & Redemption and Debt Service Funds.Source: The District.
C-63 C-64

Jurupa UnifiedRiverside
Fiscal Year 2014-15Jul 2014 Aug 2014 Sep 2014 Oct 2014 Nov 2014 Dec 2014 Jan 2015 Feb 2015 Mar 2015 Apr 2015 May 2015 Jun 2015 Accruals Total
Actual / Projected Projected Projected Projected Projected Projected Projected Projected Projected Projected Projected Projected Projected Projected 2014-15Beginning Cash 7,287,063 12,789,079 15,334,207 20,355,803 16,635,856 17,010,905 23,056,758 26,004,146 22,845,480 26,507,147 24,490,594 23,990,474 Receipts
LCFF/Revenue LimitApportionment 5,117,263 5,117,263 14,226,737 9,211,073 9,211,073 14,226,737 9,211,073 9,211,073 14,226,737 9,211,073 9,211,073 14,226,737 - 122,407,913 Property Taxes - 854,939 744,624 - 510,205 5,129,632 3,447,333 - - 1,558,195 2,564,816 675,677 - 15,485,422 Other 27,579 (27,579) - - - - - - - - - - - -
Federal Revenues 125,120 121,440 1,797,061 51,520 228,159 2,465,593 1,480,582 11,040 2,182,233 73,600 1,470,769 332,426 1,925,861 12,265,403 Other State Revenues - - 1,952,758 567,518 1,704,013 358,164 394,637 - 380,047 416,520 95,559 19,695 1,405,665 7,294,575 Other Local Revenues 3,748 584,740 46,854 562,250 526,641 466,667 1,914,461 560,376 543,508 461,982 116,198 248,327 3,336,015 9,371,767 Interfund Transfers In - - - - - - - - - - 50,271 435,679 - 485,950 Other Financing Sources - - - - - - - - - - - - - -
Total Receipts 5,273,709 6,650,802 18,768,035 10,392,361 12,180,091 22,646,793 16,448,086 9,782,489 17,332,526 11,721,370 13,508,686 15,938,542 6,667,541 167,311,030 Disbursements
Certificated Salaries 894,405 7,893,739 7,581,928 8,123,494 7,705,011 8,459,922 7,663,984 7,705,011 7,581,928 7,795,272 7,516,284 3,027,848 114,878 82,063,704 Classified Salaries 1,558,070 1,778,308 1,586,185 2,900,587 1,483,095 3,078,652 1,848,597 1,483,095 1,963,402 1,808,767 1,841,568 838,780 1,265,199 23,434,306 Employee Benefits 3,039,303 2,507,074 2,459,454 2,128,912 2,165,328 3,252,194 1,605,088 2,246,563 2,277,376 2,131,714 2,221,352 1,378,191 602,258 28,014,806 Supplies and Services 1,271,724 927,254 1,271,724 1,447,209 1,356,217 1,579,364 1,776,514 1,620,527 1,650,858 1,752,683 2,077,655 1,839,342 3,093,734 21,664,803 Capital Outlay - - - - 7,098 - 7,176 5,454 - 6,572 - - - 26,300 Other Outgo 61,297 474,229 228,538 219,457 81,224 230,808 234,592 (52,468) 230,808 242,916 239,637 243,421 87,531 2,521,990 Interfund Transfers Out - - - - - - - - - - - 1,331,690 1,283,556 2,615,246 Other Financing Uses - - - - - - - - - - - - - -
Total Disbursements 6,824,798 13,580,604 13,127,829 14,819,659 12,797,973 16,600,940 13,135,951 13,008,182 13,704,372 13,737,923 13,896,495 8,659,271 6,447,156 160,341,154 Asset TransactionsDeferred Apportionment 21,904,941 - - - - - - - - - - - - 21,904,941 Accounts Receivable - 10,196,217 184,326 787,574 1,089,198 - 100,541 67,028 33,514 - - 117,298 - 12,575,696 Due From Other Funds - - - - - - - - - - - - - - Other 50,271 16,757 (16,757) - - - - - - - - - - 50,271 SUBTOTAL ASSETS 21,955,212 10,212,974 167,569 787,574 1,089,198 - 100,541 67,028 33,514 - - 117,298 - 34,530,908 Accounts Payable 4,620,802 738,045 128,356 80,222 96,267 - 465,289 - - - 112,311 64,178 - 6,305,470 Due To Other Funds - - - - - - - - - - - - - - Current Loan - - - - - - - - - - - - - - Other - - 657,823 - - - - - - - - - - 657,823 SUBTOTAL LIABILITIES 4,620,802 738,045 786,178 80,222 96,267 - 465,289 - - - 112,311 64,178 - 6,963,293
Total PY Transactions 17,334,409 9,474,929 (618,609) 707,352 992,931 - (364,748) 67,028 33,514 - (112,311) 53,120 - 27,567,615 Net Increase/Decrease 15,783,321 2,545,127 5,021,596 (3,719,947) 375,050 6,045,853 2,947,387 (3,158,666) 3,661,668 (2,016,553) (500,120) 7,332,391 220,385
FY TRAN Deposits - - - - - - - - - - - - - FY TRAN Repayments - - - - - - - - - - - - - CY TRAN Deposits - - - - - - - - - - - - - CY TRAN Repayments (10,281,305) - - - - - - - - - - - (10,281,305)
Ending Cash with TRAN 12,789,079 15,334,207 20,355,803 16,635,856 17,010,905 23,056,758 26,004,146 22,845,480 26,507,147 24,490,594 23,990,474 31,322,865 TRAN Balance - - - - - - - - - - - - Ending Cash without TRAN 12,789,079 15,334,207 20,355,803 16,635,856 17,010,905 23,056,758 26,004,146 22,845,480 26,507,147 24,490,594 23,990,474 31,322,865 Source: The District
063
C-64
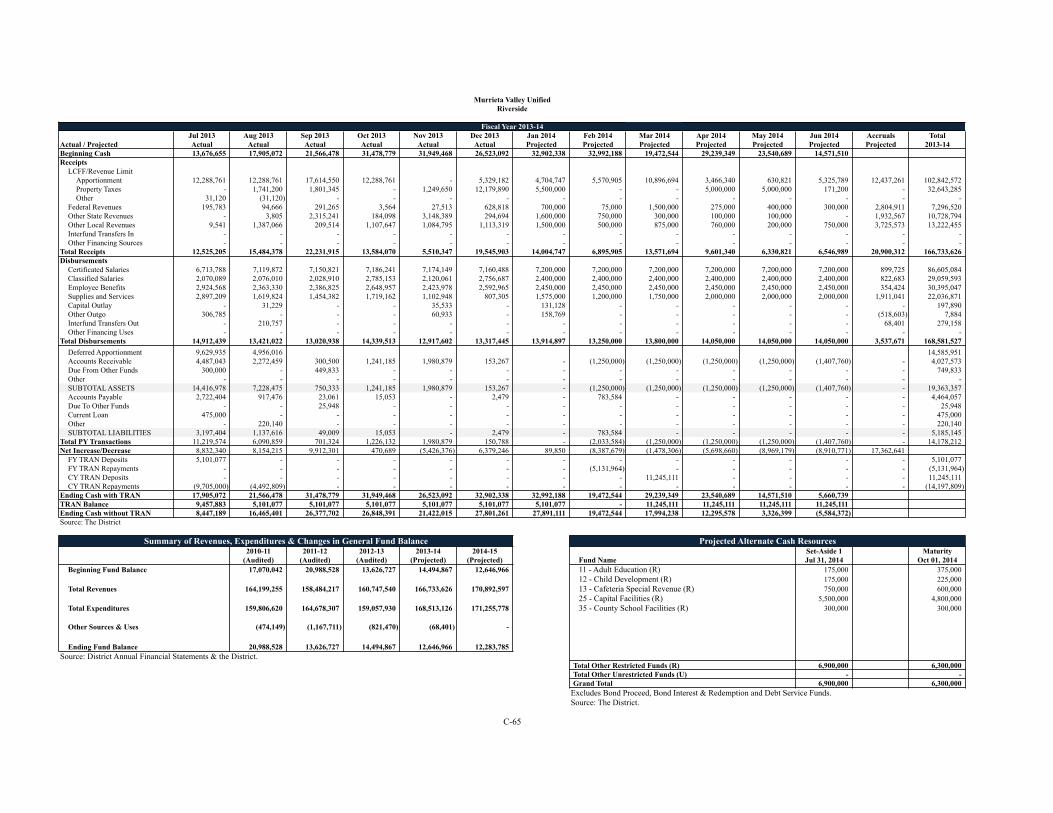
Murrieta Valley Unified Murrieta Valley UnifiedRiverside Riverside
Fiscal Year 2013-14 Fiscal Year 2014-15Jul 2013 Aug 2013 Sep 2013 Oct 2013 Nov 2013 Dec 2013 Jan 2014 Feb 2014 Mar 2014 Apr 2014 May 2014 Jun 2014 Accruals Total
Actual / Projected Actual Actual Actual Actual Actual Actual Projected Projected Projected Projected Projected Projected Projected 2013-14Beginning Cash 13,676,655 17,905,072 21,566,478 31,478,779 31,949,468 26,523,092 32,902,338 32,992,188 19,472,544 29,239,349 23,540,689 14,571,510 Receipts
LCFF/Revenue LimitApportionment 12,288,761 12,288,761 17,614,550 12,288,761 - 5,329,182 4,704,747 5,570,905 10,896,694 3,466,340 630,821 5,325,789 12,437,261 102,842,572 Property Taxes - 1,741,200 1,801,345 - 1,249,650 12,179,890 5,500,000 - - 5,000,000 5,000,000 171,200 - 32,643,285 Other 31,120 (31,120) - - - - - - - - - - - -
Federal Revenues 195,783 94,666 291,265 3,564 27,513 628,818 700,000 75,000 1,500,000 275,000 400,000 300,000 2,804,911 7,296,520 Other State Revenues - 3,805 2,315,241 184,098 3,148,389 294,694 1,600,000 750,000 300,000 100,000 100,000 - 1,932,567 10,728,794 Other Local Revenues 9,541 1,387,066 209,514 1,107,647 1,084,795 1,113,319 1,500,000 500,000 875,000 760,000 200,000 750,000 3,725,573 13,222,455 Interfund Transfers In - - - - - - - - - - - - - - Other Financing Sources - - - - - - - - - - - - - -
Total Receipts 12,525,205 15,484,378 22,231,915 13,584,070 5,510,347 19,545,903 14,004,747 6,895,905 13,571,694 9,601,340 6,330,821 6,546,989 20,900,312 166,733,626 Disbursements
Certificated Salaries 6,713,788 7,119,872 7,150,821 7,186,241 7,174,149 7,160,488 7,200,000 7,200,000 7,200,000 7,200,000 7,200,000 7,200,000 899,725 86,605,084 Classified Salaries 2,070,089 2,076,010 2,028,910 2,785,153 2,120,061 2,756,687 2,400,000 2,400,000 2,400,000 2,400,000 2,400,000 2,400,000 822,683 29,059,593 Employee Benefits 2,924,568 2,363,330 2,386,825 2,648,957 2,423,978 2,592,965 2,450,000 2,450,000 2,450,000 2,450,000 2,450,000 2,450,000 354,424 30,395,047 Supplies and Services 2,897,209 1,619,824 1,454,382 1,719,162 1,102,948 807,305 1,575,000 1,200,000 1,750,000 2,000,000 2,000,000 2,000,000 1,911,041 22,036,871 Capital Outlay - 31,229 - - 35,533 - 131,128 - - - - - - 197,890 Other Outgo 306,785 - - - 60,933 - 158,769 - - - - - (518,603) 7,884 Interfund Transfers Out - 210,757 - - - - - - - - - - 68,401 279,158 Other Financing Uses - - - - - - - - - - - - - -
Total Disbursements 14,912,439 13,421,022 13,020,938 14,339,513 12,917,602 13,317,445 13,914,897 13,250,000 13,800,000 14,050,000 14,050,000 14,050,000 3,537,671 168,581,527 Asset TransactionsDeferred Apportionment 9,629,935 4,956,016 14,585,951 Accounts Receivable 4,487,043 2,272,459 300,500 1,241,185 1,980,879 153,267 - (1,250,000) (1,250,000) (1,250,000) (1,250,000) (1,407,760) - 4,027,573 Due From Other Funds 300,000 - 449,833 - - - - - - - - - - 749,833 Other - - - - - - - - - - - - - - SUBTOTAL ASSETS 14,416,978 7,228,475 750,333 1,241,185 1,980,879 153,267 - (1,250,000) (1,250,000) (1,250,000) (1,250,000) (1,407,760) - 19,363,357 Accounts Payable 2,722,404 917,476 23,061 15,053 - 2,479 - 783,584 - - - - - 4,464,057 Due To Other Funds - - 25,948 - - - - - - - - - - 25,948 Current Loan 475,000 - - - - - - - - - - - - 475,000 Other - 220,140 - - - - - - - - - - - 220,140 SUBTOTAL LIABILITIES 3,197,404 1,137,616 49,009 15,053 - 2,479 - 783,584 - - - - - 5,185,145
Total PY Transactions 11,219,574 6,090,859 701,324 1,226,132 1,980,879 150,788 - (2,033,584) (1,250,000) (1,250,000) (1,250,000) (1,407,760) - 14,178,212 Net Increase/Decrease 8,832,340 8,154,215 9,912,301 470,689 (5,426,376) 6,379,246 89,850 (8,387,679) (1,478,306) (5,698,660) (8,969,179) (8,910,771) 17,362,641
FY TRAN Deposits 5,101,077 - - - - - - - - - - - - 5,101,077 FY TRAN Repayments - - - - - - - (5,131,964) - - - - - (5,131,964) CY TRAN Deposits - - - - - - - - 11,245,111 - - - - 11,245,111 CY TRAN Repayments (9,705,000) (4,492,809) - - - - - - - - - - - (14,197,809)
Ending Cash with TRAN 17,905,072 21,566,478 31,478,779 31,949,468 26,523,092 32,902,338 32,992,188 19,472,544 29,239,349 23,540,689 14,571,510 5,660,739 TRAN Balance 9,457,883 5,101,077 5,101,077 5,101,077 5,101,077 5,101,077 5,101,077 - 11,245,111 11,245,111 11,245,111 11,245,111 Ending Cash without TRAN 8,447,189 16,465,401 26,377,702 26,848,391 21,422,015 27,801,261 27,891,111 19,472,544 17,994,238 12,295,578 3,326,399 (5,584,372) Source: The District
Summary of Revenues, Expenditures & Changes in General Fund Balance Projected Alternate Cash Resources2010-11 2011-12 2012-13 2013-14 2014-15 Set-Aside 1 Maturity
(Audited) (Audited) (Audited) (Projected) (Projected) Fund Name Jul 31, 2014 Oct 01, 2014Beginning Fund Balance 17,070,042 20,988,528 13,626,727 14,494,867 12,646,966 11 - Adult Education (R) 175,000 375,000
12 - Child Development (R) 175,000 225,000 Total Revenues 164,199,255 158,484,217 160,747,540 166,733,626 170,892,597 13 - Cafeteria Special Revenue (R) 750,000 600,000
25 - Capital Facilities (R) 5,500,000 4,800,000 Total Expenditures 159,806,620 164,678,307 159,057,930 168,513,126 171,255,778 35 - County School Facilities (R) 300,000 300,000
Other Sources & Uses (474,149) (1,167,711) (821,470) (68,401) -
Ending Fund Balance 20,988,528 13,626,727 14,494,867 12,646,966 12,283,785 Source: District Annual Financial Statements & the District.
Total Other Restricted Funds (R) 6,900,000 6,300,000 Total Other Unrestricted Funds (U) - - Grand Total 6,900,000 6,300,000
Excludes Bond Proceed, Bond Interest & Redemption and Debt Service Funds.Source: The District.
C-65 C-66
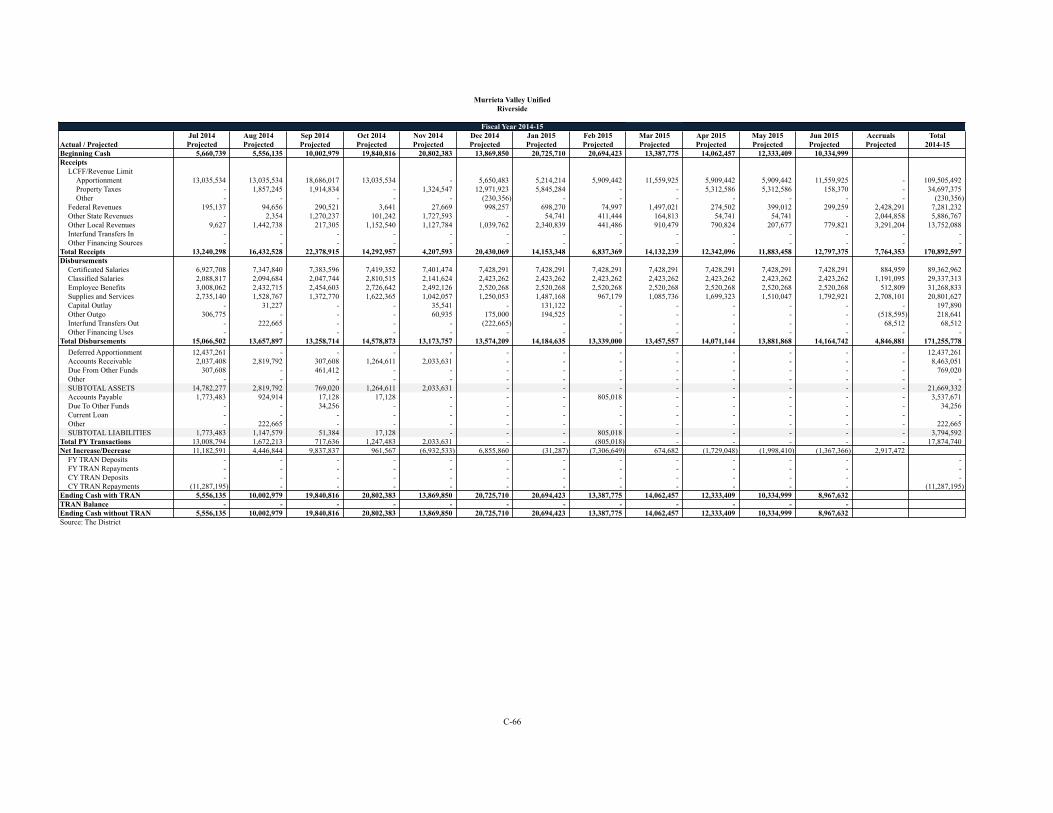
Murrieta Valley UnifiedRiverside
Fiscal Year 2014-15Jul 2014 Aug 2014 Sep 2014 Oct 2014 Nov 2014 Dec 2014 Jan 2015 Feb 2015 Mar 2015 Apr 2015 May 2015 Jun 2015 Accruals Total
Actual / Projected Projected Projected Projected Projected Projected Projected Projected Projected Projected Projected Projected Projected Projected 2014-15Beginning Cash 5,660,739 5,556,135 10,002,979 19,840,816 20,802,383 13,869,850 20,725,710 20,694,423 13,387,775 14,062,457 12,333,409 10,334,999 Receipts
LCFF/Revenue LimitApportionment 13,035,534 13,035,534 18,686,017 13,035,534 - 5,650,483 5,214,214 5,909,442 11,559,925 5,909,442 5,909,442 11,559,925 - 109,505,492 Property Taxes - 1,857,245 1,914,834 - 1,324,547 12,971,923 5,845,284 - - 5,312,586 5,312,586 158,370 - 34,697,375 Other - - - - - (230,356) - - - - - - - (230,356)
Federal Revenues 195,137 94,656 290,521 3,641 27,669 998,257 698,270 74,997 1,497,021 274,502 399,012 299,259 2,428,291 7,281,232 Other State Revenues - 2,354 1,270,237 101,242 1,727,593 - 54,741 411,444 164,813 54,741 54,741 - 2,044,858 5,886,767 Other Local Revenues 9,627 1,442,738 217,305 1,152,540 1,127,784 1,039,762 2,340,839 441,486 910,479 790,824 207,677 779,821 3,291,204 13,752,088 Interfund Transfers In - - - - - - - - - - - - - - Other Financing Sources - - - - - - - - - - - - - -
Total Receipts 13,240,298 16,432,528 22,378,915 14,292,957 4,207,593 20,430,069 14,153,348 6,837,369 14,132,239 12,342,096 11,883,458 12,797,375 7,764,353 170,892,597 Disbursements
Certificated Salaries 6,927,708 7,347,840 7,383,596 7,419,352 7,401,474 7,428,291 7,428,291 7,428,291 7,428,291 7,428,291 7,428,291 7,428,291 884,959 89,362,962 Classified Salaries 2,088,817 2,094,684 2,047,744 2,810,515 2,141,624 2,423,262 2,423,262 2,423,262 2,423,262 2,423,262 2,423,262 2,423,262 1,191,095 29,337,313 Employee Benefits 3,008,062 2,432,715 2,454,603 2,726,642 2,492,126 2,520,268 2,520,268 2,520,268 2,520,268 2,520,268 2,520,268 2,520,268 512,809 31,268,833 Supplies and Services 2,735,140 1,528,767 1,372,770 1,622,365 1,042,057 1,250,053 1,487,168 967,179 1,085,736 1,699,323 1,510,047 1,792,921 2,708,101 20,801,627 Capital Outlay - 31,227 - - 35,541 - 131,122 - - - - - - 197,890 Other Outgo 306,775 - - - 60,935 175,000 194,525 - - - - - (518,595) 218,641 Interfund Transfers Out - 222,665 - - - (222,665) - - - - - - 68,512 68,512 Other Financing Uses - - - - - - - - - - - - - -
Total Disbursements 15,066,502 13,657,897 13,258,714 14,578,873 13,173,757 13,574,209 14,184,635 13,339,000 13,457,557 14,071,144 13,881,868 14,164,742 4,846,881 171,255,778 Asset TransactionsDeferred Apportionment 12,437,261 - - - - - - - - - - - - 12,437,261 Accounts Receivable 2,037,408 2,819,792 307,608 1,264,611 2,033,631 - - - - - - - - 8,463,051 Due From Other Funds 307,608 - 461,412 - - - - - - - - - - 769,020 Other - - - - - - - - - - - - - - SUBTOTAL ASSETS 14,782,277 2,819,792 769,020 1,264,611 2,033,631 - - - - - - - - 21,669,332 Accounts Payable 1,773,483 924,914 17,128 17,128 - - - 805,018 - - - - - 3,537,671 Due To Other Funds - - 34,256 - - - - - - - - - - 34,256 Current Loan - - - - - - - - - - - - - - Other - 222,665 - - - - - - - - - - - 222,665 SUBTOTAL LIABILITIES 1,773,483 1,147,579 51,384 17,128 - - - 805,018 - - - - - 3,794,592
Total PY Transactions 13,008,794 1,672,213 717,636 1,247,483 2,033,631 - - (805,018) - - - - - 17,874,740 Net Increase/Decrease 11,182,591 4,446,844 9,837,837 961,567 (6,932,533) 6,855,860 (31,287) (7,306,649) 674,682 (1,729,048) (1,998,410) (1,367,366) 2,917,472
FY TRAN Deposits - - - - - - - - - - - - - FY TRAN Repayments - - - - - - - - - - - - - CY TRAN Deposits - - - - - - - - - - - - - CY TRAN Repayments (11,287,195) - - - - - - - - - - - (11,287,195)
Ending Cash with TRAN 5,556,135 10,002,979 19,840,816 20,802,383 13,869,850 20,725,710 20,694,423 13,387,775 14,062,457 12,333,409 10,334,999 8,967,632 TRAN Balance - - - - - - - - - - - - Ending Cash without TRAN 5,556,135 10,002,979 19,840,816 20,802,383 13,869,850 20,725,710 20,694,423 13,387,775 14,062,457 12,333,409 10,334,999 8,967,632 Source: The District
065
C-66

Yosemite Unified Yosemite UnifiedMadera Madera
Fiscal Year 2013-14 Fiscal Year 2014-15Jul 2013 Aug 2013 Sep 2013 Oct 2013 Nov 2013 Dec 2013 Jan 2014 Feb 2014 Mar 2014 Apr 2014 May 2014 Jun 2014 Accruals Total
Actual / Projected Actual Actual Actual Actual Actual Actual Projected Projected Projected Projected Projected Projected Projected 2013-14Beginning Cash 2,303,252 3,304,857 1,951,567 2,374,381 1,872,580 1,452,600 4,863,832 4,150,463 1,650,791 2,373,807 1,383,766 521,186 Receipts
LCFF/Revenue LimitApportionment 355,328 355,328 1,144,734 639,590 639,590 1,144,680 639,590 639,590 1,144,680 383,104 (21,874) 469,644 1,300,000 8,833,984 Property Taxes - - 196,251 - - 3,440,812 - - - - 646,069 1,938,208 - 6,221,340 Other (75) (59,232) (118,615) (79,077) (79,077) (79,077) (86,105) (86,105) (86,105) (86,105) (86,105) (86,105) - (931,785)
Federal Revenues 900 - 56,897 - - 76,133 90,498 35,898 102,262 54,001 17,949 100,383 - 534,921 Other State Revenues - - 176,700 26,652 245,527 5,408 113,000 38,000 38,000 115,580 38,000 - - 796,868 Other Local Revenues 40,975 27,731 53,123 (9,979) 63,120 90,264 85,201 122,574 93,055 78,974 78,974 93,055 - 817,067 Interfund Transfers In - - - - - - - - - - - - - - Other Financing Sources - - - - - - - - - - - - - -
Total Receipts 397,128 323,827 1,509,090 577,186 869,160 4,678,221 842,184 749,958 1,291,892 545,553 673,013 2,515,184 1,300,000 16,272,396 Disbursements
Certificated Salaries 85,315 603,701 601,629 633,031 626,903 617,141 648,785 648,785 648,785 648,785 648,785 648,785 - 7,060,431 Classified Salaries 157,870 260,575 254,205 259,307 271,768 264,697 273,607 273,607 273,607 273,607 273,607 273,607 - 3,110,063 Employee Benefits 105,791 253,613 213,070 242,282 241,452 224,878 252,563 252,563 252,563 252,563 252,563 252,563 - 2,796,465 Supplies and Services 275,464 190,767 176,569 177,033 268,550 203,519 342,876 342,876 342,876 342,876 342,876 342,876 - 3,349,160 Capital Outlay - - - - - - 1,250 1,250 1,250 1,250 1,250 1,250 - 7,500 Other Outgo - - - - - - (5,974) (5,974) (5,974) (5,974) (5,974) (5,974) - (35,842) Interfund Transfers Out - - - 100,000 - - 1,725 1,725 1,725 1,725 1,725 1,725 - 110,350 Other Financing Uses 14,365 58,436 - - - - 19,960 - - - - - - 92,761
Total Disbursements 638,805 1,367,092 1,245,472 1,411,653 1,408,673 1,310,234 1,534,793 1,514,833 1,514,833 1,514,833 1,514,833 1,514,833 - 16,490,889 Asset TransactionsDeferred Apportionment 995,000 305,000 1,300,000 Accounts Receivable 428,872 137,341 125,745 215,238 60,899 4,075 20,337 20,337 20,337 20,337 20,337 20,337 - 1,094,192 Due From Other Funds - - - 75,116 - - - - - - - - - 75,116 Other - - - - - - 872 872 872 872 872 872 - 5,234 SUBTOTAL ASSETS 1,423,872 442,341 125,745 290,354 60,899 4,075 21,209 21,209 21,209 21,209 21,209 21,209 - 2,474,542 Accounts Payable 625,649 157,931 (45,272) (43,758) (58,634) (39,171) 41,970 41,970 41,970 41,970 41,970 41,970 - 848,564 Due To Other Funds - - - 1,447 - - - - - - - - - 1,447 Current Loan - - - - - - - - - - - - - - Other 900 - 11,821 - - - - - - - - - - 12,721 SUBTOTAL LIABILITIES 626,549 157,931 (33,451) (42,312) (58,634) (39,171) 41,970 41,970 41,970 41,970 41,970 41,970 - 862,732
Total PY Transactions 797,323 284,410 159,196 332,666 119,533 43,246 (20,761) (20,761) (20,761) (20,761) (20,761) (20,761) - 1,611,810 Net Increase/Decrease 555,645 (758,855) 422,814 (501,801) (419,980) 3,411,232 (713,369) (785,636) (243,702) (990,041) (862,581) 979,590 1,300,000
FY TRAN Deposits 1,696,959 - - - - - - - - - - - - 1,696,959 FY TRAN Repayments - - - - - - - (1,714,036) - - - - - (1,714,036) CY TRAN Deposits - - - - - - - - 966,718 - - - - 966,718 CY TRAN Repayments (1,251,000) (594,436) - - - - - - - - - - - (1,845,436)
Ending Cash with TRAN 3,304,857 1,951,567 2,374,381 1,872,580 1,452,600 4,863,832 4,150,463 1,650,791 2,373,807 1,383,766 521,186 1,500,776 TRAN Balance 2,256,630 1,696,959 1,696,959 1,696,959 1,696,959 1,696,959 1,696,959 - 966,718 966,718 966,718 966,718 Ending Cash without TRAN 1,048,227 254,608 677,422 175,620 (244,360) 3,166,873 2,453,503 1,650,791 1,407,089 417,049 (445,532) 534,058 Source: The District
Summary of Revenues, Expenditures & Changes in General Fund Balance Projected Alternate Cash Resources2010-11 2011-12 2012-13 2013-14 2014-15 Set-Aside 1 Maturity
(Audited) (Audited) (Audited) (Projected) (Projected) Fund Name Jul 31, 2014 Oct 01, 2014Beginning Fund Balance 4,416,965 4,162,275 3,244,745 2,111,408 1,977,384 11 - Adult Education (R) - -
13 - Cafeteria Special Revenue (R) 30,000 30,000 Total Revenues 17,927,142 17,288,869 15,992,751 16,279,007 15,914,965 20 - Special Reserve for Post Employment Benefits (U) 177,000 177,000
30 - State School Building Lease-Purchase (R) - - Total Expenditures 17,689,413 18,138,637 16,712,302 16,302,681 16,590,306 40 - Special Reserve for Cap Outlay (U) 40,000 40,000
Other Sources & Uses (492,419) (67,762) (187,422) (110,350) -
Ending Fund Balance 4,162,275 3,244,745 2,337,772 1,977,384 1,302,043 Source: District Annual Financial Statements & the District.
Total Other Restricted Funds (R) 30,000 30,000 Total Other Unrestricted Funds (U) 217,000 217,000 Grand Total 247,000 247,000
Excludes Bond Proceed, Bond Interest & Redemption and Debt Service Funds.Source: The District.
C-67 C-68
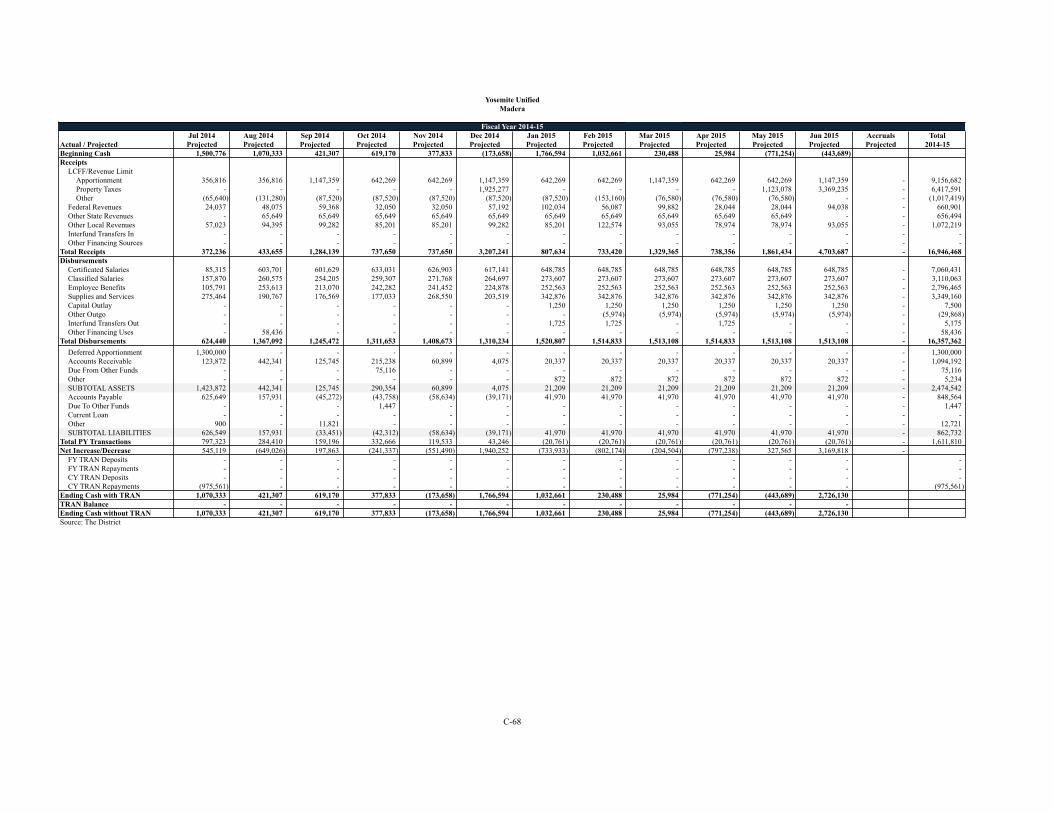
Yosemite UnifiedMadera
Fiscal Year 2014-15Jul 2014 Aug 2014 Sep 2014 Oct 2014 Nov 2014 Dec 2014 Jan 2015 Feb 2015 Mar 2015 Apr 2015 May 2015 Jun 2015 Accruals Total
Actual / Projected Projected Projected Projected Projected Projected Projected Projected Projected Projected Projected Projected Projected Projected 2014-15Beginning Cash 1,500,776 1,070,333 421,307 619,170 377,833 (173,658) 1,766,594 1,032,661 230,488 25,984 (771,254) (443,689) Receipts
LCFF/Revenue LimitApportionment 356,816 356,816 1,147,359 642,269 642,269 1,147,359 642,269 642,269 1,147,359 642,269 642,269 1,147,359 - 9,156,682 Property Taxes - - - - - 1,925,277 - - - - 1,123,078 3,369,235 - 6,417,591 Other (65,640) (131,280) (87,520) (87,520) (87,520) (87,520) (87,520) (153,160) (76,580) (76,580) (76,580) - - (1,017,419)
Federal Revenues 24,037 48,075 59,368 32,050 32,050 57,192 102,034 56,087 99,882 28,044 28,044 94,038 - 660,901 Other State Revenues - 65,649 65,649 65,649 65,649 65,649 65,649 65,649 65,649 65,649 65,649 - - 656,494 Other Local Revenues 57,023 94,395 99,282 85,201 85,201 99,282 85,201 122,574 93,055 78,974 78,974 93,055 - 1,072,219 Interfund Transfers In - - - - - - - - - - - - - - Other Financing Sources - - - - - - - - - - - - - -
Total Receipts 372,236 433,655 1,284,139 737,650 737,650 3,207,241 807,634 733,420 1,329,365 738,356 1,861,434 4,703,687 - 16,946,468 Disbursements
Certificated Salaries 85,315 603,701 601,629 633,031 626,903 617,141 648,785 648,785 648,785 648,785 648,785 648,785 - 7,060,431 Classified Salaries 157,870 260,575 254,205 259,307 271,768 264,697 273,607 273,607 273,607 273,607 273,607 273,607 - 3,110,063 Employee Benefits 105,791 253,613 213,070 242,282 241,452 224,878 252,563 252,563 252,563 252,563 252,563 252,563 - 2,796,465 Supplies and Services 275,464 190,767 176,569 177,033 268,550 203,519 342,876 342,876 342,876 342,876 342,876 342,876 - 3,349,160 Capital Outlay - - - - - - 1,250 1,250 1,250 1,250 1,250 1,250 - 7,500 Other Outgo - - - - - - - (5,974) (5,974) (5,974) (5,974) (5,974) - (29,868) Interfund Transfers Out - - - - - - 1,725 1,725 - 1,725 - - - 5,175 Other Financing Uses - 58,436 - - - - - - - - - - - 58,436
Total Disbursements 624,440 1,367,092 1,245,472 1,311,653 1,408,673 1,310,234 1,520,807 1,514,833 1,513,108 1,514,833 1,513,108 1,513,108 - 16,357,362 Asset TransactionsDeferred Apportionment 1,300,000 - - - - - - - - - - - - 1,300,000 Accounts Receivable 123,872 442,341 125,745 215,238 60,899 4,075 20,337 20,337 20,337 20,337 20,337 20,337 - 1,094,192 Due From Other Funds - - - 75,116 - - - - - - - - - 75,116 Other - - - - - - 872 872 872 872 872 872 - 5,234 SUBTOTAL ASSETS 1,423,872 442,341 125,745 290,354 60,899 4,075 21,209 21,209 21,209 21,209 21,209 21,209 - 2,474,542 Accounts Payable 625,649 157,931 (45,272) (43,758) (58,634) (39,171) 41,970 41,970 41,970 41,970 41,970 41,970 - 848,564 Due To Other Funds - - - 1,447 - - - - - - - - - 1,447 Current Loan - - - - - - - - - - - - - - Other 900 - 11,821 - - - - - - - - - - 12,721 SUBTOTAL LIABILITIES 626,549 157,931 (33,451) (42,312) (58,634) (39,171) 41,970 41,970 41,970 41,970 41,970 41,970 - 862,732
Total PY Transactions 797,323 284,410 159,196 332,666 119,533 43,246 (20,761) (20,761) (20,761) (20,761) (20,761) (20,761) - 1,611,810 Net Increase/Decrease 545,119 (649,026) 197,863 (241,337) (551,490) 1,940,252 (733,933) (802,174) (204,504) (797,238) 327,565 3,169,818 -
FY TRAN Deposits - - - - - - - - - - - - - FY TRAN Repayments - - - - - - - - - - - - - CY TRAN Deposits - - - - - - - - - - - - - CY TRAN Repayments (975,561) - - - - - - - - - - - (975,561)
Ending Cash with TRAN 1,070,333 421,307 619,170 377,833 (173,658) 1,766,594 1,032,661 230,488 25,984 (771,254) (443,689) 2,726,130 TRAN Balance - - - - - - - - - - - - Ending Cash without TRAN 1,070,333 421,307 619,170 377,833 (173,658) 1,766,594 1,032,661 230,488 25,984 (771,254) (443,689) 2,726,130 Source: The District
067
C-68

CERTAIN BACKGROUND INFORMATIONAND PROJECTED CASH FLOWS FOR SERIES M DISTRICTS

Center Joint Unified Center Joint UnifiedSacramento Sacramento
Fiscal Year 2013-14 Fiscal Year 2014-15Jul 2013 Aug 2013 Sep 2013 Oct 2013 Nov 2013 Dec 2013 Jan 2014 Feb 2014 Mar 2014 Apr 2014 May 2014 Jun 2014 Accruals Total
Actual / Projected Actual Actual Actual Actual Actual Actual Projected Projected Projected Projected Projected Projected Projected 2013-14Beginning Cash 2,326,511 5,517,236 5,479,224 1,756,630 1,094,709 720,392 2,657,399 2,612,526 745,377 3,977,575 3,069,415 828,387 Receipts
LCFF/Revenue LimitApportionment 988,861 988,861 2,839,026 1,779,950 1,779,950 2,839,025 1,779,950 1,466,847 2,422,050 717,670 511,679 1,566,770 4,000,536 23,681,175 Property Taxes (12,135) 51,861 716 29,534 - - 2,762,611 - - 1,619,373 638,522 - - 5,090,482 Other 46 - - - - - (60,889) - - - (60,890) (48,611) - (170,344)
Federal Revenues 7,133 10,534 281,088 - 3,060 325,655 316,465 40,627 463,783 274,660 201,577 178,324 655,194 2,758,100 Other State Revenues 126,321 105,632 490,758 - 627,191 133,111 571,426 40,685 - - - - - 2,095,124 Other Local Revenues 106,948 177,141 184,696 (235,365) 156,106 188,784 271,548 218,951 185,096 367,863 355,809 264,664 697,860 2,940,101 Interfund Transfers In - - - - - - - - - - - - - - Other Financing Sources - - - - - - - - - - - - - -
Total Receipts 1,217,174 1,334,029 3,796,284 1,574,119 2,566,307 3,486,575 5,641,111 1,767,110 3,070,929 2,979,566 1,646,697 1,961,147 5,353,590 36,394,638 Disbursements
Certificated Salaries 596,289 1,562,080 1,584,830 1,624,126 1,606,590 172,490 3,177,426 1,685,529 1,724,759 1,826,344 1,826,344 658,196 - 18,045,003 Classified Salaries 242,783 529,596 539,689 552,289 541,460 531,448 603,075 527,190 527,190 581,904 581,903 385,996 - 6,144,523 Employee Benefits 246,848 598,242 605,819 609,168 603,832 241,534 1,018,232 620,313 621,229 678,251 678,251 428,090 - 6,949,809 Supplies and Services 2,392 338,063 485,999 641,654 226,295 272,778 801,227 801,227 801,227 801,227 801,227 801,252 - 6,774,568 Capital Outlay - 18,487 (1,000) - - - - - - - - 1,013 - 18,500 Other Outgo 14,256 - 8,500 1,587 - - - - - - - 146,770 - 171,113 Interfund Transfers Out - - - - - - 86,024 - - - - 86,024 - 172,048 Other Financing Uses - - - - - - - - - - - - - -
Total Disbursements 1,102,568 3,046,468 3,223,837 3,428,824 2,978,177 1,218,250 5,685,984 3,634,259 3,674,405 3,887,726 3,887,725 2,507,341 - 38,275,564 Asset TransactionsDeferred Apportionment 2,108,163 1,336,038 3,444,201 Accounts Receivable 2,418,685 (4,483) (15,995) 978,483 (257) (7,864) - - - - - - - 3,368,569 Due From Other Funds - - - - - - - - - - - - - - Other - - - - - - - - - - - - - - SUBTOTAL ASSETS 4,526,848 1,331,555 (15,995) 978,483 (257) (7,864) - - - - - - - 6,812,770 Accounts Payable 1,450,729 (342,872) 4,279,046 (214,301) (37,810) 323,454 - - - - - - - 5,458,246 Due To Other Funds - - - - - - - - - - - - - - Current Loan - - - - - - - - - - - - - - Other - - - - - - - - - - - - - - SUBTOTAL LIABILITIES 1,450,729 (342,872) 4,279,046 (214,301) (37,810) 323,454 - - - - - - - 5,458,246
Total PY Transactions 3,076,119 1,674,427 (4,295,041) 1,192,784 37,553 (331,318) - - - - - - - 1,354,524 Net Increase/Decrease 3,190,725 (38,012) (3,722,594) (661,921) (374,317) 1,937,007 (44,873) (1,867,149) (603,476) (908,160) (2,241,028) (546,194) 5,353,590
FY TRAN Deposits - - - - - - - - - - - - - - FY TRAN Repayments - - - - - - - - - - - - - - CY TRAN Deposits - - - - - - - - 3,835,674 - - - - 3,835,674 CY TRAN Repayments - - - - - - - - - - - - - -
Ending Cash with TRAN 5,517,236 5,479,224 1,756,630 1,094,709 720,392 2,657,399 2,612,526 745,377 3,977,575 3,069,415 828,387 282,193 TRAN Balance - - - - - - - - 3,835,674 3,835,674 3,835,674 3,835,674 Ending Cash without TRAN 5,517,236 5,479,224 1,756,630 1,094,709 720,392 2,657,399 2,612,526 745,377 141,901 (766,259) (3,007,287) (3,553,481) Source: The District
Summary of Revenues, Expenditures & Changes in General Fund Balance Projected Alternate Cash Resources2010-11 2011-12 2012-13 2013-14 2014-15 Set-Aside 1 Maturity
(Audited) (Audited) (Audited) (Projected) (Projected) Fund Name Jul 31, 2014 Dec 31, 2014Beginning Fund Balance 6,515,972 6,382,358 6,826,228 4,168,818 2,287,892 11 - Adult Education (R) 65,000 121,000
12 - Child Development (R) 50,000 100,000 Total Revenues 37,842,917 36,087,405 34,947,824 36,394,638 36,244,091 13 - Cafeteria Special Revenue (R) 100,000 10,000
14 - Deferred Maintenance (R) 50,000 100,000 Total Expenditures 37,980,901 35,372,670 34,802,617 38,103,516 36,746,184 17 - Special Reserve Other than Cap Outlay (U) 1,019,416 19,416
35 - County School Facilities (R) 1,049,250 1,049,250 Other Sources & Uses 4,370 (270,865) (70,384) (172,048) -
Ending Fund Balance 6,382,358 6,826,228 6,901,051 2,287,892 1,785,799 Source: District Annual Financial Statements & the District.
Total Other Restricted Funds (R) 1,314,250 1,380,250 Total Other Unrestricted Funds (U) 1,019,416 19,416 Grand Total 2,333,666 1,399,666
Excludes Bond Proceed, Bond Interest & Redemption and Debt Service Funds.Source: The District.
C-70 C-71

Center Joint UnifiedSacramento
Fiscal Year 2014-15Jul 2014 Aug 2014 Sep 2014 Oct 2014 Nov 2014 Dec 2014 Jan 2015 Feb 2015 Mar 2015 Apr 2015 May 2015 Jun 2015 Accruals Total
Actual / Projected Projected Projected Projected Projected Projected Projected Projected Projected Projected Projected Projected Projected Projected 2014-15Beginning Cash 282,193 3,112,505 2,638,508 2,891,349 2,505,358 1,666,538 4,725,800 1,689,168 (76,349) (483,496) (53,650) (775,297) Receipts
LCFF/Revenue LimitApportionment 988,861 988,861 2,839,026 1,779,950 1,779,950 2,839,026 1,779,950 1,284,915 2,240,118 1,779,950 1,779,950 2,839,026 - 22,919,583 Property Taxes - - - 214,442 - - 2,714,456 - - 1,571,218 590,366 - - 5,090,482 Other - - - - - - (85,499) - - - (85,499) - - (170,998)
Federal Revenues - - 166,158 130,959 29,835 103,411 308,732 2,250 486,694 266,927 193,844 170,594 644,217 2,503,621 Other State Revenues 257,692 263,530 253,551 677,714 396,965 159,538 381,357 - - - - - - 2,390,347 Other Local Revenues 165,760 73,174 168,733 104,531 185,301 301,187 171,983 154,425 120,570 303,337 291,283 234,779 698,259 2,973,322 Interfund Transfers In - - - - - 1,000,000 - - - - - - - 1,000,000 Other Financing Sources - - - - - - - - - - - - - -
Total Receipts 1,412,313 1,325,565 3,427,468 2,907,596 2,392,051 4,403,162 5,270,979 1,441,590 2,847,382 3,921,432 2,769,944 3,244,399 1,342,476 36,706,357 Disbursements
Certificated Salaries 740,533 1,632,969 1,631,605 1,704,777 1,664,764 188,856 3,133,112 1,641,215 1,680,445 1,782,030 1,782,035 599,876 - 18,182,217 Classified Salaries 267,280 497,929 523,738 554,614 541,465 509,737 609,486 533,530 533,530 619,256 619,256 398,162 - 6,207,983 Employee Benefits 293,816 601,399 598,965 613,877 604,323 224,988 1,038,670 612,043 620,235 669,981 669,981 420,815 - 6,969,093 Supplies and Services 420,319 420,319 420,319 420,319 420,319 420,319 420,319 420,319 420,319 420,319 420,319 420,326 - 5,043,835 Capital Outlay - - - - - - - - - - - - - - Other Outgo - - - - - - - - - - - 171,008 - 171,008 Interfund Transfers Out - - - - - - 86,024 - - - - 86,024 - 172,048 Other Financing Uses - - - - - - - - - - - - - -
Total Disbursements 1,721,948 3,152,616 3,174,627 3,293,587 3,230,871 1,343,900 5,287,611 3,207,107 3,254,529 3,491,586 3,491,591 2,096,211 - 36,746,184 Asset TransactionsDeferred Apportionment 4,000,536 - - - - - - - - - - - - 4,000,536 Accounts Receivable - 1,353,054 - - - - - - - - - - - 1,353,054 Due From Other Funds - - - - - - - - - - - - - - Other - - - - - - - - - - - - - - SUBTOTAL ASSETS 4,000,536 1,353,054 - - - - - - - - - - - 5,353,590 Accounts Payable - - - - - - - - - - - - - - Due To Other Funds - - - - - - - - - - - - - - Current Loan - - - - - - - - - - - - - - Other - - - - - - - - - - - - - - SUBTOTAL LIABILITIES - - - - - - - - - - - - - -
Total PY Transactions 4,000,536 1,353,054 - - - - - - - - - - - 5,353,590 Net Increase/Decrease 3,690,901 (473,997) 252,841 (385,991) (838,820) 3,059,262 (16,632) (1,765,517) (407,147) 429,846 (721,647) 1,148,188 1,342,476
FY TRAN Deposits 3,000,000 - - - - - - - - - - - 3,000,000 FY TRAN Repayments - - - - - - (3,020,000) - - - - - (3,020,000) CY TRAN Deposits - - - - - - - - - - - - - CY TRAN Repayments (3,860,589) - - - - - - - - - - - (3,860,589)
Ending Cash with TRAN 3,112,505 2,638,508 2,891,349 2,505,358 1,666,538 4,725,800 1,689,168 (76,349) (483,496) (53,650) (775,297) 372,891 TRAN Balance 3,000,000 3,000,000 3,000,000 3,000,000 3,000,000 3,000,000 - - - - - - Ending Cash without TRAN 112,505 (361,492) (108,651) (494,642) (1,333,462) 1,725,800 1,689,168 (76,349) (483,496) (53,650) (775,297) 372,891 Source: The District
070
C-71
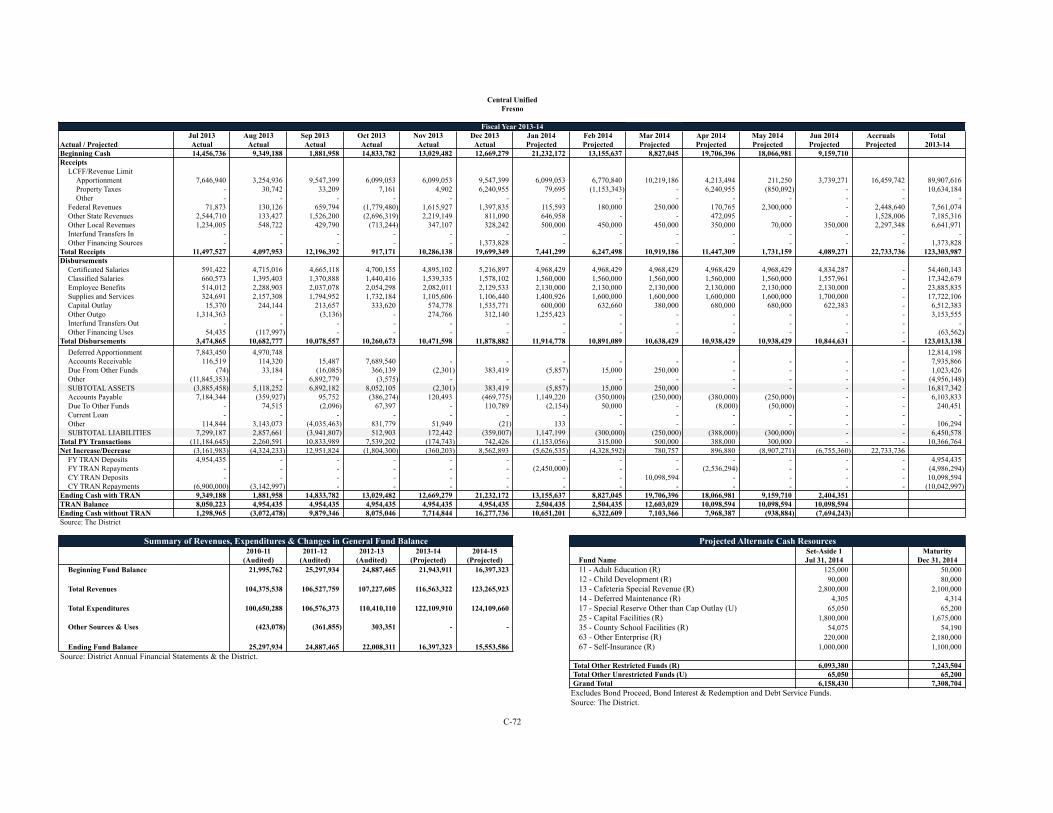
Central Unified Central UnifiedFresno Fresno
Fiscal Year 2013-14 Fiscal Year 2014-15Jul 2013 Aug 2013 Sep 2013 Oct 2013 Nov 2013 Dec 2013 Jan 2014 Feb 2014 Mar 2014 Apr 2014 May 2014 Jun 2014 Accruals Total
Actual / Projected Actual Actual Actual Actual Actual Actual Projected Projected Projected Projected Projected Projected Projected 2013-14Beginning Cash 14,456,736 9,349,188 1,881,958 14,833,782 13,029,482 12,669,279 21,232,172 13,155,637 8,827,045 19,706,396 18,066,981 9,159,710 Receipts
LCFF/Revenue LimitApportionment 7,646,940 3,254,936 9,547,399 6,099,053 6,099,053 9,547,399 6,099,053 6,770,840 10,219,186 4,213,494 211,250 3,739,271 16,459,742 89,907,616 Property Taxes - 30,742 33,209 7,161 4,902 6,240,955 79,695 (1,153,343) - 6,240,955 (850,092) - - 10,634,184 Other - - - - - - - - - - - - - -
Federal Revenues 71,873 130,126 659,794 (1,779,480) 1,615,927 1,397,835 115,593 180,000 250,000 170,765 2,300,000 - 2,448,640 7,561,074 Other State Revenues 2,544,710 133,427 1,526,200 (2,696,319) 2,219,149 811,090 646,958 - - 472,095 - - 1,528,006 7,185,316 Other Local Revenues 1,234,005 548,722 429,790 (713,244) 347,107 328,242 500,000 450,000 450,000 350,000 70,000 350,000 2,297,348 6,641,971 Interfund Transfers In - - - - - - - - - - - - - - Other Financing Sources - - - - - 1,373,828 - - - - - - - 1,373,828
Total Receipts 11,497,527 4,097,953 12,196,392 917,171 10,286,138 19,699,349 7,441,299 6,247,498 10,919,186 11,447,309 1,731,159 4,089,271 22,733,736 123,303,987 Disbursements
Certificated Salaries 591,422 4,715,016 4,665,118 4,700,155 4,895,102 5,216,897 4,968,429 4,968,429 4,968,429 4,968,429 4,968,429 4,834,287 - 54,460,143 Classified Salaries 660,573 1,395,403 1,370,888 1,440,416 1,539,335 1,578,102 1,560,000 1,560,000 1,560,000 1,560,000 1,560,000 1,557,961 - 17,342,679 Employee Benefits 514,012 2,288,903 2,037,078 2,054,298 2,082,011 2,129,533 2,130,000 2,130,000 2,130,000 2,130,000 2,130,000 2,130,000 - 23,885,835 Supplies and Services 324,691 2,157,308 1,794,952 1,732,184 1,105,606 1,106,440 1,400,926 1,600,000 1,600,000 1,600,000 1,600,000 1,700,000 - 17,722,106 Capital Outlay 15,370 244,144 213,657 333,620 574,778 1,535,771 600,000 632,660 380,000 680,000 680,000 622,383 - 6,512,383 Other Outgo 1,314,363 - (3,136) - 274,766 312,140 1,255,423 - - - - - - 3,153,555 Interfund Transfers Out - - - - - - - - - - - - - - Other Financing Uses 54,435 (117,997) - - - - - - - - - - - (63,562)
Total Disbursements 3,474,865 10,682,777 10,078,557 10,260,673 10,471,598 11,878,882 11,914,778 10,891,089 10,638,429 10,938,429 10,938,429 10,844,631 - 123,013,138 Asset TransactionsDeferred Apportionment 7,843,450 4,970,748 12,814,198 Accounts Receivable 116,519 114,320 15,487 7,689,540 - - - - - - - - - 7,935,866 Due From Other Funds (74) 33,184 (16,085) 366,139 (2,301) 383,419 (5,857) 15,000 250,000 - - - - 1,023,426 Other (11,845,353) - 6,892,779 (3,575) - - - - - - - - - (4,956,148) SUBTOTAL ASSETS (3,885,458) 5,118,252 6,892,182 8,052,105 (2,301) 383,419 (5,857) 15,000 250,000 - - - - 16,817,342 Accounts Payable 7,184,344 (359,927) 95,752 (386,274) 120,493 (469,775) 1,149,220 (350,000) (250,000) (380,000) (250,000) - - 6,103,833 Due To Other Funds - 74,515 (2,096) 67,397 - 110,789 (2,154) 50,000 - (8,000) (50,000) - - 240,451 Current Loan - - - - - - - - - - - - - - Other 114,844 3,143,073 (4,035,463) 831,779 51,949 (21) 133 - - - - - - 106,294 SUBTOTAL LIABILITIES 7,299,187 2,857,661 (3,941,807) 512,903 172,442 (359,007) 1,147,199 (300,000) (250,000) (388,000) (300,000) - - 6,450,578
Total PY Transactions (11,184,645) 2,260,591 10,833,989 7,539,202 (174,743) 742,426 (1,153,056) 315,000 500,000 388,000 300,000 - - 10,366,764 Net Increase/Decrease (3,161,983) (4,324,233) 12,951,824 (1,804,300) (360,203) 8,562,893 (5,626,535) (4,328,592) 780,757 896,880 (8,907,271) (6,755,360) 22,733,736
FY TRAN Deposits 4,954,435 - - - - - - - - - - - - 4,954,435 FY TRAN Repayments - - - - - - (2,450,000) - - (2,536,294) - - - (4,986,294) CY TRAN Deposits - - - - - - - - 10,098,594 - - - - 10,098,594 CY TRAN Repayments (6,900,000) (3,142,997) - - - - - - - - - - - (10,042,997)
Ending Cash with TRAN 9,349,188 1,881,958 14,833,782 13,029,482 12,669,279 21,232,172 13,155,637 8,827,045 19,706,396 18,066,981 9,159,710 2,404,351 TRAN Balance 8,050,223 4,954,435 4,954,435 4,954,435 4,954,435 4,954,435 2,504,435 2,504,435 12,603,029 10,098,594 10,098,594 10,098,594 Ending Cash without TRAN 1,298,965 (3,072,478) 9,879,346 8,075,046 7,714,844 16,277,736 10,651,201 6,322,609 7,103,366 7,968,387 (938,884) (7,694,243) Source: The District
Summary of Revenues, Expenditures & Changes in General Fund Balance Projected Alternate Cash Resources2010-11 2011-12 2012-13 2013-14 2014-15 Set-Aside 1 Maturity
(Audited) (Audited) (Audited) (Projected) (Projected) Fund Name Jul 31, 2014 Dec 31, 2014Beginning Fund Balance 21,995,762 25,297,934 24,887,465 21,943,911 16,397,323 11 - Adult Education (R) 125,000 50,000
12 - Child Development (R) 90,000 80,000 Total Revenues 104,375,538 106,527,759 107,227,605 116,563,322 123,265,923 13 - Cafeteria Special Revenue (R) 2,800,000 2,100,000
14 - Deferred Maintenance (R) 4,305 4,314 Total Expenditures 100,650,288 106,576,373 110,410,110 122,109,910 124,109,660 17 - Special Reserve Other than Cap Outlay (U) 65,050 65,200
25 - Capital Facilities (R) 1,800,000 1,675,000 Other Sources & Uses (423,078) (361,855) 303,351 - - 35 - County School Facilities (R) 54,075 54,190
63 - Other Enterprise (R) 220,000 2,180,000 Ending Fund Balance 25,297,934 24,887,465 22,008,311 16,397,323 15,553,586 67 - Self-Insurance (R) 1,000,000 1,100,000
Source: District Annual Financial Statements & the District.Total Other Restricted Funds (R) 6,093,380 7,243,504 Total Other Unrestricted Funds (U) 65,050 65,200 Grand Total 6,158,430 7,308,704
Excludes Bond Proceed, Bond Interest & Redemption and Debt Service Funds.Source: The District.
C-72 C-73

Central UnifiedFresno
Fiscal Year 2014-15Jul 2014 Aug 2014 Sep 2014 Oct 2014 Nov 2014 Dec 2014 Jan 2015 Feb 2015 Mar 2015 Apr 2015 May 2015 Jun 2015 Accruals Total
Actual / Projected Projected Projected Projected Projected Projected Projected Projected Projected Projected Projected Projected Projected Projected 2014-15Beginning Cash 2,404,351 9,476,013 5,179,355 6,016,343 6,735,681 6,199,526 12,580,514 5,979,818 3,536,782 4,767,770 4,756,615 4,870,460 Receipts
LCFF/Revenue LimitApportionment 4,010,470 4,010,470 10,685,988 7,218,845 7,218,845 10,685,988 7,218,845 7,218,845 10,685,988 7,218,845 7,218,845 10,685,988 - 94,077,962 Property Taxes - 15,000 30,000 15,000 - 5,000,000 200,000 - - 5,000,000 200,000 174,184 - 10,634,184 Other - - - - - - - - - - - - - -
Federal Revenues 70,000 130,000 660,000 (1,500,000) 1,600,000 900,000 20,000 180,000 250,000 100,000 2,300,000 588,000 2,300,000 7,598,000 Other State Revenues 1,800,000 150,000 800,000 (1,200,000) 600,000 250,000 100,000 100,000 100,000 - - - 820,579 3,520,579 Other Local Revenues 1,200,000 500,000 400,000 (500,000) 350,000 350,000 400,000 400,000 400,000 400,000 400,000 828,775 1,500,000 6,628,775 Interfund Transfers In - - - - - - - - - - - - - - Other Financing Sources - - - - - - - - - - - - - -
Total Receipts 7,080,470 4,805,470 12,575,988 4,033,845 9,768,845 17,185,988 7,938,845 7,898,845 11,435,988 12,718,845 10,118,845 12,276,947 4,620,579 122,459,500 Disbursements
Certificated Salaries 676,088 4,800,000 4,900,000 4,995,000 5,000,000 5,000,000 5,000,000 5,000,000 5,000,000 5,000,000 5,000,000 5,305,000 - 55,676,088 Classified Salaries 665,000 1,422,128 1,555,000 1,555,000 1,555,000 1,555,000 1,555,000 1,555,000 1,555,000 1,555,000 1,555,000 1,555,000 - 17,637,128 Employee Benefits 578,578 2,200,000 2,200,000 2,200,000 2,200,000 2,200,000 2,200,000 2,200,000 2,200,000 2,200,000 2,200,000 2,200,000 - 24,778,578 Supplies and Services 350,000 1,150,000 1,500,000 1,700,000 1,700,000 1,700,000 1,794,205 1,550,000 1,450,000 1,450,000 1,250,000 1,280,000 - 16,874,205 Capital Outlay 2,500,000 - 1,500,000 1,500,000 200,000 350,000 150,000 36,882 - - - - - 6,236,882 Other Outgo 1,316,679 - - 274,766 - - 1,315,335 - - - - - - 2,906,780 Interfund Transfers Out - - - - - - - - - - - - - - Other Financing Uses - - - - - - - - - - - - - -
Total Disbursements 6,086,345 9,572,128 11,655,000 12,224,766 10,655,000 10,805,000 12,014,541 10,341,882 10,205,000 10,205,000 10,005,000 10,340,000 - 124,109,660 Asset TransactionsDeferred Apportionment 16,459,742 - - - - - - - - - - - - 16,459,742 Accounts Receivable 120,000 120,000 16,000 8,540,258 - - - - - - - - - 8,796,258 Due From Other Funds - - - - - - - - - - - - - - Other - - - - - - - - - - - - - - SUBTOTAL ASSETS 16,579,742 120,000 16,000 8,540,258 - - - - - - - - - 25,256,000 Accounts Payable 5,250,000 (350,000) 100,000 (370,000) (350,000) - - - - - - - - 4,280,000 Due To Other Funds - - - - - - - - - - - - - - Current Loan - - - - - - - - - - - - - - Other 108,000 - - - - - - - - - - - - 108,000 SUBTOTAL LIABILITIES 5,358,000 (350,000) 100,000 (370,000) (350,000) - - - - - - - - 4,388,000
Total PY Transactions 11,221,742 470,000 (84,000) 8,910,258 350,000 - - - - - - - - 20,868,000 Net Increase/Decrease 12,215,867 (4,296,658) 836,988 719,337 (536,155) 6,380,988 (4,075,696) (2,443,037) 1,230,988 2,513,845 113,845 1,936,947 4,620,579
FY TRAN Deposits 5,000,000 - - - - - - - - - - - 5,000,000 FY TRAN Repayments - - - - - - (2,525,000) - - (2,525,000) - - (5,050,000) CY TRAN Deposits - - - - - - - - - - - - - CY TRAN Repayments (10,144,205) - - - - - - - - - - - (10,144,205)
Ending Cash with TRAN 9,476,013 5,179,355 6,016,343 6,735,681 6,199,526 12,580,514 5,979,818 3,536,782 4,767,770 4,756,615 4,870,460 6,807,406 TRAN Balance 5,000,000 5,000,000 5,000,000 5,000,000 5,000,000 5,000,000 2,475,000 2,475,000 2,475,000 - - - Ending Cash without TRAN 4,476,013 179,355 1,016,343 1,735,681 1,199,526 7,580,514 3,504,818 1,061,782 2,292,770 4,756,615 4,870,460 6,807,406 Source: The District
072
C-73

King City Union Elementary King City Union ElementaryMonterey Monterey
Fiscal Year 2013-14 Fiscal Year 2014-15Jul 2013 Aug 2013 Sep 2013 Oct 2013 Nov 2013 Dec 2013 Jan 2014 Feb 2014 Mar 2014 Apr 2014 May 2014 Jun 2014 Accruals Total
Actual / Projected Actual Actual Actual Actual Actual Actual Projected Projected Projected Projected Projected Projected Projected 2013-14Beginning Cash 1,462,297 1,693,315 1,833,292 1,825,334 924,606 395,346 1,537,898 1,442,734 1,125,388 2,458,608 2,779,084 1,158,910 Receipts
LCFF/Revenue LimitApportionment 521,750 521,750 1,496,766 939,150 939,150 557,616 1,878,300 939,150 1,496,766 582,273 18,783 557,616 3,171,549 13,620,618 Property Taxes - - 13,033 (2,799) 92,183 1,881,838 - - - 1,304,300 - 169,144 - 3,457,699 Other - - - - - (95) - - - - - (20,403) - (20,498)
Federal Revenues - - 11,915 2,171 163,566 365,046 161,641 2,658 110,552 100,741 105,591 350,689 278,288 1,652,858 Other State Revenues 3,828 - 257,700 - 328,487 130,000 61,641 320,781 59,769 87,699 85,452 - 5,447 1,340,804 Other Local Revenues 43,855 49,143 49,678 68,355 4,762 1,026 181,111 142,194 81,110 56,768 71,748 127,389 475,116 1,352,254 Interfund Transfers In - - - - - - - - - - - - - - Other Financing Sources - - - - - - - - - - - - - -
Total Receipts 569,433 570,893 1,829,092 1,006,877 1,528,147 2,935,431 2,282,693 1,404,783 1,748,197 2,131,781 281,574 1,184,435 3,930,400 21,403,735 Disbursements
Certificated Salaries 92,452 922,123 1,037,452 956,398 980,966 63,686 1,961,932 954,959 979,387 921,671 924,453 247,733 - 10,043,212 Classified Salaries 116,937 254,878 259,505 271,842 263,688 264,078 251,919 256,723 256,560 250,728 250,728 199,543 41,004 2,938,133 Employee Benefits 130,464 427,198 441,583 347,875 673,474 160,544 681,675 374,707 342,937 381,810 373,543 302,547 - 4,638,357 Supplies and Services 114,854 226,394 221,615 308,139 122,925 239,455 115,098 207,962 159,993 313,397 180,509 410,708 88,898 2,709,948 Capital Outlay - 5,258 49,864 264,103 46,090 13,591 - - - 57,738 - - - 436,646 Other Outgo 44,259 92,944 92,944 92,944 195,391 42,325 2,241 14,916 236,289 3,109 267,379 70,930 - 1,155,670 Interfund Transfers Out - - - - - - - - - - - 108,910 - 108,910 Other Financing Uses - - - - - - - - - - - - - -
Total Disbursements 498,967 1,928,796 2,102,963 2,241,301 2,282,533 783,679 3,012,865 1,809,267 1,975,166 1,928,453 1,996,612 1,340,371 129,902 22,030,874 Asset TransactionsDeferred Apportionment 1,344,331 851,963 2,196,294 Accounts Receivable 1,199,811 27,751 390,510 151,161 33,939 17,274 379,869 - - - - (206,882) - 1,993,432 Due From Other Funds - - - - - - 78,437 - - - - - - 78,437 Other - (380) 33,326 (149) 213,610 9,320 1,080 - 2,159 27,778 - 2,160 - 288,904 SUBTOTAL ASSETS 2,544,142 879,334 423,836 151,012 247,548 26,593 459,387 - 2,159 27,778 - (204,722) - 4,557,067 Accounts Payable 740,678 593,854 157,898 (146,822) (135,852) 35,793 (175,621) (87,139) (64,607) (89,370) (94,864) 184,275 - 918,222 Due To Other Funds - - - - - - - - - - - - - - Current Loan - - - (35,795) - - - - - - - - - (35,795) Other (88) 233 25 (67) 158,274 - - - - - - - - 158,378 SUBTOTAL LIABILITIES 740,590 594,087 157,923 (182,683) 22,422 35,793 (175,621) (87,139) (64,607) (89,370) (94,864) 184,275 - 1,040,805
Total PY Transactions 1,803,552 285,247 265,913 333,695 225,126 (9,199) 635,008 87,139 66,766 117,148 94,864 (388,997) - 3,516,262 Net Increase/Decrease 1,874,018 (1,072,656) (7,957) (900,729) (529,260) 2,142,552 (95,165) (317,345) (160,203) 320,475 (1,620,174) (544,933) 3,800,498
FY TRAN Deposits - 1,976,540 - - - - - - - - - - - 1,976,540 FY TRAN Repayments - - - - - (1,000,000) - - (1,027,777) - - - - (2,027,777) CY TRAN Deposits - - - - - - - - 2,521,200 - - - - 2,521,200 CY TRAN Repayments (1,643,000) (763,908) - - - - - - - - - - - (2,406,908)
Ending Cash with TRAN 1,693,315 1,833,292 1,825,334 924,606 395,346 1,537,898 1,442,734 1,125,388 2,458,608 2,779,084 1,158,910 613,977 TRAN Balance 734,335 1,976,540 1,976,540 1,976,540 1,976,540 976,540 976,540 976,540 2,521,200 2,521,200 2,521,200 2,521,200 Ending Cash without TRAN 958,981 (143,248) (151,206) (1,051,934) (1,581,194) 561,358 466,194 148,848 (62,592) 257,884 (1,362,290) (1,907,223) Source: The District
Summary of Revenues, Expenditures & Changes in General Fund Balance Projected Alternate Cash Resources2010-11 2011-12 2012-13 2013-14 2014-15 Set-Aside 1 Maturity
(Audited) (Audited) (Audited) (Projected) (Projected) Fund Name Jul 31, 2014 Dec 31, 2014Beginning Fund Balance 3,983,692 4,388,739 3,859,230 1,881,559 1,583,857 12 - Child Development (R) 11,826 11,023
13 - Cafeteria Special Revenue (R) 647,102 371,175 Total Revenues 18,693,987 18,413,039 19,333,132 21,673,288 22,712,520 14 - Deferred Maintenance (R) 80,427 19,157
25 - Capital Facilities (R) 435,742 435,742 Total Expenditures 18,205,349 18,957,269 21,540,049 21,862,080 21,341,912 35 - County School Facilities (R) 191,105 191,105
Other Sources & Uses (83,591) (93,729) 277,358 (108,910) -
Ending Fund Balance 4,388,739 3,750,780 1,929,671 1,583,857 2,954,464 Source: District Annual Financial Statements & the District.
Total Other Restricted Funds (R) 1,366,202 1,028,202 Total Other Unrestricted Funds (U) - - Grand Total 1,366,202 1,028,202
Excludes Bond Proceed, Bond Interest & Redemption and Debt Service Funds.Source: The District.
C-74 C-75

King City Union ElementaryMonterey
Fiscal Year 2014-15Jul 2014 Aug 2014 Sep 2014 Oct 2014 Nov 2014 Dec 2014 Jan 2015 Feb 2015 Mar 2015 Apr 2015 May 2015 Jun 2015 Accruals Total
Actual / Projected Projected Projected Projected Projected Projected Projected Projected Projected Projected Projected Projected Projected Projected 2014-15Beginning Cash 613,977 2,647,335 812,350 1,097,857 644,150 624,644 4,052,976 3,124,970 1,451,608 1,525,771 2,507,063 1,955,537 Receipts
LCFF/Revenue LimitApportionment 609,208 609,208 1,747,634 1,096,575 1,096,575 1,747,634 1,096,575 1,096,575 1,747,634 1,096,575 1,096,575 1,747,634 - 14,788,404 Property Taxes - - 14,620 (3,655) 98,687 1,822,051 - - - 1,396,236 - 180,926 - 3,508,865 Other - - - - - - - - - - - (21,930) - (21,930)
Federal Revenues - - 11,864 2,190 163,539 537,342 161,714 2,738 110,608 100,752 105,680 350,623 278,344 1,825,392 Other State Revenues 3,889 - 257,722 - 328,521 130,068 61,682 320,744 59,804 87,695 85,416 - 5,498 1,341,038 Other Local Revenues 39,008 43,709 44,218 60,736 2,541 70,774 161,115 126,427 72,171 50,444 63,785 113,340 422,482 1,270,751 Interfund Transfers In - - - - - - - - - - - - - - Other Financing Sources - - - - - - - - - - - - - -
Total Receipts 652,105 652,918 2,076,058 1,155,846 1,689,863 4,307,869 1,481,085 1,546,484 1,990,218 2,731,701 1,351,455 2,370,592 706,325 22,712,520 Disbursements
Certificated Salaries 94,598 944,951 1,063,199 979,911 1,005,617 53,468 2,011,234 978,883 1,003,561 944,951 948,036 253,975 - 10,282,384 Classified Salaries 119,953 261,252 266,062 278,688 270,271 265,461 258,245 263,055 263,055 257,043 257,043 204,432 42,089 3,006,649 Employee Benefits 133,722 437,807 452,560 356,432 690,498 168,937 698,588 384,033 351,673 391,171 383,081 310,272 - 4,758,775 Supplies and Services 88,566 174,642 170,909 237,696 94,788 168,627 88,773 160,331 123,411 241,637 139,175 316,721 68,654 2,073,929 Capital Outlay - - - - - - - - - - - - - - Other Outgo 44,311 92,964 92,964 92,964 195,392 - 2,227 14,919 236,252 3,117 267,425 70,920 - 1,113,456 Interfund Transfers Out - - - - - - - - - - - 106,719 - 106,719 Other Financing Uses - - - - - - - - - - - - - -
Total Disbursements 481,150 1,911,617 2,045,693 1,945,692 2,256,566 656,493 3,059,067 1,801,221 1,977,953 1,837,919 1,994,760 1,263,039 110,743 21,341,912 Asset TransactionsDeferred Apportionment 3,171,549 - - - - - - - - - - - - 3,171,549 Accounts Receivable 450,004 - 408,817 158,985 36,339 265,731 397,461 - - - - (215,765) - 1,501,573 Due From Other Funds - - - - - - 81,763 - - - - - - 81,763 Other - - - - 224,850 - - - - - - 2,271 - 227,121 SUBTOTAL ASSETS 3,621,553 - 408,817 158,985 261,189 265,731 479,225 - - - - (213,494) - 4,982,006 Accounts Payable 719,289 576,285 153,676 (143,004) (132,332) 488,775 (170,751) (85,376) (61,897) (87,510) (91,779) 179,289 - 1,344,666 Due To Other Funds - - - - - - - - - - - - - - Current Loan - - - (34,150) - - - - - - - - - (34,150) Other - - - - (153,676) - - - - - - - - (153,676) SUBTOTAL LIABILITIES 719,289 576,285 153,676 (177,154) (286,008) 488,775 (170,751) (85,376) (61,897) (87,510) (91,779) 179,289 - 1,156,839
Total PY Transactions 2,902,263 (576,285) 255,141 336,139 547,197 (223,044) 649,976 85,376 61,897 87,510 91,779 (392,782) - 3,825,167 Net Increase/Decrease 3,073,219 (1,834,984) 285,506 (453,707) (19,506) 3,428,332 (928,006) (169,361) 74,163 981,292 (551,526) 714,771 595,582
FY TRAN Deposits 1,500,000 - - - - - - (1,504,000) - - - - (4,000) FY TRAN Repayments - - - - - - - - - - - - - CY TRAN Deposits - - - - - - - - - - - - - CY TRAN Repayments (2,539,861) - - - - - - - - - - - (2,539,861)
Ending Cash with TRAN 2,647,335 812,350 1,097,857 644,150 624,644 4,052,976 3,124,970 1,451,608 1,525,771 2,507,063 1,955,537 2,670,308 TRAN Balance 1,500,000 1,500,000 1,500,000 1,500,000 1,500,000 1,500,000 1,500,000 - - - - - Ending Cash without TRAN 1,147,335 (687,650) (402,143) (855,850) (875,356) 2,552,976 1,624,970 1,451,608 1,525,771 2,507,063 1,955,537 2,670,308 Source: The District
074
C-75

Ojai Unified Ojai UnifiedVentura Ventura
Fiscal Year 2013-14 Fiscal Year 2014-15Jul 2013 Aug 2013 Sep 2013 Oct 2013 Nov 2013 Dec 2013 Jan 2014 Feb 2014 Mar 2014 Apr 2014 May 2014 Jun 2014 Accruals Total
Actual / Projected Actual Actual Actual Actual Actual Actual Projected Projected Projected Projected Projected Projected Projected 2013-14Beginning Cash 1,541,971 3,509,342 2,153,780 2,017,336 886,519 274,644 5,247,806 3,330,534 1,899,878 2,293,071 3,459,205 1,647,474 Receipts
LCFF/Revenue LimitApportionment 264,082 264,082 1,121,814 475,348 475,348 1,121,814 475,348 475,348 1,121,814 302,321 72,881 575,893 1,140,182 7,886,275 Property Taxes 16,968 14,127 - 9,795 437,271 5,232,126 - - - 3,642,535 - 271,040 - 9,623,862 Other - - - - (110,493) - - - (50,000) - - - (51,185) (211,678)
Federal Revenues 57,681 (29,091) 36,934 1,739 8,975 130,574 18,725 50,000 331,337 9,362 1,828 155,025 312,228 1,085,317 Other State Revenues 112,318 1,400 303,250 (94,154) 382,065 - 120,601 - 25,317 141,983 - 64,554 248,282 1,305,617 Other Local Revenues 120,405 109,167 184,406 185,232 212,837 238,310 395,554 126,857 54,697 103,762 189,018 44,745 340,345 2,305,336 Interfund Transfers In - - - - - - - - - - - 60,000 - 60,000 Other Financing Sources 27,629 - (27,629) - - - - - - - - - - -
Total Receipts 599,083 359,686 1,618,775 577,961 1,406,003 6,722,824 1,010,228 652,205 1,483,165 4,199,963 263,727 1,171,257 1,989,852 22,054,729 Disbursements
Certificated Salaries 136,413 123,023 888,583 937,605 936,518 966,712 900,000 1,000,000 1,100,000 960,771 900,000 1,033,240 5,575 9,888,440 Classified Salaries 180,815 195,739 367,439 380,203 382,280 396,518 350,000 375,000 371,202 350,000 350,000 404,699 14,852 4,118,747 Employee Benefits 146,726 175,105 463,167 488,692 487,615 495,395 480,000 480,000 500,000 480,000 475,458 510,465 3,175 5,185,798 Supplies and Services 93,634 516,693 252,563 298,676 222,831 128,471 275,000 300,000 225,000 382,890 350,000 277,346 240,505 3,563,608 Capital Outlay - - - - - - 70,000 - - - 100,000 22,814 - 192,814 Other Outgo - 717 - - 16,933 - - - - - - - 180,701 198,351 Interfund Transfers Out - - - - - - - - - - - - - - Other Financing Uses - - - - - - - - - - - - - -
Total Disbursements 557,588 1,011,276 1,971,752 2,105,176 2,046,177 1,987,096 2,075,000 2,155,000 2,196,202 2,173,661 2,175,458 2,248,564 444,808 23,147,759 Asset TransactionsDeferred Apportionment 250,583 158,806 409,389 Accounts Receivable 1,333,389 (389,185) 228,763 288,046 2,986 - - 250,000 - - - - - 1,713,999 Due From Other Funds - - - - - - - - - - - - - - Other 22,450 (15,691) 3,176 2,840 (6,570) 4,111 - - - - - - - 10,315 SUBTOTAL ASSETS 1,606,422 (246,071) 231,939 290,886 (3,584) 4,111 - 250,000 - - - - - 2,133,703 Accounts Payable 1,549,522 457,901 (102,550) (105,513) (95,899) (103,323) (75,000) 177,861 (100,000) (100,000) (100,000) (100,000) - 1,302,998 Due To Other Funds - - 17,957 - - - - - - - - - - 17,957 Current Loan - - 100,000 - 50,000 (130,000) - - - - - 30,000 (50,000) - Other - - - - 14,016 - - - - - - - - 14,016 SUBTOTAL LIABILITIES 1,549,522 457,901 15,406 (105,513) (31,883) (233,323) (75,000) 177,861 (100,000) (100,000) (100,000) (70,000) (50,000) 1,334,970
Total PY Transactions 56,900 (703,972) 216,533 396,399 28,299 237,434 75,000 72,139 100,000 100,000 100,000 70,000 50,000 798,733 Net Increase/Decrease 98,395 (1,355,562) (136,444) (1,130,816) (611,875) 4,973,162 (989,772) (1,430,656) (613,037) 2,126,302 (1,811,731) (1,007,307) 1,595,044
FY TRAN Deposits 1,868,975 - - - - - - - - - - - - 1,868,975 FY TRAN Repayments - - - - - - (927,500) - - (960,169) - - - (1,887,669) CY TRAN Deposits - - - - - - - - 1,006,230 - - - - 1,006,230 CY TRAN Repayments - - - - - - - - - - - - - -
Ending Cash with TRAN 3,509,342 2,153,780 2,017,336 886,519 274,644 5,247,806 3,330,534 1,899,878 2,293,071 3,459,205 1,647,474 640,167 TRAN Balance 1,868,975 1,868,975 1,868,975 1,868,975 1,868,975 1,868,975 941,475 941,475 1,947,705 1,006,230 1,006,230 1,006,230 Ending Cash without TRAN 1,640,366 284,805 148,361 (982,456) (1,594,331) 3,378,831 2,389,059 958,403 345,366 2,452,975 641,244 (366,063) Source: The District
Summary of Revenues, Expenditures & Changes in General Fund Balance Projected Alternate Cash Resources2010-11 2011-12 2012-13 2013-14 2014-15 Set-Aside 1 Maturity
(Audited) (Audited) (Audited) (Projected) (Projected) Fund Name Jul 31, 2014 Dec 31, 2014Beginning Fund Balance 2,650,833 2,592,075 2,476,934 1,542,605 449,577 11 - Adult Education (R) 13,690 9,690
13 - Cafeteria Special Revenue (R) 4,367 - Total Revenues 22,347,364 22,317,487 21,493,726 21,994,730 21,948,848 14 - Deferred Maintenance (R) 3,000 3,000
25 - Capital Facilities (R) 500,000 400,000 Total Expenditures 22,379,541 22,432,628 22,428,056 23,147,758 21,858,251
Other Sources & Uses (26,581) - - 60,000 -
Ending Fund Balance 2,592,075 2,476,934 1,542,604 449,577 540,174 Source: District Annual Financial Statements & the District.
Total Other Restricted Funds (R) 521,057 412,690 Total Other Unrestricted Funds (U) - - Grand Total 521,057 412,690
Excludes Bond Proceed, Bond Interest & Redemption and Debt Service Funds.Source: The District.
C-76 C-77

Ojai UnifiedVentura
Fiscal Year 2014-15Jul 2014 Aug 2014 Sep 2014 Oct 2014 Nov 2014 Dec 2014 Jan 2015 Feb 2015 Mar 2015 Apr 2015 May 2015 Jun 2015 Accruals Total
Actual / Projected Projected Projected Projected Projected Projected Projected Projected Projected Projected Projected Projected Projected Projected 2014-15Beginning Cash 640,167 3,478,057 2,233,122 2,212,797 1,232,419 361,371 4,413,198 3,518,371 2,215,559 1,696,579 2,605,180 1,464,004 Receipts
LCFF/Revenue LimitApportionment 272,542 272,542 1,157,821 490,575 490,575 1,157,821 490,575 490,575 1,157,821 490,575 490,575 1,157,821 - 8,119,815 Property Taxes 17,811 14,248 - 10,686 - 4,954,886 - - - 4,632,516 - 279,625 - 9,909,772 Other - - - - - (103,301) - - (51,651) - - - (64,118) (219,069)
Federal Revenues 57,630 (29,086) 36,901 1,737 105,493 50,033 18,776 50,033 331,347 9,334 1,845 139,138 312,246 1,085,426 Other State Revenues 63,951 818 172,742 (53,615) 210,444 - 68,710 - 14,426 80,831 - 43,948 141,436 743,691 Other Local Revenues 117,468 106,666 180,027 180,702 167,425 163,149 386,158 123,768 53,333 101,265 184,528 153,473 332,150 2,250,111 Interfund Transfers In - - - - - - - - - - - 59,102 - 59,102 Other Financing Sources - - - - - - - - - - - - - -
Total Receipts 529,401 365,187 1,547,491 630,085 973,936 6,222,588 964,219 664,376 1,505,277 5,314,521 676,947 1,833,107 721,713 21,948,848 Disbursements
Certificated Salaries 128,192 115,187 835,104 880,622 845,322 1,032,965 845,322 939,144 1,032,965 811,881 845,322 970,727 5,574 9,288,328 Classified Salaries 176,076 190,515 357,768 370,201 340,922 389,453 340,922 364,987 389,453 340,922 340,922 394,266 14,439 4,010,848 Employee Benefits 146,388 174,838 461,923 487,269 478,993 498,649 478,993 478,993 498,649 478,993 474,338 512,098 3,104 5,173,228 Supplies and Services 82,184 453,104 221,552 261,863 273,737 273,737 241,239 263,113 197,178 248,113 219,365 179,367 210,928 3,125,477 Capital Outlay - - - - - - 22,515 - - - 32,166 7,337 - 62,018 Other Outgo - 714 - - - - - - - - - 197,638 - 198,352 Interfund Transfers Out - - - - - - - - - - - - - - Other Financing Uses - - - - - - - - - - - - - -
Total Disbursements 532,839 934,357 1,876,347 1,999,955 1,938,975 2,194,805 1,928,991 2,046,237 2,118,246 1,879,909 1,912,112 2,261,434 234,044 21,858,251 Asset TransactionsDeferred Apportionment 1,140,182 - - - - - - - - - - - - 1,140,182 Accounts Receivable 431,504 (227,654) 227,654 286,756 - - - 247,355 - - - - - 965,615 Due From Other Funds - - - - - - - - - - - - - - Other 21,890 (15,323) 2,189 2,189 - - - - - - - - - 10,945 SUBTOTAL ASSETS 1,593,576 (242,977) 229,843 288,945 - - - 247,355 - - - - - 2,116,742 Accounts Payable 336,303 432,789 (96,175) (100,547) (93,990) (24,044) (69,946) 168,307 (93,990) (93,990) (93,990) (93,990) - 176,739 Due To Other Funds - - 17,486 - - - - - - - - - - 17,486 Current Loan - - - - - - - - - - - - - - Other - - - - - - - - - - - - - - SUBTOTAL LIABILITIES 336,303 432,789 (78,689) (100,547) (93,990) (24,044) (69,946) 168,307 (93,990) (93,990) (93,990) (93,990) - 194,226
Total PY Transactions 1,257,273 (675,766) 308,532 389,492 93,990 24,044 69,946 79,048 93,990 93,990 93,990 93,990 - 1,922,516 Net Increase/Decrease 1,253,835 (1,244,936) (20,325) (980,378) (871,049) 4,051,827 (894,826) (1,302,812) (518,980) 3,528,601 (1,141,175) (334,338) 487,670
FY TRAN Deposits 2,600,000 - - - - - - - - - - - 2,600,000 FY TRAN Repayments - - - - - - - - - (2,620,000) - - (2,620,000) CY TRAN Deposits - - - - - - - - - - - - - CY TRAN Repayments (1,015,944) - - - - - - - - - - - (1,015,944)
Ending Cash with TRAN 3,478,057 2,233,122 2,212,797 1,232,419 361,371 4,413,198 3,518,371 2,215,559 1,696,579 2,605,180 1,464,004 1,129,666 TRAN Balance 2,600,000 2,600,000 2,600,000 2,600,000 2,600,000 2,600,000 2,600,000 2,600,000 2,600,000 - - - Ending Cash without TRAN 878,057 (366,878) (387,203) (1,367,581) (2,238,629) 1,813,198 918,371 (384,441) (903,421) 2,605,180 1,464,004 1,129,666 Source: The District
076
C-77

CERTAIN BACKGROUND INFORMATIONAND PROJECTED CASH FLOWS FOR SERIES N DISTRICT

Oak Park Unified Oak Park UnifiedVentura Ventura
Fiscal Year 2013-14 Fiscal Year 2014-15Jul 2013 Aug 2013 Sep 2013 Oct 2013 Nov 2013 Dec 2013 Jan 2014 Feb 2014 Mar 2014 Apr 2014 May 2014 Jun 2014 Accruals Total
Actual / Projected Actual Actual Actual Actual Actual Actual Projected Projected Projected Projected Projected Projected Projected 2013-14Beginning Cash 399,715 4,925,767 2,956,478 4,002,081 2,561,231 1,898,632 6,834,333 5,843,031 (880,943) 1,863,596 3,727,571 1,323,821 Receipts
LCFF/Revenue LimitApportionment 665,880 665,880 2,232,090 1,198,583 1,198,583 2,232,090 1,198,584 1,198,584 2,274,989 818,981 225,015 1,273,278 2,969,781 18,152,318 Property Taxes 23,744 16,080 - 13,425 393,525 4,565,124 121,983 64 51,315 3,355,118 69,288 384,994 - 8,994,660 Other - - - - - - - - - - - - - -
Federal Revenues - 11,930 934 (11,748) 11,274 46,583 3,098 - 274,165 - 11,024 331,746 206,757 885,763 Other State Revenues 412,913 - 452,628 (471,437) 622,056 131,823 180,531 - - 145,184 - - 487,143 1,960,841 Other Local Revenues 93,824 149,445 442,532 419,803 372,882 863,325 182,822 114,259 6,598 468,727 39,550 503,144 840,421 4,497,332 Interfund Transfers In - - - - - - - - - - - - - - Other Financing Sources - - - - - - - - - - - - - -
Total Receipts 1,196,361 843,335 3,128,184 1,148,626 2,598,320 7,838,945 1,687,018 1,312,907 2,607,067 4,788,010 344,877 2,493,162 4,504,102 34,490,914 Disbursements
Certificated Salaries 133,644 1,479,500 1,506,195 1,502,400 1,690,267 1,555,470 1,553,708 1,553,708 1,553,708 1,553,708 1,553,708 1,553,708 240,024 17,429,748 Classified Salaries 139,400 245,463 401,598 415,051 481,022 422,950 411,291 411,291 411,291 411,291 411,291 411,291 82,203 4,655,433 Employee Benefits 45,334 225,304 605,639 604,246 638,172 613,262 619,085 619,085 619,085 619,085 619,085 619,085 80,928 6,527,395 Supplies and Services 126,087 636,831 128,337 567,080 597,670 341,960 301,688 192,405 224,445 292,468 164,543 440,092 168,789 4,182,395 Capital Outlay - - - - - - - - - - - - - - Other Outgo - - - - - - - - - 170,286 - - 172,714 343,000 Interfund Transfers Out - - - - - - - - - - - - - - Other Financing Uses - - - - - - - - - - - - - -
Total Disbursements 444,465 2,587,098 2,641,769 3,088,777 3,407,131 2,933,642 2,885,772 2,776,489 2,808,529 3,046,838 2,748,627 3,024,176 744,658 33,137,971 Asset TransactionsDeferred Apportionment 1,652,192 1,047,069 2,699,261 Accounts Receivable 1,312,533 398,002 31,401 786,998 23,419 (18,922) 127,300 127,300 127,300 122,803 - - - 3,038,134 Due From Other Funds - - - - - - - - - - - - - - Other - - - - - - - - - - - - - - SUBTOTAL ASSETS 2,964,725 1,445,071 31,401 786,998 23,419 (18,922) 127,300 127,300 127,300 122,803 - - - 5,737,395 Accounts Payable 1,931,651 439,028 (527,787) 287,697 (122,793) (49,320) (80,152) (6,678) - - - - - 1,871,646 Due To Other Funds - - - - - - - - - - - - - - Current Loan - - - - - - - - - - - - - - Other - - - - - - - - - - - - - - SUBTOTAL LIABILITIES 1,931,651 439,028 (527,787) 287,697 (122,793) (49,320) (80,152) (6,678) - - - - - 1,871,646
Total PY Transactions 1,033,074 1,006,043 559,188 499,301 146,212 30,398 207,452 133,978 127,300 122,803 - - - 3,865,749 Net Increase/Decrease 1,784,970 (737,720) 1,045,603 (1,440,850) (662,599) 4,935,701 (991,302) (1,329,604) (74,162) 1,863,975 (2,403,750) (531,014) 3,759,444
FY TRAN Deposits 5,349,082 - - - - - - - - - - - - 5,349,082 FY TRAN Repayments - - - - - - - (5,394,370) - - - - - (5,394,370) CY TRAN Deposits - - - - - - - - 2,818,702 - - - - 2,818,702 CY TRAN Repayments (2,608,000) (1,231,569) - - - - - - - - - - - (3,839,569)
Ending Cash with TRAN 4,925,767 2,956,478 4,002,081 2,561,231 1,898,632 6,834,333 5,843,031 (880,943) 1,863,596 3,727,571 1,323,821 792,807 TRAN Balance 6,517,902 5,349,082 5,349,082 5,349,082 5,349,082 5,349,082 5,349,082 - 2,818,702 2,818,702 2,818,702 2,818,702 Ending Cash without TRAN (1,592,135) (2,392,604) (1,347,001) (2,787,851) (3,450,450) 1,485,251 493,949 (880,943) (955,105) 908,870 (1,494,880) (2,025,894) Source: The District
Summary of Revenues, Expenditures & Changes in General Fund Balance Projected Alternate Cash Resources2010-11 2011-12 2012-13 2013-14 2014-15 Set-Aside 1 Maturity
(Audited) (Audited) (Audited) (Projected) (Projected) Fund Name Jul 31, 2014 Dec 31, 2014Beginning Fund Balance 1,372,179 1,601,484 345,655 167,910 1,520,856 13 - Cafeteria Special Revenue (R) 29,914 29,914
14 - Deferred Maintenance (R) 53 53 Total Revenues 30,712,616 30,993,219 33,284,035 34,490,917 35,184,971 17 - Special Reserve Other than Cap Outlay (U) 364,053 364,053
25 - Capital Facilities (R) 3,409 3,409 Total Expenditures 30,438,472 32,203,304 33,077,183 33,137,971 34,403,150 35 - County School Facilities (R) 3,122,121 1,622,121
40 - Special Reserve for Cap Outlay (U) 2,458 2,458 Other Sources & Uses (44,839) (45,744) - - - 57 - Foundation Permanent (R) 5,341 5,341
Ending Fund Balance 1,601,484 345,655 552,507 1,520,856 2,302,677 Source: District Annual Financial Statements & the District.
Total Other Restricted Funds (R) 3,160,838 1,660,838 Total Other Unrestricted Funds (U) 366,511 366,511 Grand Total 3,527,349 2,027,349
Excludes Bond Proceed, Bond Interest & Redemption and Debt Service Funds.Source: The District.
C-79 C-80

Oak Park UnifiedVentura
Fiscal Year 2014-15Jul 2014 Aug 2014 Sep 2014 Oct 2014 Nov 2014 Dec 2014 Jan 2015 Feb 2015 Mar 2015 Apr 2015 May 2015 Jun 2015 Accruals Total
Actual / Projected Projected Projected Projected Projected Projected Projected Projected Projected Projected Projected Projected Projected Projected 2014-15Beginning Cash 792,807 2,623,161 1,803,565 2,832,650 1,567,298 612,355 4,377,274 3,332,504 2,083,695 2,091,388 2,920,450 1,549,103 Receipts
LCFF/Revenue LimitApportionment 732,268 732,268 2,454,725 1,318,083 1,318,083 2,454,725 1,318,083 1,318,083 2,454,725 1,318,083 1,318,083 2,454,725 - 19,191,930 Property Taxes 25,834 17,223 - 14,352 416,217 4,802,288 129,171 - 54,539 3,547,895 74,632 430,570 - 9,512,721 Other - - - - - - - - - - - - - -
Federal Revenues - 11,958 974 (11,781) 11,249 1,860 3,100 - 274,144 - 10,983 331,718 251,468 885,674 Other State Revenues 231,094 - 253,260 (263,794) 348,068 (33,029) 101,063 - - 81,201 - - 379,451 1,097,314 Other Local Revenues 93,994 149,311 442,537 419,601 372,829 793,329 183,041 114,232 6,746 520,341 39,577 555,421 806,372 4,497,332 Interfund Transfers In - - - - - - - - - - - - - - Other Financing Sources - - - - - - - - - - - - - -
Total Receipts 1,083,191 910,760 3,151,496 1,476,461 2,466,446 8,019,173 1,734,458 1,432,315 2,790,153 5,467,520 1,443,275 3,772,433 1,437,291 35,184,971 Disbursements
Certificated Salaries 135,784 1,497,146 1,523,598 1,520,071 1,710,520 1,571,210 1,571,210 1,571,210 1,571,210 1,571,210 1,571,210 1,542,995 273,331 17,630,704 Classified Salaries 141,285 249,022 407,790 421,494 488,120 417,241 417,241 417,241 417,241 417,241 417,241 417,241 95,450 4,723,848 Employee Benefits 45,602 228,008 613,309 611,987 646,353 625,866 625,866 625,866 625,866 625,866 625,866 625,866 81,951 6,608,269 Supplies and Services 153,414 776,246 156,472 691,129 728,335 338,938 363,913 203,873 273,699 333,842 200,305 671,251 205,911 5,097,329 Capital Outlay - - - - - - - - - - - - - - Other Outgo - - - - - - - - - 170,300 - - 172,701 343,000 Interfund Transfers Out - - - - - - - - - - - - - - Other Financing Uses - - - - - - - - - - - - - -
Total Disbursements 476,085 2,750,421 2,701,169 3,244,680 3,573,329 2,953,255 2,978,230 2,818,189 2,888,016 3,118,458 2,814,622 3,257,353 829,344 34,403,150 Asset TransactionsDeferred Apportionment 2,969,781 - - - - - - - - - - - - 2,969,781 Accounts Receivable 99,032 1,474,254 31,667 802,219 24,630 130,185 130,185 130,185 105,555 - - - - 2,927,911 Due From Other Funds - - - - - - - - - - - - - - Other - - - - - - - - - - - - - - SUBTOTAL ASSETS 3,068,813 1,474,254 31,667 802,219 24,630 130,185 130,185 130,185 105,555 - - - - 5,897,692 Accounts Payable 2,006,001 454,189 (547,091) 299,352 (127,311) (68,816) (68,816) (6,882) - - - - - 1,940,625 Due To Other Funds - - - - - - - - - - - - - - Current Loan - - - - - - - - - - - - - - Other - - - - - - - - - - - - - - SUBTOTAL LIABILITIES 2,006,001 454,189 (547,091) 299,352 (127,311) (68,816) (68,816) (6,882) - - - - - 1,940,625
Total PY Transactions 1,062,812 1,020,065 578,758 502,868 151,940 199,001 199,001 137,066 105,555 - - - - 3,957,067 Net Increase/Decrease 1,669,918 (819,596) 1,029,085 (1,265,351) (954,943) 5,264,919 (1,044,771) (1,248,808) 7,692 2,349,062 (1,371,347) 515,080 607,947
FY TRAN Deposits 3,000,000 - - - - - - - - - - - 3,000,000 FY TRAN Repayments - - - - - (1,500,000) - - - (1,520,000) - - (3,020,000) CY TRAN Deposits - - - - - - - - - - - - - CY TRAN Repayments (2,839,565) - - - - - - - - - - - (2,839,565)
Ending Cash with TRAN 2,623,161 1,803,565 2,832,650 1,567,298 612,355 4,377,274 3,332,504 2,083,695 2,091,388 2,920,450 1,549,103 2,064,183 TRAN Balance 3,000,000 3,000,000 3,000,000 3,000,000 3,000,000 1,500,000 1,500,000 1,500,000 1,500,000 - - - Ending Cash without TRAN (376,839) (1,196,435) (167,350) (1,432,702) (2,387,645) 2,877,274 1,832,504 583,695 591,388 2,920,450 1,549,103 2,064,183 Source: The District
079
C-80

CERTAIN BACKGROUND INFORMATIONAND PROJECTED CASH FLOWS FOR SERIES O DISTRICT

Lake Elsinore Unified Lake Elsinore UnifiedRiverside Riverside
Fiscal Year 2013-14 Fiscal Year 2014-15Jul 2013 Aug 2013 Sep 2013 Oct 2013 Nov 2013 Dec 2013 Jan 2014 Feb 2014 Mar 2014 Apr 2014 May 2014 Jun 2014 Accruals Total
Actual / Projected Actual Actual Actual Actual Actual Actual Projected Projected Projected Projected Projected Projected Projected 2013-14Beginning Cash 12,818,991 20,448,774 13,285,318 16,317,205 13,348,920 13,290,699 25,455,257 26,768,115 3,787,869 25,395,986 18,677,289 12,922,105 Receipts
LCFF/Revenue LimitApportionment 4,618,987 4,618,987 13,339,695 8,314,176 8,314,176 13,332,564 8,314,176 6,559,546 9,907,894 3,794,702 2,625,675 5,018,387 24,094,591 112,853,556 Property Taxes - 1,136,473 1,230,763 - 853,534 8,241,518 3,929,706 - - 2,617,915 4,820,809 304,927 - 23,135,645 Other 18,990 (18,990) - (152,558) - (93,882) (46,441) (46,441) (82,145) (41,073) (41,073) (41,073) (15,138) (559,824)
Federal Revenues 16,607 193,961 1,354,295 (468,401) 404,408 2,631,749 361,546 918,204 3,126,326 281,366 1,109,787 308,381 2,211,680 12,449,909 Other State Revenues - 21,228 2,961,191 923,444 2,924,187 306,944 708,519 29,000 646,743 702,331 18,000 214,287 2,505,264 11,961,138 Other Local Revenues 25,002 1,120,762 180,679 1,063,034 929,862 932,172 1,491,947 1,042,864 1,011,364 684,399 230,511 632,716 3,083,464 12,428,776 Interfund Transfers In - - - 5,076,804 - - - - - - - - - 5,076,804 Other Financing Sources - 5,658,553 (2,360,532) (3,300,000) - - - - - - - - - (1,979)
Total Receipts 4,679,586 12,730,974 16,706,091 11,456,499 13,426,167 25,351,065 14,759,453 8,503,173 14,610,182 8,039,640 8,763,709 6,437,625 31,879,861 177,344,025 Disbursements
Certificated Salaries 12,882,900 11,683,178 12,295,901 12,600,527 12,228,107 12,198,631 11,742,983 11,861,687 12,175,645 12,172,364 12,573,925 12,194,315 - 146,610,163 Classified Salaries - - - - - - - - - - - - - - Employee Benefits - - - - - - - - - - - - - - Supplies and Services 1,509,478 3,607,756 1,931,255 2,593,217 1,926,594 1,135,422 1,430,247 1,401,289 2,113,128 1,842,245 1,382,868 3,263,252 - 24,136,751 Capital Outlay - - 38,816 13,248 30,170 - - - - 86,403 6,619 57,368 - 232,624 Other Outgo 4,900 35,324 20,494 594,755 52,749 6,469 406,267 56,531 37,996 22,242 1,853 39,850 - 1,279,430 Interfund Transfers Out - - - - - - - - - - - - - - Other Financing Uses - - - - (81,503) - (82,000) - - - (85,357) - - (248,860)
Total Disbursements 14,397,278 15,326,258 14,286,466 15,801,747 14,156,117 13,340,522 13,497,497 13,319,507 14,326,769 14,123,254 13,879,908 15,554,785 - 172,010,108 Asset TransactionsDeferred Apportionment 10,084,098 7,840,748 17,924,846 Accounts Receivable 9,531,345 2,609,932 152,450 1,549,692 718,985 143,983 66,902 66,902 66,902 66,902 - - - 14,973,995 Due From Other Funds 54,541 1,000,000 573,667 - - - - - - - - - - 1,628,208 Other 16,737 20,771 (27,033) (63,064) (46,421) 10,032 (16,000) 30,000 (42,000) (5,000) 58,000 43,000 - (20,978) SUBTOTAL ASSETS 19,686,721 11,471,451 699,084 1,486,628 672,564 154,015 50,902 96,902 24,902 61,902 58,000 43,000 - 34,506,071 Accounts Payable 11,631,331 6,291,990 86,822 109,665 835 - - - 696,985 696,985 696,985 696,985 - 20,908,584 Due To Other Funds 1,043,325 2,710,633 - - - - - - - - - - - 3,753,958 Current Loan - 1,450,000 - - - - - (6,400,000) - - - - - (4,950,000) Other - (930,283) - - - - - - - - - - - (930,283) SUBTOTAL LIABILITIES 12,674,656 9,522,340 86,822 109,665 835 - - (6,400,000) 696,985 696,985 696,985 696,985 - 18,782,259
Total PY Transactions 7,012,065 1,949,111 612,262 1,376,963 671,729 154,015 50,902 6,496,902 (672,083) (635,083) (638,985) (653,985) - 15,723,812 Net Increase/Decrease (2,705,627) (646,173) 3,031,887 (2,968,285) (58,221) 12,164,558 1,312,858 1,680,568 (388,670) (6,718,697) (5,755,184) (9,771,145) 31,879,861
FY TRAN Deposits 24,521,410 - - - - - - - - - - - - 24,521,410 FY TRAN Repayments - - - - - - - (24,660,813) - - - - - (24,660,813) CY TRAN Deposits - - - - - - - - 21,996,787 - - - - 21,996,787 CY TRAN Repayments (14,186,000) (6,517,283) - - - - - - - - - - - (20,703,283)
Ending Cash with TRAN 20,448,774 13,285,318 16,317,205 13,348,920 13,290,699 25,455,257 26,768,115 3,787,869 25,395,986 18,677,289 12,922,105 3,150,959 TRAN Balance 30,893,302 24,521,410 24,521,410 24,521,410 24,521,410 24,521,410 24,521,410 - 21,996,787 21,996,787 21,996,787 21,996,787 Ending Cash without TRAN (10,444,528) (11,236,093) (8,204,206) (11,172,491) (11,230,712) 933,846 2,246,704 3,787,869 3,399,199 (3,319,498) (9,074,682) (18,845,828) Source: The District
Summary of Revenues, Expenditures & Changes in General Fund Balance Projected Alternate Cash Resources2010-11 2011-12 2012-13 2013-14 2014-15 Set-Aside 1 Maturity
(Audited) (Audited) (Audited) (Projected) (Projected) Fund Name Jul 31, 2014 Dec 31, 2014Beginning Fund Balance 16,162,693 20,105,333 11,764,594 3,649,922 11,423,017 09 - Charter Schools Special Revenue (R) 1,300,000 600,000
11 - Adult Education (R) 75,000 110,000 Total Revenues 170,386,446 161,970,688 162,609,491 171,265,920 175,085,538 12 - Child Development (R) 300,000 280,000
13 - Cafeteria Special Revenue (R) 5,864,000 5,004,000 Total Expenditures 166,022,414 168,906,376 171,352,506 168,569,628 173,924,609 25 - Capital Facilities (R) 1,089,226 6,000,000
35 - County School Facilities (R) 183,000 183,000 Other Sources & Uses (421,392) (1,405,051) 628,343 5,076,804 - 40 - Special Reserve for Cap Outlay (U) 25,000 25,000
67 - Self-Insurance (R) 1,010,773 2,600,000 Ending Fund Balance 20,105,333 11,764,594 3,649,922 11,423,017 12,583,946
Source: District Annual Financial Statements & the District.Total Other Restricted Funds (R) 9,821,999 14,777,000 Total Other Unrestricted Funds (U) 25,000 25,000 Grand Total 9,846,999 14,802,000
Excludes Bond Proceed, Bond Interest & Redemption and Debt Service Funds.Source: The District.
C-82 C-83

Lake Elsinore UnifiedRiverside
Fiscal Year 2014-15Jul 2014 Aug 2014 Sep 2014 Oct 2014 Nov 2014 Dec 2014 Jan 2015 Feb 2015 Mar 2015 Apr 2015 May 2015 Jun 2015 Accruals Total
Actual / Projected Projected Projected Projected Projected Projected Projected Projected Projected Projected Projected Projected Projected Projected 2014-15Beginning Cash 3,150,959 7,577,502 6,538,734 10,197,841 6,788,752 4,090,927 11,918,452 3,673,393 713,102 5,329,416 710,533 2,027,458 Receipts
LCFF/Revenue LimitApportionment 5,093,147 5,093,147 14,135,758 9,167,665 9,167,665 14,186,053 9,167,665 9,167,665 14,186,053 9,167,665 9,167,665 14,186,053 - 121,886,201 Property Taxes - 1,136,473 1,230,763 - 48,816 9,404,988 3,929,706 - - 2,617,915 4,462,057 304,927 - 23,135,645 Other (46,568) (46,568) (46,568) (46,568) (46,568) (46,568) (46,568) (46,568) (46,568) (46,568) (46,568) (46,568) - (558,816)
Federal Revenues 16,607 200,000 1,300,000 - 128,000 3,000,000 200,000 25,000 3,000,000 200,000 1,000,000 300,000 1,062,630 10,432,237 Other State Revenues - 21,000 900,000 923,000 1,146,000 - 708,000 29,000 600,000 700,000 18,000 200,000 2,272,020 7,517,020 Other Local Revenues 25,002 1,120,762 180,679 1,063,034 978,364 1,027,864 1,505,947 1,078,864 1,011,364 684,399 230,511 632,715 3,083,465 12,622,970 Interfund Transfers In - - - - - - - - - - - - - - Other Financing Sources - - - - - - - - - - - - - -
Total Receipts 5,088,188 7,524,814 17,700,632 11,107,131 11,422,277 27,572,337 15,464,750 10,253,961 18,750,849 13,323,411 14,831,665 15,577,127 6,418,115 175,035,257 Disbursements
Certificated Salaries 13,338,350 12,042,592 12,671,250 12,986,791 12,563,268 12,271,298 12,103,517 12,051,721 12,117,310 12,115,418 12,528,184 12,261,954 - 149,051,653 Classified Salaries - - - - - - - - - - - - - - Employee Benefits - - - - - - - - - - - - - - Supplies and Services 1,632,000 3,608,000 1,956,000 2,593,700 1,725,000 1,175,591 1,418,000 1,368,000 2,087,229 1,824,000 1,272,060 3,500,000 - 24,159,580 Capital Outlay - - 38,000 13,000 11,000 13,000 - - - 65,634 6,000 50,000 - 196,634 Other Outgo 4,900 35,324 20,494 300,000 (35,166) 38,923 322,292 (25,469) 37,996 22,242 (83,504) 39,850 (161,140) 516,742 Interfund Transfers Out - - - - - - - - - - - - - - Other Financing Uses - - - - - - - - - - - - - -
Total Disbursements 14,975,250 15,685,916 14,685,744 15,893,491 14,264,102 13,498,812 13,843,809 13,394,252 14,242,535 14,027,294 13,722,740 15,851,804 (161,140) 173,924,609 Asset TransactionsDeferred Apportionment 24,094,591 - - - - - - - - - - - - 24,094,591 Accounts Receivable - 7,785,000 150,000 1,550,000 150,000 150,000 150,000 150,000 150,000 150,000 150,000 134,862 - 10,669,862 Due From Other Funds 55,000 - 550,000 - - - - - - - - - - 605,000 Other 16,737 20,771 (27,033) (63,064) (6,000) 4,000 (16,000) 30,000 (42,000) (5,000) 58,000 43,000 - 13,411 SUBTOTAL ASSETS 24,166,328 7,805,771 672,967 1,486,936 144,000 154,000 134,000 180,000 108,000 145,000 208,000 177,862 - 35,382,864 Accounts Payable 11,631,331 633,437 28,748 109,665 - - - - - - - - - 12,403,181 Due To Other Funds 1,043,325 50,000 - - - - - - - - - - - 1,093,325 Current Loan - - - - - 6,400,000 - - - (11,000,000) - - - (4,600,000) Other - - - - - - - - - - - - - - SUBTOTAL LIABILITIES 12,674,656 683,437 28,748 109,665 - 6,400,000 - - - (11,000,000) - - - 8,896,506
Total PY Transactions 11,491,672 7,122,334 644,219 1,377,271 144,000 (6,246,000) 134,000 180,000 108,000 11,145,000 208,000 177,862 - 26,486,358 Net Increase/Decrease 1,604,610 (1,038,768) 3,659,107 (3,409,089) (2,697,825) 7,827,525 1,754,941 (2,960,291) 4,616,314 10,441,117 1,316,925 (96,815) 6,579,255
FY TRAN Deposits 25,000,000 - - - - - - - - - - - 25,000,000 FY TRAN Repayments - - - - - - (10,000,000) - - (15,060,000) - - (25,060,000) CY TRAN Deposits - - - - - - - - - - - - - CY TRAN Repayments (22,178,067) - - - - - - - - - - - (22,178,067)
Ending Cash with TRAN 7,577,502 6,538,734 10,197,841 6,788,752 4,090,927 11,918,452 3,673,393 713,102 5,329,416 710,533 2,027,458 1,930,643 TRAN Balance 25,000,000 25,000,000 25,000,000 25,000,000 25,000,000 25,000,000 15,000,000 15,000,000 15,000,000 - - - Ending Cash without TRAN (17,422,498) (18,461,266) (14,802,159) (18,211,248) (20,909,073) (13,081,548) (11,326,607) (14,286,898) (9,670,584) 710,533 2,027,458 1,930,643 Source: The District
082
C-83

CERTAIN BACKGROUND INFORMATIONAND PROJECTED CASH FLOWS FOR SERIES P DISTRICT

Centinela Valley Union High Centinela Valley Union HighLos Angeles Los Angeles
Fiscal Year 2013-14 Fiscal Year 2014-15Jul 2013 Aug 2013 Sep 2013 Oct 2013 Nov 2013 Dec 2013 Jan 2014 Feb 2014 Mar 2014 Apr 2014 May 2014 Jun 2014 Accruals Total
Actual / Projected Actual Actual Actual Actual Actual Actual Projected Projected Projected Projected Projected Projected Projected 2013-14Beginning Cash 9,052,354 22,722,170 19,764,506 15,097,614 10,550,759 7,891,711 16,397,272 13,758,424 9,370,407 16,179,450 12,225,141 7,232,728 Receipts
LCFF/Revenue LimitApportionment 2,926,457 1,564,570 5,465,231 1,759,636 4,680,905 4,694,116 1,898,964 1,410,421 3,212,497 875,260 68,131 1,802,076 9,528,634 39,886,898 Property Taxes 263,830 (312,734) (72,003) 247,887 348,584 7,058,353 2,877,628 - 381,032 4,165,451 - 220,300 228,985 15,407,312 Other - - - - - - - - - - - 87,564 (87,564) -
Federal Revenues - (1,288,283) 571,465 16,080 67,956 1,494,322 727,959 129,660 1,080,496 216,099 216,099 - 1,098,882 4,330,735 Other State Revenues 988,920 (1,091,489) 3,082,001 1,565,311 (1,946,010) 330,622 1,603,107 1,491,063 1,406,646 1,066,591 895,633 325,000 (3,087,950) 6,629,445 Other Local Revenues (21,420) 149,805 (82,311) 113,442 213,272 5,141 101,531 285,000 227,739 113,487 256,420 334,436 3,831,282 5,527,823 Interfund Transfers In - - - - - - - - - - - - - - Other Financing Sources - - - - - - - - - - - - - -
Total Receipts 4,157,788 (978,132) 8,964,382 3,702,357 3,364,707 13,582,554 7,209,189 3,316,144 6,308,409 6,436,887 1,436,284 2,769,376 11,512,268 71,782,212 Disbursements
Certificated Salaries 325,532 2,499,920 2,800,331 2,601,339 2,677,094 2,543,505 2,921,118 2,921,118 2,921,118 2,921,118 2,921,118 2,921,118 378,112 31,352,540 Classified Salaries 3,074 678,837 760,731 833,121 899,872 875,109 1,090,331 1,090,331 1,090,331 1,090,331 1,090,331 1,090,331 217,319 10,810,048 Employee Benefits 493,251 660,598 811,456 1,008,737 992,791 1,023,908 967,248 967,248 967,248 967,248 967,248 965,896 1,428,247 12,221,124 Supplies and Services (9,171) 1,260,518 1,467,208 1,724,216 1,198,635 1,034,743 1,200,000 1,200,000 1,200,000 1,250,000 1,250,000 1,250,000 3,887,294 17,913,443 Capital Outlay - - - 7,935 51,508 - - - - - - - 608,194 667,637 Other Outgo (871,747) - - 1,513,341 63,500 347,693 6,840 1,025,464 - - - 949,891 913,439 3,948,421 Interfund Transfers Out - - - - - - - - - - - - 234,500 234,500 Other Financing Uses - - - - - - - - - - - - (172,149) (172,149)
Total Disbursements (59,061) 5,099,872 5,839,727 7,688,689 5,883,399 5,824,959 6,185,537 7,204,161 6,178,697 6,228,697 6,228,696 7,177,235 7,494,957 76,975,564 Asset TransactionsDeferred Apportionment 4,087,439 2,590,395 6,677,834 Accounts Receivable (1,107,416) 3,141,477 (389,670) (417,462) (267,534) 457,262 - - - - - - - 1,416,657 Due From Other Funds - - - - - - - - - - - - - - Other - - 6,196,190 - - - - - - - - - - 6,196,190 SUBTOTAL ASSETS 2,980,023 5,731,872 5,806,520 (417,462) (267,534) 457,262 - - - - - - - 14,290,681 Accounts Payable (2,999,299) 814,697 13,598,068 143,060 (127,179) (287,731) - 500,000 500,000 500,000 200,000 750,000 300,000 13,891,616 Due To Other Funds - - - - - - - - - - - - - - Current Loan - - - - - - - - - - - - - - Other - - - - - (2,972) - - - - - - - (2,972) SUBTOTAL LIABILITIES (2,999,299) 814,697 13,598,068 143,060 (127,179) (290,704) - 500,000 500,000 500,000 200,000 750,000 300,000 13,888,643
Total PY Transactions 5,979,322 4,917,175 (7,791,547) (560,522) (140,356) 747,965 - (500,000) (500,000) (500,000) (200,000) (750,000) (300,000) 402,037 Net Increase/Decrease 10,196,171 (1,160,829) (4,666,892) (4,546,855) (2,659,048) 8,505,560 1,023,652 (4,388,017) (370,288) (291,809) (4,992,413) (5,157,859) 3,717,311
FY TRAN Deposits 7,322,645 - - - - - - - - - - - - 7,322,645 FY TRAN Repayments - - - - - - (3,662,500) - - (3,662,500) - - - (7,325,000) CY TRAN Deposits - - - - - - - - 7,179,331 - - - - 7,179,331 CY TRAN Repayments (3,849,000) (1,796,836) - - - - - - - - - - - (5,645,836)
Ending Cash with TRAN 22,722,170 19,764,506 15,097,614 10,550,759 7,891,711 16,397,272 13,758,424 9,370,407 16,179,450 12,225,141 7,232,728 2,074,869 TRAN Balance 9,046,430 7,322,645 7,322,645 7,322,645 7,322,645 7,322,645 3,660,145 3,660,145 10,839,476 7,179,331 7,179,331 7,179,331 Ending Cash without TRAN 13,675,740 12,441,861 7,774,969 3,228,114 569,066 9,074,627 10,098,279 5,710,262 5,339,974 5,045,810 53,397 (5,104,462) Source: The District
Summary of Revenues, Expenditures & Changes in General Fund Balance Projected Alternate Cash Resources2010-11 2011-12 2012-13 2013-14 2014-15 Set-Aside 1 Maturity
(Audited) (Audited) (Audited) (Projected) (Projected) Fund Name Jul 31, 2014 Sep 02, 2014Beginning Fund Balance 15,570,087 10,075,832 7,092,397 9,052,354 4,093,502 11 - Adult Education (R) 245,000 381,000
13 - Cafeteria Special Revenue (R) 98,000 264,000 Total Revenues 62,803,622 63,892,113 63,749,048 71,782,212 76,448,297 20 - Special Reserve for Post Employment Benefits (U) 51,175 51,175
25 - Capital Facilities (R) 370,000 490,000 Total Expenditures 68,747,877 66,081,765 67,788,589 76,975,564 77,383,337 35 - County School Facilities (R) 796,734 796,734
40 - Special Reserve for Cap Outlay (U) 37,970 37,970 Other Sources & Uses 450,000 (443,783) 6,070,000 234,500 234,500 49 - Capital Project for Blended Components (R) 111,899 111,899
Ending Fund Balance 10,075,832 7,442,397 9,122,856 4,093,502 3,392,962 Source: District Annual Financial Statements & the District.
Total Other Restricted Funds (R) 1,621,633 2,043,633 Total Other Unrestricted Funds (U) 89,145 89,145 Grand Total 1,710,778 2,132,778
Excludes Bond Proceed, Bond Interest & Redemption and Debt Service Funds.Source: The District.
C-85 C-86

Centinela Valley Union HighLos Angeles
Fiscal Year 2014-15Jul 2014 Aug 2014 Sep 2014 Oct 2014 Nov 2014 Dec 2014 Jan 2015 Feb 2015 Mar 2015 Apr 2015 May 2015 Jun 2015 Accruals Total
Actual / Projected Projected Projected Projected Projected Projected Projected Projected Projected Projected Projected Projected Projected Projected 2014-15Beginning Cash 2,074,869 17,377,732 13,680,383 8,482,703 6,823,443 2,737,275 9,259,504 5,596,121 3,702,966 5,125,001 1,235,815 270,013 Receipts
LCFF/Revenue LimitApportionment 1,857,184 1,857,184 5,142,930 3,342,930 3,342,930 5,142,930 3,342,930 3,342,930 5,142,930 3,342,930 3,342,930 5,142,930 - 44,343,670 Property Taxes 287,735 648,594 - - 384,272 5,407,896 2,934,696 381,032 3,878,515 39,923 220,300 1,083,661 15,266,625 Other 88,496 (88,496) -
Federal Revenues - (1,288,283) 571,465 16,080 67,956 1,085,611 727,959 129,660 1,080,496 216,099 216,099 - 1,507,593 4,330,735 Other State Revenues 988,920 (1,091,489) 3,082,001 1,565,311 (1,946,010) 1,635,370 1,603,107 1,491,063 1,406,646 1,066,591 895,633 325,000 (4,392,698) 6,629,445 Other Local Revenues (21,420) 149,805 (82,311) 113,442 191,490 117,230 101,531 285,000 227,739 113,487 256,420 334,436 4,090,974 5,877,822 Interfund Transfers In - - - - - - - - - - - - - - Other Financing Sources - - - - - - - - - - - - - -
Total Receipts 3,112,419 275,811 8,714,084 5,037,764 2,040,639 13,389,037 8,710,223 5,248,653 8,238,843 8,617,622 4,751,006 6,111,163 2,201,034 76,448,297 Disbursements
Certificated Salaries 350,000 2,861,080 2,861,094 2,861,094 2,861,094 2,861,094 2,861,094 2,861,094 2,861,094 2,861,094 2,861,094 2,861,094 - 31,822,016 Classified Salaries 193,265 979,971 979,971 979,971 979,971 979,971 979,971 979,971 979,971 979,971 979,971 979,971 - 10,972,947 Employee Benefits 735,201 1,075,743 1,075,743 1,075,743 1,075,743 1,075,743 1,075,743 1,075,743 1,075,743 1,075,743 1,075,743 1,075,737 - 12,568,368 Supplies and Services 1,000,000 1,040,000 1,350,000 920,216 1,060,000 1,650,000 1,450,000 1,200,000 1,900,000 1,500,000 800,000 801,471 2,669,910 17,341,598 Capital Outlay - - 150,000 - 150,000 300,000 6,799 - - - - - 60,838 667,637 Other Outgo - - - 860,000 - - - 1,025,000 - - - 1,000,000 1,063,421 3,948,421 Interfund Transfers Out - - - - - - - - - - - 234,500 - 234,500 Other Financing Uses (172,149) - - - - - - - - - - - - (172,149)
Total Disbursements 2,106,317 5,956,794 6,416,808 6,697,024 6,126,808 6,866,808 6,373,607 7,141,808 6,816,808 6,416,808 5,716,808 6,952,773 3,794,170 77,383,337 Asset TransactionsDeferred Apportionment 9,528,634 - - - - - - - - - - - - 9,528,634 Accounts Receivable - 1,983,634 - - - - - - - - - - - 1,983,634 Due From Other Funds - - - - - - - - - - - - - - Other - - - - - - - - - - - - - - SUBTOTAL ASSETS 9,528,634 1,983,634 - - - - - - - - - - - 11,512,268 Accounts Payable - - 7,494,957 - - - - - - - - - - 7,494,957 Due To Other Funds - - - - - - - - - - - - - - Current Loan - - - - - - - - - - - - - - Other - - - - - - - - - - - - - - SUBTOTAL LIABILITIES - - 7,494,957 - - - - - - - - - - 7,494,957
Total PY Transactions 9,528,634 1,983,634 (7,494,957) - - - - - - - - - - 4,017,311 Net Increase/Decrease 10,534,736 (3,697,350) (5,197,680) (1,659,260) (4,086,168) 6,522,230 2,336,616 (1,893,155) 1,422,035 2,200,814 (965,802) (841,611) (1,593,136)
FY TRAN Deposits 12,000,000 - - - - - - - - - - - 12,000,000 FY TRAN Repayments - - - - - - (6,000,000) - - (6,090,000) - - (12,090,000) CY TRAN Deposits - - - - - - - - - - - - - CY TRAN Repayments (7,231,873) - - - - - - - - - - - (7,231,873)
Ending Cash with TRAN 17,377,732 13,680,383 8,482,703 6,823,443 2,737,275 9,259,504 5,596,121 3,702,966 5,125,001 1,235,815 270,013 (571,597) TRAN Balance 12,000,000 12,000,000 12,000,000 12,000,000 12,000,000 12,000,000 6,000,000 6,000,000 6,000,000 - - - Ending Cash without TRAN 5,377,732 1,680,383 (3,517,297) (5,176,557) (9,262,725) (2,740,496) (403,879) (2,297,034) (874,999) 1,235,815 270,013 (571,597) Source: The District
085
C-86

APPENDIX D
COVERAGE ANALYSIS

* Includes projected General Fund cash, 100% of unrestricted funds and 75% of restricted funds.
D-2
Series DistrictJ Alvord Unified 3,410,000 7/31/2014 5.88 10/1/14 7.13 10.85J Corcoran Unified 765,000 7/31/2014 4.69 10/1/14 5.33 5.94J Ducor Union Elementary 75,000 7/31/2014 3.03 10/1/14 2.28 2.65J Exeter Unified 840,000 7/31/2014 5.33 10/1/14 5.99 6.66J Golden Valley Unified 650,000 7/31/2014 2.96 10/1/14 2.72 2.84J Hesperia Unified 14,880,000 7/31/2014 2.07 10/1/14 2.07 3.24J Hueneme Elementary 4,535,000 7/31/2014 3.30 10/1/14 3.20 3.44J Lancaster Elementary 1,995,000 7/31/2014 11.28 10/1/14 9.86 11.47J Meadows Union Elementary 45,000 7/31/2014 15.34 10/1/14 23.85 26.79J Palermo Union 615,000 7/31/2014 2.33 10/1/14 2.77 2.84J Red Bluff Union Elementary 200,000 7/31/2014 11.51 10/1/14 10.16 12.46J Rio Elementary 1,825,000 7/31/2014 3.30 10/1/14 3.38 6.13J Riverside Community College 4,970,000 7/31/2014 2.91 10/1/14 4.51 6.42J San Bernardino City Unified 23,915,000 7/31/2014 2.85 10/1/14 4.17 8.98J Thermalito Union 935,000 7/31/2014 2.09 10/1/14 2.06 2.19
K Barstow Unified 5,740,000 7/31/2014 1.80 10/1/14 2.01 2.11K Calipatria Unified 580,000 7/31/2014 1.42 10/1/14 1.77 1.83K Covina-Valley Unified 11,910,000 7/31/2014 1.23 10/1/14 2.48 2.96K Delano Union Elementary 3,195,000 7/31/2014 1.85 10/1/14 2.18 5.06K Farmersville Unified 2,080,000 7/31/2014 1.81 10/1/14 1.61 1.93K Fillmore Unified 3,580,000 7/31/2014 1.32 10/1/14 1.30 1.72K Los Nietos 1,775,000 7/31/2014 1.64 10/1/14 1.38 1.54K Pacifica 2,320,000 7/31/2014 2.66 10/1/14 1.89 2.15K Rialto Unified 22,965,000 7/31/2014 1.81 10/1/14 1.52 1.92K South Whittier Elementary 3,410,000 7/31/2014 1.58 10/1/14 1.66 1.92K Washington Unified 1,700,000 7/31/2014 2.00 10/1/14 1.73 1.93
L Azusa Unified 7,945,000 7/31/2014 1.63 10/1/14 3.46 3.48L Banning Unified 3,205,000 7/31/2014 1.70 10/1/14 1.52 2.19L Chawanakee Unified 605,000 7/31/2014 2.13 10/1/14 2.54 2.71L Jurupa Unified 10,170,000 7/31/2014 2.23 10/1/14 2.97 3.45L Murrieta Valley Unified 11,165,000 7/31/2014 1.48 10/1/14 2.75 3.16L Yosemite Unified 965,000 7/31/2014 2.31 10/1/14 1.85 1.87
M Center Joint Unified 3,800,000 7/31/2014 1.28 12/31/14 1.44 1.71M Central Unified 9,985,000 7/31/2014 1.43 12/31/14 1.74 2.27M King City Union Elementary 2,500,000 7/31/2014 1.44 12/31/14 1.99 2.30M Ojai Unified 1,000,000 7/31/2014 1.85 12/31/14 2.77 3.08
N Oak Park Unified 2,795,000 7/31/2014 0.97 12/31/14 2.11 2.55
O Lake Elsinore Unified 21,830,000 7/31/2014 0.20 12/31/14 0.40 0.90
P Centinela Valley Union High 7,165,000 7/31/2014 1.75 9/2/14 1.24 1.45
All Available Funds*
First Set Aside Maturity
Note Amount DateGen. Fund +
Unrestricted Reserves DateGen. Fund +
Unrestricted Reserves

APPENDIX E
PROPOSED FORMS OF BOND COUNSEL OPINIONS
March 14, 2014
California School Cash Reserve Program AuthorityMoorpark, California
California School Cash Reserve Program Authority2013-2014 Bonds, Series J
(Final Opinion)
Ladies and Gentlemen:
We have acted as bond counsel to the California School Cash Reserve Program Authority (the“Authority”) in connection with the issuance of its California School Cash Reserve Program Authority2013-2014 Bonds, Series J (the “Series J Bonds”), in the aggregate principal amount of $59,655,000,issued pursuant to the Indenture, dated as of July 1, 2013 (the “Original Indenture”), by and between theAuthority and U.S. Bank National Association, as trustee (the “Trustee”), as supplemented by the NinthSupplemental Indenture, dated as of March 1, 2014 (the “Ninth Supplemental Indenture” and togetherwith the Original Indenture, the “Indenture”), by and between the Authority and the Trustee. Capitalizedterms not otherwise defined herein shall have the meanings ascribed thereto in the Indenture.
In such connection, we have reviewed the Indenture, the resolutions, as supplemented in somecases, of the California school districts, community college districts and county boards of education(collectively, the “Districts”) identified in Schedule I to the Ninth Supplemental Indenture and, for aDistrict that is not fiscally accountable, in certain cases, a corresponding resolution of the County Boardof Supervisors of the County in which such District is located (collectively, the “Counties”), each suchresolution as so supplemented (collectively, the “Note Resolutions”) approving the issuance of the tax andrevenue anticipation notes (the “Series J Notes”) issued on the date hereof by or on behalf of suchDistricts and designated the respective District’s “2013-2014 Tax and Revenue Anticipation Note,” withthe seniority and series designations identified in Schedule I to the Ninth Supplemental Indenture, the TaxCertificate of the Authority, dated the date hereof (the “Tax Certificate”), relating to the Series J Bonds,certificates of the Authority, the Districts (“the District Certificates”) and the Trustee, and opinions ofcounsel to the Trustee, the Districts and others, an opinion of Kutak Rock LLP, as special counsel to theDistricts, regarding the issuance of the Series J Notes by the Districts or Counties, as applicable, and theadoption, legality, validity and enforceability of the Note Resolutions, the Series J Notes and certain othermatters, and such other documents, opinions and matters to the extent we deemed necessary to render theopinions set forth herein.
The opinions expressed herein are based on an analysis of existing laws, regulations, rulings andcourt decisions and cover certain matters not directly addressed by such authorities. Such opinions maybe affected by actions taken or omitted or events occurring after the date hereof. We have not undertakento determine, or to inform any person, whether any such actions are taken or omitted or events do occur orany other matters come to our attention after the date hereof. Accordingly, this letter speaks only as of itsdate and is not intended to, and may not, be relied upon or otherwise used in connection with any such

E-2
actions, events or matters. Our engagement with respect to the Series J Bonds has concluded with theirissuance, and we disclaim any obligation to update this letter. We have assumed the genuineness of alldocuments and signatures presented to us (whether as originals or as copies) and the due and legalexecution and delivery thereof by, and validity against, any parties other than the Authority. We haveassumed, without undertaking to verify, the accuracy of the factual matters represented, warranted orcertified in the documents, and of the legal conclusions contained in the opinions, referred to in thesecond paragraph hereof. Furthermore, we have assumed compliance with all covenants and agreementscontained in the Note Resolutions, the Indenture, the District Certificates and the Tax Certificate,including (without limitation) covenants and agreements compliance with which is necessary to assurethat future actions, omissions or events will not cause interest on the Series J Bonds to be included ingross income for federal income tax purposes. We call attention to the fact that the rights and obligationsunder the Series J Bonds, the Note Resolutions, the Series J Notes, the Indenture, the District Certificatesand the Tax Certificate and their enforceability may be subject to bankruptcy, insolvency, receivership,reorganization, arrangement, fraudulent conveyance, moratorium and other laws relating to or affectingcreditors’ rights, to the application of equitable principles, to the exercise of judicial discretion inappropriate cases and to the limitations on legal remedies against school districts, community collegedistricts, county boards of education, counties and joint powers authorities in the State of California. Weexpress no opinion with respect to any indemnification, contribution, liquidated damages, penalty(including any remedy deemed to constitute a penalty), right of set-off, arbitration, judicial reference,choice of law, choice of forum, choice of venue, non-exclusivity of remedies, waiver or severabilityprovisions contained in the foregoing documents, nor do we express any opinion with respect to the stateor quality of title to or interest in any of the assets described in or as subject to the lien of the NoteResolutions or the Indenture, or the accuracy or sufficiency of the description contained therein of, or theremedies available to enforce liens on, any such assets. Our services did not include financial or othernon-legal advice. Finally, we undertake no responsibility for the accuracy, completeness or fairness ofthe Official Statement or other offering materials relating to the Series J Notes or the Series J Bonds andexpress no opinion with respect thereto.
Based on and subject to the foregoing, and in reliance thereon, as of the date hereof, we are of thefollowing opinions:
1. The Series J Bonds constitute the valid and binding special obligations of the Authority,payable from interest and principal payments made by the Districts on their respective Series J Notes.
2. The Indenture has been duly executed and delivered by, and constitutes the valid andbinding special obligation of, the Authority.

E-3
3. Interest on the Series J Bonds is excluded from gross income for federal income taxpurposes under Section 103 of the Internal Revenue Code of 1986 and is exempt from State of Californiapersonal income taxes. The amount treated as interest on the Series J Bonds and excluded from grossincome may depend upon the taxpayer’s election under Internal Revenue Notice 94-84. Such interest isnot a specific preference item for purposes of the federal individual or corporate alternative minimumtaxes, although we observe that it is included in adjusted current earnings when calculating federalcorporate alternative minimum taxable income. We express no opinion regarding any other taxconsequences related to the ownership or disposition of, or the amount, accrual or receipt of interest on,the Series J Bonds.
Faithfully yours,
ORRICK, HERRINGTON & SUTCLIFFE LLP
per

E-4
March 14, 2014
California School Cash Reserve Program AuthorityMoorpark, California
California School Cash Reserve Program Authority2013-2014 Bonds, Series K
(Final Opinion)
Ladies and Gentlemen:
We have acted as bond counsel to the California School Cash Reserve Program Authority (the“Authority”) in connection with the issuance of its California School Cash Reserve Program Authority2013-2014 Bonds, Series K (the “Series K Bonds”), in the aggregate principal amount of $59,255,000,issued pursuant to the Indenture, dated as of July 1, 2013 (the “Original Indenture”), by and between theAuthority and U.S. Bank National Association, as trustee (the “Trustee”), as supplemented by the TenthSupplemental Indenture, dated as of March 1, 2014 (the “Tenth Supplemental Indenture” and togetherwith the Original Indenture, the “Indenture”), by and between the Authority and the Trustee. Capitalizedterms not otherwise defined herein shall have the meanings ascribed thereto in the Indenture.
In such connection, we have reviewed the Indenture, the resolutions, as supplemented in somecases, of the California school districts, community college districts and county boards of education(collectively, the “Districts”) identified in Schedule I to the Tenth Supplemental Indenture and, for aDistrict that is not fiscally accountable, in certain cases, a corresponding resolution of the County Boardof Supervisors of the County in which such District is located (collectively, the “Counties”), each suchresolution as so supplemented (collectively, the “Note Resolutions”) approving the issuance of the tax andrevenue anticipation notes (the “Series K Notes”) issued on the date hereof by or on behalf of suchDistricts and designated the respective District’s “2013-2014 Tax and Revenue Anticipation Note,” withthe seniority and series designations identified in Schedule I to the Tenth Supplemental Indenture, the TaxCertificate of the Authority, dated the date hereof (the “Tax Certificate”), relating to the Series K Bonds,certificates of the Authority, the Districts (“the District Certificates”) and the Trustee, and opinions ofcounsel to the Trustee, the Districts and others, an opinion of Kutak Rock LLP, as special counsel to theDistricts, regarding the issuance of the Series K Notes by the Districts or Counties, as applicable, and theadoption, legality, validity and enforceability of the Note Resolutions, the Series K Notes and certainother matters, and such other documents, opinions and matters to the extent we deemed necessary torender the opinions set forth herein.
The opinions expressed herein are based on an analysis of existing laws, regulations, rulings andcourt decisions and cover certain matters not directly addressed by such authorities. Such opinions maybe affected by actions taken or omitted or events occurring after the date hereof. We have not undertakento determine, or to inform any person, whether any such actions are taken or omitted or events do occur orany other matters come to our attention after the date hereof. Accordingly, this letter speaks only as of itsdate and is not intended to, and may not, be relied upon or otherwise used in connection with any suchactions, events or matters. Our engagement with respect to the Series K Bonds has concluded with theirissuance, and we disclaim any obligation to update this letter. We have assumed the genuineness of alldocuments and signatures presented to us (whether as originals or as copies) and the due and legalexecution and delivery thereof by, and validity against, any parties other than the Authority. We haveassumed, without undertaking to verify, the accuracy of the factual matters represented, warranted or

E-5
certified in the documents, and of the legal conclusions contained in the opinions, referred to in thesecond paragraph hereof. Furthermore, we have assumed compliance with all covenants and agreementscontained in the Note Resolutions, the Indenture, the District Certificates and the Tax Certificate,including (without limitation) covenants and agreements compliance with which is necessary to assurethat future actions, omissions or events will not cause interest on the Series K Bonds to be included ingross income for federal income tax purposes. We call attention to the fact that the rights and obligationsunder the Series K Bonds, the Note Resolutions, the Series K Notes, the Indenture, the DistrictCertificates and the Tax Certificate and their enforceability may be subject to bankruptcy, insolvency,receivership, reorganization, arrangement, fraudulent conveyance, moratorium and other laws relating toor affecting creditors’ rights, to the application of equitable principles, to the exercise of judicialdiscretion in appropriate cases and to the limitations on legal remedies against school districts,community college districts, county boards of education, counties and joint powers authorities in the Stateof California. We express no opinion with respect to any indemnification, contribution, liquidateddamages, penalty (including any remedy deemed to constitute a penalty), right of set-off, arbitration,judicial reference, choice of law, choice of forum, choice of venue, non-exclusivity of remedies, waiver orseverability provisions contained in the foregoing documents, nor do we express any opinion with respectto the state or quality of title to or interest in any of the assets described in or as subject to the lien of theNote Resolutions or the Indenture, or the accuracy or sufficiency of the description contained therein of,or the remedies available to enforce liens on, any such assets. Our services did not include financial orother non-legal advice. Finally, we undertake no responsibility for the accuracy, completeness or fairnessof the Official Statement or other offering materials relating to the Series K Notes or the Series K Bondsand express no opinion with respect thereto.
Based on and subject to the foregoing, and in reliance thereon, as of the date hereof, we are of thefollowing opinions:
1. The Series K Bonds constitute the valid and binding special obligations of the Authority,payable from interest and principal payments made by the Districts on their respective Series K Notes.
2. The Indenture has been duly executed and delivered by, and constitutes the valid andbinding special obligation of, the Authority.
3. Interest on the Series K Bonds is excluded from gross income for federal income taxpurposes under Section 103 of the Internal Revenue Code of 1986 and is exempt from State of Californiapersonal income taxes. The amount treated as interest on the Series K Bonds and excluded from grossincome may depend upon the taxpayer’s election under Internal Revenue Notice 94-84. Such interest isnot a specific preference item for purposes of the federal individual or corporate alternative minimumtaxes, although we observe that it is included in adjusted current earnings when calculating federalcorporate alternative minimum taxable income. We express no opinion regarding any other taxconsequences related to the ownership or disposition of, or the amount, accrual or receipt of interest on,the Series K Bonds.
Faithfully yours,
ORRICK, HERRINGTON & SUTCLIFFE LLP
per

E-6
March 14, 2014
California School Cash Reserve Program AuthorityMoorpark, California
California School Cash Reserve Program Authority2013-2014 Bonds, Series L
(Final Opinion)
Ladies and Gentlemen:
We have acted as bond counsel to the California School Cash Reserve Program Authority (the“Authority”) in connection with the issuance of its California School Cash Reserve Program Authority2013-2014 Bonds, Series L (the “Series L Bonds”), in the aggregate principal amount of $34,055,000,issued pursuant to the Indenture, dated as of July 1, 2013 (the “Original Indenture”), by and between theAuthority and U.S. Bank National Association, as trustee (the “Trustee”), as supplemented by theEleventh Supplemental Indenture, dated as of March 1, 2014 (the “Eleventh Supplemental Indenture” andtogether with the Original Indenture, the “Indenture”), by and between the Authority and the Trustee.Capitalized terms not otherwise defined herein shall have the meanings ascribed thereto in the Indenture.
In such connection, we have reviewed the Indenture, the resolutions, as supplemented in somecases, of the California school districts, community college districts and county boards of education(collectively, the “Districts”) identified in Schedule I to the Eleventh Supplemental Indenture and, for aDistrict that is not fiscally accountable, in certain cases, a corresponding resolution of the County Boardof Supervisors of the County in which such District is located (collectively, the “Counties”), each suchresolution as so supplemented (collectively, the “Note Resolutions”) approving the issuance of the tax andrevenue anticipation notes (the “Series L Notes”) issued on the date hereof by or on behalf of suchDistricts and designated the respective District’s “2013-2014 Tax and Revenue Anticipation Note,” withthe seniority and series designations identified in Schedule I to the Eleventh Supplemental Indenture, theTax Certificate of the Authority, dated the date hereof (the “Tax Certificate”), relating to the Series LBonds, certificates of the Authority, the Districts (“the District Certificates”) and the Trustee, andopinions of counsel to the Trustee, the Districts and others, an opinion of Kutak Rock LLP, as specialcounsel to the Districts, regarding the issuance of the Series L Notes by the Districts or Counties, asapplicable, and the adoption, legality, validity and enforceability of the Note Resolutions, the Series LNotes and certain other matters, and such other documents, opinions and matters to the extent we deemednecessary to render the opinions set forth herein.
The opinions expressed herein are based on an analysis of existing laws, regulations, rulings andcourt decisions and cover certain matters not directly addressed by such authorities. Such opinions maybe affected by actions taken or omitted or events occurring after the date hereof. We have not undertakento determine, or to inform any person, whether any such actions are taken or omitted or events do occur orany other matters come to our attention after the date hereof. Accordingly, this letter speaks only as of itsdate and is not intended to, and may not, be relied upon or otherwise used in connection with any suchactions, events or matters. Our engagement with respect to the Series L Bonds has concluded with theirissuance, and we disclaim any obligation to update this letter. We have assumed the genuineness of alldocuments and signatures presented to us (whether as originals or as copies) and the due and legalexecution and delivery thereof by, and validity against, any parties other than the Authority. We haveassumed, without undertaking to verify, the accuracy of the factual matters represented, warranted or

E-7
certified in the documents, and of the legal conclusions contained in the opinions, referred to in thesecond paragraph hereof. Furthermore, we have assumed compliance with all covenants and agreementscontained in the Note Resolutions, the Indenture, the District Certificates and the Tax Certificate,including (without limitation) covenants and agreements compliance with which is necessary to assurethat future actions, omissions or events will not cause interest on the Series L Bonds to be included ingross income for federal income tax purposes. We call attention to the fact that the rights and obligationsunder the Series L Bonds, the Note Resolutions, the Series L Notes, the Indenture, the District Certificatesand the Tax Certificate and their enforceability may be subject to bankruptcy, insolvency, receivership,reorganization, arrangement, fraudulent conveyance, moratorium and other laws relating to or affectingcreditors’ rights, to the application of equitable principles, to the exercise of judicial discretion inappropriate cases and to the limitations on legal remedies against school districts, community collegedistricts, county boards of education, counties and joint powers authorities in the State of California. Weexpress no opinion with respect to any indemnification, contribution, liquidated damages, penalty(including any remedy deemed to constitute a penalty), right of set-off, arbitration, judicial reference,choice of law, choice of forum, choice of venue, non-exclusivity of remedies, waiver or severabilityprovisions contained in the foregoing documents, nor do we express any opinion with respect to the stateor quality of title to or interest in any of the assets described in or as subject to the lien of the NoteResolutions or the Indenture, or the accuracy or sufficiency of the description contained therein of, or theremedies available to enforce liens on, any such assets. Our services did not include financial or othernon-legal advice. Finally, we undertake no responsibility for the accuracy, completeness or fairness ofthe Official Statement or other offering materials relating to the Series L Notes or the Series L Bonds andexpress no opinion with respect thereto.
Based on and subject to the foregoing, and in reliance thereon, as of the date hereof, we are of thefollowing opinions:
1. The Series L Bonds constitute the valid and binding special obligations of the Authority,payable from interest and principal payments made by the Districts on their respective Series L Notes.
2. The Indenture has been duly executed and delivered by, and constitutes the valid andbinding special obligation of, the Authority.
3. Interest on the Series L Bonds is excluded from gross income for federal income taxpurposes under Section 103 of the Internal Revenue Code of 1986 and is exempt from State of Californiapersonal income taxes. The amount treated as interest on the Series L Bonds and excluded from grossincome may depend upon the taxpayer’s election under Internal Revenue Notice 94-84. Such interest isnot a specific preference item for purposes of the federal individual or corporate alternative minimumtaxes, although we observe that it is included in adjusted current earnings when calculating federalcorporate alternative minimum taxable income. We express no opinion regarding any other taxconsequences related to the ownership or disposition of, or the amount, accrual or receipt of interest on,the Series L Bonds.
Faithfully yours,
ORRICK, HERRINGTON & SUTCLIFFE LLP
per

E-8
March 14, 2014
California School Cash Reserve Program AuthorityMoorpark, California
California School Cash Reserve Program Authority2013-2014 Bonds, Series M
(Final Opinion)
Ladies and Gentlemen:
We have acted as bond counsel to the California School Cash Reserve Program Authority (the“Authority”) in connection with the issuance of its California School Cash Reserve Program Authority2013-2014 Bonds, Series M (the “Series M Bonds”), in the aggregate principal amount of $17,285,000,issued pursuant to the Indenture, dated as of July 1, 2013 (the “Original Indenture”), by and between theAuthority and U.S. Bank National Association, as trustee (the “Trustee”), as supplemented by the TwelfthSupplemental Indenture, dated as of March 1, 2014 (the “Twelfth Supplemental Indenture” and togetherwith the Original Indenture, the “Indenture”), by and between the Authority and the Trustee. Capitalizedterms not otherwise defined herein shall have the meanings ascribed thereto in the Indenture.
In such connection, we have reviewed the Indenture, the resolutions, as supplemented in somecases, of the California school districts, community college districts and county boards of education(collectively, the “Districts”) identified in Schedule I to the Twelfth Supplemental Indenture and, for aDistrict that is not fiscally accountable, in certain cases, a corresponding resolution of the County Boardof Supervisors of the County in which such District is located (collectively, the “Counties”), each suchresolution as so supplemented (collectively, the “Note Resolutions”) approving the issuance of the tax andrevenue anticipation notes (the “Series M Notes”) issued on the date hereof by or on behalf of suchDistricts and designated the respective District’s “2013-2014 Tax and Revenue Anticipation Note,” withthe seniority and series designations identified in Schedule I to the Twelfth Supplemental Indenture, theTax Certificate of the Authority, dated the date hereof (the “Tax Certificate”), relating to the Series MBonds, certificates of the Authority, the Districts (“the District Certificates”) and the Trustee, andopinions of counsel to the Trustee, the Districts and others, an opinion of Kutak Rock LLP, as specialcounsel to the Districts, regarding the issuance of the Series M Notes by the Districts or Counties, asapplicable, and the adoption, legality, validity and enforceability of the Note Resolutions, the Series MNotes and certain other matters, and such other documents, opinions and matters to the extent we deemednecessary to render the opinions set forth herein.
The opinions expressed herein are based on an analysis of existing laws, regulations, rulings andcourt decisions and cover certain matters not directly addressed by such authorities. Such opinions maybe affected by actions taken or omitted or events occurring after the date hereof. We have not undertakento determine, or to inform any person, whether any such actions are taken or omitted or events do occur orany other matters come to our attention after the date hereof. Accordingly, this letter speaks only as of itsdate and is not intended to, and may not, be relied upon or otherwise used in connection with any suchactions, events or matters. Our engagement with respect to the Series M Bonds has concluded with theirissuance, and we disclaim any obligation to update this letter. We have assumed the genuineness of alldocuments and signatures presented to us (whether as originals or as copies) and the due and legalexecution and delivery thereof by, and validity against, any parties other than the Authority. We haveassumed, without undertaking to verify, the accuracy of the factual matters represented, warranted or

E-9
certified in the documents, and of the legal conclusions contained in the opinions, referred to in thesecond paragraph hereof. Furthermore, we have assumed compliance with all covenants and agreementscontained in the Note Resolutions, the Indenture, the District Certificates and the Tax Certificate,including (without limitation) covenants and agreements compliance with which is necessary to assurethat future actions, omissions or events will not cause interest on the Series M Bonds to be included ingross income for federal income tax purposes. We call attention to the fact that the rights and obligationsunder the Series M Bonds, the Note Resolutions, the Series M Notes, the Indenture, the DistrictCertificates and the Tax Certificate and their enforceability may be subject to bankruptcy, insolvency,receivership, reorganization, arrangement, fraudulent conveyance, moratorium and other laws relating toor affecting creditors’ rights, to the application of equitable principles, to the exercise of judicialdiscretion in appropriate cases and to the limitations on legal remedies against school districts,community college districts, county boards of education, counties and joint powers authorities in the Stateof California. We express no opinion with respect to any indemnification, contribution, liquidateddamages, penalty (including any remedy deemed to constitute a penalty), right of set-off, arbitration,judicial reference, choice of law, choice of forum, choice of venue, non-exclusivity of remedies, waiver orseverability provisions contained in the foregoing documents, nor do we express any opinion with respectto the state or quality of title to or interest in any of the assets described in or as subject to the lien of theNote Resolutions or the Indenture, or the accuracy or sufficiency of the description contained therein of,or the remedies available to enforce liens on, any such assets. Our services did not include financial orother non-legal advice. Finally, we undertake no responsibility for the accuracy, completeness or fairnessof the Official Statement or other offering materials relating to the Series M Notes or the Series M Bondsand express no opinion with respect thereto.
Based on and subject to the foregoing, and in reliance thereon, as of the date hereof, we are of thefollowing opinions:
1. The Series M Bonds constitute the valid and binding special obligations of the Authority,payable from interest and principal payments made by the Districts on their respective Series M Notes.
2. The Indenture has been duly executed and delivered by, and constitutes the valid andbinding special obligation of, the Authority.
3. Interest on the Series M Bonds is excluded from gross income for federal income taxpurposes under Section 103 of the Internal Revenue Code of 1986 and is exempt from State of Californiapersonal income taxes. The amount treated as interest on the Series M Bonds and excluded from grossincome may depend upon the taxpayer’s election under Internal Revenue Notice 94-84. Such interest isnot a specific preference item for purposes of the federal individual or corporate alternative minimumtaxes, although we observe that it is included in adjusted current earnings when calculating federalcorporate alternative minimum taxable income. We express no opinion regarding any other taxconsequences related to the ownership or disposition of, or the amount, accrual or receipt of interest on,the Series M Bonds.
Faithfully yours,
ORRICK, HERRINGTON & SUTCLIFFE LLP
per

E-10
March 14, 2014
California School Cash Reserve Program AuthorityMoorpark, California
California School Cash Reserve Program Authority2013-2014 Bonds, Series N
(Final Opinion)
Ladies and Gentlemen:
We have acted as bond counsel to the California School Cash Reserve Program Authority (the“Authority”) in connection with the issuance of its California School Cash Reserve Program Authority2013-2014 Bonds, Series N (the “Series N Bonds”), in the aggregate principal amount of $2,795,000,issued pursuant to the Indenture, dated as of July 1, 2013 (the “Original Indenture”), by and between theAuthority and U.S. Bank National Association, as trustee (the “Trustee”), as supplemented by theThirteenth Supplemental Indenture, dated as of March 1, 2014 (the “Thirteenth Supplemental Indenture”and together with the Original Indenture, the “Indenture”), by and between the Authority and the Trustee.Capitalized terms not otherwise defined herein shall have the meanings ascribed thereto in the Indenture.
In such connection, we have reviewed the Indenture, the resolutions, as supplemented in somecases, of the California school districts, community college districts and county boards of education(collectively, the “Districts”) identified in Schedule I to the Thirteenth Supplemental Indenture and, for aDistrict that is not fiscally accountable, in certain cases, a corresponding resolution of the County Boardof Supervisors of the County in which such District is located (collectively, the “Counties”), each suchresolution as so supplemented (collectively, the “Note Resolutions”) approving the issuance of the tax andrevenue anticipation notes (the “Series N Notes”) issued on the date hereof by or on behalf of suchDistricts and designated the respective District’s “2013-2014 Tax and Revenue Anticipation Note,” withthe seniority and series designations identified in Schedule I to the Thirteenth Supplemental Indenture, theTax Certificate of the Authority, dated the date hereof (the “Tax Certificate”), relating to the Series NBonds, certificates of the Authority, the Districts (“the District Certificates”) and the Trustee, andopinions of counsel to the Trustee, the Districts and others, an opinion of Kutak Rock LLP, as specialcounsel to the Districts, regarding the issuance of the Series N Notes by the Districts or Counties, asapplicable, and the adoption, legality, validity and enforceability of the Note Resolutions, the Series NNotes and certain other matters, and such other documents, opinions and matters to the extent we deemednecessary to render the opinions set forth herein.
The opinions expressed herein are based on an analysis of existing laws, regulations, rulings andcourt decisions and cover certain matters not directly addressed by such authorities. Such opinions maybe affected by actions taken or omitted or events occurring after the date hereof. We have not undertakento determine, or to inform any person, whether any such actions are taken or omitted or events do occur orany other matters come to our attention after the date hereof. Accordingly, this letter speaks only as of itsdate and is not intended to, and may not, be relied upon or otherwise used in connection with any suchactions, events or matters. Our engagement with respect to the Series N Bonds has concluded with theirissuance, and we disclaim any obligation to update this letter. We have assumed the genuineness of alldocuments and signatures presented to us (whether as originals or as copies) and the due and legalexecution and delivery thereof by, and validity against, any parties other than the Authority. We haveassumed, without undertaking to verify, the accuracy of the factual matters represented, warranted or

E-11
certified in the documents, and of the legal conclusions contained in the opinions, referred to in thesecond paragraph hereof. Furthermore, we have assumed compliance with all covenants and agreementscontained in the Note Resolutions, the Indenture, the District Certificates and the Tax Certificate,including (without limitation) covenants and agreements compliance with which is necessary to assurethat future actions, omissions or events will not cause interest on the Series N Bonds to be included ingross income for federal income tax purposes. We call attention to the fact that the rights and obligationsunder the Series N Bonds, the Note Resolutions, the Series N Notes, the Indenture, the DistrictCertificates and the Tax Certificate and their enforceability may be subject to bankruptcy, insolvency,receivership, reorganization, arrangement, fraudulent conveyance, moratorium and other laws relating toor affecting creditors’ rights, to the application of equitable principles, to the exercise of judicialdiscretion in appropriate cases and to the limitations on legal remedies against school districts,community college districts, county boards of education, counties and joint powers authorities in the Stateof California. We express no opinion with respect to any indemnification, contribution, liquidateddamages, penalty (including any remedy deemed to constitute a penalty), right of set-off, arbitration,judicial reference, choice of law, choice of forum, choice of venue, non-exclusivity of remedies, waiver orseverability provisions contained in the foregoing documents, nor do we express any opinion with respectto the state or quality of title to or interest in any of the assets described in or as subject to the lien of theNote Resolutions or the Indenture, or the accuracy or sufficiency of the description contained therein of,or the remedies available to enforce liens on, any such assets. Our services did not include financial orother non-legal advice. Finally, we undertake no responsibility for the accuracy, completeness or fairnessof the Official Statement or other offering materials relating to the Series N Notes or the Series N Bondsand express no opinion with respect thereto.
Based on and subject to the foregoing, and in reliance thereon, as of the date hereof, we are of thefollowing opinions:
1. The Series N Bonds constitute the valid and binding special obligations of the Authority,payable from interest and principal payments made by the Districts on their respective Series N Notes.
2. The Indenture has been duly executed and delivered by, and constitutes the valid andbinding special obligation of, the Authority.
3. Interest on the Series N Bonds is excluded from gross income for federal income taxpurposes under Section 103 of the Internal Revenue Code of 1986 and is exempt from State of Californiapersonal income taxes. The amount treated as interest on the Series N Bonds and excluded from grossincome may depend upon the taxpayer’s election under Internal Revenue Notice 94-84. Such interest isnot a specific preference item for purposes of the federal individual or corporate alternative minimumtaxes, although we observe that it is included in adjusted current earnings when calculating federalcorporate alternative minimum taxable income. We express no opinion regarding any other taxconsequences related to the ownership or disposition of, or the amount, accrual or receipt of interest on,the Series N Bonds.
Faithfully yours,
ORRICK, HERRINGTON & SUTCLIFFE LLP
per

E-12
March 14, 2014
California School Cash Reserve Program AuthorityMoorpark, California
California School Cash Reserve Program Authority2013-2014 Bonds, Series O
(Final Opinion)
Ladies and Gentlemen:
We have acted as bond counsel to the California School Cash Reserve Program Authority (the“Authority”) in connection with the issuance of its California School Cash Reserve Program Authority2013-2014 Bonds, Series O (the “Series O Bonds”), in the aggregate principal amount of $21,830,000,issued pursuant to the Indenture, dated as of July 1, 2013 (the “Original Indenture”), by and between theAuthority and U.S. Bank National Association, as trustee (the “Trustee”), as supplemented by theFourteenth Supplemental Indenture, dated as of March 1, 2014 (the “Fourteenth Supplemental Indenture”and together with the Original Indenture, the “Indenture”), by and between the Authority and the Trustee.Capitalized terms not otherwise defined herein shall have the meanings ascribed thereto in the Indenture.
In such connection, we have reviewed the Indenture, the resolutions, as supplemented in somecases, of the California school districts, community college districts and county boards of education(collectively, the “Districts”) identified in Schedule I to the Fourteenth Supplemental Indenture and, for aDistrict that is not fiscally accountable, in certain cases, a corresponding resolution of the County Boardof Supervisors of the County in which such District is located (collectively, the “Counties”), each suchresolution as so supplemented (collectively, the “Note Resolutions”) approving the issuance of the tax andrevenue anticipation notes (the “Series O Notes”) issued on the date hereof by or on behalf of suchDistricts and designated the respective District’s “2013-2014 Tax and Revenue Anticipation Note,” withthe seniority and series designations identified in Schedule I to the Fourteenth Supplemental Indenture,the Tax Certificate of the Authority, dated the date hereof (the “Tax Certificate”), relating to the Series OBonds, certificates of the Authority, the Districts (“the District Certificates”) and the Trustee, andopinions of counsel to the Trustee, the Districts and others, an opinion of Kutak Rock LLP, as specialcounsel to the Districts, regarding the issuance of the Series O Notes by the Districts or Counties, asapplicable, and the adoption, legality, validity and enforceability of the Note Resolutions, the Series ONotes and certain other matters, and such other documents, opinions and matters to the extent we deemednecessary to render the opinions set forth herein.
The opinions expressed herein are based on an analysis of existing laws, regulations, rulings andcourt decisions and cover certain matters not directly addressed by such authorities. Such opinions maybe affected by actions taken or omitted or events occurring after the date hereof. We have not undertakento determine, or to inform any person, whether any such actions are taken or omitted or events do occur orany other matters come to our attention after the date hereof. Accordingly, this letter speaks only as of itsdate and is not intended to, and may not, be relied upon or otherwise used in connection with any suchactions, events or matters. Our engagement with respect to the Series O Bonds has concluded with theirissuance, and we disclaim any obligation to update this letter. We have assumed the genuineness of alldocuments and signatures presented to us (whether as originals or as copies) and the due and legalexecution and delivery thereof by, and validity against, any parties other than the Authority. We haveassumed, without undertaking to verify, the accuracy of the factual matters represented, warranted or

E-13
certified in the documents, and of the legal conclusions contained in the opinions, referred to in thesecond paragraph hereof. Furthermore, we have assumed compliance with all covenants and agreementscontained in the Note Resolutions, the Indenture, the District Certificates and the Tax Certificate,including (without limitation) covenants and agreements compliance with which is necessary to assurethat future actions, omissions or events will not cause interest on the Series O Bonds to be included ingross income for federal income tax purposes. We call attention to the fact that the rights and obligationsunder the Series O Bonds, the Note Resolutions, the Series O Notes, the Indenture, the DistrictCertificates and the Tax Certificate and their enforceability may be subject to bankruptcy, insolvency,receivership, reorganization, arrangement, fraudulent conveyance, moratorium and other laws relating toor affecting creditors’ rights, to the application of equitable principles, to the exercise of judicialdiscretion in appropriate cases and to the limitations on legal remedies against school districts,community college districts, county boards of education, counties and joint powers authorities in the Stateof California. We express no opinion with respect to any indemnification, contribution, liquidateddamages, penalty (including any remedy deemed to constitute a penalty), right of set-off, arbitration,judicial reference, choice of law, choice of forum, choice of venue, non-exclusivity of remedies, waiver orseverability provisions contained in the foregoing documents, nor do we express any opinion with respectto the state or quality of title to or interest in any of the assets described in or as subject to the lien of theNote Resolutions or the Indenture, or the accuracy or sufficiency of the description contained therein of,or the remedies available to enforce liens on, any such assets. Our services did not include financial orother non-legal advice. Finally, we undertake no responsibility for the accuracy, completeness or fairnessof the Official Statement or other offering materials relating to the Series O Notes or the Series O Bondsand express no opinion with respect thereto.
Based on and subject to the foregoing, and in reliance thereon, as of the date hereof, we are of thefollowing opinions:
1. The Series O Bonds constitute the valid and binding special obligations of the Authority,payable from interest and principal payments made by the Districts on their respective Series O Notes.
2. The Indenture has been duly executed and delivered by, and constitutes the valid andbinding special obligation of, the Authority.
3. Interest on the Series O Bonds is excluded from gross income for federal income taxpurposes under Section 103 of the Internal Revenue Code of 1986 and is exempt from State of Californiapersonal income taxes. The amount treated as interest on the Series O Bonds and excluded from grossincome may depend upon the taxpayer’s election under Internal Revenue Notice 94-84. Such interest isnot a specific preference item for purposes of the federal individual or corporate alternative minimumtaxes, although we observe that it is included in adjusted current earnings when calculating federalcorporate alternative minimum taxable income. We express no opinion regarding any other taxconsequences related to the ownership or disposition of, or the amount, accrual or receipt of interest on,the Series O Bonds.
Faithfully yours,
ORRICK, HERRINGTON & SUTCLIFFE LLP
per

E-14
March 14, 2014
California School Cash Reserve Program AuthorityMoorpark, California
California School Cash Reserve Program Authority2013-2014 Bonds, Series P
(Final Opinion)
Ladies and Gentlemen:
We have acted as bond counsel to the California School Cash Reserve Program Authority (the“Authority”) in connection with the issuance of its California School Cash Reserve Program Authority2013-2014 Bonds, Series P (the “Series P Bonds”), in the aggregate principal amount of $7,165,000,issued pursuant to the Indenture, dated as of July 1, 2013 (the “Original Indenture”), by and between theAuthority and U.S. Bank National Association, as trustee (the “Trustee”), as supplemented by theFifteenth Supplemental Indenture, dated as of March 1, 2014 (the “Fifteenth Supplemental Indenture” andtogether with the Original Indenture, the “Indenture”), by and between the Authority and the Trustee.Capitalized terms not otherwise defined herein shall have the meanings ascribed thereto in the Indenture.
In such connection, we have reviewed the Indenture, the resolutions, as supplemented in somecases, of the California school districts, community college districts and county boards of education(collectively, the “Districts”) identified in Schedule I to the Fifteenth Supplemental Indenture and, for aDistrict that is not fiscally accountable, in certain cases, a corresponding resolution of the County Boardof Supervisors of the County in which such District is located (collectively, the “Counties”), each suchresolution as so supplemented (collectively, the “Note Resolutions”) approving the issuance of the tax andrevenue anticipation notes (the “Series P Notes”) issued on the date hereof by or on behalf of suchDistricts and designated the respective District’s “2013-2014 Tax and Revenue Anticipation Note,” withthe seniority and series designations identified in Schedule I to the Fifteenth Supplemental Indenture, theTax Certificate of the Authority, dated the date hereof (the “Tax Certificate”), relating to the Series PBonds, certificates of the Authority, the Districts (“the District Certificates”) and the Trustee, andopinions of counsel to the Trustee, the Districts and others, an opinion of Kutak Rock LLP, as specialcounsel to the Districts, regarding the issuance of the Series P Notes by the Districts or Counties, asapplicable, and the adoption, legality, validity and enforceability of the Note Resolutions, the Series PNotes and certain other matters, and such other documents, opinions and matters to the extent we deemednecessary to render the opinions set forth herein.
The opinions expressed herein are based on an analysis of existing laws, regulations, rulings andcourt decisions and cover certain matters not directly addressed by such authorities. Such opinions maybe affected by actions taken or omitted or events occurring after the date hereof. We have not undertakento determine, or to inform any person, whether any such actions are taken or omitted or events do occur orany other matters come to our attention after the date hereof. Accordingly, this letter speaks only as of itsdate and is not intended to, and may not, be relied upon or otherwise used in connection with any suchactions, events or matters. Our engagement with respect to the Series P Bonds has concluded with theirissuance, and we disclaim any obligation to update this letter. We have assumed the genuineness of alldocuments and signatures presented to us (whether as originals or as copies) and the due and legalexecution and delivery thereof by, and validity against, any parties other than the Authority. We haveassumed, without undertaking to verify, the accuracy of the factual matters represented, warranted or
E-15
certified in the documents, and of the legal conclusions contained in the opinions, referred to in thesecond paragraph hereof. Furthermore, we have assumed compliance with all covenants and agreementscontained in the Note Resolutions, the Indenture, the District Certificates and the Tax Certificate,including (without limitation) covenants and agreements compliance with which is necessary to assurethat future actions, omissions or events will not cause interest on the Series P Bonds to be included ingross income for federal income tax purposes. We call attention to the fact that the rights and obligationsunder the Series P Bonds, the Note Resolutions, the Series P Notes, the Indenture, the District Certificatesand the Tax Certificate and their enforceability may be subject to bankruptcy, insolvency, receivership,reorganization, arrangement, fraudulent conveyance, moratorium and other laws relating to or affectingcreditors’ rights, to the application of equitable principles, to the exercise of judicial discretion inappropriate cases and to the limitations on legal remedies against school districts, community collegedistricts, county boards of education, counties and joint powers authorities in the State of California. Weexpress no opinion with respect to any indemnification, contribution, liquidated damages, penalty(including any remedy deemed to constitute a penalty), right of set-off, arbitration, judicial reference,choice of law, choice of forum, choice of venue, non-exclusivity of remedies, waiver or severabilityprovisions contained in the foregoing documents, nor do we express any opinion with respect to the stateor quality of title to or interest in any of the assets described in or as subject to the lien of the NoteResolutions or the Indenture, or the accuracy or sufficiency of the description contained therein of, or theremedies available to enforce liens on, any such assets. Our services did not include financial or othernon-legal advice. Finally, we undertake no responsibility for the accuracy, completeness or fairness ofthe Official Statement or other offering materials relating to the Series P Notes or the Series P Bonds andexpress no opinion with respect thereto.
Based on and subject to the foregoing, and in reliance thereon, as of the date hereof, we are of thefollowing opinions:
1. The Series P Bonds constitute the valid and binding special obligations of the Authority,payable from interest and principal payments made by the Districts on their respective Series P Notes.
2. The Indenture has been duly executed and delivered by, and constitutes the valid andbinding special obligation of, the Authority.
3. Interest on the Series P Bonds is excluded from gross income for federal income taxpurposes under Section 103 of the Internal Revenue Code of 1986 and is exempt from State of Californiapersonal income taxes. The amount treated as interest on the Series P Bonds and excluded from grossincome may depend upon the taxpayer’s election under Internal Revenue Notice 94-84. Such interest isnot a specific preference item for purposes of the federal individual or corporate alternative minimumtaxes, although we observe that it is included in adjusted current earnings when calculating federalcorporate alternative minimum taxable income. We express no opinion regarding any other taxconsequences related to the ownership or disposition of, or the amount, accrual or receipt of interest on,the Series P Bonds.
Faithfully yours,
ORRICK, HERRINGTON & SUTCLIFFE LLP
per