cse 473/573 ransac & least squares devansh arpit
TRANSCRIPT

CSE 473/573RANSAC & Least
SquaresDevansh Arpit

Mathematical Models
• Compact Understanding of the World
Input Prediction
Model
Playing Golf

Mathematical Models - Example
• Face Recognition with varying expressions
• Too Easy…

Mathematical Models
• Face Recognition with varying expressions
Learn Model
Feature Space

I. RANSAC
• Random Sample Consensus• Used for Parametric Matching/Model Fitting• Applications:
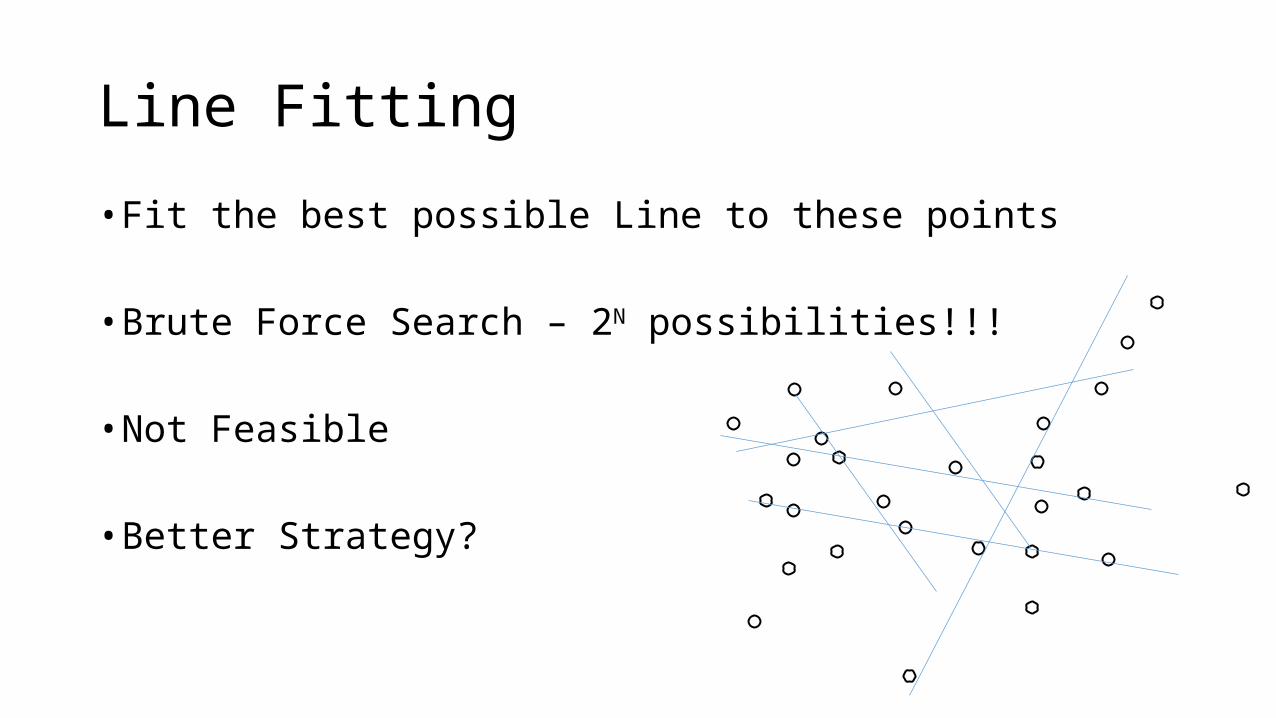
Line Fitting
• Fit the best possible Line to these points
• Brute Force Search – 2N possibilities!!!
• Not Feasible
• Better Strategy?

How RANSAC Works
• Random Search – Much Faster!!!
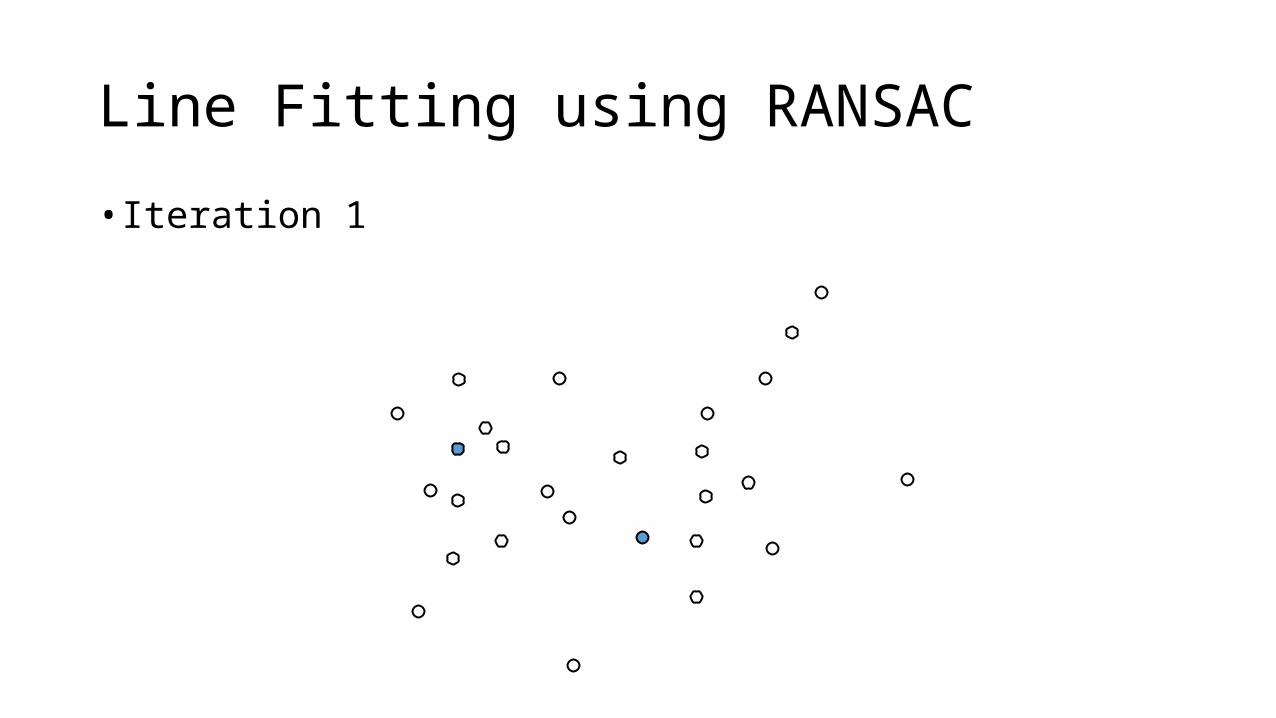
Line Fitting using RANSAC
• Iteration 1

Line Fitting using RANSAC
• Iteration 1

Line Fitting using RANSAC
• Iteration 1

Line Fitting using RANSAC
• Iteration 2

Line Fitting using RANSAC
• Iteration 2

Line Fitting using RANSAC
• Iteration 2
Line Fitting using RANSAC
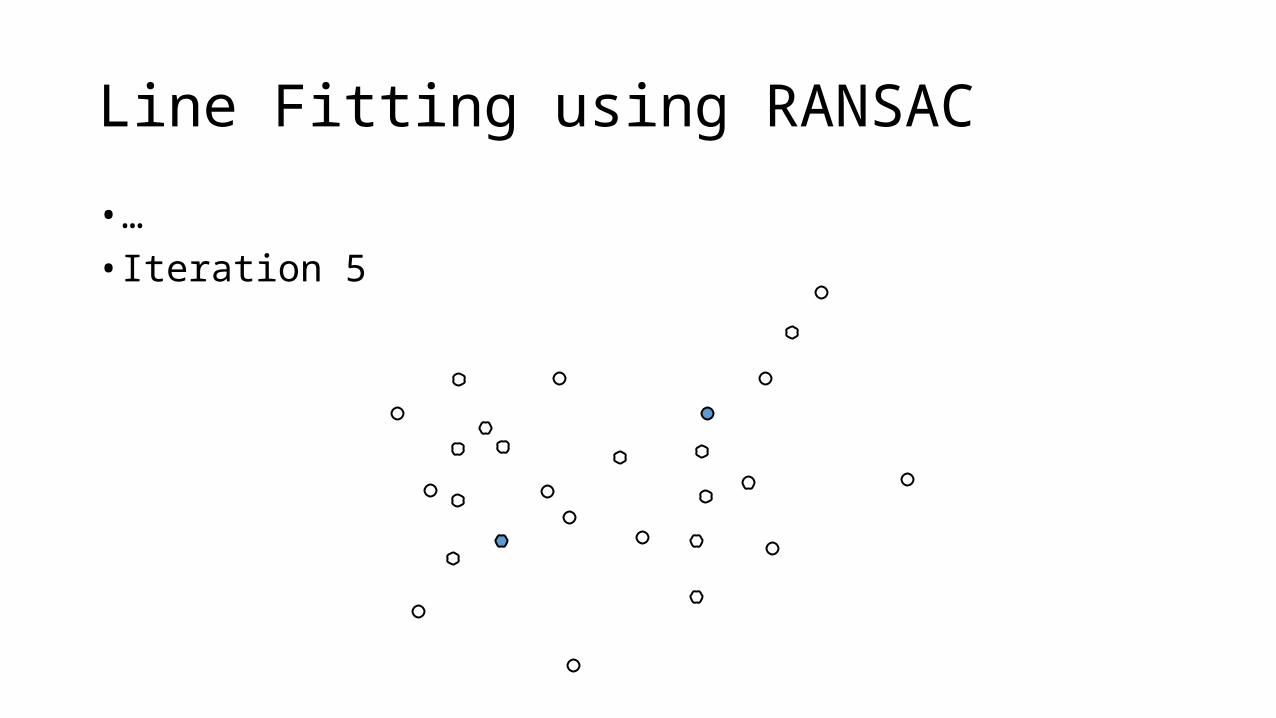
• …• Iteration 5

Line Fitting using RANSAC
• Iteration 5

Line Fitting using RANSAC
• Iteration 5

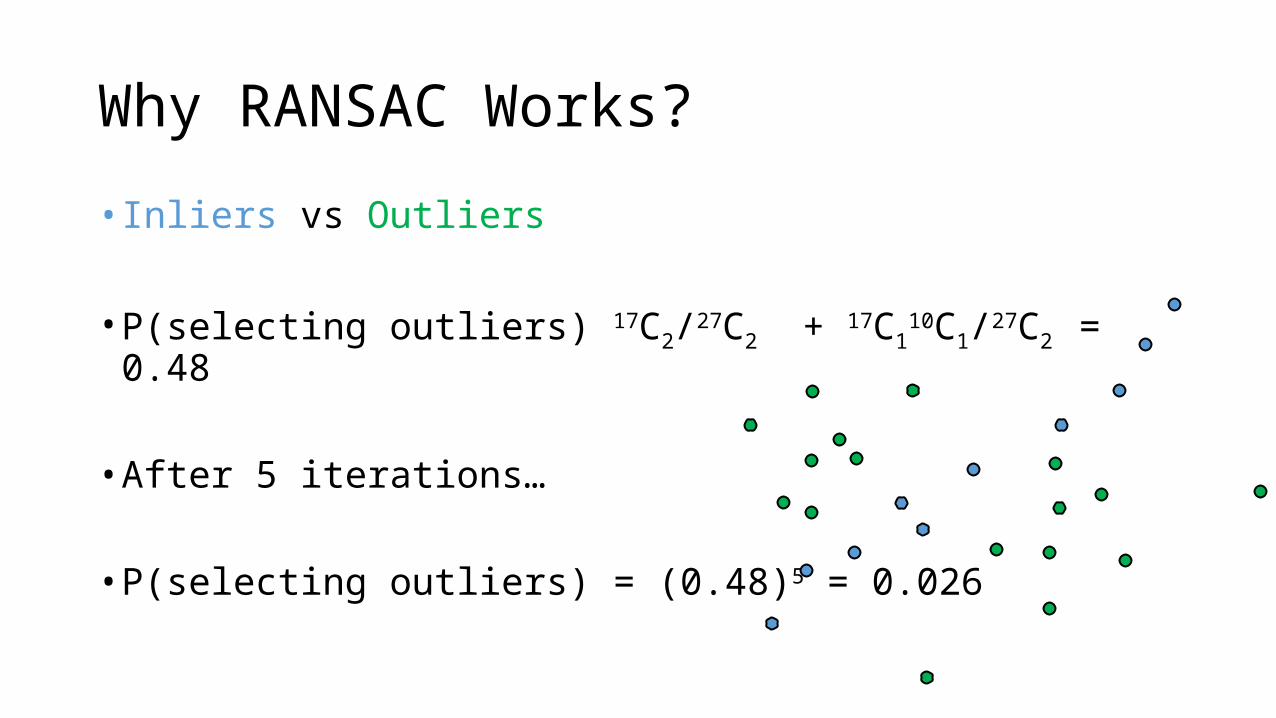
Why RANSAC Works?
• Inliers vs Outliers
• P(selecting outliers) = 17C2/27C2 + 17C110C1/27C2 = 0.48
Why RANSAC Works?
• Inliers vs Outliers
• P(selecting outliers) 17C2/27C2 + 17C110C1/27C2 = 0.48
• After 5 iterations…
• P(selecting outliers) = (0.48)5 = 0.026

Why RANSAC Works?
• In general:
• p = 1 – (1 - wn)k
Where, p = probability for selecting inliersw = ratio of inliers to total #pointsn = minimum #points required (for line = 2, circle =3)k = #iterations

RANSAC Algorithms
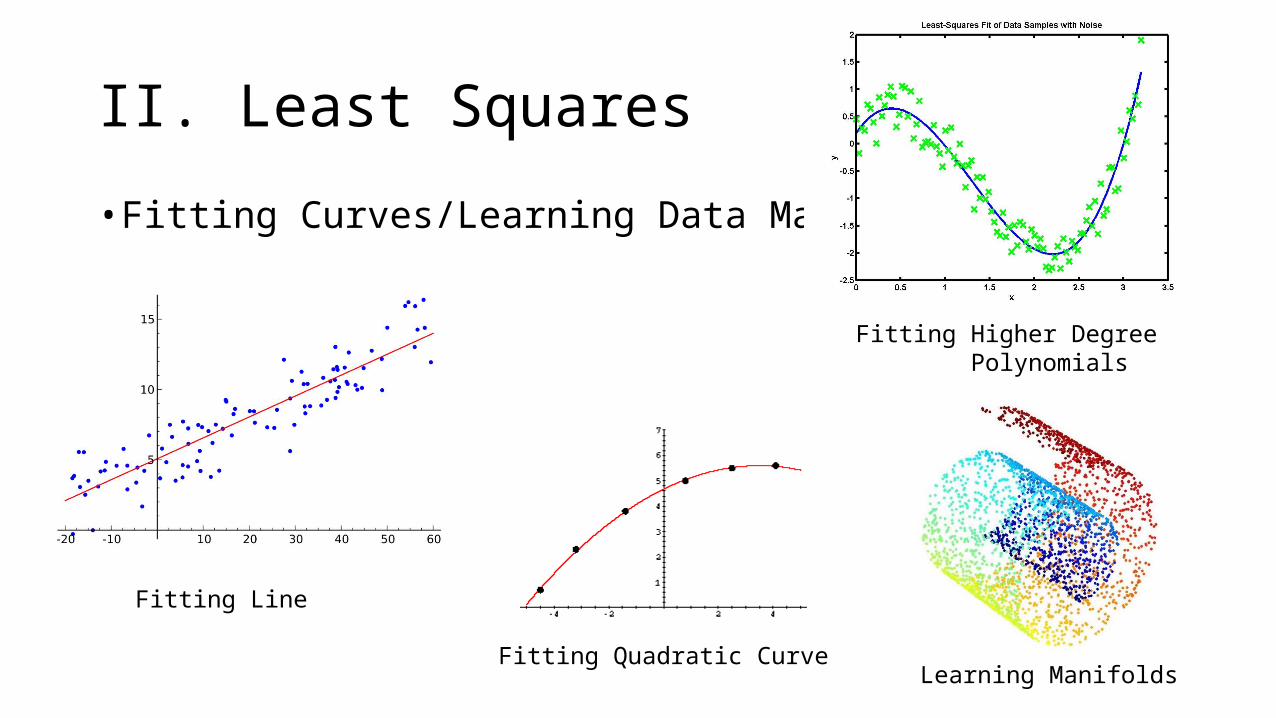
II. Least Squares
• Fitting Curves/Learning Data Manifolds
Fitting Line
Fitting Quadratic Curve
Fitting Higher Degree Polynomials
Learning Manifolds
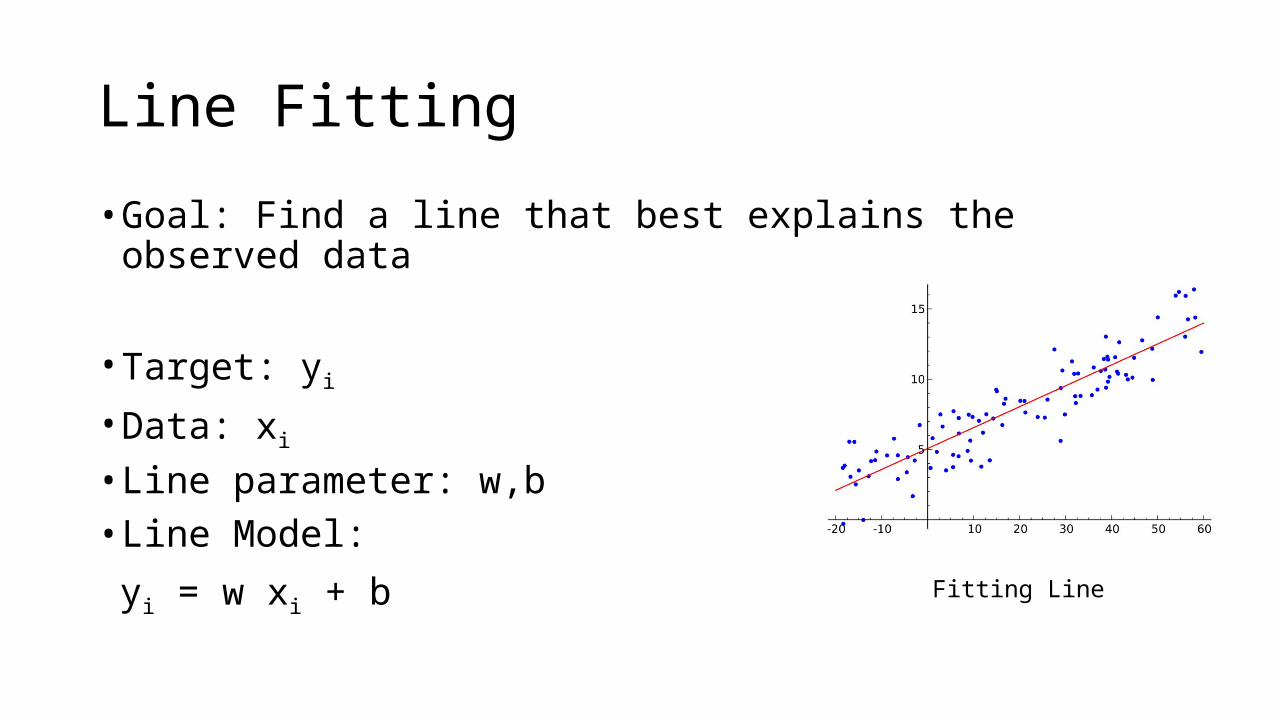
Line Fitting
• Goal: Find a line that best explains the observed data
• Target: yi
• Data: xi
• Line parameter: w,b• Line Model:
yi = w xi + bFitting Line
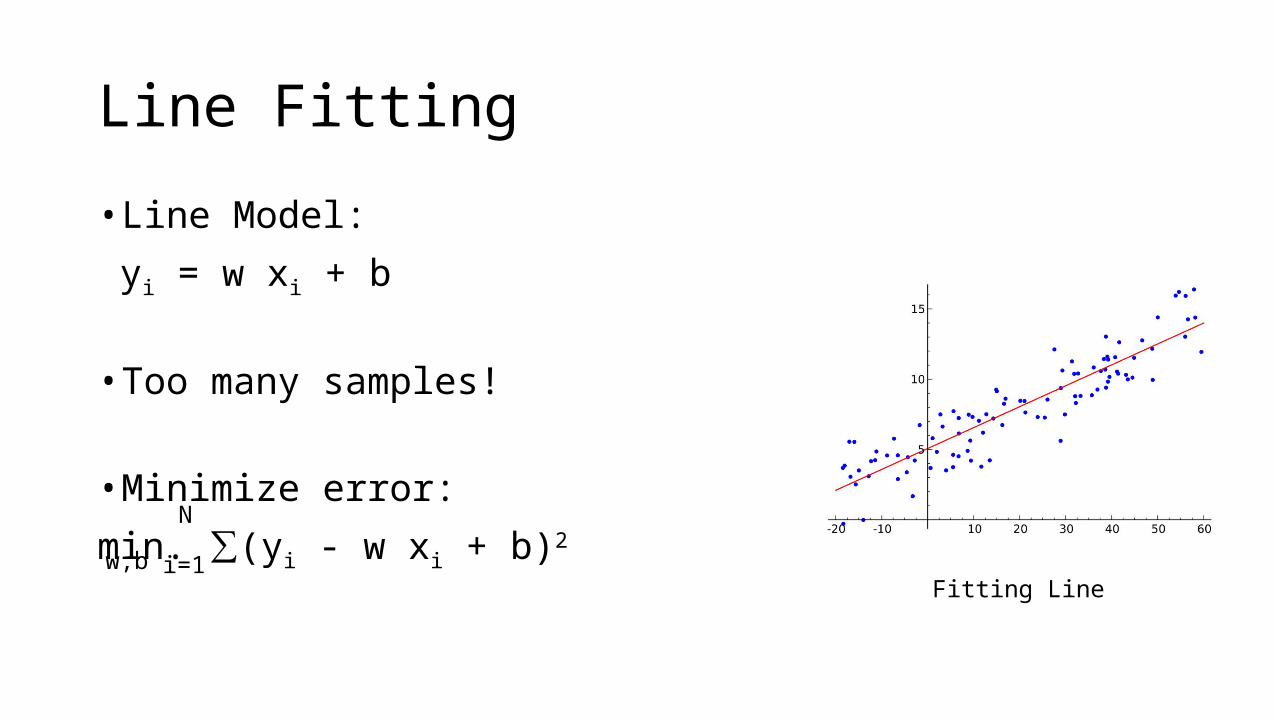
Line Fitting
• Line Model:
yi = w xi + b
• Too many samples!
• Minimize error:
min. ∑(yi - w xi + b)2
Fitting Linew,b i=1
N

#Samples(m) vs #Model-Parameters(n)• Case 1 (m=n): Unique Solution • w=X\y• No least square requires

#Samples(m) vs #Model-Parameters(n)
• Case 2 (m>n): Over-determined system of equations• No Solution exists!• Hence, we minimize error (fitting)

#Samples(m) vs #Model-Parameters(n)• Case 3 (m<n): Under-determined system of equations• Infinite Solutions exist!• Which one to choose?