csfb/aviation week aerospace & defense...
TRANSCRIPT

CSFB/Aviation Week
Aerospace & Defense Conference
December 6, 2005

Forward-looking Statements
Risks, Uncertainties, Other Factors with Respect to “Forward-Looking Statements”
Certain statements contained in this presentation constitute “forward-looking statements” within the meaning of the Private Securities Litigation Reform Act of 1995. Such statements that are not of historical fact constitute “forward-looking statements”and, accordingly, involve estimates, assumptions, judgments and uncertainties. There are a number of factors that could cause actual results or outcomes to differ materially from thoseaddressed in the forward-looking statements. Such factors are detailed in the Company’s Annual Report on Form 10-K and its amendments for the fiscal year ended December 31, 2004 filed with the Securities and Exchange Commission, along with Quarterly Reports on Form 10-Q subsequently filed with the SEC.

Leader in Advanced Structural Materials
Prepregs andreinforcements foraerospace, wind blades,recreation, and infrastructure
CarbonFiber
Reinforcements
Key RMTypical
Applications Products
CompositesPrepregHoneycomb core
Structures
Acrylonitrile
Body armorPrinted circuit boardsReinforcement forcomposites (RFC)Architectural products
Honeycomb core and prepregs for aerospace,wind, and recreations
Component assembliesfor aerospace
Aramid FiberCarbon FiberGlass Fiber
AluminumAramid PaperCarbon FiberGlass Fiber
Resins
AdhesivesHoneycomb
Prepregs
Product Lines

September 30, 2005 LTM Sales: $1,155 millionSeptember 30, 2005 LTM Sales: $1,155 million
Diversified End Markets
Industrial
• Ballistics
• Wind Energy
• Recreation
• Transportation
• Architectural
18%
45%
5%
32%
Commercial Aerospace• Boeing• Airbus• Engines/Nacelles• Regional/Business
Space & Defense
• Military Aircraft
• Launch Vehicles
• Satellites
• Missiles
Electronic Materials
• Switches & Routers
• Mainframes
• Cellular Infrastructure
• Microwave/HF equipment
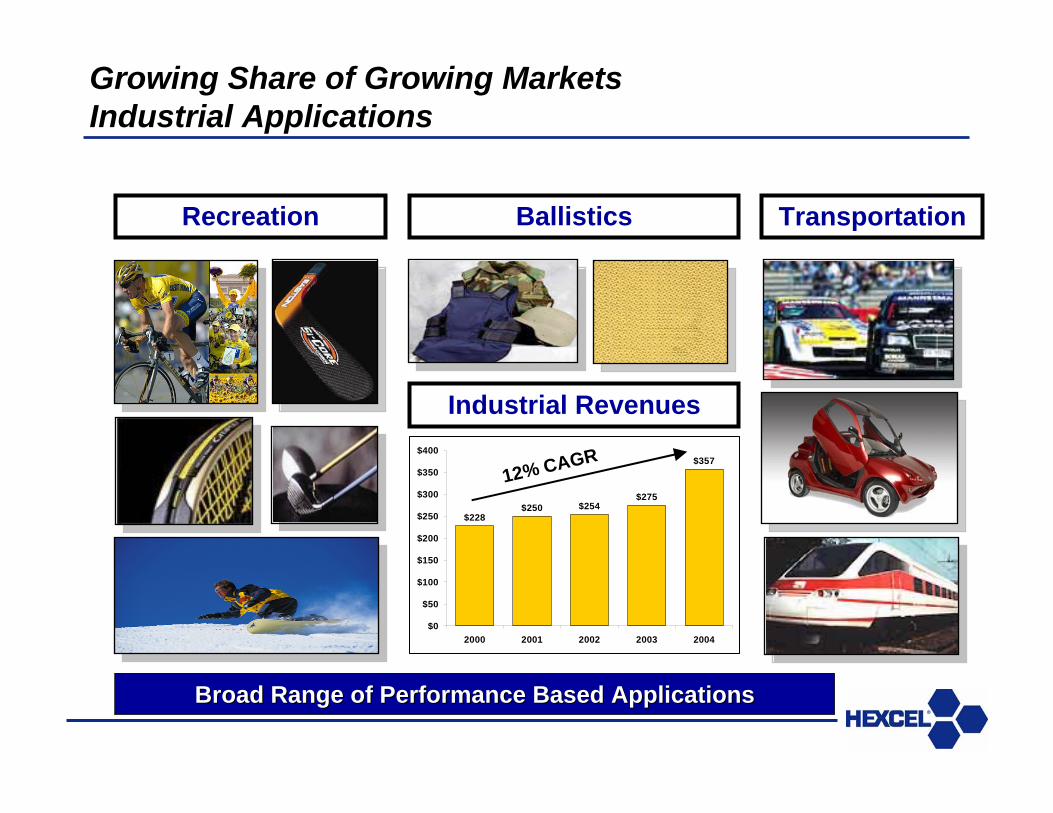
Growing Share of Growing MarketsIndustrial Applications
Broad Range of Performance Based ApplicationsBroad Range of Performance Based Applications
Recreation TransportationBallistics
Industrial Revenues
$228$250 $254
$275
$357
$0
$50
$100
$150
$200
$250
$300
$350
$400
2000 2001 2002 2003 2004
12% CAGR

Wind EnergyAnnual Global Wind Power Installations1
HexCoat® epoxy gel coat
Hexply®triax glass/epoxy prepreg
HexFIT® carbon/epoxy
Hexcel peel ply
Foam Insert
Hexply biax glass/epoxy prepreg/foam shear webHexFIT® carbon/epoxy
Multiple Hexcel Product
Applications
Composite Blade Fabrication
0
7,000
14,000
21,000
28,000
MW
Existing Capacity Forecast Prediction1990 2003 2008 2013
Global installed capacity grew 20% to 47,317 MW in 2004 Renewal of U.S. PTC is benefiting 2005 market growthTrends towards larger, more efficient energy blades
1 Source: www.AWEA.org.
Leading Hexcel Industrial Segment Growth in 2005Leading Hexcel Industrial Segment Growth in 2005

Growing Share of Growing MarketsComposites in Aerospace
Trends/PositionGrowing penetration of composites
Lightweight, stiff and strongLong life – no fatigueNo corrosion, low toxicityLow coefficient of thermal expansionStealth
Aluminum-LithiumAluminumCarbon Fiber CompositeCarbon Fiber Composite High TempTitaniumSteelOther
18%
43%
F35 (JS F)
Eurofighte r
Ra fa le
F/A 18 E/F
F22
V-22
Gripe n
F/A 18 C/D
B2
M ira ge 2000F117
F16
F15
1970 1980 1990 2000 2010
High
Low
Composite Penetration – Step Function Gain

Growing Share of Growing MarketsSpace and Defense
18%
Blackhawk Wide Chord BladeDiverse Range of Applications
Over 80 Active Programs
Top 10 Programs:
Represent less than 50% of Segment
3 Non-U.S. Military
Include:Transport AircraftFightersHelicoptersLaunch Vehicles
$129$143 $148
$179$193
2000 2001 2002 2003 2004
Major New Programs To Come
Unmanned Aerial Vehicles (UAV)
Euro Transport (A400M)
Joint Strike Fighter (JSF or F35)
Future Combat Systems (FCS)
New Composite Blade
Space & Defense Revenues
10.6% CAGR

CFRP
GFRP
GLARE
Hybrid (G+C)
CentralTorsion Box
43%
Each generation of aircraft has higher composite utilization
Airbus A380 (23%) highest to date
A380 composite content approximately 10x B747 with which it competes
Increasing Composite Penetration
Airbus A380 wing box7.5 tons of Hexcel composites

Composite Material Applications
1. Radome: Specialized glass prepregs. Flexcore® honeycomb2. Landing Gear Doors and Leg Fairings: Glass/carbon prepregs, honeycomb and
Redux bonded assembly. Special process honeycomb3. Galley, Wardrobes, Toilets: Fabricated Fibrelam panels4. Partitions: Fibrelam panel materials5. Wing to Body Fairing: Carbon/glass/aramid Prepregs. Honeycombs. Redux
adhesive6. Wing Assembly: (Trailing Edge Shroud Box) Carbon/glass prepregs. Nomex®
honeycomb. Redux bonded assembly7. Flying Control Surfaces - Ailerons, Spoilers, Vanes, Flaps: Glass/carbon/aramid
prepregs. Honeycomb. Redux adhesive8. Passenger Flooring: Fibrelam panels9. Engine Nacelles and Thrust Reversers: Carbon/glass prepregs. Nomex®
honeycomb. Special process parts10. Pylon Fairings: Carbon/glass prepregs. Bonded assembly. Redux adhesives11. Winglets: Carbon/glass prepregs12. Keel Beam: Carbon prepregs
13 Cargo Flooring: Fibrelampanels
14 Flaptrack Fairings:Carbon/glass prepregs. Special process parts
15 Overhead Storage Bins: Prepregs/fabricated Fibrelam panels
16 Ceiling and Side Wall Panels:Glass prepregs
17 Airstairs: Fabricated Fibrelampanels
18 Pressure Bulkhead: Carbonprepregs
19 Vertical Stabilizer: Carbon/glass/aramid prepregs
20 Rudder: Carbon/glassprepregs. Honeycomb bondedassembly
21 Horizontal Stabilizer:Carbon/glass Prepregs
22 Elevator: Carbon/glass prepregs. Honeycomb bonded assembly
23 Tail Cone: Carbon/glassprepregs
Broad Based Broad Based Composite UsageComposite Usage

Paradigm ShiftIncreasing Penetration of Composites
Composites Penetration Composites Penetration –– Step Change UnderwayStep Change Underway
A380
A340-500
777A330
A340
MD11
A320
A310
767757
MD-80
1980 1985 1990 1995 2000 2005
High
Low
43%
A380
B757 B767 5-6%
A320 B777 A340
787
A400M
A350
A310
A340 -500/600
10-15%
23%
50+%
39%
Composite Wing & Fuselage
Composite Wing
A380 Maiden Flight

Growing Share of Growing MarketsCommercial Aerospace Aircraft Deliveries 43%
Cyclical Recovery Underway
30 Year RPM CAGR of 5%+
China, India, Eastern Europe
Low Cost Carriers
Efficiency Demands
Combined with Secular Penetration of Composites
Hexcel sales of materials (excludes Structures) to Boeing and Airbus have grown despite the down cycle over the period 1999 – 2004 (2)
Aircraft deliveries -25%Hexcel Materials Sales +33%
B787 & A350 will Change the GameB787 & A350 will Change the Game
Average Sales/Aircraft
$0
$100
$200
$300
$400
$500
"99-00 "01-02 "03-04
10% CAGR
Note (2): See Form 10-K for Hexcel Commercial Aerospace sales to Boeing, Airbus and their subcontractors and aircraft deliveries for the period 1999 -2004
$ in
000’
s
294 311 325 303 305 320 360 400
491 527381 281 285 290
395620
1999 2000 2001 2002 2003 2004 2005E 2006E
BoeingAirbus
Boeing & Airbus Published Delivery Forecasts (1)
675
++
Note (1): 2006 Airbus Delivery Forecast derived from Wall Street estimates

Nine Month Performance
Strong Operating Leverage
(Non-GAAP: Adjusted to excluded non-recurring items)$ millions 2004 2005 +/-$Sales 798.1$ 878.5$ 80.4$ Gross Margin 171.0 194.8 23.8
% Gross M argin 21.4% 22.2% 29.6%
Operating Income (1) 71.2 94.6 23.4 % Operating Income 8.9% 10.8% 29.1%
Income Before Taxes (1) (2) 34.9 67.9 33.0 % Income Before Taxes 4.4% 7.7% 41.0%
Net Income (1) (2) (3) 24.8 61.9 37.1 % Net Income/(Loss) 3.1% 7.0% 46.1%
Diluted EPS (4) 0.26$ 0.65$ 0.39$
Notes:(1) Excludes litigation settlem ents , gain on sale of land in both years & transaction costs of 2005 secondary offering.(2) Excludes debt refinancing costs in both years and gain on dem utualization in 2004.(3) Hexcel continues to adjust its tax provis ion for its U.S. and Belgium operations through the establishm ent or re lease of a valuation allow ance.(4) Pro-form a diluted EPS based upon 94.8 m illion diluted shares in both periods.

Reconciliation of GAAP and Non-GAAP Measures
Reconciles Non GAAP Measures in Prior Chart
September Year-To Date$ millions 2004 2005GAAP Operating Income 68.2$ 78.5$
Litigation Settlements 7.0 16.5 Gain on Sale of Land (4.0) (1.4) Secondary Offering Transaction Costs - 1.0
Non-GAAP Operating Income 71.2$ 94.6$
GAAP Income Before Taxes 31.3 10.9 Litigation Settlements 7.0 16.5 Gain on Sale of Land (4.0) (1.4) Secondary Offering Transaction Costs - 1.0 Loss on Early Retirement of Debt, Net 1.6 40.9 Gain from Demutualization (1.0) -
Non-GAAP Income Before Taxes 34.9$ 67.9$
GAAP Net Income 21.2 4.9 Litigation Settlements 7.0 16.5 Gain on Sale of Land (4.0) (1.4) Secondary Offering Transaction Costs - 1.0 Loss on Early Retirement of Debt, Net 1.6 40.9 Gain from Demutualization (1.0) -
Non-GAAP Net Income 24.8$ 61.9$

Significant Operating Leverage
-35%-30%-25%-20%-15%-10%-5%0%5%
10%15%
Q2 Q3 Q4 Q1 Q2 Q3 Q4 Q1 Q2 Q3 Q4 Q1 Q2 Q3 Q4 Q1 Q2 Q3
Changes in Sales andHeadcount Levels Reduction in Leverage
$350
$400
$450
$500
$550
$600
$650
$700
$750
Q2 Q3 Q4Q1 Q2Q3 Q4 Q1Q2 Q3Q4 Q1 Q2Q3 Q4Q1 Q2 Q3
Net
Deb
t1x
2x
3x
4x
5x
6x
7x
Leverage Ratio
Headcount
LTM SalesLeverage Ratio
Net Debt
Right Sized & Right ShapedRight Sized & Right Shaped
2001 2002 2003 2004 2005 2001 2002 2003 2004 2005

www.hexcel.com