csms effectiveness test by basics · analysis was conducted to measure how effective the csms is at...
TRANSCRIPT

The Carrier Safety Measurement System (CSMS) Effectiveness Test by Behavior Analysis and Safety Improvement Categories (BASICs)
January 2014
Prepared for: Prepared by: Federal Motor Carrier Safety Administration John A. Volpe National Transportation 1200 New Jersey Avenue, SE Systems Center Washington, DC 20590 55 Broadway Cambridge, MA 02142 Prepared on: January 24, 2014

2
Table of Contents
Executive Summary ................................................................................................................................... 4
Background ............................................................................................................................................. 15
Purpose of this Paper .............................................................................................................................. 17
The 2012 CSMS Effectiveness Test (ET) .................................................................................................. 18
Effectiveness Test Results ....................................................................................................................... 20
Analysis 1: Carriers Identified and Prioritized for CSA Interventions .............................................. 20
Analysis 2: Carriers Identified as “High-Risk” for Congressionally Mandated Investigations ......... 24
Analysis 3: Crash Rate Trends by BASIC Percentile ........................................................................ 26
Summary of the Analyses ....................................................................................................................... 50
Conclusion ............................................................................................................................................... 52
Appendix A: ET Screening Explanation ................................................................................................... 53
Appendix B: Calculation of Adjusted Crash Rate .................................................................................... 59
Appendix C: For-Hire Combination Analysis ........................................................................................... 61
Appendix D: Safety Event Group BASIC Analysis .................................................................................... 68
List of Figures
Figure 1: Crash Rate by BASIC Identifying a Carrier for CSA Intervention ................................................... 9 Figure 2: Crash Rate by Number of BASICs Identifying a Carrier for CSA Intervention ............................. 11 Figure 3: 2012 CSMS Effectiveness Test Timeline ...................................................................................... 19 Figure 4: CSMS-Based Criteria to Determine High-Risk Carriers................................................................ 25 Figure 5: Unsafe Driving BASIC, Overall ..................................................................................................... 29 Figure 6: Unsafe Driving BASIC, Straight Segment ..................................................................................... 30 Figure 7: Unsafe Driving BASIC, Combination Segment ............................................................................. 31 Figure 8: HOS Compliance BASIC ............................................................................................................... 32 Figure 9: HOS Compliance BASIC, Straight Segment .................................................................................. 33 Figure 10: HOS Compliance BASIC, Combination Segment ....................................................................... 34 Figure 11: Driver Fitness BASIC .................................................................................................................. 35 Figure 12: Driver Fitness BASIC, Straight Segment .................................................................................... 36

3
Figure 13: Driver Fitness BASIC, Combination Segment ............................................................................ 37 Figure 14: Driver Fitness BASIC, For-Hire Combination Segment Carriers ................................................ 38 Figure 15: Controlled Substances/Alcohol BASIC ...................................................................................... 39 Figure 16: Controlled Substances/Alcohol BASIC, Straight Segment ......................................................... 40 Figure 17: Controlled Substances/Alcohol BASIC, Combination Segment ................................................ 41 Figure 18: Vehicle Maintenance BASIC ...................................................................................................... 42 Figure 19: Vehicle Maintenance BASIC, Straight Segment ........................................................................ 43 Figure 20: Vehicle Maintenance BASIC, Combination Segment ................................................................ 44 Figure 21: HM Compliance BASIC, Post-period Crash Rates ...................................................................... 45 Figure 22: HM Compliance BASIC, Post-period Violation Rates ................................................................ 46 Figure 23: Crash Indicator .......................................................................................................................... 47 Figure 24: Crash Indicator, Straight Segment ............................................................................................ 48 Figure 25: Crash Indicator, Combination Segment .................................................................................... 49
List of Tables
Table 1: Carriers Identified and Prioritized for CSA Interventions ............................................................... 5 Table 2: Total ET Carrier Population ............................................................................................................ 6 Table 3: Carriers Identified in 1 or more BASIC and Prioritized for CSA Interventions ................................ 7 Table 4: Carriers Identified and Prioritized for CSA Interventions by BASIC ................................................ 8 Table 5: Carriers Identified and Prioritized for CSA Interventions by Multiple BASICs ............................. 10 Table 6: Carriers Identified and Prioritized for CSA Interventions ............................................................. 20 Table 7: Total ET Carrier Population .......................................................................................................... 21 Table 8: Carriers Identified in 1 or more BASIC and Prioritized for CSA Interventions .............................. 22 Table 9: Carriers Not Prioritized for CSA Interventions ............................................................................. 22 Table 10: Carriers Identified and Prioritized for CSA Interventions by BASIC ............................................ 23 Table 11: Carriers Identified and Prioritized for CSA Interventions by Multiple BASICs ........................... 24 Table 12: CSMS ET High-Risk Carrier Results ............................................................................................. 25 Table 13: CSMS ET High-Risk Carrier Results Grouped by Carrier Size in Power Units .............................. 26
4
Executive Summary
The Federal Motor Carrier Safety Administration’s (FMCSA) core mission is to reduce crashes, injuries, and fatalities involving large trucks and buses. One important step in achieving this goal is to prioritize FMCSA enforcement resources on carriers that pose the highest future crash risk. The Carrier Safety Measurement System (CSMS) is FMCSA’s workload prioritization tool. This tool is used to identify carriers with potential safety issues so that they are subject to interventions (i.e., actions used by FMCSA to encourage or enforce safe motor carrier practices) as part of FMCSA’s enforcement program titled Compliance, Safety, Accountability (CSA).
CSMS is designed to cover the full range of safety-based regulations with which motor carriers must comply. CSMS uses safety performance data to rank each carrier’s relative performance in six separate Behavior Analysis and Safety Improvement Categories (BASICs): Unsafe Driving, Hours-of-Service (HOS) Compliance, Driver Fitness, Controlled Substances/Alcohol, Vehicle Maintenance, and Hazardous Material (HM) Compliance, as well as crash involvement (Crash Indicator). Carriers with a sufficient amount of safety data in a particular BASIC are assigned a BASIC percentile on a 0‒100 percentile scale (with 100 indicating the worst performance) based on the carrier’s violation rate for that BASIC. These BASIC percentiles are then used in the CSA program to identify and prioritize carriers for CSA interventions.1
Analysis was conducted to measure how effective the CSMS is at identifying the highest safety risk motor carriers by using the CSMS Effectiveness Test (ET). The ET model simulates CSMS results based on historical data. The basic structure of the ET is running CSMS results for carriers for a date in the past and then observing the subsequent crash involvement of the carriers. Analysis is then conducted to quantify the extent to which there are associations between particular CSMS results and future crash rates. These future crash rates are measured in crashes per 100 Power Units (PU). A Power Unit is a Commercial Motor Vehicle (CMV), usually a truck or bus, operated by a motor carrier. This paper presents three analyses based on the 2012 ET crash risk results.
Analysis 1: Carriers Identified and Prioritized for CSA Interventions
FMCSA, through its CSA program, identifies carriers with BASIC percentiles above CSMS Intervention Thresholds for appropriate contact and/or intervention.2 In addition to the CSMS BASIC percentiles being over the Intervention Threshold, a carrier is also identified for future intervention if it has any of a set of “serious” violations discovered during an investigation
1 A CSA intervention may include any of the following: a warning letter, targeted roadside inspection, investigation, or follow-on enforcement action. 2 Intervention Thresholds are defined at http://ai.fmcsa.dot.gov/sms/InfoCenter/default.aspx#question1561

5
conducted within the previous 12 months.3 Using the ET population of carriers, which is screened to ensure that carriers are active and have sufficient data4 for analysis, the table below depicts the future crash rates of carriers identified and prioritized for a CSA intervention compared to carriers not identified for a CSA intervention.
Table 1: Carriers Identified and Prioritized for CSA Interventions
Carrier Group Identified for Interventions
Number of Carriers Identified
Total PUs
Total Crashes
Crash Rate (Crashes
per 100 PU)
% Increase in Crash Rate
Compared to Not Identified Carriers
Identified in 1 or more BASICs 43,042 1,073,093 51,763 4.82 79%
Not Identified 235,276 2,017,018 54,222 2.69 0%
Overall, the CSMS ET results demonstrated that the group of carriers identified for a CSA intervention for any BASIC have a 79 percent higher future crash rate (4.82 crashes per 100 PU) than the group of carriers not identified for CSA interventions (2.69 crashes per 100 PU).
Analysis 1a: Carriers Identified and Prioritized for CSA Interventions by Size
The ET population of carriers is stratified by size in the next table and shows the relationships between carrier size and group crash rates. It is important to conduct such size-stratified analysis. The CSMS should identify carriers for intervention across all carrier populations and sizes so that the CSA program can hold as much of the carrier population accountable for safety as possible. It is also important to identify small carriers with safety problems because one goal of the CSA intervention process is to intervene early and change unsafe behavior before such problems become habitual. By intervening promptly with small carriers, FMCSA can proactively help these carriers establish strong safety practices before they expand their size.
3 Serious violations are defined in detail at http://csa.fmcsa.dot.gov/Documents/Serious_Violations.xlsx and generally denote either severe non-compliance or a pattern of violations by the motor carrier. 4 See Appendix A for data sufficiency requirements.

6
Table 2: Total ET Carrier Population
Carriers stratified by # of Power Units (PUs)
# of Carriers
% of Total
Carriers
Total PUs
% of Total PUs
Total Crashes
% of Total
Crashes
Crash Rate (per 100 PUs)
5 or Fewer PUs 209,915 75.4% 408,707 13% 15,691 15% 3.84 5 < PUs <= 15 42,678 15.3% 378,787 12% 13,799 13% 3.64 15 < PUs <= 50 18,476 6.6% 482,934 16% 17,934 17% 3.71 50 < PUs <= 500 6,701 2.4% 823,783 27% 28,884 27% 3.51 More than 500 PUs 548 0.2% 995,899 32% 29,677 28% 2.98 All Carriers 278,318 100% 3,090,110 100% 105,985 100% 3.43
Small companies make up most of the carrier population—75 percent of carriers have 5 or fewer PUs. While such small-sized carriers compose a small portion of the total number of PUs being operated during the ET (13 percent), they have a higher crash rate than larger carriers. This may be due in part to the ET screening criteria, which exclude carriers with no crashes or inspections during the CSMS time period and the post-identification crash period. More details on the screening criteria can be found in Appendix A.
However, many of these small carriers have very little safety information to make a meaningful safety assessment. FMCSA also has limited resources for interventions. For CSMS to work most effectively in this industry environment, the system must strike a balance of being highly selective with identifying small carriers for interventions (i.e., the group of carriers with the very worst safety problems) relative to large carriers while still holding all carriers accountable.
Table 3 applies the same PU stratification used in the prior table but depicts only those carriers that are identified for intervention in at least one BASIC. The table shows that for all size groups the CSMS is effectively isolating a subset of carriers with higher crash rates relative to those carriers not identified for interventions, and that this association is strongest for the groups of carriers operating fewer PUs.
7
Table 3: Carriers Identified in 1 or more BASIC and Prioritized for CSA Interventions
Carriers Stratified by # of
Power Units (PUs)
# of Carriers
% of Size-Stratified
ET Carrier Population Identified5
Total Power Units
Total Crashes
Crash Rate (per 100 PUs)
% Increase in Crash Rate
Compared to Not Identified
Carriers within
Stratification 5 or Fewer PUs 24,647 12% 56,731 4,336 7.64 137% 5 < PUs <= 15 10,253 24% 92,965 6,173 6.64 149% 15 < PUs <= 50 5,514 30% 145,894 8,693 5.96 117% 50 < PUs <= 500 2,359 35% 308,120 15,110 4.90 84% More than 500 PUs 269 49% 469,384 17,451 3.72 60% All Carriers 43,042 15% 1,073,093 51,763 4.82 79%
The third column in the above table, titled “% of Size-Stratified ET Carrier Population Identified,” shows that smaller percentages of small-sized carriers than large-sized carriers are being identified for interventions. For example, 12 percent of the carriers with 5 or fewer PUs are being identified for interventions while 49 percent of the carriers with more than 500 PUs are being identified for interventions. This means that the CSMS is being more selective with identifying smaller-sized carriers for interventions, while also being effective in finding sets of small carriers with high future crashes rates.
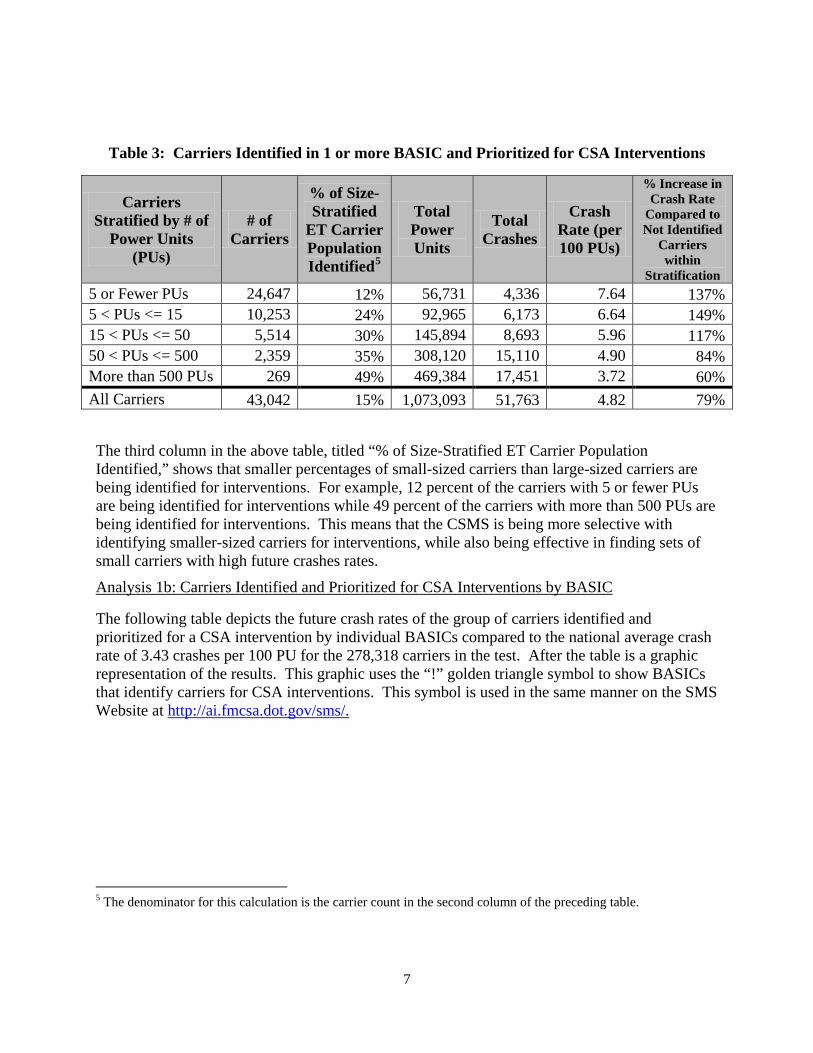
Analysis 1b: Carriers Identified and Prioritized for CSA Interventions by BASIC
The following table depicts the future crash rates of the group of carriers identified and prioritized for a CSA intervention by individual BASICs compared to the national average crash rate of 3.43 crashes per 100 PU for the 278,318 carriers in the test. After the table is a graphic representation of the results. This graphic uses the “!” golden triangle symbol to show BASICs that identify carriers for CSA interventions. This symbol is used in the same manner on the SMS Website at http://ai.fmcsa.dot.gov/sms/.
5 The denominator for this calculation is the carrier count in the second column of the preceding table.

8
Table 4: Carriers Identified and Prioritized for CSA Interventions by BASIC
BASIC Identified for Interventions
Number of Carriers
Identified
Total PUs
Total Crashes
Crash Rate (Crashes
per 100 PU)
% Increase in Crash Rate
Compared to National Average (3.43)
Unsafe Driving 9,594 194,756 12,888 6.62 93% Crash 4,662 246,463 15,638 6.34 85% HOS Compliance 22,558 343,114 21,462 6.26 83% Vehicle Maintenance 15,734 234,895 13,261 5.65 65%
Controlled Substances/Alcohol 2,914 44,945 2,070 4.61 34%
HM Compliance 746 250,892 11,266 4.49 31% Driver Fitness 5,067 323,038 10,047 3.11 -9%
9
Figure 1: Crash Rate by BASIC Identifying a Carrier for CSA Intervention

10
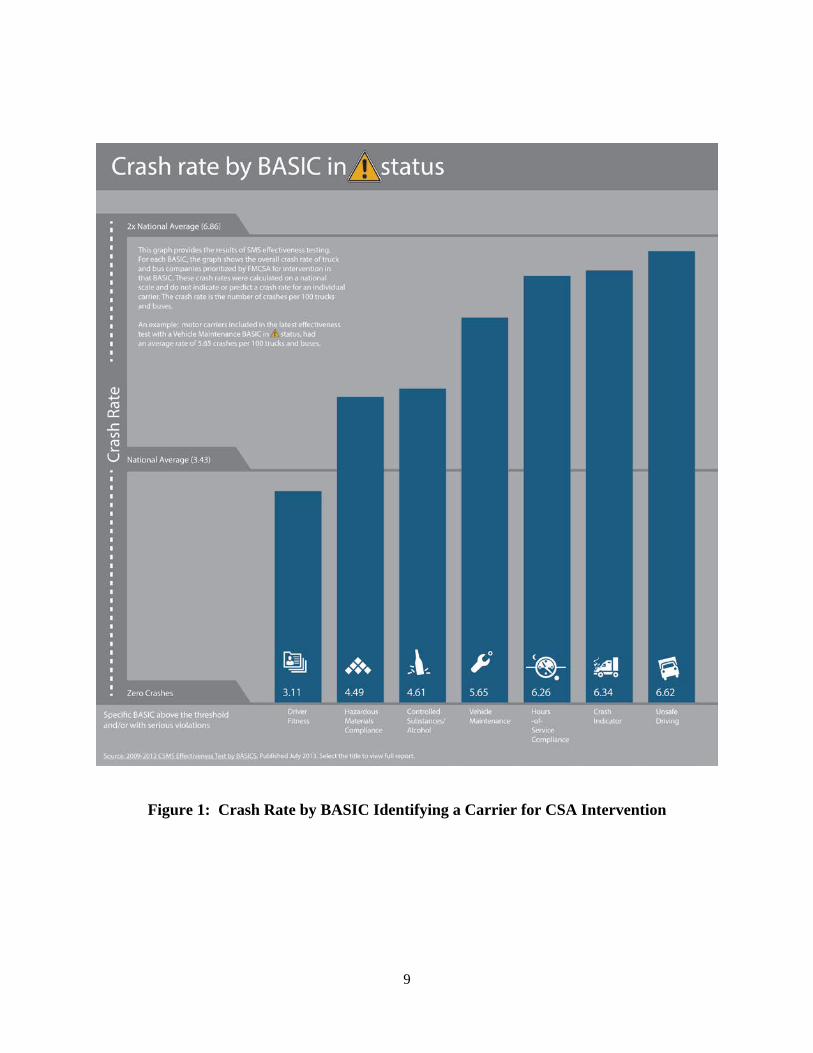
The ET results provide significant support for the Unsafe Driving, HOS Compliance, and Vehicle Maintenance BASICs, as well as the Crash Indicator as accurate gauges of high future crash risk. The group of carriers identified for CSA interventions for any of these BASICs has a 65-93 percent higher future crash rate than the national average. Two BASICs, HM Compliance and Controlled Substances/Alcohol, have smaller positive associations shown by crash rates 31 percent and 34 percent higher than the national average, respectively. The Driver Fitness BASIC did not have a positive association with higher crash rate. Possible explanations for these results are provided in the trend analysis section on each BASIC. The following table demonstrates that as the number of BASICs identifying carriers for interventions increases, the future crash rate of the carriers also increases. The group of carriers with no BASICs identified for interventions has a crash rate of 2.69 crashes per 100 PU. The crash rates steadily move up to a crash rate of 7.17 crashes per 100 PU for the group of carriers with 5 or more BASICs identified for interventions. The following figure is a graphic representation of the results. This graphic uses the “!” golden triangle symbol to show BASICs that identify carriers for CSA interventions.
Table 5: Carriers Identified and Prioritized for CSA Interventions by Multiple BASICs
# of BASICs Identified for Interventions
# of Carriers
Crash Rate (Crashes per 100 PU)
0 BASICs 235,276 2.69 1 BASIC 30,440 4.26 2 BASICs 8,572 5.77 3 to 4 BASICs 3,746 6.24 5+ BASICs 284 7.17
11
Figure 2: Crash Rate by Number of BASICs Identifying a Carrier for CSA Intervention
These results provide strong support for the use of the CSMS as a prioritization tool and the practice of applying more severe interventions for motor carriers with multiple BASICs identified for interventions.
12
Analysis 2: Carriers Identified as “High-Risk” for Congressionally Mandated Investigations
In section 4138 of SAFETEA-LU, Congress emphasized the importance of directing intervention resources toward high-risk motor carriers. The statute directs that “The [FMCSA] shall ensure that compliance reviews are completed on motor carriers that have demonstrated through performance data that they pose the highest safety risk.” These high-risk carriers are required by statute to receive an Onsite Investigation. Given the extensive resources needed to complete Onsite Investigations, it is important to be selective. Therefore, the criteria for identifying high-risk carriers are applied to the group of carriers identified for CSA interventions to focus resources on those carriers that pose the greatest safety risk.
The group of carriers that met the high-risk criteria established by FMCSA has more than twice the future crash rate (7.33 crashes per 100 PUs) than the crash rate of the general population (3.43 crashes per 100 PUs).6 These high-risk carriers even have a higher crash rate than motor carriers with 5+ BASICs identified for intervention in Analysis 1b. These results indicate that the high-risk criteria are finding a set of carriers based on their performance data with very high future crash rates, consistent with the intent of Congress.
Analysis 3: Crash Rate Trends by BASIC Percentile
When examining the future crash rates of carriers across the entire percentile spectrum for each BASIC, the ET results show that the strongest associations are in the Unsafe Driving, HOS Compliance, and Vehicle Maintenance BASICs, and the Crash Indicator. The graphs for each of these BASICs (depicted in the Effectiveness Test Results, “Analysis 3” section of this paper beginning on page 26) show the three elements that indicate a strong trend: (1) high crash rates for high percentiles relative to the national crash rate, (2) a trend line with a steep positive slope, and (3) a high correlation value attesting that the trend line closely represents the percentile crash data. Additional analysis in Appendix D shows that these strong associations remain for groups of carriers with small amounts of safety event data (e.g., inspections) and large amounts of safety event data.
The BASICs that do not provide evidence of a strong association with future crash rate are shown to be effective as safety indicators in other ways. The Driver Fitness BASIC, for instance, does not have a strong association with future crash rate in the CSMS ET at the national level. However, the Driver Fitness percentiles of the for-hire, Combination segment carriers7
6 The full high-risk criteria are explained in the section titled Effectiveness Test Results, “Analysis 2” of this paper, on pages 24-26. In short, a carrier must either 1) have a total of four or more BASICs at or above the “all other” threshold, which is the 65th percentile for the Unsafe Driving BASIC, HOS Compliance BASIC and Crash Indicator BASIC, and the 80th percentile for the remaining four BASICs; or 2) be at the 85th percentile in the Unsafe Driving, HOS Compliance, or Crash Indicator BASICs and at the “all other” threshold in any other BASIC. 7 “Combination segment carriers” are those with Combination trucks/motorcoach buses making up at least 70 percent of their fleet – see Appendix B for details on segmentation.

13
(which comprise 50 percent of the carriers assigned a percentile in this BASIC) showed an association with future crash rate.
The relatively weaker association between Controlled Substances/Alcohol BASIC percentiles and future crash rates may in part be due to how few of these violations are found during roadside inspections. While infrequent identification of commercial motor vehicle (CMV) drivers using controlled substances or alcohol is beneficial from a public safety perspective, it means there are few violations from which to draw a carrier-level trend. Furthermore, the vast majority of Controlled Substances/Alcohol regulations are related to the administration of testing at the carrier level and are not observable or confirmed at the roadside. Other analysis has shown statistically positive correlations between alcohol/drug related violations and crash rates.8 The results of this BASIC are used in CSA to send resources to enforce Controlled Substances/Alcohol testing regulations to carriers with the highest violations rates. This approach strengthens enforcement of the testing regulations, which lowers the occurrence of drug and alcohol use by CMV drivers.
Finally, the HM Compliance BASIC does not show a strong association with future crash rate; however, it is not intended to identify such an association as the regulations used in this BASIC focus on the reduction of crash severity/consequences, not crash frequency. To address this issue of crash severity, additional ET analysis showed that the HM BASIC percentile results are a strong predictor of carriers at risk for future HM violations that could increase the consequences of crashes.
The results of the trend analysis for the Driver Fitness, Controlled Substances/Alcohol and HM Compliance BASICs touch on some challenges of the ET approach. It was necessary to modify the ET to incorporate risks associated with crash consequences (e.g., HM spills). In the case of assessing the Driver Fitness and Controlled Substances/Alcohol BASICs, the ET applies a carrier-level approach that may not pick up infrequent but severe public safety risks (e.g., use of drugs & alcohol, physically unqualified drivers). The ET model may be modified in the future to further address these limitations.
8 Carrier Safety Measurement System (CSMS) Violation Severity Weights (revised December 2010), pg. 4-14 http://federal.eregulations.us/rulemaking/document/FMCSA-2004-18898-0210
14
In conclusion, these three analyses provide solid evidence that the CSMS as a tool is effectively supporting FMCSA in its mission to reduce crashes, injuries, and fatalities involving large trucks and buses by improving safety and compliance. The CSMS gives FMCSA’s CSA intervention process strong candidates for safety improvement by identifying groups of carriers through non- compliance and high crash risk. The CSMS ET continues to show that the group of carriers identified for CSA interventions and the group of carriers identified as high risk have higher future crash rates than other active carriers not identified for interventions, indicating that the CSMS is working effectively as a prioritization tool. These results also show that CSMS is identifying carriers with higher future crash rates across the spectrum of the carrier sizes and over varying amounts of carrier safety data. This allows the CSA program to hold a large portion of the motor carrier industry accountable.
Further analysis can be performed on the ability to identify high risk carriers using multiple BASIC results. This ET model can also be used to test future improvements to the CSMS methodology and CSA intervention policy and be updated to observe changes in motor carrier safety and safety regulations.
15
Background
Compliance, Safety, Accountability (CSA) is the Federal Motor Carrier Safety Administration (FMCSA) program designed to improve large truck and bus safety, and ultimately prevent crashes, injuries, and fatalities involving commercial motor vehicles (CMVs). It is an enforcement and compliance model that allows FMCSA and its State Partners to contact a larger number of carriers earlier than was previously possible to address safety problems before crashes occur.
CSA consists of three components: (1) the Carrier Safety Measurement System (CSMS), (2) the intervention process, and (3) the Safety Fitness Determination Rule. The CSMS is the system component of CSA, and uses inspection, investigation, and crash data to assist the Agency in prioritizing motor carriers for intervention. The process refers to the Agency’s intervention tools, designed to allow the Agency to reach more carriers with its limited resources than was possible under the previous process. Finally, the rule refers to the Safety Fitness Determination rulemaking that would allow the Agency to utilize all available roadside inspection data in conjunction with Onsite Investigation data to regularly determine whether a motor carrier is unfit to continue operations.
CSMS is designed to cover the full range of safety-based regulations with which motor carriers must comply. CSMS uses safety performance data to rank each carrier’s relative performance in any of six Behavior Analysis and Safety Improvement Categories (BASICs) as well as crash involvement (Crash Indicator). FMCSA developed the BASICs under the premise that CMV crashes can be traced to the behavior of motor carriers and/or CMV drivers. Increased compliance in these areas can reduce the crash risk. The BASICs are based on data collected during driver and vehicle safety inspections and from State-reported CMV crash records. These data are recorded in the Motor Carrier Management Information System (MCMIS). In addition, motor carrier census data, also recorded in MCMIS, are used for the identification and normalization of safety event data. For a detailed description of the design of the CSMS and the BASICs, please see the CSMS Methodology Version 3.0.1.9
The system component, CSMS, supports CSA by measuring the relative safety performance of individual motor carriers. FMCSA uses the CSMS to: (1) prioritize those motor carriers for CSA interventions, and (2) select high-risk carriers for Onsite Investigations to meet a Congressional mandate in Section 4138 of SAFETEA-LU. The CSMS also allows for continued monitoring of motor carriers by tracking their compliance with safety regulations over time.
9 http://csa.fmcsa.dot.gov/Documents/SMSMethodology.pdf

16
The process for assessing a carrier’s performance in each BASIC and the Crash Indicator is as follows. First, relevant inspection, violation, and crash data obtained from the MCMIS are attributed to a carrier to create a safety event history for the carrier. Then, each carrier’s violations are classified into a BASIC and are severity-weighted and time-weighted. The severity weight assigned to each violation reflects that violation’s association with crash occurrence and crash consequences. These severity weights help differentiate the levels of crash risk associated with the violations used in each BASIC. For a detailed description of the derivation and analysis of violation severity weights, see “Carrier Safety Measurement System (CSMS) Violation Severity Weights.”10 The time weight applied to violations and inspections increases the emphasis on more recent events.
Next, each carrier’s time and severity weighted violations are added and normalized to form a quantifiable measure for a carrier in each BASIC. Finally, a percentile rank is assigned on a 0‒100 scale for each carrier with a measure, with 100 indicating the worst performance. This percentile is based on a comparison of each carrier’s BASIC measure to other carriers with a similar number of safety events.11 The CSMS applies similar steps to crash data to calculate carrier Crash Indicator percentiles. FMCSA, through its CSA program, selects carriers with BASIC percentiles above CSMS Intervention Thresholds for appropriate intervention.12
In addition, a carrier is prioritized for intervention if it has any of a set of “serious” violations discovered during an investigation within the previous 12 months. Each of these serious violations is tied to a BASIC, and when found a serious violation will identify the carrier as having a safety issue with that BASIC.13 The number and type of BASICs that are “identified for interventions” determine the carrier’s priority to receive an intervention. This information also contributes to recommending a specific type of intervention (e.g., warning letter, focused investigation, comprehensive investigation) that the carrier will receive. The ultimate goal of the prioritization and intervention selection is to maximize the safety impact of FMCSA’s limited investigative resources.
10 http://federal.eregulations.us/rulemaking/document/FMCSA-2004-18898-0210 11The full process for assigning percentile ranks is available in the SMS Methodology:
http://csa.fmcsa.dot.gov/Documents/SMSMethodology.pdf 12 http://ai.fmcsa.dot.gov/sms/InfoCenter/default.aspx#question1561 13 http://csa.fmcsa.dot.gov/Documents/Serious_Violations.xlsx

17
Purpose of this Paper
FMCSA’s core mission is to reduce crashes, injuries, and fatalities involving large trucks and buses. One important step in achieving this goal is to prioritize FMCSA enforcement resources on carriers that pose the highest future crash risk. The CSMS is FMCSA’s primary workload prioritization tool.
This paper quantifies the effectiveness of the current CSMS methodology and intervention policy at identifying high safety risk carriers by explaining the modeling, analysis, and outcomes of the CSMS Effectiveness Test (ET). The ET model simulates CSMS results based on historical data. The basic structure of the ET is running CSMS results for carriers for a date in the past and then observing the subsequent crash involvement of the carriers. Analysis is then conducted to quantify the extent to which there are associations between particular CSMS results and future crash rate. This paper will show the ET crash risk results of three analyses:
Analysis 1: Carriers Identified and Prioritized for CSA Interventions
Analysis 2: Carriers Identified as “High-Risk” for Congressionally Mandated Investigations
Analysis 3: Crash Rate Trends by BASIC Percentile
This paper focuses on the effectiveness of the current CSMS methodology and CSA intervention policy. This approach of applying CSMS ET results, however, can also quantify the impact of potential changes and provide insight into how to improve CSMS and CSA intervention policy.
18
The 2012 CSMS Effectiveness Test (ET)
This paper is based on the 2012 ET. It includes an examination of motor carriers that were assessed by the CSMS in January 2011 and their subsequent crash involvement over the following 18-month period through June 2012. The approach of observing future crash involvement in a monitoring period after CSMS assessment reflects how the program works from an operational standpoint and captures the actual risk of crash occurrence. This approach was chosen to examine how well the CSMS is functioning to support its primary purpose of identifying groups of motor carriers for intervention.
Analysis was conducted by grouping sets of carriers based on the various CSMS results and calculating the collective crash rate for each set over the course of the 18-month post-identification crash period. These sets of carriers are selected based on the type of analysis being conducted. For example, the set of carriers identified for CSA interventions via CSMS results and the set of carriers not identified for CSA interventions can be used to determine if CSMS and corresponding CSA intervention selection policy are finding carriers with higher subsequent crash rates. The analysis using the ET was accomplished by:
(1) Performing a simulated CSMS identification run that calculates carrier percentile ranks for each BASIC as of January 2011 using historical data from calendar years 2009 and 2010. The ET was run in this time period to allow sufficient time (18 months) for the ‘post-identification crash period’ to calculate future crash rates, as well as extra time to allow for the time lag in crash reporting;
(2) Observing each carrier’s crash involvement over the 18-month period immediately following the simulated CSMS timeframe (i.e., the post-identification crash period, January 2011 to June 2012); and
(3) Grouping sets of carriers based on their CSMS results and calculating the collective crash rate for each set based on the crashes that occurred over the 18-month post- identification crash period.
19
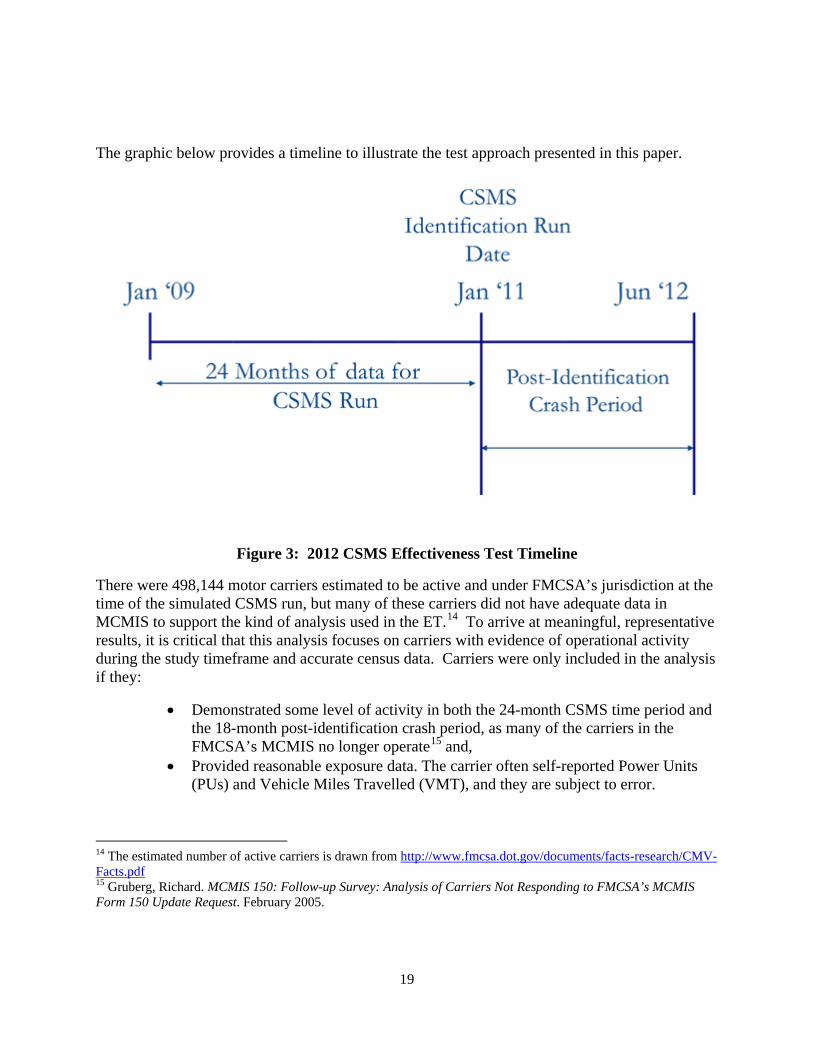
The graphic below provides a timeline to illustrate the test approach presented in this paper.
Figure 3: 2012 CSMS Effectiveness Test Timeline
There were 498,144 motor carriers estimated to be active and under FMCSA’s jurisdiction at the time of the simulated CSMS run, but many of these carriers did not have adequate data in MCMIS to support the kind of analysis used in the ET.14 To arrive at meaningful, representative results, it is critical that this analysis focuses on carriers with evidence of operational activity during the study timeframe and accurate census data. Carriers were only included in the analysis if they:
• Demonstrated some level of activity in both the 24-month CSMS time period and the 18-month post-identification crash period, as many of the carriers in the FMCSA’s MCMIS no longer operate15 and,
• Provided reasonable exposure data. The carrier often self-reported Power Units (PUs) and Vehicle Miles Travelled (VMT), and they are subject to error.
14 The estimated number of active carriers is drawn from http://www.fmcsa.dot.gov/documents/facts-research/CMV-Facts.pdf 15 Gruberg, Richard. MCMIS 150: Follow-up Survey: Analysis of Carriers Not Responding to FMCSA’s MCMIS Form 150 Update Request. February 2005.

20
Appendix A provides a more detailed explanation of the screens applied to exclude carriers from the ET analysis. There were 278,318 motor carriers that passed these screening criteria and are included in the analysis. These screens help mitigate the potential impacts of carriers that are out of business or not in operation throughout the study timeframe.
Effectiveness Test Results
Analysis 1: Carriers Identified and Prioritized for CSA Interventions FMCSA, through its CSA program, identifies carriers with BASIC percentiles above CSMS Intervention Thresholds for appropriate contact and/or intervention.16 In addition to the CSMS BASIC percentiles being over the Intervention Threshold, a carrier is also identified for future intervention if it has any of a set of “serious” violations discovered during an investigation conducted within the previous 12 months.17 Using the ET population of carriers, Table 6 depicts the future crash rates of carriers identified and prioritized for a CSA intervention compared to carriers not identified.
Table 6: Carriers Identified and Prioritized for CSA Interventions
Carrier Group Identified for Interventions
Number of Carriers Identified
Total PUs
Total Crashes
Crash Rate (Crashes
per 100 PU)
% Increase in Crash Rate
Compared to Not Identified Carriers
Identified in 1 or more BASICs 43,042 1,073,093 51,763 4.82 79%
Not Identified 235,276 2,017,018 54,222 2.69 0%
Overall, the CSMS ET results demonstrated that the group of carriers identified for a CSA intervention for any BASIC have a 79 percent higher future crash rate (4.82 crashes per 100 PU) than the group of carriers not identified for CSA interventions (2.69 crashes per 100 PU).
Analysis 1a: Carriers Identified and Prioritized for CSA Interventions by Size
The ET population of carriers is stratified by size in Table 7 to show the relationships between carrier size and group crash rates. It is important to conduct such size-stratified analysis. The CSMS should identify carriers for intervention across all carrier populations and sizes, so that the CSA program can hold as much of the carrier population accountable for safety as possible. It is also important to identify small carriers with safety problems. One goal of the CSA intervention process is to intervene early and change unsafe behavior before such problems become habitual.
16 Intervention Thresholds are defined at http://ai.fmcsa.dot.gov/sms/InfoCenter/default.aspx#question1561 17 Serious violations are defined in detail at http://csa.fmcsa.dot.gov/Documents/Serious_Violations.xlsx and generally denote either severe non-compliance or a pattern of violations by the motor carrier.

21
By intervening promptly with small carriers, FMCSA can proactively help these carriers establish strong safety practices before they expand their size.
Table 7: Total ET Carrier Population
Carriers stratified by # of Power Units (PUs)
# of Carriers
% of Total
Carriers
Total PUs
% of Total PUs
Total Crashes
% of Total
Crashes
Crash Rate (per 100 PUs)
5 or Fewer PUs 209,915 75.4% 408,707 13% 15,691 15% 3.84 5 < PUs <= 15 42,678 15.3% 378,787 12% 13,799 13% 3.64 15 < PUs <= 50 18,476 6.6% 482,934 16% 17,934 17% 3.71 50 < PUs <= 500 6,701 2.4% 823,783 27% 28,884 27% 3.51 More than 500 PUs 548 0.2% 995,899 32% 29,677 28% 2.98 All Carriers 278,318 100% 3,090,110 100% 105,985 100% 3.43
Small companies make up most of the carrier population—75 percent of carriers have five or fewer PUs. While such small-sized carriers compose a small portion of the total number of PUs being operated during the ET (13 percent), they have a higher crash rate than larger carriers. This may be due in part to the ET screening criteria that exclude carriers with no crashes or inspections during the CSMS time period and the post-identification crash period. More details on the screening criteria can be found in Appendix A.
However, many of these small carriers have very little safety information to make a meaningful safety assessment. FMCSA also has limited resources for interventions. For CSMS to work best in this industry environment, the system must strike a balance of being highly selective with identifying small carriers for interventions (i.e., the group of carriers with the very worst safety problems) relative to large carriers while still holding all carriers accountable.
Table 8 applies the same PU stratification used in the prior table but depicts only those carriers that are identified for intervention in at least one BASIC. The table shows that for all size groups the CSMS is effectively isolating a subset of carriers with higher crash rates relative to those carriers not identified for interventions. This association is strongest for the groups of carriers operating fewer PUs.

22
Table 8: Carriers Identified in 1 or more BASIC and Prioritized for CSA Interventions
Carriers Stratified by # of
Power Units (PUs)
# of Carriers
% of Size-Stratified
ET Carrier Population Identified18
Total Power Units
Total Crashes
Crash Rate (per 100 PUs)
% Increase in Crash Rate
Compared to Not Identified
Carriers within
Stratification 5 or Fewer PUs 24,647 12% 56,731 4,336 7.64 137% 5 < PUs <= 15 10,253 24% 92,965 6,173 6.64 149% 15 < PUs <= 50 5,514 30% 145,894 8,693 5.96 117% 50 < PUs <= 500 2,359 35% 308,120 15,110 4.90 84% More than 500 PUs 269 49% 469,384 17,451 3.72 60% All Carriers 43,042 15% 1,073,093 51,763 4.82 79%
The third column in Table 8 above, titled “% of Size-Stratified ET Carrier Population Identified” shows that smaller percentages of small-sized carriers than large-sized carriers are being identified for interventions. For example, 12 percent of the carriers with five or fewer PUs are being identified for interventions while 49 percent of the carriers with more than 500 PUs are being identified for interventions. This means that the CSMS is being more selective with identifying smaller-sized carriers for interventions while also being effective in finding sets of small carriers with high future crashes rates. For additional comparison, Table 9 below shows those carriers that were not identified for intervention in any BASIC and their crash rates.
Table 9: Carriers Not Prioritized for CSA Interventions
Carriers Stratified by # of
Power Units (PUs)
# of Carriers
% of Size-Stratified
ET Carrier Population Identified19
Total Power Units
Total Crashes
Crash Rate (per 100
PUs)
5 or Fewer PUs 185,268 88% 351,977 11,355 3.23 5 < PUs <= 15 32,425 76% 285,822 7,626 2.67 15 < PUs <= 50 12,962 70% 337,040 9,241 2.74 50 < PUs <= 500 4,342 65% 515,664 13,774 2.67 More than 500 PUs 279 51% 526,515 12,226 2.32 All Carriers 235,276 85% 2,017,018 54,222 2.69
18 The denominator for this calculation is the carrier count in the second column of Table 7. 19 The denominator for this calculation is the carrier count in the second column of Table 7.

23
Analysis 1b: Carriers Identified and Prioritized for CSA Interventions by BASIC
Table 10 depicts the future crash rates in the post-identification crash period of the group of carriers identified and prioritized for a CSA intervention by individual BASICs compared to the national average crash rate of 3.43 crashes per 100 PU for all 278,318 carriers in the test.
Table 10: Carriers Identified and Prioritized for CSA Interventions by BASIC
BASIC Identified for Interventions
Number of Carriers
Identified
Total PUs
Total Crashes
Crash Rate
(Crashes per 100
PU)
% Increase in Crash Rate
Compared to National Average (3.43)
Unsafe Driving 9,594 194,756 12,888 6.62 93% Crash 4,662 246,463 15,638 6.34 85% HOS Compliance 22,558 343,114 21,462 6.26 83% Vehicle Maintenance 15,734 234,895 13,261 5.65 65%
Controlled Substances/Alcohol 2,914 44,945 2,070 4.61 34%
HM Compliance 746 250,892 11,266 4.49 31% Driver Fitness 5,067 323,038 10,047 3.11 -9%
The ET results provide significant support for the Unsafe Driving, HOS Compliance, and Vehicle Maintenance BASICs as well as the Crash Indicator as accurate gauges of high future crash risk. The group of carriers identified for CSA interventions for any of these BASICs has a 65-93 percent higher future crash rate than the national average. Two BASICs, HM Compliance and Controlled Substances/Alcohol, have smaller positive associations shown by crash rates 31 percent and 34 percent higher than the national average, respectively. The Driver Fitness BASIC did not have a positive association with higher crash rate. Possible explanations for these results are provided in the trend analysis section on each BASIC.
24
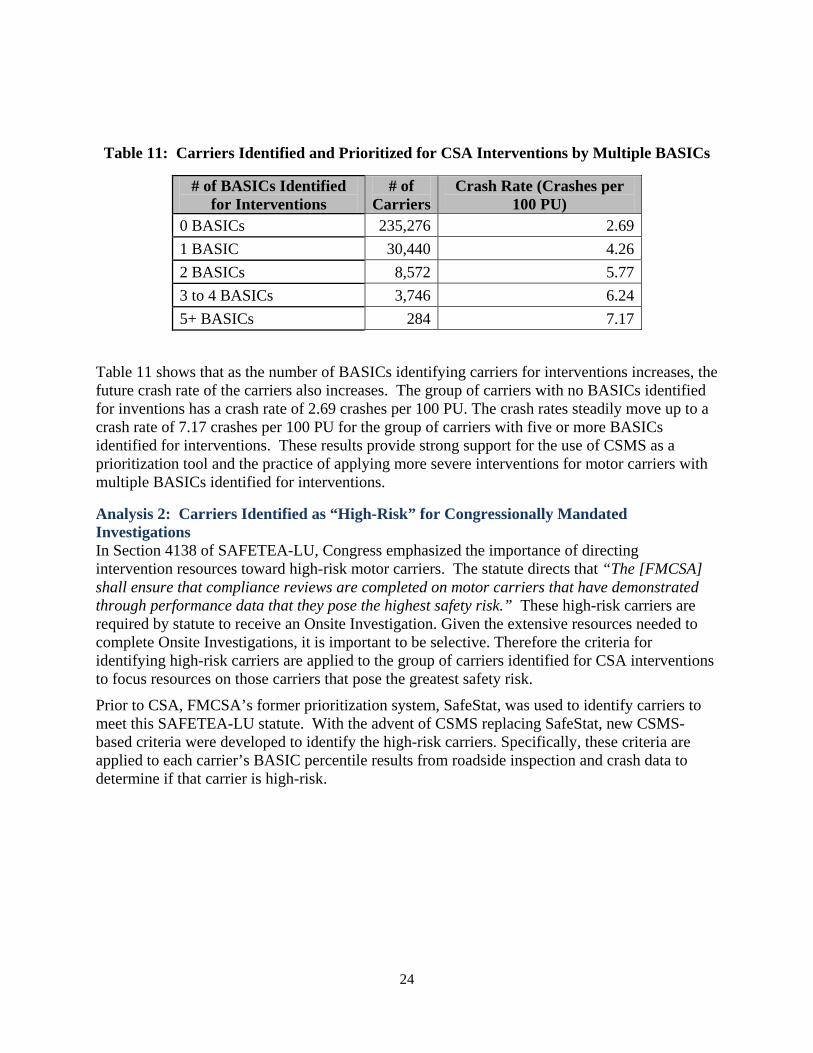
Table 11: Carriers Identified and Prioritized for CSA Interventions by Multiple BASICs
# of BASICs Identified for Interventions
# of Carriers
Crash Rate (Crashes per 100 PU)
0 BASICs 235,276 2.69 1 BASIC 30,440 4.26 2 BASICs 8,572 5.77 3 to 4 BASICs 3,746 6.24 5+ BASICs 284 7.17
Table 11 shows that as the number of BASICs identifying carriers for interventions increases, the future crash rate of the carriers also increases. The group of carriers with no BASICs identified for inventions has a crash rate of 2.69 crashes per 100 PU. The crash rates steadily move up to a crash rate of 7.17 crashes per 100 PU for the group of carriers with five or more BASICs identified for interventions. These results provide strong support for the use of CSMS as a prioritization tool and the practice of applying more severe interventions for motor carriers with multiple BASICs identified for interventions.
Analysis 2: Carriers Identified as “High-Risk” for Congressionally Mandated Investigations In Section 4138 of SAFETEA-LU, Congress emphasized the importance of directing intervention resources toward high-risk motor carriers. The statute directs that “The [FMCSA] shall ensure that compliance reviews are completed on motor carriers that have demonstrated through performance data that they pose the highest safety risk.” These high-risk carriers are required by statute to receive an Onsite Investigation. Given the extensive resources needed to complete Onsite Investigations, it is important to be selective. Therefore the criteria for identifying high-risk carriers are applied to the group of carriers identified for CSA interventions to focus resources on those carriers that pose the greatest safety risk.
Prior to CSA, FMCSA’s former prioritization system, SafeStat, was used to identify carriers to meet this SAFETEA-LU statute. With the advent of CSMS replacing SafeStat, new CSMS-based criteria were developed to identify the high-risk carriers. Specifically, these criteria are applied to each carrier’s BASIC percentile results from roadside inspection and crash data to determine if that carrier is high-risk.

25
Figure 4: CSMS-Based Criteria to Determine High-Risk Carriers
*“All other” motor carrier threshold is defined as the 65th percentile for Unsafe Driving, HOS Compliance and Crash Indicator BASICs, and 80th percentile for the remaining three BASICs20
The 2012 CSMS ET provides a means of comparing the crash involvement of high-risk carriers (i.e., carriers that meet the above criteria) to those of the general carrier population. Table 12 shows the future crash rate of both the high-risk carriers and the general population.
Table 12: CSMS ET High-Risk Carrier Results
Group # of Carriers
# of Post-Period Crashes
# Post-Period PUs
Post-Period Crash Rate (Crashes per 100 PUs)
All Carriers in ET Study 278,318 105,985 3,090,111 3.43
High-Risk Carriers 5,654 8,836 120,622 7.33
The group of carriers that met the high-risk criteria has more than twice the future crash rate (7.33 crashes per 100 PUs) than the national average crash rate (3.43 crashes per 100 PUs). These high-risk carriers even have a higher crash rate than any of the BASICs carrier groups shown in Table 10 of Analysis 1b. These results indicate that the high-risk criteria are finding a set of carriers based upon their performance data with very high crash rates, consistent with the intent of Congress.
20 http://ai.fmcsa.dot.gov/sms/InfoCenter/default.aspx#question13
Crash OR HOS OR Unsafe ≥ 85 +
1 other BASIC at or above the “all other” motor carrier
threshold*
Any 4 or more BASICs at or above the “all other” motor
carrier threshold* OR
26
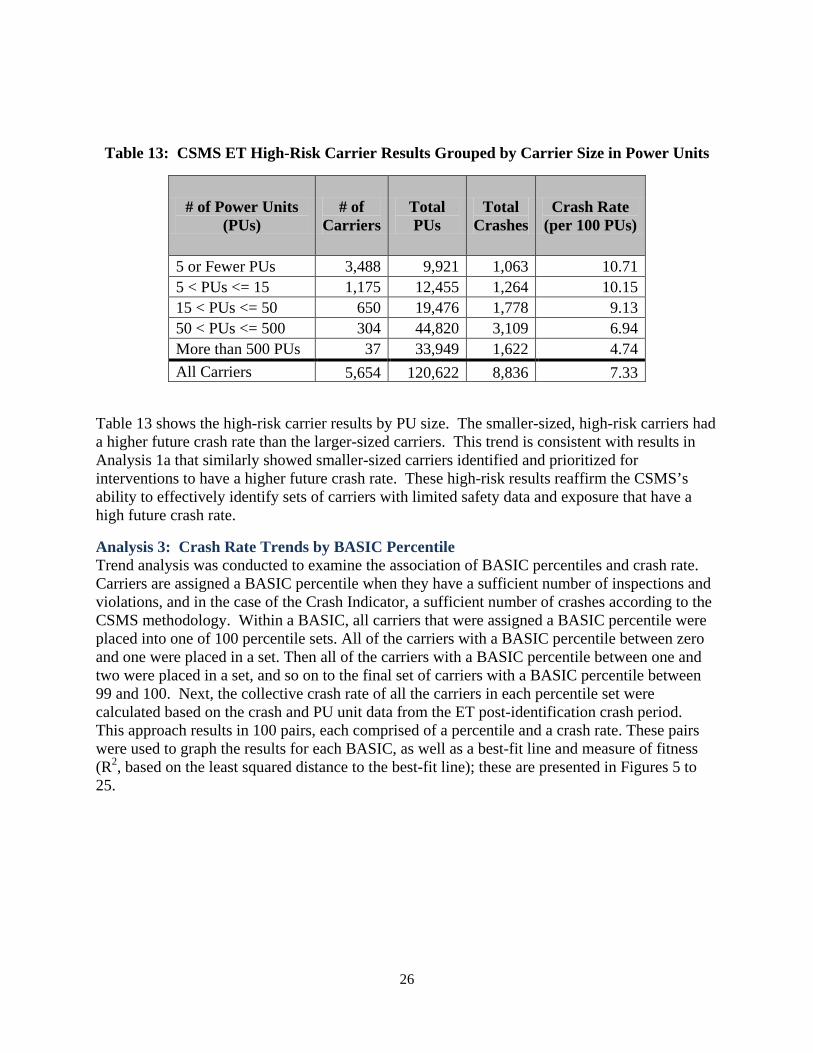
Table 13: CSMS ET High-Risk Carrier Results Grouped by Carrier Size in Power Units
# of Power Units (PUs)
# of Carriers
Total PUs
Total Crashes
Crash Rate (per 100 PUs)
5 or Fewer PUs 3,488 9,921 1,063 10.71 5 < PUs <= 15 1,175 12,455 1,264 10.15 15 < PUs <= 50 650 19,476 1,778 9.13 50 < PUs <= 500 304 44,820 3,109 6.94 More than 500 PUs 37 33,949 1,622 4.74 All Carriers 5,654 120,622 8,836 7.33
Table 13 shows the high-risk carrier results by PU size. The smaller-sized, high-risk carriers had a higher future crash rate than the larger-sized carriers. This trend is consistent with results in Analysis 1a that similarly showed smaller-sized carriers identified and prioritized for interventions to have a higher future crash rate. These high-risk results reaffirm the CSMS’s ability to effectively identify sets of carriers with limited safety data and exposure that have a high future crash rate.
Analysis 3: Crash Rate Trends by BASIC Percentile Trend analysis was conducted to examine the association of BASIC percentiles and crash rate. Carriers are assigned a BASIC percentile when they have a sufficient number of inspections and violations, and in the case of the Crash Indicator, a sufficient number of crashes according to the CSMS methodology. Within a BASIC, all carriers that were assigned a BASIC percentile were placed into one of 100 percentile sets. All of the carriers with a BASIC percentile between zero and one were placed in a set. Then all of the carriers with a BASIC percentile between one and two were placed in a set, and so on to the final set of carriers with a BASIC percentile between 99 and 100. Next, the collective crash rate of all the carriers in each percentile set were calculated based on the crash and PU unit data from the ET post-identification crash period. This approach results in 100 pairs, each comprised of a percentile and a crash rate. These pairs were used to graph the results for each BASIC, as well as a best-fit line and measure of fitness (R2, based on the least squared distance to the best-fit line); these are presented in Figures 5 to 25.
27
When viewed in a graph, three visible factors identify a strong positive association between high crash rates and high BASIC percentiles:
1) A high crash rate relative to the national average, especially at the higher end of the BASIC percentile spectrum.
2) The slope of the best-fit line: the steeper the positive slope, the more indicative a high BASIC percentile is of future crash rates for those carriers.
3) A high correlation value (R2), which means that the best-fit line closely represents the (percentile group, crash rate) pair data points.
BASICs with all three factors have the strongest positive association to future crash rate. For the purposes of this analysis, any best-fit trend line with a slope greater than zero denotes a positive association. The results for high BASIC percentiles, visible on the right side of the graph, are of particular interest because these are used to identify carriers for CSA interventions. The association between percentile and crash rate is considered “strong” for R2 values greater than 0.5, while R2 values between 0.2 and 0.5 indicate a “moderate” association, and R2 values less than 0.2 indicate a “weak” association.
This approach of using 100 percentile sets provides the ability to analyze the entire ET population in a meaningful way, as it accounts for the crash experience of both big and small carriers. Crashes are low probability, high-impact events, which creates a particular challenge for analyzing the crash risk of small carriers. Individually, small carriers usually have zero crashes (giving them a crash rate of zero), but this does not mean they are not exhibiting patterns of unsafe behavior and are not at risk for a crash. As shown in Analysis 1a, the sets of smaller-sized carriers identified for interventions exhibited higher crash rates than the larger-sized carriers.
A small carrier with a single crash may have an extremely high crash rate that also does not accurately reflect their risk management practices. For example, a one-truck carrier can have no crashes and a crash rate of zero crashes per 100 PUs or one crash and a crash rate of 100 crashes per 100 PUs. Neither the low nor the high crash rate accurately represents the carrier’s individual crash risk.
Of the 278,318 carriers used in this model, 209,915 (75 percent) have five or fewer PUs, making it necessary to have a strategy for analyzing the safety risk of these small carriers. Placing all of these carriers together in percentile sets and calculating the collective crash rate (i.e., the total number of crashes divided by the total number of PUs) allows for assessing average crash rate of each set. However, this collective crash rate is not a prediction of the actual crash rate of an individual carrier. In fact, 93 percent of the carriers in the model had no crashes in the post-identification monitoring period. Grouping carriers by percentile allows FMCSA to focus its CSA program on the set of carriers with higher crash likelihood.
28
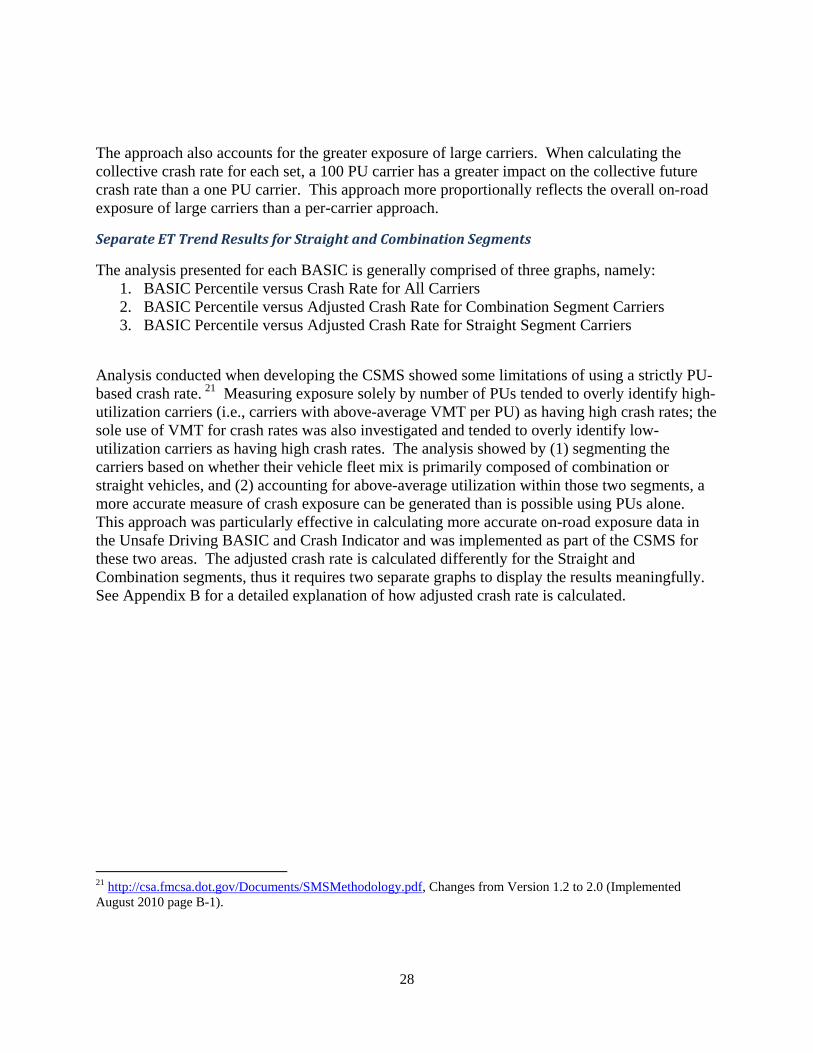
The approach also accounts for the greater exposure of large carriers. When calculating the collective crash rate for each set, a 100 PU carrier has a greater impact on the collective future crash rate than a one PU carrier. This approach more proportionally reflects the overall on-road exposure of large carriers than a per-carrier approach.
Separate ET Trend Results for Straight and Combination Segments
The analysis presented for each BASIC is generally comprised of three graphs, namely: 1. BASIC Percentile versus Crash Rate for All Carriers 2. BASIC Percentile versus Adjusted Crash Rate for Combination Segment Carriers 3. BASIC Percentile versus Adjusted Crash Rate for Straight Segment Carriers
Analysis conducted when developing the CSMS showed some limitations of using a strictly PU-based crash rate. 21 Measuring exposure solely by number of PUs tended to overly identify high-utilization carriers (i.e., carriers with above-average VMT per PU) as having high crash rates; the sole use of VMT for crash rates was also investigated and tended to overly identify low-utilization carriers as having high crash rates. The analysis showed by (1) segmenting the carriers based on whether their vehicle fleet mix is primarily composed of combination or straight vehicles, and (2) accounting for above-average utilization within those two segments, a more accurate measure of crash exposure can be generated than is possible using PUs alone. This approach was particularly effective in calculating more accurate on-road exposure data in the Unsafe Driving BASIC and Crash Indicator and was implemented as part of the CSMS for these two areas. The adjusted crash rate is calculated differently for the Straight and Combination segments, thus it requires two separate graphs to display the results meaningfully. See Appendix B for a detailed explanation of how adjusted crash rate is calculated.
21 http://csa.fmcsa.dot.gov/Documents/SMSMethodology.pdf, Changes from Version 1.2 to 2.0 (Implemented August 2010 page B-1).

29
Unsafe Driving BASIC Trend
The Unsafe Driving BASIC is defined as operating CMVs in a dangerous or careless manner. The violations used in this BASIC come from driver roadside inspections and tend to be related to traffic enforcement. Example of violations that feed this BASIC are speeding, reckless driving, improper lane change, failure to use a seat belt, and texting while driving.
Figure 5: Unsafe Driving BASIC, Overall
Each “x” in the above graph represents the collective future crash rate of carriers at or above that BASIC percentile, and less than the next BASIC percentile. For example, the right-most point represents the post-identification crash rate of the group of carriers with BASIC percentiles at or above 99. The next point represents the crash rate of those with BASIC percentiles at or above 98 and less than 99, and so forth. Given that 27,900 carriers received a percentile for the Unsafe Driving BASIC, each “x” represents the crash rate for 279 carriers on average.
The results in Figure 5 indicate a strong positive association of Unsafe Driving BASIC percentiles with future crash rates. Nearly all percentile crash rates are higher than the national average of 3.43. The best-fit trend line has a steep positive slope and a strong trend shown by R2 of 0.784.
R² = 0.784
0
2
4
6
8
10
12
14
0 20 40 60 80 100
Cra
sh R
ate
(cra
shes
per
100
PU
s)
BASIC Percentile
Unsafe Driving BASIC
Unsafe Driving National Avg Trend (Unsafe Driving)

30
Figure 6: Unsafe Driving BASIC, Straight Segment
The results in Figure 6 indicate a strong positive association of Unsafe Driving BASIC percentiles with future crash rates for the Straight Segment carriers. Nearly all percentile crash rates above the 50th percentile are higher than the national average of 1.43 for Straight Segment carriers. The best-fit trend line has a steep positive slope and a moderate trend shown by R2 of 0.50.
R² = 0.500
0
1
2
3
4
5
6
7
8
0 10 20 30 40 50 60 70 80 90 100
Cra
sh R
ate
(Cra
shes
per
100
Adj
uste
d PU
s)
BASIC Percentile
Unsafe Driving BASIC, Straight Segment Carriers
Unsafe Driving Straight Segment Avg Trend (Unsafe Driving)

31
Figure 7: Unsafe Driving BASIC, Combination Segment
Figure 7 results indicate a strong positive association of Unsafe Driving BASIC percentiles with future crash rates for the Combination Segment carriers. Each set of percentile crash rates above the 50th percentile is higher than the national average of 5.20 for Combination Segment carriers. The best-fit trend line has a steep positive slope and a strong trend shown by R2 of 0.735.
All three graphs show steep positive slopes and strong trends, indicating a consistent association between the Unsafe Driving percentiles and future crash rates across carrier types.
R² = 0.7352
0
2
4
6
8
10
12
0 10 20 30 40 50 60 70 80 90 100
Cra
sh R
ate
(Cra
shes
per
100
Adj
uste
d PU
s)
BASIC Percentile
Unsafe Driving BASIC, Combination Segment Carriers
Unsafe Driving Combo Segment Avg Trend (Unsafe Driving)
32
HOS Compliance BASIC Trend
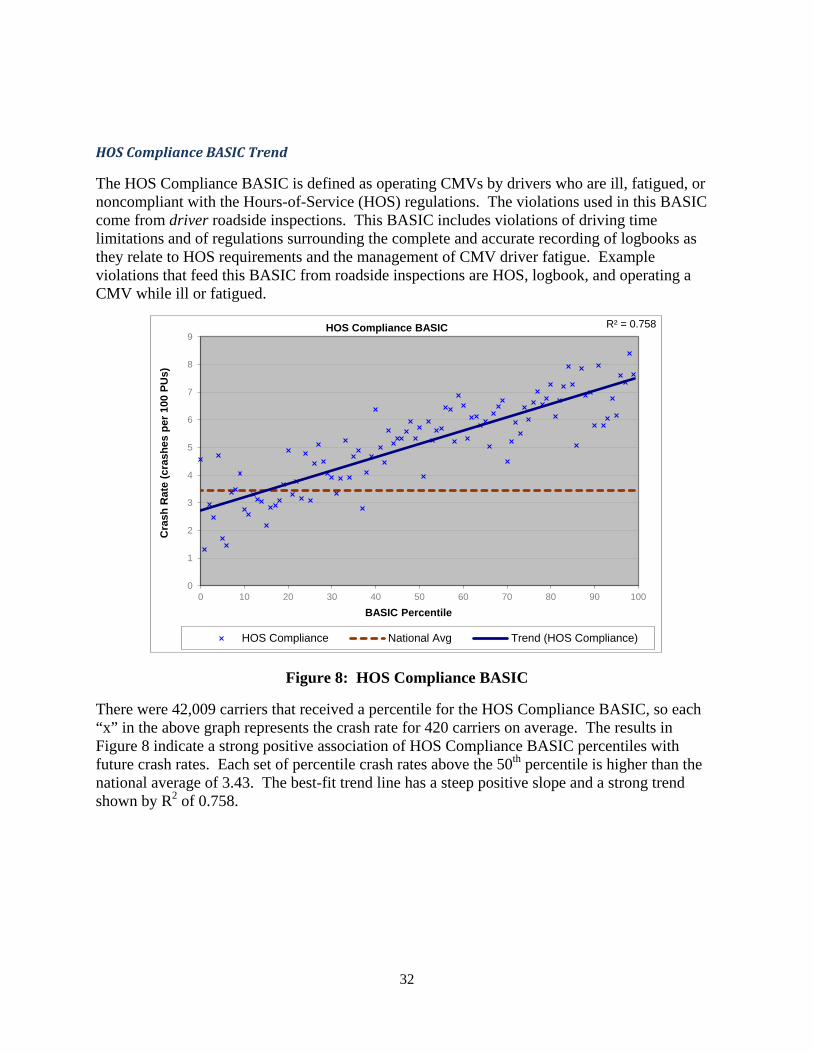
The HOS Compliance BASIC is defined as operating CMVs by drivers who are ill, fatigued, or noncompliant with the Hours-of-Service (HOS) regulations. The violations used in this BASIC come from driver roadside inspections. This BASIC includes violations of driving time limitations and of regulations surrounding the complete and accurate recording of logbooks as they relate to HOS requirements and the management of CMV driver fatigue. Example violations that feed this BASIC from roadside inspections are HOS, logbook, and operating a CMV while ill or fatigued.
Figure 8: HOS Compliance BASIC
There were 42,009 carriers that received a percentile for the HOS Compliance BASIC, so each “x” in the above graph represents the crash rate for 420 carriers on average. The results in Figure 8 indicate a strong positive association of HOS Compliance BASIC percentiles with future crash rates. Each set of percentile crash rates above the 50th percentile is higher than the national average of 3.43. The best-fit trend line has a steep positive slope and a strong trend shown by R2 of 0.758.
R² = 0.758
0
1
2
3
4
5
6
7
8
9
0 10 20 30 40 50 60 70 80 90 100
Cra
sh R
ate
(cra
shes
per
100
PU
s)
BASIC Percentile
HOS Compliance BASIC
HOS Compliance National Avg Trend (HOS Compliance)
33
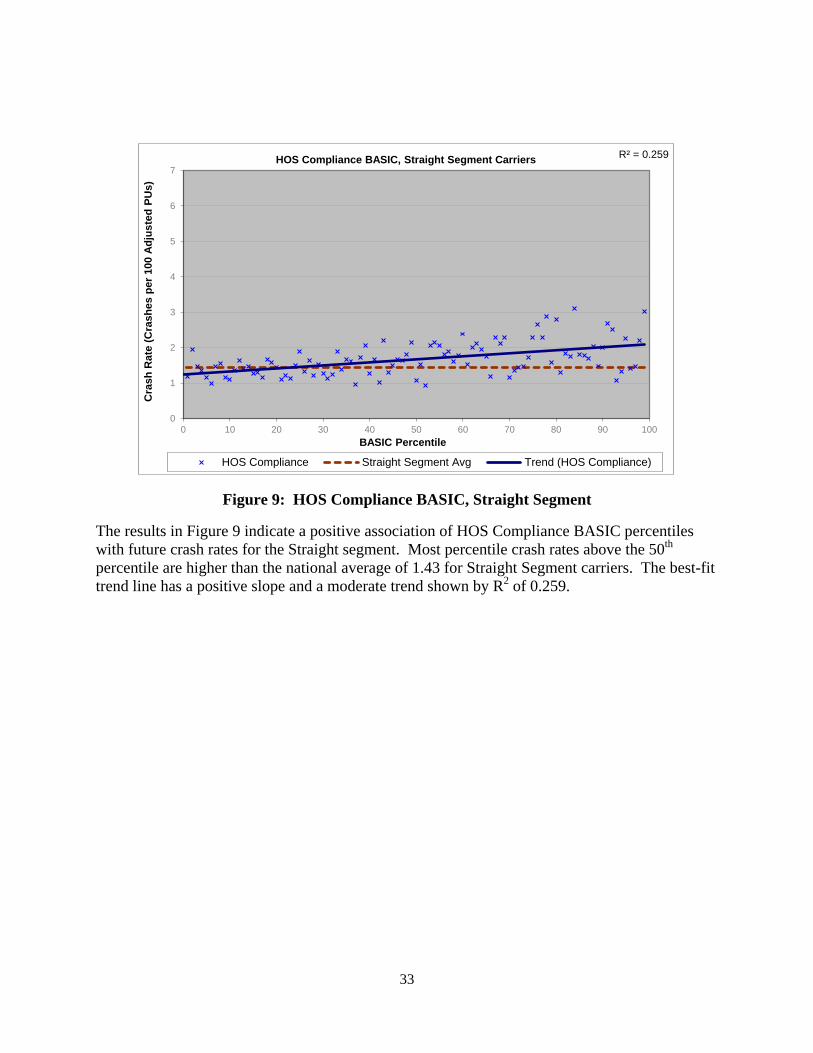
Figure 9: HOS Compliance BASIC, Straight Segment
The results in Figure 9 indicate a positive association of HOS Compliance BASIC percentiles with future crash rates for the Straight segment. Most percentile crash rates above the 50th percentile are higher than the national average of 1.43 for Straight Segment carriers. The best-fit trend line has a positive slope and a moderate trend shown by R2 of 0.259.
R² = 0.259
0
1
2
3
4
5
6
7
0 10 20 30 40 50 60 70 80 90 100
Cra
sh R
ate
(Cra
shes
per
100
Adj
uste
d PU
s)
BASIC Percentile
HOS Compliance BASIC, Straight Segment Carriers
HOS Compliance Straight Segment Avg Trend (HOS Compliance)

34
Figure 10: HOS Compliance BASIC, Combination Segment
The results in Figure 10 indicate a strong positive association of HOS Compliance BASIC percentiles with future crash rates for the Combination Segment. Nearly all percentile crash rates above the 50th percentile are higher than the national average of 5.20 for Combination Segment carriers. The best-fit trend line has a steep positive slope and a strong trend shown by R2 of 0.608.
All three graphs (Figures 8–10) show positive slopes and moderate to strong trends, indicating a consistent association between the HOS Compliance percentiles and future crash rates across carrier types, but particularly for the Combination Segment.
R² = 0.6077
0
2
4
6
8
10
12
0 10 20 30 40 50 60 70 80 90 100
Cra
sh R
ate
(Cra
shes
per
100
Adj
uste
d PU
s)
BASIC Percentile
HOS Compliance BASIC, Combination Segment Carriers
HOS Compliance Combo Segment Avg Trend (HOS Compliance)
35
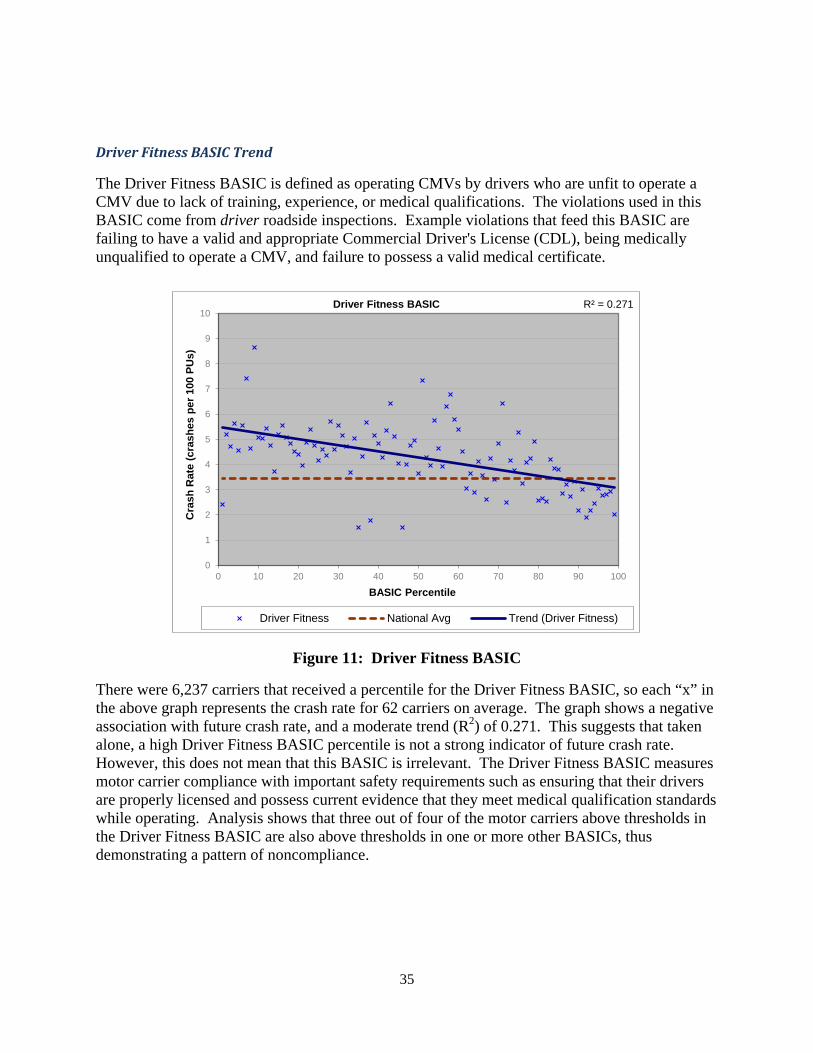
Driver Fitness BASIC Trend
The Driver Fitness BASIC is defined as operating CMVs by drivers who are unfit to operate a CMV due to lack of training, experience, or medical qualifications. The violations used in this BASIC come from driver roadside inspections. Example violations that feed this BASIC are failing to have a valid and appropriate Commercial Driver's License (CDL), being medically unqualified to operate a CMV, and failure to possess a valid medical certificate.
Figure 11: Driver Fitness BASIC
There were 6,237 carriers that received a percentile for the Driver Fitness BASIC, so each “x” in the above graph represents the crash rate for 62 carriers on average. The graph shows a negative association with future crash rate, and a moderate trend (R2) of 0.271. This suggests that taken alone, a high Driver Fitness BASIC percentile is not a strong indicator of future crash rate. However, this does not mean that this BASIC is irrelevant. The Driver Fitness BASIC measures motor carrier compliance with important safety requirements such as ensuring that their drivers are properly licensed and possess current evidence that they meet medical qualification standards while operating. Analysis shows that three out of four of the motor carriers above thresholds in the Driver Fitness BASIC are also above thresholds in one or more other BASICs, thus demonstrating a pattern of noncompliance.
R² = 0.271
0
1
2
3
4
5
6
7
8
9
10
0 10 20 30 40 50 60 70 80 90 100
Cra
sh R
ate
(cra
shes
per
100
PU
s)
BASIC Percentile
Driver Fitness BASIC
Driver Fitness National Avg Trend (Driver Fitness)

36
Previous analysis that was conducted to assist in determining the severity weights of violations in CSMS showed that there are positive and statistically significant relationships for the majority of Driver Fitness violations and crash involvement. This prior analysis was conducted at the driver (rather than carrier) level.22
Figure 12: Driver Fitness BASIC, Straight Segment
Similar to the overall analysis, the Straight Segment shows a negative association between the Driver Fitness BASIC percentile and future crash rate, and a weak trend shown by R2 of 0.129.
22 Carrier Safety Measurement System (CSMS) Violation Severity Weights (revised December 2010), pg. 4-14 http://federal.eregulations.us/rulemaking/document/FMCSA-2004-18898-0210
R² = 0.129
0
1
2
3
4
5
6
0 10 20 30 40 50 60 70 80 90 100
Cra
sh R
ate
(Cra
shes
per
100
Adj
uste
d PU
s)
BASIC Percentile
Driver Fitness BASIC, Straight Segment Carriers
Driver Fitness Straight Segment Avg Trend (Driver Fitness)

37
Figure 13: Driver Fitness BASIC, Combination Segment
Unlike the overall and Straight Segment analyses, the Combination Segment analysis shows a positive association between the Driver Fitness BASIC percentile and future crash rate, albeit with a weak trend shown by R2 of 0.092.
Given the lack of positive relation from the ET for this BASIC, using all carriers or Straight Segment carriers, and the weak positive association found for Combination Segment carriers, additional analyses were conducted to see if stronger positive associations exist in certain subsections of the motor carrier population. Based on these analyses, a moderate positive association between the Driver Fitness BASIC percentile and crash rate was found on a sizable portion of the motor carrier industry. Specifically, the Combination Segment carriers that are for hire (representing about half of the carriers with Driver Fitness percentiles) demonstrated a positive association with future crashes. The future crash rate for these carriers is plotted in the Figure 14 graph.
R² = 0.0918
0
1
2
3
4
5
6
7
8
9
0 10 20 30 40 50 60 70 80 90 100
Cra
sh R
ate
(Cra
shes
per
100
Adj
uste
d PU
s)
BASIC Percentile
Driver Fitness BASIC, Combination Segment Carriers
Driver Fitness Combo Segment Avg Trend (Driver Fitness)

38
Figure 14: Driver Fitness BASIC, For-Hire Combination Segment Carriers
For carriers that (a) identify on the MCS-150 census form as for-hire and (b) are in the Combination Segment, there is a positive association with future crashes as shown in the results in Figure 14. Most sets of percentile crash rates above the 50th percentile are higher than the national average of 5.20 for Combination Segment carriers. The best-fit trend line has a positive slope and a moderate trend shown by R2 of 0.271.
This analysis of for-hire Combination Segment carriers was also conducted for the other BASICs and the Crash Indicator. These results largely reflected what was found for the total Combination Segment, and are available in Appendix C.
R² = 0.2712
0
1
2
3
4
5
6
7
8
9
0 10 20 30 40 50 60 70 80 90 100
Cra
sh R
ate
(Cra
shes
per
100
Adj
uste
d PU
s)
BASIC Percentile
Driver Fitness BASIC, For-Hire Combination Segment Carriers
Driver Fitness Combo Segment Avg Trend (Driver Fitness)
39
There has been a recent change (as of August 2012) to the specificity of the driver disqualification violations used in this BASIC.23 This change helps separate driver disqualification violations due to safety reasons from those violations due to non-safety reasons. CSMS now calculates the safety-based disqualification violations with more severity weight than those that are non-safety-based. Given how recently this change went into effect and the use of historical data in the ET, this change is not yet reflected in the ET.
Controlled Substances/Alcohol BASIC Trend
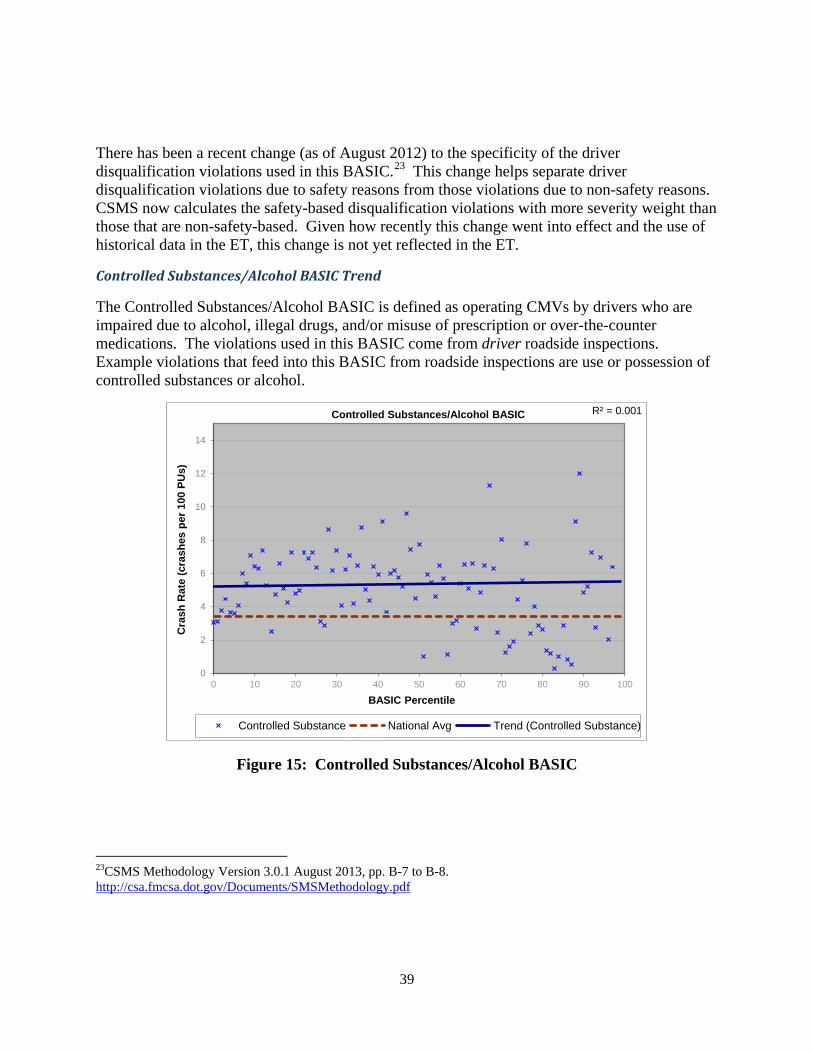
The Controlled Substances/Alcohol BASIC is defined as operating CMVs by drivers who are impaired due to alcohol, illegal drugs, and/or misuse of prescription or over-the-counter medications. The violations used in this BASIC come from driver roadside inspections. Example violations that feed into this BASIC from roadside inspections are use or possession of controlled substances or alcohol.
Figure 15: Controlled Substances/Alcohol BASIC
23CSMS Methodology Version 3.0.1 August 2013, pp. B-7 to B-8. http://csa.fmcsa.dot.gov/Documents/SMSMethodology.pdf
R² = 0.001
0
2
4
6
8
10
12
14
0 10 20 30 40 50 60 70 80 90 100
Cra
sh R
ate
(cra
shes
per
100
PU
s)
BASIC Percentile
Controlled Substances/Alcohol BASIC
Controlled Substance National Avg Trend (Controlled Substance)

40
There were 1,948 carriers that received a percentile for the Controlled Substances/Alcohol BASIC, so each “x” in the Figure 15 graph represents the crash rate for 19 carriers on average. Figure 15 shows that there is almost no association between this BASIC and future crash rate as indicated by a flat trend line with a very small R2 of 0.083. This result is not unexpected because violations in the Controlled Substances/Alcohol BASIC are relatively rarely found in roadside inspections and the use of Controlled Substances/Alcohol among CMV drivers has been extremely low, especially since the advent of mandatory Controlled Substances/Alcohol testing of CMV drivers by motor carriers.24 While infrequent use of Controlled Substances/Alcohol by CMV drivers is good from a public safety perspective, it means there are few violations from which to draw a carrier-level trend. Furthermore, the vast majority of Controlled Substances/Alcohol regulations is related to the administration of testing at the carrier level and is not observable or confirmed at the roadside. Given this, the ability of alcohol/drug use to impact a carrier's overall crash rate is limited.
Figure 16: Controlled Substances/Alcohol BASIC, Straight Segment
Similar to the overall analysis, the Straight Segment shows very little association between the Controlled Substances/Alcohol BASIC percentile and future crash rate, with an R2 of 0.083.
24 http://www.fmcsa.dot.gov/facts-research/research-technology/analysis/FMCSA-RRA-07-017.htm
R² = 0.083
0
1
2
3
4
5
6
7
8
9
0 10 20 30 40 50 60 70 80 90 100
Cra
sh R
ate
(Cra
shes
per
100
Adj
uste
d PU
s)
BASIC Percentile
Controlled Substances/Alcohol BASIC, Straight Segment Carriers
Controlled Substance Straight Segment Avg Trend (Controlled Substance)

41
Figure 17: Controlled Substances/Alcohol BASIC, Combination Segment
Unlike the overall and Straight Segment analyses, the Combination Segment analysis shows a positive association between Controlled Substances/Alcohol BASIC percentile and future crash rate, albeit with a weak trend shown by R2 of 0.160.
The dangers of driving while under the influence of drugs or alcohol, however, are not in dispute. Based on prior analysis performed at the driver level, there is a strong positive correlation between drug and alcohol violations and crash rates. 25
As part of the CSA program, this BASIC still provides value to enforcement by identifying those carriers with a history of these sorts of issues. The results of this BASIC are used to send enforcement resources to carriers with the highest Controlled Substances/Alcohol violations rates. These enforcement resources, in turn, can enforce Controlled Substances/Alcohol testing regulations on these carriers. This approach strengthens enforcement of the testing regulation, which was instrumental in lowering the number of crashes caused by this behavior in the first place.
25 Carrier Safety Measurement System (CSMS) Violation Severity Weights (revised December 2010), pg. 4-14 http://federal.eregulations.us/rulemaking/document/FMCSA-2004-18898-0210
R² = 0.1595
0
2
4
6
8
10
12
14
0 10 20 30 40 50 60 70 80 90 100
Cra
sh R
ate
(Cra
shes
per
100
Adj
uste
d PU
s)
BASIC Percentile
Controlled Substances/Alcohol BASIC, Combination Segment Carriers
Controlled Substance Combo Segment Avg Trend (Controlled Substance)

42
Vehicle Maintenance BASIC Trend
The Vehicle Maintenance BASIC is defined as failure to properly maintain a CMV and prevent shifting loads. The violations used in this BASIC come from vehicle roadside inspections. Example violations that feed this BASIC are brakes, lights, and other mechanical defects, improper load securement, and failure to make required repairs.
Figure 18: Vehicle Maintenance BASIC
There were 57,780 carriers that received a percentile for the Vehicle Maintenance BASIC, so each “x” in the above graph represents the crash rate for 578 carriers on average. The results in Figure 18 indicate a strong positive association of Vehicle Maintenance BASIC percentiles with future crash rates. Almost each set of percentile crash rates above the 50th percentile is higher than the national average of 3.43. The best-fit trend line has a steep positive slope, and a strong trend shown by R2 of 0.788.
R² = 0.788
0
1
2
3
4
5
6
7
8
0 10 20 30 40 50 60 70 80 90 100
Cra
sh R
ate
(cra
shes
per
100
PU
s)
BASIC Percentile
Vehicle Maintenance BASIC
Vehicle Maintenance National Avg Trend (Vehicle Maintenance)
43
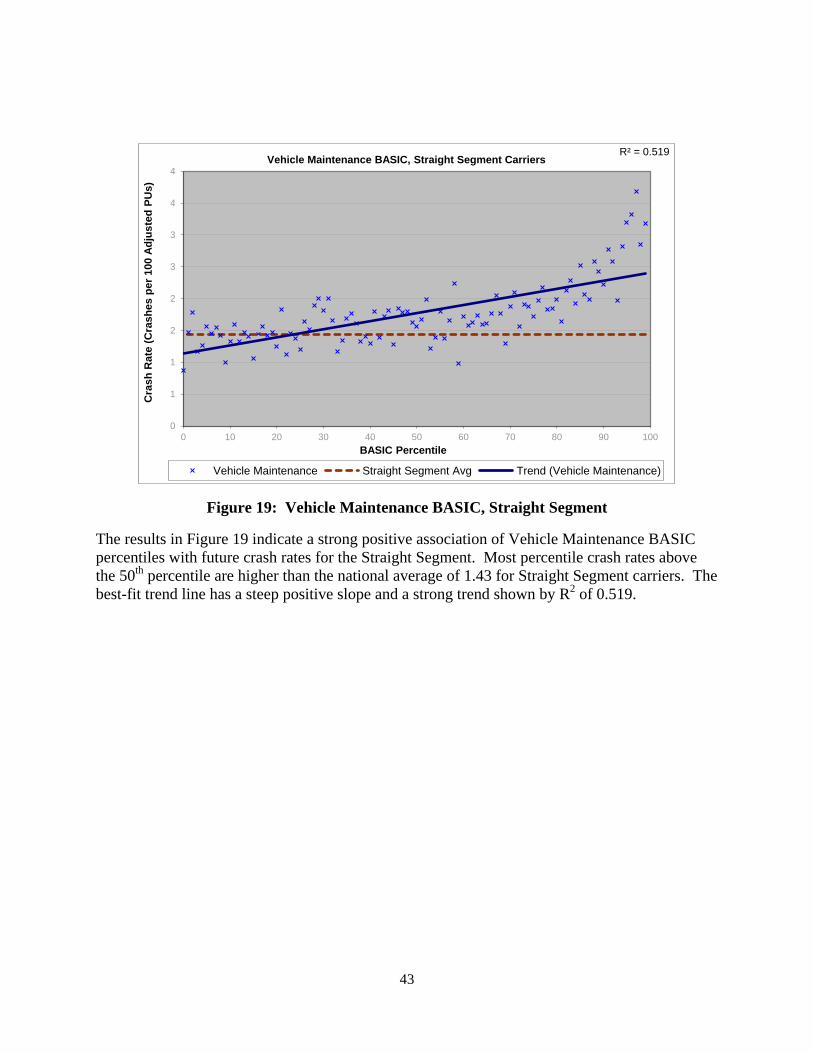
Figure 19: Vehicle Maintenance BASIC, Straight Segment
The results in Figure 19 indicate a strong positive association of Vehicle Maintenance BASIC percentiles with future crash rates for the Straight Segment. Most percentile crash rates above the 50th percentile are higher than the national average of 1.43 for Straight Segment carriers. The best-fit trend line has a steep positive slope and a strong trend shown by R2 of 0.519.
R² = 0.519
0
1
1
2
2
3
3
4
4
0 10 20 30 40 50 60 70 80 90 100
Cra
sh R
ate
(Cra
shes
per
100
Adj
uste
d PU
s)
BASIC Percentile
Vehicle Maintenance BASIC, Straight Segment Carriers
Vehicle Maintenance Straight Segment Avg Trend (Vehicle Maintenance)

44
Figure 20: Vehicle Maintenance BASIC, Combination Segment
The results in Figure 20 indicate a strong positive association of Vehicle Maintenance BASIC percentiles with future crash rates for the Combination Segment. Nearly all percentile crash rates above the 50th percentile are higher than the national average of 5.20 for the Combination Segment. The best-fit trend line has a steep positive slope and a strong trend shown by R2 of 0.644
All three graphs (Figures 18-20) show positive slopes and strong trends, indicating a consistent association between the Vehicle Maintenance percentiles and future crash rates across carrier types.
R² = 0.6444
0
1
2
3
4
5
6
7
8
9
0 10 20 30 40 50 60 70 80 90 100
Cra
sh R
ate
(Cra
shes
per
100
Adj
uste
d PU
s)
BASIC Percentile
Vehicle Maintenance BASIC, Combination Segment Carriers
Vehicle Maintenance Combo Segment Avg Trend (Vehicle Maintenance)

45
The HM Compliance BASIC Trend
The HM Compliance BASIC is defined as the unsafe handling of HM on a CMV. The violations used in this BASIC come from vehicle roadside inspections where placardable quantities of HM are being transported. Example violations that feed this BASIC are leaking containers, improper placarding, and improperly packaged HM.
Figure 21: HM Compliance BASIC, Post-period Crash Rates
There were 1,509 carriers that received a percentile for the HM Compliance BASIC, so each “x” in the above graph represents the crash rate for 15 carriers on average. The HM Compliance BASIC has almost no association with future crash rates as indicated by a nearly flat trend line with a very small R2 of 0.004. Assessing the risk of future crash involvement, however, is not the intent of this BASIC. This means that the Straight and Combination Segment analyses are not relevant, therefore they are not included here. This BASIC was designed to be an indicator of a motor carrier’s ability to properly package, transport, and accurately identify and communicate hazardous cargo in the event of a crash or spill. The presence of HM can greatly increase the consequences of crashes. FMCSA’s mission is to save lives, which is directly linked to reducing the frequency and severity of CMV crashes.
R² = 0.004
0
1
2
3
4
5
6
7
8
9
0 10 20 30 40 50 60 70 80 90 100
Cra
sh R
ate
(cra
shes
per
100
PU
s)
BASIC Percentile
HM Compliance BASIC
HM Compliance National Avg Trend (HM Compliance)

46
Reducing the incidence of HM violations can reduce crash severity directly, by reducing the likelihood of improperly packaged cargo adding to the severity of the crash, or indirectly. Accurately documented HM (as indicated by fewer documentation and markings-related HM violations) improves the ability of crash responders to react appropriately to the risk by informing them about the nature of HM in the accident. A better way to assess this BASIC is to examine if the BASIC results are a strong predictor of carriers at risk for future HM violations.
Figure 22: HM Compliance BASIC, Post-period Violation Rates
The graph for Figure 22 indicates a positive association with future HM violation rates based upon the steep positive slope of the trend line and a strong trend shown by R2 of 0.779. This trend accelerates upward from the 90th to 99th percentile sets. Thus, the HM Compliance BASIC is effectively identifying high-risk carriers, but the “risk” in this case relates to crash severity/consequence rather than crash frequency.
R² = 0.7785
0.00
0.05
0.10
0.15
0.20
0.25
0.30
0.35
0.40
0.45
0.50
0 10 20 30 40 50 60 70 80 90 100
Post
-HM
vio
latio
ns p
er H
M in
spec
tion
BASIC Percentile
HM Compliance BASIC, Post-period Violation Rates
HM Compliance Trend (HM Compliance)
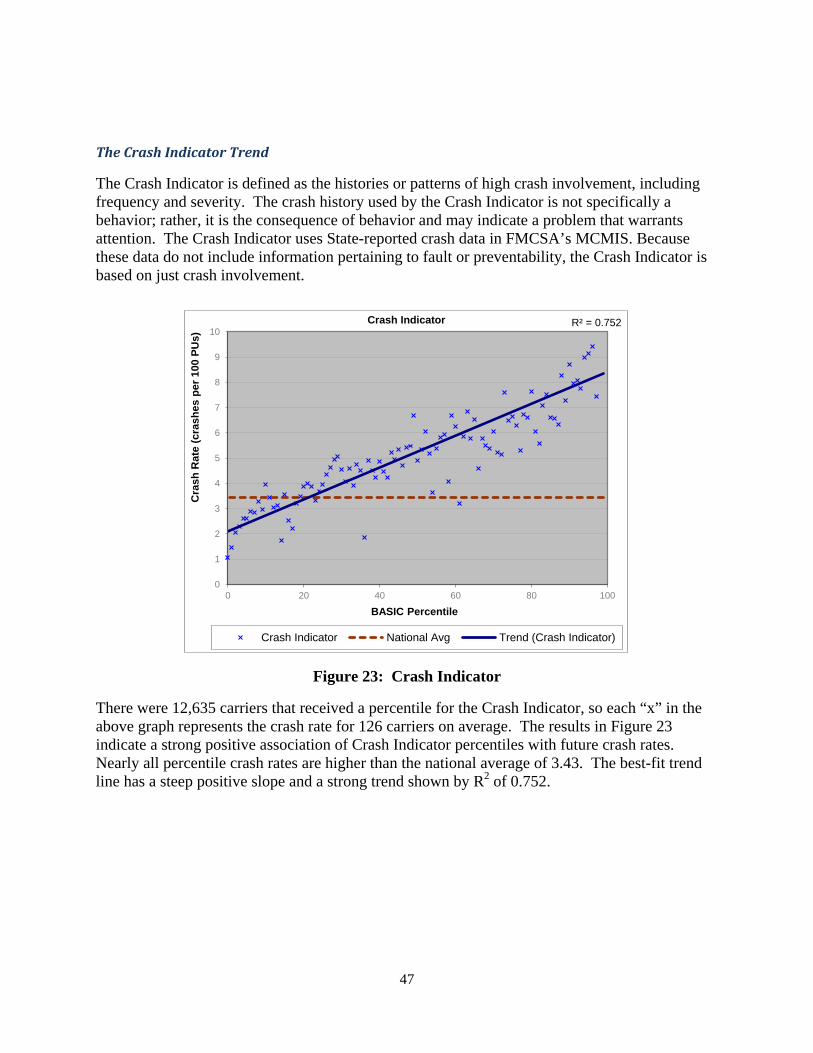
47
The Crash Indicator Trend
The Crash Indicator is defined as the histories or patterns of high crash involvement, including frequency and severity. The crash history used by the Crash Indicator is not specifically a behavior; rather, it is the consequence of behavior and may indicate a problem that warrants attention. The Crash Indicator uses State-reported crash data in FMCSA’s MCMIS. Because these data do not include information pertaining to fault or preventability, the Crash Indicator is based on just crash involvement.
Figure 23: Crash Indicator
There were 12,635 carriers that received a percentile for the Crash Indicator, so each “x” in the above graph represents the crash rate for 126 carriers on average. The results in Figure 23 indicate a strong positive association of Crash Indicator percentiles with future crash rates. Nearly all percentile crash rates are higher than the national average of 3.43. The best-fit trend line has a steep positive slope and a strong trend shown by R2 of 0.752.
R² = 0.752
0
1
2
3
4
5
6
7
8
9
10
0 20 40 60 80 100
Cra
sh R
ate
(cra
shes
per
100
PU
s)
BASIC Percentile
Crash Indicator
Crash Indicator National Avg Trend (Crash Indicator)

48
Figure 24: Crash Indicator, Straight Segment
The results in the above graph indicate a positive association of Crash Indicator percentiles with future crash rates for the Straight Segment. Each set of percentile crash rates above the 50th percentile is higher than the national average of 1.43 for Straight Segment carriers . The best-fit trend line has a steep positive slope and a moderate trend shown by R2 of 0.446.
R² = 0.446
0
1
2
3
4
5
6
7
0 10 20 30 40 50 60 70 80 90 100
Cra
sh R
ate
(Cra
shes
per
100
Adj
uste
d PU
s)
BASIC Percentile
Crash Indicator, Straight Segment Carriers
Crash Indicator Straight Segment Avg Trend (Crash Indicator)
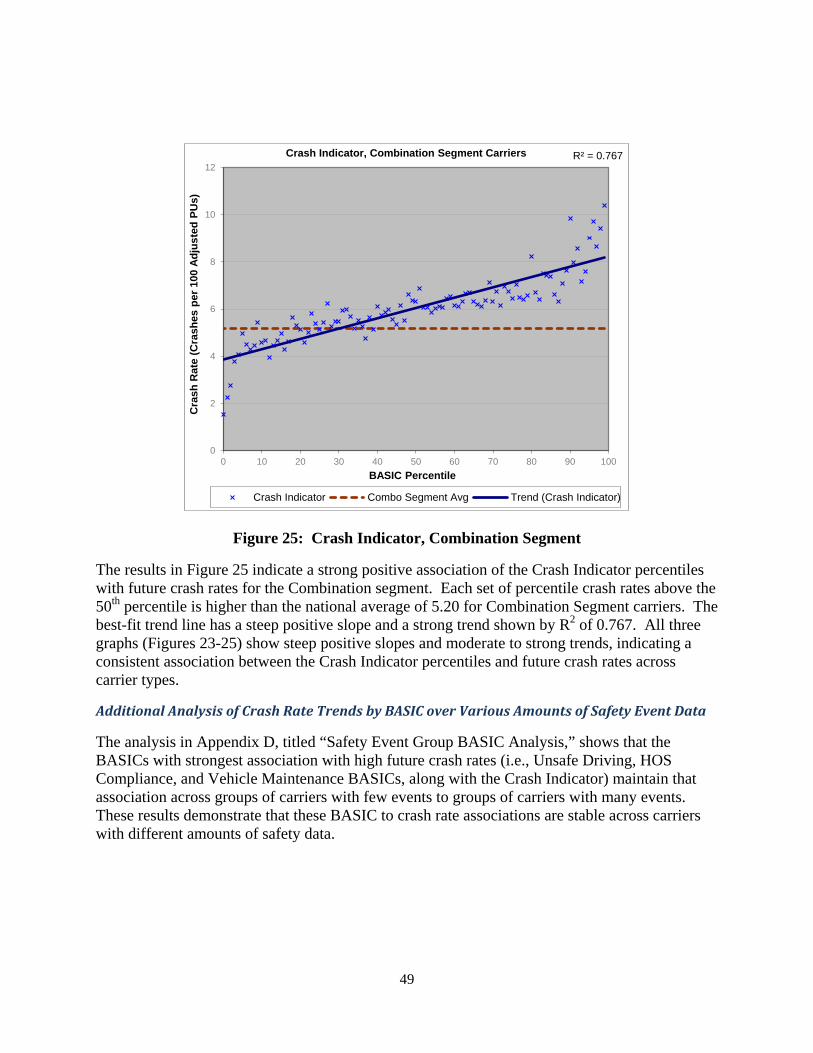
49
Figure 25: Crash Indicator, Combination Segment
The results in Figure 25 indicate a strong positive association of the Crash Indicator percentiles with future crash rates for the Combination segment. Each set of percentile crash rates above the 50th percentile is higher than the national average of 5.20 for Combination Segment carriers. The best-fit trend line has a steep positive slope and a strong trend shown by R2 of 0.767. All three graphs (Figures 23-25) show steep positive slopes and moderate to strong trends, indicating a consistent association between the Crash Indicator percentiles and future crash rates across carrier types.
Additional Analysis of Crash Rate Trends by BASIC over Various Amounts of Safety Event Data
The analysis in Appendix D, titled “Safety Event Group BASIC Analysis,” shows that the BASICs with strongest association with high future crash rates (i.e., Unsafe Driving, HOS Compliance, and Vehicle Maintenance BASICs, along with the Crash Indicator) maintain that association across groups of carriers with few events to groups of carriers with many events. These results demonstrate that these BASIC to crash rate associations are stable across carriers with different amounts of safety data.
R² = 0.767
0
2
4
6
8
10
12
0 10 20 30 40 50 60 70 80 90 100
Cra
sh R
ate
(Cra
shes
per
100
Adj
uste
d PU
s)
BASIC Percentile
Crash Indicator, Combination Segment Carriers
Crash Indicator Combo Segment Avg Trend (Crash Indicator)

50
Summary of the Analyses
Analysis 1: Carriers Identified for a CSA Intervention
The CSMS ET results demonstrate that the group of carriers identified for a CSA intervention for any BASIC has a 79 percent higher future crash rate (4.82 crashes per 100 PU) than the group of carriers not identified for an intervention (2.69 crashes per 100 PU). The ET results provide significant support for the Unsafe Driving, HOS Compliance, and Vehicle Maintenance BASICs, as well as the Crash Indicator as good indicators of high future crash rate. The group of carriers identified for CSA interventions for any of these BASICs has a 65-93 percent higher future crash rate than the national average. Two other BASICs, HM Compliance and Controlled Substances/Alcohol, have smaller positive associations shown by crash rates 31 percent and 34 percent higher than the national average, respectively. Analysis on stratifying the ET results by carrier size was also conducted. The results showed that the CSMS identifies carriers for intervention with high crash rates across all PU-size groups. This analysis also showed that the CSMS is more selective in identifying smaller-sized carriers for interventions in comparison to larger-sized carriers, while being effective in finding sets of small carriers with high future crash rates. Additionally, the analysis showed as the number of BASICs identifying carriers for interventions increases, the future crash rate of the group of carriers also increases. The group of carriers with no BASICs identified for inventions has a crash rate of 2.69 crashes per 100 PU. The crash rates steadily move up to a crash rate of 7.17 crashes per 100 PU for the group of carriers with five or more BASICs identified for interventions. These results provide strong support for the use of CSMS as a prioritization tool and the practice of identifying carriers for more severe interventions using multiple BASICs.
Analysis 2: Carriers Identified as “High-Risk” for Congressionally Mandated Investigations
FMCSA is directed by Congress to “ensure that compliance reviews are completed on motor carriers that have demonstrated through performance data that they pose the highest safety risk.” A set of CSMS-based criteria were developed to identify the high-risk carriers for this statute. By applying this set of CSMS-based criteria to the carriers in the ET model, 5,654 of the 278,318 carriers in the ET were identified as high-risk. The group of carriers that met the high-risk criteria has a future crash rate (7.33 crashes per 100 PUs) that is more than twice the crash rate of the general population (3.43 crashes per 100 PUs). These high-risk carriers even have a higher crash rate than motor carriers with 5+ BASICs identified for intervention shown in Analysis 1. The high crash rate experienced by the high-risk carriers holds for both sets of small-sized carriers and large-sized carriers. Consistent with the intent of Congress, these results indicate

51
that the high-risk criteria are finding a set of carriers based upon their performance data with very high crash rates.
Analysis 3: Crash Rate Trends by BASIC Percentile
When examining the future crash rates of carriers across the entire percentile spectrum for each BASIC, the ET results show that the strongest associations are in the Unsafe Driving, HOS Compliance, and Vehicle Maintenance BASICs, and the Crash Indicator. The graphs for each of these BASICs show the three elements that indicate a strong trend: (1) high crash rates for high percentiles relative to the national crash rate, (2) a trend line with a steep positive slope, and (3) the trend line closely represents percentile crash data as indicated by a high R2. Additional analysis in Appendix D shows that these strong associations remain for groups of carriers with small amounts of safety event data (e.g., inspections) and large amounts of safety event data.
The BASICs that do not provide evidence of a strong association with future crash rate are shown to be effective as safety tools in other ways. The Driver Fitness BASIC, for instance, does not have a strong association with future crash rate in the CSMS ET at the national level. However, the Driver Fitness percentiles of the for-hire, Combination Segment carriers (which comprise 50 percent of the carriers assigned a percentile in this BASIC) showed a stronger positive association with future crash rate.
The relatively weaker association between Controlled Substances/Alcohol BASIC percentiles and future crash rates may in part be due to how few of these violations are found during roadside inspections. While infrequent identification of drivers using Controlled Substances/Alcohol is good from a public safety perspective, it means there are few violations from which to draw a carrier-level trend. Furthermore, the vast majority of Controlled Substances/Alcohol regulations is related to the administration of testing at the carrier level and is not observable or confirmed at the roadside. Other analysis has shown statistically positive correlations between drug and alcohol related violations and crash rates.26 The results of this BASIC are used in CSA to send resources to enforce Controlled Substances/Alcohol testing regulations to carriers with the highest violations rates. This approach strengthens enforcement of the testing regulations, which lowers the occurrence of drug and alcohol use by CMV drivers.
Finally, the HM Compliance BASIC does not show a strong association with future crash rate; however, it is not intended to identify such an association as the regulations used in this BASIC focus on the reduction of crash severity/consequences, not crash frequency. To address this issue of crash severity, additional ET analysis showed that the HM BASIC percentile results are a
26 Carrier Safety Measurement System (CSMS) Violation Severity Weights (revised December 2010), pg. 4-14 http://federal.eregulations.us/rulemaking/document/FMCSA-2004-18898-0210
52
strong predictor of carriers at risk for future HM violations that could increase the consequences of crashes.
The results of the trend analysis for the Driver Fitness, Controlled Substances/Alcohol, and HM Compliance BASICs touch on some challenges of the ET approach. It was necessary to modify the ET to incorporate risks associated with crash consequences (e.g., HM spills). In the case of assessing Driver Fitness and Controlled Substances/Alcohol BASICs, the ET applies a carrier-level approach that may not pick up infrequent but severe public safety risks (e.g., use of drugs and alcohol, physically impaired drivers). The ET model may be modified in the future to further address these limitations.
Conclusion
Collectively, these three analyses provide solid evidence that the CSMS as a tool is effectively supporting FMCSA in its mission to reduce crashes, injuries, and fatalities involving large trucks and buses by improving safety and compliance. The CSMS gives FMCSA’s CSA intervention process strong candidates for safety improvement by identifying groups of carriers through non compliance and high crash risk. The CSMS ET continues to show that the group of carriers identified for CSA interventions and the group of carriers identified as high risk have higher future crash rates than other active carriers not identified for interventions, indicating that the CSMS is working effectively as a prioritization tool. These results also show that CSMS is identifying carriers with higher future crash rates across the spectrum of the carrier sizes and over varying amounts of carrier safety data. This allows the CSA program to hold a large portion of the motor carrier industry accountable. Further analysis can also be performed on the ability to identify high-risk carriers using multiple BASIC results. This ET model also can be used to test future improvements to the CSMS methodology and CSA intervention policy and be updated to observe changes in motor carrier safety and safety regulations.

53
Appendix A: ET Screening Explanation
Carrier Screening Criteria
The Effectiveness Test only includes carriers that meet the following criteria:
1. Active, US-domiciled carriers
2. Carriers with a positive value for average power unit count as of the time of the CSMS identification run.
3. Carriers with a positive value for average power unit count as of as of the end of the post-identification period
4. Carriers with one or more crashes, or one or more inspections (of any level) during the identification period
Carriers meeting these requirements are subject to the data validation tests described below. Carriers that do not pass all filtering tests will be identified as outliers for the purpose of the Effectiveness Test.
Carriers Excluded
While the major screening criteria requiring inspection or crash in both the CSMS time period and the post-identification crash period helps ensure that the carriers in the ET were active through the course of the study, the criteria tend to eliminate a larger portion of smaller carriers, which could have been operating throughout the study period. Given that the post-identification crash period crash rate of 0.89 crashes per 100 PUs for the 340,265 eliminated carriers (see Table A-1) is lower than the study population crash rate of 3.43 crashes per 100 PUs, and that these eliminated carriers are proportionally smaller (92% with 5 or fewer PUs) than the study population (75% with 5 or fewer PUs), it is quite possible that the stratified crash rates for the groups of all real active carriers could be lower for smaller carriers than is apparent from the ET results.

54
Table A-1: Carriers Excluded from ET Analysis
Power Units Group # Carriers
Total PUs
Total Crashes
Crash Rate
5 or Fewer PUs 312,740 504,401 4,714 0.93 5 < PUs <= 15 20,785 176,697 2,112 1.20 15 < PUs <= 50 5,368 136,898 1,893 1.38 50 < PUs <= 500 1,286 141,578 1,330 0.94 More than 500 PUs 86 324,928 2,884 0.89 All Carriers 340,265 1,284,502 12,933 0.89
Carrier PU Stability over ET Time-frame
Carriers with widely varying power unit counts that have dramatically changed from the CSMS run to the end of the post-identification period are excluded from the ET study because it is hard to ascertain the actual crash exposure for such carriers. The two PU counts subject to this test are the average PU used in the CSMS identification run and the average count of PUs at the end of the post- identification period. These averages are calculated by averaging the carrier’s current PU count, PU count from 6 months ago, and PU count from 18 months ago. Variation in power unit counts will be measured as the magnitude of the difference between these two values, normalized by the average of the two values (see below). The standard deviation of this measure will be calculated for the set of carriers that meet the data sufficiency requirements described above. Carriers with a PU counts variation greater than three standard deviations from the mean will be identified as outliers.
The algorithm for this outlier test is as follows:
1. Calculate PU count variation as,
+
−=
2______
ctendpupuavgctendpupuavgdiff ,
where avg_pu is the carrier's average PU count as calculated for the CSMS identification run, and pu_end_ct is the carrier's PU count as of the end of the post-identification period.

55
2. Calculate the standard deviation for diff for all carriers.
3. Calculate the variation threshold equal to three times the standard deviation of the PU diff for the carrier population, plus the average of the PU diff for the carrier population,
)_())_(_*3( diffpopavgdiffpopdevstdthreshold += .
In a truly random system, the population distribution would be normal, the mean would be zero, and this correction would not be necessary. This system has been shown not to be completely normal, and the adjustment above corrects for the case in which the mean of the population PU diff is not zero.
4. Identify all carriers for which the absolute value of the PU diff value is greater than the variation threshold. These will be identified as outliers.
Extreme Crash Rates
The crash counts for all carriers are assumed to follow a Poisson distribution with mean equal to the average crash rate for the population. Given this mean value, the probability of a carrier experiencing more than (or less than) its actual observed number of crashes per PU during the period is calculated. Carriers with crash rates that are exceedingly high (or low) based upon the prescribed significance level are excluded from the ET study.
Carriers with extremely high or low crash rates are identified as outliers. There are several possible reasons for extreme crash rates, but the most common is misreporting of power unit data. These data are self-reported and it is known that there are problem data.
The high crash test is performed for each carrier with an average PU value of fewer than 500 PUs for the CSMS identification run, and again for each carrier with fewer than 500 PUs at the end of the post-identification period. This algorithm is not applied to carriers identified as outliers due to extreme variations in PU counts (see above).
The Poisson distribution is used to identify carriers outside the expected limits for crashes. The shape of the Poisson distribution for the purpose of the Effectiveness Test27 is determined by one factor, the population crash rate (the dependent variable).
Where the thresholds for acceptable crashes fall on the distribution is determined by the confidence level used. The Effectiveness Test uses a confidence level of 1/1,000,000, which for one degree of freedom results in an inverse chi value of 24.366. Either of these values may be used in an implementation of the Poisson distribution. If the level of confidence and the degrees of freedom do not change, then it is simpler to enter the inverse chi value. A carrier is
27 There is an additional factor for the Poisson distribution, the degrees of freedom. The Effectiveness Test always assumes one degree of freedom.

56
considered an outlier if its placement on the Poisson distribution is outside acceptable limits. This is determined by a carrier's PU count (the independent variable).
Carriers will be identified as high-crash outliers according to the following algorithm:
1. Count the total number of crashes that involve a fatality, an injury, or a tow-away for all carriers in the population during the relevant time period.
2. Count the total number of PUs operated by the carriers in the population. For the CSMS identification run, this is the sum of the average PU counts for all carriers in the population. For the post-identification period, this is the sum of the PU counts at the end of the post-identification period.
3. Calculate the average crash rate for the population by dividing the total number of crashes found in step 1, by the total number of PUs found in step 2.
The population average crash rate will be an input parameter into the Poisson test function. If the test is being run for the CSMS identification run, the average crash rate over that period is used. To run the test over the post-identification period, the average crash rate over the post-identification period is used.
After the average population crash rate has been found, the high-crash threshold for a given carrier may be found as follows:
4. Take two test crash values: cr_ct_1 = 0 and cr_ct_2 = cr_ct_1 + 1.
5. Calculate two test value as follows:
)_,_,1__(__ cravgctpuctcrfunctestvaltest = , and
)_,_,2__(_2__ cravgctpuctcrfunctestvaltest = . where pu_ct is the PU count of the carrier, and avg_cr is the average crash rate of the population found in steps 1-3 above. The test function, test_func(), will be used again in the algorithm and is given as follows:
=)_,_,_(_ cravgctpuctcrfunctest ))3*_*_(*2 cravgctpu , if cr_ct = 0,
=)_,_,_(_ cravgctpuctcrfunctest))3*_*_()3*_*_ln(*__)_ln(*_(*2 cravgctpucravgctpuctcrctcrctcrctcr +−− , if cr_ct >
0.
6. If (test_val >= chi_inv OR test_val_2 <= chi_inv), where chi_inv = 24.366, then the maximum crash count has not yet been found. Iterate the values of cr_ct_1 and cr_ct_2 and return to step 4.

57
7. If (test_val < chi_inv and test_val_2 > chi_inv), then the value of cr_ct_1 is the maximum expect crash count for the carrier.
8. If the crash count of the carrier is greater than the value of cr_ct_1, found in step 7, then the carrier is identified as an outlier.
The reason for this iterative comparison is that there are two thresholds on a Poisson distribution, one for low crash counts and one for high crash counts. If test_val < chi_inv and test_val_2 > chi_inv, then the input PU count is outside the threshold for the minimum crash count, not the maximum. The algorithm seeks one of two values for cr_ct that returns the greatest value of test_func() that is below chi_inv. The higher of the two values of cr_ct is the high crash rate.
It must be noted that this principle does not mean that one can simply identify these two values and be finished with the high and low crash counts for a carrier. One reason is that the PU criteria are different; carriers with more than 500 PUs cannot be high-crash outliers, while carriers with fewer than 500 PUs cannot be low crash outliers. The other reason is that the formula for test_func() is not exactly the same.
Similar to the high crash test, the low crash test excludes carriers if they have a crash rate that is extremely low. Such a crash rate would indicate an artificially high power unit count, which could skew the results of the Effectiveness Test. Generally it is not possible for small carriers to fail this test, therefore this test is only performed for carriers with 500 or more PUs. The test is performed twice for each carrier, once for the CSMS identification run and once for the post-identification period. The principals of the Poisson distribution are the same, and the same confidence level, 1/1,000,000, is used.
The algorithm for the low crash test is as follows:
1. Follow steps 1 - 3 of the High Crash Rate algorithm above to find the average crash rate of the carrier population.
2. Take a test crash count, cr_ct = 0.
3. Calculate a test value as follows:
)_,_,_(__ cravgctpuctcrfunctestvaltest = , where pu_ct is the carrier PU count, and avg_cr is the average crash rate of the carrier population. The test function, test_func() is given as follows:
=)_,_,_(_ cravgctpuctcrfunctest ))3/_*_(*2 cravgctpu , if cr_ct = 0,
=)_,_,_(_ cravgctpuctcrfunctest))3/_*_()3/_*_ln(*__)_ln(*_(*2 cravgctpucravgctpuctcrctcrctcrctcr +−− , if cr_ct
> 0.

58
4. If test_val >= chi_inv, then the value of cr_ct is below the minimum crash count expected for this carrier. Iterate the value of cr_ct and return to step 3.
5. If test_val < chi_inv, then the value of cr_ct is the minimum expected crash count for this carrier.
6. If the crash count for this carrier is less than the value of cr_ct found in step 5, this carrier is identified as a low-crash outlier.

59
Appendix B: Calculation of Adjusted Crash Rate
Analysis conducted when developing the CSMS showed some limitations of using a strictly PU-based crash rate. Measuring exposure solely by number of PUs tended to overly identify high-utilization carriers (i.e., carriers with above-average VMT per PU) as having high crash rates. The sole use of VMT for crash rates was also investigated and tended to overly identify low-utilization carriers as having high crash rates. The analysis showed that by (1) segmenting the carriers based on whether their vehicle fleet mix is primarily composed of combination or straight vehicles, and (2) accounting for above-average utilization within those two segments, a more accurate measure of crash exposure than that produced by PUs alone can be generated. This approach was particularly effective in calculating more accurate on-road exposure data in the Unsafe Driving BASIC and Crash Indicator, and was implemented as part of the CSMS for these two areas. The adjusted crash rate is calculated differently for the Straight and Combination Segments, thus it requires two separate graphs to display the results meaningfully. The following steps show how the adjusted crash rates in these graphs were calculated. Step 1: Segment Each Carrier into “Combination” or “Straight” Each carrier in the ET population is segmented into one of two groups based on the types of vehicles operated, so that companies operating fundamentally different types of vehicles are no longer compared to each other: • Combination Segment: Combination trucks/motorcoach buses constituting 70 percent or
more of the total PUs in a carrier’s fleet. • Straight Segment: Straight trucks/other vehicles constituting more than 30 percent of the
total PUs in a carrier’s fleet. Step 2: Calculate Utilization for Each Carrier Divide the carrier’s annual VMT (if available) by the average number of PUs the carrier had during the post-identification crash period to find the average VMT per PU. Step 3: Determine the Utilization Factor for Each Carrier Carriers with above average truck utilization within their segment (Combination or Straight) receive an upward adjustment to their PUs called the Utilization Factor (UF) which helps account for additional exposure to crashes. The UF is dependent on carrier segment. The following two tables show how the UF is calculated for each segment.

60
Table B-1: Combination Segment Carriers
Combination Segment Carriers
Average VMT per PU Utilization Factor (UF)
< 80,000 1
80,000 - 160,000 1+0.6[(VMT per PU-80,000) / 80,000]
160,000 - 200,000 1.6
> 200,000 1
If no VMT data are available 1
Table B-2: Straight Segment Carriers
Straight Segment Carriers
Average VMT per PU Utilization Factor (UF)
< 20,000 1
20,000 - 60,000 VMT per PU / 20,000
60,000 - 200,000 3
> 200,000 1
If no VMT data are available 1
Step 4: Calculate Adjusted PUs for Each Carrier Adjusted PUs is the average number of PUs the carrier had during the post-identification crash period multiplied by the UF. Step 5: Calculate the Adjusted Crash Rate The adjusted crash rate for any group of carriers is the group’s total number of post-identification crashes times 100 divided by the total number of adjusted PUs.

61
Appendix C: For-Hire Combination Analysis
In addition to the Overall, Straight Segment, and Combination Segment analyses, future crash rates were also examined for the subset of Combination Segment carriers that are for-hire. This analysis was conducted for all BASICs and the Crash Indicator. This includes carriers that (a) identify on the MCS-150 census form as for-hire and (b) are in the Combination Segment.
Figure C-1: Unsafe Driving BASIC, For-Hire Combination Segment Carriers
The results in Figure C-1 indicate a strong positive association of Unsafe Driving BASIC percentiles with future crash rates for the Combination Segment for-hire carriers. All percentile crash rates above the 50th percentile are higher than the national average of 5.20 for Combination Segment carriers. The best-fit trend line has a steep positive slope and a strong trend shown by R2 of 0.731.
R² = 0.7305
0
2
4
6
8
10
12
0 10 20 30 40 50 60 70 80 90 100
Cra
sh R
ate
(Cra
shes
per
100
Adj
uste
d PU
s)
BASIC Percentile
Unsafe Driving BASIC, For-Hire Combination Segment Carriers
Unsafe Driving Combo Segment Avg Trend (Unsafe Driving)

62
Figure C-2: HOS Compliance BASIC, For-Hire Combination Segment Carriers
The results in Figure C-2 indicate a strong positive association of HOS Compliance BASIC percentiles with future crash rates for the Combination Segment for-hire carriers. Nearly all percentile crash rates above the 50th percentile are higher than the national average of 5.20 for Combination Segment carriers. The best-fit trend line has a positive slope and a strong trend shown by R2 of 0.621.
R² = 0.6205
0
2
4
6
8
10
12
0 10 20 30 40 50 60 70 80 90 100
Cra
sh R
ate
(Cra
shes
per
100
Adj
uste
d PU
s)
BASIC Percentile
HOS Compliance BASIC, For-Hire Combination Segment Carriers
HOS Compliance Combo Segment Avg Trend (HOS Compliance)
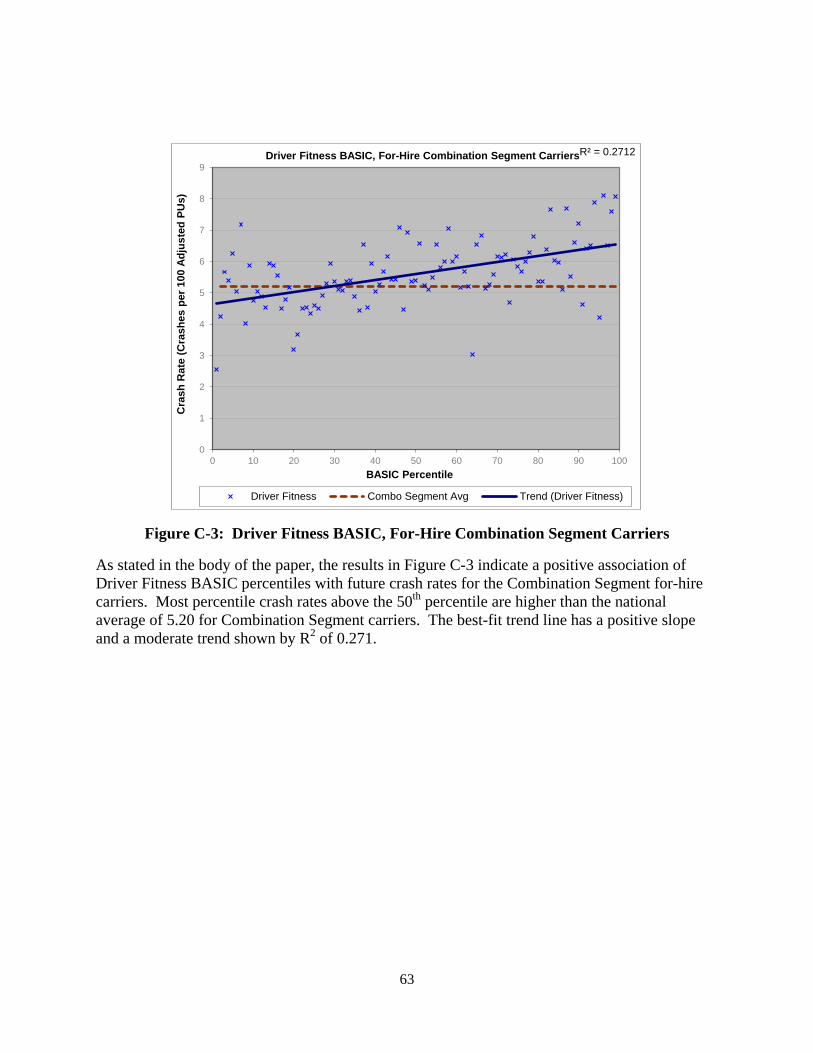
63
Figure C-3: Driver Fitness BASIC, For-Hire Combination Segment Carriers
As stated in the body of the paper, the results in Figure C-3 indicate a positive association of Driver Fitness BASIC percentiles with future crash rates for the Combination Segment for-hire carriers. Most percentile crash rates above the 50th percentile are higher than the national average of 5.20 for Combination Segment carriers. The best-fit trend line has a positive slope and a moderate trend shown by R2 of 0.271.
R² = 0.2712
0
1
2
3
4
5
6
7
8
9
0 10 20 30 40 50 60 70 80 90 100
Cra
sh R
ate
(Cra
shes
per
100
Adj
uste
d PU
s)
BASIC Percentile
Driver Fitness BASIC, For-Hire Combination Segment Carriers
Driver Fitness Combo Segment Avg Trend (Driver Fitness)

64
Figure C-4: Controlled Substances/Alcohol BASIC, For-Hire Combination Segment Carriers
The results in Figure C-4 indicate a positive association of Controlled Substances/Alcohol BASIC percentiles with future crash rates for the Combination Segment for-hire carriers. Most percentile crash rates above the 50th percentile are higher than the national average of 5.20 for Combination Segment carriers. The best-fit trend line has a positive slope and a weak trend shown by R2 of 0.198.
R² = 0.1978
0
2
4
6
8
10
12
14
0 10 20 30 40 50 60 70 80 90 100
Cra
sh R
ate
(Cra
shes
per
100
Adj
uste
d PU
s)
BASIC Percentile
Controlled Substance BASIC, For-Hire Combination Segment Carriers
Controlled Substance Combo Segment Avg Trend (Controlled Substance)

65
Figure C-5: Vehicle Maintenance BASIC, For-Hire Combination Segment Carriers
The results in Figure C-5 indicate a positive association of Vehicle Maintenance BASIC percentiles with future crash rates for the Combination Segment for-hire carriers. Nearly all percentile crash rates above the 50th percentile are higher than the national average of 5.20 for Combination Segment carriers. The best-fit trend line has a steep positive slope and a strong trend shown by R2 of 0.624.
R² = 0.6244
0
1
2
3
4
5
6
7
8
9
10
0 10 20 30 40 50 60 70 80 90 100
Cra
sh R
ate
(Cra
shes
per
100
Adj
uste
d PU
s)
BASIC Percentile
Vehicle Maintenance BASIC, For-Hire Combination Segment Carriers
Vehicle Maintenance Combo Segment Avg Trend (Vehicle Maintenance)

66
Figure C-6: HM Compliance BASIC, For-Hire Combination Segment Carriers
The results in Figure C-6 indicate almost no association of HM Compliance BASIC percentiles with future crash rates for the Combination Segment for-hire carriers. However, recall that assessing the risk of future crash involvement is not the intent of this BASIC; this BASIC was designed to be an indicator of a motor carrier’s ability to properly package, transport, and accurately identify and communicate hazardous cargo in the event of a crash or spill. The best-fit trend line has a shallow positive slope and a weak trend shown by R2 of 0.003.
R² = 0.003
0
1
2
3
4
5
6
7
8
9
0 10 20 30 40 50 60 70 80 90 100
Cra
sh R
ate
(Cra
shes
per
100
Adj
uste
d PU
s)
BASIC Percentile
HM Compliance BASIC, For-Hire Combo Segment Carriers
Series1 Combo Segment Avg Trend (HM Compliance)

67
Figure C-7: Crash Indicator, For-Hire Combination Segment Carriers
The results in Figure C-7 indicate a positive association of Crash Indicator percentiles with future crash rates for the Combination Segment for-hire carriers. All percentile crash rates above the 50th percentile are higher than the national average of 5.20 for Combination Segment carriers. The best-fit trend line has a steep positive slope and a strong trend shown by R2 of 0.760.
R² = 0.7598
0
2
4
6
8
10
12
0 10 20 30 40 50 60 70 80 90 100
Cra
sh R
ate
(Cra
shes
per
100
Adj
uste
d PU
s)
BASIC Percentile
Crash Indicator, For-Hire Combination Segment Carriers
Crash Indicator Combo Segment Avg Trend (Crash Indicator)
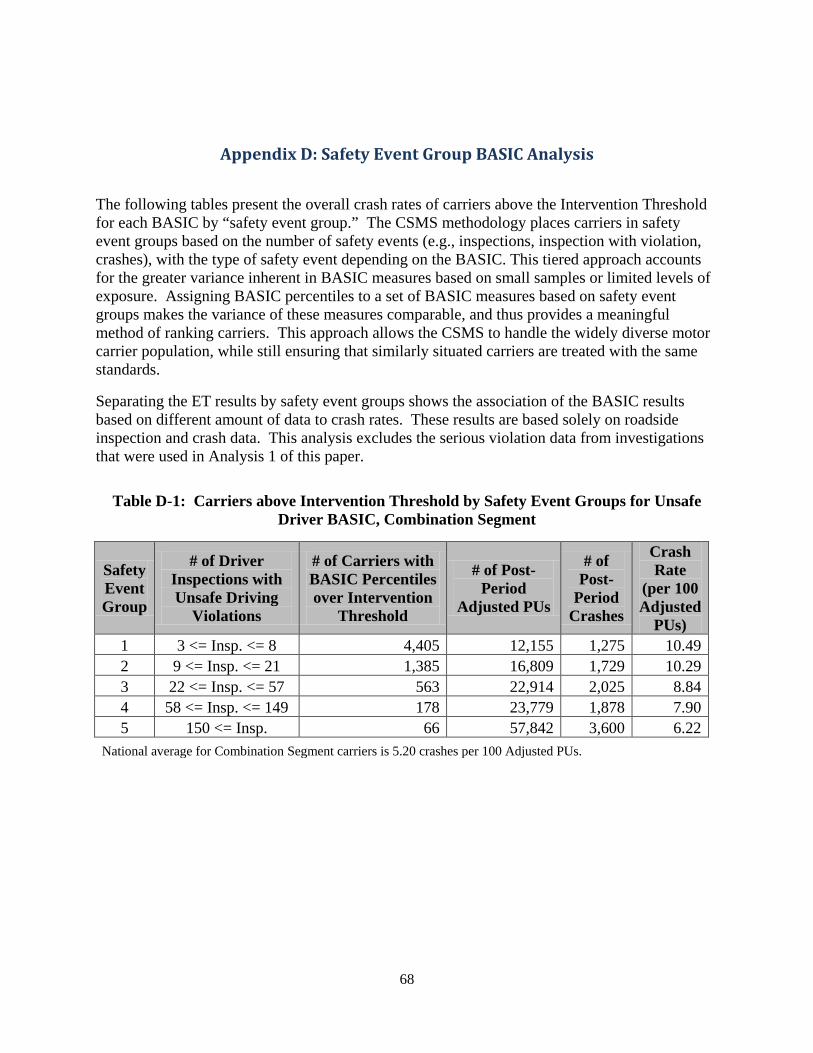
68
Appendix D: Safety Event Group BASIC Analysis
The following tables present the overall crash rates of carriers above the Intervention Threshold for each BASIC by “safety event group.” The CSMS methodology places carriers in safety event groups based on the number of safety events (e.g., inspections, inspection with violation, crashes), with the type of safety event depending on the BASIC. This tiered approach accounts for the greater variance inherent in BASIC measures based on small samples or limited levels of exposure. Assigning BASIC percentiles to a set of BASIC measures based on safety event groups makes the variance of these measures comparable, and thus provides a meaningful method of ranking carriers. This approach allows the CSMS to handle the widely diverse motor carrier population, while still ensuring that similarly situated carriers are treated with the same standards.
Separating the ET results by safety event groups shows the association of the BASIC results based on different amount of data to crash rates. These results are based solely on roadside inspection and crash data. This analysis excludes the serious violation data from investigations that were used in Analysis 1 of this paper.
Table D-1: Carriers above Intervention Threshold by Safety Event Groups for Unsafe
Driver BASIC, Combination Segment
Safety Event Group
# of Driver Inspections with Unsafe Driving
Violations
# of Carriers with BASIC Percentiles over Intervention
Threshold
# of Post-Period
Adjusted PUs
# of Post-
Period Crashes
Crash Rate
(per 100 Adjusted
PUs) 1 3 <= Insp. <= 8 4,405 12,155 1,275 10.49 2 9 <= Insp. <= 21 1,385 16,809 1,729 10.29 3 22 <= Insp. <= 57 563 22,914 2,025 8.84 4 58 <= Insp. <= 149 178 23,779 1,878 7.90 5 150 <= Insp. 66 57,842 3,600 6.22
National average for Combination Segment carriers is 5.20 crashes per 100 Adjusted PUs.

69
Table D-2: Carriers above Intervention Threshold by Safety Event Groups for Unsafe Driver BASIC, Straight Segment
Safety Event Group
# of Driver Inspections with Unsafe Driving
Violations
# of Carriers with BASIC Percentiles over Intervention
Threshold
# of Post-Period
Adjusted PUs
# of Post-
Period Crashes
Crash Rate
(per 100 Adjusted
PUs) 1 3 <= Insp. <= 4 1,584 7,934 362 4.56 2 5 <= Insp. <= 8 844 9,198 445 4.84 3 9 <= Insp. <= 18 385 10,418 467 4.48 4 19 <= Insp. <= 49 146 14,367 463 3.22 5 50 <= Insp. 36 44,294 627 1.42
National average for Straight Segment carriers is 1.43 crashes per 100 Adjusted PUs. The trend results of the adjusted crash rates for both the Combination and Straight Segments for
the Unsafe Driving BASIC are similar. All of the safety event group crash rates are above or very close to the respective national average for each segment. These results are consistent with Unsafe BASIC results shown in Analyses 1 and 3. The safety event groups with fewer inspections with violations tend to have higher future crash rates.
Table D-3: Carriers above Intervention Threshold by Safety Event Groups for Hours-of-
Service (HOS) Compliance BASIC
Safety Event Group
# of Driver Inspections
# of Carriers with BASIC Percentiles over Intervention
Threshold
# of Post-Period PUs
# of Post-
Period Crashes
Crash Rate
(per 100 PUs)
1 3 <= Insp. <= 10 7,094 18,204 929 5.10 2 11 <= Insp. <= 20 5,720 26,841 1,600 5.96 3 21 <= Insp. <= 100 6,600 73,674 5,216 7.08 4 101 <= Insp. <= 500 1,621 79,154 5,748 7.26 5 501 <= Insp. 307 127,897 7,125 5.57
National average for all carriers is 3.43 crashes per 100 PUs.
All of the safety event group crash rates in the HOS Compliance BASIC are above the national average. These results are consistent with HOS Compliance BASIC results shown in Analyses 1 and 3.
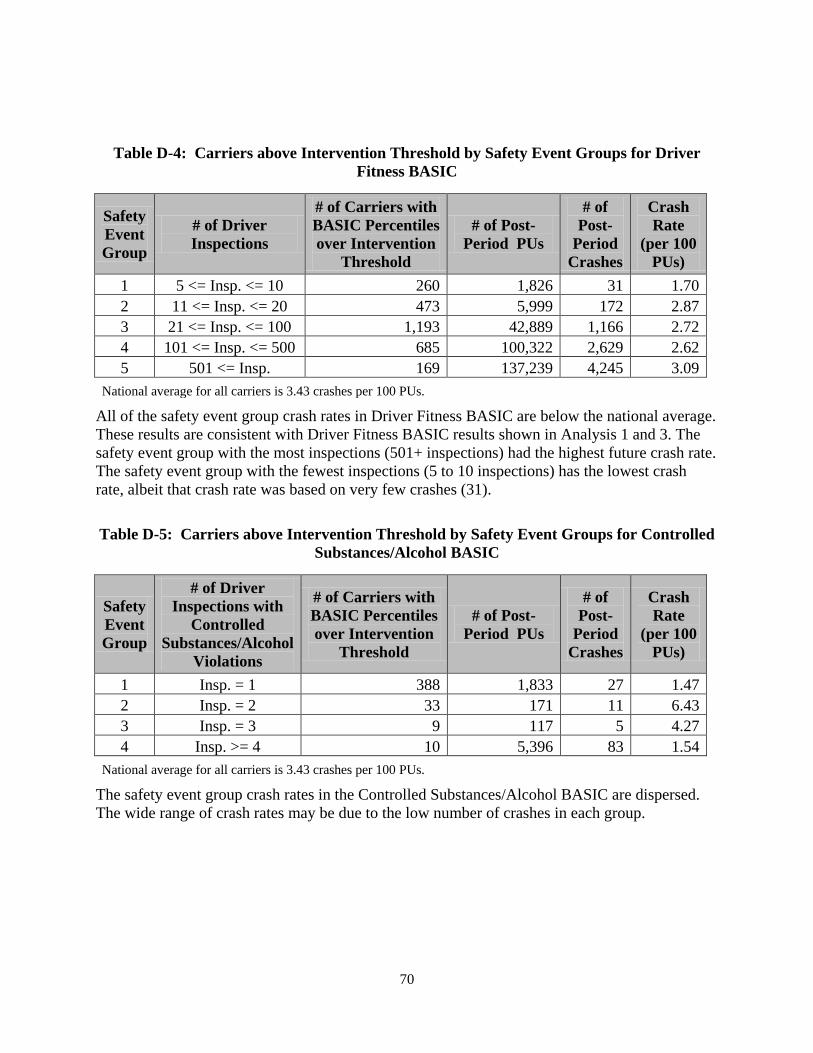
70
Table D-4: Carriers above Intervention Threshold by Safety Event Groups for Driver Fitness BASIC
Safety Event Group
# of Driver Inspections
# of Carriers with BASIC Percentiles over Intervention
Threshold
# of Post-Period PUs
# of Post-
Period Crashes
Crash Rate
(per 100 PUs)
1 5 <= Insp. <= 10 260 1,826 31 1.70 2 11 <= Insp. <= 20 473 5,999 172 2.87 3 21 <= Insp. <= 100 1,193 42,889 1,166 2.72 4 101 <= Insp. <= 500 685 100,322 2,629 2.62 5 501 <= Insp. 169 137,239 4,245 3.09
National average for all carriers is 3.43 crashes per 100 PUs. All of the safety event group crash rates in Driver Fitness BASIC are below the national average.
These results are consistent with Driver Fitness BASIC results shown in Analysis 1 and 3. The safety event group with the most inspections (501+ inspections) had the highest future crash rate. The safety event group with the fewest inspections (5 to 10 inspections) has the lowest crash rate, albeit that crash rate was based on very few crashes (31).
Table D-5: Carriers above Intervention Threshold by Safety Event Groups for Controlled
Substances/Alcohol BASIC
Safety Event Group
# of Driver Inspections with
Controlled Substances/Alcohol
Violations
# of Carriers with BASIC Percentiles over Intervention
Threshold
# of Post-Period PUs
# of Post-
Period Crashes
Crash Rate
(per 100 PUs)
1 Insp. = 1 388 1,833 27 1.47 2 Insp. = 2 33 171 11 6.43 3 Insp. = 3 9 117 5 4.27 4 Insp. >= 4 10 5,396 83 1.54
National average for all carriers is 3.43 crashes per 100 PUs. The safety event group crash rates in the Controlled Substances/Alcohol BASIC are dispersed.
The wide range of crash rates may be due to the low number of crashes in each group.
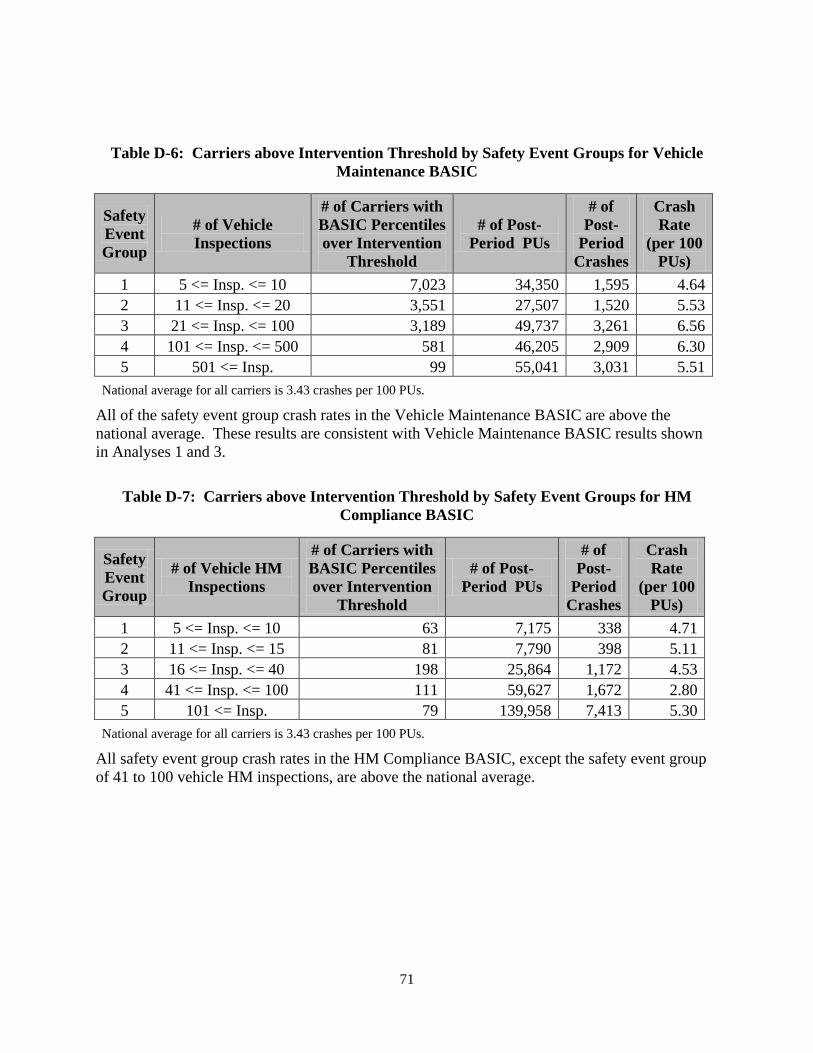
71
Table D-6: Carriers above Intervention Threshold by Safety Event Groups for Vehicle Maintenance BASIC
Safety Event Group
# of Vehicle Inspections
# of Carriers with BASIC Percentiles over Intervention
Threshold
# of Post-Period PUs
# of Post-
Period Crashes
Crash Rate
(per 100 PUs)
1 5 <= Insp. <= 10 7,023 34,350 1,595 4.64 2 11 <= Insp. <= 20 3,551 27,507 1,520 5.53 3 21 <= Insp. <= 100 3,189 49,737 3,261 6.56 4 101 <= Insp. <= 500 581 46,205 2,909 6.30 5 501 <= Insp. 99 55,041 3,031 5.51
National average for all carriers is 3.43 crashes per 100 PUs. All of the safety event group crash rates in the Vehicle Maintenance BASIC are above the
national average. These results are consistent with Vehicle Maintenance BASIC results shown in Analyses 1 and 3.
Table D-7: Carriers above Intervention Threshold by Safety Event Groups for HM
Compliance BASIC
Safety Event Group
# of Vehicle HM Inspections
# of Carriers with BASIC Percentiles over Intervention
Threshold
# of Post-Period PUs
# of Post-
Period Crashes
Crash Rate
(per 100 PUs)
1 5 <= Insp. <= 10 63 7,175 338 4.71 2 11 <= Insp. <= 15 81 7,790 398 5.11 3 16 <= Insp. <= 40 198 25,864 1,172 4.53 4 41 <= Insp. <= 100 111 59,627 1,672 2.80 5 101 <= Insp. 79 139,958 7,413 5.30
National average for all carriers is 3.43 crashes per 100 PUs. All safety event group crash rates in the HM Compliance BASIC, except the safety event group
of 41 to 100 vehicle HM inspections, are above the national average.

72
Table D-8: Carriers above Intervention Threshold by Safety Event Groups for Crash Indicator, Combination Segment
Safety Event Group
# of Crashes From CSMS Run
# of Carriers with Crash Indicator Percentiles over
Intervention Threshold
# of Post-Period
Adjusted PUs
# of Post-
Period Crashes
Crash Rate
(per 100 Adjusted
PUs) 1 2 <= Crashes <= 3 1,772 10,493 1,014 9.663 2 4 <= Crashes <= 6 665 14,880 1,326 8.911 3 7 <= Crashes <= 16 440 28,054 2,215 7.895 4 17 <= Crashes <= 45 159 35,918 2,658 7.400 5 46 <= Crashes 61 74,964 4,890 6.523
National average for Combination Segment carriers is 5.20 crashes per 100 Adjusted PUs.
Table D-9: Carriers above Intervention Threshold by Safety Event Groups for Crash Indicator, Straight Segment
Safety Event Group
# of Crashes From CSMS Run
# of Carriers with Crash Indicator Percentiles over
Intervention Threshold
# of Post-Period
Adjusted PUs
# of Post-
Period Crashes
Crash Rate
(per 100 Adjusted
PUs) 1 2 Crashes 763 7,015 362 5.161 2 3 <= Crashes <= 4 455 10,810 438 4.052 3 5 <= Crashes <= 8 200 14,196 560 3.945 4 9 <= Crashes <= 26 113 26,584 817 3.073 5 27 <= Crashes 34 48,133 1,358 2.821
National average for Straight Segment carriers is 1.43 crashes per 100 Adjusted PUs. The trend results of the adjusted crash rates for both the Combination and Straight Segments for
the Crash Indicator are similar. All of the safety event group crash rates are above the respective national average for each segment. These results are consistent with Crash Indicator results shown in Analyses 1 and 3. The safety event groups based on fewer crashes tend to have higher future crash rates.
Overall, the BASICs with the strongest associations to high future crash rates (i.e., Unsafe Driving, HOS Compliance, and Vehicle Maintenance BASICs, along with the Crash Indicator) maintain that association for groups of carriers with few events, as well as groups of carriers with many events. These results demonstrate that these BASIC-to-crash rate associations are stable across carriers with different amounts of safety data.

Carrier Safety Measurement System (CSMS) Effectiveness Test Report
Peer Review Comments
Reviewers: Kristin Monaco, Independent Researcher Ian Noy, Independent Researcher Peter Savolainen,Wayne State University January 2014

Monaco 2
Author: Kristin Monaco Objective: To enable the author(s) to improve the report on CSMS Effectiveness Test. Clarity of Hypothesis: The structure of the study and nature of the analysis is clearly stated in the report. It is fairly general, however. The study uses past data to test whether carriers identified as high-risk, but it is not clear from the outset whether this is the sole requirement of the scope of work. Due to this, some of my recommendations may be outside of the scope of work, but this speaks to some problems with the clarity of the hypothesis. For the purpose of this review, I will assume that the purpose of the study is not only to determine whether the data from the CSMS if effective in identifying high-risk carriers, but to measure the effectiveness of the CSMS, which I am going to interpret as being more than just a correlation between a carrier’s BASIC score and future safety measures (measured in this study as crash involvement).
Validity of Research Design
The authors present 3 sets of analyses: first, carriers are identified and prioritized for safety concerns; second, carriers are identified as high risk; third, crash rate trends are analyzed by BASIC percentile in different categories. They use data from 2009-2010 to identify and prioritize carriers that are likely high risk and then test whether these carriers had a higher crash incidence in 2011 and the first half of 2012.
This research design is valid, however, it leaves some questions unaddressed. First, by using 2009-2010 data to test crash incidence in 2011 and 2012, the authors necessarily restrict the sample for these tests to carriers for which there were data in the earlier period. It would be interesting to know whether the characteristics of these carriers differ from the general carrier population (perhaps using the MCMIS). Second, the methodology relies heavily on basic correlations between BASIC elements and crash outcome. While crash outcome is a logical area of focus, merely examining the correlation between each BASIC element and crash likelihood misses the opportunity to examine the relative importance of the different BASIC elements (through factor analysis or some other means). Third, there is likely an endogeneity problem since the BASIC measures assumed to be exogenous (in the R-squared analysis) could themselves be considered endogenous in other safety studies. This is likely beyond the scope of this study, but should at least be acknowledged.
More specific issues with the different models are presented in the “Robustness” and
“Appropriateness of Methods” sections that follow.

Monaco 3
Quality of Data Collection Activities:
The authors utilized the data set that meets the purpose of the study, however, in restricting their analysis to only a few elements of this data set (without considering other variables in the data set or other data sets that contain information on the characteristics of carriers), the nature of their analysis is limited and does not necessarily serve the purpose of determining the effectiveness of the CSMS, since it is not clear whether there are other operating characteristics from CSMS (or linked to the CSMS data set) or alternative data sets that could be used to predict crash risk with the same level of precision.
Robustness and Depth of Analysis methods Employed
As discussed above, there are some issues with the robustness of the methods employed. • In Analyses 1 and 2 (carriers identified and prioritized and carriers identified as high risk)
there are a series of tables that present such information as crash risk by size and other comparative statistics, however, no statistical test is presented to determine whether crash risk, for example, actually is significantly different among the range of “medium size” carriers. This is just one example, but generally all of the tables that follow this format should present some statistical information about differences in means or proportions.
• Also in Analysis 2 there is a presentation of BASICS (page 24) by elements, identifying the share of carriers that have high percentiles for 1, 2, 3.4, or 5 elements. It would likely be beneficial to the reader to know the cross tabulations of these BASICS (for example, are maintenance and driver fitness related) and the frequency of each of the BASIC components (since these are used in Analysis 3, but their underlying distributions are not clear).
• Analysis 3 is relatively shallow since it consists of a series of lines fit to scatterplots with a description of R-squared values. Even if multiple regressors were not being used to model crash rates, at a minimum t-tests of the relationship between the BASIC percentile and crash incidence should be presented.
• In addition, it is interesting to note that one of the “best” predictors of crash rate in Analysis 3 is merely the past value of crash incidence. It seems obvious, but the main BASIC elements that had the highest correlation with crash rate involved mostly driver behavior (reckless driving and HOS compliance).
Appropriateness of Methods for the Hypotheses Being Tested
The methodology is generally appropriate for the goal of addressing whether BASIC rating and safety prioritization is linked to crash likelihood, but there are a few limitations. First, the models are very basic from a statistical perspective and multiple regression analysis is not used at all. Analysis 3 which purports to examine the relationship between the various BASIC elements and crash incidence would especially benefit from factor analysis or another approach to assessing which BASIC measure is “most important” in predicting future crash incidence. There are clearly BASIC elements that have little/no predictive power, such as haz mat or alcohol use. The authors touch on this point on the bottom of page 35 when they note that while driver fitness may not be a good predictor of crash risk it is likely correlated with factors that are.
Monaco 4
This is why I suggest earlier that knowing the correlation between the BASIC elements would be helpful, since it might shed light on the channels by which various “inputs” lead to crash “output”. It also shines light on the issue of what some of these BASICs are actually capturing – eg. is the alcohol BASIC doing a good job of capturing substance abuse among drivers? Related to this is the issue of whether there are other carrier characteristics that might be more useful in predicting crash incidence than some of the BASIC measures. This concept was not presented by the authors, but given the relatively large body of literature on truck crashes some non-BASIC carrier characteristics should be included and tested to determine their relative importance.
Extent to Which the Conclusions Follow the Analysis The conclusions are incredibly limited (one paragraph of the entire report). The authors assert
that the analyses “provide solid evidence that the CSMS is effectively supporting FMCSA in its mission to reduce crashes, injuries, and fatalities involving large trucks and buses by improving safety and compliance.” I do not see that in this study. There is no measure of whether interventions have actually decreased crash rates, merely that those who should be identified as high risk from the earlier data actually have higher crash rates later.
The authors also note that carriers are identified “across the spectrum of the carrier sizes”. One
of the interesting patterns illustrated in Analysis 1 is that larger carriers seem to be disproportionately targeted. While they have a lower crash rate they are more likely to have complete information (not surprising when one considers “churning” among smaller carriers) and are likely “low hanging fruit” since it is easier to target one carrier with 50 trucks than 10 carriers with 5 trucks. Another semi-related observation is that the number of carriers identified as “high risk” contains a very small portion of the total crashes. So, while the policy prescription of targeting the highest risk carriers is sensible, it is not clear what the expected reduction in the crash rate might be (it does not seem particularly large).
Strengths and Limitations of the Overall Product This is a good first cut at assessing whether the information contained in the BASIC ratings do what they purport to do – help identify carriers at high risk of crashes. It also establishes that carriers identified as priority (or highest risk) are indeed high risk. What the study does not do is provide more quantitative analysis that would help guide improvements to the CSMS. After reading I am still left wondering where the biggest “bang for the buck” lies in examining BASIC rates and whether the data here simply illustrate that high risk carriers tend to remain high risk carriers over time.
Specific Recommendations for Improvement of the Product.
I would recommend the authors bolster their analyses through increased used of statistical tests (or, assuming that these tests have already been run, simply presenting the results alongside the
Monaco 5
descriptive tables). The analysis of the importance of the various BASIC elements can be improved through the identification of other correlates and the use of factor analysis to identify the most useful BASIC elements for predicting future crashes. Finally, I would urge the authors to revise the conclusions to reflect realistic inference that can be made from their various analyses.

Noy 6
The Carrier Safety Measurement System (CSMS) Effectiveness Test by Behavior Analysis and Safety Improvement Categories (BASICs) Review Comments – Ian Noy
1. Clarity of Hypothesis: Is the objective and hypothesis clearly stated at the
outset, in a manner that enables a logical progression throughout the report Yes, the objective of the report and the approach used are clearly described. This is an important effort as it relates to the rationale underlying FMCSA enforcement policy and practices. The report is well written, though there are parts that are somewhat unclear as to methodology.
2. Validity of Research Design The overall approach is valid, but more could be done with the data, especially in identifying where CSMS can potentially be improved. For example, it should have been possible to test the predictive value of different combination of BASICs or to define the most predictive set. Instead, the analysis focused on individual BASICs and the number of BASICs. It might be that a small set of 3 BASICs has as much predictive power as the 5, in which case you might want to reconsider the selection algorithm.
Another issue not fully explored is the stratification issue. The ET model selected a smaller percentage of small carriers, even though this category was associated with higher crash risk. One can do several what if scenarios to shift selection thresholds/priorities so that last odds ratio column is more balanced. As it stands, there seems to be an over selection of large carriers. This becomes an enforcement resource issue, which is not at all addressed. That is, what is the smartest strategy for utilizing maximum capacity? How are owner-operators classified? Are they considered carriers and part of the ET? They will likely not be part of the database simply because there is not enough data, but they may be high risk. How do you deal with this group, which is far more difficult to find for intervention.
3. Quality of Data Collection Activities: Have the authors utilized appropriate data collection given the available Federal data sources and the nature of trucking industry information sources.
The analyses are based on a cohort of carriers and recorded/historical data. Since the analyses use data that have been collected previously, the reader has no way to assess the quality of the data in the database. How robust are roadside inspections? How good are the data recorded by inspectors? How complete is the crash/violations history from State enforcement? These are important questions that are beyond the scope of the present report.
Noy 7
4. Robustness and Depth of Analysis methods Employed Certainly, more could have been done with the data. The paper evaluates the current selection practice, but it doesn’t explore how these might be optimized for the same dataset, or a smaller dataset. As indicated above, it might be worthwhile to analyze combination sets of BASICs in a multivariate way. Can you use multiple regression approaches to identify the set of BASICs to be used in selecting carriers? These data relate to a particular cohort – 24 months-worth of data starting in 2009 and the n18 months post-data analysis of future crashes. What about comparing with other cohorts, same approach but starting in 2008 or 2010 to see if the results are repeatable? The analyses concerning objective 2 are not clear. What is especially unclear is how the selection of high-risk carriers differs from the selection of the carriers for intervention. They are selected presumably based on the same data, but the thresholds may be different. How were these criteria determined? What is the relevance of the discussion of SafeStat, and how does that relate to the current analyses? Can you draw a Venn diagram showing how the high-risk group compares with the group selected for intervention?
5. Appropriateness of Methods for the Hypotheses Being Tested See previous discussion. If you repeat the ET exercise for different cohorts, do you get consistent results in terms of odds ratios? Again, it is not really clear what criteria were used to define high-risk carriers and why these criteria were chosen. What does Fatigue have to do with new CSMS, or this this a shortcut for HOS compliance? The analyses on high-risk carriers seems to be weighting the BASICs to select a higher risk group. Why not find the most predictive weightings and adjust the threshold for the intervention selection to meet the resources available for FMCSA intervention? This whole part of the report is not clear insofar as how these approaches are different. Perhaps I am missing something fundamental, but it should be clarified.
6. Extent to Which the Conclusions Follow the Analysis Does the fact that previous HM violations are predictive of future HM violations mean that violators were not addressed by FMCSA? Since they were identified previously, that should have triggered an enforcement action, no. So, either they were not subject to intervention or the intervention was ineffective. I presume the thresholds for small carriers are the same as for large carriers. The report states several times that CSMS more selective for smaller carriers. What does this mean? Why is this the case? I am not sure I understand. The fact that the non-identified small carriers still have a larger crash risk suggests there continues to be a problem with the CSA approach. By the metrics provided, the crash rate of the non-id small carriers, 3.23, is higher than the crash rate of

Noy 8
the larger carriers, 2.32, by almost 40%. The conclusion that there is solid evidence that the “CSMS is effectively supporting FMCSA in its mission to reduce crashes, injuries, and fatalities involving large trucks and buses by improving safety and compliance” is over-reaching. I think the analyses themselves indicate that the program may be suboptimal.
7. Strengths and Limitations of the Overall Product There is a critical tradeoff between carrier size and crash risk that this report has highlighted. It is not an easy tradeoff to resolve, but indications are that the thresholds should perhaps be adjusted. There was adjustment made for PUs based on exposure data, but the analyses suggested that the selection of carriers should be reviewed.
8. Specific Recommendations for Improvement of the Product. It might be a good idea to use this approach to measure intervention effectiveness.

Savolainen 9
Review of
The Carrier Safety Measurement System (CSMS) Effectiveness Test by Behavior Analysis and Safety Improvement Categories (BASICs)
Report to Federal Motor Carrier Safety Administration (FMCSA) Peter T. Savolainen, Ph.D., P.E.
Wayne State University 1. Clarity of Hypothesis: The research hypotheses are very clearly outlined. Ultimately, the aim of the study is to examine the efficacy of the Carrier Safety Measurement System (CSMS) in quantifying risk among carriers in support of Federal Motor Carrier Safety Administration (FMCSA) efforts to reduce large truck and bus involved crashes. This research question is addressed through the conduct of three specific analyses, which assess:
(a) Carriers identified and prioritized for CAS interventions; (b) Carriers identified as “high-risk” for congressionally mandated investigations; and (c) Crash rate trends by BASIC percentile.
2. Validity of Research Design: The research design is methodologically sound and an appropriate analytical framework is utilized. Ultimately, these methods demonstrate important findings as to the risk factors associated with truck- and bus-involved crashes. Some suggestions for refinement of the approach are detailed below, but on the whole, this research appears to have been very well executed. 3. Quality of Data Collection Activities: The authors have appropriately utilized available data from the CSMS and the Motor Carrier Management Information System (MCMIS). As a reader, it would be interesting to know more about the CSMS and MCMIS data. A summary table, providing aggregate descriptive statistics (e.g., min, mean, max, std. dev., etc.) would be useful and interesting. Some general information is provided in Tables 1 through 4, perhaps this and additional supplementary information can be provided at a more disaggregate level. In addition, it would be interesting to know what other types of information may be available through these resources. The authors note that certain data are sparsely available, particularly for smaller carriers. Is there any way to quantify this information (i.e., is a certain percentage of data missing for smaller carriers in contrast to larger carriers)? Continuing, are there any other particular limitations to the dataset? Is there anything that the authors feel would be valuable, but is either unavailable or not available in a useful form currently? Some of these points could be elaborated on in the conclusions of the report. On pg. 19, the authors note that “…many of these carriers did not have adequate data in MCMIS to support the kind of analysis used in the ET”. Could further details be provided on this point? Specifically, what may the impacts be on the analysis? Based upon other information available in the report, it appears that data issues are more prevalent among the smaller carriers. May this lead to a potential over- or under-estimation of their crash rates? In particular, it seems that some of the smaller “safe” carriers may be more difficult to track.
Savolainen 10
4. Robustness and Depth of Analysis methods Employed: The authors employ various fundamental statistical techniques as a part of their analyses, including comparisons of average crash rates and the estimation of simple linear regression models. The resultant findings are likely to be relatively robust. 5. Appropriateness of Methods for the Hypotheses Being Tested: The formal statistical testing procedures are reasonable. There are several areas where clarification would be helpful to better understand how specific methods were applied. One minor point is that it is not directly indicated is whether the differences in crash rates (illustrated in Tables 1 through 4) are statistically significant. They certainly appear to be, but a simple comparison procedure (e.g., t-tests) could be conducted (if they have not already). It is noted that power units (PU) are used as an exposure measure rather than vehicle miles of travel (VMT). Were the analyses conducted both ways? It would be interesting to see which was the stronger predictor (one would generally assume VMT, but it would be noteworthy and useful to know if that were not the case). At minimum, can VMT data be provided at the fleet level? Are there any other types of information that can be used to distinguish differences between fleets? The term “simulation” is used at several points in the report (pg. 4, pg. 17, and Appendix A specifically). It does not appear that this term is appropriate. In the context of statistical analysis, the term simulation generally refers to numerical techniques for approximating data distributions (e.g., Markov chain Monte Carlo simulation). In this case, it appears that the analysts are using the actual data from the pre- and post- periods. If this is the case, the verbiage should be changed. If this is not the case (and simulation is, in fact, being used), greater discussion is necessary to understand how this simulation was conducted. On pg. 26, it is noted that the trend analysis considers carriers with “a sufficient number of inspections and violations”. How is this determined (i.e., what is sufficient)? The general description for the process of detecting outliers for high crash rates (and subsequently for low crash rates) is not particularly clear to the reader. Some clarification of how the algorithm is being used would be helpful. It appears that the test is conducted as follows: (1) the crash counts for all carriers are assumed to follow a Poisson distribution with mean equal to the average crash rate for the population; (2) given this mean value, the probability of a carrier experiencing more than (or less than) its actual observed number of crashes during the period is calculated; (3) carriers with crash counts that are exceedingly high (or low) based upon the prescribed significant level are excluded from the subsequent analysis. Is that correct? 6. Extent to Which the Conclusions Follow the Analysis: The conclusions are well supported by the analysis results. Specifically, the three analyses directly address the primary issue of concern to the FMCSA, which is whether the CSMS provides a useful analytical framework for prioriting carriers for intervention based upon risk indices.’
Savolainen 11
One area that is not specifically addressed in the conclusions is the direction for future work, including what additional utility could be derived from the CSMS or recommendations for enhancements to the system moving forward. The authors note that the CSMS Effectiveness Test (ET) highlights the strengths and weaknesses of various components and prioritization policies, providing insights into how to improve the CSMS. Do the authors have specific recommendations on how the system can be improved moving forward? 7. Strengths and Limitations of the Overall Product: Overall, the report provides a lot of information that is very useful to the FMCSA and others in the traffic safety community. Ultimately, the analytical results show some very strong trends, which reflect important relationships that can be identified through the use of the CSMS. Most of the analytical issues that have been identified would help to strengthen the results of the study. Some of these issues may be easily addressed (i.e., determining whether group crash rates are significantly different). Some of the other issues may not be practical to address or may present promising avenues for subsequent work in this area. 8. Specific Recommendations for Improvement of the Product: The following are general comments beyond the technical issues that have been discussed previously. Some of the discussion on pg. 27 is ambiguous and/or difficult to follow. It is noted that, “this collective crash rate is not a prediction of the actual crash rate of an individual carrier”. It seems that the average crash rate for these percentile sets would result in an expected value for carriers with in that set. Ultimately, the description of the process becomes unclear in the last paragraph on pg. 27 and the first paragraph on pg. 28. On pg. 54, it is noted that, “This system has been shown not to be completely normal, and the adjustment above corrects for the case in which the mean of the population PU diff is not zero.” What would lead to “widely varying power unit counts”? Can any guidance be provided as to this issue? On pg. 54, it is also noted “The Effectiveness Test uses a confidence level of 1/1,000,000, which for one degree of freedom results in an inverse chi value of 24.366.” This presumably should refer to the significance (not confidence) level. Figures 5 through 25 show the crash rate by BASIC percentile for various scenarios. The key shows that national average as a dotted line, but the lines in the figures are solid. Addressing this discrepancy would improve the clarity of the report. Figures 5 through 25 also include different scales on the y-axis (crash rates). It is suggested that the same scale is used to the extent possible. These figures are generally grouped in sets of 3. So, perhaps a common scale for each group of figures may be appropriate. Another alternative would be to reduce the number of figures by (approximately) one-third by combining these figures. However, given the amount of information included in each figure, this may not be practical.

Savolainen 12
Continuing on the prior point, the discussion of the figures tends to be very formulaic. If this could be presented in a more concise form, highlighting the differences (i.e., which indicators were the strongest or weakest indicators) between these figures may improve the readability of the report. There are numerous instances where the reader is referred to external references (i.e., other reports). Perhaps some of these fine details could be provided in an appendix in short summary form (e.g., intervention thresholds, a summary of serious violations, etc.). This is not a critical issue, but providing further details of technical jargon would help to orient the reader.