cso 018 constructed wetlands pilot treatment system
TRANSCRIPT
Onondaga County, New York
CSO 018 Constructed Wetlands Pilot Treatment System
Sampling Plan
Prepared for
New York State Department of Environmental Conservation
Prepared jointly by
and
May 2016
Revision 4

OC_CSO018_SAMPLINGPLANAMENDMENT_052016.DOCX III
Contents 1 Objectives................................................................................................................................. 1-1
2 Sampling Responsibilities .......................................................................................................... 2-1
3 Sampling................................................................................................................................... 3-1 3.1 Parameter Sampling and Flow Monitoring ............................................................................ 3-1 3.2 Water Levels and Flow ........................................................................................................... 3-5 3.3 In Situ Environmental Parameters ......................................................................................... 3-6 3.4 Floatables ............................................................................................................................... 3-6 3.5 Meteorological Conditions .................................................................................................... 3-6 3.6 Maintenance Concerns .......................................................................................................... 3-6 3.7 Flow Configuration-Sampling Coordination .......................................................................... 3-6
4 Field Data Collection ................................................................................................................. 4-1 4.1 Storm Event Sampling Guidelines .......................................................................................... 4-1 4.2 Sampling and Metering Approach ......................................................................................... 4-2
4.2.1 CSO Event Sampling and Metering – SPDES Permit Required .................................. 4-2 4.2.2 CSO Event Sampling – System Optimization............................................................. 4-2 4.2.3 Extreme Event Sampling ........................................................................................... 4-3
4.3 Sample Collection and Preservation ...................................................................................... 4-3 4.3.1 Grab Samples ............................................................................................................ 4-3 4.3.2 Automated Sampling ................................................................................................ 4-4
4.4 Parameter-Specific Sample Preservation .............................................................................. 4-4 4.4.1 General Sample Preservation Guidelines ................................................................. 4-4 4.4.2 Additional Fecal Coliform Guidelines ........................................................................ 4-5
5 Field Data Collection QA/QC ...................................................................................................... 5-1 5.1 Sample Containers ................................................................................................................. 5-1 5.2 Sample Labeling ..................................................................................................................... 5-1 5.3 Chain of Custody .................................................................................................................... 5-1 5.4 Field Equipment Calibration .................................................................................................. 5-1
5.4.1 YSI Sonde................................................................................................................... 5-1 5.5 Health, Safety, & Training ...................................................................................................... 5-1
6 Analytical Protocols .................................................................................................................. 6-1 6.1 Chemicals and Reagents ........................................................................................................ 6-1 6.2 Reagents ................................................................................................................................ 6-2 6.3 Standard Solutions/Titrants ................................................................................................... 6-2 6.4 Bench or Shelf Reagents ........................................................................................................ 6-2 6.5 Calculations and Charts ......................................................................................................... 6-2 6.6 Laboratory Equipment ........................................................................................................... 6-2 6.7 Laboratory Quality Control Documentation Requirements .................................................. 6-4
6.7.1 Standard Curves ........................................................................................................ 6-4 6.7.2 Method Blank ........................................................................................................... 6-5 6.7.3 Instrument Blank ...................................................................................................... 6-5 6.7.4 Trip Blank (Special).................................................................................................... 6-5 6.7.5 Reference Sample ..................................................................................................... 6-5 6.7.6 Spiked Recovery ........................................................................................................ 6-5 6.7.7 Duplicate Analysis ..................................................................................................... 6-6
CONTENTS
IV OC_CSO018_SAMPLINGPLANAMENDMENT_052016.DOCX
6.7.8 External QA/QC ......................................................................................................... 6-6 6.7.9 Internal QA/QC .......................................................................................................... 6-6
7 Data Validation and Reporting .................................................................................................. 7-1 7.1 Data Review and Validation ................................................................................................... 7-1
7.1.1 Precision .................................................................................................................... 7-1 7.1.2 Accuracy .................................................................................................................... 7-1
7.2 Reporting and Documentation ............................................................................................... 7-2 7.2.1 Field and Laboratory Data ......................................................................................... 7-2
Appendices
A CSO Event Notification/Sampling Flowchart B CSO 018 Constructed Wetlands Pilot Treatment System Flow Diagrams C Floatables Description Form D OCDWEP Environmental Laboratory Field Preservation Guide E Example Chain of Custody Form F OCDWEP Personal Protective Equipment (PPE) Requirements
Tables
2-1 Preliminary Sampling Activity List with Associated Responsibilities ................................................... 2-1 3-1 SPDES Permit Parameter Sampling ..................................................................................................... 3-3 3-2 Years 1 and 2 Wetland Operational Scenarios .................................................................................... 3-7 4-1 System Optimization Parameters ........................................................................................................ 4-3 4-2 Sample Preservation and Collection Guidelines .................................................................................. 4-5 6-1 Analytical Procedures for Water Quality Analysis ............................................................................... 6-1 6-2 Reagent Grade Water Tests ................................................................................................................ 6-2 6-3 OCDWEP Laboratory Quality Control by Parameter ........................................................................... 6-4
OC_CSO018_SAMPLINGPLANAMENDMENT_052016.DOCX 1-1
SECTION 1
Objectives The following are the primary objectives of the sampling plan. Revision 4 of the Sampling Plan is for the period of April 1, 2016 through April 1, 2017 and reflects changes in procedures initiated during the first year of the pilot monitoring program for the Facility.
1. Monitor the overflow parameters required under the State Pollutant Discharge Elimination System (SPDES) permit (Permit Number NY 002 7081; Modification Date: June 4, 2014).
2. Monitor the performance of grit and floatables (G&F) removal system.
3. Assess target pollutant removal efficiencies for the wetland system with respect to the three different wetland types: Floating Wetland Islands (FWI), Vertical Down Flow (VDF) wetlands, and Surface Flow (SF) wetlands; and three different flow sequences (series, parallel, series-parallel).

OC_CSO018_SAMPLINGPLANAMENDMENT_052016.DOCX 2-1
SECTION 2
Sampling Responsibilities Flow and water quality monitoring will be performed. Sampling staff will be from the Onondaga Environmental Institute (OEI) under the direction of CH2M and the Onondaga County Department of Water Environment Protection (OCDWEP). Sampling efforts will be coordinated in accordance with the Combined Sewer Overflow (CSO) Event Notification/Sampling Flowchart included in Appendix A. All sampling staff members have received OCDWEP staff training in appropriate sampling and preservation protocols.
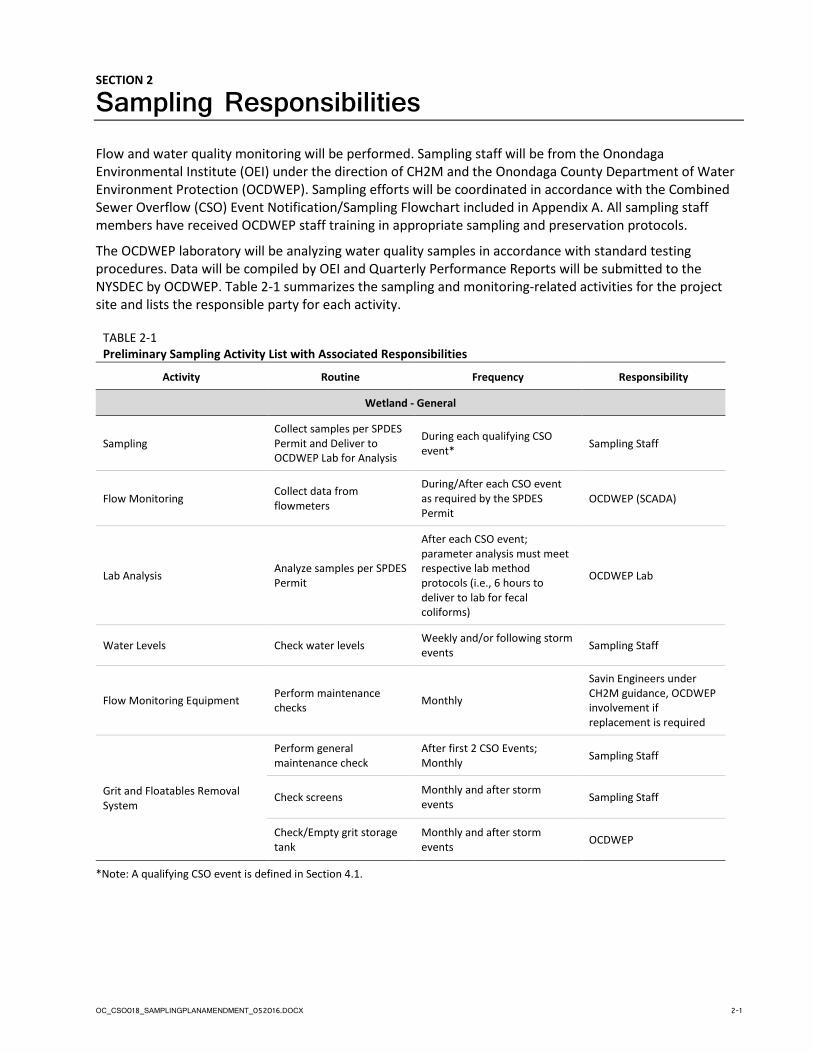
The OCDWEP laboratory will be analyzing water quality samples in accordance with standard testing procedures. Data will be compiled by OEI and Quarterly Performance Reports will be submitted to the NYSDEC by OCDWEP. Table 2-1 summarizes the sampling and monitoring-related activities for the project site and lists the responsible party for each activity.
TABLE 2-1 Preliminary Sampling Activity List with Associated Responsibilities
Activity Routine Frequency Responsibility
Wetland - General
Sampling Collect samples per SPDES Permit and Deliver to OCDWEP Lab for Analysis
During each qualifying CSO event* Sampling Staff
Flow Monitoring Collect data from flowmeters
During/After each CSO event as required by the SPDES Permit
OCDWEP (SCADA)
Lab Analysis Analyze samples per SPDES Permit
After each CSO event; parameter analysis must meet respective lab method protocols (i.e., 6 hours to deliver to lab for fecal coliforms)
OCDWEP Lab
Water Levels Check water levels Weekly and/or following storm events Sampling Staff
Flow Monitoring Equipment Perform maintenance checks Monthly
Savin Engineers under CH2M guidance, OCDWEP involvement if replacement is required
Grit and Floatables Removal System
Perform general maintenance check
After first 2 CSO Events; Monthly Sampling Staff
Check screens Monthly and after storm events Sampling Staff
Check/Empty grit storage tank
Monthly and after storm events OCDWEP
*Note: A qualifying CSO event is defined in Section 4.1.


OC_CSO018_SAMPLINGPLANAMENDMENT_052016.DOCX 3-1
SECTION 3
Sampling
Sampling staff will monitor the treatment system for the following parameters: target pollutants identified by the SPDES permit, wetland cell water levels and flow rates, in situ environmental parameters, and vegetation. Meteorological conditions will also be monitored. “Treatment system components” referred to in the text signify the grit and floatables (G&F) removal system and wetland cells 1-3. The following sections codify the parameters of interest, indicating general sampling frequency and association with monitoring objectives.
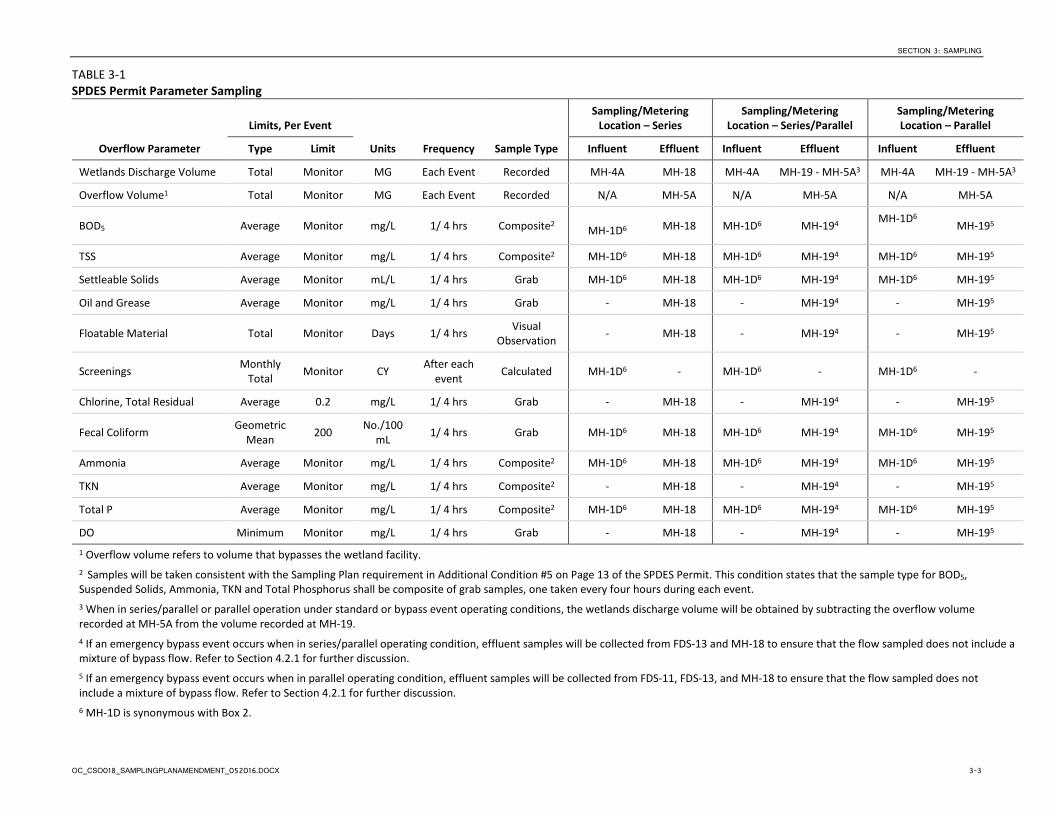
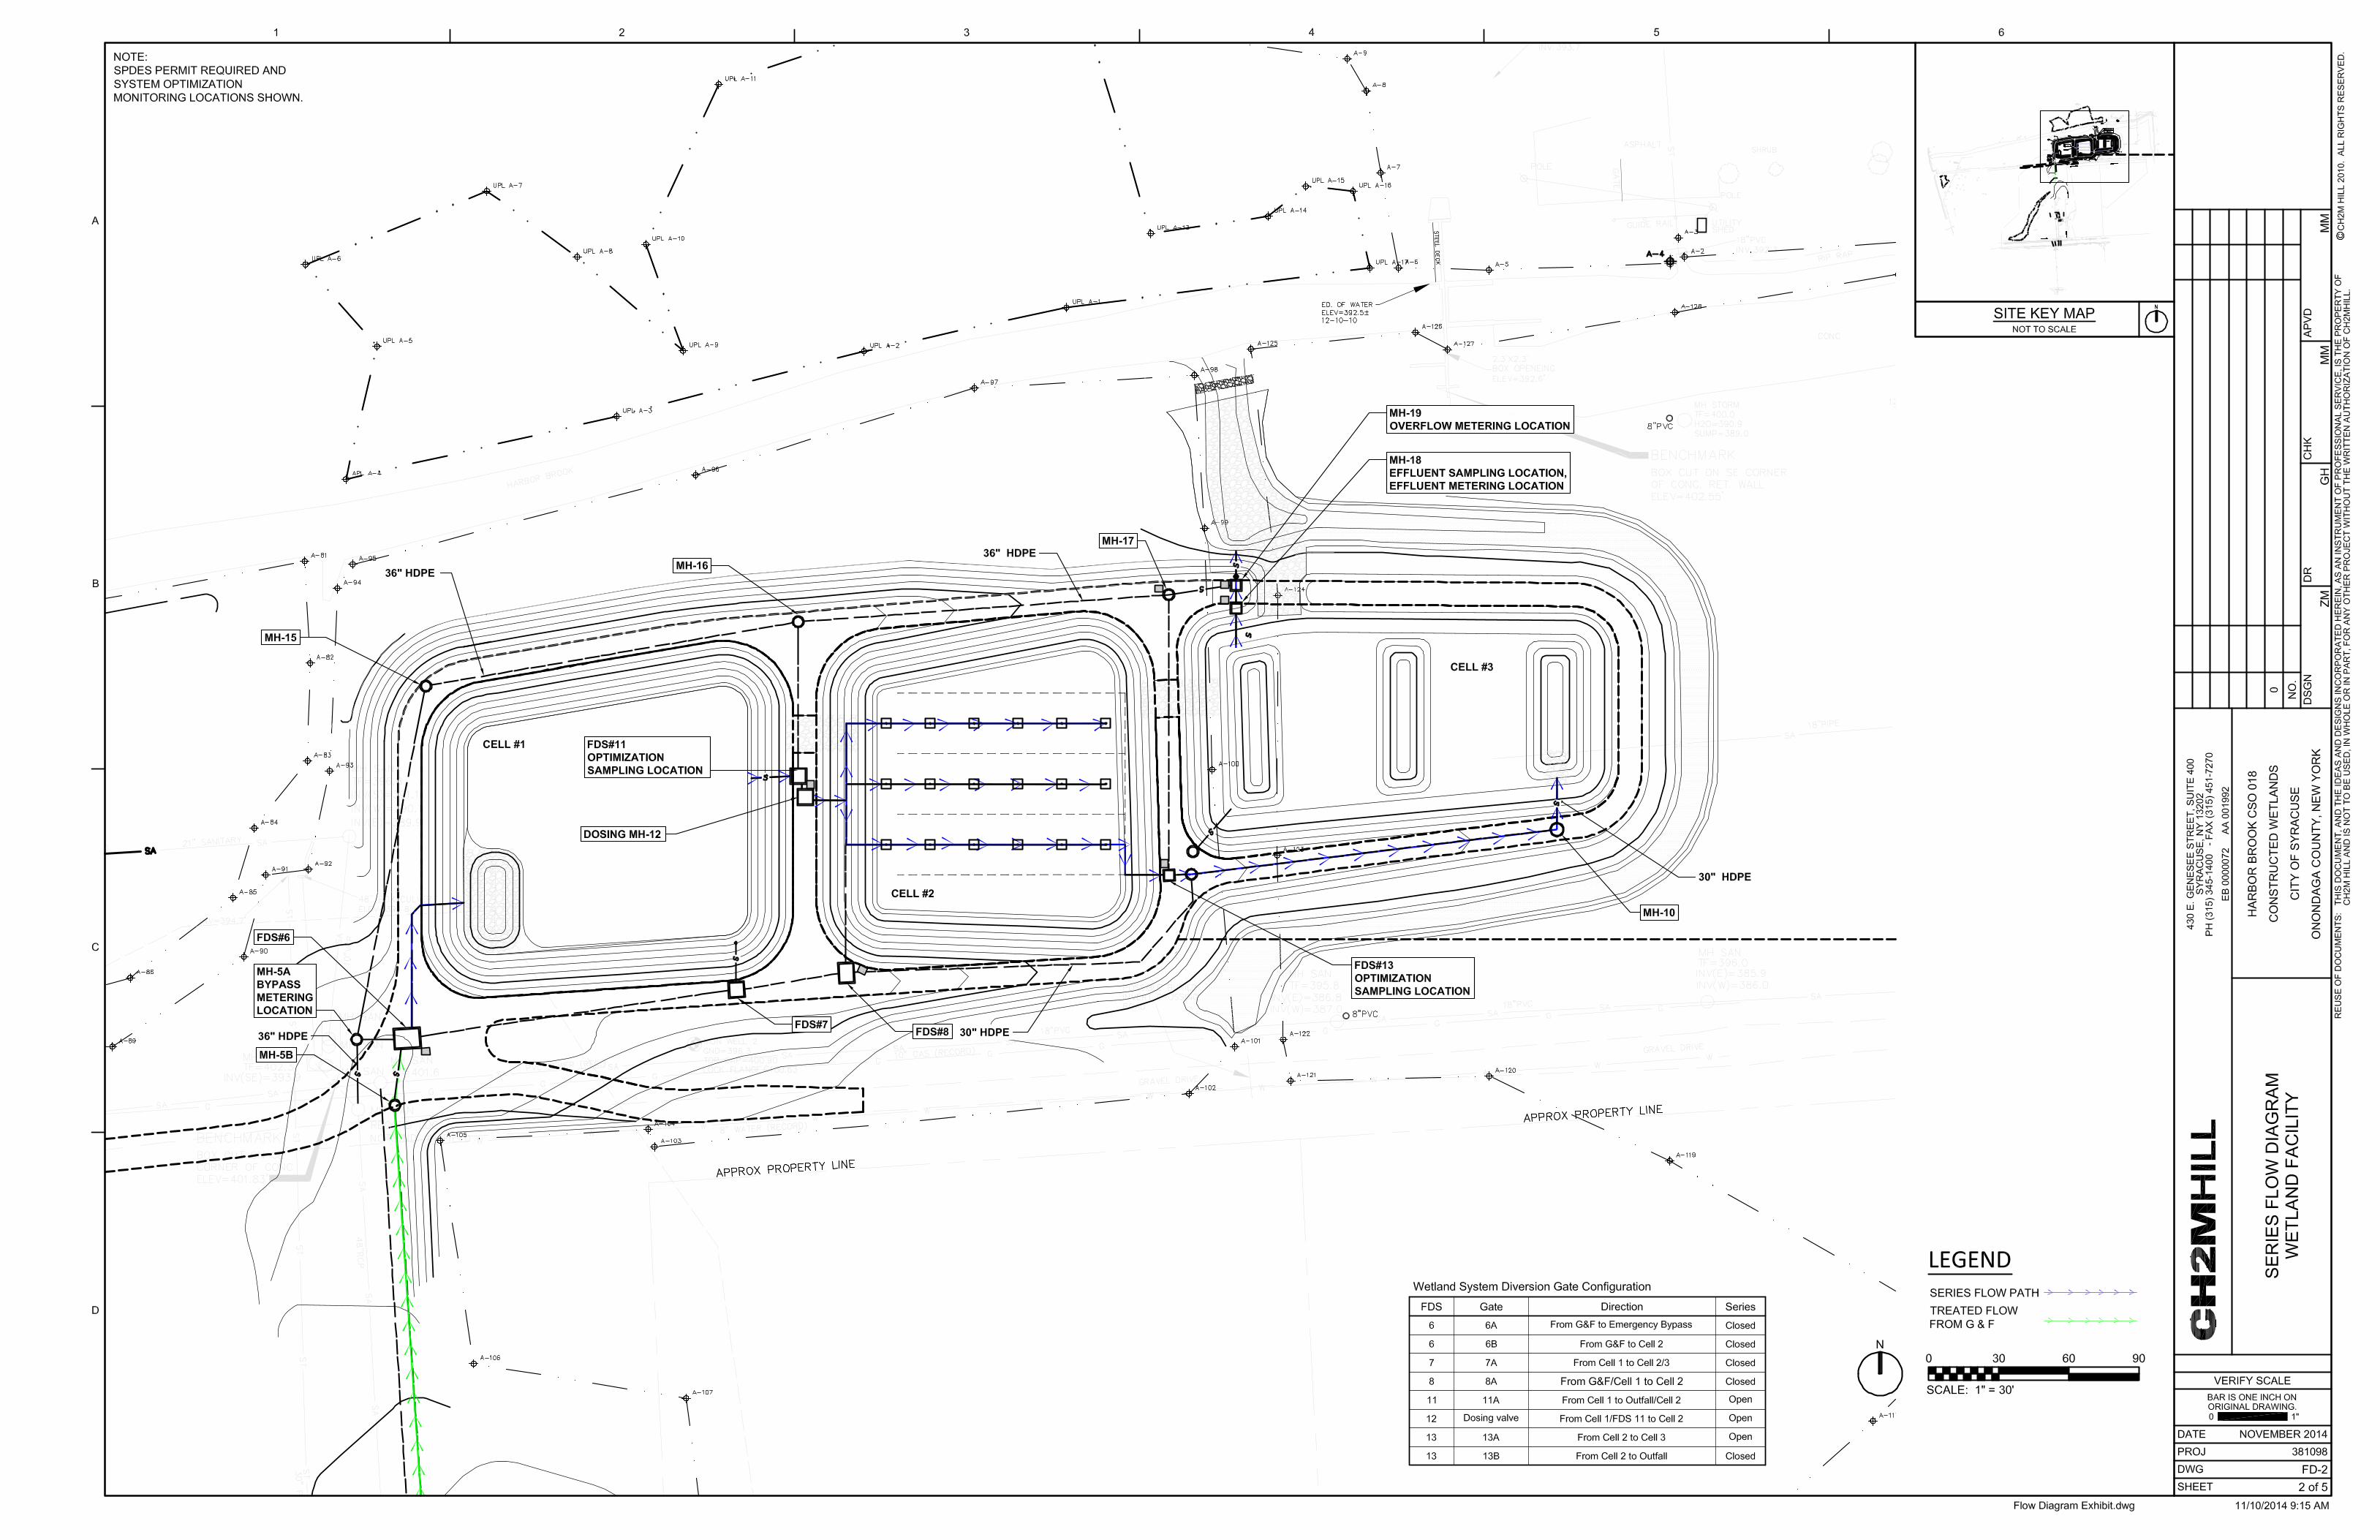
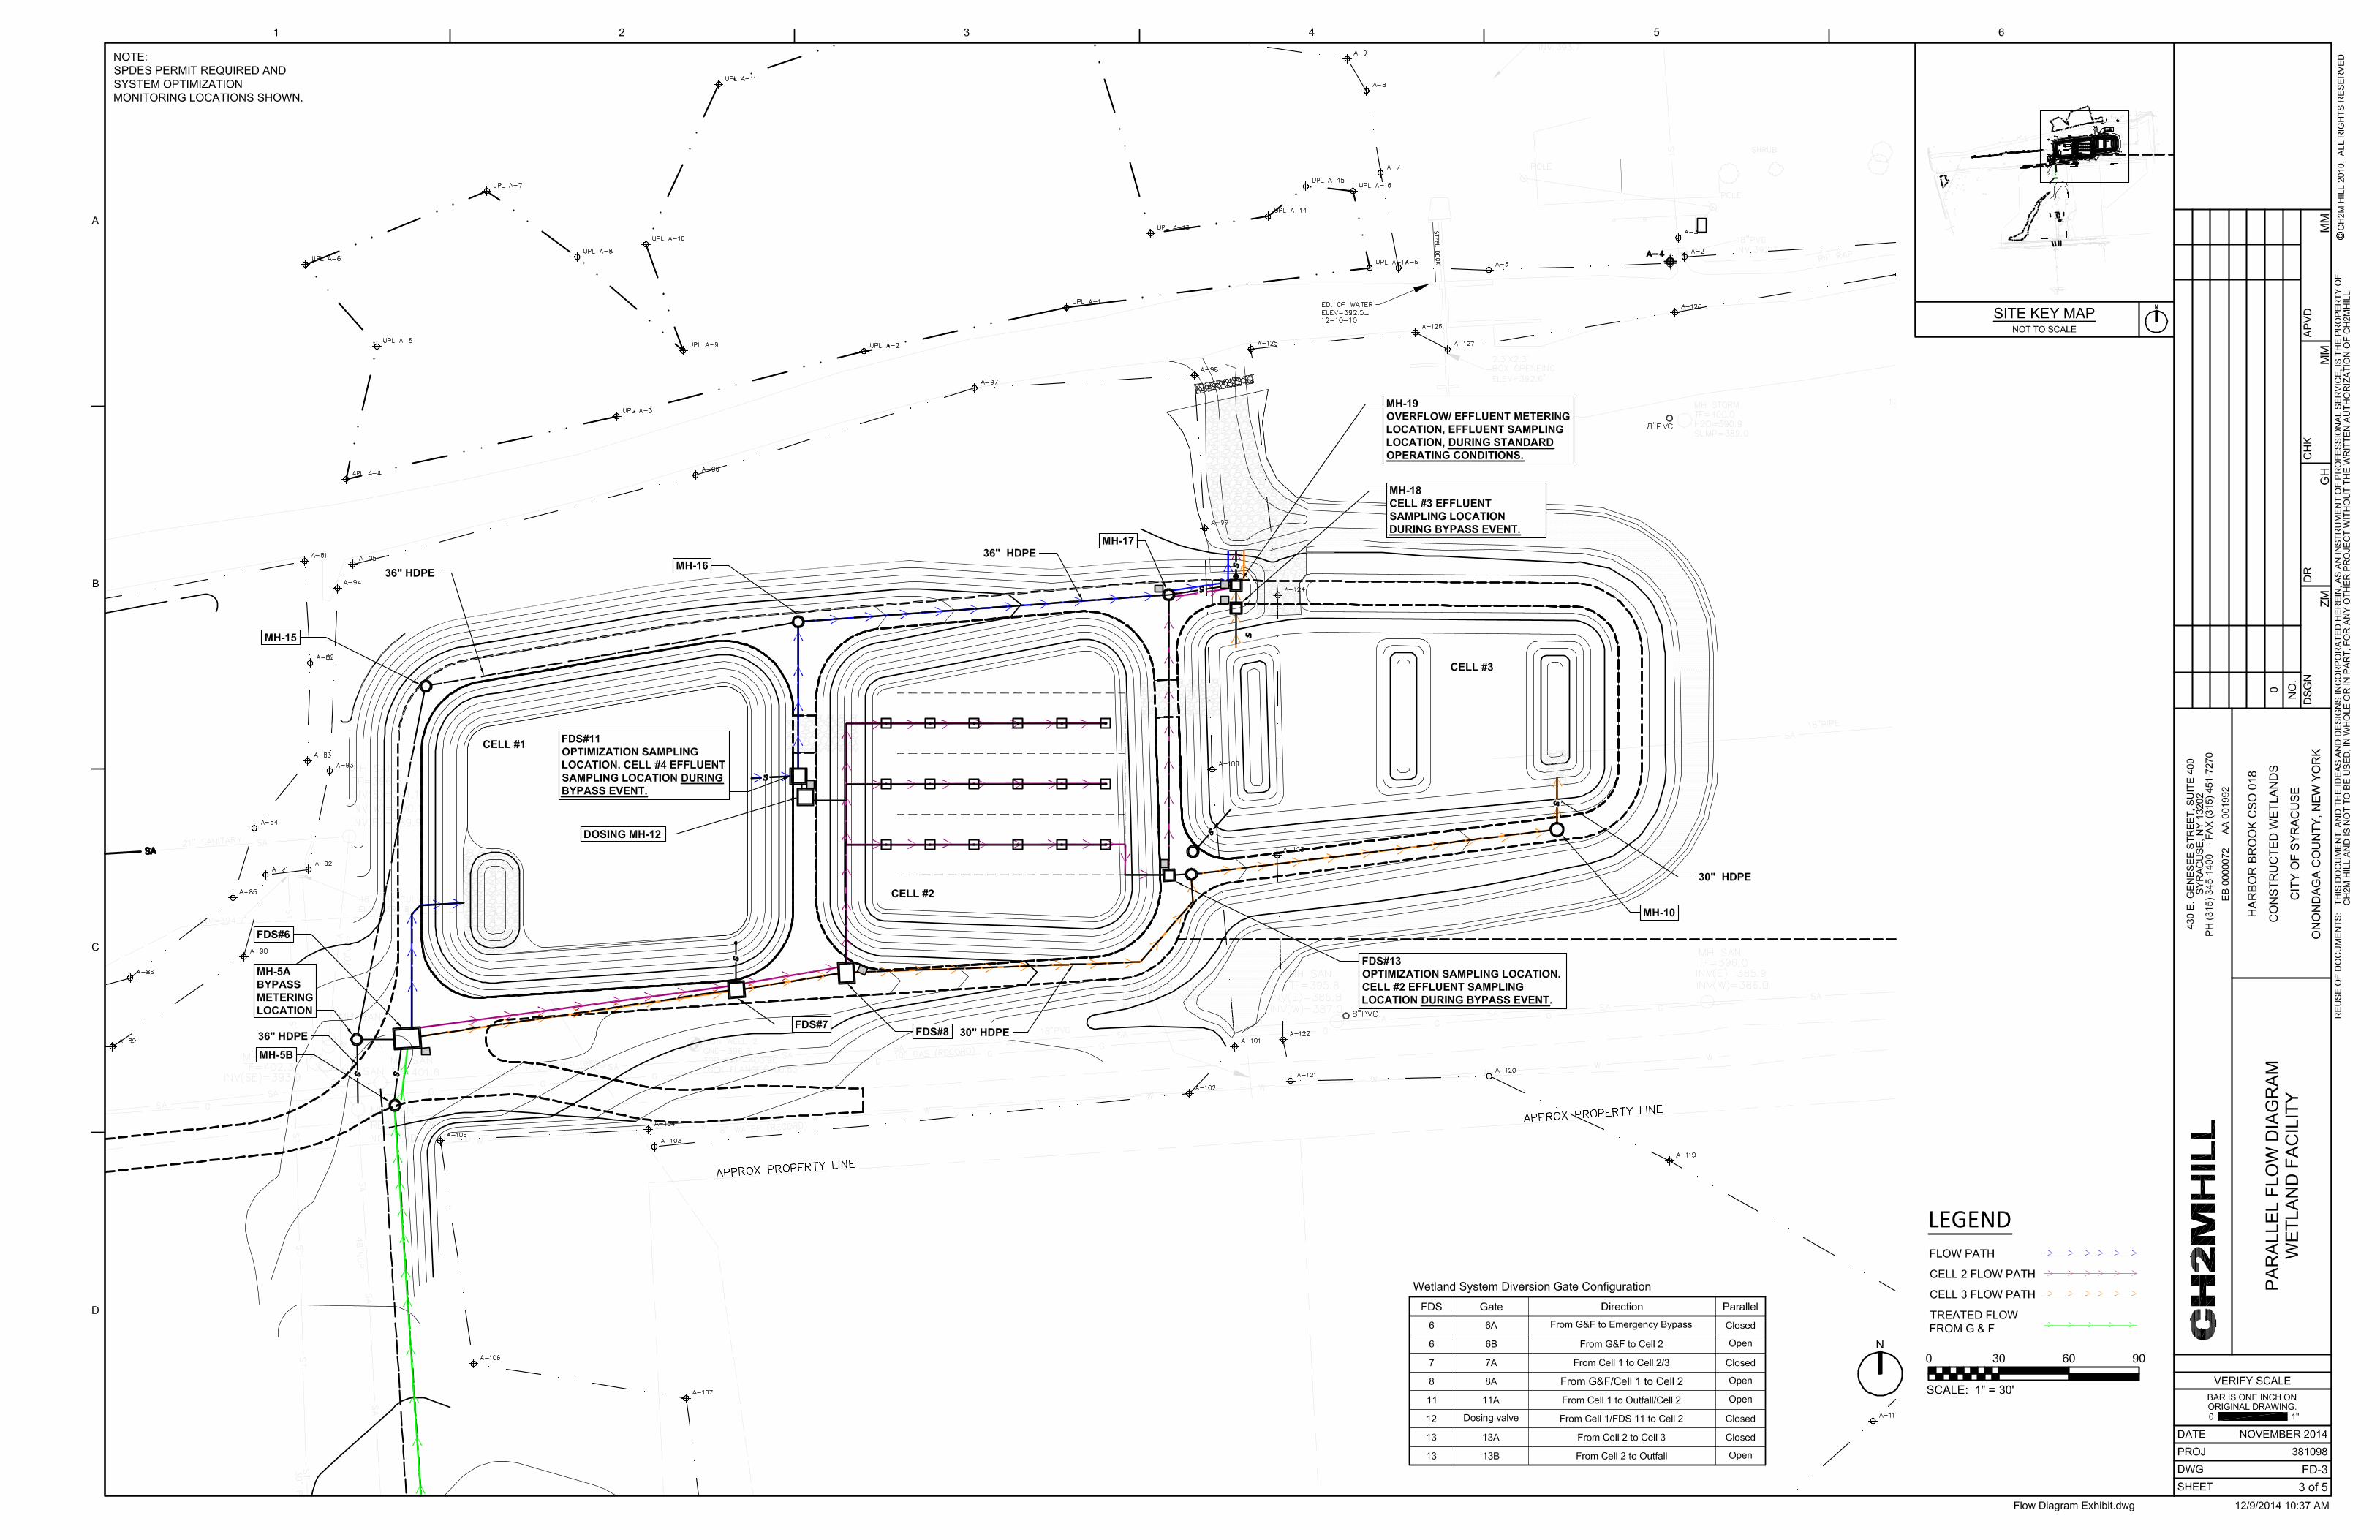
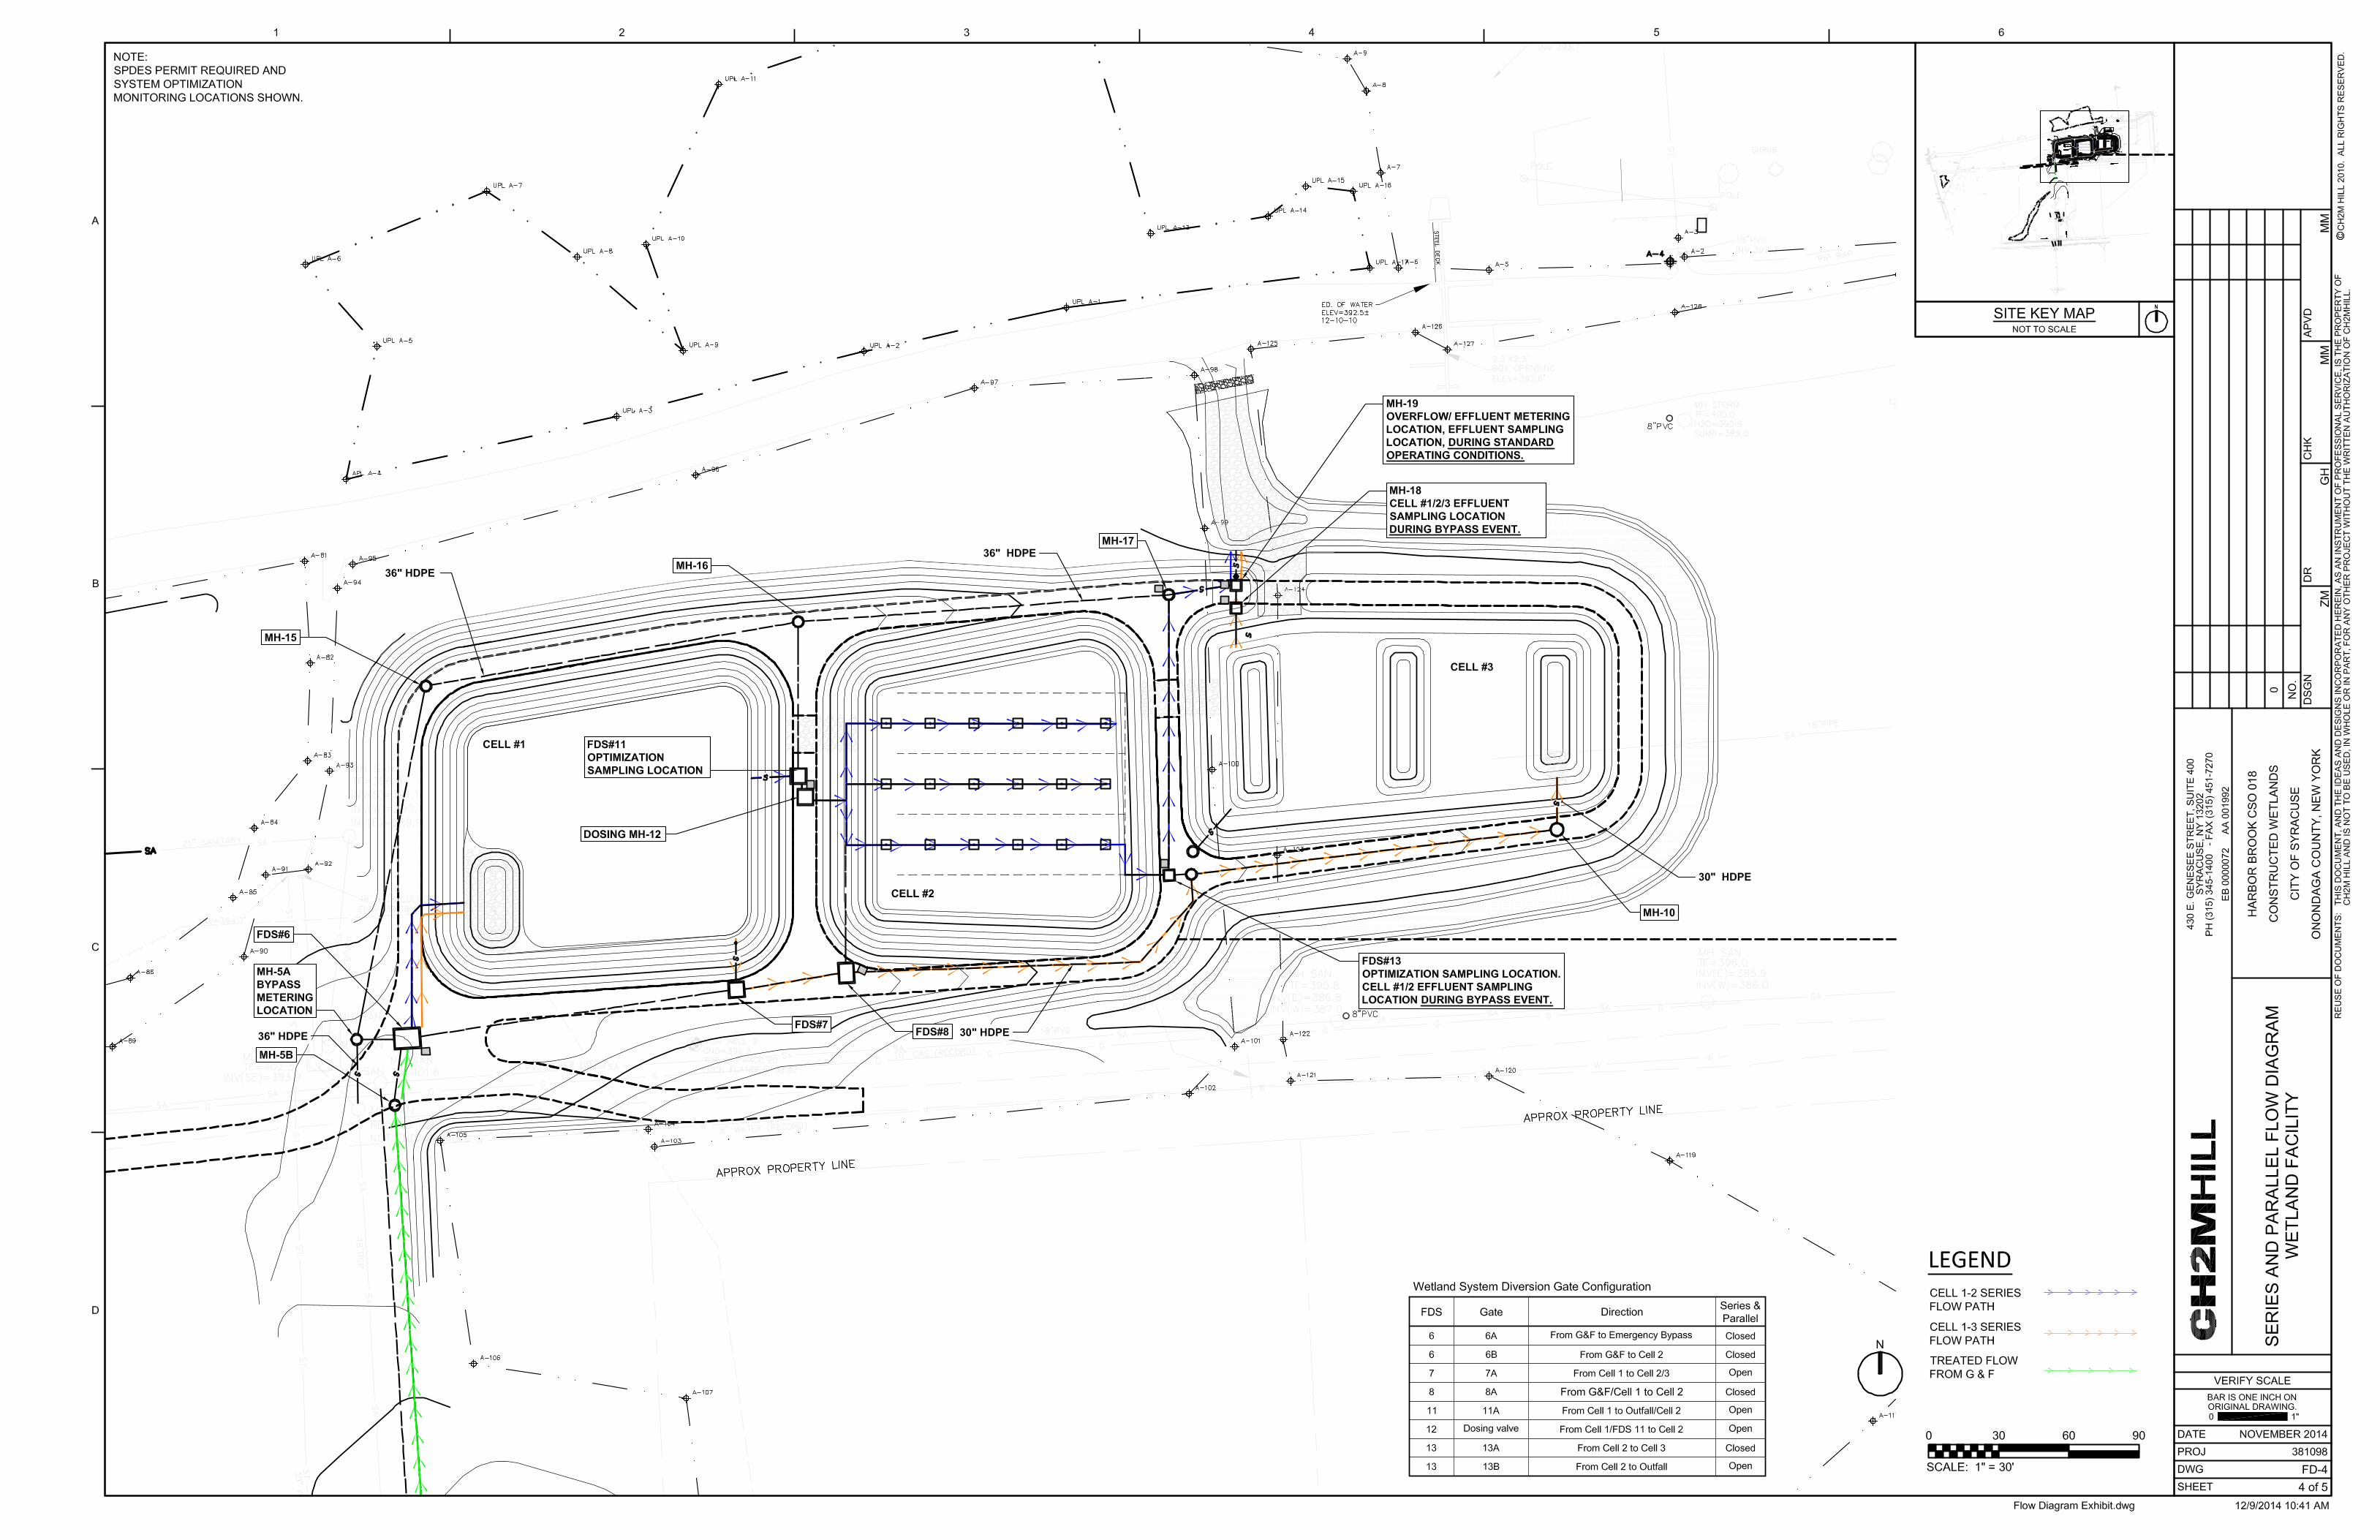
3.1 Parameter Sampling and Flow Monitoring Per the SPDES permit, samples will be collected and flows will be metered, as shown in Table 3-1. The locations of the parameter sampling and flow metering are shown in the flow diagrams provided in Appendix B. Note that the sampling/metering locations shown in Table 3-1 are for series operation. When in series/parallel or parallel operation, the effluent sampling location will be MH-19, other sampling/metering locations will remain the same. The actual effluent location will be sampled for the appropriate operation scenario. Samples will be collected as stated in Section 4 of this report. Note that additional samples will be collected from FDS-11 and FDS-13 (not required by the SPDES permit) for analyzing and optimizing the treatment system performance.

SECTION 3: SAMPLING
OC_CSO018_SAMPLINGPLANAMENDMENT_052016.DOCX 3-3
TABLE 3-1 SPDES Permit Parameter Sampling
Overflow Parameter
Limits, Per Event
Units Frequency Sample Type
Sampling/Metering Location – Series
Sampling/Metering Location – Series/Parallel
Sampling/Metering Location – Parallel
Type Limit Influent Effluent Influent Effluent Influent Effluent
Wetlands Discharge Volume Total Monitor MG Each Event Recorded MH-4A MH-18 MH-4A MH-19 - MH-5A3 MH-4A MH-19 - MH-5A3
Overflow Volume1 Total Monitor MG Each Event Recorded N/A MH-5A N/A MH-5A N/A MH-5A
BOD5 Average Monitor mg/L 1/ 4 hrs Composite2 MH-1D6 MH-18 MH-1D6 MH-194 MH-1D6 MH-195
TSS Average Monitor mg/L 1/ 4 hrs Composite2 MH-1D6 MH-18 MH-1D6 MH-194 MH-1D6 MH-195
Settleable Solids Average Monitor mL/L 1/ 4 hrs Grab MH-1D6 MH-18 MH-1D6 MH-194 MH-1D6 MH-195
Oil and Grease Average Monitor mg/L 1/ 4 hrs Grab - MH-18 - MH-194 - MH-195
Floatable Material Total Monitor Days 1/ 4 hrs Visual Observation - MH-18 - MH-194 - MH-195
Screenings Monthly Total Monitor CY After each
event Calculated MH-1D6 - MH-1D6 - MH-1D6 -
Chlorine, Total Residual Average 0.2 mg/L 1/ 4 hrs Grab - MH-18 - MH-194 - MH-195
Fecal Coliform Geometric Mean 200 No./100
mL 1/ 4 hrs Grab MH-1D6 MH-18 MH-1D6 MH-194 MH-1D6 MH-195
Ammonia Average Monitor mg/L 1/ 4 hrs Composite2 MH-1D6 MH-18 MH-1D6 MH-194 MH-1D6 MH-195
TKN Average Monitor mg/L 1/ 4 hrs Composite2 - MH-18 - MH-194 - MH-195
Total P Average Monitor mg/L 1/ 4 hrs Composite2 MH-1D6 MH-18 MH-1D6 MH-194 MH-1D6 MH-195
DO Minimum Monitor mg/L 1/ 4 hrs Grab - MH-18 - MH-194 - MH-195 1 Overflow volume refers to volume that bypasses the wetland facility. 2 Samples will be taken consistent with the Sampling Plan requirement in Additional Condition #5 on Page 13 of the SPDES Permit. This condition states that the sample type for BOD5, Suspended Solids, Ammonia, TKN and Total Phosphorus shall be composite of grab samples, one taken every four hours during each event. 3 When in series/parallel or parallel operation under standard or bypass event operating conditions, the wetlands discharge volume will be obtained by subtracting the overflow volume recorded at MH-5A from the volume recorded at MH-19. 4 If an emergency bypass event occurs when in series/parallel operating condition, effluent samples will be collected from FDS-13 and MH-18 to ensure that the flow sampled does not include a mixture of bypass flow. Refer to Section 4.2.1 for further discussion. 5 If an emergency bypass event occurs when in parallel operating condition, effluent samples will be collected from FDS-11, FDS-13, and MH-18 to ensure that the flow sampled does not include a mixture of bypass flow. Refer to Section 4.2.1 for further discussion. 6 MH-1D is synonymous with Box 2.

SECTION 3: SAMPLING
OC_CSO018_SAMPLINGPLANAMENDMENT_052016.DOCX 3-5
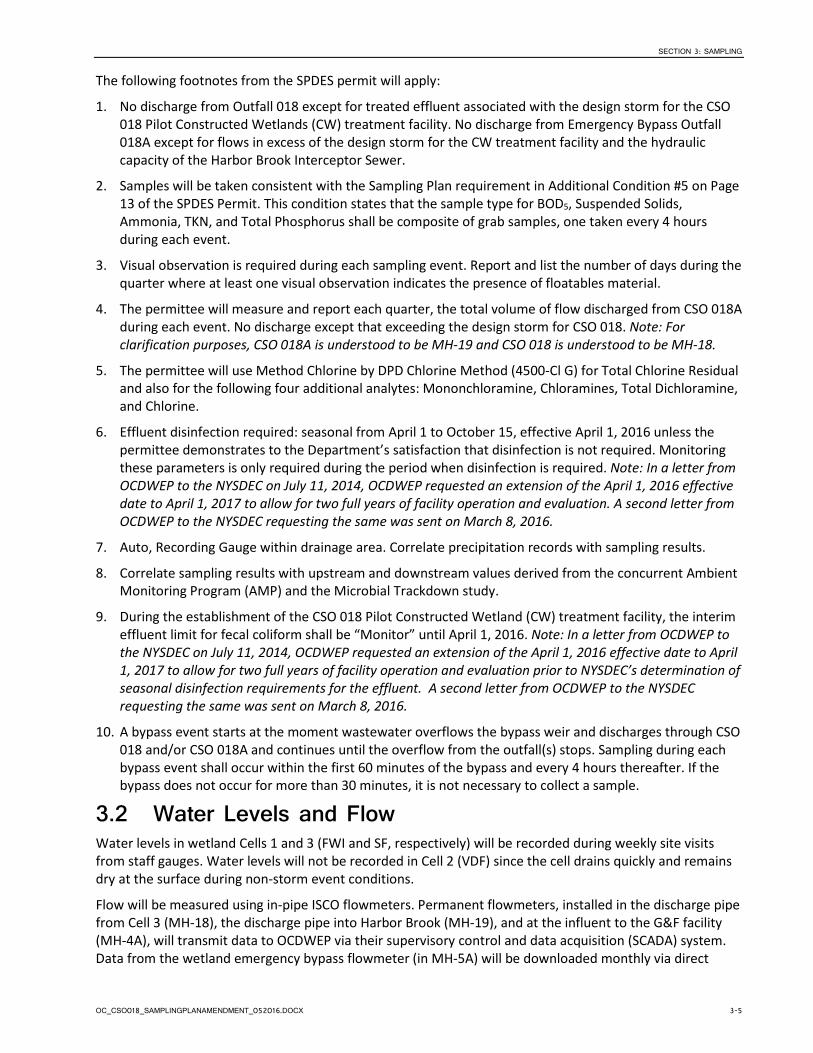
The following footnotes from the SPDES permit will apply:
1. No discharge from Outfall 018 except for treated effluent associated with the design storm for the CSO 018 Pilot Constructed Wetlands (CW) treatment facility. No discharge from Emergency Bypass Outfall 018A except for flows in excess of the design storm for the CW treatment facility and the hydraulic capacity of the Harbor Brook Interceptor Sewer.
2. Samples will be taken consistent with the Sampling Plan requirement in Additional Condition #5 on Page 13 of the SPDES Permit. This condition states that the sample type for BOD5, Suspended Solids, Ammonia, TKN, and Total Phosphorus shall be composite of grab samples, one taken every 4 hours during each event.
3. Visual observation is required during each sampling event. Report and list the number of days during the quarter where at least one visual observation indicates the presence of floatables material.
4. The permittee will measure and report each quarter, the total volume of flow discharged from CSO 018A during each event. No discharge except that exceeding the design storm for CSO 018. Note: For clarification purposes, CSO 018A is understood to be MH-19 and CSO 018 is understood to be MH-18.
5. The permittee will use Method Chlorine by DPD Chlorine Method (4500-Cl G) for Total Chlorine Residual and also for the following four additional analytes: Mononchloramine, Chloramines, Total Dichloramine, and Chlorine.
6. Effluent disinfection required: seasonal from April 1 to October 15, effective April 1, 2016 unless the permittee demonstrates to the Department’s satisfaction that disinfection is not required. Monitoring these parameters is only required during the period when disinfection is required. Note: In a letter from OCDWEP to the NYSDEC on July 11, 2014, OCDWEP requested an extension of the April 1, 2016 effective date to April 1, 2017 to allow for two full years of facility operation and evaluation. A second letter from OCDWEP to the NYSDEC requesting the same was sent on March 8, 2016.
7. Auto, Recording Gauge within drainage area. Correlate precipitation records with sampling results.
8. Correlate sampling results with upstream and downstream values derived from the concurrent Ambient Monitoring Program (AMP) and the Microbial Trackdown study.
9. During the establishment of the CSO 018 Pilot Constructed Wetland (CW) treatment facility, the interim effluent limit for fecal coliform shall be “Monitor” until April 1, 2016. Note: In a letter from OCDWEP to the NYSDEC on July 11, 2014, OCDWEP requested an extension of the April 1, 2016 effective date to April 1, 2017 to allow for two full years of facility operation and evaluation prior to NYSDEC’s determination of seasonal disinfection requirements for the effluent. A second letter from OCDWEP to the NYSDEC requesting the same was sent on March 8, 2016.
10. A bypass event starts at the moment wastewater overflows the bypass weir and discharges through CSO 018 and/or CSO 018A and continues until the overflow from the outfall(s) stops. Sampling during each bypass event shall occur within the first 60 minutes of the bypass and every 4 hours thereafter. If the bypass does not occur for more than 30 minutes, it is not necessary to collect a sample.
3.2 Water Levels and Flow Water levels in wetland Cells 1 and 3 (FWI and SF, respectively) will be recorded during weekly site visits from staff gauges. Water levels will not be recorded in Cell 2 (VDF) since the cell drains quickly and remains dry at the surface during non-storm event conditions.
Flow will be measured using in-pipe ISCO flowmeters. Permanent flowmeters, installed in the discharge pipe from Cell 3 (MH-18), the discharge pipe into Harbor Brook (MH-19), and at the influent to the G&F facility (MH-4A), will transmit data to OCDWEP via their supervisory control and data acquisition (SCADA) system. Data from the wetland emergency bypass flowmeter (in MH-5A) will be downloaded monthly via direct

SECTION 3: SAMPLING
3-6 OC_CSO018_SAMPLINGPLANAMENDMENT_052016.DOCX
connection to the meter. Additional temporary flow meters will be installed in the outlet pipes from FDS-11 and FDS-13 to quantify flows from Cell 1 and 2, respectively, when the system is operating in parallel or series/parallel modes. Data from the temporary flow meters will be downloaded monthly via direct connection.
3.3 In Situ Environmental Parameters In situ measurements of diagnostic parameters provide insight into the biogeochemical processes at work within the treatment system and provide metrics of wetland health. Relating these variables to pollutant load reductions can help to indicate strategies for optimizing wetland performance and future system designs. Measurements will be made on grab samples obtained during storm events.
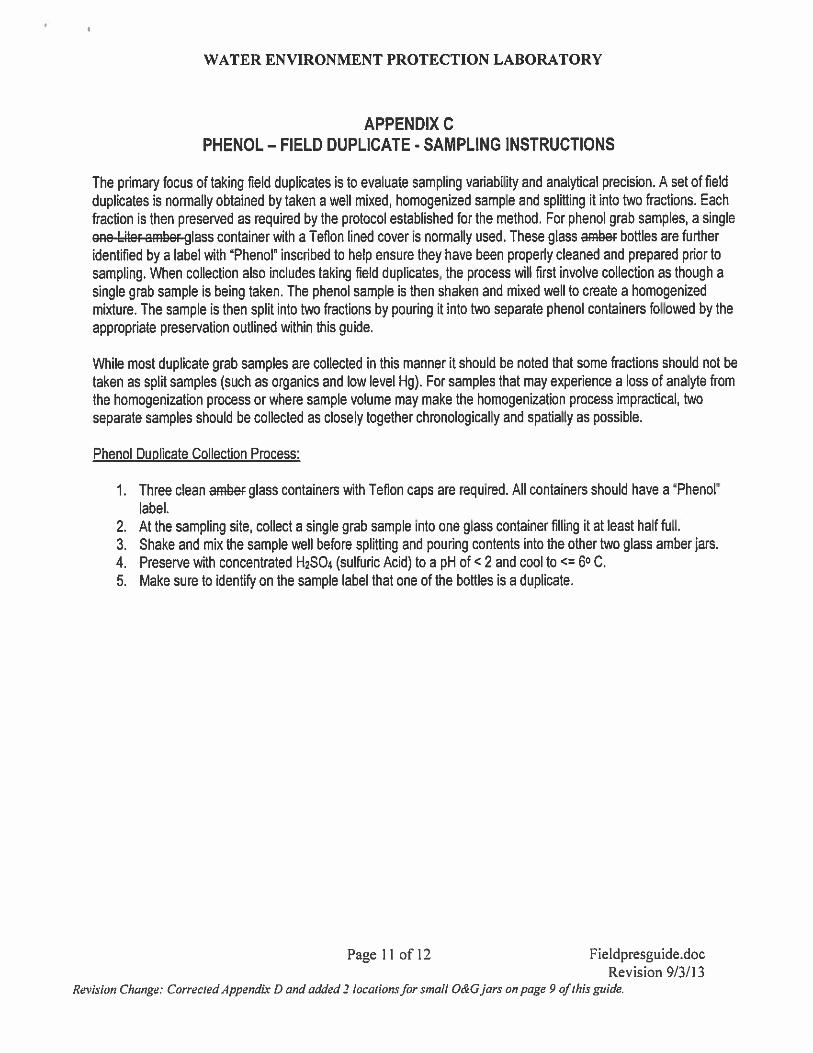
3.4 Floatables If floatables are present during an effluent discharge event, sampling staff will record a description of the floatables on the “Floatables Description Form” included in Appendix C. The forms will be provided to the NYSDEC in the quarterly reports submitted by OCDWEP. If no floatables are observed, a form will not be completed.
3.5 Meteorological Conditions Per the SPDES permit, precipitation will be logged and recorded hourly. An automatic, recording rain gauge installed at the City of Syracuse’s Wadsworth Park will be used for hourly precipitation data and intensity. In the event of a malfunction with the Wadsworth Park rain gauge, OCDWEP’s Metro Facility rain gauge will be used as a backup.
3.6 Maintenance Concerns Weekly site visits will afford the monitoring team the opportunity to address structural and practical concerns, including but not limited to water levels, berm integrity, operation of the G&F system, wildlife, vandalism, odors, and vector control. These items will be tracked per SPDES requirements (Part 750). See the Wet Weather Operating Plan for more information.
3.7 Flow Configuration-Sampling Coordination A crucial monitoring issue for the Harbor Brook CSO 018 Wetland Treatment System will be properly sampling each of the three different flow configurations. The three wetland cells will be able to receive CSO discharge in series, parallel, and series-parallel flow configurations. The following primary directives will be followed to ensure that objectives for smooth operation and adequate data collection are maintained:
• During the first year of system operation, the system will remain in series operation to provide a consistent base of operation as the sampling program is initiated.
• During the second pilot test period, the flow configuration will be set to series as soon as snowpack is anticipated, and will remain as such until spring thaw due to the fact that series flow offers the longest retention time with which to detain runoff associated with snowmelt.
• An effort will be made to monitor each scenario under the full range of seasonal conditions so as to generate a sufficiently robust dataset which will lend itself to valuable statistical inferences.
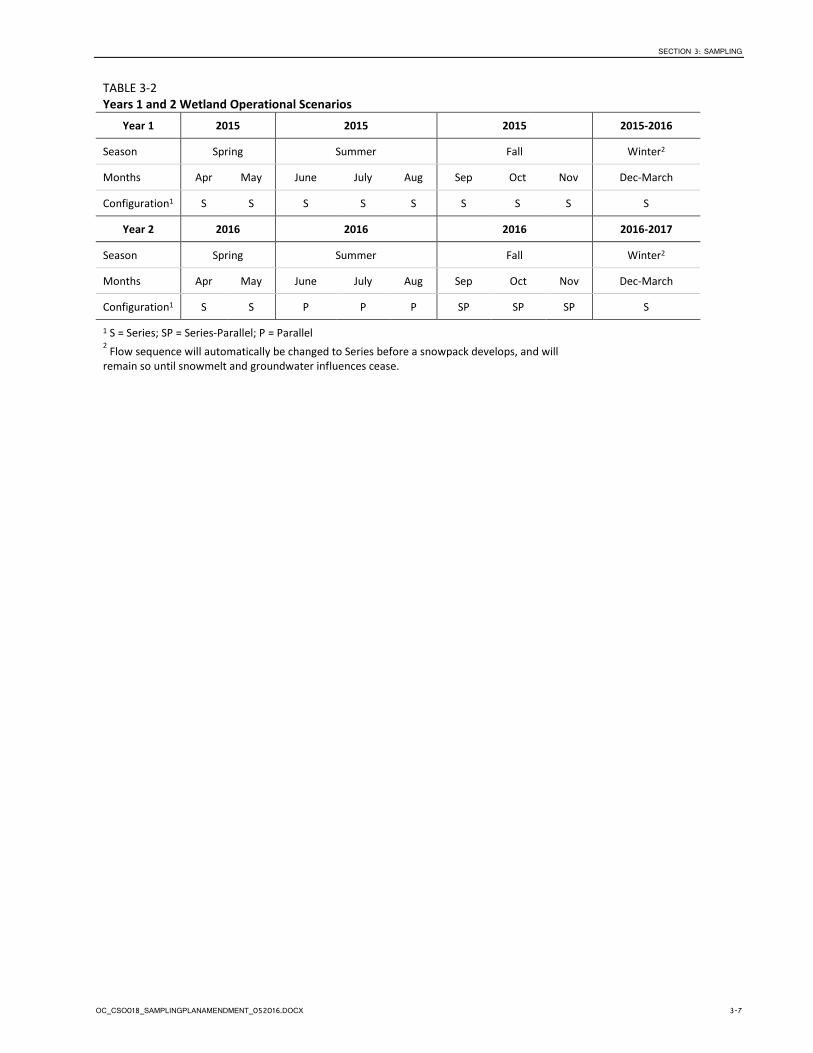
• Facility operation began on April 22, 2015 after the successful completion of system testing and calibration by the construction contractor. Table 3-2 reflects the actual wetland operating scenarios through 2015 and the planned scenarios for 2016. The various operating scenarios will be evaluated (see Section 4 for “system optimization” monitoring) and the long-term operating scenario will be decided upon after the completion of the initial monitoring period.
SECTION 3: SAMPLING
OC_CSO018_SAMPLINGPLANAMENDMENT_052016.DOCX 3-7
TABLE 3-2 Years 1 and 2 Wetland Operational Scenarios
Year 1 2015 2015 2015 2015-2016
Season Spring Summer Fall Winter2
Months Apr May June July Aug Sep Oct Nov Dec-March
Configuration1 S S S S S S S S S
Year 2 2016 2016 2016 2016-2017
Season Spring Summer Fall Winter2
Months Apr May June July Aug Sep Oct Nov Dec-March
Configuration1 S S P P P SP SP SP S
1 S = Series; SP = Series-Parallel; P = Parallel 2 Flow sequence will automatically be changed to Series before a snowpack develops, and will remain so until snowmelt and groundwater influences cease.


OC_CSO018_SAMPLINGPLANAMENDMENT_052016.DOCX 4-1
SECTION 4
Field Data Collection This section details field protocols for obtaining water samples and taking in situ measurements of environmental parameters. All grab sample collection and preservation protocols described here are consistent with those described by the AMP.
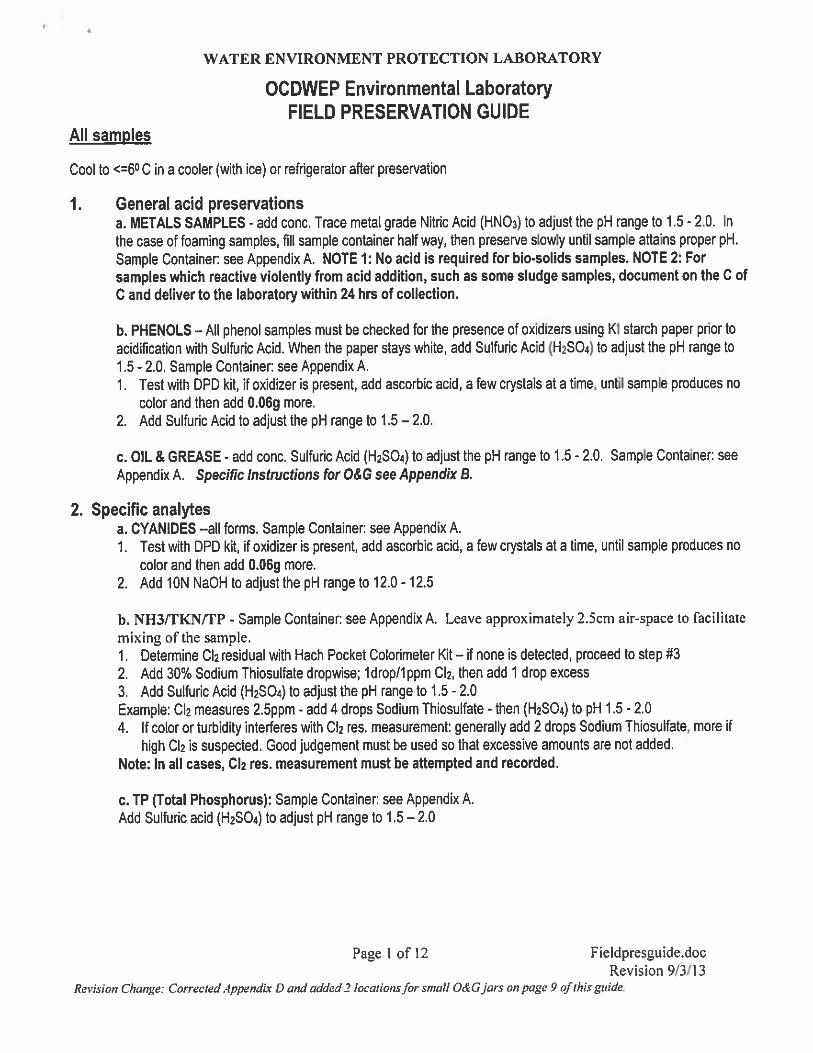
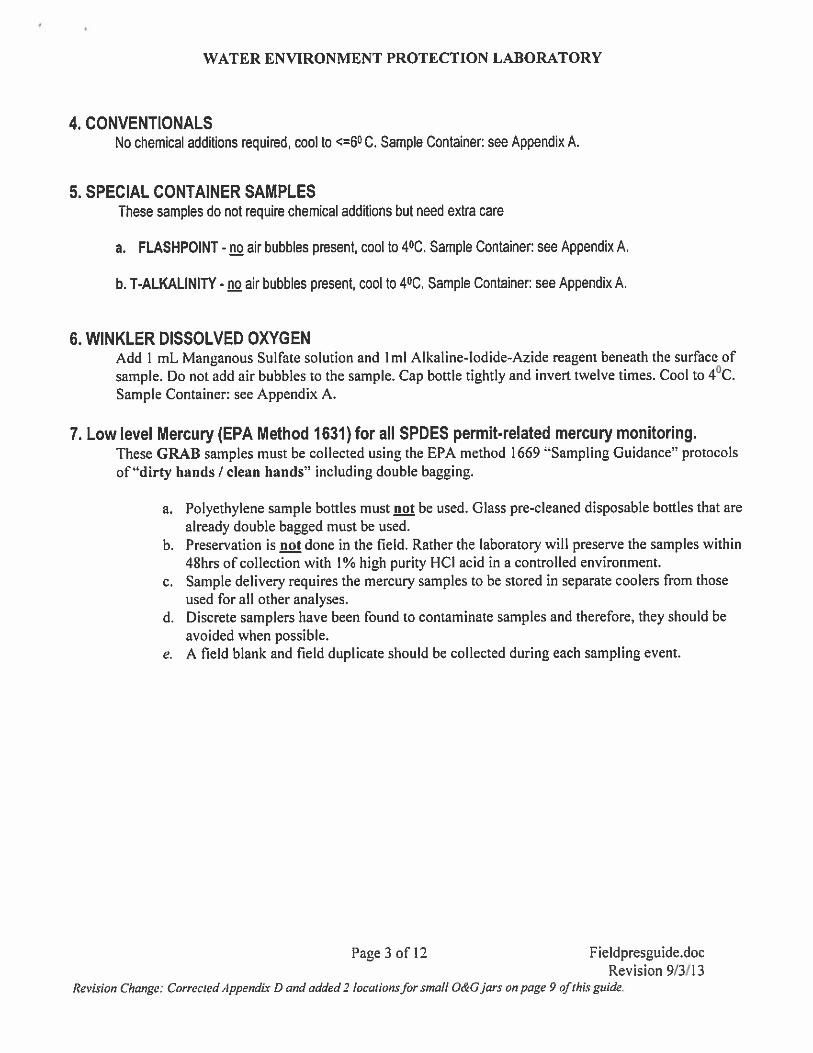
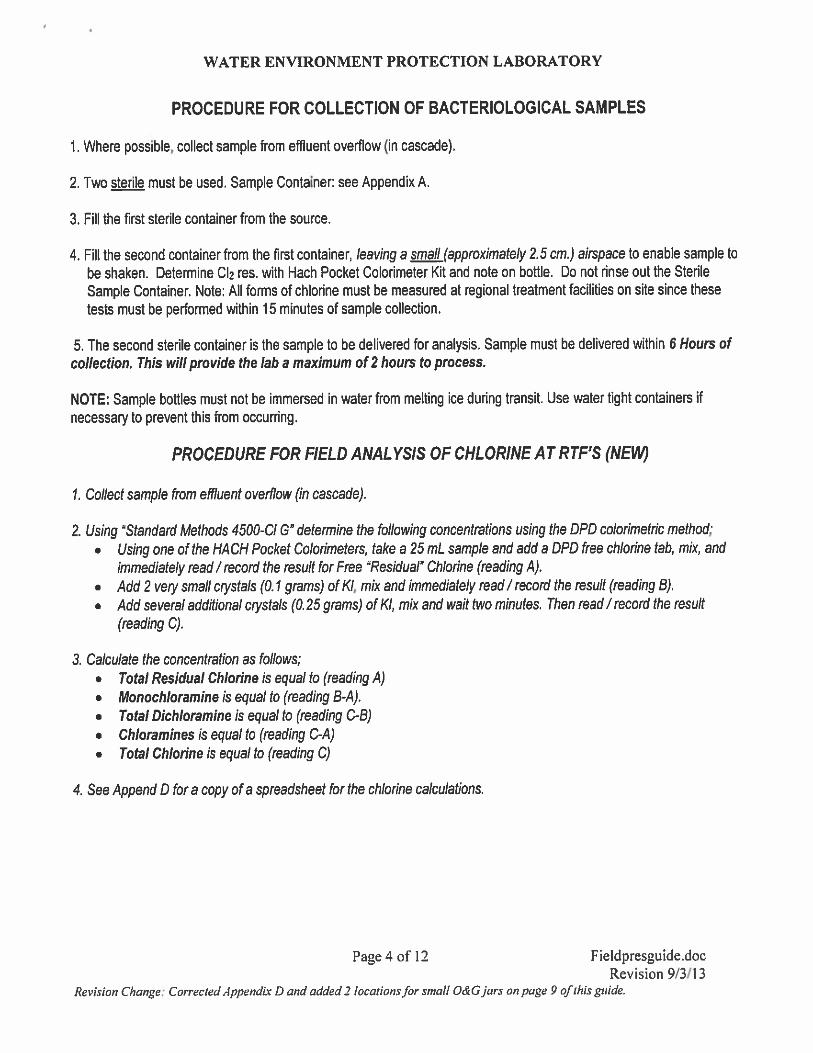
All field sampling and preservation techniques referenced herein are per OCDWEP’s Environmental Laboratory Field Preservation Guide (Appendix D) and are also consistent with standard USEPA protocols (USEPA 600/4-82-029 and 40 CFR 136).
Protocols applicable to the directives of this plan have been chosen from the aforementioned documents and major salient points are presented below.
4.1 Storm Event Sampling Guidelines Samples will be collected during qualifying CSO events, which are defined as wet weather events where rainfall and/or snowmelt causes flow in the Rowland Street Trunk Sewer (018 sewer) to be above 6 cubic feet per second (cfs). At this point per the County’s combined sewer system SWMM model, the Harbor Brook Interceptor Sewer (HBIS) is at its capacity, and a CSO overflow out the 018 outfall would occur. In the event of dry weather flow above 6 cfs due to influence from the Bellevue Country Club detention ponds, the capacity of the HBIS and Metro will be verified by OCDWEP via their SCADA system. If sufficient capacity exists, the dry weather flow will be allowed to flow into the HBIS and eventually to Metro for treatment.
Via the use of OCDWEP’s SCADA system, the sampling staff will be notified when wet weather flow reaches 6 cfs and begins to be diverted to the G&F system (referred to as an “Influent diversion event”). Sampling staff are required to acknowledge that they are able to collected samples and will proceed to the sampling site immediately to do so.
Similarly, when flow begins discharging from the wetland facility (referred to as an “Effluent discharge event”), the SCADA system will alert OCDWEP who will in turn alert the sampling staff (if not already on-site) that sampling from the effluent must begin. Currently, SCADA integration of the effluent discharge alarm has not been completed. At this time, sampling staff repeatedly check the effluent flow meter display interface to determine the measured flow rate. Once a positive flow rate of greater than 0.1 cfs is observed, effluent samples are collected. Flow rates of less than 0.1 cfs are considered negligible and are likely not an indication of actual positive flow due to accuracy limits of the flow meter. It is expected that the SCADA integration of the effluent discharge alarm will be completed by mid-summer 2016.
A backflow preventer is installed on the outfall pipe after MH-19 to prevent backflow from the adjacent stream or Harbor Brook from flowing into wetland Cell 3 and skewing analytical and flow data. The backflow preventer does not allow quantifiable flow out of the wetland facility until 20 inches of pressure head difference across the unit is achieved. The elevation of the flow behind the backflow preventer within the wetland facility when the facility begins to discharge varies from event to event. This is because the elevation of Harbor Brook is in constant flux due to rainfall, snowmelt, surrounding groundwater conditions, etc.
Upon arriving at the site, sampling staff will collect samples from the influent, preserve them per OCDWEP standards, and notify the OCDWEP Lab that samples have been collected. If the flow is substantial enough for an effluent discharge event to occur, samples will be collected from the effluent, as well. In most situations, depending on the intensity and duration of the rain event and due to the substantial storage volume within the wetland cells, an effluent discharge event will not occur for an extended duration after the influent diversion begins. After the influent diversion event and/or effluent discharge event is complete, sampling staff will again notify the OCDWEP Lab, and samples will be analyzed for parameters within the

SECTION 4: FIELD DATA COLLECTION
4-2 OC_CSO018_SAMPLINGPLANAMENDMENT_052016.DOCX
required hold times. In the event that influent samples are collected and an effluent discharge does not occur, the influent sample parameters that have not yet been analyzed will be discarded and results will not be reported in the quarterly performance report.
4.2 Sampling and Metering Approach The approach of this monitoring and sampling plan will be to collect flow-weighted composite event samples under normal circumstances. Flowmeter data will be collected from the installed flowmeters.
4.2.1 CSO Event Sampling and Metering – SPDES Permit Required A grab sample will be collected at the influent (MH-1D/Box 2) immediately after sampling staff arrive onsite. Similarly, a grab sample will be collected at the effluent after 30 minutes of discharge occurs. Grab samples will be collected at the influent and effluent again every 4 hours, if the event is of sufficient duration. For parameters that require composite samples, grab samples collected every 4 hours will be composited manually by the OCDWEP Lab prior to analysis. If the discharge does not occur for more than 30 minutes, it is not necessary to collect samples (per SPDES permit requirements).
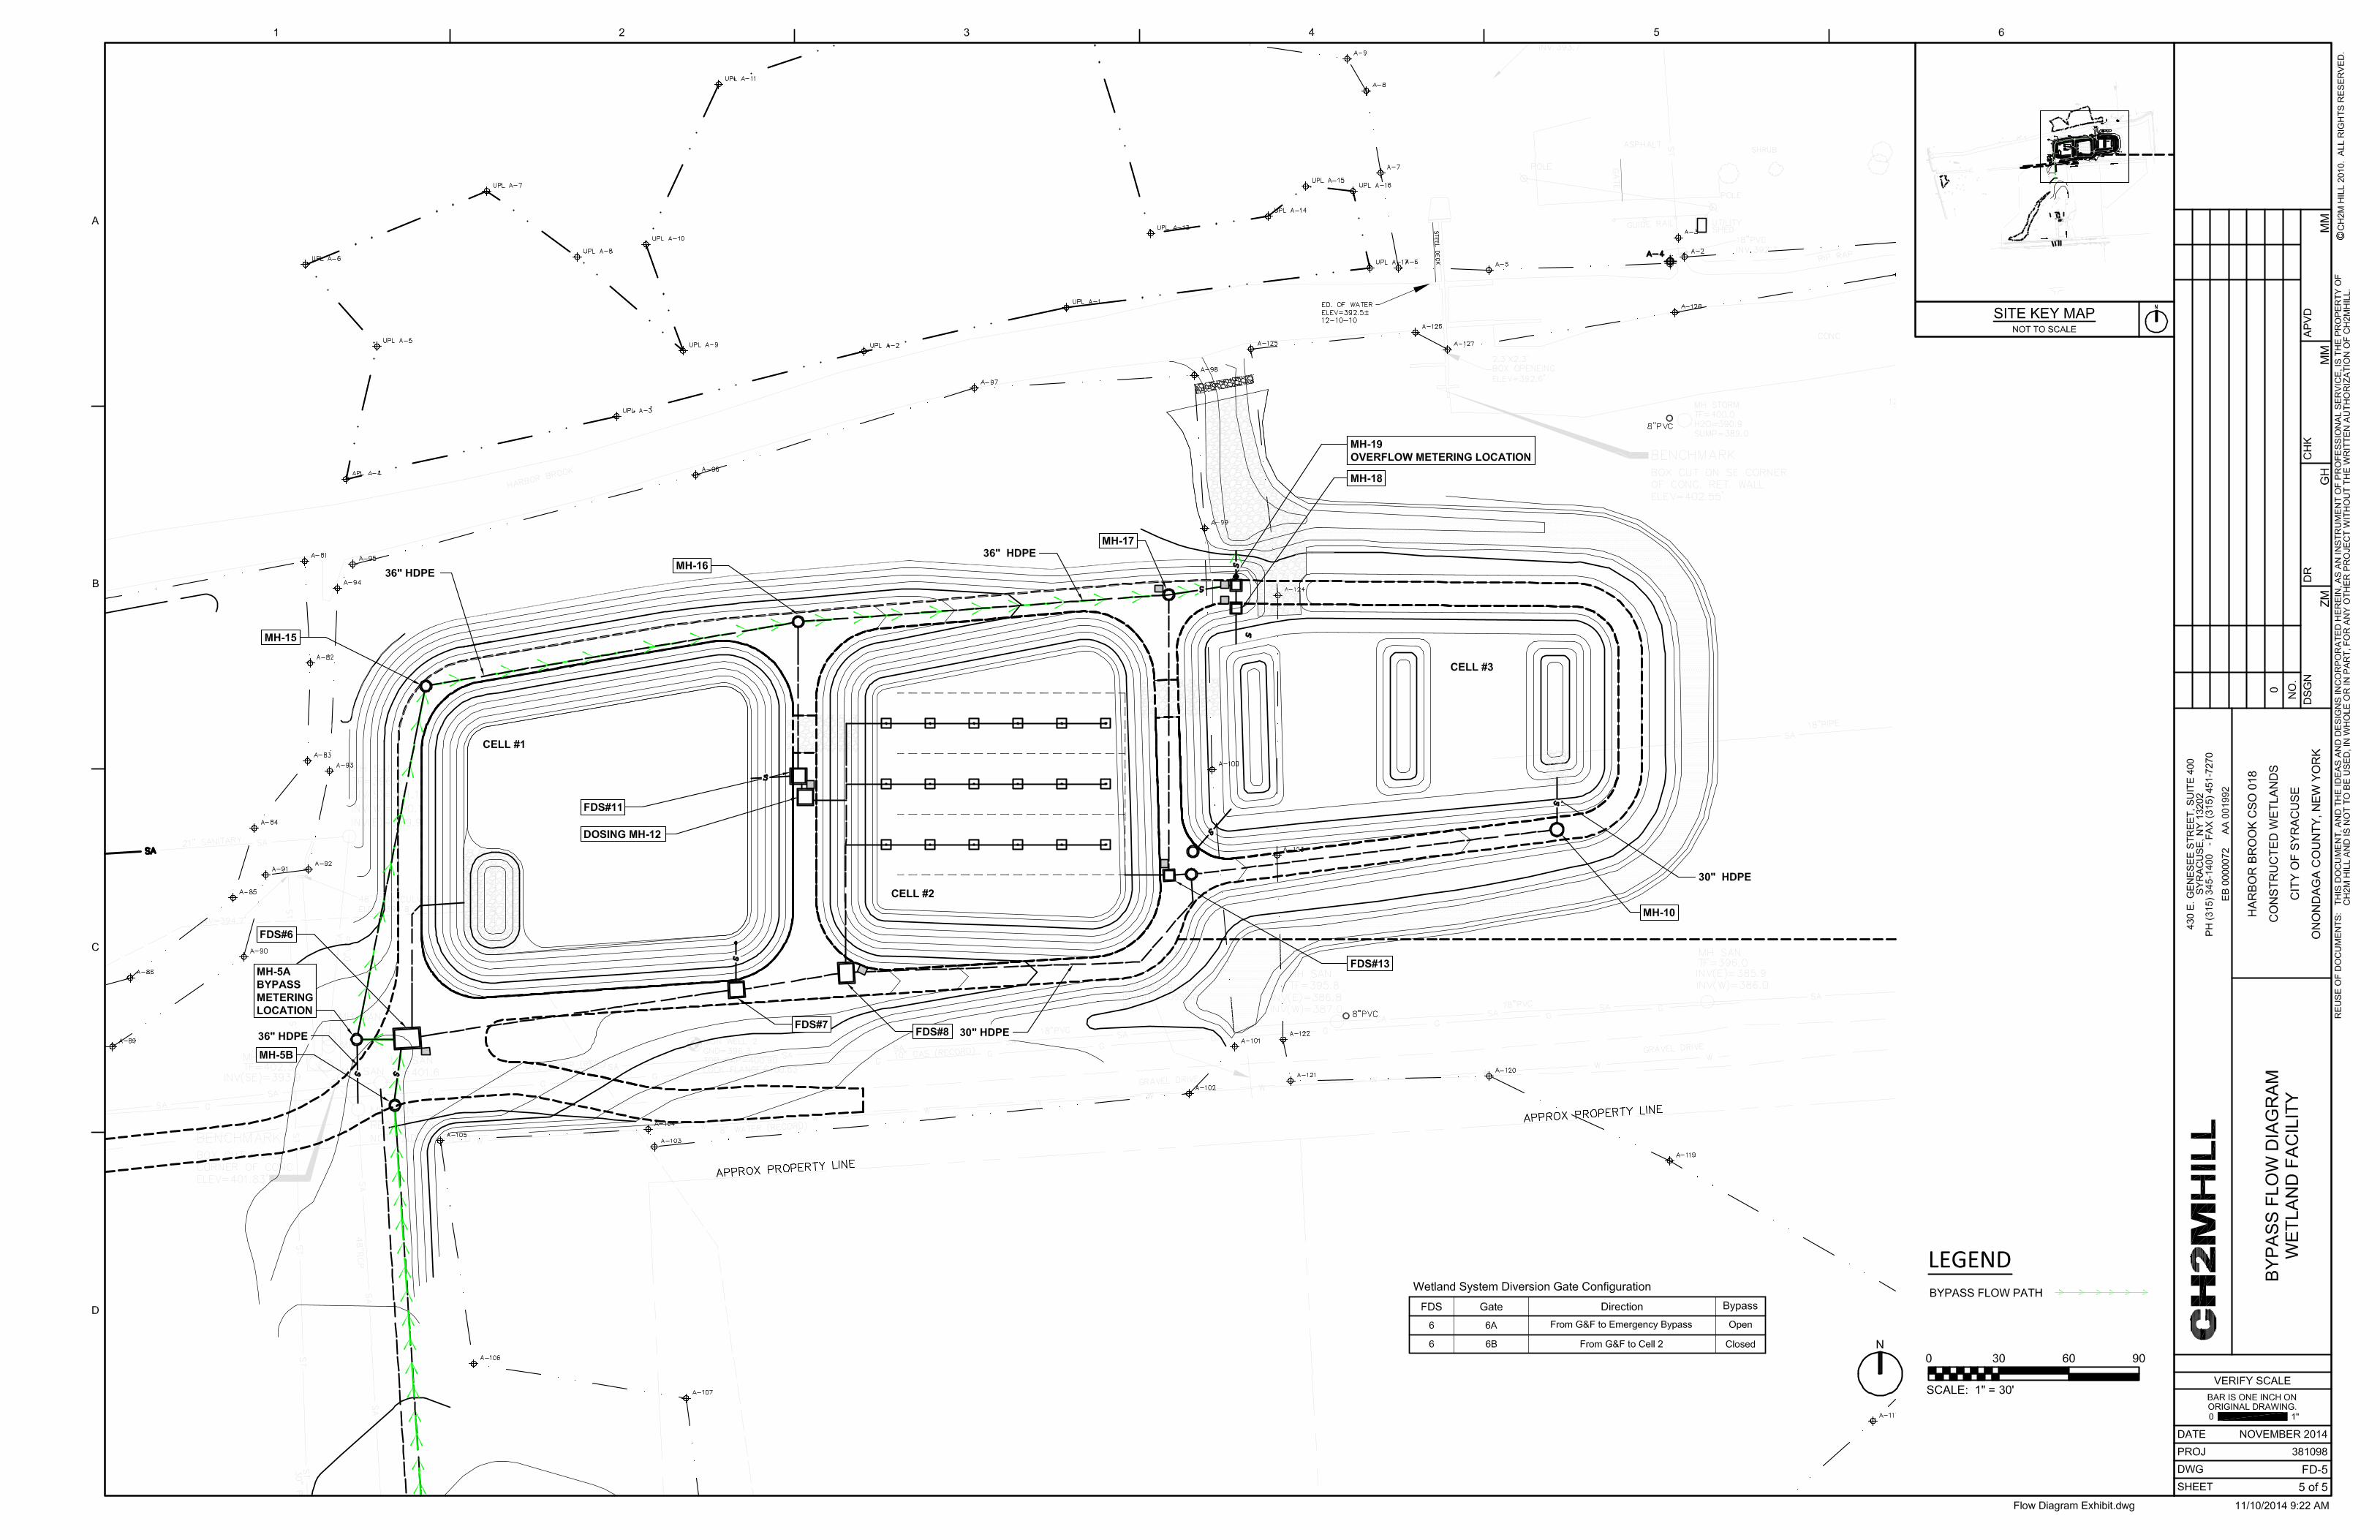
When in series operation, effluent samples will be collected from MH-18. When in series/parallel or parallel operation, under normal operating conditions, effluent samples will be collected from MH-19. In the event that an emergency bypass event occurs while in series/parallel, effluent samples will be collected from FDS-13 and MH-18 to ensure that the flow sampled does not include a mixture of bypass flow. Similarly, if an emergency bypass event occurs when in parallel operation, effluent samples will be collected from FDS-11, FDS-13, and MH-18 and reported as such. An emergency bypass event is defined as an event that is greater than the design capacity of the wetland facility (44 cfs) and can be identified via monitoring of the influent flows over OCDWEP’s SCADA system. If the influent flow is greater than 44 cfs, an emergency bypass event is underway and effluent samples will be collected from the appropriate location. The sampling locations for each operating scenario are identified on the flow diagrams included in Appendix B.
A facility bypass is defined as an event occurring when the entire facility (G&F and wetland cells) is offline. The most likely reason this could occur is during downtime to repair a malfunctioning piece of equipment essential to the operation of the facility. If a facility bypass occurs, untreated discharge volumes will be reported as such in the quarterly performance reports.
During each event, in situ measurements for the appropriate parameters are also measured. The exact date and time that the event starts and ends will be recorded, and after the event is over, sampling staff will coordinate with OCDWEP to obtain flowmeter data from their SCADA system and precipitation data.
Under all operating scenarios, the overflow volume, the volume that bypasses the wetland facility (either during an emergency bypass or facility bypass), will be obtained from the flowmeter in MH-5A. When in series operation, the wetlands discharge volume will be obtained from the flowmeter in MH-18. When in series/parallel or parallel operation and under standard and bypass event operating conditions, the wetlands discharge volume will be obtained by subtracting the overflow volume recorded at MH-5A (if present) from the volume recorded at MH-19.
4.2.2 CSO Event Sampling – System Optimization After sampling for the SPDES permit is completed, and if an event is of sufficient duration, grab samples will be collected at intermediate points within the system at Cells 1 and 2 (FDS-11 and FDS-13 on the flow diagrams in Appendix B). The samples will be analyzed for the parameters in Table 4-1 to analyze the performance of each of the cells.
SECTION 4: FIELD DATA COLLECTION
OC_CSO018_SAMPLINGPLANAMENDMENT_052016.DOCX 4-3
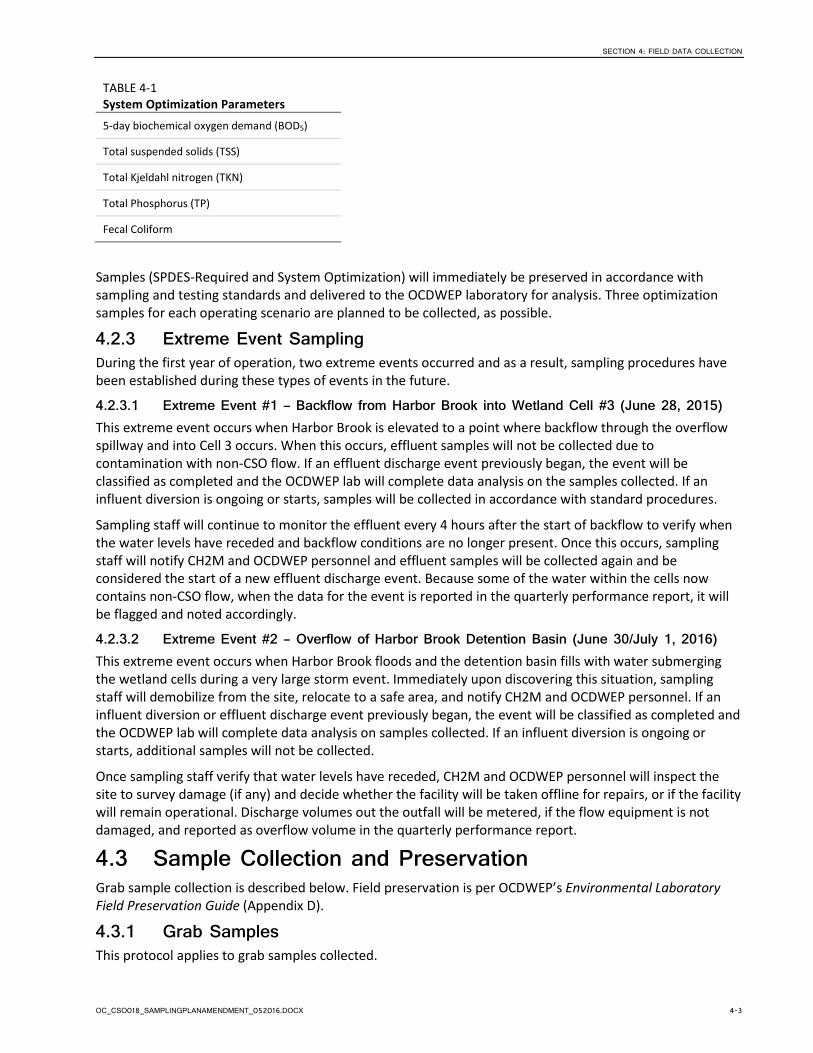
TABLE 4-1 System Optimization Parameters
5-day biochemical oxygen demand (BOD5)
Total suspended solids (TSS)
Total Kjeldahl nitrogen (TKN)
Total Phosphorus (TP)
Fecal Coliform
Samples (SPDES-Required and System Optimization) will immediately be preserved in accordance with sampling and testing standards and delivered to the OCDWEP laboratory for analysis. Three optimization samples for each operating scenario are planned to be collected, as possible.
4.2.3 Extreme Event Sampling During the first year of operation, two extreme events occurred and as a result, sampling procedures have been established during these types of events in the future.
4.2.3.1 Extreme Event #1 – Backflow from Harbor Brook into Wetland Cell #3 (June 28, 2015) This extreme event occurs when Harbor Brook is elevated to a point where backflow through the overflow spillway and into Cell 3 occurs. When this occurs, effluent samples will not be collected due to contamination with non-CSO flow. If an effluent discharge event previously began, the event will be classified as completed and the OCDWEP lab will complete data analysis on the samples collected. If an influent diversion is ongoing or starts, samples will be collected in accordance with standard procedures.
Sampling staff will continue to monitor the effluent every 4 hours after the start of backflow to verify when the water levels have receded and backflow conditions are no longer present. Once this occurs, sampling staff will notify CH2M and OCDWEP personnel and effluent samples will be collected again and be considered the start of a new effluent discharge event. Because some of the water within the cells now contains non-CSO flow, when the data for the event is reported in the quarterly performance report, it will be flagged and noted accordingly.
4.2.3.2 Extreme Event #2 – Overflow of Harbor Brook Detention Basin (June 30/July 1, 2016) This extreme event occurs when Harbor Brook floods and the detention basin fills with water submerging the wetland cells during a very large storm event. Immediately upon discovering this situation, sampling staff will demobilize from the site, relocate to a safe area, and notify CH2M and OCDWEP personnel. If an influent diversion or effluent discharge event previously began, the event will be classified as completed and the OCDWEP lab will complete data analysis on samples collected. If an influent diversion is ongoing or starts, additional samples will not be collected.
Once sampling staff verify that water levels have receded, CH2M and OCDWEP personnel will inspect the site to survey damage (if any) and decide whether the facility will be taken offline for repairs, or if the facility will remain operational. Discharge volumes out the outfall will be metered, if the flow equipment is not damaged, and reported as overflow volume in the quarterly performance report.
4.3 Sample Collection and Preservation Grab sample collection is described below. Field preservation is per OCDWEP’s Environmental Laboratory Field Preservation Guide (Appendix D).
4.3.1 Grab Samples This protocol applies to grab samples collected.
SECTION 4: FIELD DATA COLLECTION
4-4 OC_CSO018_SAMPLINGPLANAMENDMENT_052016.DOCX
4.3.1.1 Sampling Equipment 1. Stainless steel bucket 2. Coli Sampler 3. YSI 660/6600 or equivalent probe 4. Bucket (for sonde use) 5. LaMotte Test Kits for Cl2 and pH 6. Sulfuric Acid 7. Sodium Thiosulfate 8. Ice packs/cooler
4.3.1.2 Bottles 1. (1) 1-L white plastic pre-cleaned 2. (1) 1-L white plastic pre-cleaned 3. (2) 125-mL sterile plastic
4.3.1.3 Sampling Procedure 1. Use a stainless steel sampling bucket on a rope to collect water sample from the appropriate sampling
point and poured into sample containers.
2. Collect a Coliform sample as per the Coliform Sampling Procedure below.
3. Preserve samples as described below and check samples for the appropriate pH.
4. Place samples on ice.
5. Collect field data with the YSI; place sonde in a sample bucket.
6. Record sample information on the Chain of Custody (COC) and record field observations on the field sheets.
4.3.2 Automated Sampling Automated sampling equipment at the facility effluent will not be used. During the first year of operation it was determined that there is sufficient time between the start of an influent diversion and the start of an effluent discharge for sampling staff to plan and arrive on site to collect the effluent grab samples.
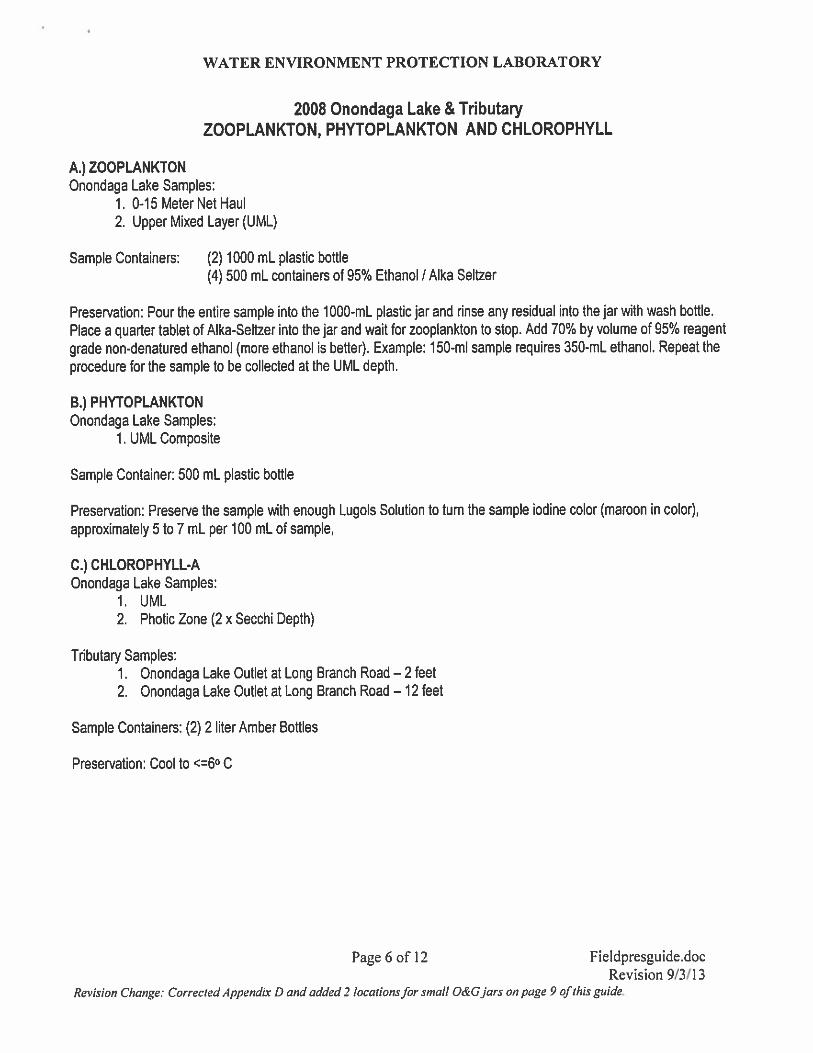
4.4 Parameter-Specific Sample Preservation 4.4.1 General Sample Preservation Guidelines In accordance with OCDWEP’s Environmental Laboratory Field Preservation Guide (Appendix D), the sample preservation and collection guidelines shown in Table 4-2 will be followed.
SECTION 4: FIELD DATA COLLECTION
OC_CSO018_SAMPLINGPLANAMENDMENT_052016.DOCX 4-5
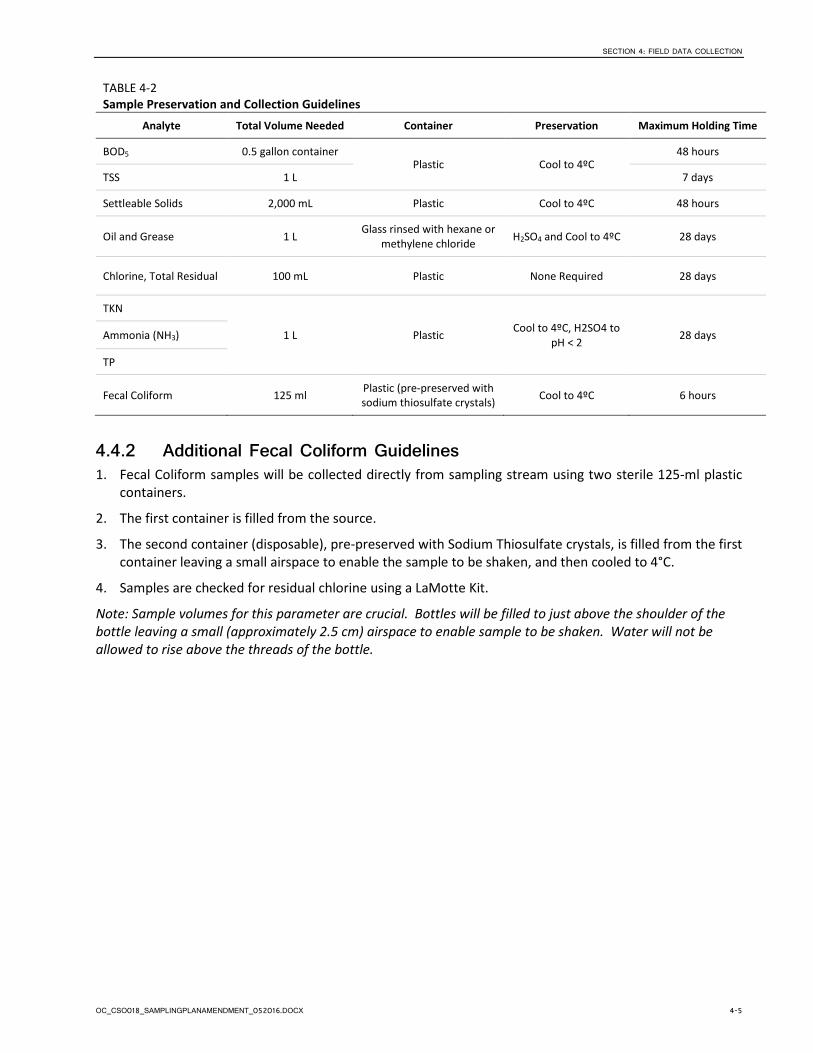
TABLE 4-2 Sample Preservation and Collection Guidelines
Analyte Total Volume Needed Container Preservation Maximum Holding Time
BOD5 0.5 gallon container Plastic Cool to 4ºC
48 hours
TSS 1 L 7 days
Settleable Solids 2,000 mL Plastic Cool to 4ºC 48 hours
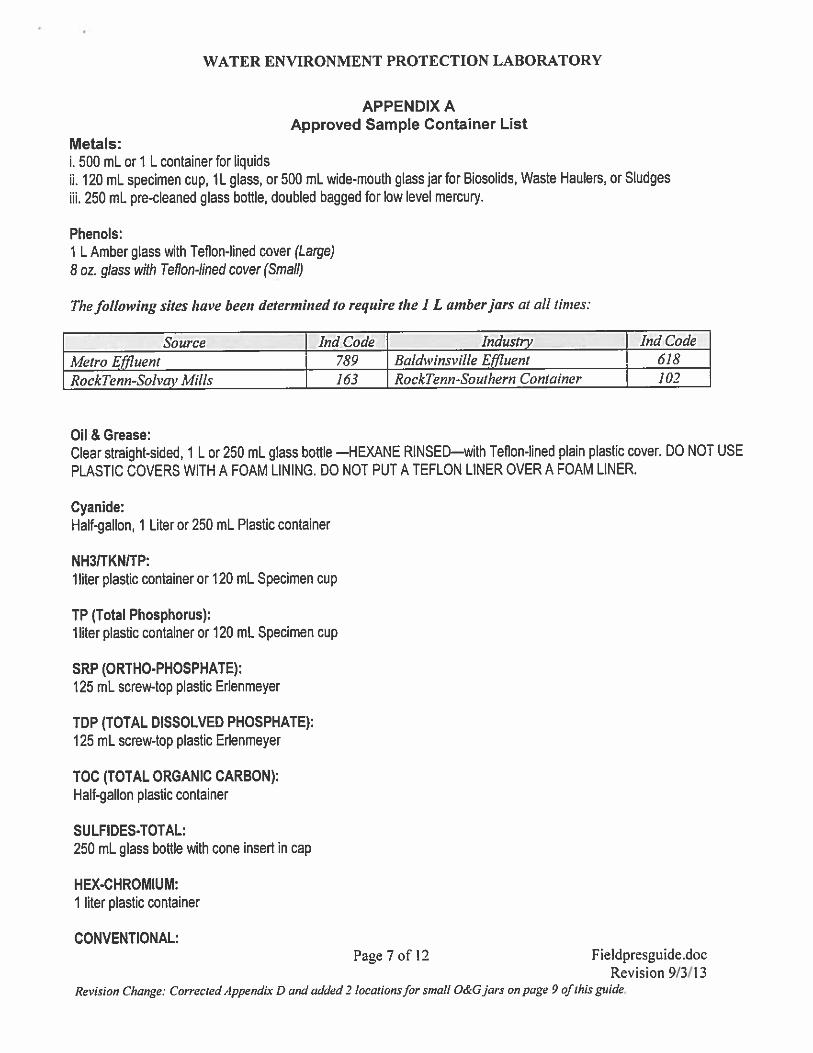
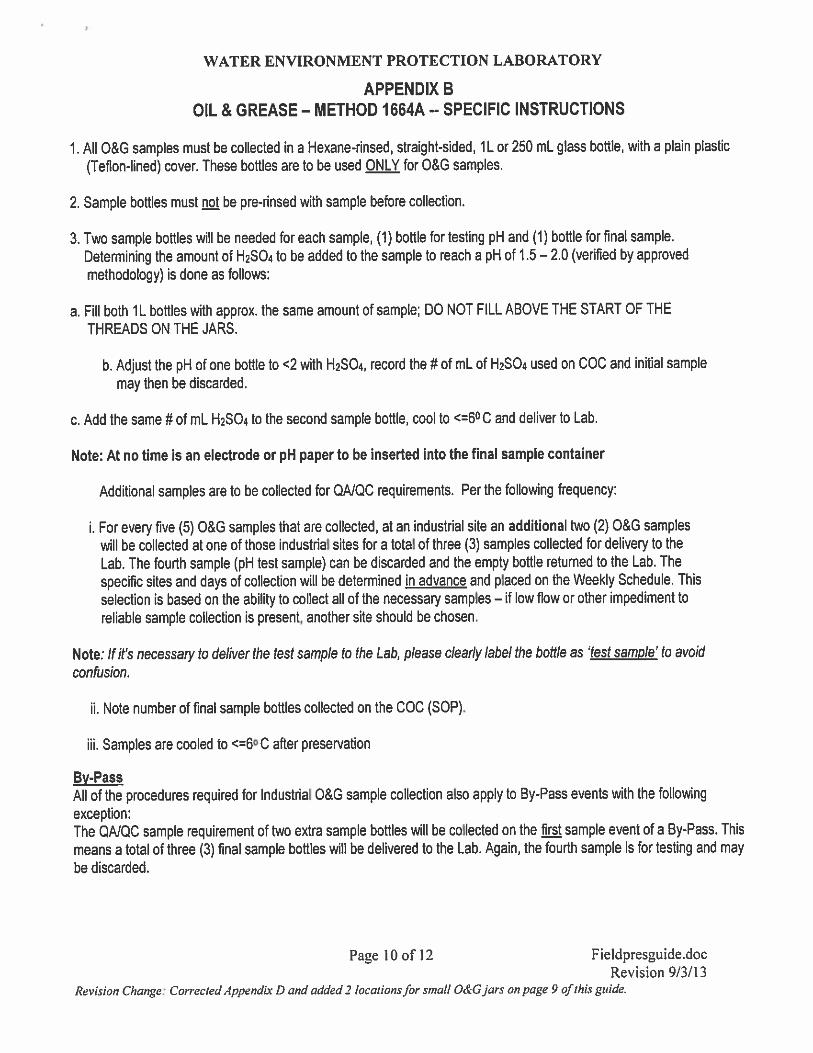
Oil and Grease 1 L Glass rinsed with hexane or methylene chloride H2SO4 and Cool to 4ºC 28 days
Chlorine, Total Residual 100 mL Plastic None Required 28 days
TKN
1 L Plastic Cool to 4ºC, H2SO4 to pH < 2 28 days Ammonia (NH3)
TP
Fecal Coliform 125 ml Plastic (pre-preserved with sodium thiosulfate crystals) Cool to 4ºC 6 hours
4.4.2 Additional Fecal Coliform Guidelines 1. Fecal Coliform samples will be collected directly from sampling stream using two sterile 125-ml plastic
containers.
2. The first container is filled from the source.
3. The second container (disposable), pre-preserved with Sodium Thiosulfate crystals, is filled from the first container leaving a small airspace to enable the sample to be shaken, and then cooled to 4°C.
4. Samples are checked for residual chlorine using a LaMotte Kit.
Note: Sample volumes for this parameter are crucial. Bottles will be filled to just above the shoulder of the bottle leaving a small (approximately 2.5 cm) airspace to enable sample to be shaken. Water will not be allowed to rise above the threads of the bottle.

OC_CSO018_SAMPLINGPLANAMENDMENT_052016.DOCX 5-1
SECTION 5
Field Data Collection QA/QC All field data collection quality assurance/quality control (QA/QC) protocols have been adapted for use in this monitoring program from the AMP.
5.1 Sample Containers All sample containers are new except for the pre-preserved sample containers.
5.2 Sample Labeling All sample bottles will be labeled with the time, date, analytes to be tested, pH if known, and any field preservation techniques employed.
5.3 Chain of Custody Chain of Custody (COC) forms will be filled out for every sample taken during a field visit (see example COC form in Appendix E). Forms include: sample type, container types, details on preservation techniques, and analysis to be performed, in addition to project personnel who had handled the bottle in the field. COC forms will be submitted to the OCDWEP laboratory when samples are delivered for analysis. OCDWEP staff will be responsible for filing the original and scanning a digital copy. Care will be taken to either print COC forms on waterproof “Rite in the Rain” paper or provide other adequate protections so that field notes can be taken during storm events.
5.4 Field Equipment Calibration 5.4.1 YSI Sonde Detailed protocol for calibration and maintenance for the YSI Sonde can be found in the 2009 AMP. A summary field calibration checklist is as follows:
1. Calibration is typically performed the morning before use (and no more than 24-hours before use).
2. If dissolved oxygen (DO) membrane is replaced, the unit must be allowed to stabilize overnight.
3. Temperature calibration is set by factory and does not require frequent calibration.
4. DO membranes should be checked and replaced as needed after each use.
5. The pH reference probe and temperature probes should be cleaned with 1:1 hydrochloric acid (HCl) and a cotton swab on an as-needed basis.
6. The pH probe calibration solution should be replaced daily.
7. For long-term storage, sondes are stored in a clean, dry space in a case.
8. For short-term storage, sondes are stored in a calibration cup of tap water.
9. Watertight connectors are lubricated when necessary in order to ensure a waterproof connection.
5.5 Health, Safety, & Training Considering the Harbor Brook Wetland Treatment System will be capturing combined sewage, health and safety for field staff is an important concern. All field personnel will be supplied with pertinent personal protective equipment (PPE), consistent with the requirements of OCDWEP sample collection field staff. A list of the required equipment with winter modifications is supplied in Appendix F. All samples will be taken, handled, and preserved with disposable nitrile gloves. Chemical splash goggles will be worn during sample preservation.

SECTION 5: FIELD DATA COLLECTION QA/QC
5-2 OC_CSO018_SAMPLINGPLANAMENDMENT_052016.DOCX
To maintain consistency with the OCDWEP, all field personnel associated with the Harbor Brook CSO 018 Wetland Treatment System will receive field training from OCDWEP staff apropos to “gray infrastructure” wastewater treatment facilities. Additionally, the New York State Environmental Laboratory Approval Program (NYS ELAP) Certification Manual requires that all field staff that collect “analyze immediate” parameters in the field such as pH, temperature, or chlorine residual, undergo training as specified under Item 249. To this end, OCDWEP hosts annual ELAP-certified “pH Training,” which all field staff will be required to attend. Lighting installations will be maintained onsite if night visits are necessary. A minimum of two staff members will accompany each other on field visits at all times.
OC_CSO018_SAMPLINGPLANAMENDMENT_052016.DOCX 6-1
SECTION 6
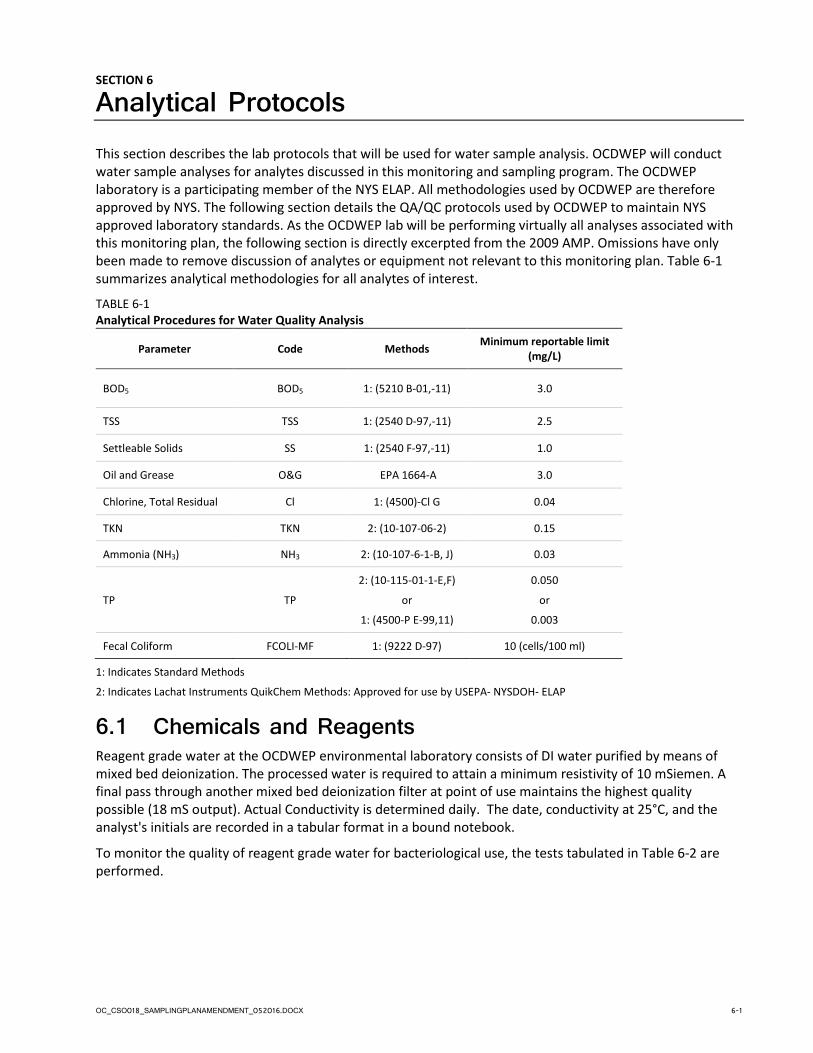
Analytical Protocols This section describes the lab protocols that will be used for water sample analysis. OCDWEP will conduct water sample analyses for analytes discussed in this monitoring and sampling program. The OCDWEP laboratory is a participating member of the NYS ELAP. All methodologies used by OCDWEP are therefore approved by NYS. The following section details the QA/QC protocols used by OCDWEP to maintain NYS approved laboratory standards. As the OCDWEP lab will be performing virtually all analyses associated with this monitoring plan, the following section is directly excerpted from the 2009 AMP. Omissions have only been made to remove discussion of analytes or equipment not relevant to this monitoring plan. Table 6-1 summarizes analytical methodologies for all analytes of interest.
TABLE 6-1 Analytical Procedures for Water Quality Analysis
Parameter Code Methods Minimum reportable limit (mg/L)
BOD5 BOD5 1: (5210 B-01,-11) 3.0
TSS TSS 1: (2540 D-97,-11) 2.5
Settleable Solids SS 1: (2540 F-97,-11) 1.0
Oil and Grease O&G EPA 1664-A 3.0
Chlorine, Total Residual Cl 1: (4500)-Cl G 0.04
TKN TKN 2: (10-107-06-2) 0.15
Ammonia (NH3) NH3 2: (10-107-6-1-B, J) 0.03
TP TP
2: (10-115-01-1-E,F)
or
1: (4500-P E-99,11)
0.050
or
0.003
Fecal Coliform FCOLI-MF 1: (9222 D-97) 10 (cells/100 ml)
1: Indicates Standard Methods
2: Indicates Lachat Instruments QuikChem Methods: Approved for use by USEPA- NYSDOH- ELAP
6.1 Chemicals and Reagents Reagent grade water at the OCDWEP environmental laboratory consists of DI water purified by means of mixed bed deionization. The processed water is required to attain a minimum resistivity of 10 mSiemen. A final pass through another mixed bed deionization filter at point of use maintains the highest quality possible (18 mS output). Actual Conductivity is determined daily. The date, conductivity at 25°C, and the analyst's initials are recorded in a tabular format in a bound notebook.
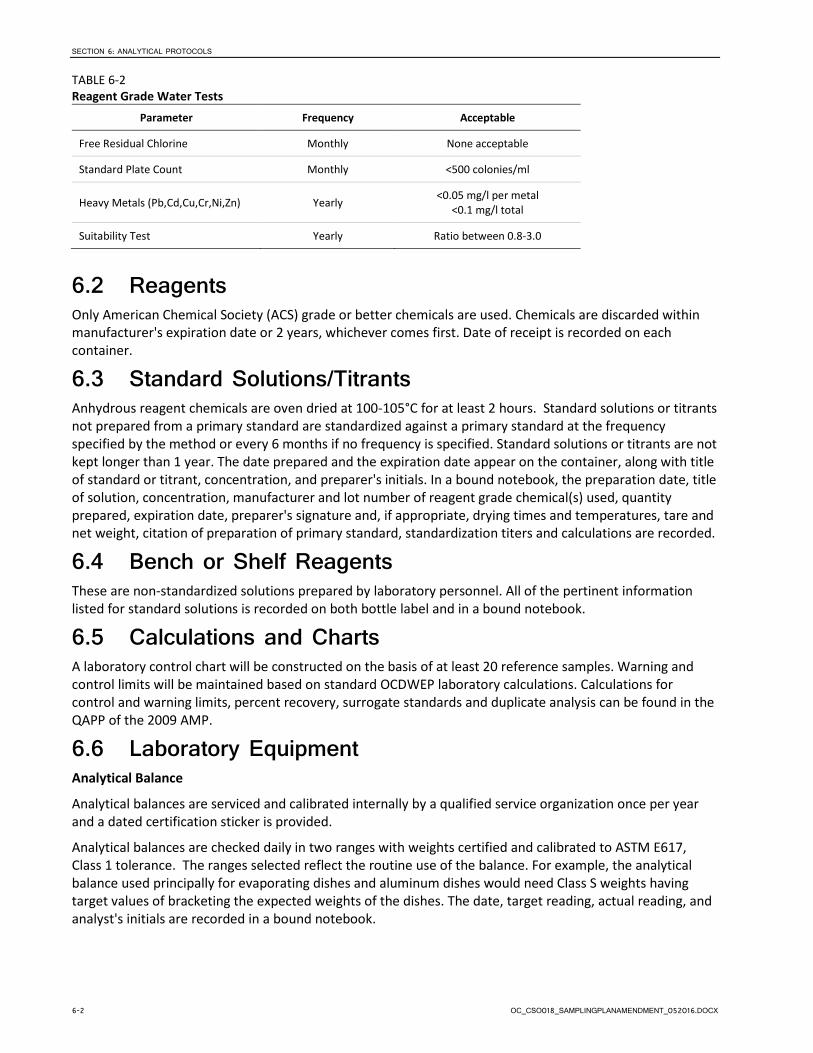
To monitor the quality of reagent grade water for bacteriological use, the tests tabulated in Table 6-2 are performed.
SECTION 6: ANALYTICAL PROTOCOLS
6-2 OC_CSO018_SAMPLINGPLANAMENDMENT_052016.DOCX
TABLE 6-2 Reagent Grade Water Tests
Parameter Frequency Acceptable
Free Residual Chlorine Monthly None acceptable
Standard Plate Count Monthly <500 colonies/ml
Heavy Metals (Pb,Cd,Cu,Cr,Ni,Zn) Yearly <0.05 mg/l per metal <0.1 mg/l total
Suitability Test Yearly Ratio between 0.8-3.0
6.2 Reagents Only American Chemical Society (ACS) grade or better chemicals are used. Chemicals are discarded within manufacturer's expiration date or 2 years, whichever comes first. Date of receipt is recorded on each container.
6.3 Standard Solutions/Titrants Anhydrous reagent chemicals are oven dried at 100-105°C for at least 2 hours. Standard solutions or titrants not prepared from a primary standard are standardized against a primary standard at the frequency specified by the method or every 6 months if no frequency is specified. Standard solutions or titrants are not kept longer than 1 year. The date prepared and the expiration date appear on the container, along with title of standard or titrant, concentration, and preparer's initials. In a bound notebook, the preparation date, title of solution, concentration, manufacturer and lot number of reagent grade chemical(s) used, quantity prepared, expiration date, preparer's signature and, if appropriate, drying times and temperatures, tare and net weight, citation of preparation of primary standard, standardization titers and calculations are recorded.
6.4 Bench or Shelf Reagents These are non-standardized solutions prepared by laboratory personnel. All of the pertinent information listed for standard solutions is recorded on both bottle label and in a bound notebook.
6.5 Calculations and Charts A laboratory control chart will be constructed on the basis of at least 20 reference samples. Warning and control limits will be maintained based on standard OCDWEP laboratory calculations. Calculations for control and warning limits, percent recovery, surrogate standards and duplicate analysis can be found in the QAPP of the 2009 AMP.
6.6 Laboratory Equipment Analytical Balance
Analytical balances are serviced and calibrated internally by a qualified service organization once per year and a dated certification sticker is provided.
Analytical balances are checked daily in two ranges with weights certified and calibrated to ASTM E617, Class 1 tolerance. The ranges selected reflect the routine use of the balance. For example, the analytical balance used principally for evaporating dishes and aluminum dishes would need Class S weights having target values of bracketing the expected weights of the dishes. The date, target reading, actual reading, and analyst's initials are recorded in a bound notebook.
SECTION 6: ANALYTICAL PROTOCOLS
OC_CSO018_SAMPLINGPLANAMENDMENT_052016.DOCX 6-3
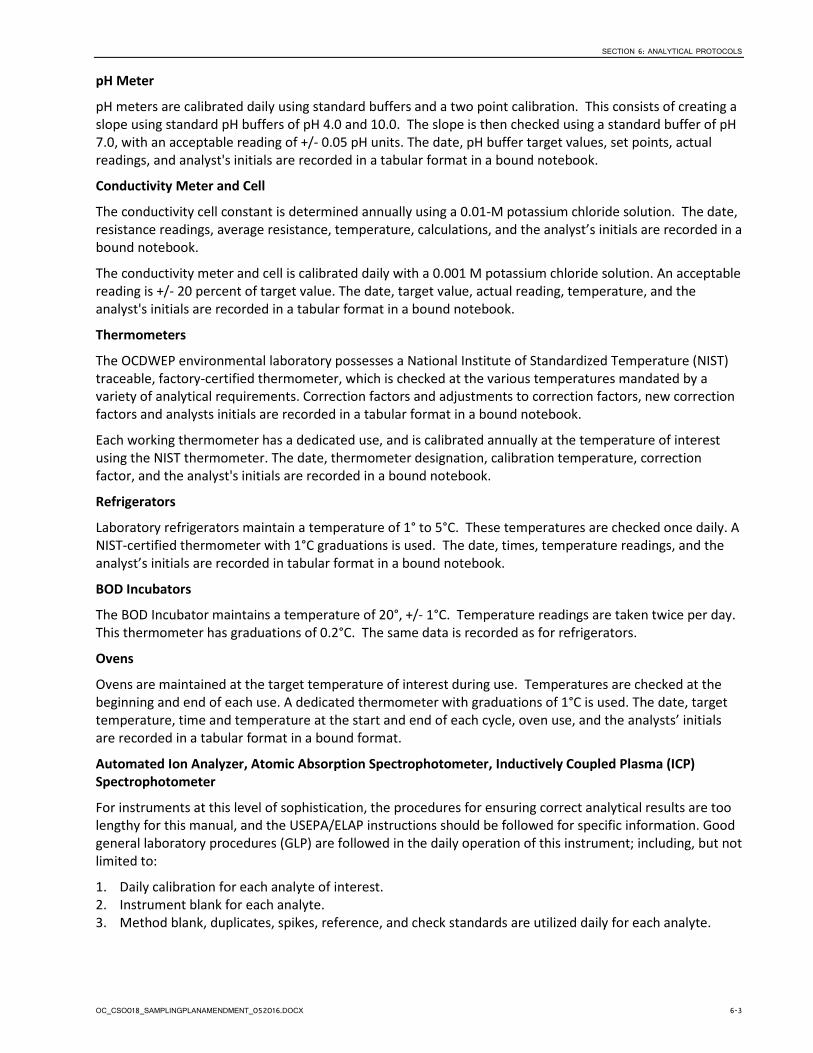
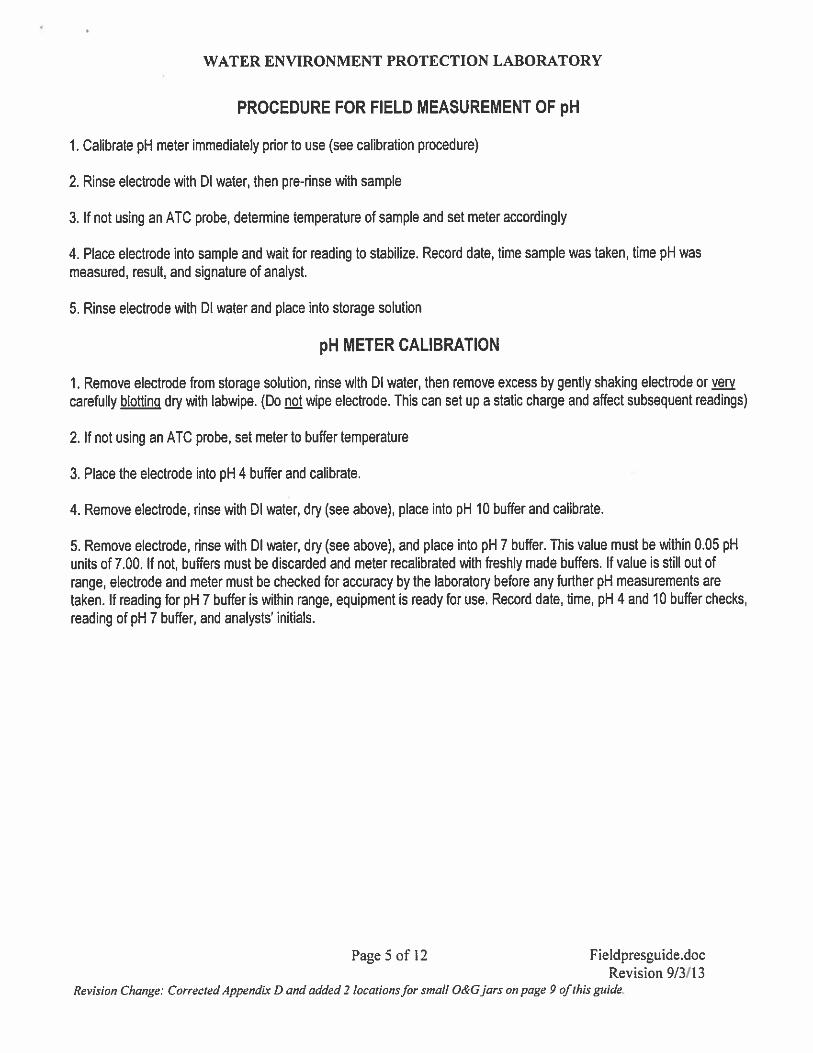
pH Meter
pH meters are calibrated daily using standard buffers and a two point calibration. This consists of creating a slope using standard pH buffers of pH 4.0 and 10.0. The slope is then checked using a standard buffer of pH 7.0, with an acceptable reading of +/- 0.05 pH units. The date, pH buffer target values, set points, actual readings, and analyst's initials are recorded in a tabular format in a bound notebook.
Conductivity Meter and Cell
The conductivity cell constant is determined annually using a 0.01-M potassium chloride solution. The date, resistance readings, average resistance, temperature, calculations, and the analyst’s initials are recorded in a bound notebook.
The conductivity meter and cell is calibrated daily with a 0.001 M potassium chloride solution. An acceptable reading is +/- 20 percent of target value. The date, target value, actual reading, temperature, and the analyst's initials are recorded in a tabular format in a bound notebook.
Thermometers
The OCDWEP environmental laboratory possesses a National Institute of Standardized Temperature (NIST) traceable, factory-certified thermometer, which is checked at the various temperatures mandated by a variety of analytical requirements. Correction factors and adjustments to correction factors, new correction factors and analysts initials are recorded in a tabular format in a bound notebook.
Each working thermometer has a dedicated use, and is calibrated annually at the temperature of interest using the NIST thermometer. The date, thermometer designation, calibration temperature, correction factor, and the analyst's initials are recorded in a bound notebook.
Refrigerators
Laboratory refrigerators maintain a temperature of 1° to 5°C. These temperatures are checked once daily. A NIST-certified thermometer with 1°C graduations is used. The date, times, temperature readings, and the analyst’s initials are recorded in tabular format in a bound notebook.
BOD Incubators
The BOD Incubator maintains a temperature of 20°, +/- 1°C. Temperature readings are taken twice per day. This thermometer has graduations of 0.2°C. The same data is recorded as for refrigerators.
Ovens
Ovens are maintained at the target temperature of interest during use. Temperatures are checked at the beginning and end of each use. A dedicated thermometer with graduations of 1°C is used. The date, target temperature, time and temperature at the start and end of each cycle, oven use, and the analysts’ initials are recorded in a tabular format in a bound format.
Automated Ion Analyzer, Atomic Absorption Spectrophotometer, Inductively Coupled Plasma (ICP) Spectrophotometer
For instruments at this level of sophistication, the procedures for ensuring correct analytical results are too lengthy for this manual, and the USEPA/ELAP instructions should be followed for specific information. Good general laboratory procedures (GLP) are followed in the daily operation of this instrument; including, but not limited to:
1. Daily calibration for each analyte of interest. 2. Instrument blank for each analyte. 3. Method blank, duplicates, spikes, reference, and check standards are utilized daily for each analyte.
SECTION 6: ANALYTICAL PROTOCOLS
6-4 OC_CSO018_SAMPLINGPLANAMENDMENT_052016.DOCX
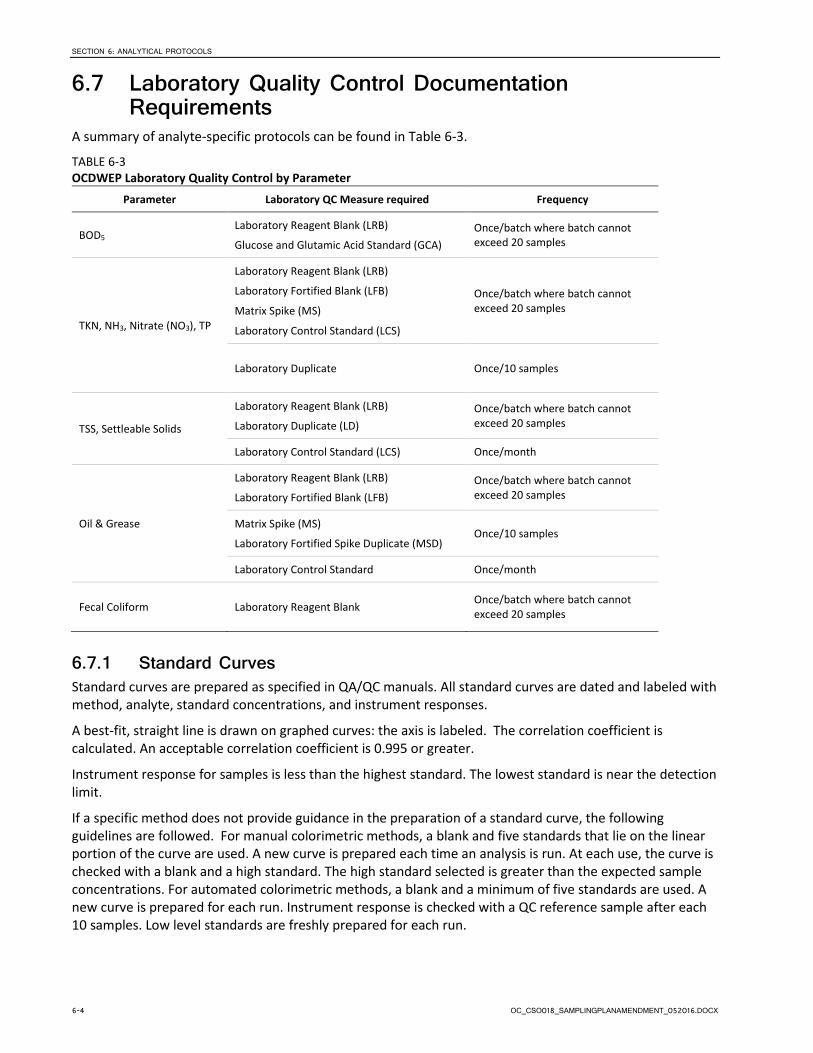
6.7 Laboratory Quality Control Documentation Requirements
A summary of analyte-specific protocols can be found in Table 6-3.
TABLE 6-3 OCDWEP Laboratory Quality Control by Parameter
Parameter Laboratory QC Measure required Frequency
BOD5 Laboratory Reagent Blank (LRB)
Glucose and Glutamic Acid Standard (GCA) Once/batch where batch cannot exceed 20 samples
TKN, NH3, Nitrate (NO3), TP
Laboratory Reagent Blank (LRB)
Laboratory Fortified Blank (LFB)
Matrix Spike (MS)
Laboratory Control Standard (LCS)
Once/batch where batch cannot exceed 20 samples
Laboratory Duplicate Once/10 samples
TSS, Settleable Solids
Laboratory Reagent Blank (LRB)
Laboratory Duplicate (LD) Once/batch where batch cannot exceed 20 samples
Laboratory Control Standard (LCS) Once/month
Oil & Grease
Laboratory Reagent Blank (LRB)
Laboratory Fortified Blank (LFB) Once/batch where batch cannot exceed 20 samples
Matrix Spike (MS)
Laboratory Fortified Spike Duplicate (MSD) Once/10 samples
Laboratory Control Standard Once/month
Fecal Coliform Laboratory Reagent Blank Once/batch where batch cannot exceed 20 samples
6.7.1 Standard Curves Standard curves are prepared as specified in QA/QC manuals. All standard curves are dated and labeled with method, analyte, standard concentrations, and instrument responses.
A best-fit, straight line is drawn on graphed curves: the axis is labeled. The correlation coefficient is calculated. An acceptable correlation coefficient is 0.995 or greater.
Instrument response for samples is less than the highest standard. The lowest standard is near the detection limit.
If a specific method does not provide guidance in the preparation of a standard curve, the following guidelines are followed. For manual colorimetric methods, a blank and five standards that lie on the linear portion of the curve are used. A new curve is prepared each time an analysis is run. At each use, the curve is checked with a blank and a high standard. The high standard selected is greater than the expected sample concentrations. For automated colorimetric methods, a blank and a minimum of five standards are used. A new curve is prepared for each run. Instrument response is checked with a QC reference sample after each 10 samples. Low level standards are freshly prepared for each run.
SECTION 6: ANALYTICAL PROTOCOLS
OC_CSO018_SAMPLINGPLANAMENDMENT_052016.DOCX 6-5
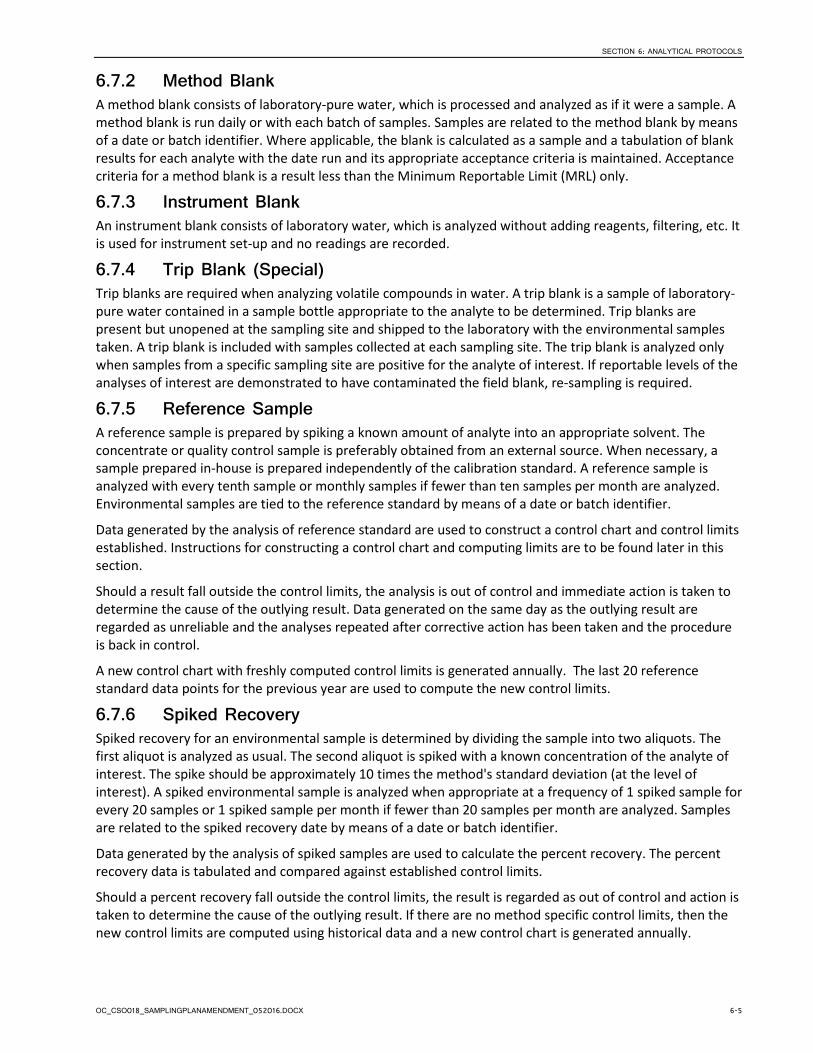
6.7.2 Method Blank A method blank consists of laboratory-pure water, which is processed and analyzed as if it were a sample. A method blank is run daily or with each batch of samples. Samples are related to the method blank by means of a date or batch identifier. Where applicable, the blank is calculated as a sample and a tabulation of blank results for each analyte with the date run and its appropriate acceptance criteria is maintained. Acceptance criteria for a method blank is a result less than the Minimum Reportable Limit (MRL) only.
6.7.3 Instrument Blank An instrument blank consists of laboratory water, which is analyzed without adding reagents, filtering, etc. It is used for instrument set-up and no readings are recorded.
6.7.4 Trip Blank (Special) Trip blanks are required when analyzing volatile compounds in water. A trip blank is a sample of laboratory-pure water contained in a sample bottle appropriate to the analyte to be determined. Trip blanks are present but unopened at the sampling site and shipped to the laboratory with the environmental samples taken. A trip blank is included with samples collected at each sampling site. The trip blank is analyzed only when samples from a specific sampling site are positive for the analyte of interest. If reportable levels of the analyses of interest are demonstrated to have contaminated the field blank, re-sampling is required.
6.7.5 Reference Sample A reference sample is prepared by spiking a known amount of analyte into an appropriate solvent. The concentrate or quality control sample is preferably obtained from an external source. When necessary, a sample prepared in-house is prepared independently of the calibration standard. A reference sample is analyzed with every tenth sample or monthly samples if fewer than ten samples per month are analyzed. Environmental samples are tied to the reference standard by means of a date or batch identifier.
Data generated by the analysis of reference standard are used to construct a control chart and control limits established. Instructions for constructing a control chart and computing limits are to be found later in this section.
Should a result fall outside the control limits, the analysis is out of control and immediate action is taken to determine the cause of the outlying result. Data generated on the same day as the outlying result are regarded as unreliable and the analyses repeated after corrective action has been taken and the procedure is back in control.
A new control chart with freshly computed control limits is generated annually. The last 20 reference standard data points for the previous year are used to compute the new control limits.
6.7.6 Spiked Recovery Spiked recovery for an environmental sample is determined by dividing the sample into two aliquots. The first aliquot is analyzed as usual. The second aliquot is spiked with a known concentration of the analyte of interest. The spike should be approximately 10 times the method's standard deviation (at the level of interest). A spiked environmental sample is analyzed when appropriate at a frequency of 1 spiked sample for every 20 samples or 1 spiked sample per month if fewer than 20 samples per month are analyzed. Samples are related to the spiked recovery date by means of a date or batch identifier.
Data generated by the analysis of spiked samples are used to calculate the percent recovery. The percent recovery data is tabulated and compared against established control limits.
Should a percent recovery fall outside the control limits, the result is regarded as out of control and action is taken to determine the cause of the outlying result. If there are no method specific control limits, then the new control limits are computed using historical data and a new control chart is generated annually.
SECTION 6: ANALYTICAL PROTOCOLS
6-6 OC_CSO018_SAMPLINGPLANAMENDMENT_052016.DOCX
6.7.7 Duplicate Analysis A duplicate analysis is required only when a sample yields a positive result. A minimum of 10 percent of all positive samples for a given analyte is analyzed in duplicate. The range between the duplicates is tabulated and acceptance limits established. Instructions for the tabulation and the computation of limits are to be found later in this section.
A new tabulation with a freshly computed acceptance limit is generated annually. The last 20 data points for the previous year are used to compute the acceptable control limits.
6.7.8 External QA/QC Although the OCDWEP laboratory is a New York State Department of Health Environmental Laboratory Accreditation Program (NYSDOH-ELAP)-certified laboratory, it is also National Environmental Laboratory Accreditation Conference (NELAC)-certified, and is obligated to follow all of the criteria for maintaining this certification under the auspices of the ELAP program. Part of this program consists of a biannual inspection by a NYS Laboratory Inspector, who spends one or more days at each facility checking all aspects of the operation. In addition, performance evaluations are conducted twice per year. This consists of unknown samples sent to the OCDWEP laboratory to be analyzed and the results reported back to ELAP. The laboratory is required to submit results for each parameter that they are certified for, including bacteriology, metals, nutrients, etc.
The USEPA also uses the results from this program to satisfy the requirements of the SPDES permit program that regulates the various wastewater treatment plants in the OCDWEP system.
6.7.9 Internal QA/QC In addition to the above, the OCDWEP laboratory conducts an internal QA/QC program consisting of unknowns that are generated periodically by the OCDWEP staff and given to technicians as “typical” samples, occurring without the analysts' knowledge. The object of this is to ensure that “typical” samples are analyzed using the same care as the “official” samples.
OC_CSO018_SAMPLINGPLANAMENDMENT_052016.DOCX 7-1
SECTION 7
Data Validation and Reporting
7.1 Data Review and Validation Data will be reviewed for technical defensibility and usability. The former assesses the accuracy and precision of lab measurement. The latter assesses weather the dataset is robust enough to meet monitoring program objectives.
Technical defensibility review includes:
1. Internal laboratory quality control: blanks, spikes, replicates, and standard curves. 2. Review of COC forms. 3. Determination as to whether samples were processes within their maximum allowable holding
timeframe.
Usability review includes:
1. Charge balance of major cations and anions (if available from conventional samples) 2. Results of field duplicates 3. Statistical evaluation of dataset (outliers etc.)
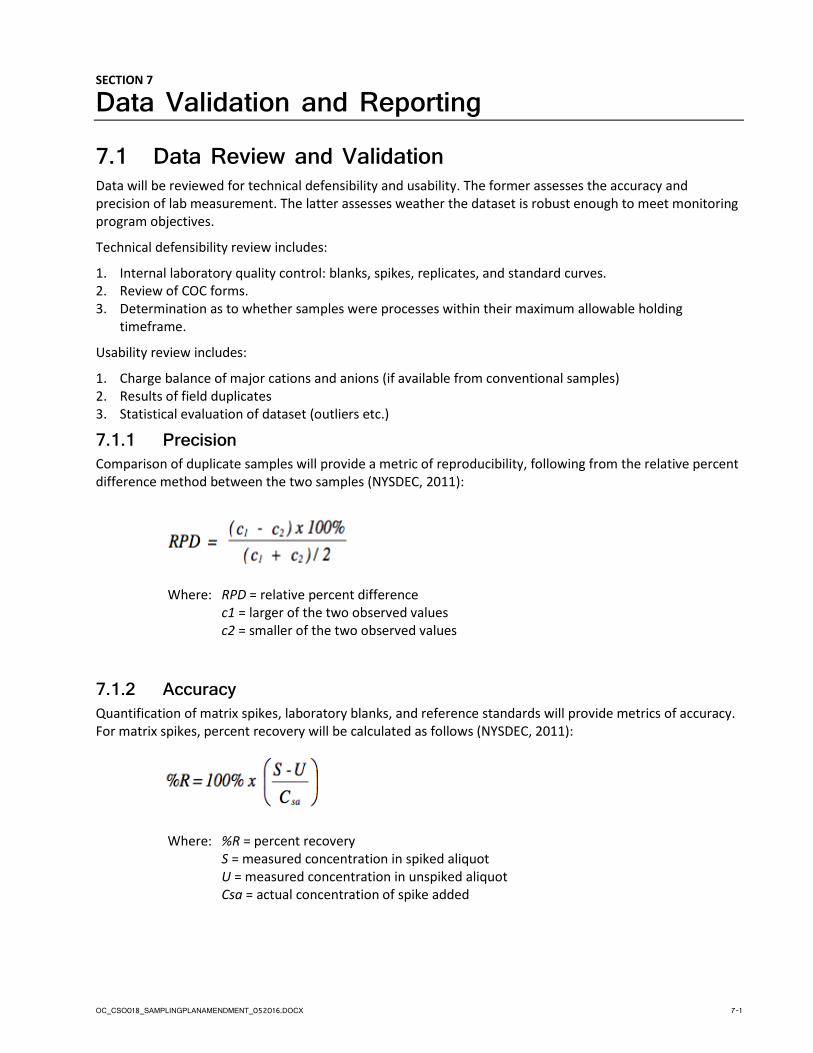
7.1.1 Precision Comparison of duplicate samples will provide a metric of reproducibility, following from the relative percent difference method between the two samples (NYSDEC, 2011):
Where: RPD = relative percent difference c1 = larger of the two observed values c2 = smaller of the two observed values
7.1.2 Accuracy Quantification of matrix spikes, laboratory blanks, and reference standards will provide metrics of accuracy. For matrix spikes, percent recovery will be calculated as follows (NYSDEC, 2011):
Where: %R = percent recovery S = measured concentration in spiked aliquot U = measured concentration in unspiked aliquot Csa = actual concentration of spike added

SECTION 7: DATA VALIDATION AND REPORTING
7-2 OC_CSO018_SAMPLINGPLANAMENDMENT_052016.DOCX
When a standard reference material is used:
Where: %R = percent recovery Cm = measured concentration of SRM Csrm = actual concentration of SRM
7.2 Reporting and Documentation 7.2.1 Field and Laboratory Data Laboratory data is stored both on the Laboratory Information Management System (LIMS) and on paper copy to be filed at OCDWEP. The OCDWEP lab will transmit this data to the sampling and reporting staff after the analyses for each CSO event are completed.
Monitoring results required by the SPDES permit will be provided in reports as required by the permit. Any additional sampling results will be provided in similar report documents for internal review and analysis.
APPENDIX A CSO Event Notification/Sampling Flowchart

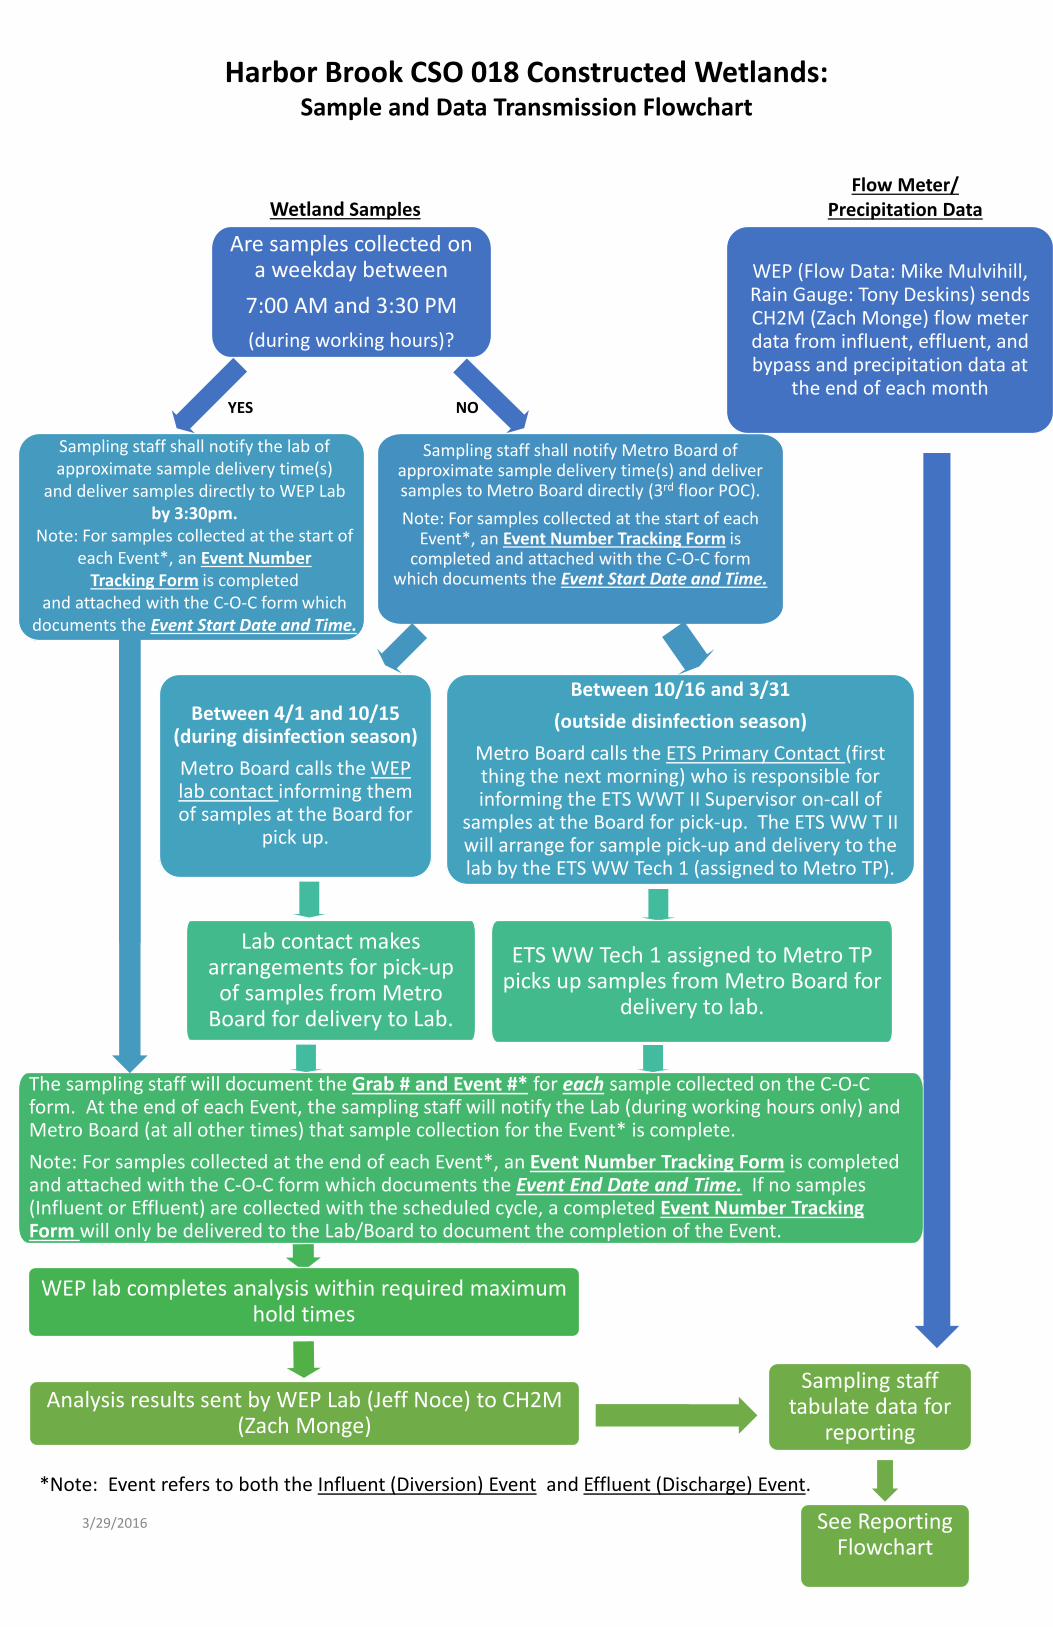
Are samples collected on a weekday between
7:00 AM and 3:30 PM (during working hours)?
Sampling staff shall notify Metro Board of approximate sample delivery time(s) and deliver samples to Metro Board directly (3rd floor POC). Note: For samples collected at the start of each
Event*, an Event Number Tracking Form is completed and attached with the C-O-C form
which documents the Event Start Date and Time.
Between 4/1 and 10/15 (during disinfection season) Metro Board calls the WEP lab contact informing them of samples at the Board for
pick up.
Between 10/16 and 3/31 (outside disinfection season)
Metro Board calls the ETS Primary Contact (first thing the next morning) who is responsible for informing the ETS WWT II Supervisor on-call of
samples at the Board for pick-up. The ETS WW T II will arrange for sample pick-up and delivery to the lab by the ETS WW Tech 1 (assigned to Metro TP).
Lab contact makes arrangements for pick-up
of samples from Metro Board for delivery to Lab.
The sampling staff will document the Grab # and Event #* for each sample collected on the C-O-C form. At the end of each Event, the sampling staff will notify the Lab (during working hours only) and Metro Board (at all other times) that sample collection for the Event* is complete. Note: For samples collected at the end of each Event*, an Event Number Tracking Form is completed and attached with the C-O-C form which documents the Event End Date and Time. If no samples (Influent or Effluent) are collected with the scheduled cycle, a completed Event Number Tracking Form will only be delivered to the Lab/Board to document the completion of the Event.
WEP lab completes analysis within required maximum hold times
Analysis results sent by WEP Lab (Jeff Noce) to CH2M (Zach Monge)
Harbor Brook CSO 018 Constructed Wetlands: Sample and Data Transmission Flowchart
WEP (Flow Data: Mike Mulvihill, Rain Gauge: Tony Deskins) sends CH2M (Zach Monge) flow meter data from influent, effluent, and bypass and precipitation data at
the end of each month
Wetland SamplesFlow Meter/
Precipitation Data
See Reporting Flowchart
Sampling staff shall notify the lab of approximate sample delivery time(s)
and deliver samples directly to WEP Lab by 3:30pm.
Note: For samples collected at the start of each Event*, an Event Number
Tracking Form is completed and attached with the C-O-C form which
documents the Event Start Date and Time.
NOYES
Sampling staff tabulate data for
reporting
3/29/2016
ETS WW Tech 1 assigned to Metro TP picks up samples from Metro Board for
delivery to lab.
*Note: Event refers to both the Influent (Diversion) Event and Effluent (Discharge) Event.

APPENDIX B CSO 018 Constructed Wetlands Pilot Treatment
System Flow and Facility Diagrams


APPENDIX C Floatables Description Form

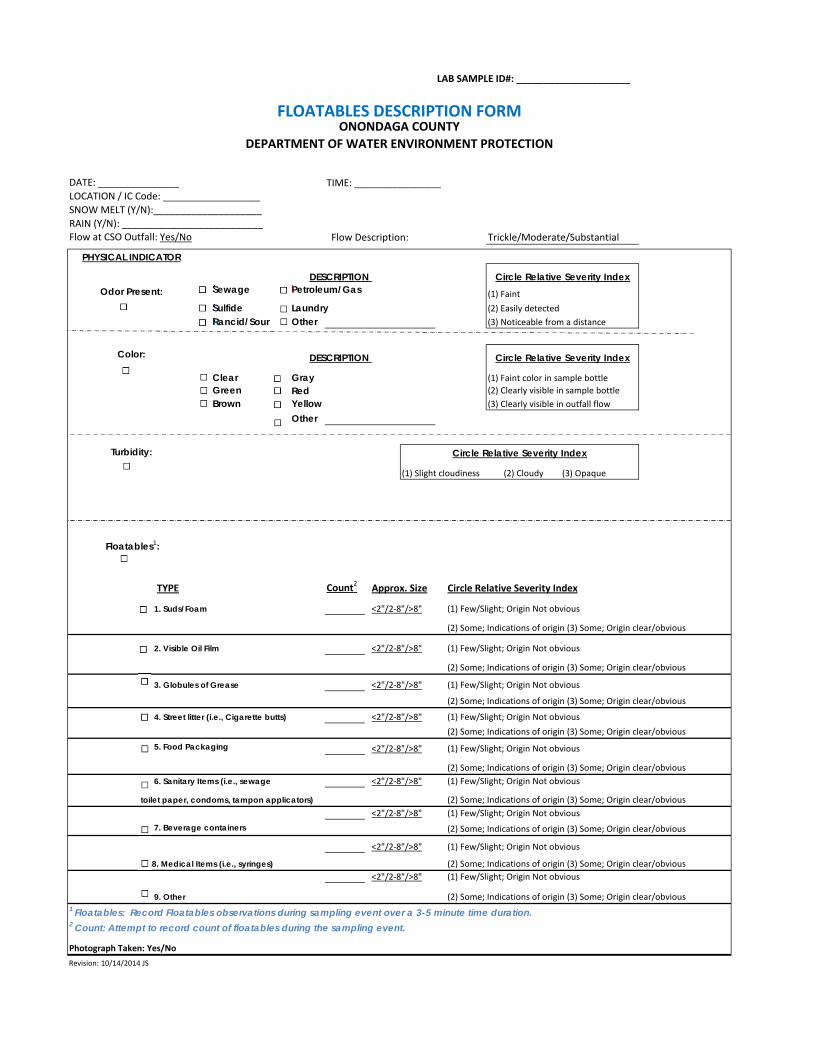
LAB SAMPLE ID#: _____________________
DATE: _______________ TIME: ________________LOCATION / IC Code: __________________
SNOW MELT (Y/N):____________________
RAIN (Y/N): __________________________Flow at CSO Outfall: Yes/No Flow Description: Trickle/Moderate/Substantial
Petroleum/Gas (1) Faint
Laundry (2) Easily detected
Other (3) Noticeable from a distance
Clear Gray (1) Faint color in sample bottle
Green Red Brown Yellow (3) Clearly visible in outfall flow
Other
(1) Slight cloudiness (3) Opaque
TYPE Count2 Approx. Size Circle Relative Severity Index
1. Suds/Foam <2"/2‐8"/>8" (1) Few/Slight; Origin Not obvious
(2) Some; Indications of origin (3) Some; Origin clear/obvious
2. Visible Oil Film <2"/2‐8"/>8" (1) Few/Slight; Origin Not obvious
(2) Some; Indications of origin (3) Some; Origin clear/obvious
3. Globules of Grease <2"/2‐8"/>8" (1) Few/Slight; Origin Not obvious
(2) Some; Indications of origin (3) Some; Origin clear/obvious
4. Street litter (i.e., Cigarette butts) <2"/2‐8"/>8" (1) Few/Slight; Origin Not obvious
(2) Some; Indications of origin (3) Some; Origin clear/obvious
5. Food Packaging <2"/2‐8"/>8" (1) Few/Slight; Origin Not obvious
(2) Some; Indications of origin (3) Some; Origin clear/obvious
6. Sanitary Items (i.e., sewage <2"/2‐8"/>8" (1) Few/Slight; Origin Not obvious
toilet paper, condoms, tampon applicators) (2) Some; Indications of origin (3) Some; Origin clear/obvious
<2"/2‐8"/>8" (1) Few/Slight; Origin Not obvious
7. Beverage containers (2) Some; Indications of origin (3) Some; Origin clear/obvious
<2"/2‐8"/>8" (1) Few/Slight; Origin Not obvious
8. Medical Items (i.e., syringes) (2) Some; Indications of origin (3) Some; Origin clear/obvious
<2"/2‐8"/>8" (1) Few/Slight; Origin Not obvious
9. Other (2) Some; Indications of origin (3) Some; Origin clear/obvious1 Floatables: Record Floatables observations during sampling event over a 3-5 minute time duration.2 Count: Attempt to record count of floatables during the sampling event.
Revision: 10/14/2014 JS
FLOATABLES DESCRIPTION FORM ONONDAGA COUNTY
DEPARTMENT OF WATER ENVIRONMENT PROTECTION
Sulfide Rancid/Sour
PHYSICAL INDICATOR
DESCRIPTION Circle Relative Severity IndexOdor Present: Sewage
Color: DESCRIPTION
Photograph Taken: Yes/No
Circle Relative Severity Index
(2) Clearly visible in sample bottle
Floatables1:
Turbidity:
(2) Cloudy
Circle Relative Severity Index

APPENDIX D OCDWEP Environmental Laboratory Field
Preservation Guide


APPENDIX E Onondaga County Chain of Custody Form


EndDate
SAMPLE NOTES (Lab) Receipt Temp
CATEGORY: Treatment Plant AMP IND TP WHC SPECIAL QA/QC
Initial
CHAIN OF CUSTODY RECORDONONDAGA COUNTY DEPARTMENT OF WATER ENVIRONMENT PROTECTION
Engineering and Laboratory Services Division(Revision: Feb 2014 – COC_62002Dbaseportraitmod.DOC )
Origin of Sample (i.e., Name of Industry, Treatment Plant, Hauler, etc.)Sewer#/WCode
IC/FC #
StartDate
PickupDate
StartTime
EndTime
SampType
Bottle #
ContainerType
Preserved
Invoice#
DEC Permit
Req. By
YES NO
Project NameSample #
LABORATORY NAME: HC
CHAIN OF CUSTODY (Signature, Date of Possession)
SPLIT WITH (Name/Title/Date):
1. 2. 3. 4.
If present than attach Floatables Description Form to the Chain of Custody
PARAMETERS AS LISTED IN ANNUAL SCHEDULE? YES NO If NO, List Parameters below for all samples:
Lab Comments:
MATRIX: Solid
WasteWaterSurWaterPotWater
Remarks (sample / collection details):Total Residual Chlorine
MonochloramineTotal Dichloramine
ChloramineTotal Chlorine
Floatables Present / Absent
Bypass Samples
Bottles/Comp Aliquot/Bottle Sample Interval Refrig/IcedPreservation
ChecklistNH3-NTKN
Color Interference?
Oxidizer Present? Oxidizer Removed?Yes No Yes No
PreKit#Initials
If yes, added [ ] drops Na Thio
Sampler ID
Phenol
Field pHChlorine Residual
Meter#Flow Yes / No
Attachments included? YES / NO If yes, list pages: Page ____ of ____.


APPENDIX F Onondaga County Personal Protective Equipment
(PPE) Requirements

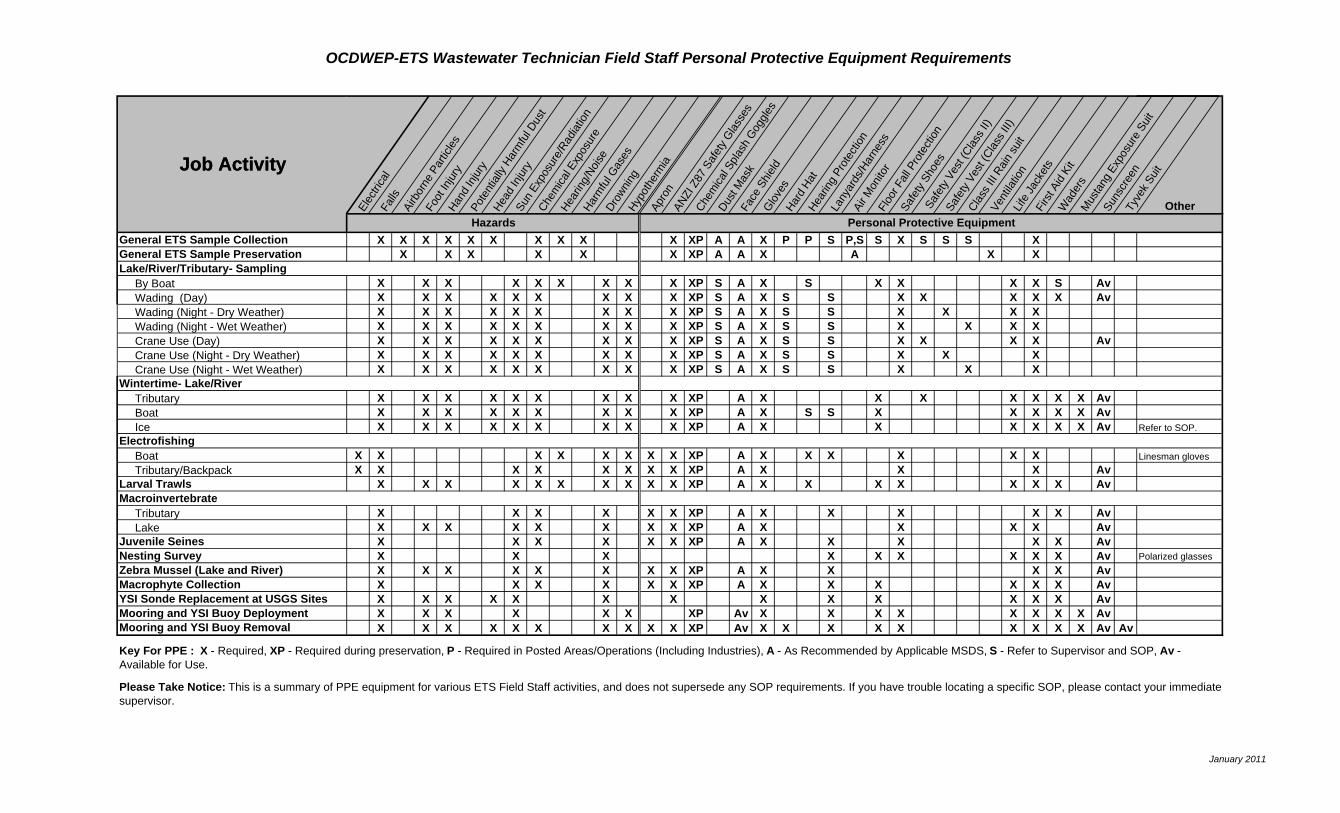
OCDWEP-ETS Wastewater Technician Field Staff Personal Protective Equipment Requirements
Elec
trica
lFa
llsAi
rbor
ne P
artic
les
Foot
Injur
yHa
nd In
jury
Pote
ntial
ly Ha
rmfu
l Dus
t
Head
Injur
ySu
n Ex
posu
re/R
adiat
ion
Chem
ical E
xpos
ure
Hear
ing/N
oise
Harm
ful G
ases
Drow
ning
Hypo
ther
mia
Apro
nAN
ZI Z
87 S
afet
y Glas
ses
Chem
ical S
plash
Gog
gles
Dust
Mas
kFa
ce S
hield
Gloves
Hard
Hat
Hear
ing P
rote
ction
Lany
ards
/Har
ness
Air M
onito
rFl
oor F
all P
rote
ction
Safe
ty Sh
oes
Saf
ety V
est (
Class I
I)
Safe
ty Ve
st (C
lass I
II)
Clas
s III
Rain su
it
Vent
ilatio
nLif
e Ja
cket
sFi
rst A
id Ki
tW
ader
sM
usta
ng E
xpos
ure
Suit
Suns
cree
nTy
vek S
uit
Other
Job Activity
Hazards Personal Protective EquipmentGeneral ETS Sample Collection X X X X X X X X X X XP A A X P P S P,S S X S S S XGeneral ETS Sample Preservation X X X X X X XP A A X A X X
By Boat X X X X X X X X X XP S A X S X X X X S Av Wading (Day) X X X X X X X X X XP S A X S S X X X X X Av Wading (Night - Dry Weather) X X X X X X X X X XP S A X S S X X X X Wading (Night - Wet Weather) X X X X X X X X X XP S A X S S X X X X Crane Use (Day) X X X X X X X X X XP S A X S S X X X X Av Crane Use (Night - Dry Weather) X X X X X X X X X XP S A X S S X X X Crane Use (Night - Wet Weather) X X X X X X X X X XP S A X S S X X X
Tributary X X X X X X X X X XP A X X X X X X X Av Boat X X X X X X X X X XP A X S S X X X X X Av Ice X X X X X X X X X XP A X X X X X X Av Refer to SOP.
Boat X X X X X X X X XP A X X X X X X Linesman gloves Tributary/Backpack X X X X X X X X XP A X X X AvLarval Trawls X X X X X X X X X X XP A X X X X X X X Av
Tributary X X X X X X XP A X X X X X Av Lake X X X X X X X X XP A X X X X AvJuvenile Seines X X X X X X XP A X X X X X AvNesting Survey X X X X X X X X X Av Polarized glassesZebra Mussel (Lake and River) X X X X X X X X XP A X X X X AvMacrophyte Collection X X X X X X XP A X X X X X X AvYSI Sonde Replacement at USGS Sites X X X X X X X X X X X X X AvMooring and YSI Buoy Deployment X X X X X X XP Av X X X X X X X X AvMooring and YSI Buoy Removal X X X X X X X X X X XP Av X X X X X X X X X Av Av
Please Take Notice: This is a summary of PPE equipment for various ETS Field Staff activities, and does not supersede any SOP requirements. If you have trouble locating a specific SOP, please contact your immediate supervisor.
Key For PPE : X - Required, XP - Required during preservation, P - Required in Posted Areas/Operations (Including Industries), A - As Recommended by Applicable MSDS, S - Refer to Supervisor and SOP, Av - Available for Use.
Job Activity
Hazards Personal Protective Equipment
Macroinvertebrate
Electrofishing
Wintertime- Lake/River
Lake/River/Tributary- Sampling
January 2011