cso report card
TRANSCRIPT
ARE YOU BEING SERVED?
A DSHS REPORT CARD2009-2010
An Independent Report Card for Community Organizations in Washington State:
Customer Service, Accessibility and Confidentiality atDSHS Community Service Offices
March 2011
Prepared by:
Dr. Rose Ernst, Seattle UniversityLinda Nguyen
Kamilah C. Taylor

1
TABLE OF CONTENTS
1.INTRODUCTION.................................................................................................................3
2. METHODS............................................................................................................................5
3. GENERAL FINDINGS..........................................................................................................8
4. OFFICE SPACE: ACCESSIBILITY AND CONFIDENTIALITY..........................................9
5. PHONE SERVICES: ACCESSIBILITY AND INFORMATION..........................................16
6. CUSTOMER SERVICE: INFORMATION AND TREAMENT...........................................20
7. IN PURSUIT OF RESPECT AND DIGNITY: RECOMMENDATIONS...........................33
8. APPENDIX: RESEARCH PROTOCOLS............................................................................36
9.EXPLANATORY NOTES.....................................................................................................39
10. BIBLIOGRAPHY...............................................................................................................41
2
•Excellence in service•Respect•Collaboration and partnership•Diversity•Accountability
Washington State Department of Social and Health Services
3
1. INTRODUCTION
Washington State residents are facing hard times. Programs for the most vulnerable in Washington State are being slashed by state government at the very moment that they are most urgently needed. During a rough economic period, it is easy to be thankful for any services provided by the government. We believe, however, that this is precisely the time to ask the hard questions about the ways in which “the people” are treated by their government: when they are most vulnerable. One of the most important government institutions in this regard is the Department Social and Health Services. According to DSHS, “over 2.1 million people—one‐third of the state’s residents—receive services from DSHS” (2010). Given its mandate and size, DSHS represents one of the key ways our state government is supposed to serve the people.
According to DSHS, “over 2.1 million people—one‐third of the state’s residents—receive services from DSHS”
We ask a series of questions in this report designed to study if DSHS enacts its own core values in regards to the point at which all residents can access its services. When you walk through the doors of a local Community Service Office, the main point of physical entry for those encountering DSHS, what is your experience? Are you treated with dignity? Are you given the information you need in order to make the best choices for you and your family? Are you treated differently because of your perceived racial identity? If the residents of this state are not able to answer in the affirmative to these questions, then we have to ask if the state is being accountable to its citizenry. This re-port card offers a starting point for this discussion. We also offer specific recommenda-tions at the end of this report.
4
For Communities
Our hope for the results of this report is twofold. First, we offer this report to all of the communities working for racial, economic and social justice around the state. We know that every community knows its needs the best, but we hope this will shine a light on the most basic right to human dignity and access to services in our compari-son of offices in different regions of the state. We hope this report will be useful to you in advocating for better treatment and services from local and state government and will provoke conversations about the role of state agencies such as DSHS in help-ing or hindering community social justice efforts.
The conditions we describe in this report demand action on the part of
state officials and DSHS administrators.
For Administrators and Elected Officials
Second, we hope that state officials, from DSHS administrators, to the Governor, to the state Legislature, take this report to heart. The conditions we describe in this re-port demand action on the part of state officials and DSHS administrators. Our report indicates that DSHS is failing to enact its own core values in regards to Community Service Offices. While we know times are tight at DSHS, we argue that many of the most pressing issues around fair treatment will cost the state very little. Therefore, in the conclusion to this report, we offer specific suggestions for addressing these failures.
5
2. METHODSThis report includes different ways of measuring the overall experience of people entering CSOs for services and information, as well as differences between individuals and DSHS regions. The follow-ing is a sample of the questions we used to understand what individuals experience when they try to access services and information at all DSHS CSOs:
CSO Accessibility and Information
• Is this office easily accessible by car and/or public transportation?
• Is the office accessible by wheelchair?
• Does the office have required DSHS informational materials? Is this information provided in more than one language?
• Are there clear instructions about how to get assistance? Is this provided in more than one language?
• Is the office designed so individual-staff interactions are confidential?
• Is there a way for you to provide confidential feedback about their experience at the office?
• Are you able to ask for information without a social security number?
• Are office hours clearly posted? Are there drop boxes for confidential forms (after hours)?
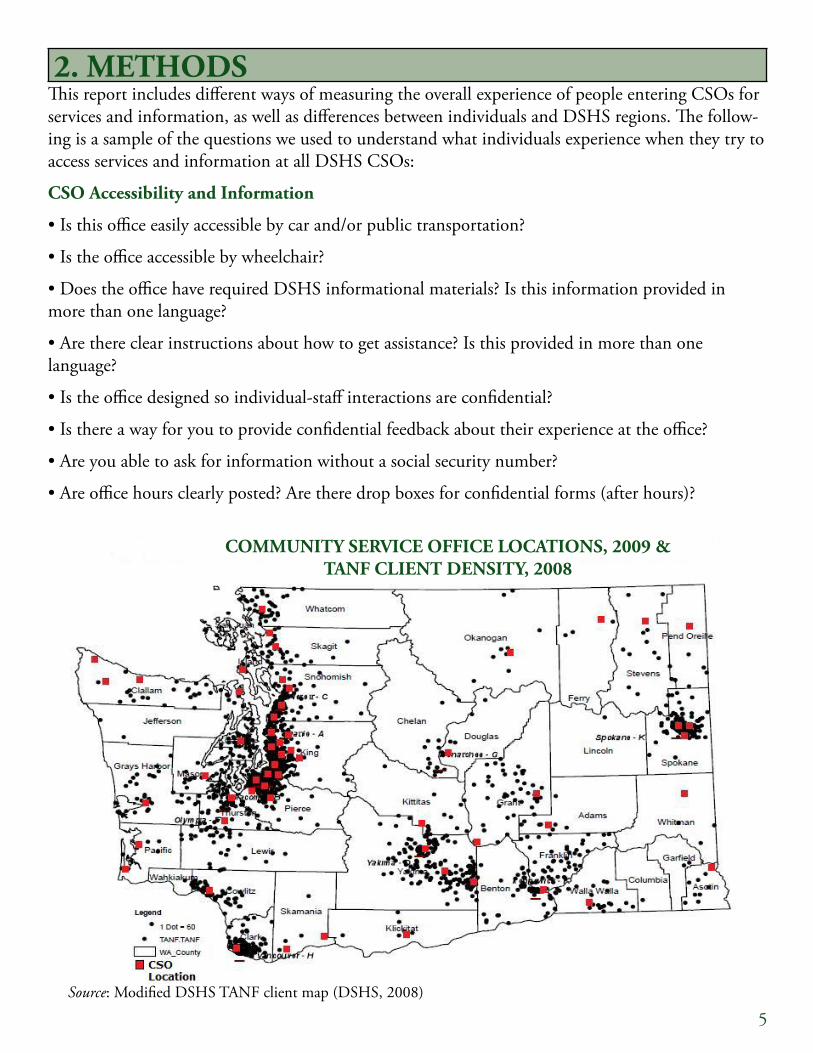
COMMUNITY SERVICE OFFICE LOCATIONS, 2009 &TANF CLIENT DENSITY, 2008
Source: Modified DSHS TANF client map (DSHS, 2008)
6
Staff-Individual Interactions
• If you ask for information about services provided by DSHS, how much and what kind of information do you receive?
• Are staff members professional, patient and willing to explain services?1
• Do staff members explain your rights and responsibilities as a client of DSHS?
• Do individuals of different racial and/or ethnic backgrounds experience any of the above interaction questions in a different way?
• Do non-native English speakers and/or those who do not speak English experience any of the above interaction questions in a different way?
• Do staff members understand individuals’ limited access to internet and computers for ap plication of services?
Phone Services
• Is it possible to call your local CSO? Are you able to leave a message there to ask a general question? Are there any non-English options?
• What information do staff give over the phone about what services are available for adults and children who are undocumented?
The first two components of the project include visits to all 542 CSOs in Washington State between July 2009 and December 2009, in addition to the phone survey in 2010.3 We used an “audit” study, com-monly used to track differences between treatments of individuals based on race, to collect data about the second component about staff-individual interactions at the office. DSHS was not notified of these visits in order to protect the integrity of the data collected. These data were collected in two different stages that we explain below:
• Four women, African American, Asian American, Latina4 and White American visited all of the offices together, though at spaced intervals.
o We each asked for information about programs/services provided and instructions for application to programs.
o We were often able to witness one another’s interaction with staff.
o We independently wrote our observations about the information provided, questions asked of us, and the general tone of the interaction.
o After finishing these notes, we collectively discussed the interactions we witnessed in order to cali- brate our observations and look for possible patterns (if any) between office visit interactions.
• These four co-investigators also sat in the CSOs and collected data about other staff- individual interactions, noting the following:
o General tone of interaction (e.g. level of voice, body language)
o The race and/or ethnicity of the individual asking for help—when we could determine this. These data, while less precise than those gathered in the investigator interactions above, provided a larger data set of interactions.
7
Data LimitationsThe goal of this study is to provide information about the ways in which residents of the state of Washing-ton experience DSHS. The data collected about accessibility are easily verifiable through office visits. The other two components of the study, individual-staff interactions and phone services, are obviously taken at a particular point in time, and reflect many different variables not considered in this study. Nevertheless, when we aggregate the data we collected, there are certain patterns that emerge in terms of the perceived identity of individuals asking DSHS for assistance. While we recognize the necessary limitations of this study (for example, one visit to each office), we hope this data will provoke much-needed discussion about the ways in which CSOs treat individuals who, by virtue of living and paying taxes in the state of Washing-ton, pay DSHS employees’ salaries.
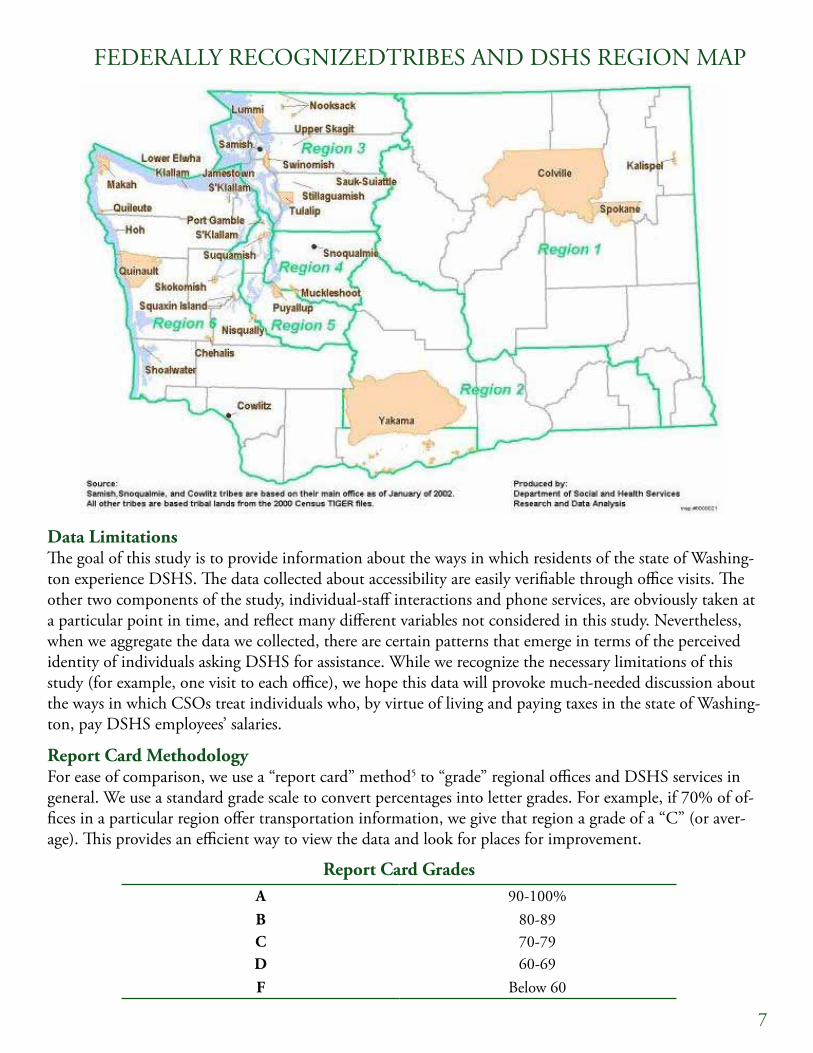
Report Card MethodologyFor ease of comparison, we use a “report card” method5 to “grade” regional offices and DSHS services in general. We use a standard grade scale to convert percentages into letter grades. For example, if 70% of of-fices in a particular region offer transportation information, we give that region a grade of a “C” (or aver-age). This provides an efficient way to view the data and look for places for improvement.
A 90-100%B 80-89C 70-79D 60-69F Below 60
Report Card Grades
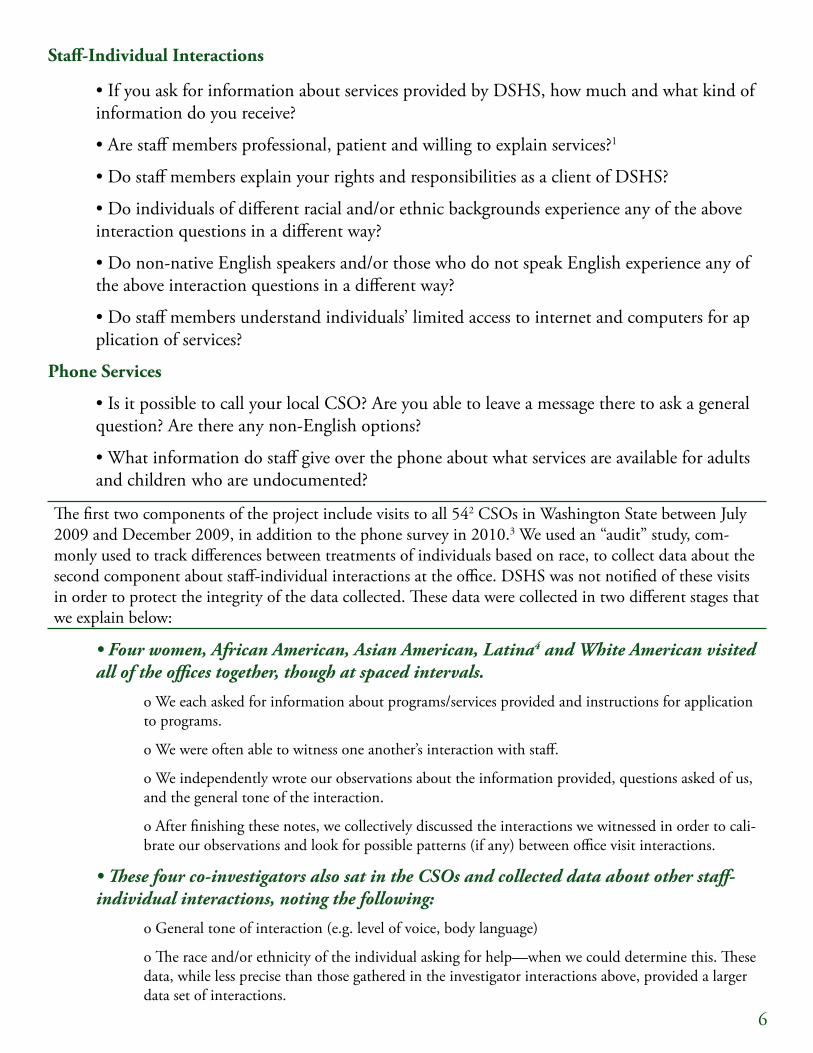
FEDERALLY RECOGNIZEDTRIBES AND DSHS REGION MAP

8
There is significant variance between DSHS regions in terms of accessibility. These findings, however, do not erase the fact that the
overall grade on a range of measures included in this report card is an ‘F’.
Table 1. REPORT CARD: GENERAL FINDINGS Grade
AccessibilityTraveling to the Office DOffices Meeting Physical Navigation Requirements FOffices Meeting Navigation Requirements FOffices with Basic Language Requirements F
ConfidentialityConfidentiality Assured FAble to Talk to Staff without Social Security Number D
Information and TreatmentProfessional Demeanor DReceived information about Cash, Food and Medical F
3. GENERAL FINDINGS
There is significant variance between DSHS regions in terms of accessibility. These findings, however, do not erase the fact that the overall grade on a range of measures included in this report card is an ‘F’. The highlights include the following: parking accessibil-ity and the ability to ask a question without a social security number.6 Required materials, general accessibility, confidentiality, quality/quantity of information received and general treatment were among the areas that need immediate attention.
9
4. OFFICE SPACE:
ACCESSIBILITY & CONFIDENTIALITY
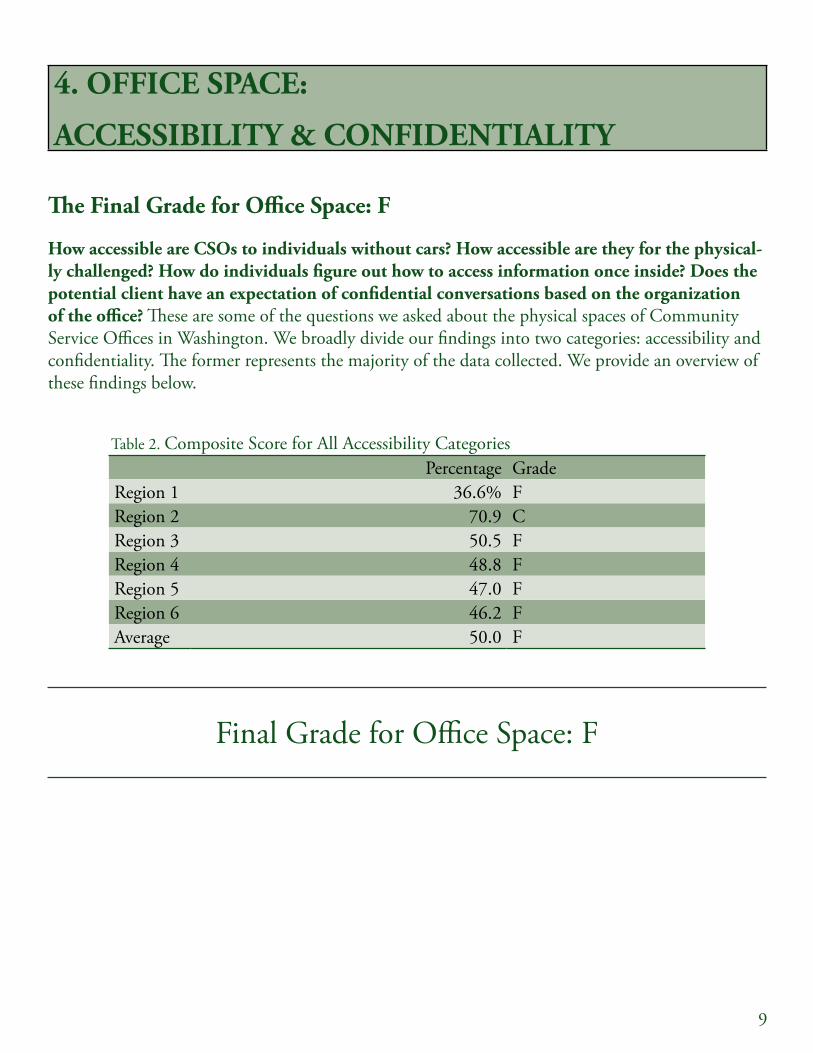
The Final Grade for Office Space: F
How accessible are CSOs to individuals without cars? How accessible are they for the physical-ly challenged? How do individuals figure out how to access information once inside? Does the potential client have an expectation of confidential conversations based on the organization of the office? These are some of the questions we asked about the physical spaces of Community Service Offices in Washington. We broadly divide our findings into two categories: accessibility and confidentiality. The former represents the majority of the data collected. We provide an overview of these findings below.
Table 2. Composite Score for All Accessibility CategoriesPercentage Grade
Region 1 36.6% FRegion 2 70.9 CRegion 3 50.5 FRegion 4 48.8 FRegion 5 47.0 FRegion 6 46.2 FAverage 50.0 F
Final Grade for Office Space: F
10
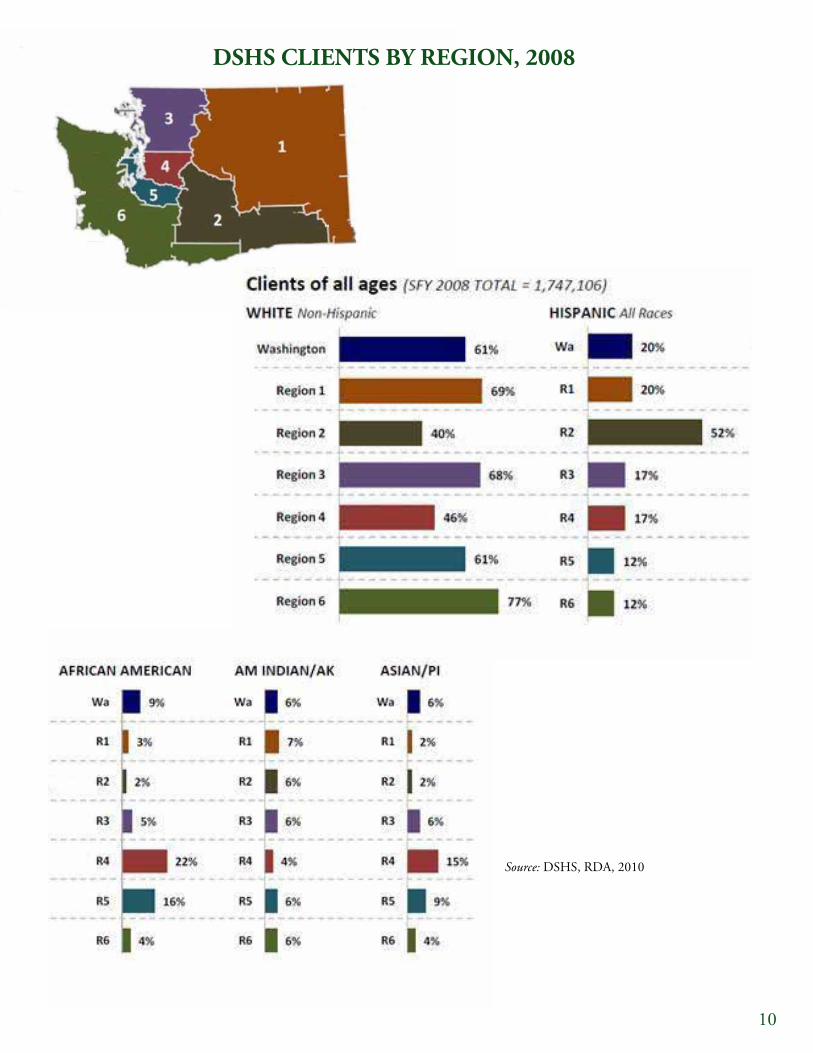
Source: DSHS, RDA, 2010
DSHS CLIENTS BY REGION, 2008
11
Accessibility
1. Traveling to the Office: Grade D
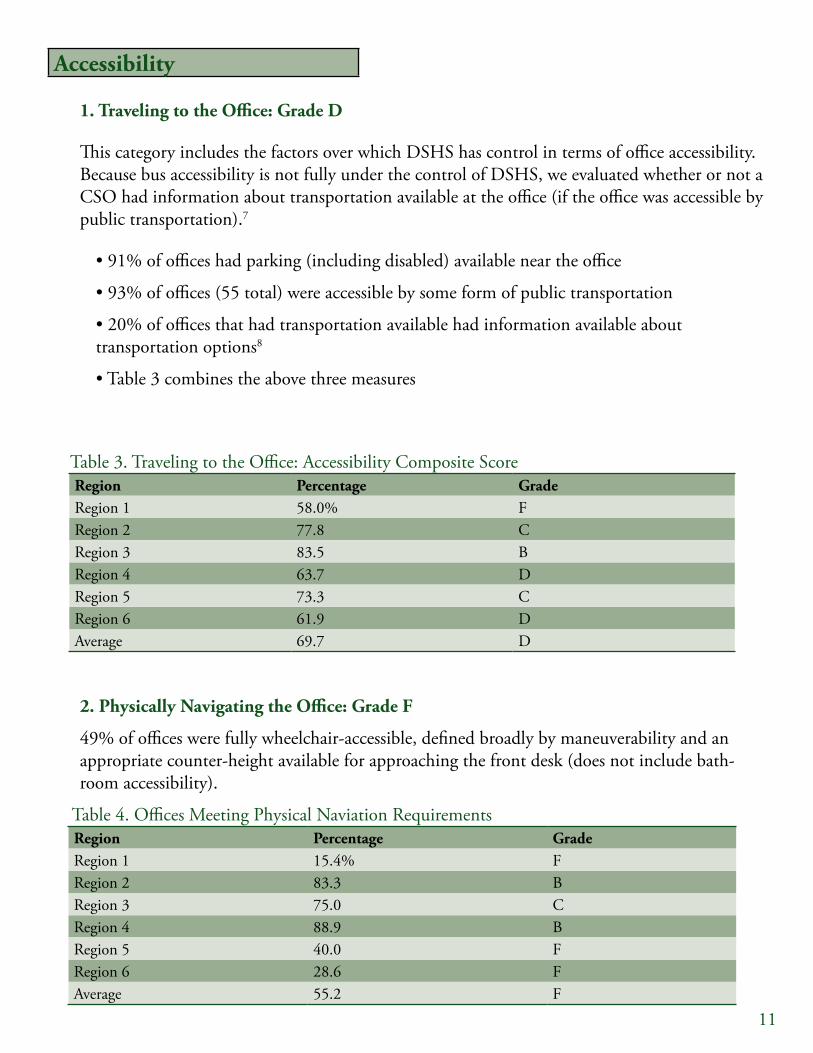
This category includes the factors over which DSHS has control in terms of office accessibility. Because bus accessibility is not fully under the control of DSHS, we evaluated whether or not a CSO had information about transportation available at the office (if the office was accessible by public transportation).7
• 91% of offices had parking (including disabled) available near the office
• 93% of offices (55 total) were accessible by some form of public transportation
• 20% of offices that had transportation available had information available about transportation options8
• Table 3 combines the above three measures
Table 3. Traveling to the Office: Accessibility Composite ScoreRegion Percentage GradeRegion 1 58.0% FRegion 2 77.8 CRegion 3 83.5 BRegion 4 63.7 DRegion 5 73.3 CRegion 6 61.9 DAverage 69.7 D
2. Physically Navigating the Office: Grade F
49% of offices were fully wheelchair-accessible, defined broadly by maneuverability and an appropriate counter-height available for approaching the front desk (does not include bath-room accessibility).
Table 4. Offices Meeting Physical Naviation Requirements Region Percentage GradeRegion 1 15.4% FRegion 2 83.3 BRegion 3 75.0 CRegion 4 88.9 BRegion 5 40.0 FRegion 6 28.6 FAverage 55.2 F
12
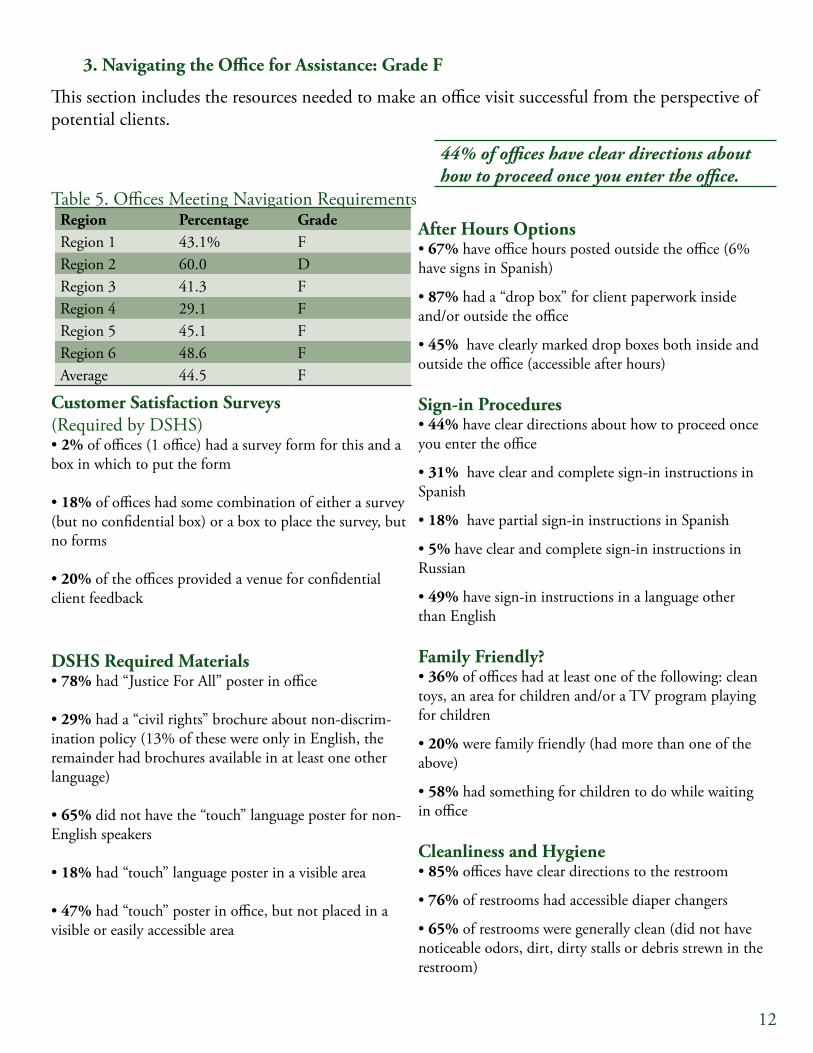
3. Navigating the Office for Assistance: Grade F
This section includes the resources needed to make an office visit successful from the perspective of potential clients.
44% of offices have clear directions about how to proceed once you enter the office.
Table 5. Offices Meeting Navigation RequirementsRegion Percentage GradeRegion 1 43.1% FRegion 2 60.0 DRegion 3 41.3 FRegion 4 29.1 FRegion 5 45.1 FRegion 6 48.6 FAverage 44.5 F
After Hours Options• 67% have office hours posted outside the office (6% have signs in Spanish)
• 87% had a “drop box” for client paperwork inside and/or outside the office
• 45% have clearly marked drop boxes both inside and outside the office (accessible after hours) Sign-in Procedures• 44% have clear directions about how to proceed once you enter the office
• 31% have clear and complete sign-in instructions in Spanish
• 18% have partial sign-in instructions in Spanish
• 5% have clear and complete sign-in instructions in Russian
• 49% have sign-in instructions in a language other than English
Family Friendly?• 36% of offices had at least one of the following: clean toys, an area for children and/or a TV program playing for children
• 20% were family friendly (had more than one of the above)
• 58% had something for children to do while waiting in office
Cleanliness and Hygiene• 85% offices have clear directions to the restroom
• 76% of restrooms had accessible diaper changers
• 65% of restrooms were generally clean (did not have noticeable odors, dirt, dirty stalls or debris strewn in the restroom)
Customer Satisfaction Surveys (Required by DSHS)• 2% of offices (1 office) had a survey form for this and a box in which to put the form
• 18% of offices had some combination of either a survey (but no confidential box) or a box to place the survey, but no forms
• 20% of the offices provided a venue for confidential client feedback
DSHS Required Materials• 78% had “Justice For All” poster in office
• 29% had a “civil rights” brochure about non-discrim-ination policy (13% of these were only in English, the remainder had brochures available in at least one other language)
• 65% did not have the “touch” language poster for non-English speakers
• 18% had “touch” language poster in a visible area • 47% had “touch” poster in office, but not placed in a visible or easily accessible area
13
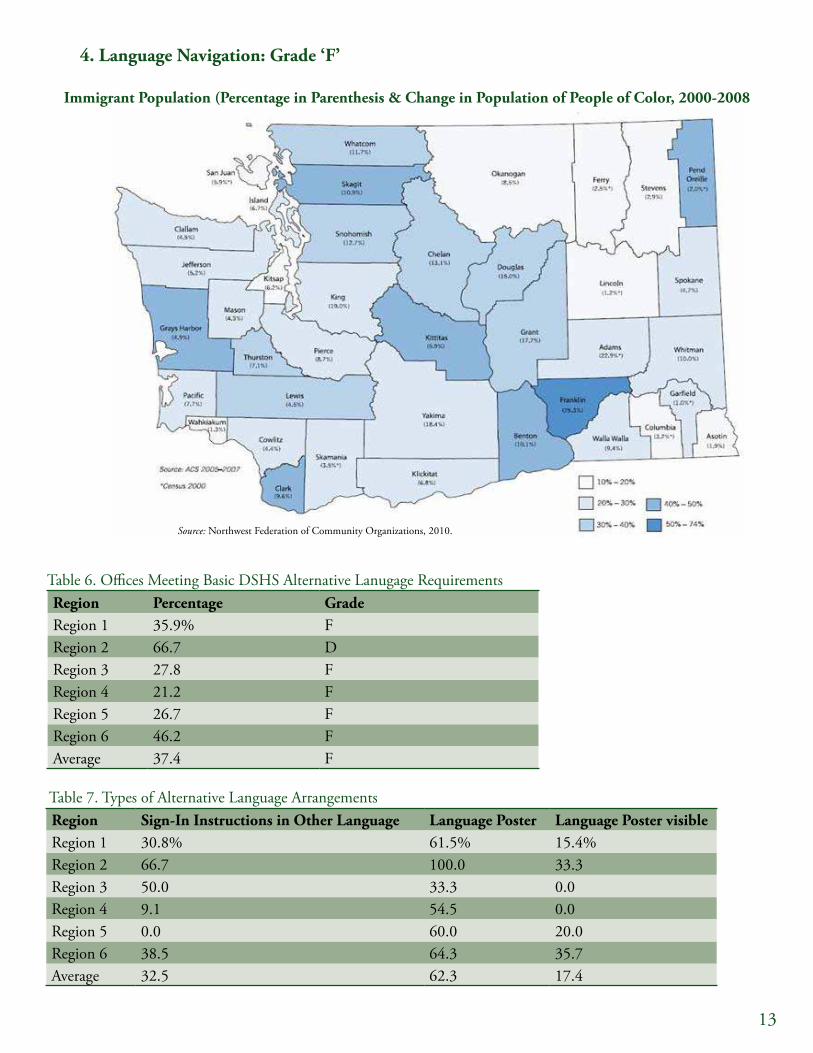
4. Language Navigation: Grade ‘F’
Immigrant Population (Percentage in Parenthesis & Change in Population of People of Color, 2000-2008
Table 6. Offices Meeting Basic DSHS Alternative Lanugage RequirementsRegion Percentage GradeRegion 1 35.9% FRegion 2 66.7 DRegion 3 27.8 FRegion 4 21.2 FRegion 5 26.7 FRegion 6 46.2 FAverage 37.4 F
Table 7. Types of Alternative Language Arrangements Region Sign-In Instructions in Other Language Language Poster Language Poster visibleRegion 1 30.8% 61.5% 15.4%Region 2 66.7 100.0 33.3Region 3 50.0 33.3 0.0Region 4 9.1 54.5 0.0Region 5 0.0 60.0 20.0Region 6 38.5 64.3 35.7Average 32.5 62.3 17.4
Source: Northwest Federation of Community Organizations, 2010.
14
Confidentiality
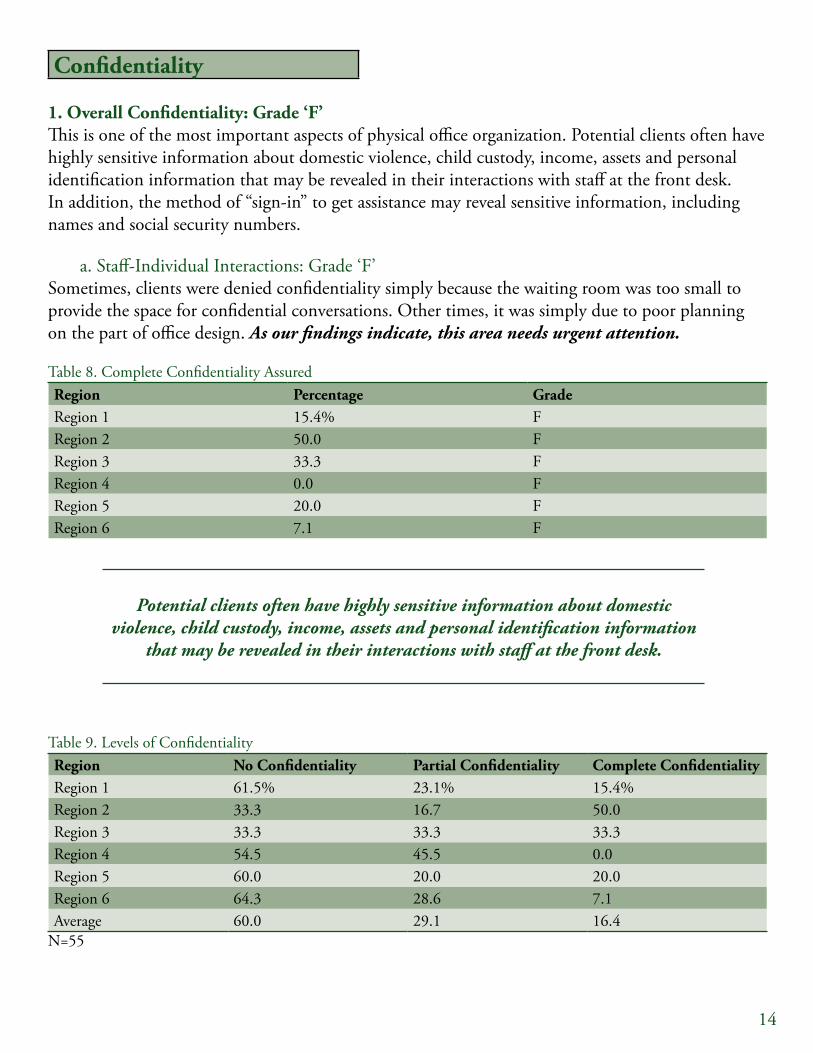
1. Overall Confidentiality: Grade ‘F’This is one of the most important aspects of physical office organization. Potential clients often have highly sensitive information about domestic violence, child custody, income, assets and personal identification information that may be revealed in their interactions with staff at the front desk. In addition, the method of “sign-in” to get assistance may reveal sensitive information, including names and social security numbers.
a. Staff-Individual Interactions: Grade ‘F’Sometimes, clients were denied confidentiality simply because the waiting room was too small to provide the space for confidential conversations. Other times, it was simply due to poor planning on the part of office design. As our findings indicate, this area needs urgent attention.
Table 8. Complete Confidentiality AssuredRegion Percentage GradeRegion 1 15.4% FRegion 2 50.0 FRegion 3 33.3 FRegion 4 0.0 FRegion 5 20.0 FRegion 6 7.1 F
Potential clients often have highly sensitive information about domestic violence, child custody, income, assets and personal identification information
that may be revealed in their interactions with staff at the front desk.
Table 9. Levels of ConfidentialityRegion No Confidentiality Partial Confidentiality Complete Confidentiality Region 1 61.5% 23.1% 15.4%Region 2 33.3 16.7 50.0Region 3 33.3 33.3 33.3Region 4 54.5 45.5 0.0Region 5 60.0 20.0 20.0Region 6 64.3 28.6 7.1Average 60.0 29.1 16.4
N=55
15
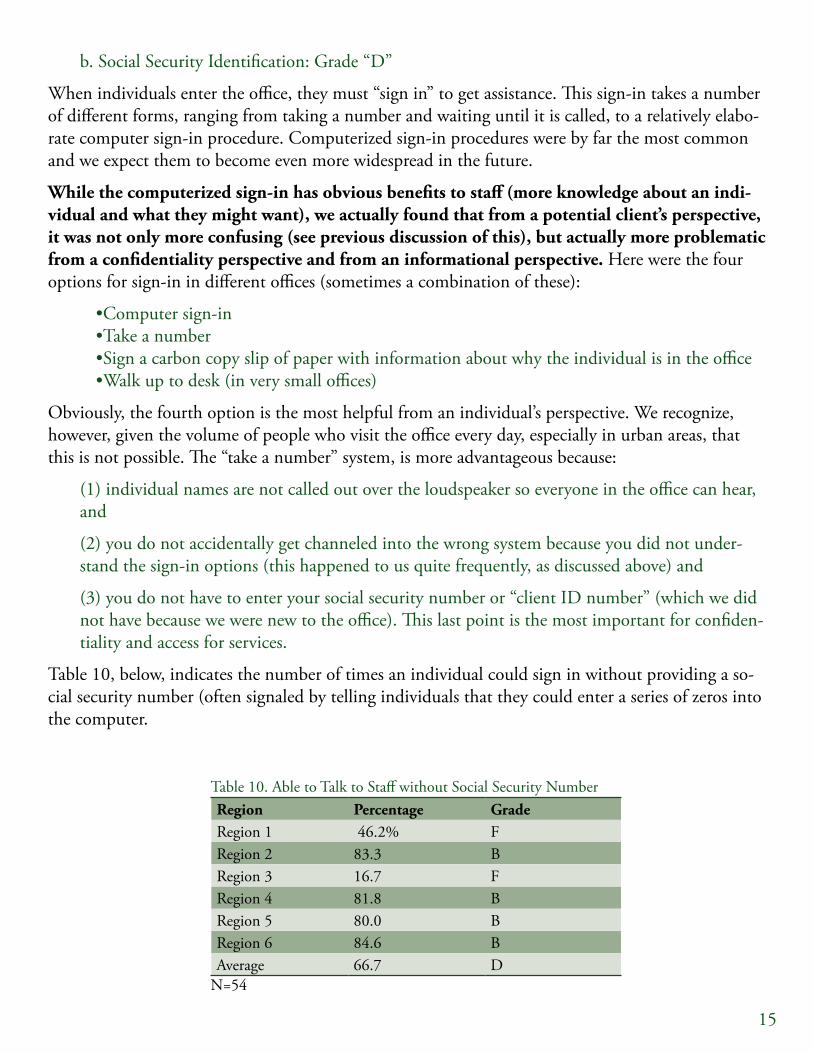
b. Social Security Identification: Grade “D”
When individuals enter the office, they must “sign in” to get assistance. This sign-in takes a number of different forms, ranging from taking a number and waiting until it is called, to a relatively elabo-rate computer sign-in procedure. Computerized sign-in procedures were by far the most common and we expect them to become even more widespread in the future.
While the computerized sign-in has obvious benefits to staff (more knowledge about an indi-vidual and what they might want), we actually found that from a potential client’s perspective, it was not only more confusing (see previous discussion of this), but actually more problematic from a confidentiality perspective and from an informational perspective. Here were the four options for sign-in in different offices (sometimes a combination of these):
•Computer sign-in•Take a number•Sign a carbon copy slip of paper with information about why the individual is in the office•Walk up to desk (in very small offices)
Obviously, the fourth option is the most helpful from an individual’s perspective. We recognize, however, given the volume of people who visit the office every day, especially in urban areas, that this is not possible. The “take a number” system, is more advantageous because:
(1) individual names are not called out over the loudspeaker so everyone in the office can hear, and
(2) you do not accidentally get channeled into the wrong system because you did not under-stand the sign-in options (this happened to us quite frequently, as discussed above) and
(3) you do not have to enter your social security number or “client ID number” (which we did not have because we were new to the office). This last point is the most important for confiden-tiality and access for services.
Table 10, below, indicates the number of times an individual could sign in without providing a so-cial security number (often signaled by telling individuals that they could enter a series of zeros into the computer.
Table 10. Able to Talk to Staff without Social Security NumberRegion Percentage GradeRegion 1 46.2% FRegion 2 83.3 BRegion 3 16.7 FRegion 4 81.8 BRegion 5 80.0 BRegion 6 84.6 BAverage 66.7 D
N=54
16
5. PHONE SERVICES:
ACCESSIBILITY & INFORMATIONMany individuals access DSHS through the phone, either as a supplement to an office visit, or just to receive basic information about programs. Phone contact is critical for those who are unable to access the office or do not have internet access.
The data gathered for this portion of the study should be viewed as supplemental to the office audit study in the preceding pages. We gathered information (between May and August 2010) about:
(1) Ease of access and ability to speak to a member of staff; (2) Information provided; (3) Language accessibility.
DSHS has a number of different levels of phone service. We did not attempt to assess the level of service once a client already had an open case in the system. Similar to our study in the offices, we wanted to assess the ‘typical’ experience of an individual trying to access basic information about programs and eligibility. Therefore, we only assessed two phone system levels:
(1) Direct local CSO service and (2) General customer service hotline (attached to clusters of offices).
Accessibility by Phone
• Are you able to speak to a member of staff if your question is not answered by prerecorded messages?
• Are you able to leave a general message if no one is able to take your call?
• Is the phone system easy to understand?
• How long do you have to wait to speak to someone?
Information Provided by Phone
• What are you told when you ask what services are available if you are an undocumented individual?
Language Accessibility by Phone
• How many phone services are accessible in Spanish?
• How many phone services are accessible in Russian?
• How many phone services are accessible in other languages?
• Are there different wait times for different languages?
17
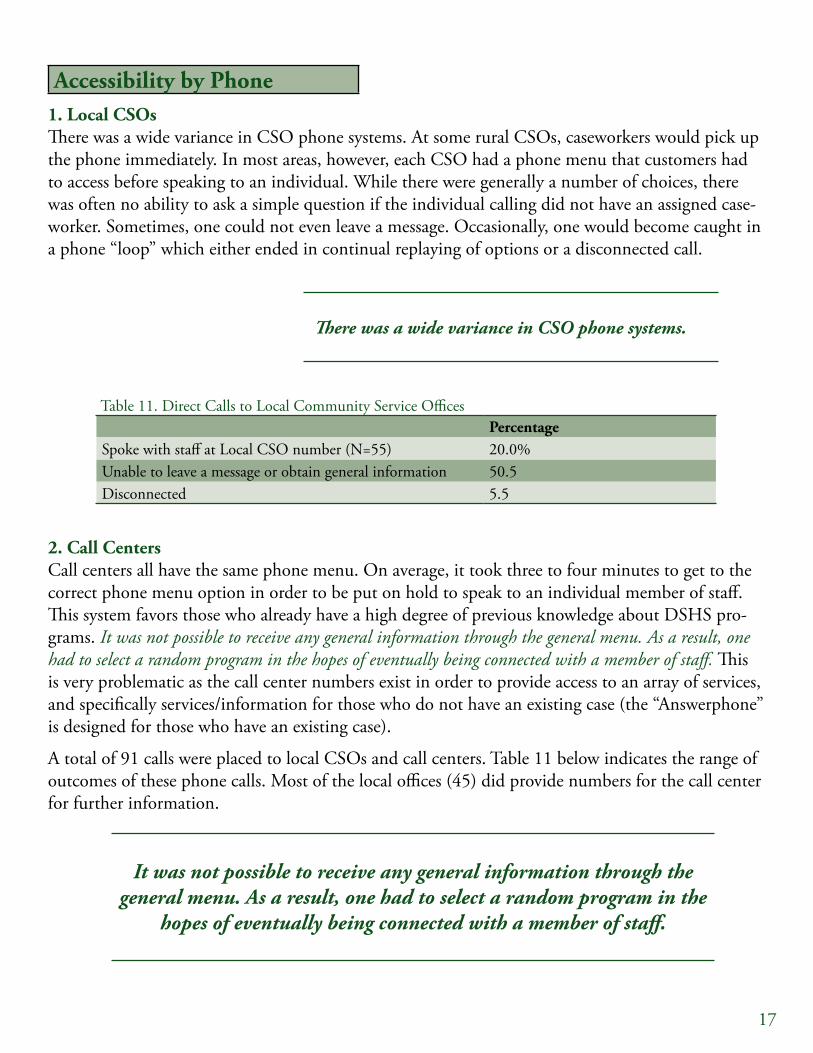
Accessibility by Phone1. Local CSOsThere was a wide variance in CSO phone systems. At some rural CSOs, caseworkers would pick up the phone immediately. In most areas, however, each CSO had a phone menu that customers had to access before speaking to an individual. While there were generally a number of choices, there was often no ability to ask a simple question if the individual calling did not have an assigned case-worker. Sometimes, one could not even leave a message. Occasionally, one would become caught in a phone “loop” which either ended in continual replaying of options or a disconnected call.
There was a wide variance in CSO phone systems.
Table 11. Direct Calls to Local Community Service Offices
PercentageSpoke with staff at Local CSO number (N=55) 20.0% Unable to leave a message or obtain general information 50.5Disconnected 5.5
2. Call CentersCall centers all have the same phone menu. On average, it took three to four minutes to get to the correct phone menu option in order to be put on hold to speak to an individual member of staff. This system favors those who already have a high degree of previous knowledge about DSHS pro-grams. It was not possible to receive any general information through the general menu. As a result, one had to select a random program in the hopes of eventually being connected with a member of staff. This is very problematic as the call center numbers exist in order to provide access to an array of services, and specifically services/information for those who do not have an existing case (the “Answerphone” is designed for those who have an existing case).
A total of 91 calls were placed to local CSOs and call centers. Table 11 below indicates the range of outcomes of these phone calls. Most of the local offices (45) did provide numbers for the call center for further information.
It was not possible to receive any general information through the general menu. As a result, one had to select a random program in the
hopes of eventually being connected with a member of staff.
18
Information Provided by Phone
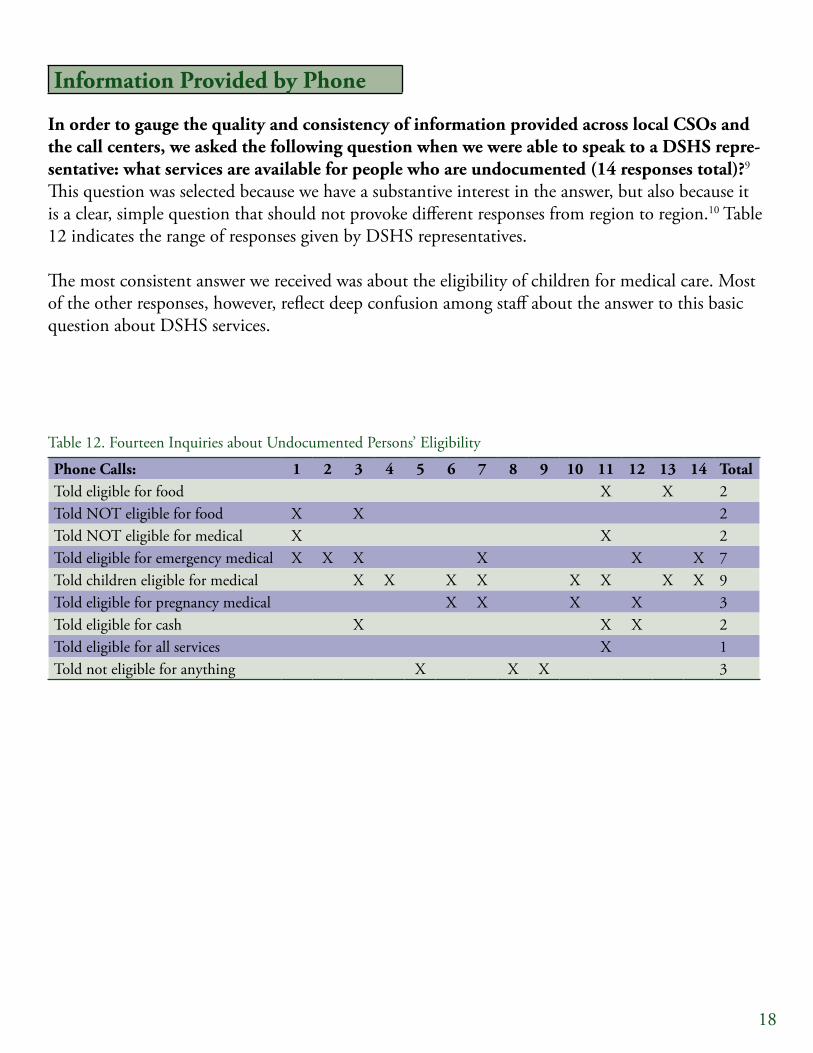
In order to gauge the quality and consistency of information provided across local CSOs and the call centers, we asked the following question when we were able to speak to a DSHS repre-sentative: what services are available for people who are undocumented (14 responses total)?9
This question was selected because we have a substantive interest in the answer, but also because it is a clear, simple question that should not provoke different responses from region to region.10 Table 12 indicates the range of responses given by DSHS representatives.
The most consistent answer we received was about the eligibility of children for medical care. Most of the other responses, however, reflect deep confusion among staff about the answer to this basic question about DSHS services.
Phone Calls: 1 2 3 4 5 6 7 8 9 10 11 12 13 14 TotalTold eligible for food X X 2Told NOT eligible for food X X 2Told NOT eligible for medical X X 2Told eligible for emergency medical X X X X X X 7Told children eligible for medical X X X X X X X X 9Told eligible for pregnancy medical X X X X 3Told eligible for cash X X X 2Told eligible for all services X 1Told not eligible for anything X X X 3
Table 12. Fourteen Inquiries about Undocumented Persons’ Eligibility
19
Language Accessibility by Phone
We also measured the accessibility of phone services by language. As with the other data presented, we measured this by testing the availability of information through direct CSO contact as well as the DSHS information call centers.
Only 32 of the offices had direct phone menu availability (five offices picked up the phone imme-diately without a menu, so we were unable to test this and all the other offices had an automatic transfer to a call center; does not include those menus that said “press X for Spanish” in English rather than Spanish). Of these offices, five offices picked up the phone immediately (no menu available), so we were unable to test these services, leaving us with 27 offices total to include in the sample.
• 17 of these 27 offices had a Spanish-language option on the phone menu
• 13 of these 27 offices had a Russian-language option on the phone menu
One consistent problem emerged in the area of language options for the call center. Even when one followed the call center menu in Spanish or
Russian, the members of staff who answered the call after waiting on hold answered in English. In the case of Russian, the menu would transition at
various points to English halfway through the choices.
20
6. CUSTOMER SERVICE:
INFORMATION & TREATMENTAs noted in the methodology section of this report, a major component of this study was an “audit” of customer service provided by those working at the front desks in the lobby areas of CSOs.11 The goal of our study is not to “call out” individual employees of DSHS. It is, rather, to gather a summative view of what people experience when they encounter the state through DSHS. We recognize that receptionists often have difficult and sometimes dangerous jobs. That does not mean, however, that treating individuals in a degrading manner is acceptable. The fact that we sometimes had sharply different experiences with the same receptionist attests to the fact that there is a great deal of bureaucratic discretion in this area. Furthermore, this interaction has many fewer constraints than those that are typically studied: the actual provision of services. We believe that both individu-als and the state have responsibility for these interactions, although the burden is clearly on the state as they are the ones who set guidelines and enforce rules about appropriate client-staff interactions.
We recognize that receptionists often have difficult and sometimes dangerous jobs. That does not mean, however, that treating individuals in a degrading manner is acceptable.
Audit ProceduresHere is an overview of a typical office visit:
Upon entering, we tried to sign in—sometimes unsuccessfully—so that we could be seen to ask our questions. The systems offices had to “sign in” varied from elaborate computer options to taking a number to simply walking up to the front desk.
When we were called up to speak to the receptionist, we asked a variation of the question/state-ment: “I’d like find out about welfare (sometimes benefits)—what kinds of programs are there? Can you explain them to me?” Depending on the situation, the receptionist would sometimes probe further to obtain detailed information about us. We told receptionists that we “just wanted general information” and if they pushed further, we told them that we “might be applying for different people” or that “it’s a complicated situation.”
In addition to asking them to explain the general programs on the general intake application (cash, medical and food), we asked them how to apply and what would happen after we applied. This was another point at which they could provide information.
We then asked what we should do if we or the people we were applying for had questions or were confused.
Finally, we took turns asking one additional question to see if we could gather any further infor-mation about the programs.12
Once our interaction was complete (or immediately preceding it if we had to wait to see a recep-tionist), we would sit in the office and unobtrusively observe other client-staff interactions in the office.
21
How much information did we receive? How were we treated?We measured our interactions at two levels: treatment and information received. The informational component included the quantity and type of information provided upon our inquiries about welfare. Did they provide full information about the available programs? Did they skip over or refuse to explain certain aspects of the application? Did they provide a full list of documentation required? Did they provide a way to get further help if we needed it? These were just a few of the informational questions we asked ourselves in measuring staff re-sponses. The treatment category included the quality of our interactions. This is, obviously, a sub-jective measure, but is equally important compared to the informational measure. For example, if a receptionist provides two people the same information but raises her voice with one client so that everyone in the office can hear her confidential information, these two clients will have a different experience. Fortunately, we were frequently able to observe each other’s interactions so that we were able to compare our own perceptions with one another. We first discuss the informational results.
Information ReceivedFollowing each interaction, we noted whether the following programs were explained to us: cash, medical and food. These three programs were located at the top of the application, so it was easy to point to them.
• In almost all of the offices, we had to prompt the receptionist to explain these programs to us. In most cases, the receptionists would explain the eligibility requirements for the pro-grams, not what the programs actually provided. If we pushed them further on this point, the most common response we encountered was “cash is cash, medical is medical and food is food.” Occasionally, a receptionist did take the time to explain the actual benefits one would receive, but this was rare.
• We also took note of descriptions of subsets of the general programs included on the ap-plication. For example, “cash” benefits include Temporary Assistance for Needy Families (TANF) and General Assistance Unemployable (GAU). The first program is generally for adults with children while the second is for disabled adults. Medical includes different pro-grams for children and adults. As these are important distinctions within the general pro-gram categories, we noted if receptionists explained these programs, however briefly, as they are at the heart of the application process for benefits.
22
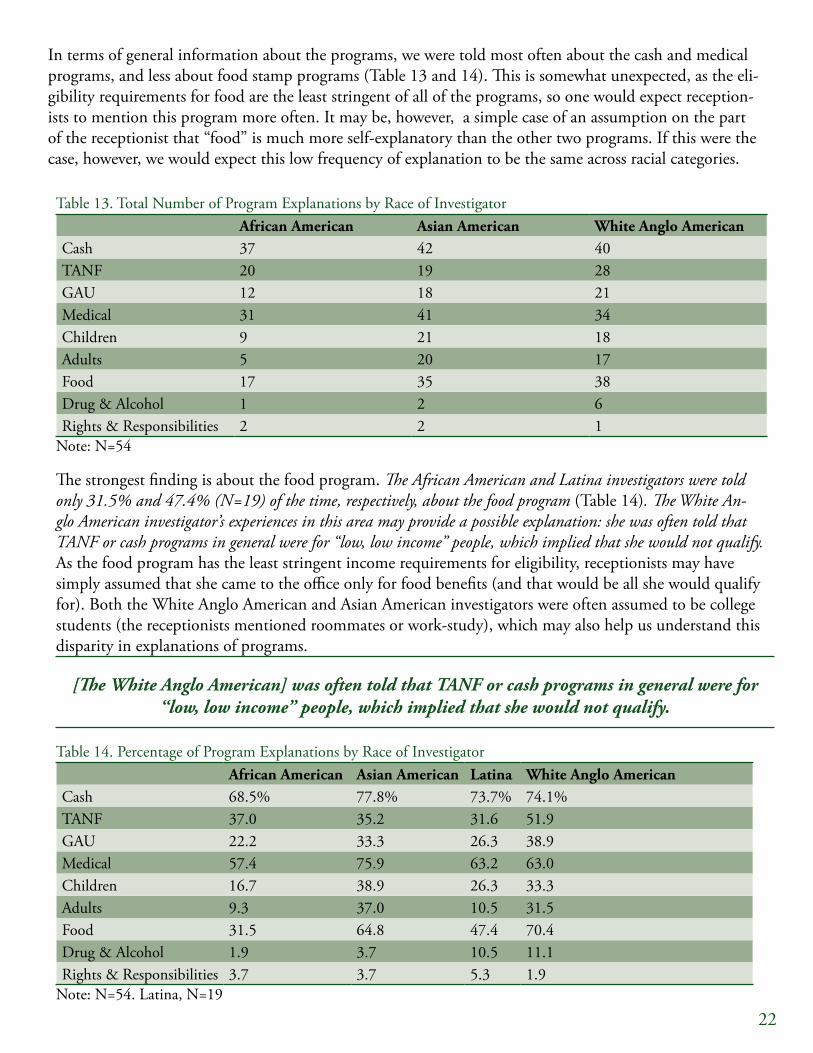
In terms of general information about the programs, we were told most often about the cash and medical programs, and less about food stamp programs (Table 13 and 14). This is somewhat unexpected, as the eli-gibility requirements for food are the least stringent of all of the programs, so one would expect reception-ists to mention this program more often. It may be, however, a simple case of an assumption on the part of the receptionist that “food” is much more self-explanatory than the other two programs. If this were the case, however, we would expect this low frequency of explanation to be the same across racial categories.
Table 13. Total Number of Program Explanations by Race of InvestigatorAfrican American Asian American White Anglo American
Cash 37 42 40TANF 20 19 28GAU 12 18 21Medical 31 41 34Children 9 21 18Adults 5 20 17Food 17 35 38Drug & Alcohol 1 2 6Rights & Responsibilities 2 2 1
Note: N=54
The strongest finding is about the food program. The African American and Latina investigators were told only 31.5% and 47.4% (N=19) of the time, respectively, about the food program (Table 14). The White An-glo American investigator’s experiences in this area may provide a possible explanation: she was often told that TANF or cash programs in general were for “low, low income” people, which implied that she would not qualify. As the food program has the least stringent income requirements for eligibility, receptionists may have simply assumed that she came to the office only for food benefits (and that would be all she would qualify for). Both the White Anglo American and Asian American investigators were often assumed to be college students (the receptionists mentioned roommates or work-study), which may also help us understand this disparity in explanations of programs.
[The White Anglo American] was often told that TANF or cash programs in general were for “low, low income” people, which implied that she would not qualify.
Table 14. Percentage of Program Explanations by Race of InvestigatorAfrican American Asian American Latina White Anglo American
Cash 68.5% 77.8% 73.7% 74.1%TANF 37.0 35.2 31.6 51.9GAU 22.2 33.3 26.3 38.9Medical 57.4 75.9 63.2 63.0Children 16.7 38.9 26.3 33.3Adults 9.3 37.0 10.5 31.5Food 31.5 64.8 47.4 70.4Drug & Alcohol 1.9 3.7 10.5 11.1Rights & Responsibilities 3.7 3.7 5.3 1.9
Note: N=54. Latina, N=19
23
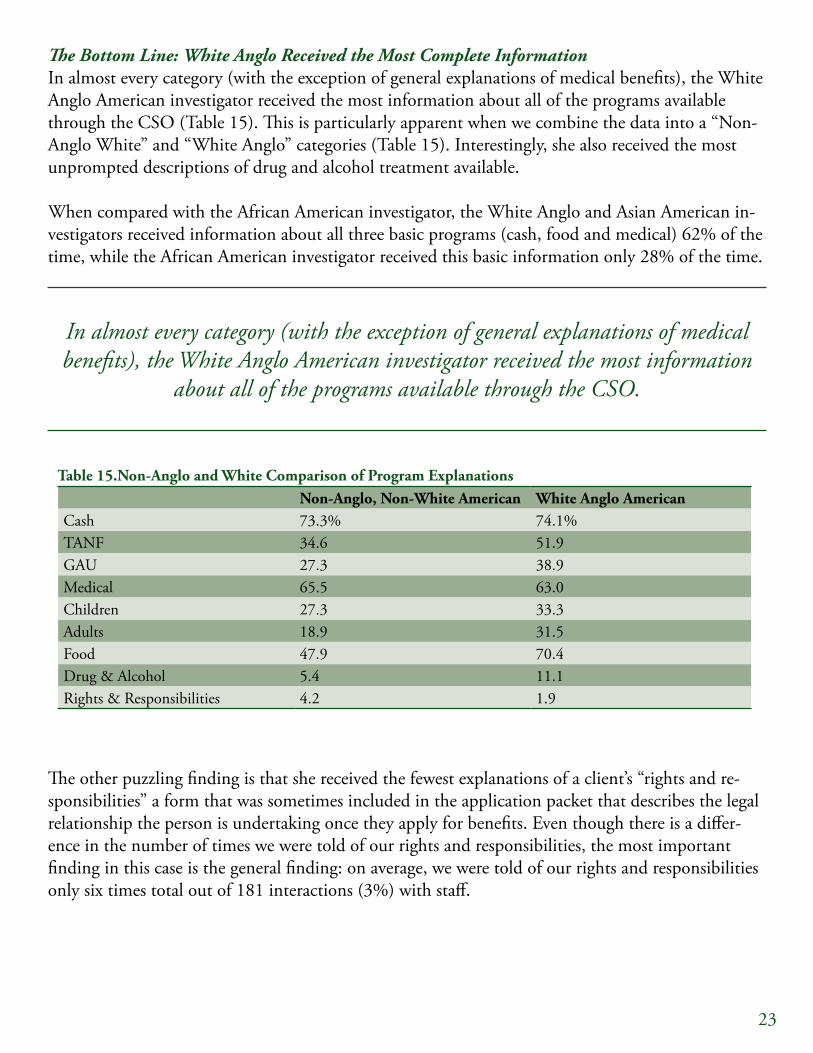
The Bottom Line: White Anglo Received the Most Complete InformationIn almost every category (with the exception of general explanations of medical benefits), the White Anglo American investigator received the most information about all of the programs available through the CSO (Table 15). This is particularly apparent when we combine the data into a “Non-Anglo White” and “White Anglo” categories (Table 15). Interestingly, she also received the most unprompted descriptions of drug and alcohol treatment available.
When compared with the African American investigator, the White Anglo and Asian American in-vestigators received information about all three basic programs (cash, food and medical) 62% of the time, while the African American investigator received this basic information only 28% of the time.
In almost every category (with the exception of general explanations of medical benefits), the White Anglo American investigator received the most information
about all of the programs available through the CSO.
Table 15.Non-Anglo and White Comparison of Program ExplanationsNon-Anglo, Non-White American White Anglo American
Cash 73.3% 74.1%TANF 34.6 51.9GAU 27.3 38.9Medical 65.5 63.0Children 27.3 33.3Adults 18.9 31.5Food 47.9 70.4Drug & Alcohol 5.4 11.1Rights & Responsibilities 4.2 1.9
The other puzzling finding is that she received the fewest explanations of a client’s “rights and re-sponsibilities” a form that was sometimes included in the application packet that describes the legal relationship the person is undertaking once they apply for benefits. Even though there is a differ-ence in the number of times we were told of our rights and responsibilities, the most important finding in this case is the general finding: on average, we were told of our rights and responsibilities only six times total out of 181 interactions (3%) with staff.
24
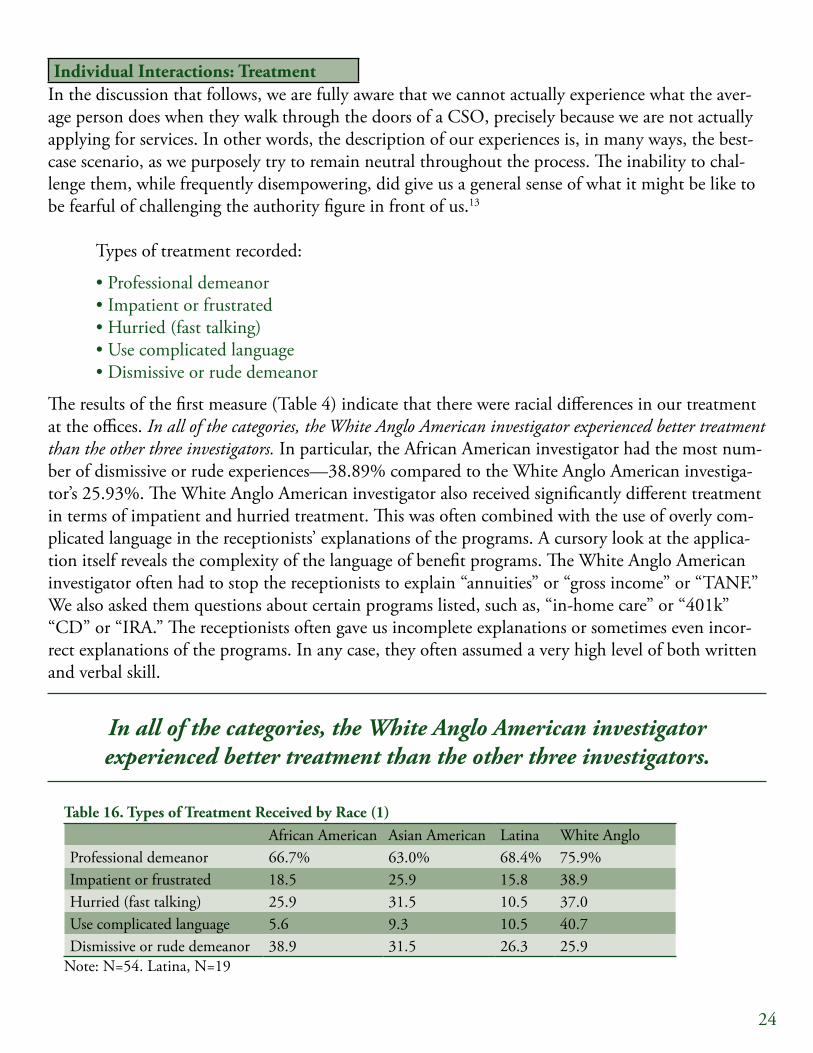
Individual Interactions: TreatmentIn the discussion that follows, we are fully aware that we cannot actually experience what the aver-age person does when they walk through the doors of a CSO, precisely because we are not actually applying for services. In other words, the description of our experiences is, in many ways, the best-case scenario, as we purposely try to remain neutral throughout the process. The inability to chal-lenge them, while frequently disempowering, did give us a general sense of what it might be like to be fearful of challenging the authority figure in front of us.13 Types of treatment recorded:
• Professional demeanor • Impatient or frustrated • Hurried (fast talking) • Use complicated language • Dismissive or rude demeanor
The results of the first measure (Table 4) indicate that there were racial differences in our treatment at the offices. In all of the categories, the White Anglo American investigator experienced better treatment than the other three investigators. In particular, the African American investigator had the most num-ber of dismissive or rude experiences—38.89% compared to the White Anglo American investiga-tor’s 25.93%. The White Anglo American investigator also received significantly different treatment in terms of impatient and hurried treatment. This was often combined with the use of overly com-plicated language in the receptionists’ explanations of the programs. A cursory look at the applica-tion itself reveals the complexity of the language of benefit programs. The White Anglo American investigator often had to stop the receptionists to explain “annuities” or “gross income” or “TANF.” We also asked them questions about certain programs listed, such as, “in-home care” or “401k” “CD” or “IRA.” The receptionists often gave us incomplete explanations or sometimes even incor-rect explanations of the programs. In any case, they often assumed a very high level of both written and verbal skill.
In all of the categories, the White Anglo American investigator experienced better treatment than the other three investigators.
Table 16. Types of Treatment Received by Race (1)African American Asian American Latina White Anglo
Professional demeanor 66.7% 63.0% 68.4% 75.9%Impatient or frustrated 18.5 25.9 15.8 38.9Hurried (fast talking) 25.9 31.5 10.5 37.0Use complicated language 5.6 9.3 10.5 40.7Dismissive or rude demeanor 38.9 31.5 26.3 25.9
Note: N=54. Latina, N=19
25
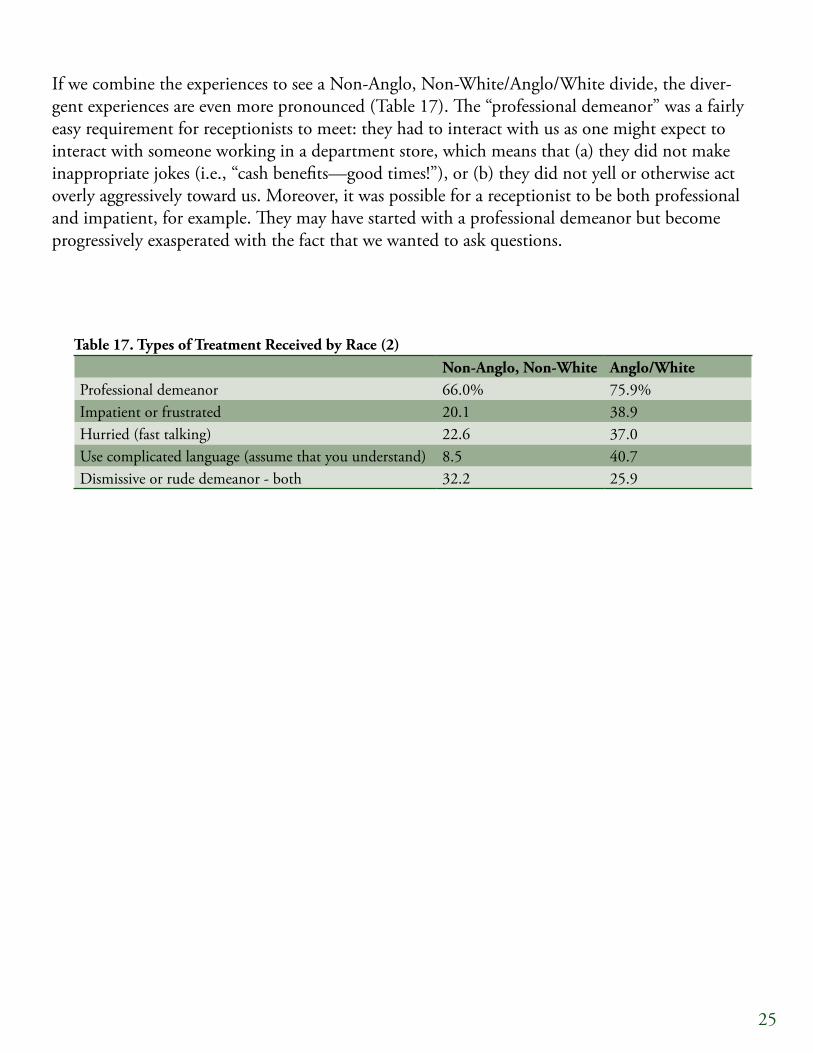
If we combine the experiences to see a Non-Anglo, Non-White/Anglo/White divide, the diver-gent experiences are even more pronounced (Table 17). The “professional demeanor” was a fairly easy requirement for receptionists to meet: they had to interact with us as one might expect to interact with someone working in a department store, which means that (a) they did not make inappropriate jokes (i.e., “cash benefits—good times!”), or (b) they did not yell or otherwise act overly aggressively toward us. Moreover, it was possible for a receptionist to be both professional and impatient, for example. They may have started with a professional demeanor but become progressively exasperated with the fact that we wanted to ask questions.
Table 17. Types of Treatment Received by Race (2)Non-Anglo, Non-White Anglo/White
Professional demeanor 66.0% 75.9%Impatient or frustrated 20.1 38.9Hurried (fast talking) 22.6 37.0Use complicated language (assume that you understand) 8.5 40.7Dismissive or rude demeanor - both 32.2 25.9

26
The second measure of our interactions involved a ranking of our treatment at the office. Our rankings do not reflect whether or not we received respectful treatment or not. For example, we may have all had a bad experience at one office, but one of us may have received even worse treat-ment than another. In other words, it is a relative scale of treatment. If, for example, only one of us received noticeably better treatment than the three others, the three others received the same rank under the first (e.g. 1, 2, 2, 2). This measure is particularly helpful because it helps us understand comparative treatment at a particular office rather than across all offices. Moreover, it is for the same type of interaction: we all requested the same information. There were 14 offices where we all received essentially the same level of treatment (this says nothing about the quality of the treatment, but rather, the equal-ity of treatment). If we examine just the offices where we did experience different types of treatment (Table 18), there is, again, a notable racial difference in terms of treatment.
Table 18. Relative Level of Treatment: Most FavorableAfrican American Asian American White Anglo
Most favorable treatment of the four investigators 2.5% 5.0% 27.5%Most favorable: others may receive the same treat-ment as well
17.5 30.0 60.0
Note: The second category includes those instances where two or more investigators receive the same “most favorable” treatment among the four of us. The totals for the Latina category is not included the N is too small. The total N for this table is 40; at the other 14 offices we experienced similar treatment amongst the four of us.
Table 19. Relative Level of Treatment: Least FavorableAfrican American Asian American White Anglo
Least favorable treatment of the four investigators 22.5% 17.5% 5.0%Least favorable: others may receive the same treat-ment as well
52.5 35.0 10.0
Note: The second category includes those instances where two or more investigators receive the same “least favorable” treatment among the four of us. The totals for the Latina category are not included the N is too small. The total N for this table is 40; at the other 14 offices we experienced similar treatment amongst the four of us.
27
Examples of Types of Treatment:
• As noted elsewhere, the African American investigator (and to a lesser extent the Asian American and Latina investigators) sometimes had interactions with receptionists where the level of voice (and tone) was raised significantly above the others. This often took a form of shaming—that is, our individual questions were “broadcasted” to the office.
• The White Anglo American investigator sometimes experienced, for lack of a better term, a “conspira-torial” interaction with the receptionist. This took the form of either implicitly or explicitly allying themselves with the White Anglo American investigator against the other clients in the office.
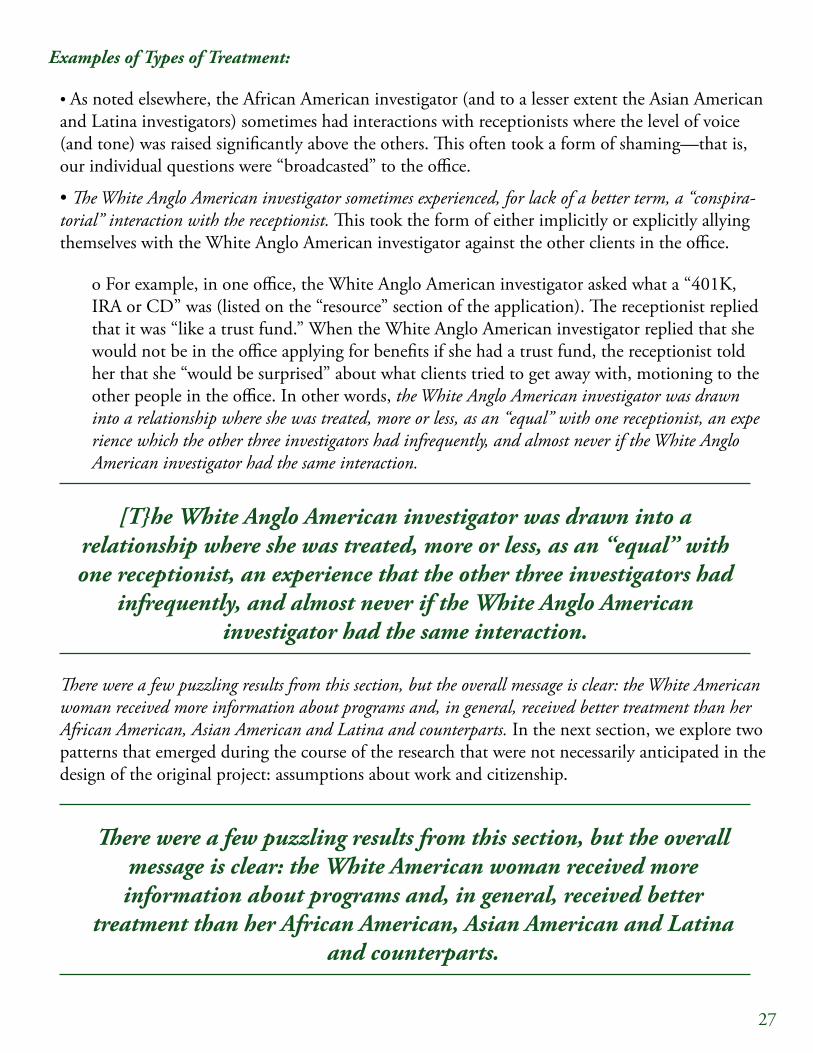
o For example, in one office, the White Anglo American investigator asked what a “401K, IRA or CD” was (listed on the “resource” section of the application). The receptionist replied that it was “like a trust fund.” When the White Anglo American investigator replied that she would not be in the office applying for benefits if she had a trust fund, the receptionist told her that she “would be surprised” about what clients tried to get away with, motioning to the other people in the office. In other words, the White Anglo American investigator was drawn into a relationship where she was treated, more or less, as an “equal” with one receptionist, an expe rience which the other three investigators had infrequently, and almost never if the White Anglo American investigator had the same interaction.
[T}he White Anglo American investigator was drawn into a relationship where she was treated, more or less, as an “equal” with one receptionist, an experience that the other three investigators had
infrequently, and almost never if the White Anglo American investigator had the same interaction.
There were a few puzzling results from this section, but the overall message is clear: the White American woman received more information about programs and, in general, received better treatment than her African American, Asian American and Latina and counterparts. In the next section, we explore two patterns that emerged during the course of the research that were not necessarily anticipated in the design of the original project: assumptions about work and citizenship.
There were a few puzzling results from this section, but the overall message is clear: the White American woman received more information about programs and, in general, received better
treatment than her African American, Asian American and Latina and counterparts.
28
Citizenship and WorkCitizenship, in the formal legal sense of the term, is a critical eligibility criterion for many social services. Thus, it is not surprising that DSHS requires documentation of this for enrollment in many of its programs. We do not dispute the necessity of this as a legal mandate the agency must follow. What we did find, however, is a completely uneven implementation of this in practice, at least at the initial stages of contact between the potential client and the state. Two types of questions were asked by receptionists about citizenship status:
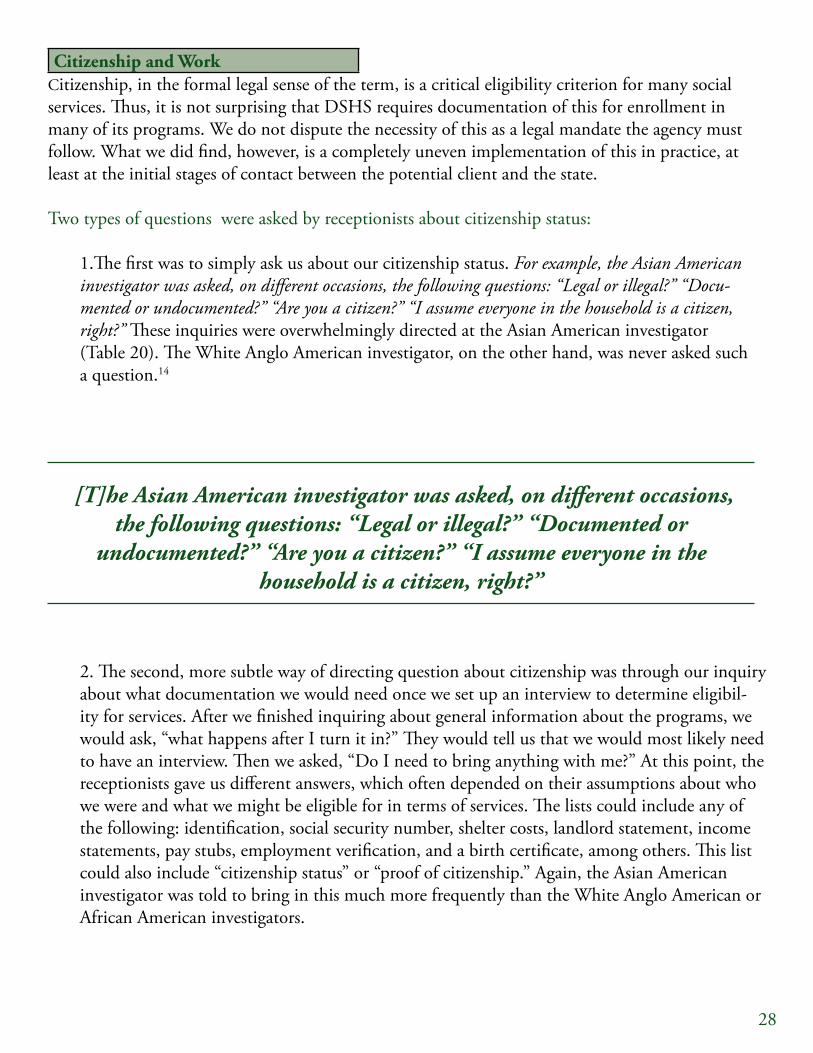
1.The first was to simply ask us about our citizenship status. For example, the Asian American investigator was asked, on different occasions, the following questions: “Legal or illegal?” “Docu-mented or undocumented?” “Are you a citizen?” “I assume everyone in the household is a citizen, right?” These inquiries were overwhelmingly directed at the Asian American investigator (Table 20). The White Anglo American investigator, on the other hand, was never asked such a question.14
[T]he Asian American investigator was asked, on different occasions, the following questions: “Legal or illegal?” “Documented or
undocumented?” “Are you a citizen?” “I assume everyone in the household is a citizen, right?”
2. The second, more subtle way of directing question about citizenship was through our inquiry about what documentation we would need once we set up an interview to determine eligibil-ity for services. After we finished inquiring about general information about the programs, we would ask, “what happens after I turn it in?” They would tell us that we would most likely need to have an interview. Then we asked, “Do I need to bring anything with me?” At this point, the receptionists gave us different answers, which often depended on their assumptions about who we were and what we might be eligible for in terms of services. The lists could include any of the following: identification, social security number, shelter costs, landlord statement, income statements, pay stubs, employment verification, and a birth certificate, among others. This list could also include “citizenship status” or “proof of citizenship.” Again, the Asian American investigator was told to bring in this much more frequently than the White Anglo American or African American investigators.
29
The Bottom Line about Citizenship: Asian American Singled Out
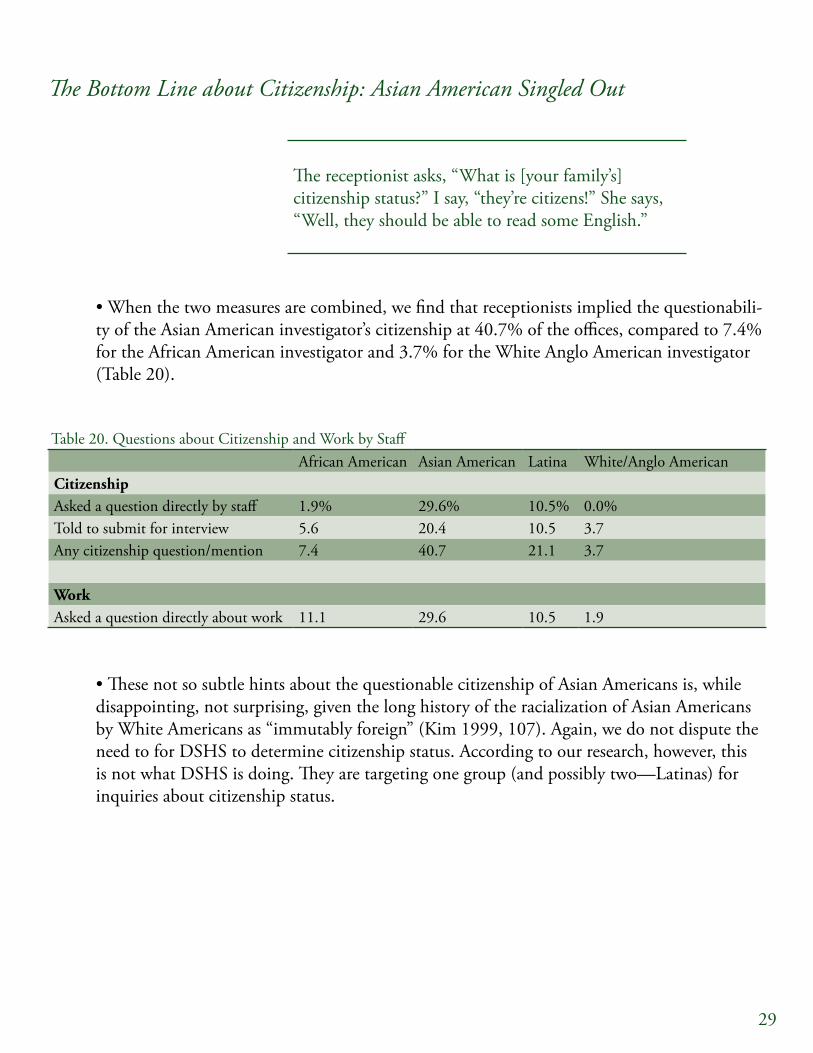
The receptionist asks, “What is [your family’s] citizenship status?” I say, “they’re citizens!” She says, “Well, they should be able to read some English.”
• When the two measures are combined, we find that receptionists implied the questionabili-ty of the Asian American investigator’s citizenship at 40.7% of the offices, compared to 7.4% for the African American investigator and 3.7% for the White Anglo American investigator (Table 20).
Table 20. Questions about Citizenship and Work by StaffAfrican American Asian American Latina White/Anglo American
CitizenshipAsked a question directly by staff 1.9% 29.6% 10.5% 0.0%Told to submit for interview 5.6 20.4 10.5 3.7Any citizenship question/mention 7.4 40.7 21.1 3.7 WorkAsked a question directly about work 11.1 29.6 10.5 1.9
• These not so subtle hints about the questionable citizenship of Asian Americans is, while disappointing, not surprising, given the long history of the racialization of Asian Americans by White Americans as “immutably foreign” (Kim 1999, 107). Again, we do not dispute the need to for DSHS to determine citizenship status. According to our research, however, this is not what DSHS is doing. They are targeting one group (and possibly two—Latinas) for inquiries about citizenship status.
30
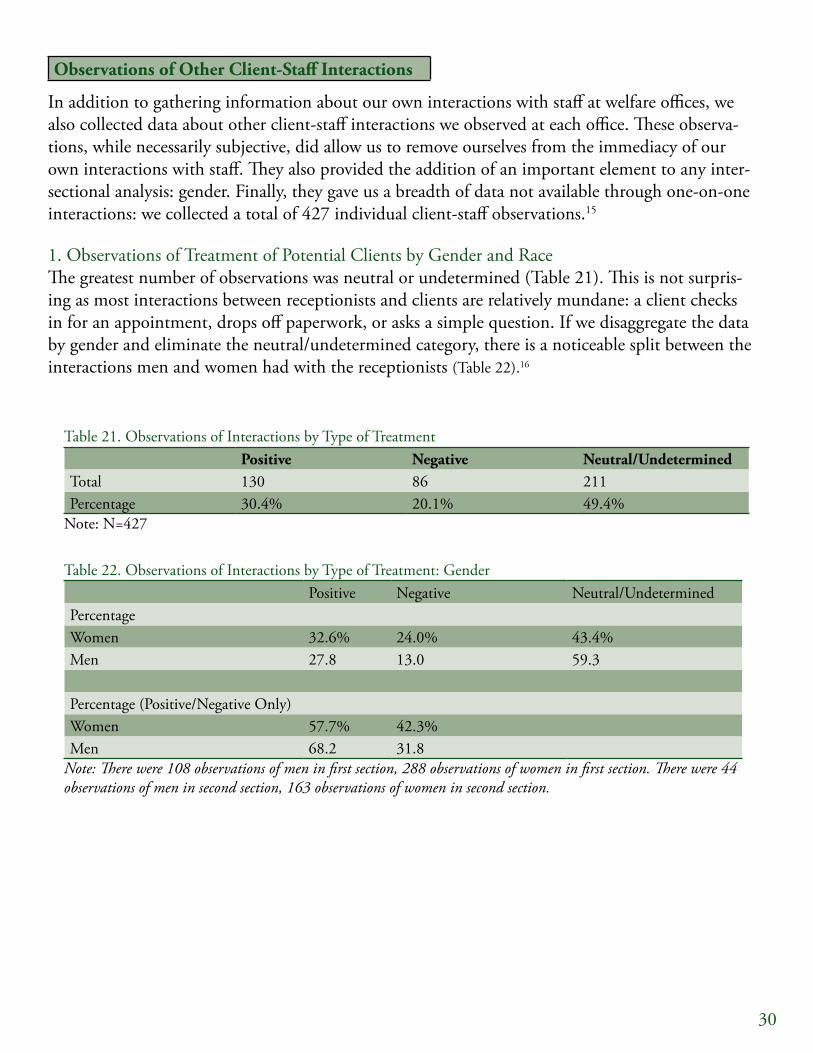
Observations of Other Client-Staff Interactions
In addition to gathering information about our own interactions with staff at welfare offices, we also collected data about other client-staff interactions we observed at each office. These observa-tions, while necessarily subjective, did allow us to remove ourselves from the immediacy of our own interactions with staff. They also provided the addition of an important element to any inter-sectional analysis: gender. Finally, they gave us a breadth of data not available through one-on-one interactions: we collected a total of 427 individual client-staff observations.15 1. Observations of Treatment of Potential Clients by Gender and RaceThe greatest number of observations was neutral or undetermined (Table 21). This is not surpris-ing as most interactions between receptionists and clients are relatively mundane: a client checks in for an appointment, drops off paperwork, or asks a simple question. If we disaggregate the data by gender and eliminate the neutral/undetermined category, there is a noticeable split between the interactions men and women had with the receptionists (Table 22).16
Table 21. Observations of Interactions by Type of TreatmentPositive Negative Neutral/Undetermined
Total 130 86 211Percentage 30.4% 20.1% 49.4%
Note: N=427
Table 22. Observations of Interactions by Type of Treatment: GenderPositive Negative Neutral/Undetermined
PercentageWomen 32.6% 24.0% 43.4%Men 27.8 13.0 59.3
Percentage (Positive/Negative Only)Women 57.7% 42.3%Men 68.2 31.8
Note: There were 108 observations of men in first section, 288 observations of women in first section. There were 44 observations of men in second section, 163 observations of women in second section.
31
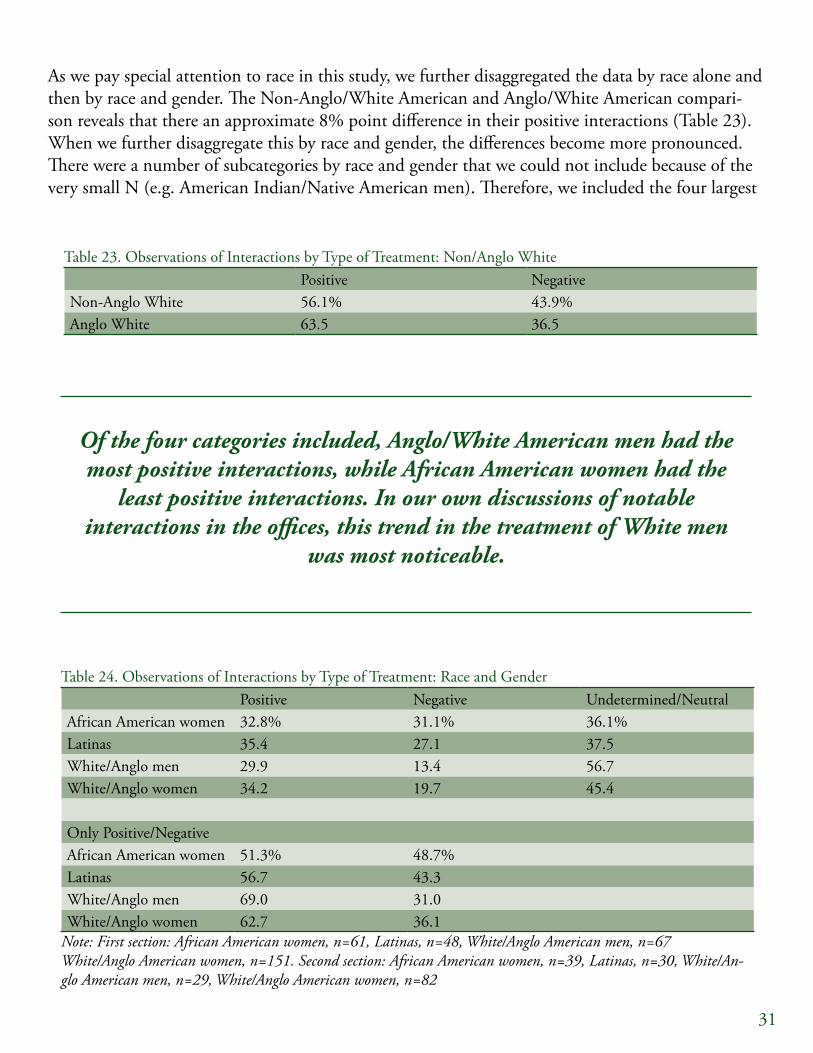
As we pay special attention to race in this study, we further disaggregated the data by race alone and then by race and gender. The Non-Anglo/White American and Anglo/White American compari-son reveals that there an approximate 8% point difference in their positive interactions (Table 23). When we further disaggregate this by race and gender, the differences become more pronounced. There were a number of subcategories by race and gender that we could not include because of the very small N (e.g. American Indian/Native American men). Therefore, we included the four largest
Table 23. Observations of Interactions by Type of Treatment: Non/Anglo WhitePositive Negative
Non-Anglo White 56.1% 43.9%Anglo White 63.5 36.5
Table 24. Observations of Interactions by Type of Treatment: Race and GenderPositive Negative Undetermined/Neutral
African American women 32.8% 31.1% 36.1%Latinas 35.4 27.1 37.5White/Anglo men 29.9 13.4 56.7White/Anglo women 34.2 19.7 45.4
Only Positive/NegativeAfrican American women 51.3% 48.7%Latinas 56.7 43.3White/Anglo men 69.0 31.0White/Anglo women 62.7 36.1
Note: First section: African American women, n=61, Latinas, n=48, White/Anglo American men, n=67White/Anglo American women, n=151. Second section: African American women, n=39, Latinas, n=30, White/An-glo American men, n=29, White/Anglo American women, n=82
Of the four categories included, Anglo/White American men had the most positive interactions, while African American women had the
least positive interactions. In our own discussions of notable interactions in the offices, this trend in the treatment of White men
was most noticeable.
32
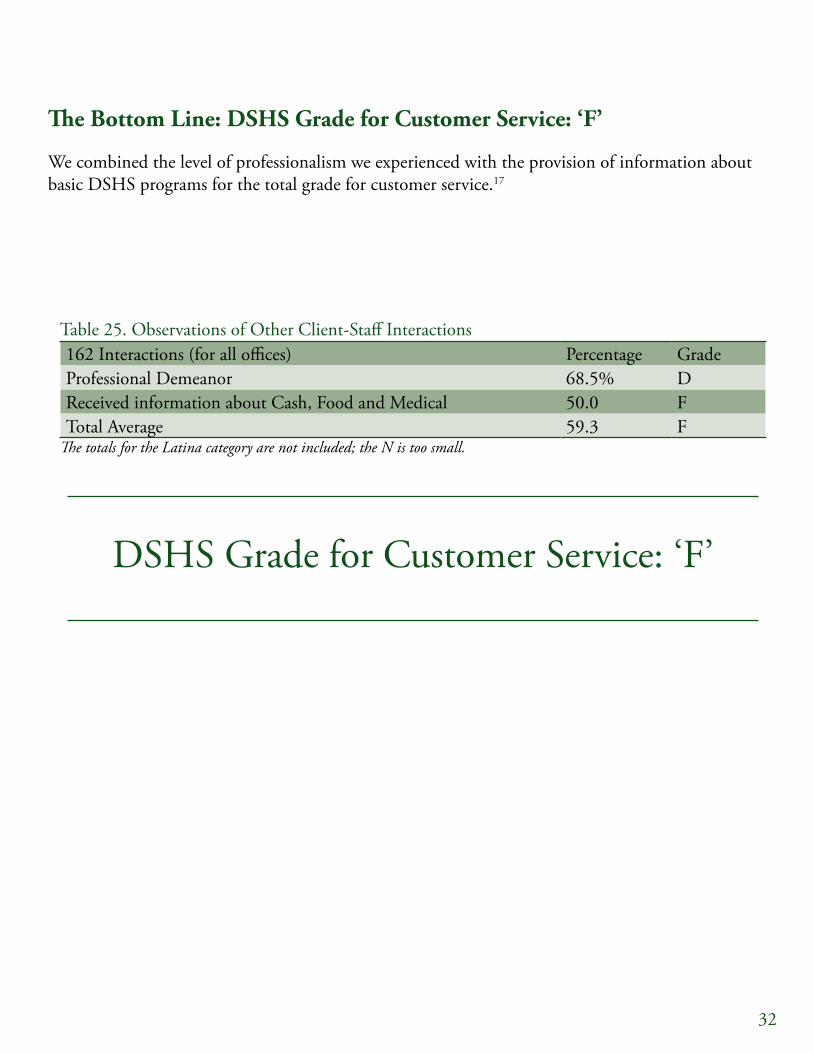
The Bottom Line: DSHS Grade for Customer Service: ‘F’
We combined the level of professionalism we experienced with the provision of information about basic DSHS programs for the total grade for customer service.17
Table 25. Observations of Other Client-Staff Interactions162 Interactions (for all offices) Percentage GradeProfessional Demeanor 68.5% DReceived information about Cash, Food and Medical 50.0 FTotal Average 59.3 F
The totals for the Latina category are not included; the N is too small.
DSHS Grade for Customer Service: ‘F’
33
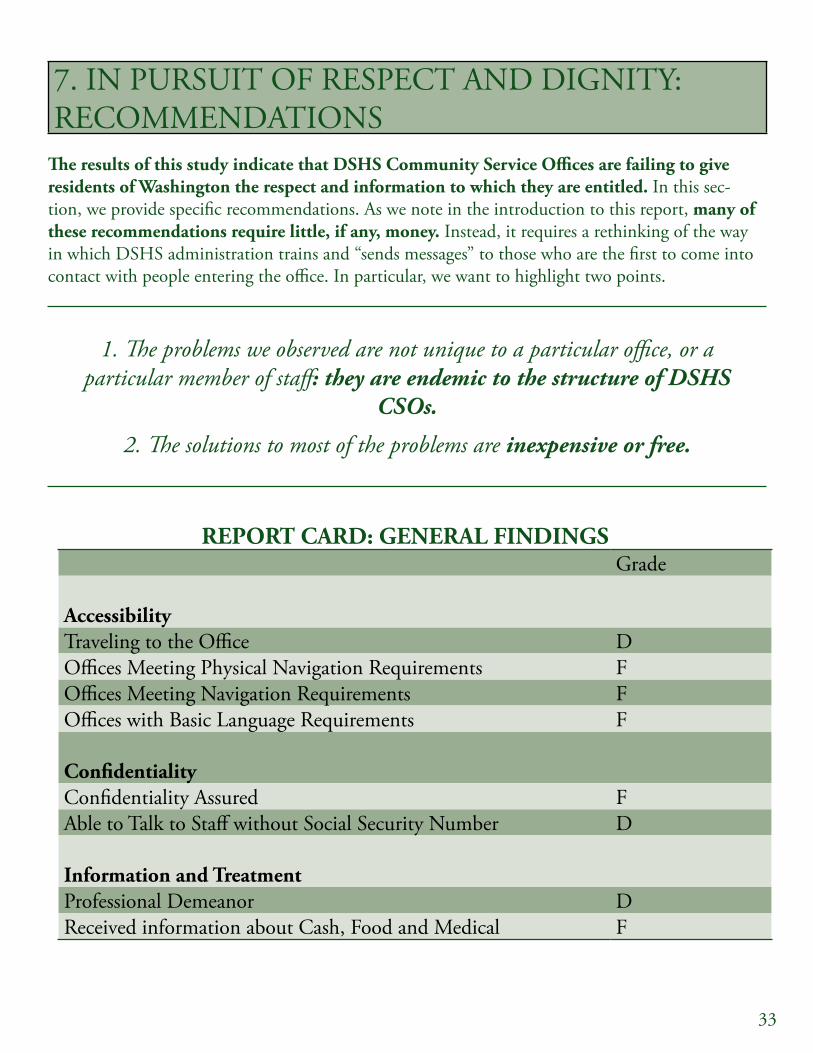
7. IN PURSUIT OF RESPECT AND DIGNITY: RECOMMENDATIONS
The results of this study indicate that DSHS Community Service Offices are failing to give residents of Washington the respect and information to which they are entitled. In this sec-tion, we provide specific recommendations. As we note in the introduction to this report, many of these recommendations require little, if any, money. Instead, it requires a rethinking of the way in which DSHS administration trains and “sends messages” to those who are the first to come into contact with people entering the office. In particular, we want to highlight two points.
1. The problems we observed are not unique to a particular office, or a particular member of staff: they are endemic to the structure of DSHS
CSOs.
2. The solutions to most of the problems are inexpensive or free.
REPORT CARD: GENERAL FINDINGS Grade
AccessibilityTraveling to the Office DOffices Meeting Physical Navigation Requirements FOffices Meeting Navigation Requirements FOffices with Basic Language Requirements F
ConfidentialityConfidentiality Assured FAble to Talk to Staff without Social Security Number D
Information and TreatmentProfessional Demeanor DReceived information about Cash, Food and Medical F
34
Recommendations that require few resources:Accessibility
• Include public transportation options/directions on phone menu
• Streamline call center and local CSO phone menus
• Ensure Spanish and Russian phone options are coherent and consistent
• Ensure free transportation information to and from the office is available in the waiting room (free as this is from the transportation provider)
• Ensure at least one counter is low enough for people of short stature and those who happen to be in a wheelchair
• Remove carpet from offices to ensure wheelchair accessibility
• Ensure hours of operation are posted outside the office
• Ensure secure, opaque drop-boxes for client documents are located inside and outside the office
Confidentiality•Direct staff to lower voices when speaking to people at front desk, especially when discussing private information
• Reinstate “take a number” system to ensure confidentiality (this will save resources)
• In small offices, confidentiality can be improved by rearranging chairs away from front desk
Information and Treatment• Issue official statements from DSHS administrators reminding staff that they are to treat clients with respect, regardless of race, ethnicity, language, nationality, ability, gender iden-tity, sexual orientation or religious affiliation. Ensure there are clear penalties for non-com-pliance.
• Place confidential customer service surveys at front desk and place confidential box for surveys in office
• Direct security guards to act professionally with women entering the office18
• Reconsider current customer service training programs for staff.
• Require all staff to enroll in a dismantling racism training program (not cultural compe-tency) as a condition of employment at DSHS
• Require front desk staff to read and explain the “rights and responsibilities” section of every ap-plication form.

35
The results of this study indicate that DSHS Community Service Offices are failing to give residents of Washington the respect and information to
which they are entitled.
Final ThoughtsWe did not include the many recommendations that cost a great deal of money. These suggestions would require a complete restructuring of DSHS as an agency; they would fundamentally alter the relationship between the people and the state. We hope that this “big picture” conversation is sparked by the findings of this study.

36
8. APPENDIX: RESEARCH PROTOCOLS
1. Physical Office Observation Form Office Name:_____________________________ Date Visited:__________ 1. Once a person enters a CSO, is there clear signage with directions for how to proceed? Yes No Languages other than English? Yes No List languages:___________________________________ 2. Drop Boxes: prominently placed drop boxes outside and inside all CSOs with a sign telling clients they can
use the box to drop off documents. 3. The Limited English Proficiency poster, “Point to Your Language” is posted. 4. The “And Justice for All” civil rights poster is posted. 5. Civil Rights brochure 22-552. 6. The waiting area or reception area is clean. Overall: Yes No Dirty (actual dirt/dust) on the floor Debris (e.g., paper) Waiting area chairs are dirty, broken or torn 7. Is the reception area sensitive to families? For example, are there toys for the children to play with while waiting? Overall: Yes No Toys Other: 8. Is there easy access and obvious directions to rest rooms? Yes No 9. This facility is easy to navigate in a wheelchair. Yes No 10. How many writing surfaces are in the lobby? #___________ 11. There is sufficient space between clients being served and folks in the waiting area to allow confidential
conversations. Yes No Explain answer: 12. General notes about office: (number system, other attributes of physical space) ADDITIONAL NOTES: 13. The CSO is on a bus line. Number of bus lines: _________________________ Bus
numbers:____________________________ 14. There is parking set aside for disabled people. 15. The parking is located near the office. Is the restroom clean?
Overall: Yes No Toilets clogged Toilet/stall area clean Sink/general area clean Faucets operate
Odor Number of stalls___________
Customer Service Satisfaction Survey 1. Office uses standard Customer Satisfaction Survey 2. Is it available in waiting room?
37
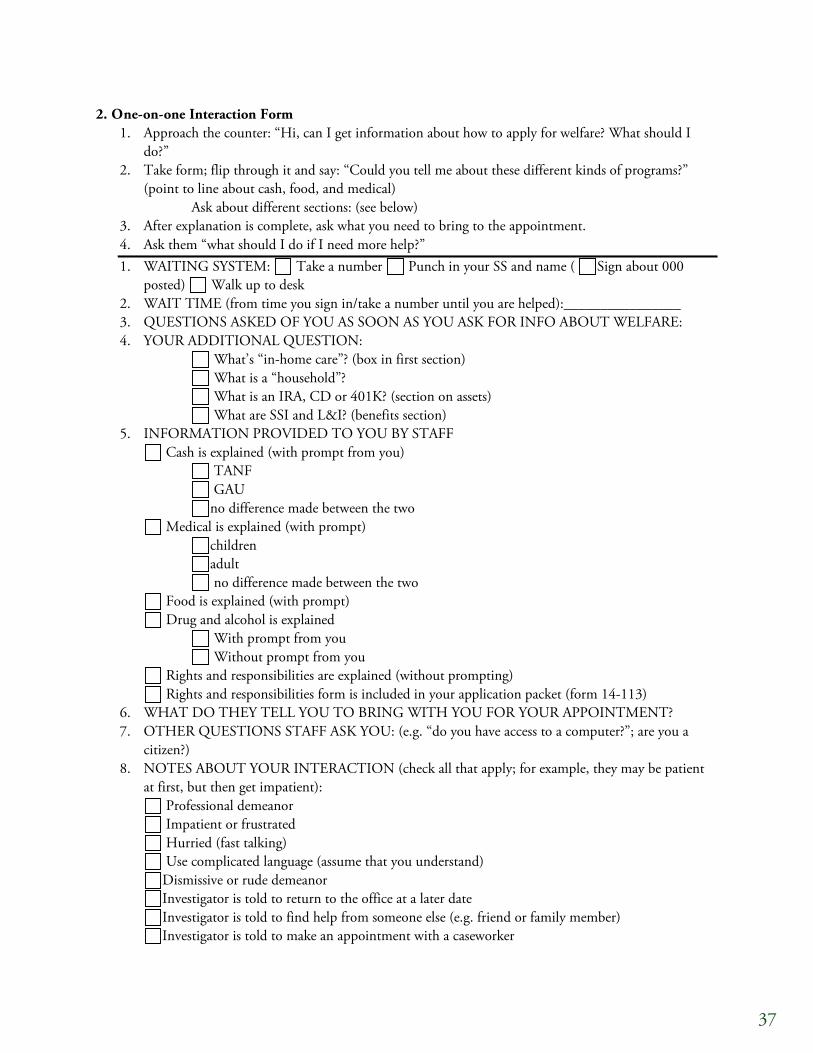
2. One-on-one Interaction Form 1. Approach the counter: “Hi, can I get information about how to apply for welfare? What should I
do?” 2. Take form; flip through it and say: “Could you tell me about these different kinds of programs?”
(point to line about cash, food, and medical) Ask about different sections: (see below)
3. After explanation is complete, ask what you need to bring to the appointment. 4. Ask them “what should I do if I need more help?” 1. WAITING SYSTEM: Take a number Punch in your SS and name ( Sign about 000
posted) Walk up to desk 2. WAIT TIME (from time you sign in/take a number until you are helped):________________ 3. QUESTIONS ASKED OF YOU AS SOON AS YOU ASK FOR INFO ABOUT WELFARE: 4. YOUR ADDITIONAL QUESTION:
What’s “in-home care”? (box in first section) What is a “household”? What is an IRA, CD or 401K? (section on assets) What are SSI and L&I? (benefits section)
5. INFORMATION PROVIDED TO YOU BY STAFF Cash is explained (with prompt from you)
TANF GAU no difference made between the two
Medical is explained (with prompt) children adult no difference made between the two
Food is explained (with prompt) Drug and alcohol is explained
With prompt from you Without prompt from you
Rights and responsibilities are explained (without prompting) Rights and responsibilities form is included in your application packet (form 14-113)
6. WHAT DO THEY TELL YOU TO BRING WITH YOU FOR YOUR APPOINTMENT? 7. OTHER QUESTIONS STAFF ASK YOU: (e.g. “do you have access to a computer?”; are you a
citizen?) 8. NOTES ABOUT YOUR INTERACTION (check all that apply; for example, they may be patient
at first, but then get impatient): Professional demeanor Impatient or frustrated Hurried (fast talking) Use complicated language (assume that you understand) Dismissive or rude demeanor Investigator is told to return to the office at a later date Investigator is told to find help from someone else (e.g. friend or family member) Investigator is told to make an appointment with a caseworker
38
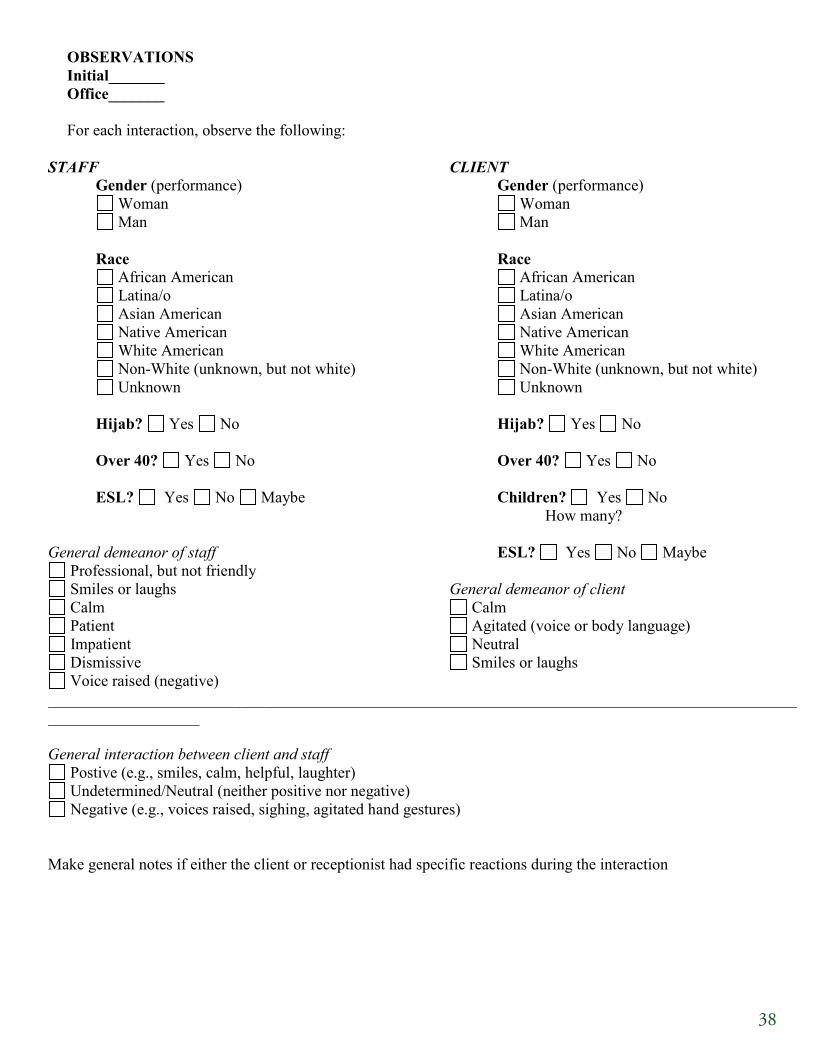
Co OBSERVATIONS Initial_______ Office_______ For each interaction, observe the following:
STAFF Gender (performance)
Woman Man
Race
African American Latina/o Asian American Native American White American Non-White (unknown, but not white) Unknown
Hijab? Yes No Over 40? Yes No ESL? Yes No Maybe
General demeanor of staff
Professional, but not friendly Smiles or laughs Calm Patient Impatient Dismissive
CLIENT Gender (performance)
Woman Man
Race
African American Latina/o Asian American Native American White American Non-White (unknown, but not white) Unknown
Hijab? Yes No Over 40? Yes No
Children? Yes No How many? ESL? Yes No Maybe
General demeanor of client
Calm Agitated (voice or body language) Neutral Smiles or laughs
Voice raised (negative) _________________________________________________________________________________________________________________ General interaction between client and staff
Postive (e.g., smiles, calm, helpful, laughter) Undetermined/Neutral (neither positive nor negative) Negative (e.g., voices raised, sighing, agitated hand gestures)
Make general notes if either the client or receptionist had specific reactions during the interaction
39
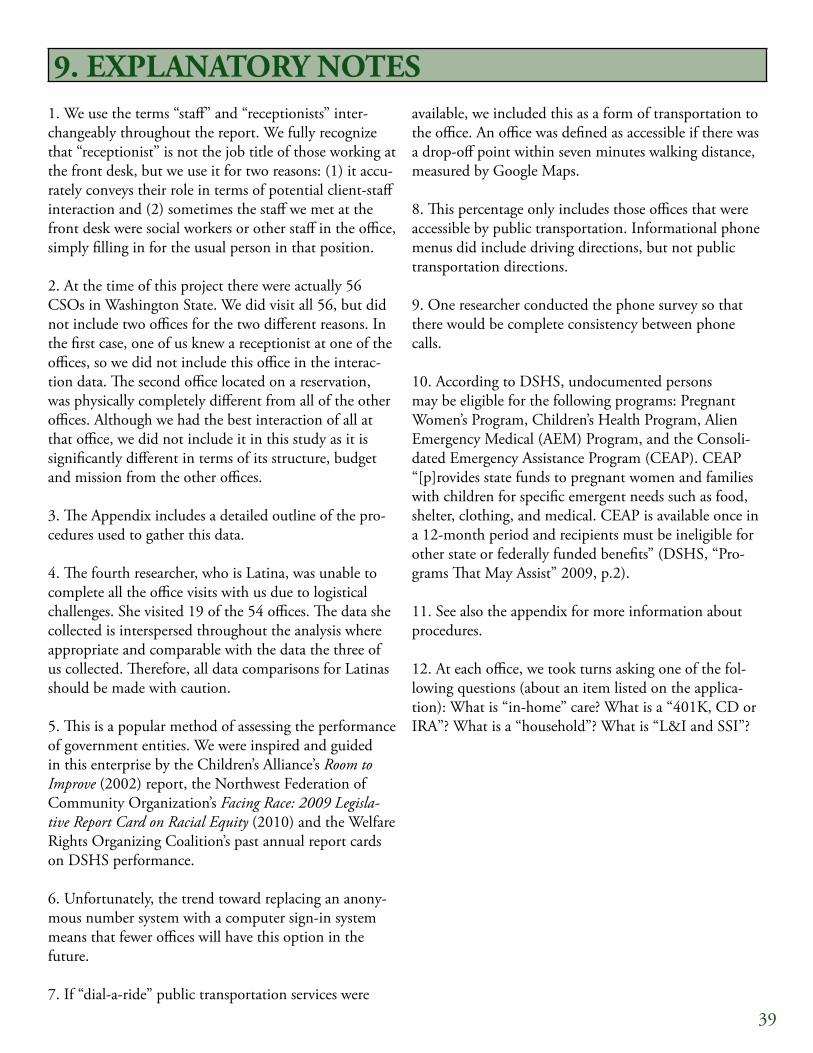
9. EXPLANATORY NOTES1. We use the terms “staff” and “receptionists” inter-changeably throughout the report. We fully recognize that “receptionist” is not the job title of those working at the front desk, but we use it for two reasons: (1) it accu-rately conveys their role in terms of potential client-staff interaction and (2) sometimes the staff we met at the front desk were social workers or other staff in the office, simply filling in for the usual person in that position.
2. At the time of this project there were actually 56 CSOs in Washington State. We did visit all 56, but did not include two offices for the two different reasons. In the first case, one of us knew a receptionist at one of the offices, so we did not include this office in the interac-tion data. The second office located on a reservation, was physically completely different from all of the other offices. Although we had the best interaction of all at that office, we did not include it in this study as it is significantly different in terms of its structure, budget and mission from the other offices.
3. The Appendix includes a detailed outline of the pro-cedures used to gather this data.
4. The fourth researcher, who is Latina, was unable to complete all the office visits with us due to logistical challenges. She visited 19 of the 54 offices. The data she collected is interspersed throughout the analysis where appropriate and comparable with the data the three of us collected. Therefore, all data comparisons for Latinas should be made with caution.
5. This is a popular method of assessing the performance of government entities. We were inspired and guided in this enterprise by the Children’s Alliance’s Room to Improve (2002) report, the Northwest Federation of Community Organization’s Facing Race: 2009 Legisla-tive Report Card on Racial Equity (2010) and the Welfare Rights Organizing Coalition’s past annual report cards on DSHS performance.
6. Unfortunately, the trend toward replacing an anony-mous number system with a computer sign-in system means that fewer offices will have this option in the future.
7. If “dial-a-ride” public transportation services were
available, we included this as a form of transportation to the office. An office was defined as accessible if there was a drop-off point within seven minutes walking distance, measured by Google Maps.
8. This percentage only includes those offices that were accessible by public transportation. Informational phone menus did include driving directions, but not public transportation directions.
9. One researcher conducted the phone survey so that there would be complete consistency between phone calls. 10. According to DSHS, undocumented persons may be eligible for the following programs: Pregnant Women’s Program, Children’s Health Program, Alien Emergency Medical (AEM) Program, and the Consoli-dated Emergency Assistance Program (CEAP). CEAP “[p]rovides state funds to pregnant women and families with children for specific emergent needs such as food, shelter, clothing, and medical. CEAP is available once in a 12‐month period and recipients must be ineligible for other state or federally funded benefits” (DSHS, “Pro-grams That May Assist” 2009, p.2).
11. See also the appendix for more information about procedures.
12. At each office, we took turns asking one of the fol-lowing questions (about an item listed on the applica-tion): What is “in-home” care? What is a “401K, CD or IRA”? What is a “household”? What is “L&I and SSI”?
40
EXPLANATORY NOTES13. Our findings, as noted above, are necessarily subjec-tive. We have partially mitigated this problem by (a) observing each other’s interactions while in the office and (b) discussing our interactions and comparing expe-riences (recorded on a voice recorder after each office). This recording of reactions also allowed us to look at our experiences as a whole: our perceptions at the begin-ning of the visits were sometimes different from those toward the end when we had more knowledge about what to expect from the offices. We developed two ways to measure the treatment we received. The first are those that are noted immediately following the one-on-one interaction. We made these notations before any general discussion with each other about our perceptions of one another’s interactions. The second measure was adaptable by collective comparison of our experiences immediately following the visit to the office. We discussed our percep-tions of who was treated differently from one another at the office. Throughout this, we were especially cognizant of a tendency to attribute “better” interactions to the White Anglo American investigator. In other words, we continually tried to question our possibly unconscious tendency to note that people of color received less than equal treatment. If we take these two measures together, we can get a full picture of our general interactions at the office.
14.It is difficult to discern if this pattern applies to Latinas, as the Latina investigator only visited 19 of the 54 offices. She was asked this question at some of the offices, however.
15. We were unable to make observations at every of-fice: some offices simply had very few clients to observe. The observational data we did collect, however, noted a number of relevant demographic characteristics about both the receptionist and the client(s). We examine a few of these characteristics, namely race and gender, in relationship to the type of treatment we observed. It is important to note that we always tried to err on the side of caution in these observations; that is why there are a number of observations that are “neutral or undeter- mined.” We labeled the interaction based on the tone and level of voice, body language, laughter, tears, shout-ing as well as certain substantive comments by reception-ists (e.g. shouting someone’s personal information loudly so everyone in the office can hear it). We did make a note if a client approached the receptionist in a hostile
way, though we really tried to focus on the reaction of the receptionist to the situation.
16. The total number does not add up to 427 because observations where couples (men and women) interacted together with the receptionist were excluded.
17. Some offices had statements of “Client Rights and Responsibilities” attached to the regular application forms. The regular application also has a section titled “Declaration and Signatures” that informs the client of the penalties for false statements. It was rare for a re-ceptionist to explain either of these important sections, much less point them out as an important section to read before completing the application. This is disturb-ing because clients need to be aware of their rights and responsibilities before entering this type of contract with the state.
18. At one office, a security guard told one of us, as we were walking into the office, that she was “a very pretty girl.” This is inappropriate behavior for any security guard.
41
10. BIBLIOGRAPHYBlank, Rebecca M., Marilyn Dabady and Constance Forbes Citro. 2004. Measuring Racial Discrimination. Washington, D.C.: National Academies Press.
Brodkin, Evelyn Z. 1997. “Inside the Welfare Contract: Discretion and Accountability in State Welfare Administration.” The Social Service Review 71(1):1–33.
The Children’s Alliance. 2002. Room to Improve: Customer Service at Offices of the Washington Department of Social and Health Services. Seattle, WA: The Children’s Alliance.
Coulton, Claudia, Younghee Lim, Thomas Cook and Nina Lalich. 2003. “Did Welfare Leavers’ Employment Levels and Job Characteristics Change during TANF Implementation: An analysis using SIPP 1996-2000.” Cleveland, OH: Center on Urban Poverty and Social Change.
Fraser, Nancy. 1989. “Women, Welfare, and the Politics of Need Interpretation.” In Unruly Practices: Power, Discourse, and Gender in Contemporary Social Theory, ed. Nancy Fraser. Minneapolis, MN: University of Minnesota Press. Pp. 144–60.
Fraser, Nancy, and Linda Gordon. 1994. “A Genealogy of Dependency: Tracing a Keyword of the US Welfare State.” Signs 19 (Winter): 309–36.
Gilliam, Franklin D. 1999. “The ‘Welfare Queen’ Experiment.” Nieman Reports 53 (2): 49–52.
Gilliom, John. 2001. Overseers of the Poor: Surveillance, Resistance, and the Limits of Privacy. Chicago: University of Chicago Press.
Gooden, Susan Tinsley. 2004. “Examining the Implementation of Welfare Reform by Race: Do Blacks, Hispanics and Whites Report Similar Experiences with Welfare Agencies?” The Review of Black Political Economy (Fall): 27–53.
Goodsell, Charles T. 1977. “Bureaucratic Manipulation of Physical Symbols: An Empirical Study.” American Journal of Political Science 21(1): 79–91.
Goodsell, Charles T. 1980. “Client Evaluation of Three Welfare Programs: A Comparison of Three Welfare Programs.” Admin istration & Society 12: 123–136.
Goodsell, Charles T. 1984. “Welfare Waiting Rooms.” Journal of Contemporary Ethnography 12: 467–477.
Gordon, Linda, ed. 1990. Women, the State, and Welfare. Madison: University of Wisconsin Press.
Gordon, Rebecca. 2001. Cruel and Usual: How Welfare Reform Punishes Poor People. Oakland, CA: Applied Research Center.
Hasenfeld, Yeheskel. 1985. “Citizens’ Encounters with Welfare State Bureaucracies.” The Social Service Review 59(4): 622–635.
Keiser, Lael R., Peter R. Mueser and Seung-Whan Choi. 2004. “Race, Bureaucratic Discretion, and the Implementation of Welfare Reform.” American Journal of Political Science 48 (2): 314–327.
Kim, Claire Jean. 1999. “The Racial Triangulation of Asian Americans.” Politics & Society 27: 105–138.
Lieberman, Robert C. 1998. Shifting the Color Line: Race and the American Welfare State. Cambridge, MA: Harvard Universi-Press.
Lipsky, Michael.1980. Street-level Bureaucracy: Dilemmas of the Individual in Public Services. New York : Russell Sage Founda-tion.
42
BIBLIOGRAPHYLower-Basch, Elizabeth. 2002. Leavers and Diversion Studies: Preliminary Analysis of Racial Differences in Caseload Trends and
Leaver Outcomes Office of the Assistant Secretary for Planning and Evaluation, Department of Health and Human Services, December 2000. http://aspe.hhs.gov/hsp/leavers99/race.htm.
Massey, Douglas S. and Garvey Lundy. 2001. “Use of Black English and Racial Discrimination in Urban Housing Markets: New Methods and Findings.” Urban Affairs Review 36: 452–460.
Nelson, Barbara J. 1981. “Client Evaluations of Social Programs.” In The Public Encounter: Where State and Citizen Meet, ed. Charles T. Goodsell, 23-42. Bloomington: Indiana University Press.
Northwest Federation of Community Organizations. 2010. Facing Race: 2009 Legislative Report Card on Racial Equity. Seattle.
Office of the Federal Register. 2008. “2008 Presidential Election: Popular Vote Count Totals.” College Park, MD: U.S. Na tional Archives. http://www.archives.gov/federalregister/ electoral-college/2008/popular-vote.html.
Page, Devah and Hana Shepherd. 2008. “The Sociology of Discrimination: Racial Discrimination in Employment, Housing, Credit, and Consumer Markets.” Annual Review of Sociology 34:181–209.
Piven, Frances Fox and Richard A. Cloward. 1993 [1973]. Regulating the Poor: The Functions of Public Welfare. New York: Vin tage.
Quillian, Lincoln. 2006. “New Approaches to Understanding Racial Prejudice and Discrimination.” Annual Review of Sociology 32: 299–328.
Soss, Joe. 2000. Unwanted Claims: The Politics of Participation in the U.S. Welfare System. Ann Arbor: University of Michigan Press.
Yinger, John. 1995. Closed Doors, Opportunities Lost: The Continuing Costs of Housing Discrimination. New York: Russell Sage Foundation.
United States Census Bureau. 2009. United States Population Clock. United States Census Bureau. http://www.census.gov/.
Washington State Department of Social and Health Services. 2008. “ESA Program Briefing Book 2008.” http://www.dshs. wa.gov/esa/esbriefingbook.shtml#esa
Washington State Department of Social and Health Services. 2009. “Programs That May Assist Undocumented Aliens.” http:// hrsa.dshs.wa.gov/News/fact/FS009-009UndocumentedAliens-ProgramsavailableMarch2009.pdf
Washington State Department of Social and Health Services. 2009. “Services We Offer.” https://fortress.wa.gov/dshs/f2ws 03esaapps/onlinecso/services.asp.
Washington State Department of Social and Health Services. 2010. “2008 Diversity Counts.” http://www.dshs.wa.gov/pdf/ms/ rda/research/11/152.pdf
Washington State Department of Social and Health Services, Division of Child Support. 2011. “Federally Recognized Tribes of Washington State.” http://www.dshs.wa.gov/dcs/tribal/map.asp
43
ACKNOWLEDGMENTS
We would like to thank the following individuals for their advice and/or comments in the plan-ning, research and preparation of the report: Selene Barnes, Angelique M. Davis, Mako Fitts, Bridget Donovan, Diana Meña, Ángela Ortez, Gary K. Perry, Hoa T. Pham, Andrea Y. Simpson and Grace M. Taylor. We would also like to express our gratitude for generous support for this proj-ect by Seattle University’s Endowed Mission Fund.
CONTACT INFORMATIONQuestions? Comments? Please contact Rose Ernst via email.
Dr. Rose Ernst
Assistant ProfessorPolitical ScienceSeattle University901 12th AveSeattle, WA [email protected]